

Submitted:
11 September 2026
Posted:
14 September 2026
You are already at the latest version
Abstract
Metric positional encoding supplies physical distances to Transformers, but its contribution to segmentation performance and spacing robustness remains uncertain. We evaluated whether metric coordinates improve performance, produce a more favorable response to resampling, and affect predictions through supplied spacing. A factorial UNETR comparison combined token-index or millimeter-based coordinates with additive Fourier encoding or 3D RoPE. KiTS23 evaluation used three-fold cross-validation on 391 patients; 117 eligible volumes were resampled to through-plane spacings of 3, 4, and 5 mm. Controls altered supplied spacing independently of image content. The RoPE comparison was repeated after retraining on AMOS22. In KiTS23, metric variants responded to supplied spacing but did not yield a more favorable Surface Dice change under resampling (contrast: −0.0029; 95% CI: −0.0104 to 0.0043). Among 38 eligible AMOS22 cases, metric RoPE retained higher absolute scores at every tested spacing, although its advantage narrowed from 0.0512 at native spacing to 0.0216 at 5 mm. Its baseline-relative response was less favorable (contrast: −0.0241; 95% CI: −0.0296 to −0.0186). These findings support evaluating absolute scores alongside changes from baseline and controls of spacing sensitivity. A less favorable change can coexist with higher absolute performance, conditional on the trained models and retrospective perturbations.
Keywords:
3D medical image segmentation
; positional encoding
; metric coordinates
; transformer
; computed tomography
1. Introduction
Transformer models have been increasingly adopted for 3D medical image segmentation because they can capture long-range dependencies through self-attention [1,2,3,4]. Because self-attention does not inherently encode the order or position of its elements, Vision Transformers divide images into patches, represent them as tokens, and incorporate positional information [5,6]. UNETR [7] extended this approach to volumetric patches and reused representations from different encoder layers to generate dense segmentations. UNesT, in turn, introduced a hierarchical organization to preserve local relationships while reducing computational cost [8].
Positional encoding methods have evolved from sinusoidal and learnable absolute representations to relative [9], rotary, and multidimensional Fourier feature-based schemes [5,10,11,12,13]. This diversity reflects the fact that positional representation introduces an inductive bias whose usefulness may depend on both the task and the geometry of the data [14]. However, its effect remains poorly established in 3D medical image segmentation.
In most implementations, position is computed from indices within the token grid. These indices represent order and separation in token units, but not physical distance: a separation of four tokens may correspond to different physical distances depending on voxel spacing. This discrepancy is particularly relevant in heterogeneous clinical datasets, where images with matrices of the same size may cover different anatomical extents. Indeed, in established systems such as nnU-Net, voxel spacing influences preprocessing and resampling decisions [15]. An alternative is to represent position using physical coordinates expressed in millimeters.
The available evidence, however, is heterogeneous and does not support a general advantage for any particular positional representation. Removing explicit positional encoding improved performance in a slice-based classification task [16], whereas RoPE was incorporated into an improved architecture for multi-organ segmentation [17]. A coordinate-based embedding incorporating physical position and resolution improved infarct segmentation, whereas no significant improvement was observed in tumor segmentation on BraTS [18]. Anisotropic Fourier features have shown benefits in classification and regression, including experiments with simulated anisotropy, but that study did not evaluate dense segmentation [19].
Previous studies present three main challenges when attempting to isolate the effect of the coordinate system. First, some comparisons simultaneously modify the positional formulation, where it is incorporated, and other network components; therefore, the observed differences cannot be attributed exclusively to the use of token indices or metric coordinates. Second, in medical imaging datasets, voxel spacing is associated with scanner characteristics, acquisition protocols, image quality, and case difficulty. Comparing patients with different spacings therefore confounds the effect of geometry with these characteristics. To avoid this, spacing must be modified in a controlled manner within the same volume, allowing results to be compared within each patient. Third, a comparison between positional encodings is informative only if the Transformer encoder contributes meaningfully to the prediction; some hybrid models retain their performance even after their attention blocks are removed [20].
These observations leave two distinct questions: whether metric coordinates improve segmentation performance at native spacing, and whether they produce a more favorable performance change when the same image is resampled to a larger through-plane spacing. A higher score in the first comparison does not establish an advantage in the second. We addressed both questions using a factorial design that combined token-index or millimeter-based coordinates with additive Fourier encoding and 3D RoPE while keeping the architecture, data splits, and training procedure fixed. The primary hypothesis was that metric coordinates would produce a more favorable change in Surface Dice under controlled spacing increases, with each patient serving as their own reference. Diagnostic controls additionally altered the supplied spacing independently of image content to assess whether the metric variants responded to that information. Evaluation comprised three-fold cross-validation on KiTS23 [21,22] and an independent repetition of the RoPE coordinate-system contrast after retraining on AMOS22 [23]. Together, these comparisons assess whether sensitivity to supplied spacing, native-spacing performance, and response to resampling support the same choice of positional representation.
2. Materials and Methods
2.1. Experimental Design and Datasets
We designed a 2 × 2 factorial study to isolate the effect of the coordinate system in UNETR. The first factor was the representation of position using either token indices or metric coordinates; the second factor was incorporated through either additive Fourier encoding or 3D RoPE. The four configurations shared the same architecture, data, data splits, and training procedure. The primary comparison assessed whether metric coordinates better preserved surface Dice under controlled increases in inter-slice spacing. We analyzed performance at native spacing, interaction with the encoding family, and remaining outcomes as complementary results. KiTS23 was used as the primary dataset. It comprised 489 contrast-enhanced abdominal CT studies, with annotations for the kidney, tumor, and cyst, together with geometric information in NIfTI format [21,22]. Ninety-eight cases were reserved for procedure development, while the remaining 391 cases were used in a three-fold cross-validation scheme [24]. This organization allowed a model not trained on a given patient fold to generate a prediction for each patient and configuration. We evaluated performance at the native spacing in all 391 patients. We investigated robustness to spacing variations through a controlled resampling experiment on volumes whose original geometry allowed comparable increases in inter-slice spacing, as detailed in Section 2.4. The main analytical decisions were prespecified during development, before final evaluation, and analyses incorporated subsequently were identified as exploratory or post hoc sensitivity analyses [25].
AMOS22 was used to determine whether the observed pattern was reproduced in another dataset and for a different segmentation task. It comprised 300 publicly available multicenter, multi-vendor abdominal CT studies, with annotations for 15 organs. We retrained the RoPE variants using token indices and metric coordinates on the 200 training studies and evaluated them on the 100 validation studies. This stage constituted an independent replication of the contrast between coordinate systems rather than a transfer of models trained on KiTS23.
2.2. Preprocessing and Architecture
Before preprocessing, the orientation, voxel spacing, origin, and field of view were obtained from the NIfTI header and affine matrix. For each patient, the anisotropy ratio was defined as:
where and are the voxel spacings along the three axes. The variable was retained as a continuous quantity and was discretized only for stratification and exploratory analyses.
The images and their corresponding masks were reoriented to the right-anterior-superior (RAS) coordinate system, with coordinates and the affine matrix updated consistently. Voxel spacing was not homogenized, as its variation was part of the object of study. Consequently, input regions of voxels represented different physical extents across patients. Intensities were clipped to the range between −175 and 250 Hounsfield units and scaled to . During training, regions were sampled both over annotated structures and within the body.
Data augmentation included reflections, 90° axial rotations, intensity variations, and Gaussian noise. For AMOS22, left-right reflection was disabled. No scaling or deformations that altered the physical scale were applied, and all spatial transformations were jointly propagated to the image, mask, coordinates, and affine matrix. Inference was performed using a sliding-window approach with an overlap of 0.5 and Gaussian weighting. No augmentation was used during inference, and no configuration-specific post-processing was applied. All configurations used UNETR [7]. Each input region was partitioned into tokens of voxels. The encoder consisted of 12 Transformer blocks, with a hidden dimension of 768, 12 attention heads, and an internal dimension of 3072. The decoder and skip connections remained identical across all configurations; only the positional representation was changed.
As a diagnostic control, we evaluated whether the Transformer blocks effectively contributed to segmentation. To this end, the Fourier variant with token indices (F-Index) was compared with the same network after replacing the Transformer blocks with identity operations, without modifying the decoder, sampling, or optimization procedure [20]. Evidence of a contribution from these blocks was considered present when the lower bound of the 95% CI, obtained by bootstrap resampling of the paired difference in surface Dice, was greater than zero.
2.3. Coordinate Systems and Positional Encodings
The design separated two decisions: how to represent token position and how to incorporate that representation into the Transformer. For each token , a coordinate vector associated with the center of the corresponding patch was defined. Coordinates were expressed as offsets relative to the center of the region, such that the comparison evaluated relative distances rather than the patient’s absolute location within the scanner. Two systems were considered: one based on token-grid indices and another based on physical distances.
In the index-based system, position was defined as:
where is the three-dimensional index of the token and corresponds to the center of the grid. In this system, a unit displacement always represents the separation between two consecutive tokens, regardless of voxel spacing. Therefore, the coordinates describe the order and separation within the grid, but not the physical distance.
In the metric system, the center of token , expressed in voxel coordinates, was transformed into physical space using the affine matrix :
where is the physical center of the token, and is the physical center of the region, both expressed in millimeters along the anatomical RAS axes. The scale was fixed at 13.33 mm, corresponding to the median physical size of a token—16 times the voxel spacing—calculated across the three axes and the 98 development patients. This single value placed the metric coordinates on a numerical scale comparable to index-based coordinates.
Coordinates were not normalized by each field of view of the patient, as such an operation would have eliminated the physical differences that constituted the object of study. Centering with respect to the region removed the absolute origin of the scanner and patient translations. Consequently, the metric coordinates represented relative physical separations along the RAS axes, rather than absolute locations within the scanner. Token coordinates were recomputed for each inference window. Figure 2 illustrates both systems.
To determine whether the effect of the coordinate system depended on how position was incorporated, both representations were evaluated with two encoding families: additive Fourier encoding and 3D RoPE. These families introduce position through different mechanisms: Fourier encoding adds positional information to the token representations, whereas RoPE modifies attention interactions through rotations of the queries and keys.
In additive Fourier encoding [19,26], the coordinates were transformed as:
where denotes concatenation. The fixed matrix combined axial frequencies for each axis and produced a 768-component vector, which was added to the token representation before the first attention block. No learned projection was used. The index-based and metric-coordinate variants shared the matrix , the frequencies, and the point of incorporation; only the definition of changed.
3D RoPE incorporated position through rotations of the queries and keys [10]. For the coordinate along axis and frequency , each pair of channels was transformed as follows:
Fixed frequencies were used for each axis, and ten pairs of channels were rotated for each of the three axes—60 channels in total; the remaining four channels in each head were left unrotated. The index-based and metric-coordinate variants shared the same frequencies, channel assignments, and number of parameters; again, only the definition of differed.
To avoid an additional source of positional information, we disabled the learned absolute positional encoding in UNETR in all four configurations. Thus, within each family, any observed differences could be attributed to the coordinate system rather than to changes in the incorporation mechanism, frequencies, or model capacity. Figure 3 summarizes both procedures.
2.4. Controlled Spacing Variations and Diagnostic Controls
The experiment evaluated model responses to retrospective resampling within the same patients, controlling between-patient differences while retaining the effects of the specified filtering and resampling procedure. To this end, each volume was compared with itself before and after a controlled modification of the inter-slice spacing. This within-patient comparison kept the anatomy, reference mask, and evaluated model constant. The analysis was restricted to volumes whose original geometry allowed the same spacing increases to be applied from a relatively fine through-plane resolution. A total of 117 KiTS23 cases met this criterion, falling within the lowest anisotropy tertile and having an original inter-slice spacing below 3 mm. The thresholds were defined exclusively using the development cohort; the 3-mm value corresponded to its median. The eligible cases were distributed across the three folds in groups of 40, 41, and 36 patients.
Each volume was resampled to target spacings of 3, 4, and 5 mm along the superior-inferior axis of the RAS coordinate system. These values represented increases relative to the original spacing and remained within the range observed in KiTS23. For a subsampling factor , a one-dimensional Gaussian filter with standard deviation expressed in voxels of the original grid, was applied before resampling. The filtering reduced aliasing caused by subsampling. The image was subsequently linearly interpolated onto a grid that preserved the origin and orientation. The number of slices was adjusted to approximate the original field of view at the target spacing. The resampled images were generated without using the reference mask.
To calculate metrics on a common grid, we mapped predictions obtained after resampling back to the original grid using nearest-neighbor interpolation. Thus, predictions with different spacings could be compared against the same reference mask without interpolating the labels.
The design distinguished between two potential sources of change: changes in the image content produced by resampling and the spacing information supplied to the metric variants. In the primary condition, each resampled image was paired with an affine matrix encoding the corresponding target spacing. To determine whether predictions responded specifically to this information, two controls were added in which the image and the recorded spacing were deliberately made discordant:
- The resampled image was presented with the original spacing.
- The original image was presented with the target spacing.
In these controls, only the inter-slice spacing recorded in the affine matrix was modified; the image content, origin, and orientation remained constant within each comparison. This made it possible to determine whether the metric variants responded to the supplied spacing independently of the visual changes introduced by resampling. These controls were not applied to the index-based variants, whose coordinates depended solely on the token grid and not on the affine matrix. Figure 4 summarizes the resampling procedure and the concordant and discordant combinations between the image and recorded spacing.
We used the same procedure for AMOS22. We calculated the geometric criteria exclusively from the training studies, and 38 cases in the validation set satisfied them. We evaluated these cases at inter-slice spacings of 3, 4, and 5 mm using the two previously trained RoPE variants.
2.5. Model Training and Selection
The training protocol was designed to compare the four configurations under identical optimization conditions. Within each fold, models were initialized with the same weights for the non-positional components and received the same sequence of patients, patches, and transformations. We did not tune hyperparameters specifically for any encoding. Table 2 summarizes the common conditions. We evaluated models every 5,000 iterations on a fixed set of 20 development patients. For each configuration, we selected the checkpoint with the highest mean surface Dice; in case of a tie, we chose the earliest evaluation. We applied the stopping criterion jointly to all four configurations to maintain a comparable training budget. Starting at 20,000 iterations, we terminated training if no configuration improved by at least 0.005 relative to the previous evaluation. If any configuration achieved this improvement, all configurations continued until the next evaluation, with a maximum of 30,000 iterations. During development, a preliminary evaluation was performed for the four main configurations and four additional positional baselines—APE, No PE, PPE, and AFPE—described in the Supplementary Methods. We trained each configuration once for 10,000 iterations. This stage verified implementation feasibility and established the common protocol; the final comparison corresponded to the cross-validation described in Section 2.1. We trained the control without Transformer blocks separately. For AMOS22, we trained each of the RoPE-Index and RoPE-Metric variants for 30,000 iterations using seed 2026 and the same initial weights for the non-positional components. The official validation split was reserved exclusively for final evaluation and was not involved in model selection, training termination, or protocol tuning.
2.6. Computational Cost Evaluation
To determine whether metric coordinates introduced additional computational overhead, we compared the number of parameters, peak memory usage during inference, and processing time per volume. Timing measurements used the selected models from fold 1 and the same KiTS23 case for all variants. After five warm-up runs, we performed 20 paired measurements per family; within each pair, we evaluated the metric- and index-based variants, with their order randomly assigned. Relative time was summarized as the geometric mean of the metric/index ratio, with a 95% CI obtained through paired bootstrap resampling.
2.7. Outcomes and Statistical Analysis
The analytical strategy distinguished three aspects: performance at the native spacing, the response to controlled increases in inter-slice spacing, and replication of the contrast between the RoPE variants in AMOS22. The unit of analysis was the patient. The primary analysis focused on the second aspect; comparisons at the native spacing, the remaining metrics, and heterogeneity analyses were considered complementary. Surface Dice [28] was the primary metric and was calculated from physical distances using the official KiTS23 implementation. For each patient, the value corresponded to the unweighted mean across the three hierarchical challenge classes: kidney and masses (kidney, tumor, and cyst), masses (tumor and cyst), and tumor, with tolerances of 1.033, 1.133, and 1.150 mm, respectively [22]. We analyzed volumetric Dice and HD95 as secondary metrics [29]. For AMOS22, we used a tolerance of 1 mm, and averaged overlap metrics across the organs present in the reference within the 15 annotated classes. Rules for absent structures and non-finite HD95 values are provided in the Supplementary Methods.
Let denote the surface Dice for patient , positional family , and coordinate system , obtained at the native spacing, and let denote the corresponding score after resampling to spacing . The change relative to the native spacing was expressed as:
The contrast between coordinate systems within each family was:
The primary estimand was defined as the average of this contrast, with equal weighting across the two positional families and the three spacing levels:
The direction of change was retained: indicates a decrease in Surface Dice, whereas indicates an increase. Positive values of therefore indicate a more favorable change with metric coordinates. Equivalently, this contrast measures how the metric-minus-index performance difference changes after resampling. A negative value means that this difference shifts toward the index-based variant; it does not imply that the metric variant has a lower absolute score after resampling. When resampling increases scores, the contrast compares improvements from each variant’s baseline. We interpreted the overall average only when the Fourier and RoPE effects did not oppose each other.
We quantified uncertainty using 95% CIs from 10,000 patient-level percentile bootstrap resamples [30]. In KiTS23, resampling preserved pairing across configurations and was stratified by fold; in AMOS22, it used paired resampling without stratification. Comparisons at the native spacing and the controls involving the spacing information supplied to the model followed the same within-patient comparison principle. A Surface Dice difference of 0.01 was used as an interpretive margin for the primary contrast, rather than as a threshold of clinical relevance.
Secondary analyses applied the same contrast to volumetric Dice and to the individual KiTS23 classes. For HD95, we reversed the definition of change relative to the native spacing so that positive contrast values also favored metric coordinates. A mixed-effects model examined whether the effect varied with the change in anisotropy or with the positional encoding family, accounting for repeated measurements within patients and for fold. Subgroup analyses and analyses using alternative Surface Dice tolerances were considered exploratory or post hoc sensitivity analyses.
In AMOS22, we evaluated only the contrast between the RoPE variants, averaged across the three spacings. We considered the result supportive of the hypothesis of a more favorable change with metric coordinates if the estimate was positive and the lower bound of its 95% CI was greater than −0.01. No formal sample size calculation was performed; we included all available cases meeting the eligibility criteria. The Supplementary Methods provide the full specification of the mixed-effects model, multiplicity procedures, and sensitivity analyses.
3. Results
In the development-set ablation of F-Index, the full model achieved a Surface Dice of 0.1845, compared with 0.1668 for the separately trained control in which the Transformer blocks were replaced by identity mappings. The paired difference was 0.0177 (95% CI: 0.0034 to 0.0326), supporting a contribution from the Transformer blocks under this configuration and development protocol.
3.1. Response to Resampling and Supplied-Spacing Controls in KiTS23
Among the 117 eligible KiTS23 studies, the primary Surface Dice contrast was −0.0029 (95% CI: −0.0104 to 0.0043), averaged across the two positional encoding families and three target spacings. Positive values would indicate a more favorable change from native spacing with metric coordinates. The estimate therefore did not support the hypothesized average advantage under the evaluated resampling procedure.
The estimates were small and had the same direction in both positional encoding families: −0.0056 for Fourier (95% CI: −0.0136 to 0.0021) and −0.0002 for RoPE (95% CI: −0.0107 to 0.0099). No clear difference was observed between the families either (difference between effects: 0.0053; 95% CI: −0.0051 to 0.0162). Figure 5 and Figure 6 show segmentations at the original spacing and after resampling to 5 mm for cases with individual effects near the 25th, 50th, and 75th percentiles.
Resampling did not uniformly reduce segmentation scores. Averaged across the eligible patients, all 12 configuration-by-spacing combinations yielded higher Surface Dice and lower HD95 than at native spacing. The signed contrasts therefore compare improvements as well as deterioration relative to each variant’s baseline; they should not be interpreted exclusively as differences in performance loss.
The control analyses showed that the metric variants used the spacing information supplied to the model. For the same resampled image, providing the correct spacing rather than retaining the original spacing increased Surface Dice by 0.0955 (95% CI: 0.0834 to 0.1075). The increase was 0.0192 for Fourier (95% CI: 0.0108 to 0.0275) and 0.1717 for RoPE (95% CI: 0.1508 to 0.1923).
In the reverse control, changing only the supplied spacing while leaving the image unresampled produced an overall signed change in Surface Dice of −0.0758 (95% CI: −0.0862 to −0.0654), relative to supplying the native spacing. The change was −0.0045 for Fourier (95% CI: −0.0155 to 0.0063) and −0.1470 for RoPE (95% CI: −0.1623 to −0.1316). Thus, the effect was pronounced for RoPE, whereas the Fourier interval included zero. The magnitude of the responses in both controls increased with the supplied spacing.
The primary comparison and the diagnostic controls address different contrasts. Correct spacing improved the predictions of metric variants relative to supplying incorrect spacing to those same variants, whereas the primary analysis compared their response to resampling with that of index-based variants. The response to supplied spacing, particularly with RoPE, makes it unlikely that the near-zero primary contrast arose solely because the metric variants ignored this information. It does not establish a comparative advantage over token indices. Figure 7 presents these complementary results.
3.2. Performance at the Original Spacing in KiTS23
At the original spacing, replacing token indices with metric coordinates did not improve Surface Dice. After averaging across the two positional encoding families within each patient, Surface Dice was 0.2795 with token indices and 0.2775 with metric coordinates. The paired difference—metric coordinates minus token indices—was −0.0020 (95% CI: −0.0060 to 0.0020). Descriptively, the RoPE configurations achieved higher values than the Fourier configurations with both coordinate systems (Table 3).
The secondary metrics showed different patterns. For volumetric Dice, the overall difference between metric coordinates and token indices was 0.0047 (95% CI: −0.0005 to 0.0101). Within the RoPE family, the metric variant achieved a Dice score 0.0128 higher than the index-based variant (95% CI: 0.0042 to 0.0214). In contrast, HD95 was 11.59 mm higher with metric coordinates (95% CI: 6.75 to 16.59 mm), indicating greater distance between the surfaces. This increase was concentrated in RoPE. Overall, metric coordinates did not show a consistent advantage across the evaluated metrics.
Performance varied across classes and was lower for lesions. Depending on the configuration, the mean volumetric Dice for the kidney and masses class ranged from 0.8152 to 0.8450. Some overlap with the reference was observed in 95.9–98.5% of cases for masses and in 93.6–96.4% for tumors.
3.3. Secondary Outcomes and Sensitivity Analyses
The secondary outcomes likewise did not show an overall advantage of metric coordinates under spacing changes. In the contrasts below, positive values favor metric coordinates and negative values favor token indices. For volumetric Dice, the overall difference between coordinate systems in the change from the original spacing was −0.0077 (95% CI: −0.0184 to 0.0029), with no clear advantage within either Fourier or RoPE. For HD95, the overall effect interval included zero, but estimates differed between positional encoding families. The difference between the RoPE and Fourier effects was −17.94 mm (95% CI: −29.80 to −6.32 mm), indicating a less favorable HD95 response with metric RoPE (Table 4).
No common pattern was observed across the hierarchical classes either. The estimate for tumor was the only one whose interval did not include zero; however, it corresponded to a secondary outcome without multiplicity adjustment and was interpreted as a non-confirmatory signal. Fold-specific estimates likewise showed no conclusive differences.
The heterogeneity analyses did not identify consistent effect modification. The most negative estimate was observed in the highest tertile of original anisotropy (−0.0151; 95% CI: −0.0294 to −0.0034), but the formal contrasts across strata of anisotropy, tumor volume, kidney volume, and cyst presence all included zero. Separately, the mixed-effects model examined the relationship between resampling and the change in anisotropy. For Fourier, the interaction suggested that performance loss increased less with metric coordinates as anisotropy change increased (β = −0.0183; 95% CI: −0.0350 to −0.0016; p = 0.032), although the evidence was attenuated after Holm correction (adjusted p = 0.095). The three-way interaction did not indicate that this relationship depended on the positional encoding family (β = −0.0034; 95% CI: −0.0270 to 0.0202; adjusted p = 1.000).
The primary result was unchanged when the Surface Dice tolerance was varied. Estimates ranged from −0.0014 to −0.0037, remained close to zero, and all corresponding intervals included zero (Table 5). We evaluated the alternative tolerances post hoc.
3.4. Absolute Performance and Response to Resampling in AMOS22
AMOS22 showed a different pattern from that observed in KiTS23: metric RoPE achieved higher performance at the original spacing, but its advantage decreased after resampling. Across the 100 studies in the validation split, the macro–Surface Dice was 0.3615 with metric RoPE and 0.3261 with token index-based RoPE. The paired difference—metric RoPE minus index-based RoPE—was 0.0354 (95% CI: 0.0311 to 0.0399).
The spacing-change analysis included the 38 geometrically eligible studies. Within this subset, the advantage of metric RoPE was 0.0512 (95% CI: 0.0452 to 0.0573) at the original spacing and decreased to 0.0353, 0.0246, and 0.0216 after resampling to 3, 4, and 5 mm, respectively. Although the absolute difference remained in favor of metric RoPE under all four conditions, the preservation contrast was −0.0241 (95% CI: −0.0296 to −0.0186), with negative values in 35 of the 38 studies. In this contrast, negative values indicate a more favorable change from baseline for the index-based RoPE variant. The same preservation pattern was observed for volumetric Dice (−0.0221; 95% CI: −0.0271 to −0.0172).
The absolute and baseline-relative comparisons therefore favored different variants. Metric RoPE retained the higher Surface Dice at every tested spacing, whereas index-based RoPE showed the more favorable change from its own native-spacing score. The negative preservation contrast represents a narrowing of the metric advantage, not a reversal of the absolute ranking. The result did not meet the predefined consistency criterion for a more favorable change with metric coordinates (Figure 8).
We could not estimate a macro-level contrast for HD95. All 428 combinations of study, variant, and condition had an infinite macro HD95 because, in every case, the segmentation of at least one organ present in the reference was missing. For this reason, no analysis selectively restricted to finite values was performed. Several small structures also received zero scores with both variants, limiting the interpretation of organ-specific results.
3.5. Computational efficiency
Replacing token indices with metric coordinates did not change the number of trainable parameters. All four KiTS23 configurations contained 92,636,420 parameters, and none included learnable positional parameters. No increase in peak inference memory was observed either: both Fourier variants used 1.374 GiB, whereas both RoPE variants used 1.373 GiB.
In the controlled benchmark on an RTX A6000 GPU, point estimates of the runtime overhead were below 1%. Relative to the index-based variants, inference time increased by 0.71% with metric Fourier (95% CI: 0.57% to 0.84%) and by 0.84% with metric RoPE (95% CI: 0.67% to 1.00%). The median differences were 0.010 and 0.013 seconds per volume, respectively.
These intervals reflect technical repetitions on the same volume and device rather than variation across patients, volumes, or hardware. Under the evaluated conditions, the incremental cost of using metric coordinates was small and was not accompanied by changes in parameter count or observed peak inference memory.
4. Discussion
4.1. Main Finding and Interpretation
The experiments distinguish three questions that can lead to different assessments of metric positional encoding: whether predictions respond to supplied spacing, whether metric coordinates improve absolute performance, and whether they produce a more favorable change under resampling. In KiTS23, the primary contrast was close to zero despite clear responses to the supplied spacing. Its confidence interval did not support an advantage of at least 0.01 for metric coordinates, although it did not entirely exclude a disadvantage of that magnitude. This finding limits the case for improved performance preservation under the evaluated conditions; it does not establish equivalence between the coordinate systems.
The diagnostic controls help explain why the near-zero primary contrast remains informative. For resampled images, providing the corresponding spacing improved the metric variants relative to retaining the original spacing. Conversely, altering only the supplied spacing changed predictions for images that had not been resampled, particularly with RoPE. These observations show that image–spacing consistency affected predictions within the metric variants. They do not show that those variants responded more favorably to resampling than their index-based counterparts. Sensitivity to a physically interpretable input is therefore insufficient evidence of comparative robustness.
AMOS22 provides a complementary result: metric RoPE retained higher absolute Surface Dice at all tested spacings, while index-based RoPE showed the more favorable change relative to its own baseline. Among the 38 eligible cases, the metric advantage narrowed from 0.0512 at native spacing to 0.0216 at 5 mm. The negative preservation contrast did not imply that metric RoPE became the lower-performing model. A model-selection decision based only on the baseline-relative contrast would miss its remaining absolute advantage; a decision based only on absolute scores would miss the narrowing of that advantage. Both comparisons are needed to characterize the observed response.
The native-spacing results in KiTS23 also show why an apparent benefit should be checked across metrics. Within RoPE, metric coordinates increased volumetric Dice by 0.0128 (95% CI: 0.0042 to 0.0214), while the increase in HD95 was concentrated in the same family. The overlap benefit therefore did not establish a consistent improvement in surface accuracy.
4.2. Relationship to Previous Work and Possible Mechanisms
The physical motivation for metric coordinates remains valid: a fixed separation between tokens does not represent the same anatomical distance when voxel spacing varies. However, providing an explicit physical scale does not impose invariance to spacing changes. Positional encoding transforms coordinates into phases or features that interact with learned representations; during training, the model may associate them with both anatomy and acquisition protocols or cohort composition. Thus, a geometrically interpretable signal may be informative without necessarily improving performance when spacing changes within the evaluated range.
This interpretation helps place previously discordant findings into context. A positional encoding based on coordinates and resolution improved infarct segmentation in a geometrically heterogeneous cohort but did not provide the same benefit on BraTS [18]. Anisotropic Fourier features have also proved useful for classification and regression, although they had not been evaluated for dense segmentation [19]. In other settings, removing explicit positional encoding was beneficial [16], whereas RoPE was incorporated into an improved architecture for multi-organ segmentation [17]. Unlike comparisons in which several components are modified simultaneously, our design kept the architecture fixed within each contrast. The change in pattern between KiTS23 and AMOS22 is consistent with dependence on the experimental context and does not support a universal hierarchy between coordinate systems.
The increase in mean scores after downsampling is important for interpreting the signed contrasts. In KiTS23, all 12 configuration-by-spacing combinations showed higher mean Surface Dice and lower mean HD95 after resampling. Increasing through-plane spacing changed the sampling geometry and, through antialiasing, the image signal. Because the input windows retained fixed dimensions of 96 × 96 × 96 voxels, their physical extent also changed. These factors may contribute to the observed response, but the present experiments do not isolate their individual contributions. Pairing controls between-patient differences and exposes each configuration to the same retrospective perturbation; it does not identify a pure effect of spacing or establish how performance would change under a real acquisition protocol. The primary contrast should therefore be interpreted as a comparison of signed responses to the specified resampling procedure.
4.3. Strengths and Limitations
The factorial design allowed us to isolate the coordinate system within two positional encoding families while using common data, optimization settings, and selection rules. We kept development patients separate from evaluation; each of the 391 KiTS23 patients was evaluated by a model that had not been trained on that patient, and the perturbation analysis preserved pairing across configurations, spacings, and patients. The patient was the unit of analysis, and the controls showed that the spacing encoded in the affine matrix affected predictions from the metric variants. These design choices strengthen the validity of the comparison, although they do not turn cross-validation into external validation. The fold-specific models shared part of their training data, and the results characterize the complete cross-validation procedure rather than a final model retrained on the entire cohort [24,25].
The main inferential limitation is the absence of complete training replicates. We performed a single run for each configuration and fold in KiTS23 and a single run for each variant in AMOS22, with matched initializations within each comparison. Matching initializations and transformations reduce noise in the contrasts, but the intervals reflect between-patient variation conditional on the trained models. They do not incorporate uncertainty arising from new initializations, optimization trajectories, or checkpoint selection. The modest absolute performance, particularly for small structures, also warrants consideration. Using the same hyperparameters across all variants helped attribute differences to the coordinate system, but it may have favored some variants unequally or introduced floor effects. The class-wise results did not suggest a general collapse in KiTS23, but they do not establish that higher-performing models would respond in the same way.
The retrospective perturbation does not simultaneously reproduce changes in noise, contrast, field of view, artifacts, or other differences across scanners or centers. In KiTS23, the robustness analysis was restricted to 117 of the 391 cases with an original through-plane spacing below 3 mm and belonging to the lowest anisotropy tertile. These results therefore cannot be directly extrapolated to studies with an original through-plane spacing of 3 mm or greater, or with high anisotropy. In AMOS22, only 38 validation cases met the geometric criteria for the perturbations. Moreover, macro HD95 was infinite in all 428 evaluated study–variant–condition combinations because at least one reference organ lacked a predicted segmentation in each combination. The observed macro Surface Dice advantage therefore does not establish adequate segmentation of every organ. The scope is further restricted to UNETR, two public abdominal CT datasets, and two positional encoding families; the findings cannot be directly generalized to magnetic resonance imaging, other anatomical regions, hierarchical architectures, patch sizes, or resampling strategies. In addition, the metric contrast depended on the 13.33 mm normalization scale and the fixed frequency spectrum evaluated and therefore does not represent all possible metric parameterizations. The variable contribution of Transformer blocks across hybrid models provides an additional reason to avoid such extrapolation [20]. Finally, the sample size was determined by data availability rather than by a formal power calculation.
4.4. Implications
Evaluation of metric positional encoding should report absolute performance at native and modified spacings, paired changes from each variant’s baseline, and controls that alter the supplied spacing independently of image content. The absolute scores indicate which variant performs better under each evaluated condition; the paired contrast indicates how their performance difference changes after resampling. Diagnostic controls establish whether the supplied spacing affects the metric variants, without substituting for a comparison against token indices. Reporting these quantities together makes a remaining absolute advantage and an unfavorable baseline-relative response visible. The number of training runs should also be reported, with patient-level uncertainty distinguished from variability due to training.
The modification nevertheless remains practical for research: it added no parameters, did not increase the observed peak inference memory, and its point estimates for inference overhead were below 1% on the evaluated RTX A6000 GPU. This low computational cost makes the approach easy to investigate, but it is not, by itself, a reason for deployment. Future experiments should repeat training with multiple random seeds, include architectures with different attention mechanisms, and combine metric coordinates with data augmentation strategies that explicitly vary spacing. The most relevant test would be a multicenter evaluation involving real protocol changes, which could determine when sensitivity to physical scale provides clinical robustness and when it instead amplifies acquisition-specific associations.
5. Conclusions
This controlled UNETR comparison shows that sensitivity to supplied spacing, absolute segmentation performance, and change from native-spacing performance can lead to different assessments of metric positional encoding. In KiTS23, the metric variants responded to spacing information without showing an overall advantage in the primary Surface Dice contrast. In AMOS22, metric RoPE retained higher absolute scores at every evaluated spacing, although its advantage narrowed after resampling. A less favorable change from baseline therefore did not imply lower absolute performance under the perturbed conditions.
Metric coordinates added no trainable parameters and incurred little measured inference overhead on the evaluated RTX A6000 GPU. The evidence remains conditional on the trained models, with one run per configuration and fold in KiTS23 and one per variant in AMOS22, modest absolute performance, and retrospective perturbations in two abdominal CT datasets. Repeated training and evaluation under real acquisition changes are needed to assess generalizability. For the evaluated setting, the practical implication is to report absolute scores, paired changes, and spacing controls together when judging the value of metric positional encoding.
Author Contributions
Conceptualization, G.S.T. and C.H.M.; methodology, G.S.T.; software, G.S.T., M.S.C.; validation, G.S.T., C.H.M. and M.S.C.; formal analysis, G.S.T.; investigation, G.S.T and C.H.M.; resources, G.S.T.; data curation, M.S.C.; writing—original draft preparation, G.S.T.; writing—review and editing, C.H.M.; visualization, M.S.C.; supervision, G.S.T.; project administration, G.S.T.; funding acquisition, G.S.T. All authors have read and agreed to the published version of the manuscript.
Funding
This research received no external funding.
Institutional Review Board Statement
Not applicable.
Data Availability Statement
The KiTS23 and AMOS22 datasets analyzed in this study are publicly available from the official KiTS23 repository and the AMOS22 Zenodo record, respectively. The code and experimental configurations used in this study are publicly available at sanchezgt/metric-position-encoding-3d.
Conflicts of Interest
The authors declare no conflicts of interest.
References
- Li, J.; Chen, J.; Tang, Y.; Wang, C.; Landman, B.A.; Zhou, S.K. Transforming Medical Imaging with Transformers? A Comparative Review of Key Properties, Current Progresses, and Future Perspectives. Medical Image Analysis 2023, 85, 102762. [CrossRef]
- Xia, K.; Wang, J. Recent Advances of Transformers in Medical Image Analysis: A Comprehensive Review. MedComm—Future Medicine 2023, 2, e38. [CrossRef]
- Zhou, H.-Y.; Guo, J.; Zhang, Y.; Han, X.; Yu, L.; Wang, L.; Yu, Y. nnFormer: Volumetric Medical Image Segmentation via a 3D Transformer. IEEE Transactions on Image Processing 2023, 32, 4036–4045. [CrossRef]
- Hatamizadeh, A.; Nath, V.; Tang, Y.; Yang, D.; Roth, H.R.; Xu, D. Swin UNETR: Swin Transformers for Semantic Segmentation of Brain Tumors in MRI Images. In Proceedings of the Brainlesion: Glioma, Multiple Sclerosis, Stroke and Traumatic Brain Injuries; Crimi, A., Bakas, S., Eds.; Springer International Publishing: Cham, 2022; pp. 272–284.
- Vaswani, A.; Shazeer, N.; Parmar, N.; Uszkoreit, J.; Jones, L.; Gomez, A.N.; Kaiser, L.; Polosukhin, I. Attention Is All You Need. In Proceedings of the Advances in neural information processing systems; 2017; Vol. 30.
- Dosovitskiy, A.; Beyer, L.; Kolesnikov, A.; Weissenborn, D.; Zhai, X.; Unterthiner, T.; Dehghani, M.; Minderer, M.; Heigold, G.; Gelly, S.; et al. An Image Is Worth 16x16 Words: Transformers for Image Recognition at Scale. In Proceedings of the International conference on learning representations; 2021.
- Hatamizadeh, A.; Tang, Y.; Nath, V.; Yang, D.; Myronenko, A.; Landman, B.; Roth, H.R.; Xu, D. UNETR: Transformers for 3D Medical Image Segmentation. In Proceedings of the 2022 IEEE/CVF winter conference on applications of computer vision; 2022; pp. 1748–1758.
- Yu, X.; Yang, Q.; Zhou, Y.; Cai, L.Y.; Gao, R.; Lee, H.H.; Li, T.; Bao, S.; Xu, Z.; Lasko, T.A.; et al. UNesT: Local Spatial Representation Learning with Hierarchical Transformer for Efficient Medical Segmentation. Medical Image Analysis 2023, 90, 102939. [CrossRef]
- Shaw, P.; Uszkoreit, J.; Vaswani, A. Self-Attention with Relative Position Representations. In Proceedings of the Proceedings of the 2018 Conference of the North American Chapter of the Association for Computational Linguistics: Human Language Technologies, Volume 2 (Short Papers); Walker, M., Ji, H., Stent, A., Eds.; Association for Computational Linguistics: New Orleans, Louisiana, June 2018; pp. 464–468.
- Su, J.; Ahmed, M.; Lu, Y.; Pan, S.; Bo, W.; Liu, Y. RoFormer: Enhanced Transformer with Rotary Position Embedding. Neurocomputing 2024, 568, 127063. [CrossRef]
- Kazemnejad, A.; Padhi, I.; Ramamurthy, K.N.; Das, P.; Reddy, S. The Impact of Positional Encoding on Length Generalization in Transformers. In Proceedings of the Advances in neural information processing systems; 2023; Vol. 36, pp. 24892–24928.
- Li, Y.; Si, S.; Li, G.; Hsieh, C.-J.; Bengio, S. Learnable Fourier Features for Multi-Dimensional Spatial Positional Encoding. In Proceedings of the Advances in neural information processing systems; 2021; Vol. 34, pp. 15816–15829.
- Ito, T.; Cocchi, L.; Klinger, T.; Ram, P.; Campbell, M.; Hearne, L.J. Learning Positional Encodings in Transformers Depends on Initialization 2024.
- Wu, K.; Peng, H.; Chen, M.; Fu, J.; Chao, H. Rethinking and Improving Relative Position Encoding for Vision Transformer.; 2021; pp. 10033–10041.
- Isensee, F.; Jaeger, P.F.; Kohl, S.A.A.; Petersen, J.; Maier-Hein, K.H. nnU-Net: A Self-Configuring Method for Deep Learning-Based Biomedical Image Segmentation. Nat Methods 2021, 18, 203–211. [CrossRef]
- Müller-Franzes, G.; Khader, F.; Siepmann, R.; Han, T.; Kather, J.N.; Nebelung, S.; Truhn, D. Medical Slice Transformer for Improved Diagnosis and Explainability on 3D Medical Images with DINOv2. Scientific Reports 2025, 15, 23979. [CrossRef]
- Yang, H.; Yang, C.; Yang, D.; Hang, X.; Liu, W. RE-XswinUnet: Rotary Positional Encoding and Inter-Slice Contextual Connections for Multi-Organ Segmentation. Big Data and Cognitive Computing 2025, 9, 274. [CrossRef]
- Das, B.K.; Zhao, G.; Islam, S.; Re, T.J.; Comaniciu, D.; Gibson, E.; Maier, A. Co-Ordinate-Based Positional Embedding That Captures Resolution to Enhance Transformer’s Performance in Medical Image Analysis. Scientific Reports 2024, 14, 9380. [CrossRef]
- Jabareen, N.; Yuan, D.; Liu, D.; Ten, F.-W.; Lukassen, S. Anisotropic Fourier Features for Positional Encoding in Medical Imaging. In Proceedings of the Shape in medical imaging; 2025; pp. 1–13.
- Wald, T.; Roy, S.; Isensee, F.; Ulrich, C.; Ziegler, S.; Trofimova, D.; Stock, R.; Baumgartner, M.; Köhler, G.; Maier-Hein, K.H. Primus: Enforcing Attention Usage for 3D Medical Image Segmentation. Transactions on Machine Learning Research 2026.
- Heller, N.; Isensee, F.; Trofimova, D.; Tejpaul, R.; Zhao, Z.; Chen, H.; Wang, L.; others The KiTS21 Challenge: Automatic Segmentation of Kidneys, Renal Tumors, and Renal Cysts in Corticomedullary-Phase CT 2023.
- KiTS23 Challenge Organizers KiTS23: The 2023 Kidney Tumor Segmentation Challenge 2023.
- Ji, Y.; Bai, H.; Ge, C.; Yang, J.; Zhu, Y.; Zhang, R.; Li, Z.; Zhang, L.; Ma, W.; Wan, X.; et al. AMOS: A Large-Scale Abdominal Multi-Organ Benchmark for Versatile Medical Image Segmentation. In Proceedings of the Advances in neural information processing systems: Datasets and benchmarks track; 2022; Vol. 35.
- Bradshaw, T.J.; Huemann, Z.; Hu, J.; Rahmim, A. A Guide to Cross-Validation for Artificial Intelligence in Medical Imaging. Radiology: Artificial Intelligence 2023, 5, e220232. [CrossRef]
- Tejani, A.S.; Klontzas, M.E.; Gatti, A.A.; Mongan, J.T.; Moy, L.; Park, S.H.; Kahn, C.E.; Asselbergs, F.W. Checklist for Artificial Intelligence in Medical Imaging (CLAIM): 2024 Update. Radiology: Artificial Intelligence 2024, 6, e240300. [CrossRef]
- Heo, B.; Park, S.; Han, D.; Yun, S. Rotary Position Embedding for Vision Transformer. In Proceedings of the Computer Vision—ECCV 2024; Leonardis, A., Ricci, E., Roth, S., Russakovsky, O., Sattler, T., Varol, G., Eds.; Springer Nature Switzerland: Cham, 2025; pp. 289–305.
- Loshchilov, I.; Hutter, F. Decoupled Weight Decay Regularization.; September 27 2018.
- Nikolov, S.; Blackwell, S.; Zverovitch, A.; Mendes, R.; Livne, M.; Fauw, J.D.; Patel, Y.; Meyer, C.; Askham, H.; Romera-Paredes, B.; et al. Clinically Applicable Segmentation of Head and Neck Anatomy for Radiotherapy: Deep Learning Algorithm Development and Validation Study. Journal of Medical Internet Research 2021, 23, e26151. [CrossRef]
- Taha, A.A.; Hanbury, A. Metrics for Evaluating 3D Medical Image Segmentation: Analysis, Selection, and Tool. BMC Med Imaging 2015, 15, 29. [CrossRef]
- Efron, B.; Tibshirani, R. Bootstrap Methods for Standard Errors, Confidence Intervals, and Other Measures of Statistical Accuracy. Statistical Science 1986, 1, 54–75. [CrossRef]
Figure 1.
Experimental design. a) Cohort partitioning in KiTS23, including the development set, three-fold internal evaluation, and the subset used for paired spacing perturbations. b) Three-fold cross-validation of the four positional configurations, generation of out-of-fold predictions, and replication of the RoPE index-versus-metric contrast in AMOS22-TC.
Figure 1.
Experimental design. a) Cohort partitioning in KiTS23, including the development set, three-fold internal evaluation, and the subset used for paired spacing perturbations. b) Three-fold cross-validation of the four positional configurations, generation of out-of-fold predictions, and replication of the RoPE index-versus-metric contrast in AMOS22-TC.
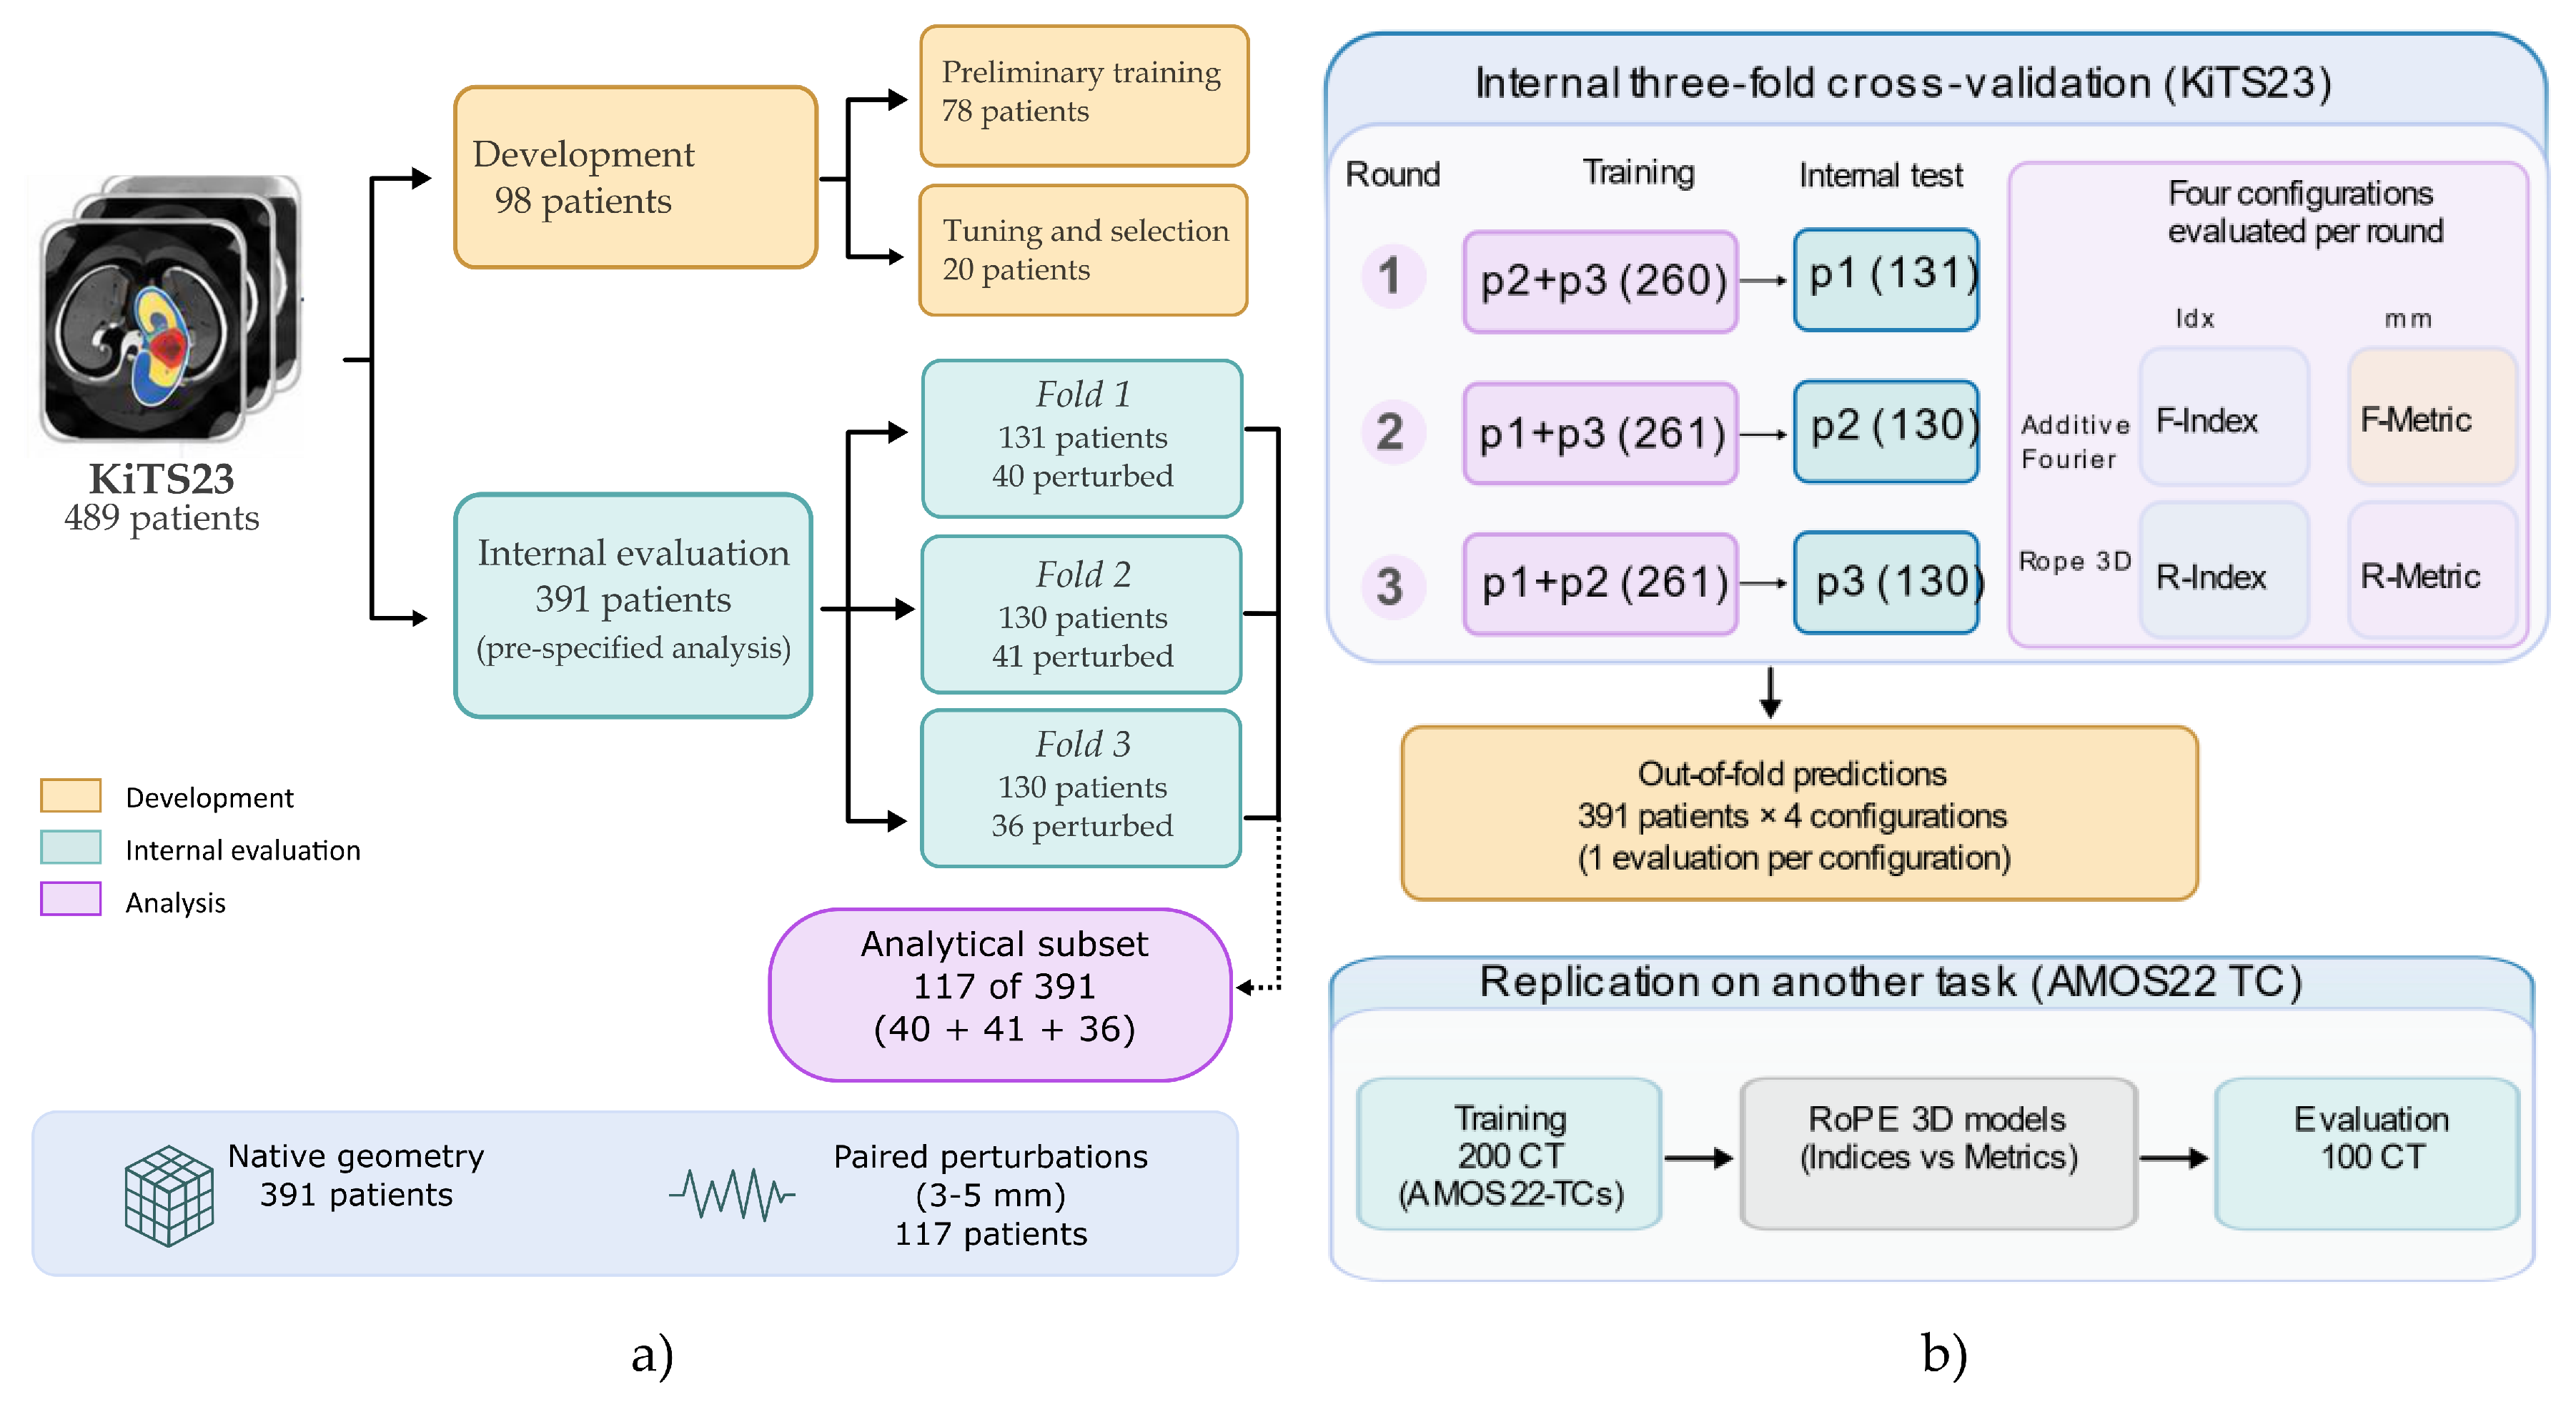
Figure 2.
Token coordinate systems. a) Discrete offsets relative to the center of the grid. b) Metric offsets obtained using the affine matrix, centered on the region and normalized by ().
Figure 2.
Token coordinate systems. a) Discrete offsets relative to the center of the grid. b) Metric offsets obtained using the affine matrix, centered on the region and normalized by ().
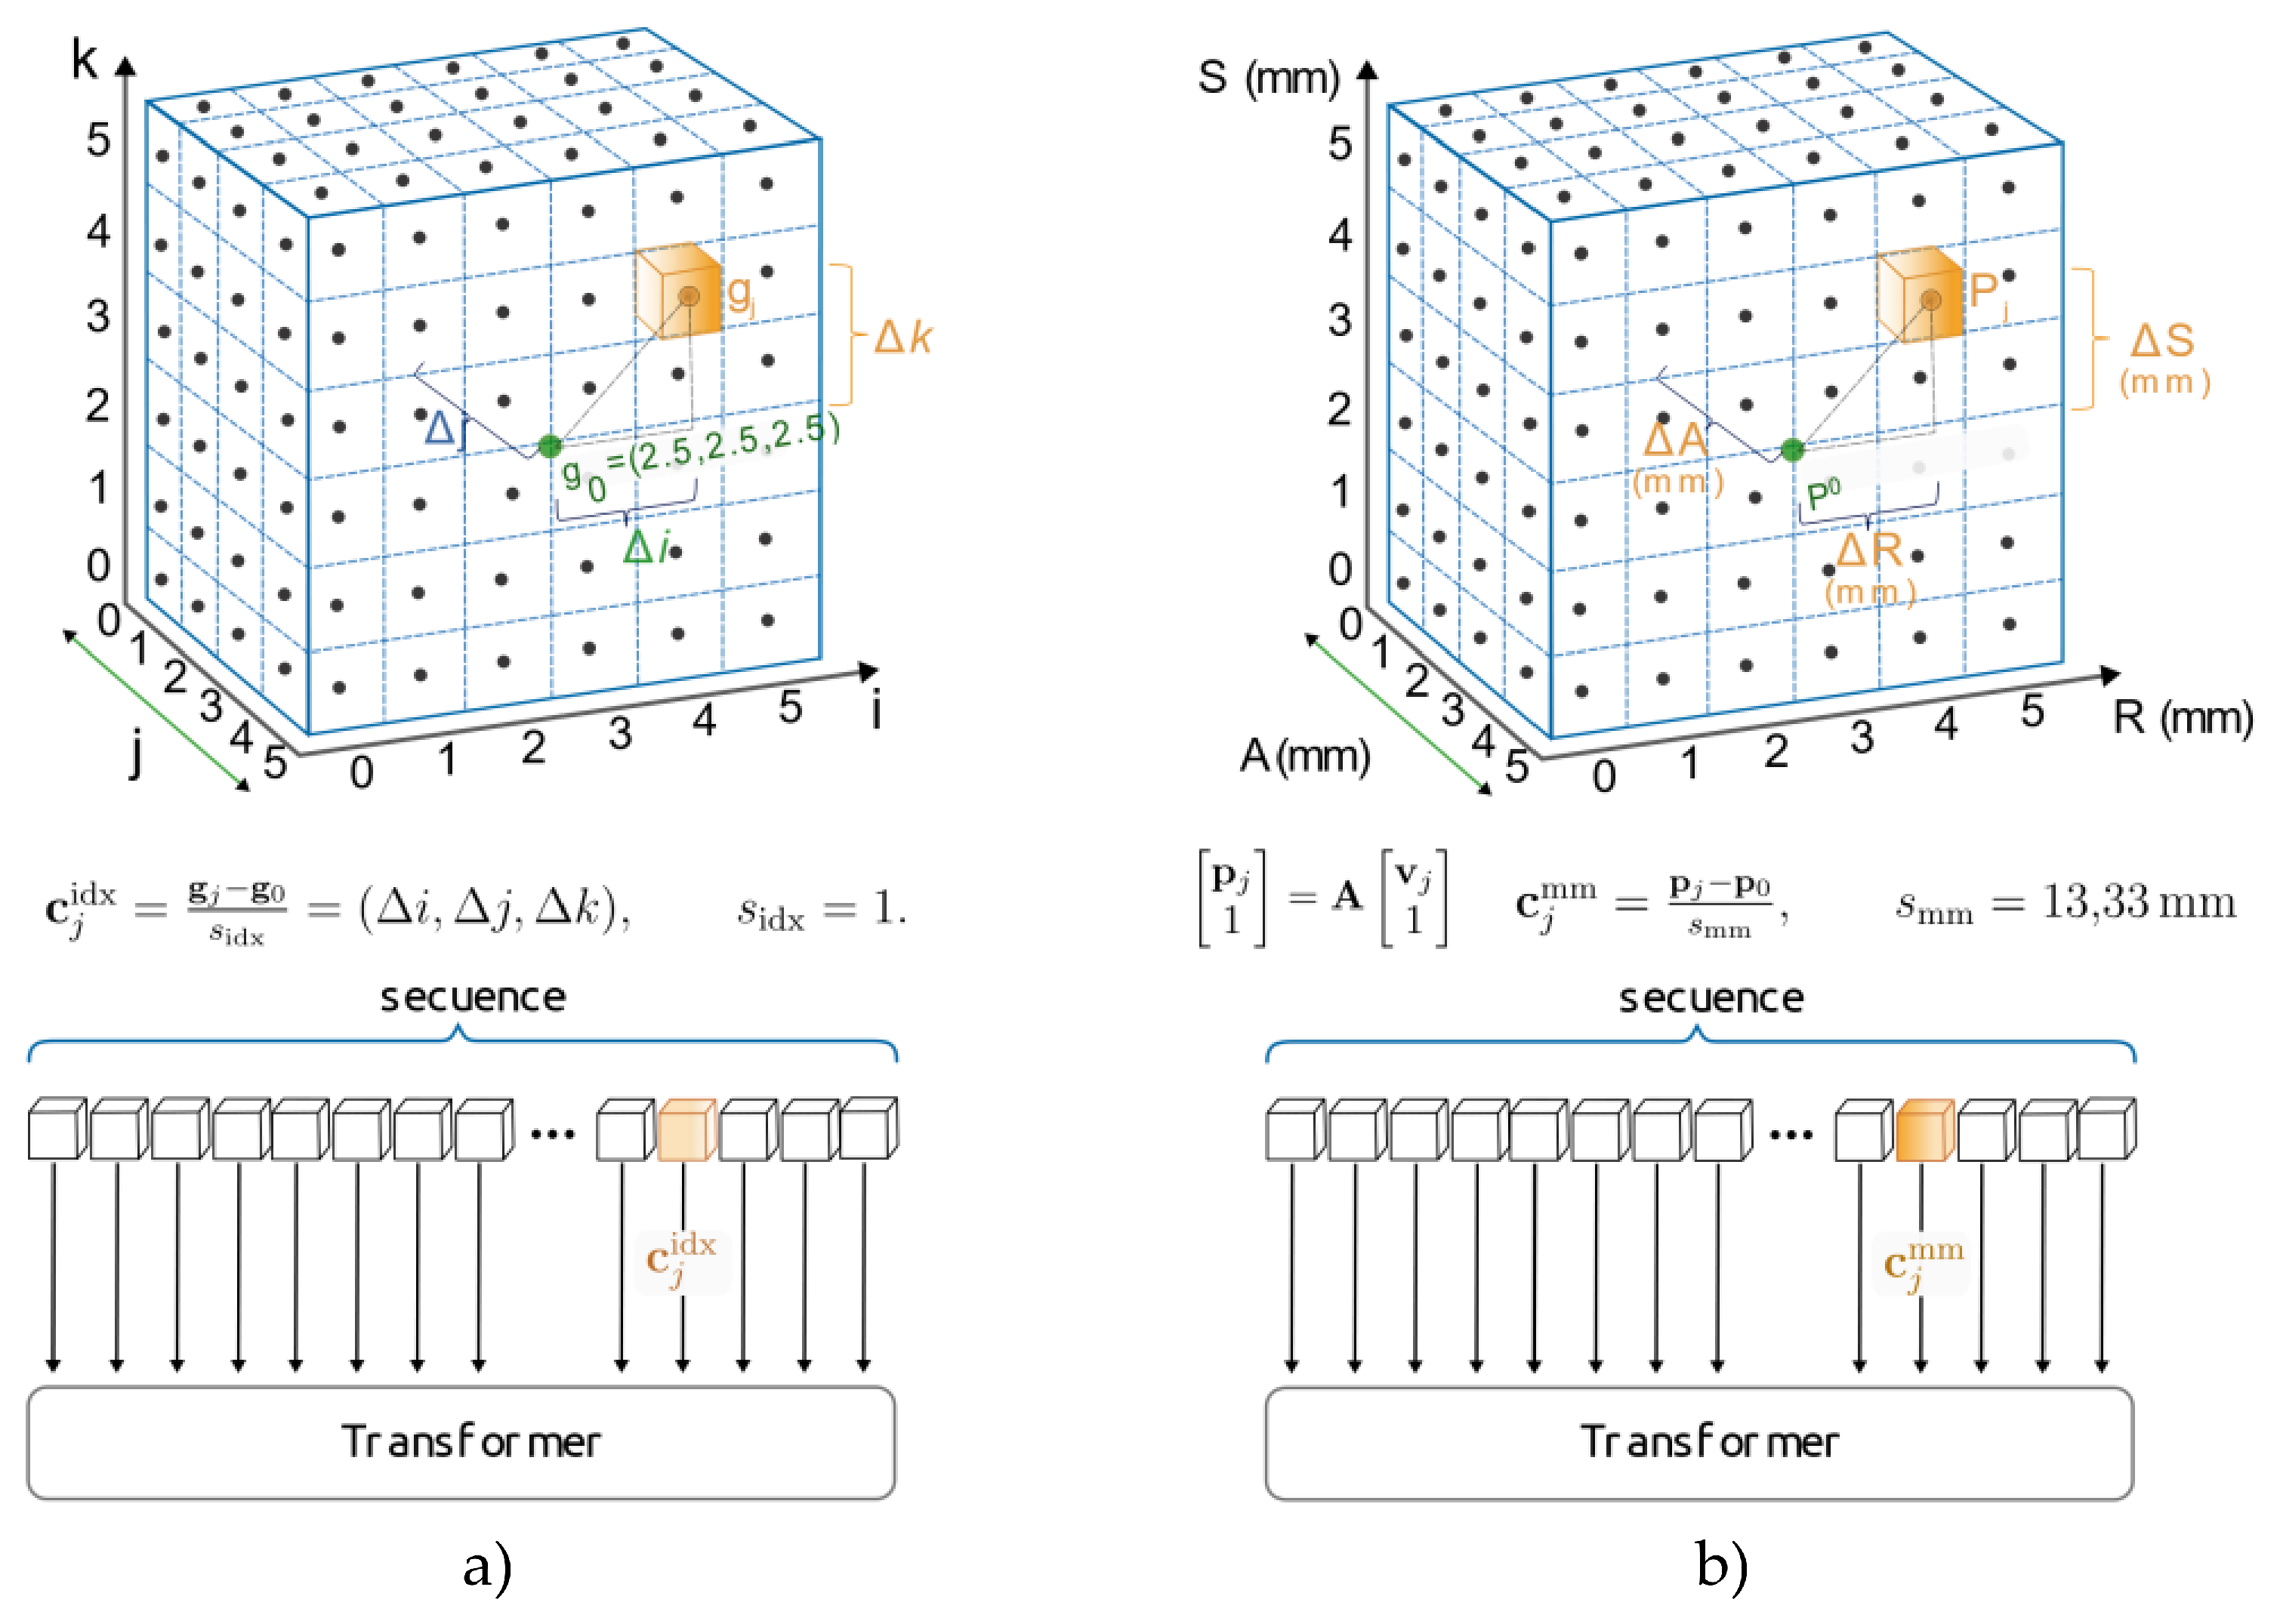
Figure 3.
Incorporation of the positional encoding families. a) Additive Fourier encoding. b) 3D RoPE uses the coordinates to rotate pairs of query and key channels along each axis.
Figure 3.
Incorporation of the positional encoding families. a) Additive Fourier encoding. b) 3D RoPE uses the coordinates to rotate pairs of query and key channels along each axis.
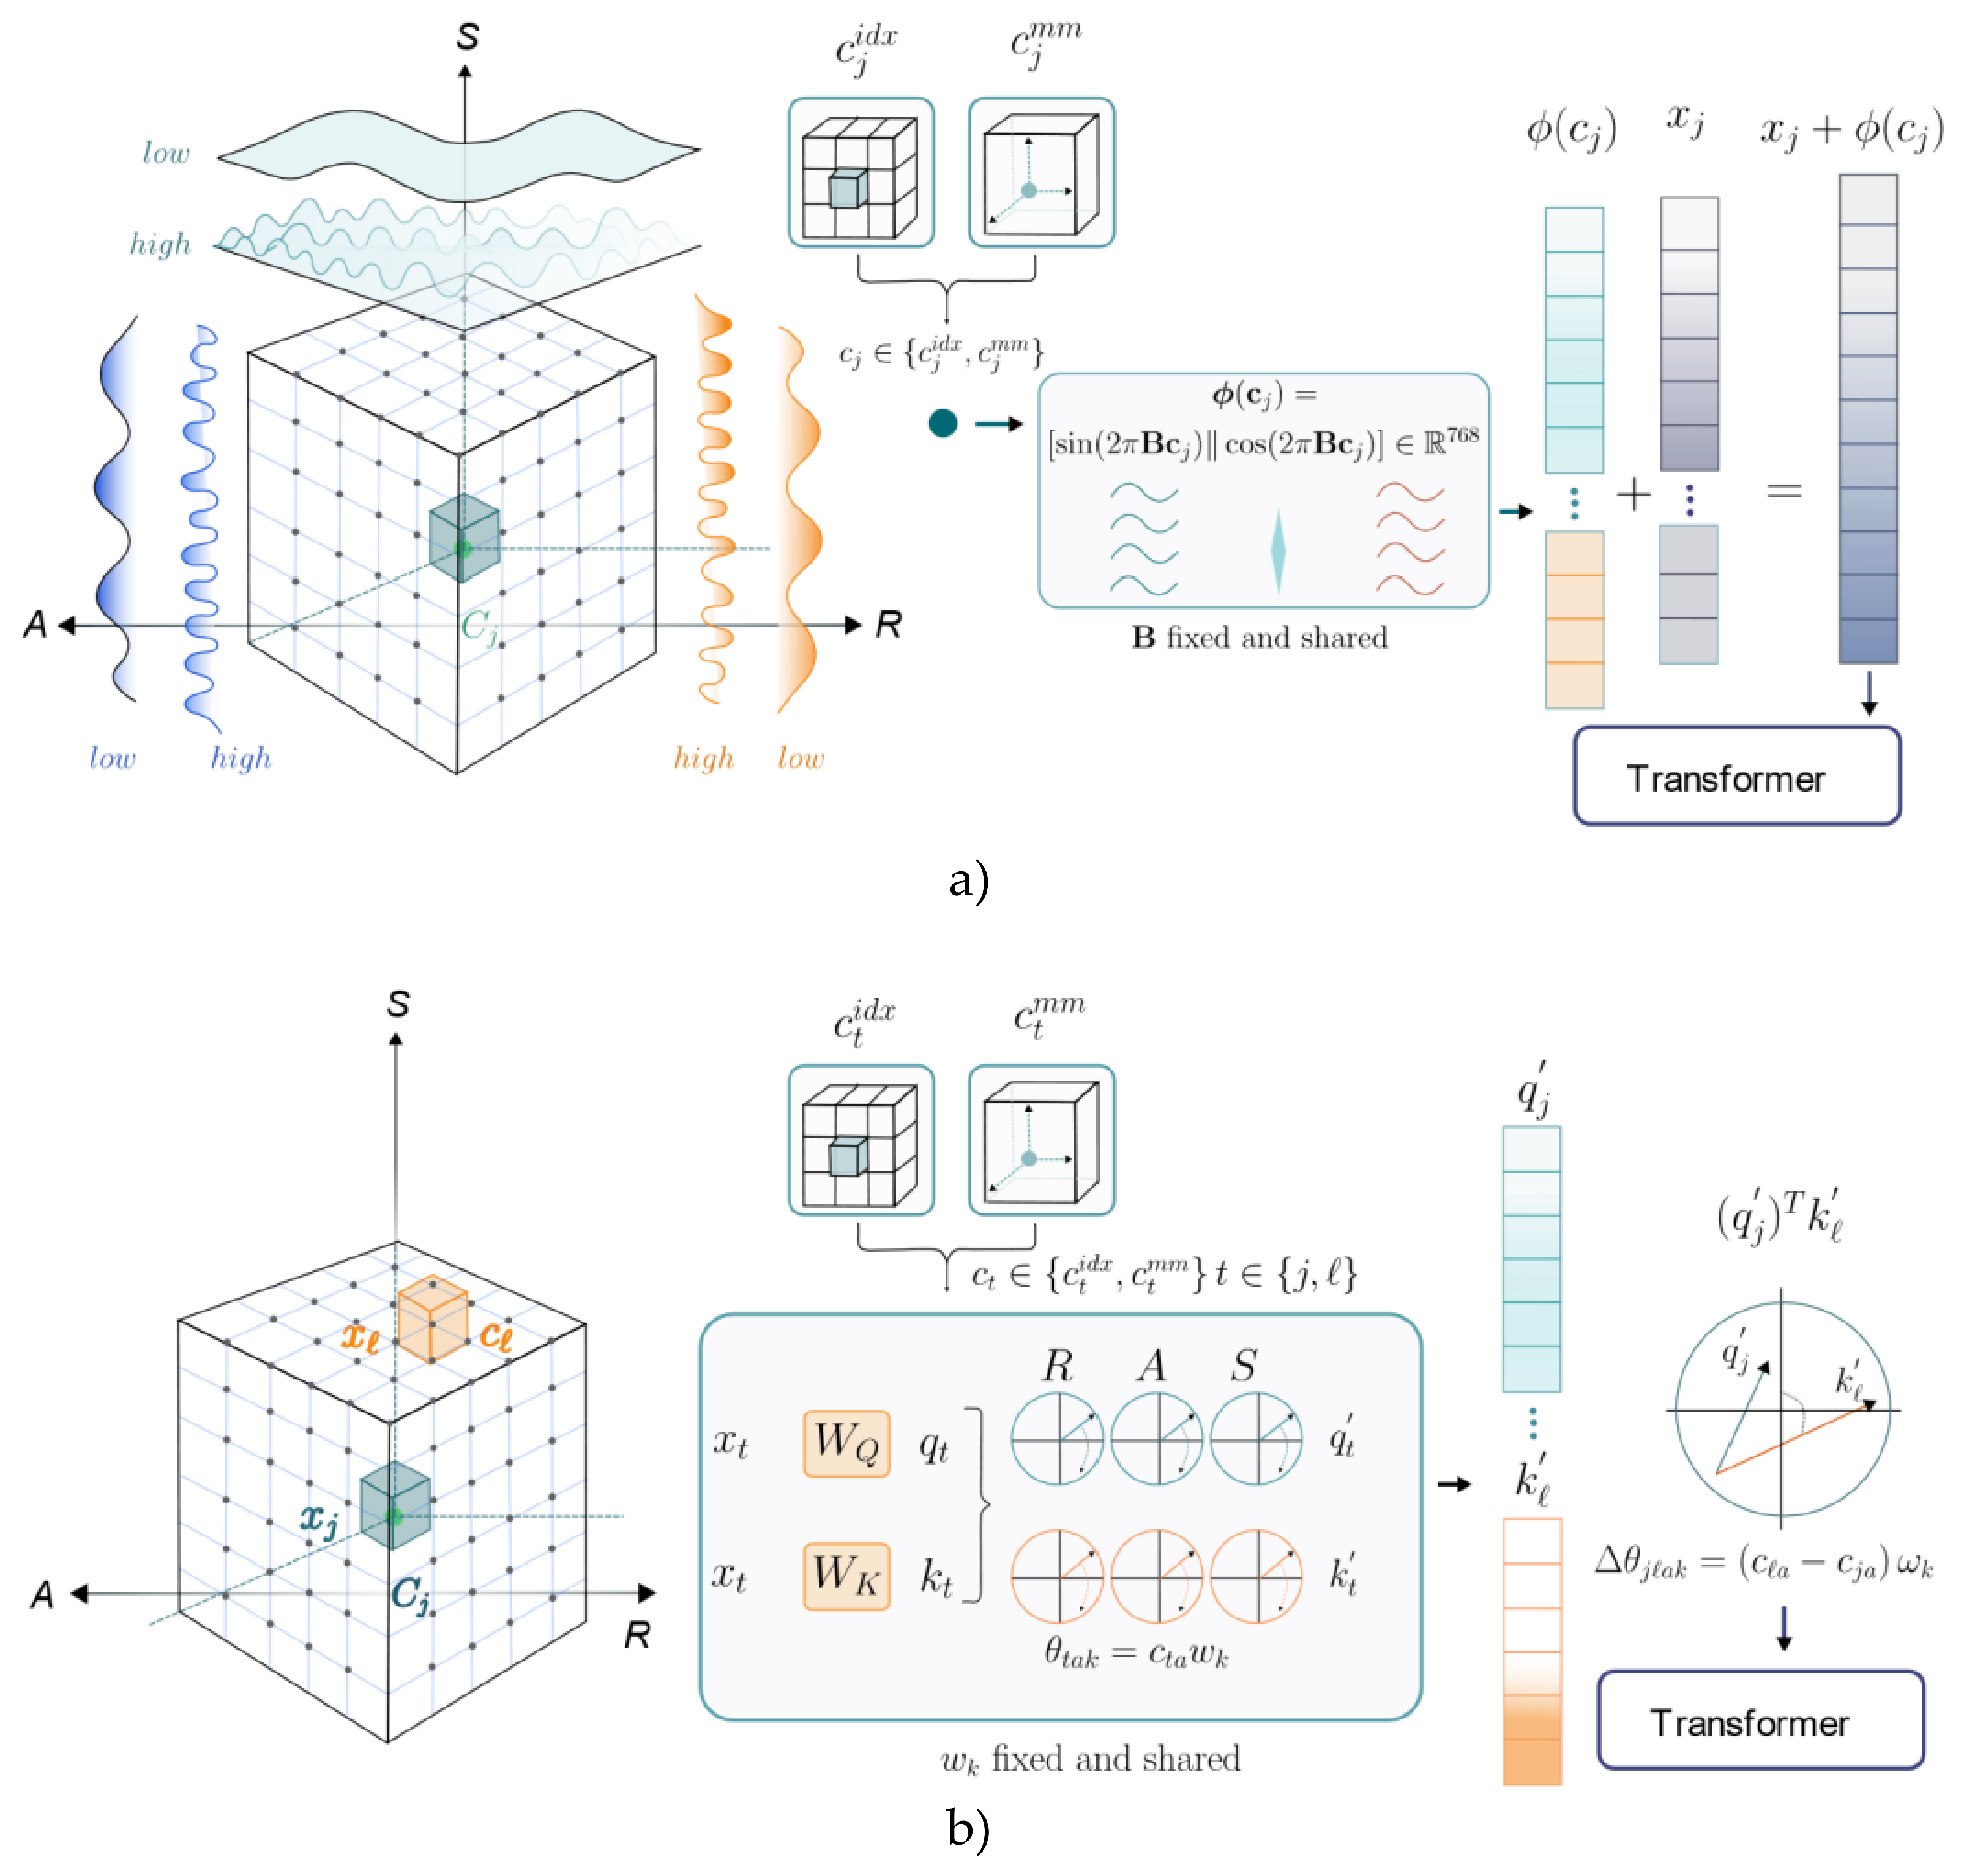
Figure 4.
Generation of resampled images and controls for the spacing supplied to the model. The left panel shows resampling to 3, 4, and 5 mm and the mapping of predictions back to the reference grid; the right panel shows the concordant and discordant combinations between the image and the supplied spacing.
Figure 4.
Generation of resampled images and controls for the spacing supplied to the model. The left panel shows resampling to 3, 4, and 5 mm and the mapping of predictions back to the reference grid; the right panel shows the concordant and discordant combinations between the image and the supplied spacing.
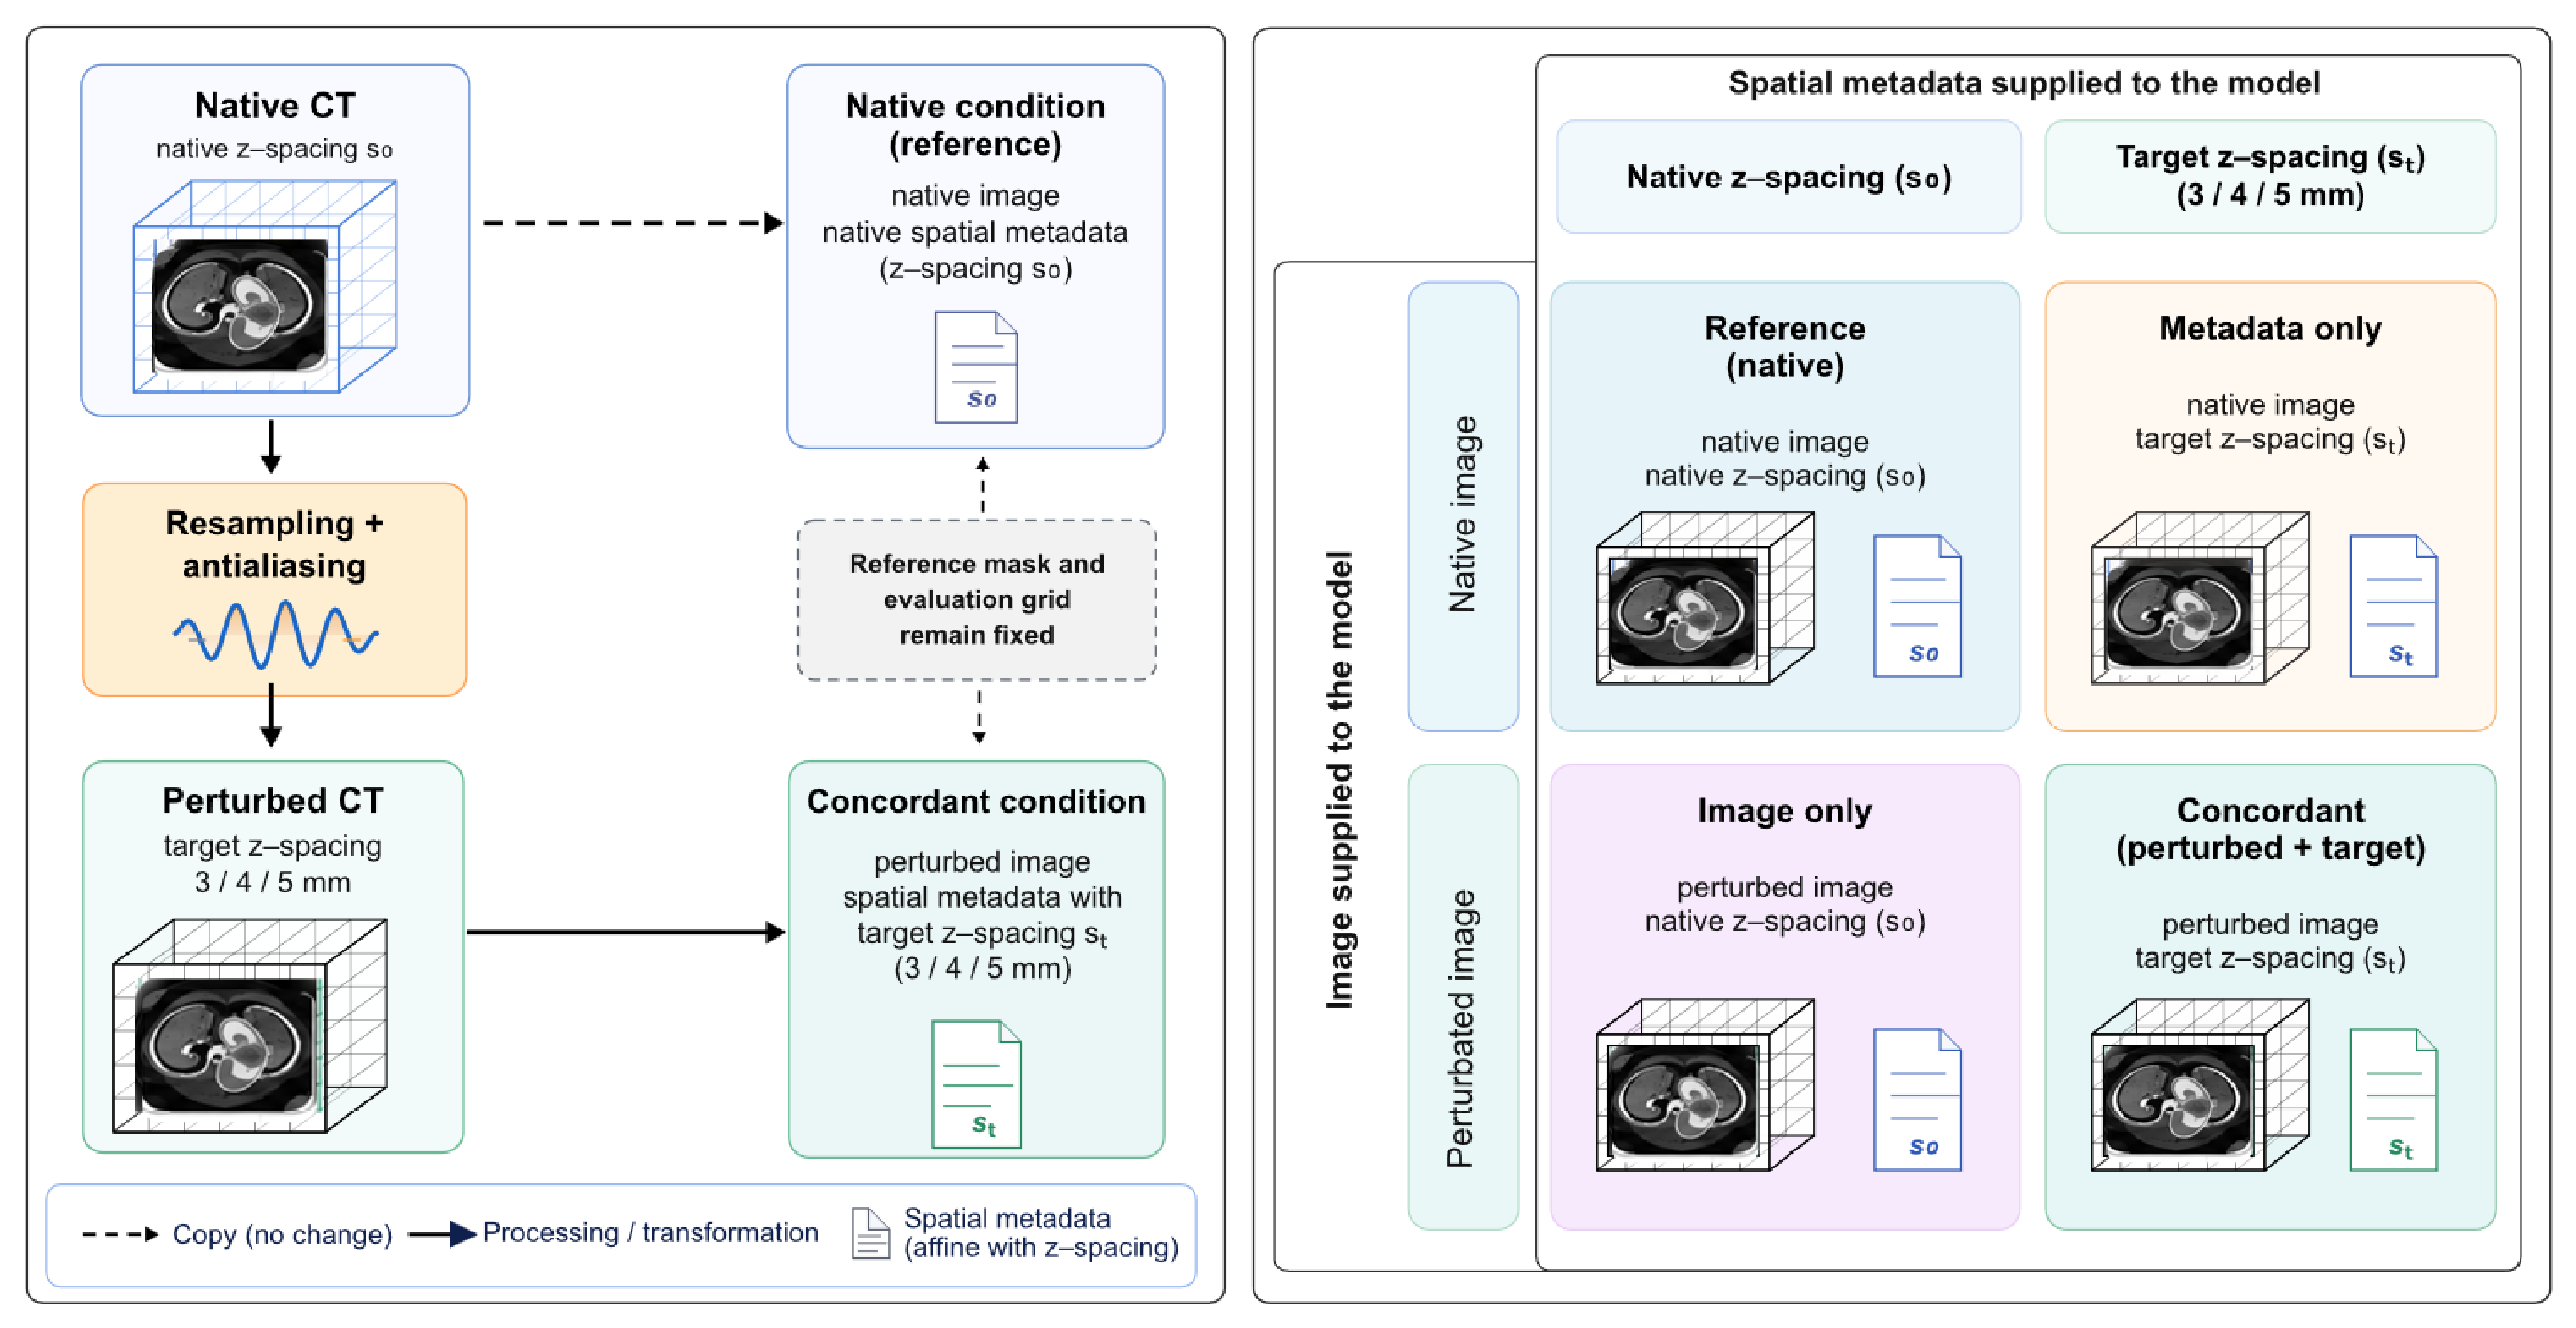
Figure 5.
Segmentations for the case with an individual effect closest to the median. The reference and predictions from the four configurations are shown (a) at the original spacing and (b) after resampling to 5 mm, using the corresponding spacing information. All panels show the same coronal plane and physical field of view. Solid contours represent the reference, whereas dashed contours represent the predictions; colors identify the kidney, tumor, and cyst. 3D DS corresponds to the mean Surface Dice of the entire volume.
Figure 5.
Segmentations for the case with an individual effect closest to the median. The reference and predictions from the four configurations are shown (a) at the original spacing and (b) after resampling to 5 mm, using the corresponding spacing information. All panels show the same coronal plane and physical field of view. Solid contours represent the reference, whereas dashed contours represent the predictions; colors identify the kidney, tumor, and cyst. 3D DS corresponds to the mean Surface Dice of the entire volume.
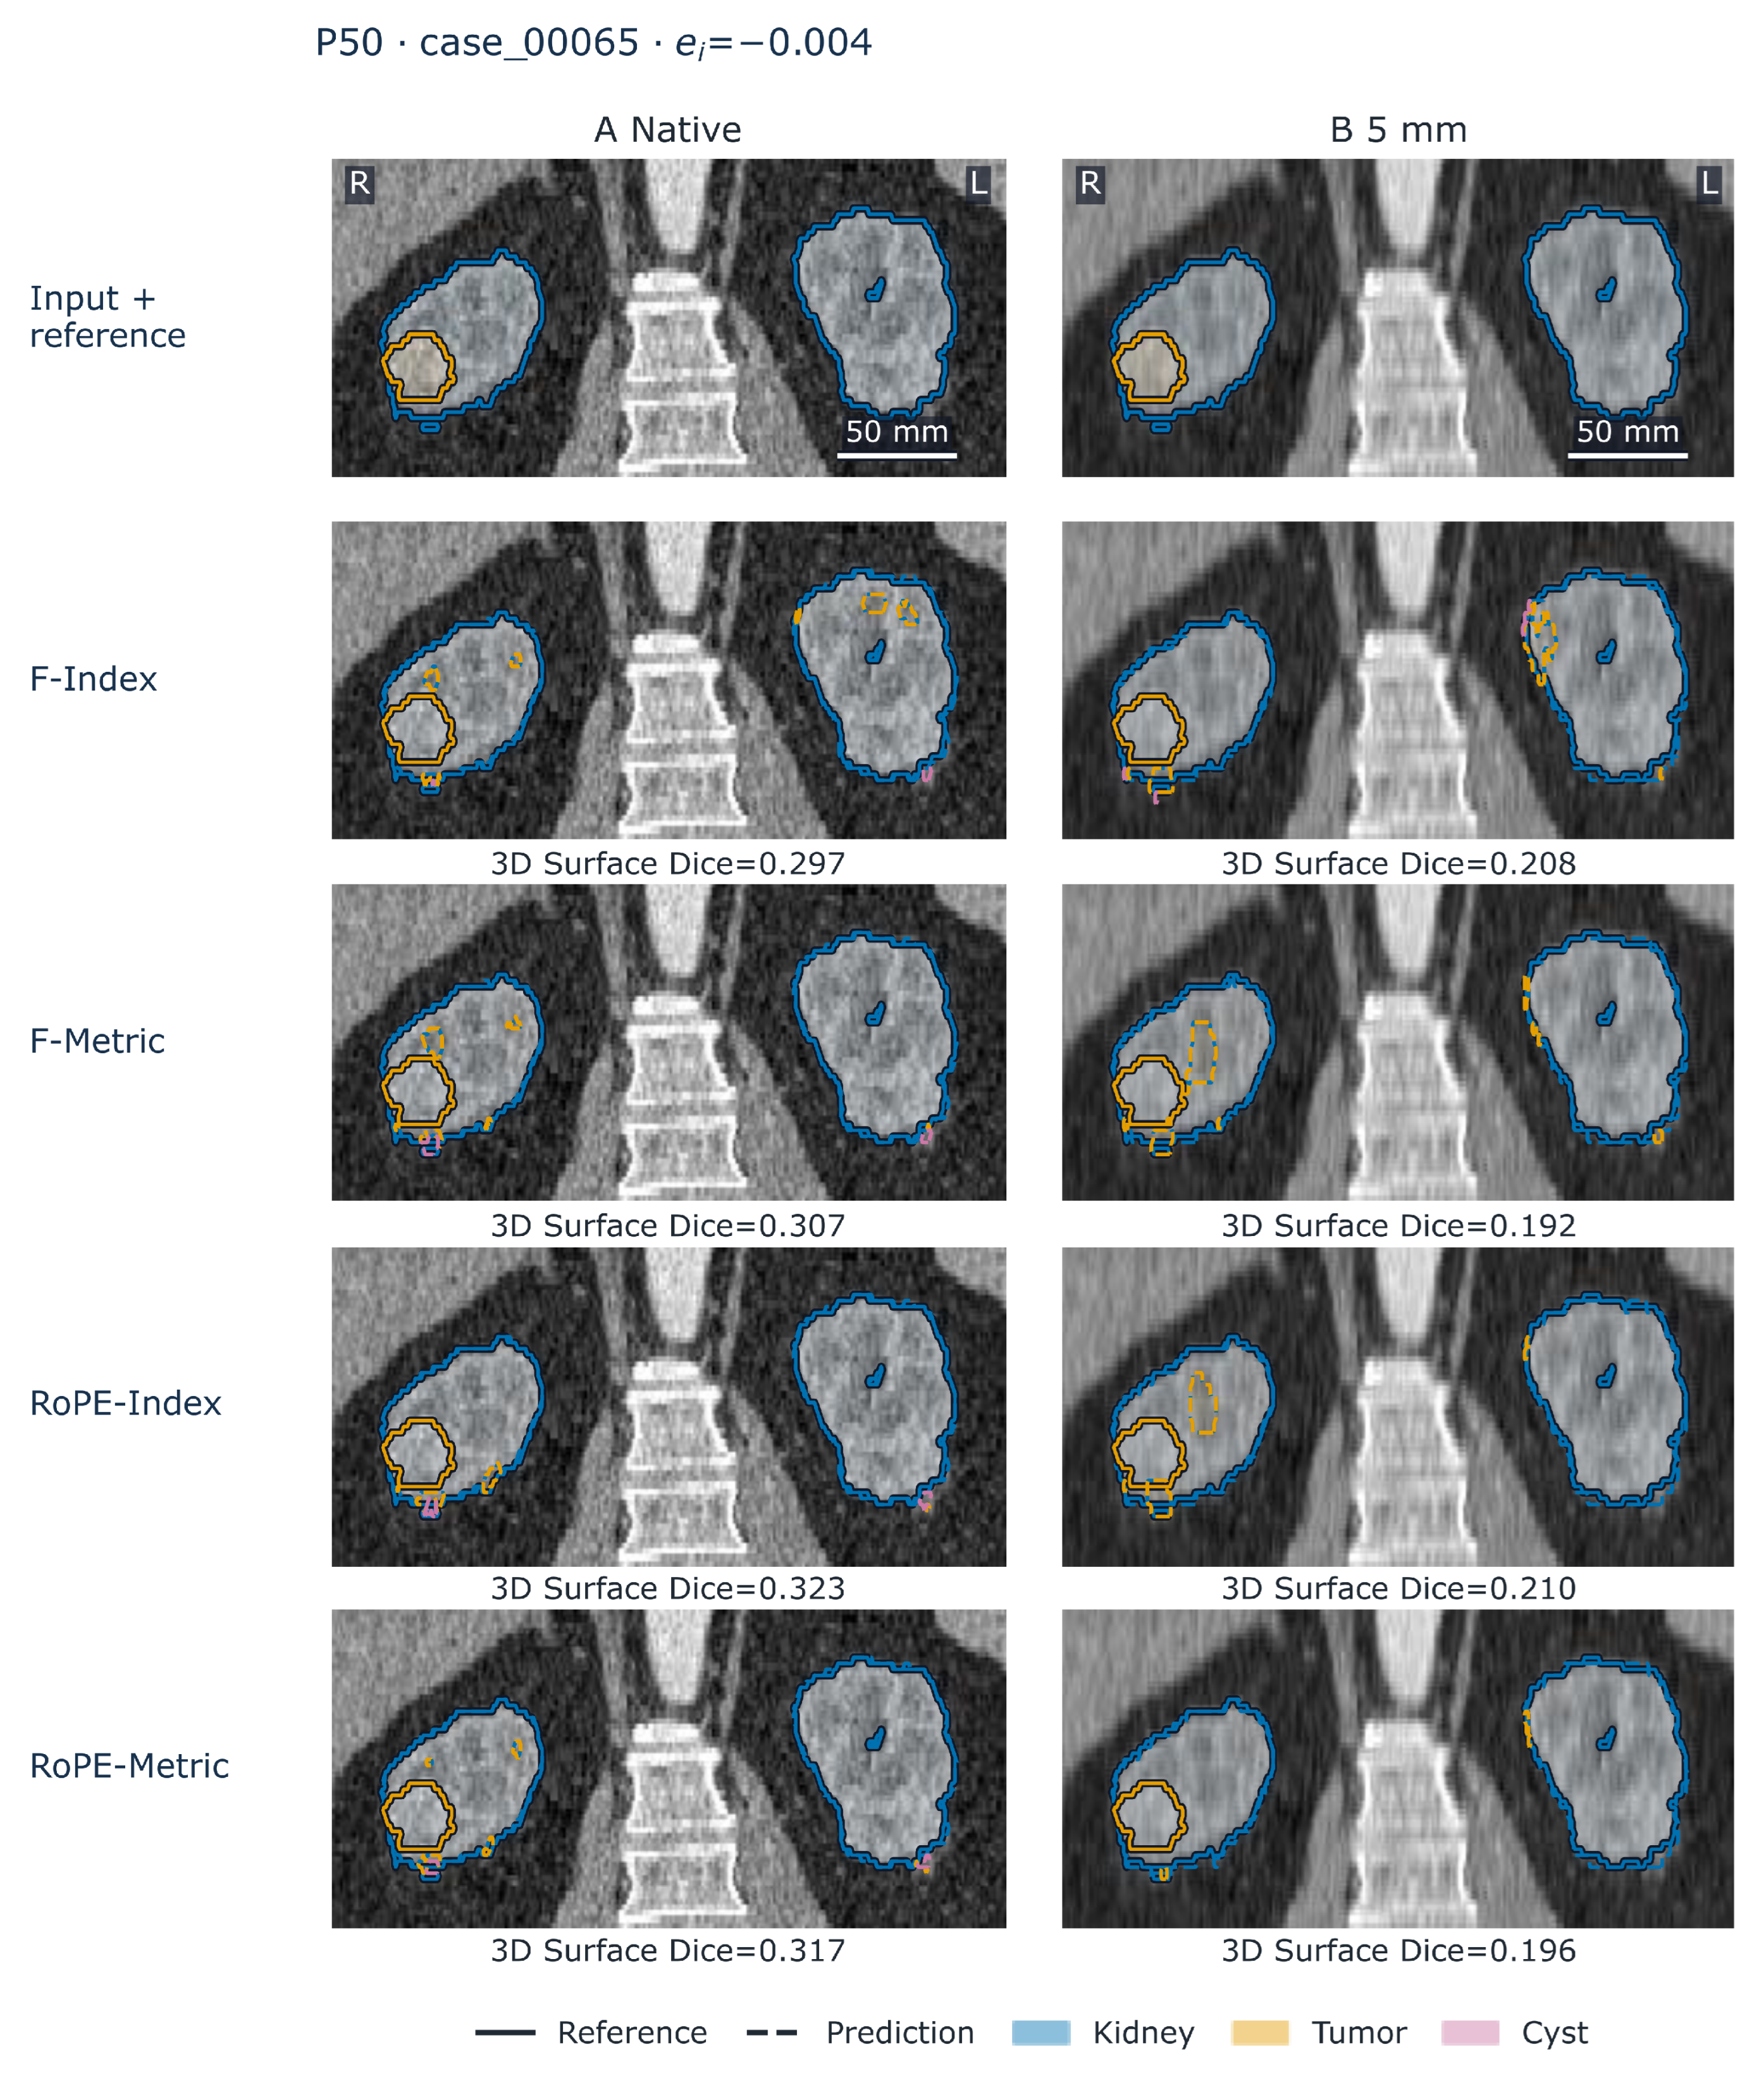
Figure 6.
Segmentations for cases near the 25th and 75th percentiles of the individual effect. For each case, the full coronal field, the reference segmentation, and the four predictions are shown in the native geometry and at 5 mm with consistent metadata. Solid contours represent the reference, whereas dashed contours represent the prediction; colors identify the kidney, tumor, and cyst. 3D DS denotes the mean three-dimensional Surface Dice of the volume.
Figure 6.
Segmentations for cases near the 25th and 75th percentiles of the individual effect. For each case, the full coronal field, the reference segmentation, and the four predictions are shown in the native geometry and at 5 mm with consistent metadata. Solid contours represent the reference, whereas dashed contours represent the prediction; colors identify the kidney, tumor, and cyst. 3D DS denotes the mean three-dimensional Surface Dice of the volume.
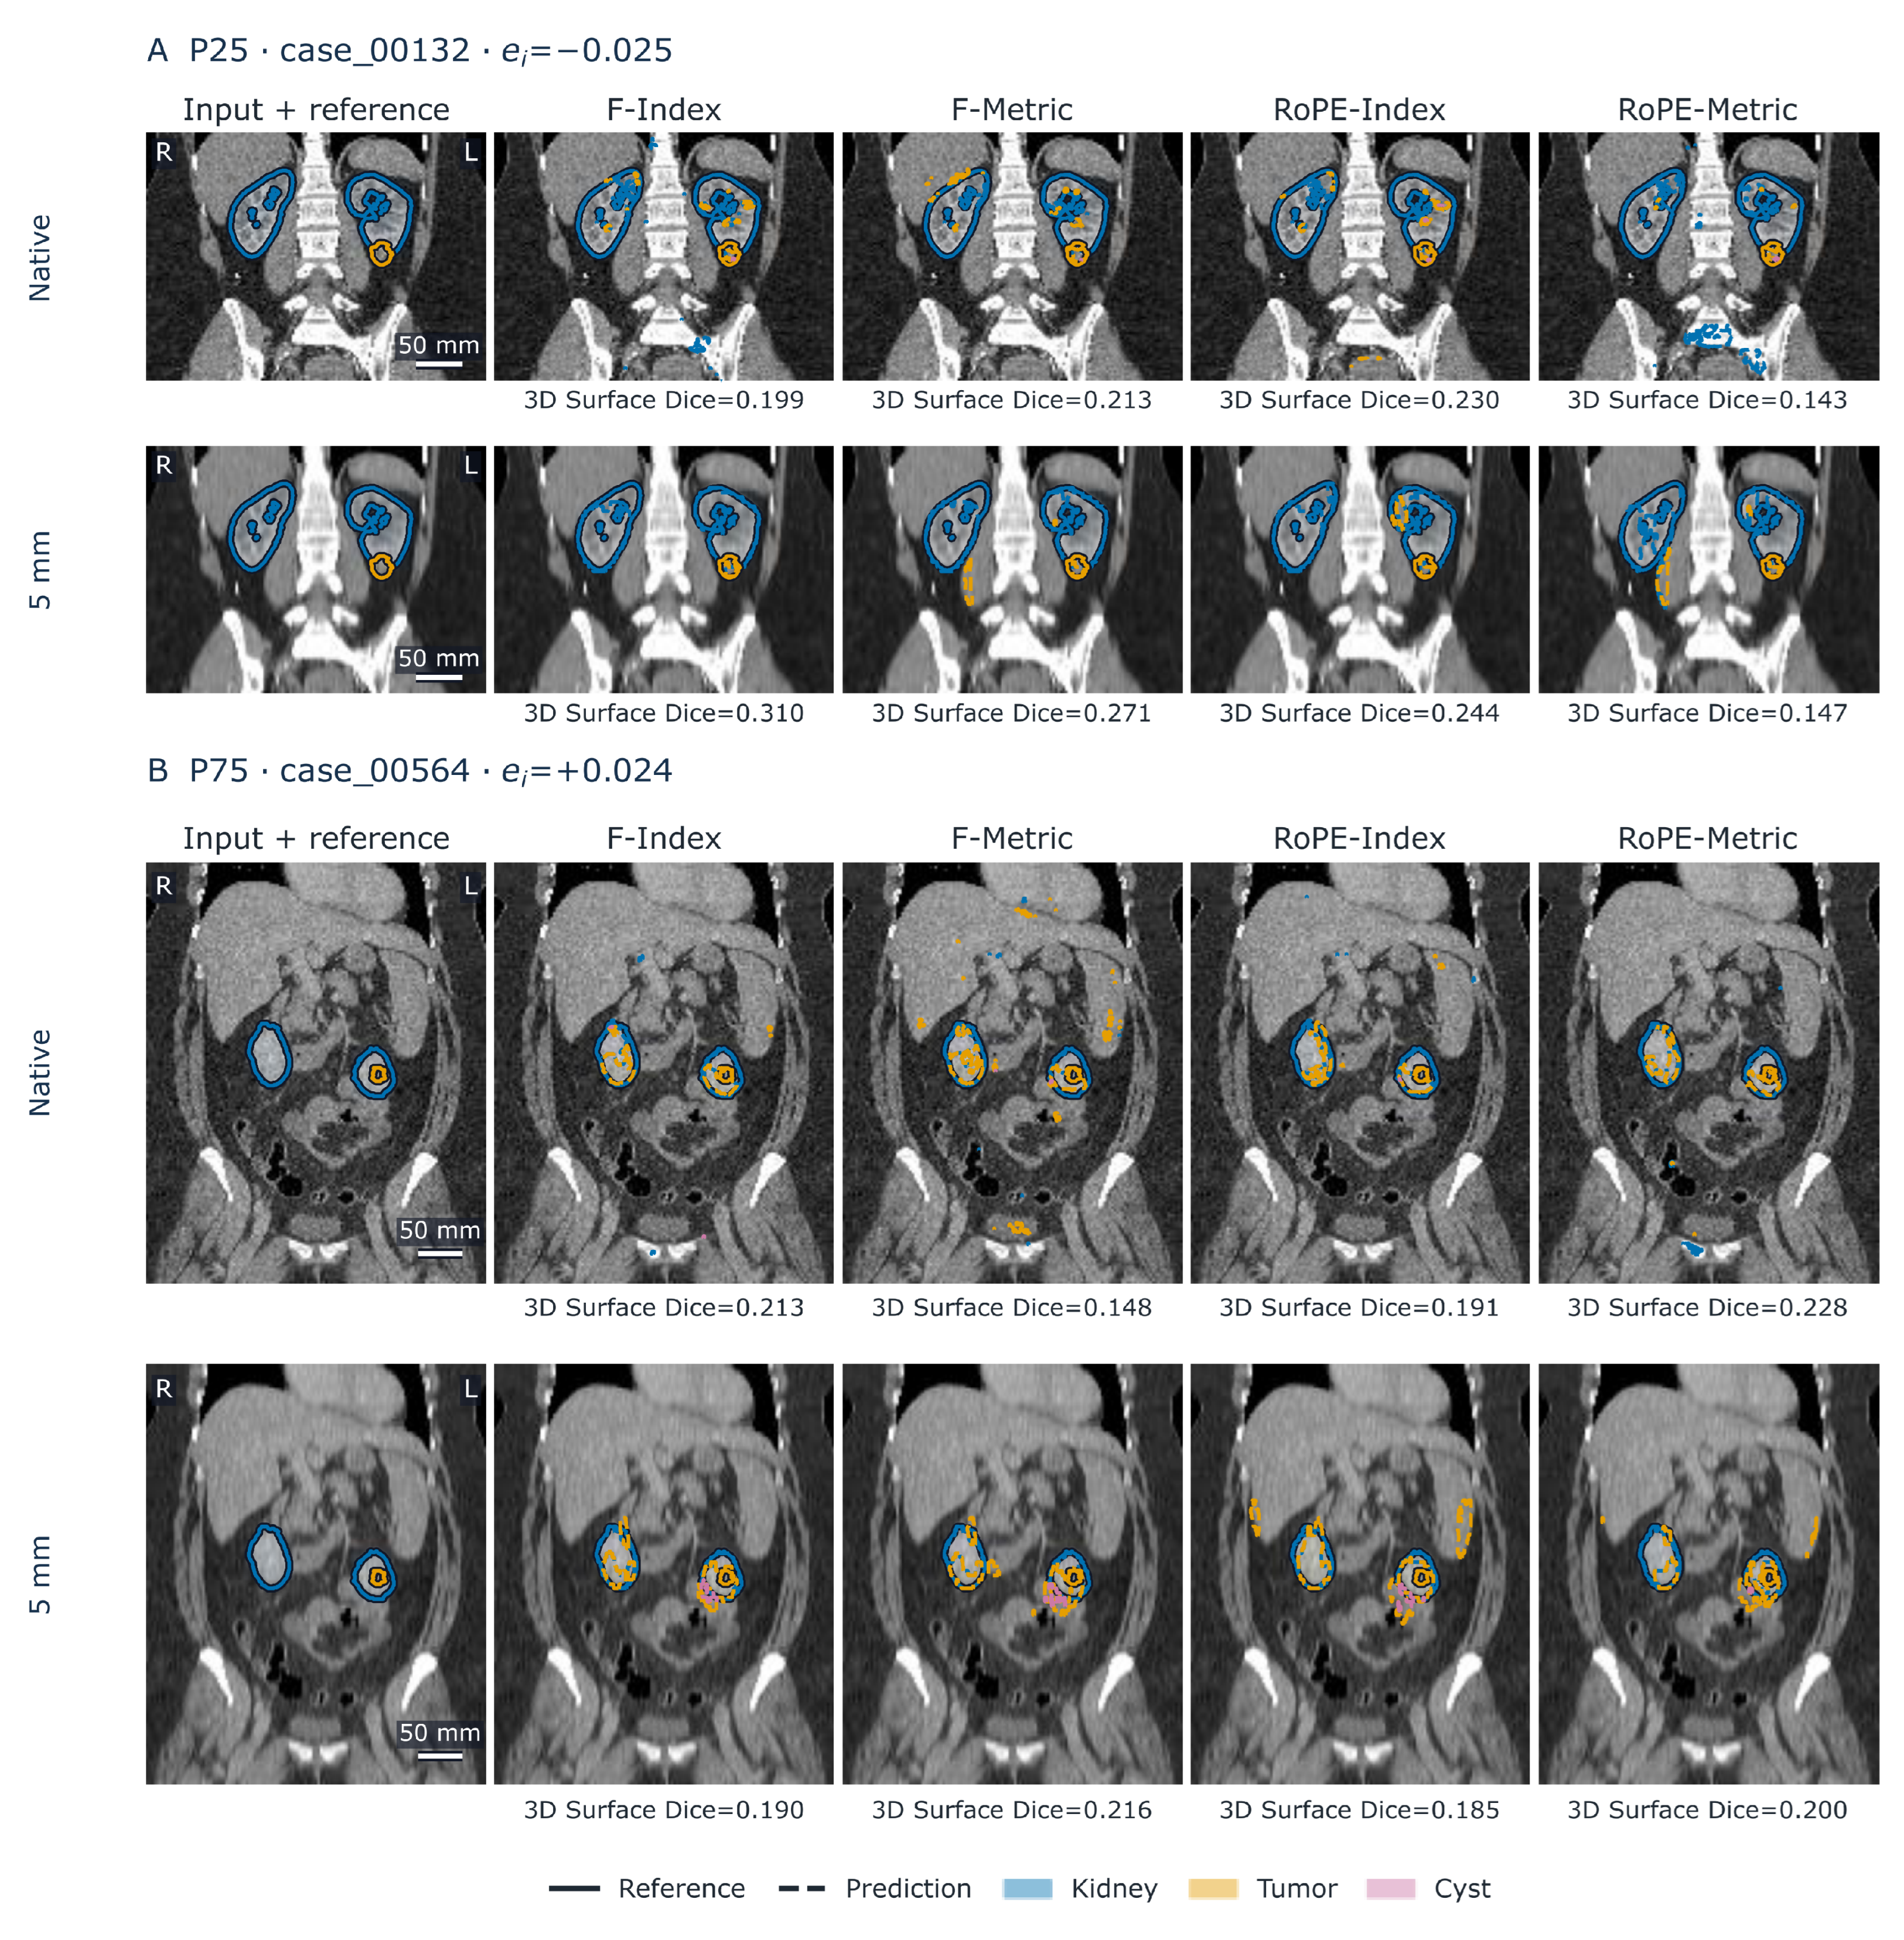
Figure 7.
Primary contrast and supplied-spacing controls in KiTS23 (n = 117). a) Differences in signed Surface Dice changes between coordinate systems; positive values favor metric coordinates. Dashed lines mark the interpretive reference values of ±0.01. b) Signed Surface Dice changes within the metric variants, comparing consistent with native spacing for resampled images, and altered with native spacing for unresampled images. Points show paired means, and error bars show 95% confidence intervals from patient-level bootstrap resampling stratified by fold.
Figure 7.
Primary contrast and supplied-spacing controls in KiTS23 (n = 117). a) Differences in signed Surface Dice changes between coordinate systems; positive values favor metric coordinates. Dashed lines mark the interpretive reference values of ±0.01. b) Signed Surface Dice changes within the metric variants, comparing consistent with native spacing for resampled images, and altered with native spacing for unresampled images. Points show paired means, and error bars show 95% confidence intervals from patient-level bootstrap resampling stratified by fold.
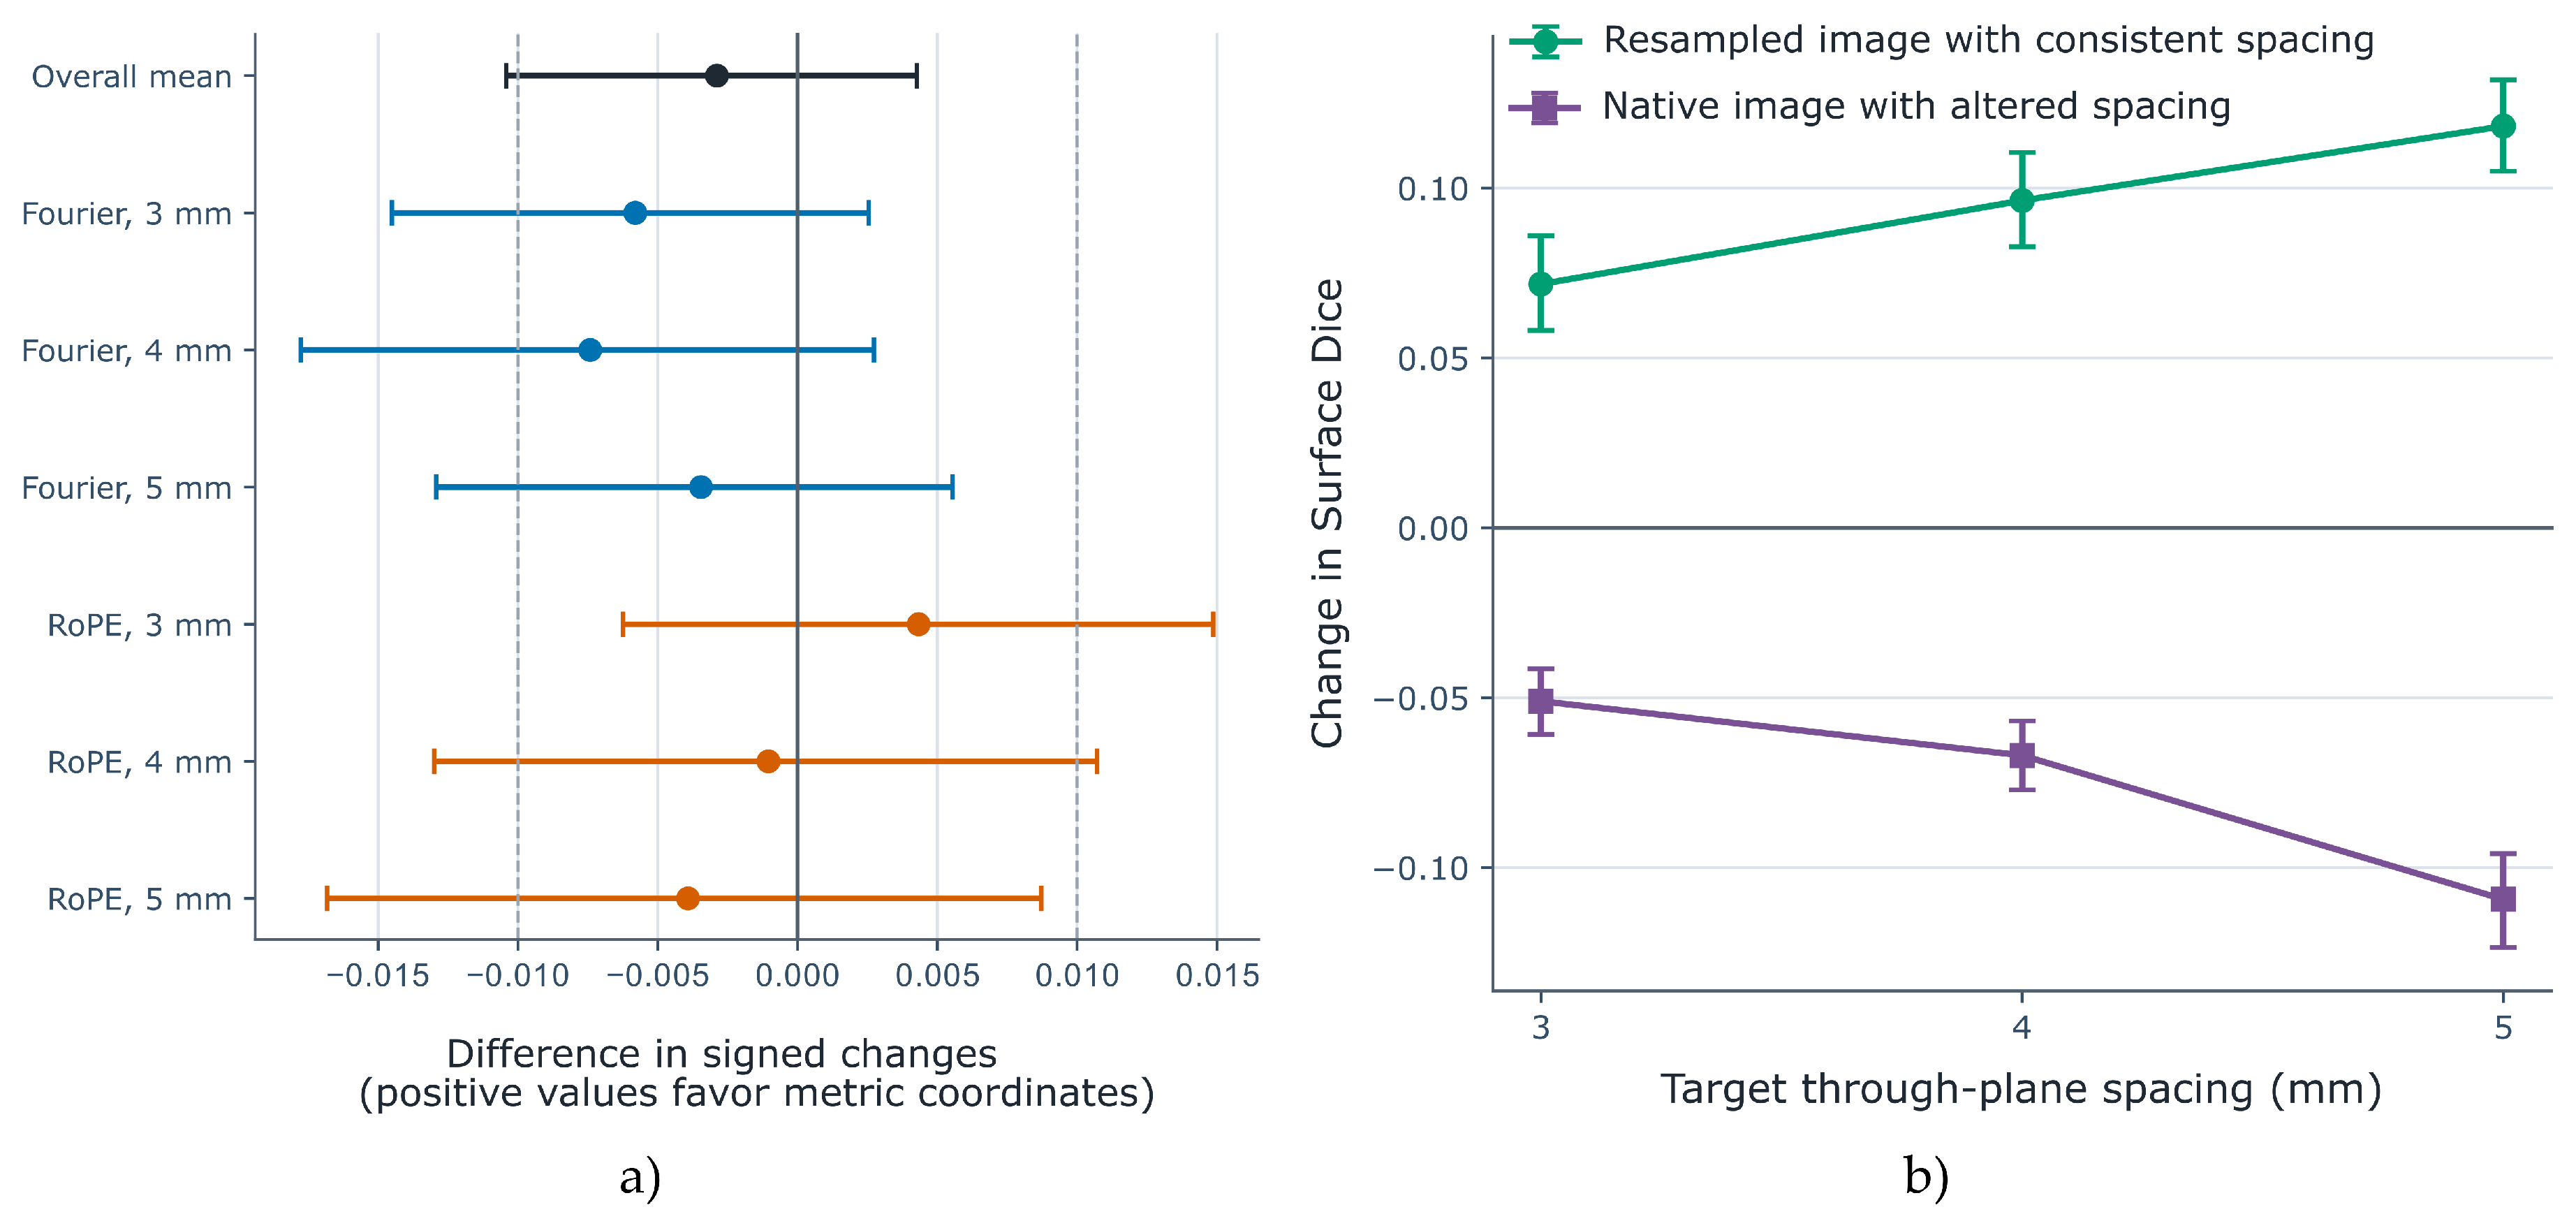
Figure 8.
Absolute Surface Dice and signed responses to resampling in the 38 eligible AMOS22 cases. a) Mean Surface Dice for each RoPE variant. b) Metric-minus-index Surface Dice difference at each spacing. c) Signed change, defined as native minus resampled Surface Dice; negative values indicate an improvement after resampling. d) Difference in signed changes between coordinate systems, with negative values indicating a more favorable change for index-based RoPE. Metric RoPE retains higher absolute scores even where the signed-change contrast favors index-based RoPE. Dashed lines in d mark the interpretive reference values of ±0.01. Error bars show 95% confidence intervals; B and D use paired patient-level bootstrap contrasts.
Figure 8.
Absolute Surface Dice and signed responses to resampling in the 38 eligible AMOS22 cases. a) Mean Surface Dice for each RoPE variant. b) Metric-minus-index Surface Dice difference at each spacing. c) Signed change, defined as native minus resampled Surface Dice; negative values indicate an improvement after resampling. d) Difference in signed changes between coordinate systems, with negative values indicating a more favorable change for index-based RoPE. Metric RoPE retains higher absolute scores even where the signed-change contrast favors index-based RoPE. Dashed lines in d mark the interpretive reference values of ±0.01. Error bars show 95% confidence intervals; B and D use paired patient-level bootstrap contrasts.
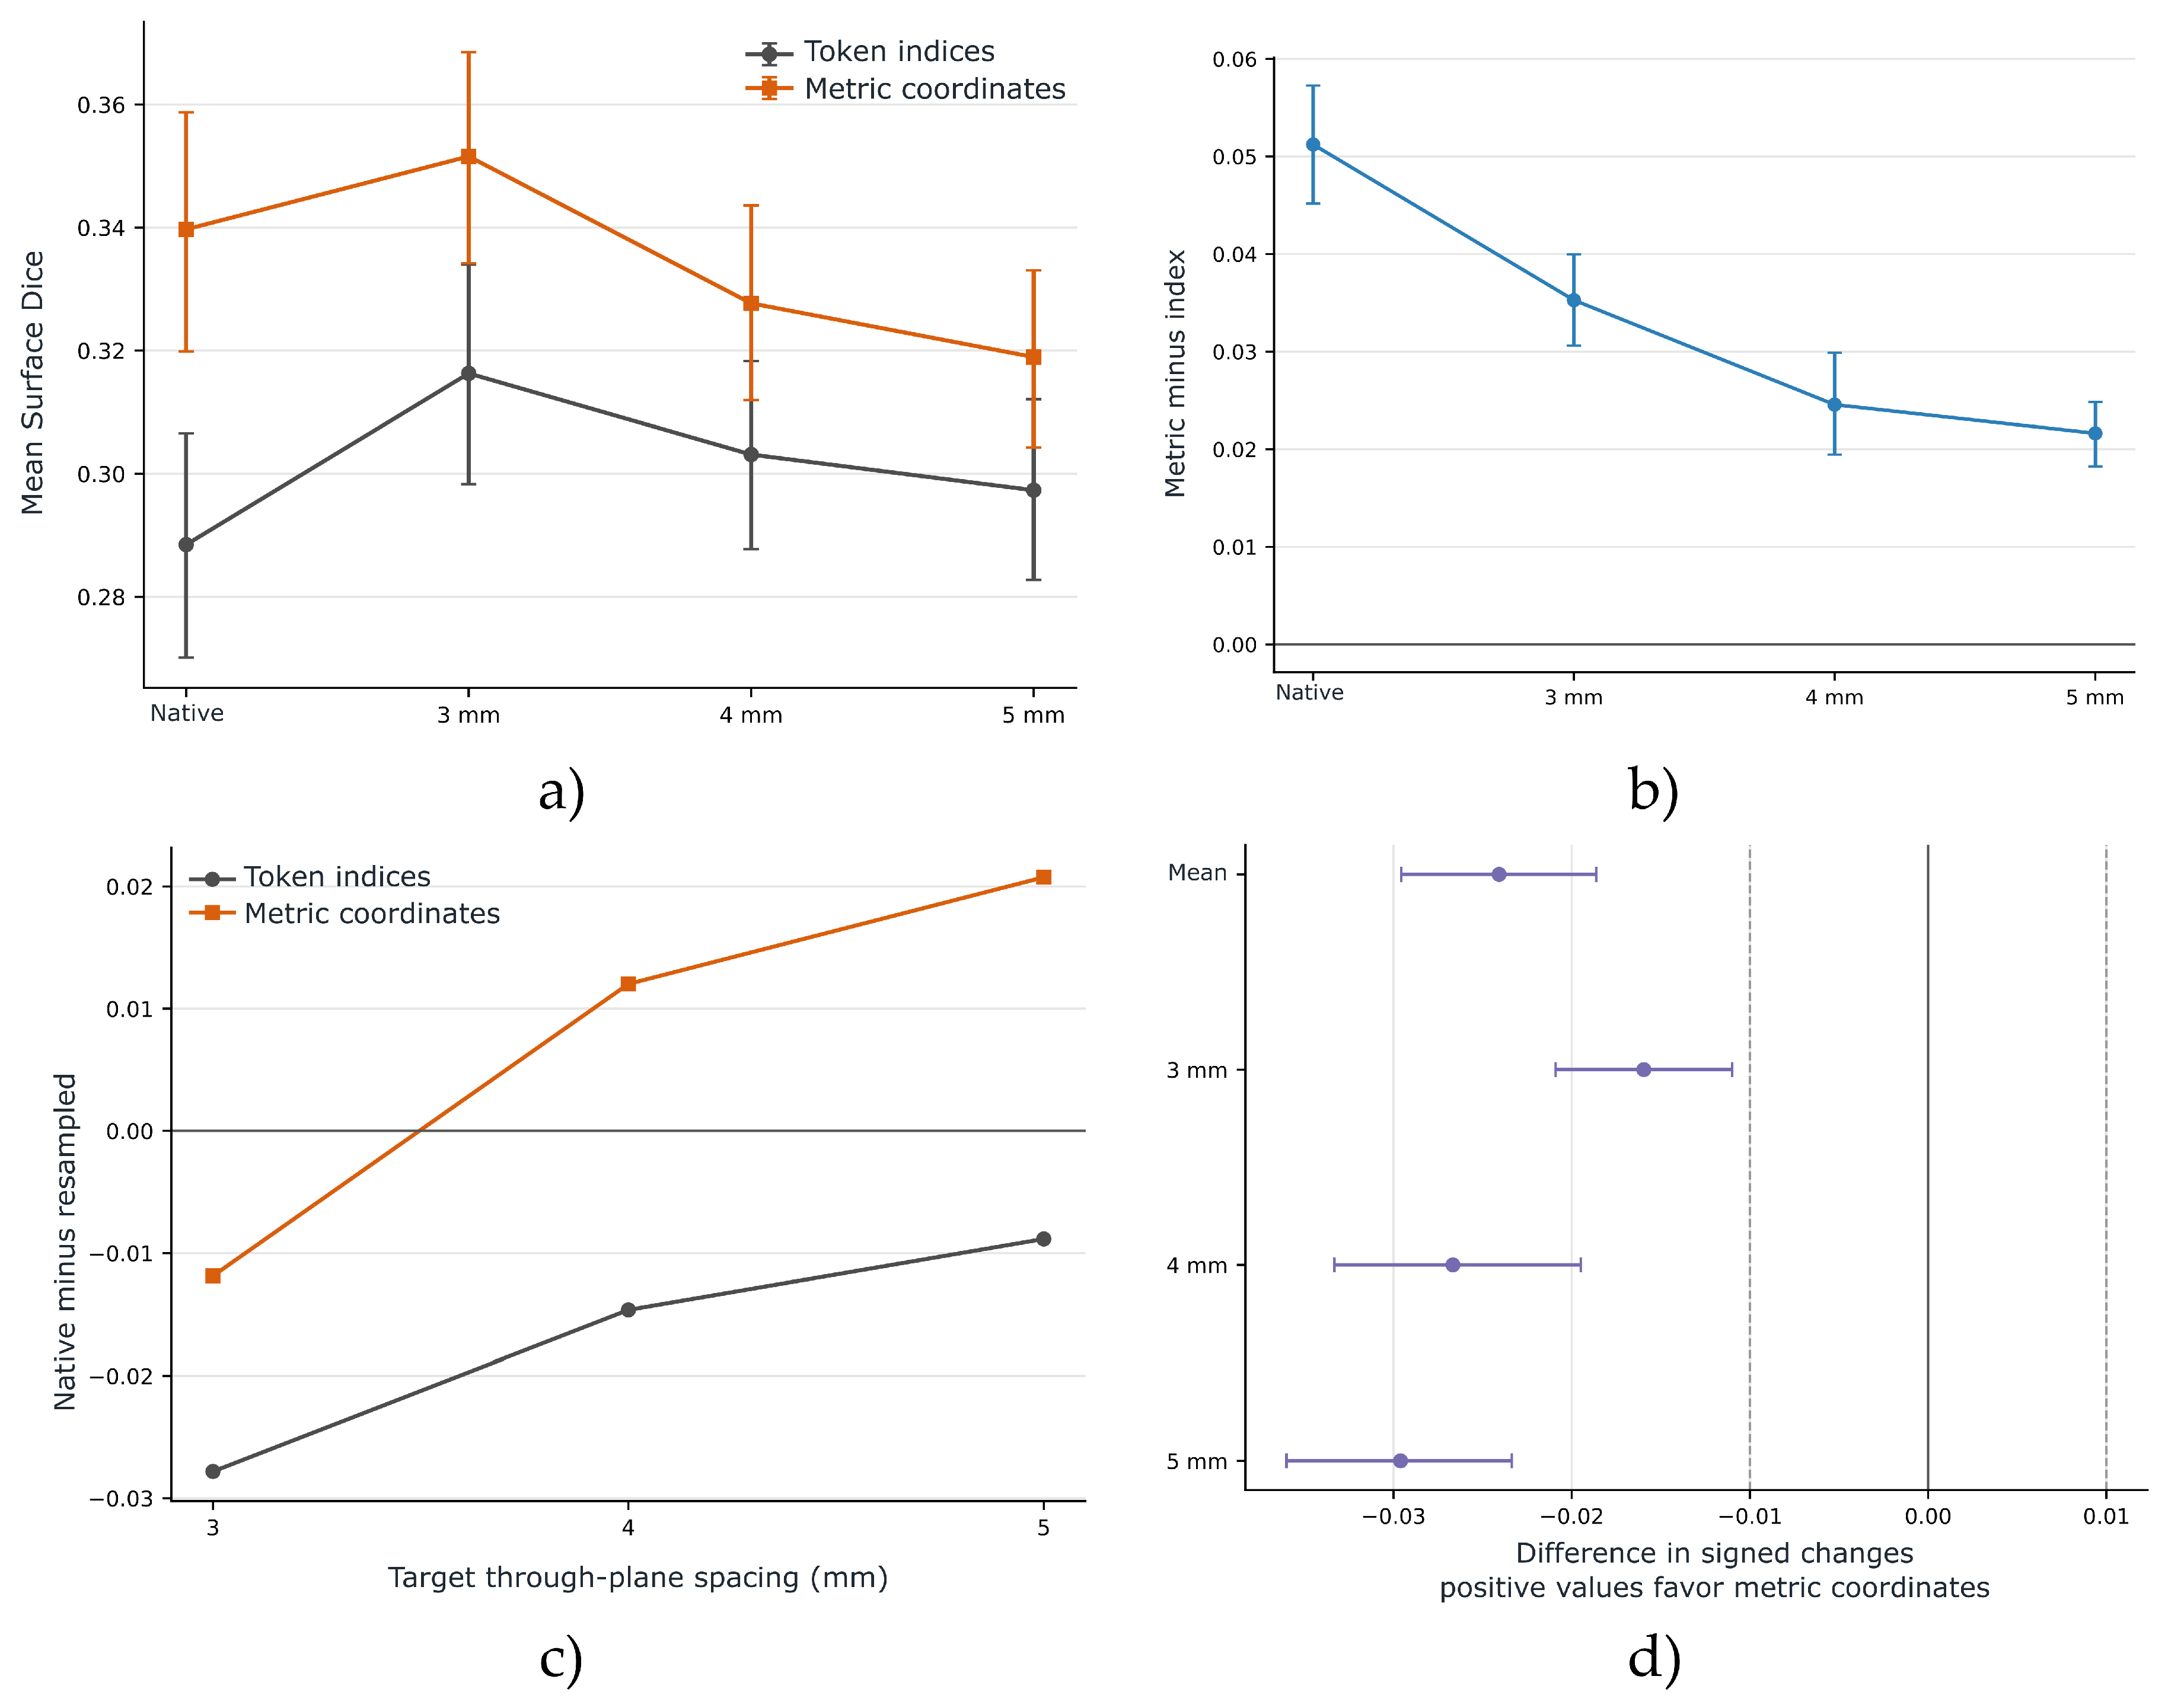

Table 1.
Dataset characteristics and native voxel geometry. Spacing and anisotropy values are reported as median (minimum–maximum).
Table 1.
Dataset characteristics and native voxel geometry. Spacing and anisotropy values are reported as median (minimum–maximum).
| Dataset | Modality | n | Structures | In-plane (mm) | Through-plane (mm) | Anisotropy ratio | Study role |
|---|---|---|---|---|---|---|---|
| KiTS23 | Contrast-enhanced abdominal CT | 489 | Kidney, tumor, and cyst | 0.781 (0.393–1.041) | 3.0 (0.5–5.0) | 4.30 (1.02–10.60) | Primary |
| AMOS22-CT | Multicenter abdominal CT | 300 | 15 abdominal organs | 0.685 (0.448–1.068) | 5.0 (1.25–5.0) | 6,39 (1.28–11.16) | Replication |
Table 2.
Training conditions and computational resources.
| Aspect | Configuration |
|---|---|
| Optimization | AdamW [27]; initial learning rate of weight decay of |
| Learning-rate schedule | 500 warm-up iterations followed by cosine decay |
| Loss function | Dice and cross-entropy with equal weighting |
| Batch size and precision | 2 regions per step; accumulation oversteps; effective batch size of 4; FP16 mixed precision |
| KiTS23 checkpoint evaluation | Every 5,000 iterations on the 20 development patients |
| KiTS23 internal evaluation | Minimum of 20,000 and maximum of 30,000 iterations |
| KiTS23 seeds | 2026, 2027 and 2028 for folds 1, 2, and 3, respectively |
| Development screening | 10,000 iterations per configuration |
| AMOS22 replication | 30,000 iterations; seed 2026 |
| Computational resources | Two NVIDIA RTX A6000 GPUs with 48 GB each, 250 GB RAM, and 52 CPU threads; one GPU per training run and two configurations trained in parallel |
Table 3.
Performance of the four configurations in KiTS23 at the original spacing (n = 391).
| Configuration | Surface Dice, mean (SD) | Dice, mean (SD) | HD95, mm, mean (SD) |
|---|---|---|---|
| F-Index | |||
| F-Metric | |||
| RoPE-Index | |||
| RoPE-Metric |
Table 4.
Secondary outcomes from the preservation analysis in KiTS23 (n = 117).
| Outcome | Overall | Fourier | RoPE | RoPE minus Fourier |
|---|---|---|---|---|
| Volumetric Dice | −0.0077 (−0.0184 to 0.0029) | −0.0111 (−0.0237 to 0.0017) | −0.0043 (−0.0204 to 0.0113) | 0.0068 (−0.0120 to 0.0255) |
| HD95, mm | −5.57 (−11.89 to 1.01) | 3.40 (−3.72 to 10.61) | −14.54 (−24.81 to −4.36) | −17.94 (−29.80 to −6.32) |
Estimates correspond to the difference between coordinate systems in the change from the original spacing. Positive values favor metric coordinates.
Table 5.
Class-specific results and sensitivity to tolerance, KiTS23 (n = 117).
| Analysis | Class or tolerance | Difference in change (95% IC) |
|---|---|---|
| Hierarchical class | Kidney and masses | 0.0047 (−0.0065 to 0.0161) |
| Hierarchical class | Masses | −0.0061 (−0.0135 to 0.0007) |
| Hierarchical class | Tumor | −0.0072 (−0.0147 to −0.0004) |
| Surface Dice tolerance | 0.5× | −0.0014 (−0.0065 to 0.0036) |
| Surface Dice tolerance | 1× | −0.0029 (−0.0104 to 0.0043) |
| Surface Dice tolerance | 1.5× | −0.0037 (−0.0120 to 0.0043) |
Positive values favor metric coordinates. Class-specific analyses were secondary, and the alternative tolerances were evaluated post hoc. The intervals were not adjusted for multiplicity.
Disclaimer/Publisher’s Note: The statements, opinions and data contained in all publications are solely those of the individual author(s) and contributor(s) and not of MDPI and/or the editor(s). MDPI and/or the editor(s) disclaim responsibility for any injury to people or property resulting from any ideas, methods, instructions or products referred to in the content. |
© 2026 by the authors. Licensee MDPI, Basel, Switzerland. This article is an open access article distributed under the terms and conditions of the Creative Commons Attribution (CC BY) license (http://creativecommons.org/licenses/by/4.0/).
Copyright: This open access article is published under a Creative Commons CC BY 4.0 license, which permit the free download, distribution, and reuse, provided that the author and preprint are cited in any reuse.