

Submitted:
10 September 2026
Posted:
14 September 2026
You are already at the latest version
Abstract
Machine learning-based network intrusion detection, the explanation of detector decisions, and alert triage have each developed as a largely separate line of research. As a result, a detector’s aggregate performance score still tells a security analyst little about how far to trust an individual alert: it does not reveal how reliable the detector is for each attack type, whether the explanation of a decision is faithful, or on what calibrated basis some alerts should be automated and others escalated. We propose a confusion-aware triage framework that addresses these three concerns within a single, unified approach. From a trained detector’s predictions, the framework estimates the reliability of each attack type, validates the explanations of its decisions, and routes each alert, by that reliability, into automatic handling, analyst assistance, or escalation, presenting each escalated alert as a compact decision card. We evaluate the framework on UNSW-NB15 and CIC-IDS2017 with six detector families over five seeds. Per-attack-type reliability is estimable, stable across training runs, and transfers to unseen traffic, whereas a detector’s confidence overstates its reliability on the rarest attacks; the explanations are faithful for seven of the eight routed attack types; and routing by reliability escalates 27.9% of alerts while catching 75.7% of the detector’s errors, and abstains where the detector is already reliable. Routing by reliability matches routing by confidence on error coverage while remaining calibrated, per-attack-type, and auditable. The framework is proposed as an analyst-facing decision aid, and its evaluation with security analysts is left to future work.
Keywords:
network intrusion detection
; explainable AI
; per-attack-type reliability
; alert triage
; explanation faithfulness
; selective classification
1. Introduction
Machine learning (ML) has become the dominant way to build network intrusion detection systems (IDS), and modern ML-based detectors report high overall detection performance [1,2]. Trained on labelled network traffic, such a detector classifies each flow as normal or as one of several attack types. In practice, these detectors feed a security operations centre (SOC), where the volume of alerts now outpaces what analysts can investigate, and alert fatigue is a recognized cause of missed detections and analyst burnout [8,9]. A high overall performance score does not, on its own, tell an overloaded analyst which alerts to trust and act on; for that, the analyst must understand each alert and judge how far to trust it, which is why explainable AI (XAI) has become central to modern IDS research [6].
Research on ML-based IDS has followed three broad directions. The first pursues higher detection performance: deep-learning models capture complex traffic patterns, ensemble methods combine several classifiers for robustness, and, because attack types are very uneven in number, a large body of work rebalances the under-represented attacks through resampling, synthetic oversampling, or cost-sensitive training [10,11,12,13,14]. These methods steadily raise the scores reported on standard benchmarks.
The second direction makes detectors interpretable, since an operator will not act on a decision they cannot understand. Post-hoc attribution methods such as SHAP (SHapley Additive exPlanations) and LIME (Local Interpretable Model-agnostic Explanations) assign each input feature a contribution to the model’s output and are now the standard tools for explaining IDS predictions [6,15,16,17]. The third direction studies how to divide work between the detector and the human: instead of acting on every prediction, a system can defer the uncertain ones to an analyst through a reject option or a learning-to-defer rule [21,22,23]. Each of these directions has advanced steadily, but largely on its own.
Despite this progress, three problems remain. First, detection performance is almost always reported as a single overall score that averages over all attack types at once. It therefore hides how the detector behaves on any individual type: the rare attacks that matter most are often the ones it detects least reliably, yet this weakness stays invisible in the aggregate. An analyst holding one alert has no way to read, from a headline number, how far to trust that particular label [3,4]. Second, the explanations produced for these detectors are seldom validated. A feature-attribution method tells the analyst which inputs influenced a decision, but not whether those inputs are genuinely responsible for it, and a feature can rank high merely because it correlates with the label; systematic reviews confirm that quantitative tests of explanation faithfulness remain rare [5,6,7]. Third, existing methods for routing alerts threshold a single confidence score. That score is poorly calibrated in exactly the attack types where the detector is weakest, so the alerts most in need of human review are the ones it misjudges, and these methods give the analyst no reliable account of what an uncertain alert most likely is [8,9]. In short, current systems report how well a detector does on average, but not how far to trust it for a given attack type, nor why, nor what to do with an uncertain alert.
This paper addresses these problems with a unified, reliability-centred approach to intrusion detection and triage. Our goal is to give an analyst, for each attack type, a trustworthy account of the detector’s behaviour, so that attention concentrates on the alerts where reliability is lowest while routine, reliable predictions are handled automatically.
The main contributions of this paper are summarized as follows:
- 1.
- Reliability for each attack type. We show empirically that a detector’s reliability can be estimated for each attack type, that this estimate stays stable across training runs and transfers from validation to unseen test data, and that each attack type has a consistent “twin”, the attack it is most often confused with.
- 2.
- Validated explanations. Building on SHAP-based attribution [15], we explain why the detector chose one attack type over its most likely alternative, and we test empirically that these explanations are faithful, that is, that the features they highlight are the ones the detector truly relies on.
- 3.
- Reliability-driven triage. We propose a triage framework that extends selective classification and learning to defer [21,22] and the three-mode human-AI teaming of Baruwal Chhetri et al. [9]: it routes each alert, by its attack-type reliability, into automatic handling, analyst assistance, or escalation. We measure the escalation rate and the share of the detector’s errors it catches, estimate its cost with a standard cost model under illustrative parameters, and, for each escalated alert, produce a compact card designed to support the analyst’s decision. The framework is a proposed decision aid; validating its usefulness with analysts is left to future work.
The remainder of this paper is organized as follows. Section 2 reviews related work on ML-based IDS, explainability, and alert triage. Section 3 states the problem, the objectives, and the proposed framework. Section 4 presents the method, and Section 5 describes the datasets, models, and experimental setup. Section 6 presents the results. Section 7 discusses their implications and limitations, and Section 8 concludes.
2. Related Work
This section reviews three strands of prior work that our approach brings together: machine learning for intrusion detection, explainability for those detectors, and the selective-classification and alert-triage methods that decide when to involve a human. For each, we outline what it achieves and the gap that the corresponding contribution of this work fills.
2.1. Machine Learning for Intrusion Detection
Machine learning now underpins most intrusion detection, and its scope is surveyed in recent reviews [1,2]. Detectors range from classical classifiers to deep neural networks and ensemble models, and on standard benchmarks they report high overall detection performance.
A central obstacle to this performance is class imbalance: a few attack types dominate the traffic, while the rarest and often most dangerous attacks appear in very small numbers. Under these conditions, standard classifiers detect the rare attack types far less reliably than the aggregate score suggests [3]. To counter this, researchers have proposed evolutionary preprocessing [10], generative adversarial network (GAN)-based oversampling of rare attack types [11], dynamic ensembles that adapt to the class distribution during training [12], and, more recently, models that combine deep learning with data augmentation [13] or hybrid feature selection [14].
These methods raise detection scores, but they are all judged by aggregate metrics on a held-out test set, and reported figures shift with preprocessing choices, so results are hard to compare across studies [4]. More importantly, none returns a reliability estimate for each attack type that still holds once the detector is deployed on live traffic. When a detector labels an alert as a given attack, neither an overall performance score nor any of these methods tells the analyst how far to trust that specific label, or what the alert is more likely to be. This gap motivates our first contribution.
2.2. Explainability for Intrusion Detection
Because ML-based detectors are often black boxes, a large body of work explains their outputs after the fact. SHAP [15], grounded in cooperative game theory, assigns each input feature a contribution to the model’s decision and is the most common attribution method in this field. An early application integrated SHAP into a full detection pipeline that combines local and global explanations to relate feature values to different attack types in a form security experts can read [16]. A survey of explainable IDS methods identified SHAP and LIME as the leading techniques and noted the scarcity of explanation-evaluation metrics as a recurring weakness [6], and other work paired an ensemble classifier with LIME to produce human-readable explanations [17]. Explainable deep-learning detectors have since been reported for Internet of Things (IoT) traffic [18] and for ensemble architectures that keep detection performance while adding per-alert explanations [19], while reviews caution that attributions can be manipulated by adversaries [20] and that quantitative faithfulness is rarely measured [5].
A common limitation runs through this work: attribution describes what a model outputs but rarely tests whether the highlighted features are truly responsible for the decision. A feature ranked first by SHAP may only correlate with the label, so removing it can leave performance unchanged or even improve it. Where faithfulness is measured, it varies sharply across attribution methods [7], which shows that fidelity must be tested for a given model rather than assumed. Our second contribution takes up this gap with a feature-deletion faithfulness test that separates the features that genuinely drive a decision from those that only appear important.
2.3. Selective Classification and Alert Triage
Deciding which predictions to act on automatically and which to send to a human is studied in the selective-classification and learning-to-defer literatures. Geifman and El-Yaniv developed the reject option for neural classifiers, which controls a coverage-risk trade-off by thresholding softmax confidence with formal risk guarantees over the accepted predictions, evaluated on general image-classification benchmarks [21]. Mozannar and Sontag extended this to a learning-to-defer setting in which a single loss trains the classifier together with a rule that decides when to defer and accounts for the human reviewer’s error rate [22]. In security, a reject-option classifier deferred uncertain intrusion detection and prevention system (IDPS) signatures to human experts [23], and a reject-option detector flagged low-reliability predictions on supervisory control and data acquisition (SCADA) network traffic [24].
On the operational side, alert fatigue is a main cause of analyst burnout and missed detections. A systematic survey of alert prioritization catalogued the criteria used to rank alerts and the methods that apply them [8]. Ban et al. filtered security information and event management (SIEM) alerts with a cost-sensitive classifier that reduces the volume reaching an analyst while keeping the critical ones [25]; AlertPro re-ranked alerts with reinforcement learning on datasets of multi-step attacks [26]; and a human-AI teaming framework set out, in three modes, how to divide responsibility between automated classifiers and analysts [9].
Two concurrent 2026 studies come closest to our setting: Gombar [44] folds model confidence, SHAP-based explanation strength, and attack severity into a suspicious-flow priority score, and Le et al. [45] map calibrated detector outputs to a graded action ladder with conformal action sets, reporting, as we do below, that this gate does not outperform a strong simple selective baseline. Both explain and prioritize alerts, but neither grounds the decision in a calibrated per-attack-type reliability estimate or tests the faithfulness of its explanations.
These lines of work remain separate. Selective classifiers and reject-option detectors defer on a single confidence score, which is poorly calibrated for exactly the rare attack types where the detector is weakest, and the security applications above were evaluated on signatures, SCADA traffic, or alert streams rather than on standard multiclass network-intrusion benchmarks. SOC triage tools, in turn, rank alerts by severity or confidence but do not give the analyst a calibrated estimate of the likely true attack type. No existing method combines a reliability model for each attack type with a cost analysis of the triage policy it produces. Our third contribution provides this missing combination.
3. Problem Statement and Proposed Approach
The previous section shows steady progress on intrusion detection, explanation, and alert triage in the IDS literature. Yet a detector is still judged mainly by its aggregate performance score on standard network-intrusion datasets [1,2], which does not, on its own, establish how reliable the detector is for any individual attack type, why it confuses one attack with another, or on what basis some of its alerts should be handled automatically while others are reviewed by an analyst.
Each of these corresponds to a gap in the literature reviewed in Section 2. First, detection performance is reported as an aggregate that averages over all attack types, so whether a detector’s reliability can be characterized for each attack type, and whether that characterization is stable across training runs and transfers to unseen traffic, is not established; the rarest attacks, which matter most, are often the least reliably detected [3,4]. Second, the explanations attached to a detector are seldom validated, so whether the features an explanation highlights are the ones the detector truly relies on, its faithfulness, remains untested [5,6,7]. Third, methods that decide which alerts to handle automatically and which to escalate threshold a single confidence score, which is poorly calibrated in exactly the attack types where the detector is weakest, so whether per-attack-type reliability offers a sounder basis for that decision than confidence is an open question [8,9,21,22].
At present, no work establishes, for network intrusion detection, whether reliability can be characterized per attack type and shown to transfer, whether the accompanying explanations are faithful, and whether reliability provides a better basis than confidence for deciding what to automate or escalate. This gap leaves a security analyst without an objective, per-attack-type account of how far a detector can be trusted or of what an uncertain alert most likely is.
To answer these three questions, we pursue three empirical objectives, which map directly to this paper’s results and contributions:
- 1.
- estimate, for each attack type, how far a detector’s prediction can be trusted, show that this estimate is stable across training runs and transfers from validation to unseen test data, and identify the attack each type is most often confused with (its twin);
- 2.
- explain why the detector chose one attack type over its most likely alternative, and test empirically that the explanation is faithful, that is, that the features it highlights are the ones the detector truly relies on;
- 3.
- route each alert by its attack-type reliability, rather than by a confidence score, into automatic handling, analyst assistance, or escalation; measure the escalation rate, the share of the detector’s errors it catches, and how this reliability-based routing compares with confidence-based routing; estimate the resulting cost with a standard cost model under illustrative parameters; and produce, for each escalated alert, a compact card designed to support the analyst’s decision.
Establishing these three points makes it possible to triage alerts by reliability rather than by confidence, and to give an analyst a per-attack-type account of a detector’s behaviour. We therefore propose a confusion-aware triage framework as a way to put these findings to use. The framework wraps any trained multiclass detector and turns its predictions into a per-attack-type reliability profile, an evidence profile of per-attack-type and per-alert explanations, and a triage policy. Its reliability profile and triage policy read only the detector’s predicted labels on a held-out validation fold, not its internal probabilities, so they apply to any classifier; the evidence profile requires feature-level access to the detector and is instantiated here with tree-based SHAP. The framework has three parts (Figure 1):
- a reliability profile, recording for each predicted class how often it is correct and what the alert most likely is when it is not (Section 4.2);
- an evidence profile, explaining why the detector chose one class over its nearest competitor and which feature groups genuinely support each class (Section 4.3);
- a triage policy, which uses the reliability profile to send each alert to automatic handling, analyst assistance, or escalation, and presents the evidence profile with the alerts it escalates (Section 4.4).
The framework is a proposed decision aid. Its components, the reliability profile, the evidence profile, and the triage policy, are evaluated empirically in this paper, but the framework’s usefulness to a working analyst has not been validated with human experts, which we leave to future work. Extending the evidence profile to non-tree detectors, using model-agnostic or deep-model SHAP variants, is likewise left to future work.
The next section describes the method used to establish each of these components.
4. Method
The method builds the proposed framework (Section 3) from a trained machine learning-based detector, in four parts: intrusion detection (Section 4.1), the reliability profile (Section 4.2), the evidence profile (Section 4.3), and the triage policy (Section 4.4).
4.1. Intrusion Detection
We treat intrusion detection as a multiclass classification problem. Each network flow is labelled as normal or as one of several attack types, and a trained detector assigns every flow a single predicted label. The framework does not depend on how this detector is built. We evaluate six detector families that span the common design choices: a rule-based baseline, a random forest [39], a support vector machine (SVM) [36], gradient-boosted trees (XGBoost) [37], a one-dimensional convolutional neural network (1D-CNN), and a long short-term memory (LSTM) network [38], with their training and hyperparameters given in Section 5. Each detector is trained and evaluated on a single stratified train, validation, and test split repeated over five random seeds, rather than by k-fold cross-validation: the validation fold is used for all tuning, early stopping, and model selection, and the test fold is scored once, after the configuration is frozen. All that the rest of this section requires is the detector’s predicted labels on a held-out validation fold, together with the ground-truth labels of that fold. Writing pred for the predicted class and true for the ground-truth class over the set of C classes (the attack types together with normal traffic), the detector’s behaviour on the validation fold is summarized by its confusion matrix, which the following subsections turn into a reliability profile (Section 4.2), an evidence profile (Section 4.3), and a triage policy (Section 4.4). All of these quantities are estimated on the validation fold, frozen, and then applied unchanged to the test fold, so no test label is used to build them.
4.2. Reliability for Each Attack Type
From the detector introduced in Section 4.1, the reliability of a predicted attack type c is the precision of the detector’s prediction,
the diagonal of the detector’s confusion matrix once each row (indexed by the predicted attack type) is normalized to sum to one. The full row, the empirical posterior , gives the distribution over what an alert labelled c actually is. It is counted from the validation fold, averaged over the five seeds, and each row sums to one over the C classes.
For each predicted class c we define its twint as the most likely true class other than c,
read from the empirical posterior. The twin names the attack a prediction is most often confused with.
Because the reliability profile is estimated on validation and applied to test, we verify that it transfers. For each predicted class c we measure the total variation distance (TVD) between its validation and test posteriors,
where 0 means the two folds agree exactly. A small TVD for every class indicates that a reliability profile built on validation still holds on unseen test traffic.
4.3. Validated Explanations
The reliability profile shows how often each prediction is correct; the evidence profile explains why. The tests in this subsection build it: they explain each decision, verify that the highlighted features are the ones the detector truly relies on, and flag feature groups that mislead.
Contrastive attribution.
For every attack type the routing policy (Section 4.4) does not fully automate, we explain why the detector chose the predicted class c over its twin t. Reliability and routing read only predicted labels and so apply to any detector; the contrastive explanation, by contrast, uses the tree-based detector, for which SHAP [15] attributes each class’s raw margin to the input features. The margin separating c and t is , so the contribution of feature j to that decision is the contrastive attribution
positive when feature j supports c, and negative when it supports the twin. Summed over features, these contributions additively decompose the margin the detector used, up to the classes’ base values, so the explanation is a decomposition of the decision rather than an approximation. We aggregate the per-feature contributions into semantic feature groups (Section 5.4) for readability.
Faithfulness test.
An attribution is useful only if the features it highlights are the ones the detector actually relies on. We test this with a non-circular feature-deletion protocol [41,42]: we rank features by their contrastive attribution on the validation fold, then, on the held-out test fold, permute the top ranked features and measure how far the c-versus-t margin collapses, comparing against permuting k random features as a control. Unlike remove-and-retrain benchmarks [43], we do not retrain after deletion, since our aim is the reliance of the fixed detector, not whether the information is available elsewhere. Ranking on one fold and testing on another avoids a test that would merely re-measure its own ranking. An explanation passes for a class when the top-k deletion collapses the margin by at least twice the random baseline, and we report the number of the five seeds in which it passes.
Importance versus usefulness.
Attribution explains a detector’s output; it does not reveal whether a feature helps its performance. To separate the two, we also compute the signed permutation importance [39,40] of each feature group g for each class c,
measured on the test fold and averaged over seeds. A positive value means the class relies on the group; a negative value means the group is detrimental, its removal improves the class’s . Comparing the sign of with the (unsigned) global SHAP magnitude of the same group reveals cases where a feature the detector treats as important actually degrades its accuracy for a class.
4.4. Reliability-Driven Triage
The triage policy turns the reliability profile into an action for each alert, and attaches the evidence profile to the alerts it escalates.
Routing policy.
In the manner of selective classification and learning to defer [21,22], the reliability of each predicted attack type determines how its alerts are handled. With two thresholds and ,
Reliable classes are handled automatically, assisted classes are automated but carry an explanation, and unreliable classes are escalated to an analyst. We use and unless stated otherwise. Because is estimated on validation, the routing decision is fixed before any test alert is seen; for error-coverage and operational metrics, assisted alerts count as automated. As a baseline, we compare this reliability-based routing against confidence-based routing, which applies the same three-way rule to the detector’s per-alert confidence (its maximum predicted probability) in place of the attack-type reliability .
Cost model.
To weigh analyst effort against missed attacks, we adopt the established intrusion-detection cost model [32,33,34], in which each outcome carries a cost. For N test alerts split into an automated set and an escalated set , the mean cost per alert is
where each escalated alert costs of analyst review time and is assumed resolved correctly. We use the illustrative weights , , , , which order the outcomes so that a missed attack is the most expensive, and we report the sensitivity of the result to the missed-attack cost . The cost saving of a policy is the reduction in mean cost per alert relative to automating every alert.
Triage card.
The framework presents its decision for each predicted class as a compact triage card containing the assigned action, the class’s reliability, the empirical posterior over what the alert most likely is, the contrastive evidence that drove the prediction over its twin, the evidence arguing back for the twin, and any feature group found to be detrimental for the class. Fully automated classes are shown without explanation.
The next section specifies the datasets, detectors, and evaluation protocol used to compute and test all of the quantities defined above.
5. Experimental Settings
The method above rests on concrete choices of data, detectors, and evaluation protocol, specified in the following subsections.
5.1. Datasets
We evaluate on two public benchmarks. UNSW-NB15 [27,28] is our primary dataset: it labels each network flow as normal or as one of nine attack types (Analysis, Backdoor, DoS, Exploits, Fuzzers, Generic, Reconnaissance, Shellcode, and Worms), giving ten classes in all. We pool the two partitioned files, remove the row-identifier column, and drop exact duplicates ( of pooled rows, ), which leaves unique records. The result is severely imbalanced: the normal class ( records) outnumbers the rarest attack, Worms (171 records), by roughly 500 to 1, which is precisely the regime in which per-attack-type reliability matters. CIC-IDS2017 [29] is our second benchmark, built from an explicit set of dataset-quality criteria. It comprises roughly million flows from eight capture sessions, described by 77 CICFlowMeter features, whose labels we harmonize into nine classes (normal traffic plus DoS, DDoS, PortScan, BruteForce, WebAttack, Bot, Infiltration, and Heartbleed). We apply the same leakage guards as for UNSW-NB15, dropping socket identifiers and, by default, the destination port, whose service identity would otherwise let a model separate several attacks almost trivially, and take a stratified subsample of records (a cap with the rarest classes kept whole, e.g. Heartbleed with about 11). It is therefore severely imbalanced, like UNSW-NB15. On this dataset, recent detectors approach ceiling performance, so it serves as a near-saturated control on which the triage framework should find little to escalate.
5.2. Preprocessing and Validation
We use a single stratified train/validation/test split on each dataset’s class label, produced once and reused by every experiment. Every step that learns a value, the one-hot encoding vocabulary, the standardization statistics, and the imputation medians, is fitted on the training fold only and applied unchanged to validation and test; this train-only fitting is the safeguard against leakage. Categorical fields (protocol, service, state) are one-hot encoded with rare values bucketed; tree models use the features unscaled, while neural models are z-score standardized. Recurrent models additionally receive fixed-length sliding windows of consecutive flows. Class imbalance is handled with inverse-frequency class weights during training; any resampling is applied to the training fold only, so validation and test keep their natural class distribution.
5.3. Detectors and Training
The six detectors introduced in Section 4.1 are tuned against validation macro-F1: by grid search for the tree and SVM models, and by Bayesian optimization (Optuna with a tree-structured Parzen estimator sampler) for XGBoost (50 trials) and the neural models (30 trials each). The SVM uses a radial basis function (RBF) kernel. The search runs on a single seed, and the chosen configuration is then evaluated across all five seeds. Because the RBF-SVM does not scale to the full training pool, it is fitted on a stratified subsample of training records, with validation and test kept complete.
5.4. Feature Selection and Feature Groups
We reduce the feature set with a recursive feature-addition (RFA) selector, in the spirit of Hamed, Dara, and Kremer [30]: features are added one at a time, each kept when it improves validation macro-F1, and the process stops when further additions yield less than gain over a short patience window. This selects a compact set of fourteen features (RFA-14), which we use for the reliability and triage analysis. For the explanation analysis (Section 4.3), the UNSW-NB15 features are aggregated into five semantic groups: basic flow, content, timing, general-purpose, and connection-tracking, following the dataset’s feature taxonomy [27,31]. The 77 CIC-IDS2017 features map to the same groups, except that CICFlowMeter provides no connection-tracking features (host and service history), a difference that bears on the cross-dataset explanation analysis.
5.5. Evaluation Protocol
Only the validation set is used for tuning, early stopping, and model selection; the test set is evaluated exactly once per model, after all hyperparameters are frozen. Every model is trained with five seeds, and we report the mean and standard deviation across seeds. The reliability-based and confidence-based routing policies are compared with a paired Wilcoxon signed-rank test over the five seeds, with Holm–Bonferroni correction where several comparisons are made, following the protocol recommended for comparing classifiers [35]. We report accuracy together with macro-averaged precision, recall, and F1. Macro-F1 is the primary metric, since it weights every class equally, whereas accuracy, dominated by the common classes, can reward a detector that neglects the rarest attacks.
The next section presents the results obtained under this protocol, organized around the three objectives set out in Section 3.
6. Results
We report results on UNSW-NB15, our primary benchmark, and use CIC-IDS2017 as a near-saturated control (Section 5). Detection performance is reported first, then the three objectives, reliability, explanations, and triage, in turn. Unless stated otherwise, per-attack-type quantities are for the primary detector, XGBoost, and are averaged over the five seeds.
6.1. Detection Performance
All six detectors were trained and evaluated under the protocol of Section 5. Table 1 reports accuracy, macro-precision, macro-recall, and macro-F1 as mean and standard deviation over the five seeds, on both datasets. Macro-F1 is our primary metric.
On UNSW-NB15, XGBoost attains the highest macro-F1 (0.611), ahead of the random forest (0.534), with the LSTM (0.425), SVM (0.389), 1D-CNN (0.386), and rule-based baseline (0.360) lower; we carry XGBoost forward as the primary detector. Accuracy on its own would mislead here: the random forest scores marginally higher accuracy (0.808) than XGBoost (0.800), yet a markedly lower macro-F1 (0.534 against 0.611), because accuracy is dominated by the common classes and rewards a detector that neglects the rare attacks. This is why macro-F1, not accuracy, is the headline metric.
On CIC-IDS2017, the tree detectors are near ceiling (XGBoost macro-F1 0.970, random forest 0.965, both above 0.99 accuracy), which confirms CIC-IDS2017 as a near-saturated control: there is little per-attack-type unreliability to triage, which we return to in the triage results below.
The aggregate hides a wide spread across attack types. For XGBoost on UNSW-NB15, per-class F1 ranges from 0.10 on Analysis and 0.13 on Backdoor to 0.92 on Generic and 0.90 on Normal (Figure 2), and the same rare attacks are the hardest for every detector. A single macro-F1 therefore says little about how far an individual prediction can be trusted, which is what the next subsection quantifies.
6.2. Reliability for Each Attack Type
Reliability varies by attack type.
The reliability , the precision of a prediction, varies enormously across attack types (Table 2). A prediction of Generic or Normal is correct about and of the time, but a prediction of Analysis or Backdoor is correct only and of the time; DoS (), Shellcode (), Fuzzers (), and Worms () lie in between, while Reconnaissance () and Exploits () are fairly reliable. The detector’s alerts are thus trustworthy for some attack types and almost meaningless for others, a distinction invisible in the macro-F1 of Section 6.1. These reliabilities are stable across training runs: the standard deviation of is at most 0.006 for every attack type but the rarest, Worms (0.025).
Confidence is not reliability.
The detector’s own confidence does not reveal this. For the least reliable types, the mean predicted confidence far exceeds the reliability: Analysis is predicted with mean confidence 0.51 against a reliability of 0.08, Backdoor with 0.53 against 0.09, and Worms with 0.93 against 0.63 (Table 2, Figure 3). Only for the well-populated types (Normal, Exploits, Generic) does confidence track reliability. Thresholding a confidence score, as selective-classification baselines do, would therefore automate exactly the rare attacks the detector is least able to call.
Reliability transfers to unseen traffic.
The reliability profile is estimated on validation, and it transfers to the held-out test fold. The total variation distance between the validation and test posteriors is below 0.1 for every attack type (Table 2), with a mean of 0.032 and a support-weighted mean of 0.011; the largest gaps are for the two rarest routed types, Shellcode (0.072) and Worms (0.062). A reliability profile built on validation therefore still holds on unseen traffic.
Each attack type has a stable twin.
Each attack type has a consistent twin, the attack type a prediction is most often confused with. The twins are identical across all five seeds for the eight routed types: Analysis and Backdoor are mutual twins, and both DoS and Worms have Exploits as their twin (Figure 4). These twins are what the next section explains and what the triage card surfaces.
6.3. Validated Explanations
The contrastive attribution decomposes the decision.
For each routed attack type, the group-level contrastive attributions sum to the decision margin, up to the classes’ base values. For a prediction of Analysis over its twin Backdoor, for instance, the five group attributions sum to 2.30 against a measured margin of 2.26 (Figure 5), so the explanation accounts for the decision rather than approximating it.
The explanations are faithful.
The explanation passes the feature-deletion faithfulness test for seven of the eight routed attack types in all five seeds (Table 3): deleting the ten features the attribution ranks highest collapses the margin far more than deleting ten random features, by 13× (DoS) to 45× (Reconnaissance), and for Exploits, random deletion did not reduce the margin at all. Backdoor is the exception, where the top-ten deletion collapses the margin only about three times the random baseline and the test passes in three of the five seeds.
Importance is not usefulness.
The features the detector relies on most are not always the ones that improve its detection performance. Connection-tracking is the second most important feature group by global SHAP magnitude (mean 14.5, behind basic-flow at 48.6), so the detector leans on it; yet permuting it improves the F1 of Analysis () and Backdoor (), meaning the group is detrimental for exactly the two least reliable attack types (Figure 6). On CIC-IDS2017, where the same detector is reliable throughout, this disagreement does not recur.
6.4. Reliability-Driven Triage
Routing catches most errors at a modest escalation rate.
At the operating thresholds and , the policy escalates of alerts and catches of the detector’s errors, a 47.8-point improvement over escalating the same fraction of alerts at random (Figure 7); the alerts it handles automatically carry a error rate. The pattern holds across all six detectors (Figure A1): the escalation rate tracks unreliability, from for the random forest to for the rule-based baseline, and each detector’s policy catches far more errors than random escalation of the same size.
Reliability is a sounder basis than confidence, though not a higher-coverage one.
Routing by reliability is not more accurate than routing by confidence. At the same workload, confidence-based routing catches of the errors against for reliability-based routing, a gap of under one point that is not statistically significant (paired Wilcoxon signed-rank over the five seeds, p=0.0625). The value of the reliability basis is not higher coverage but that it is defined per attack type and is calibrated, whereas the confidence score is not (Section 6.2). The reliability policy is therefore interpretable and auditable at the level of attack types, and it routes on the same quantity, , that the analyst is shown.
The policy lowers cost under illustrative weights.
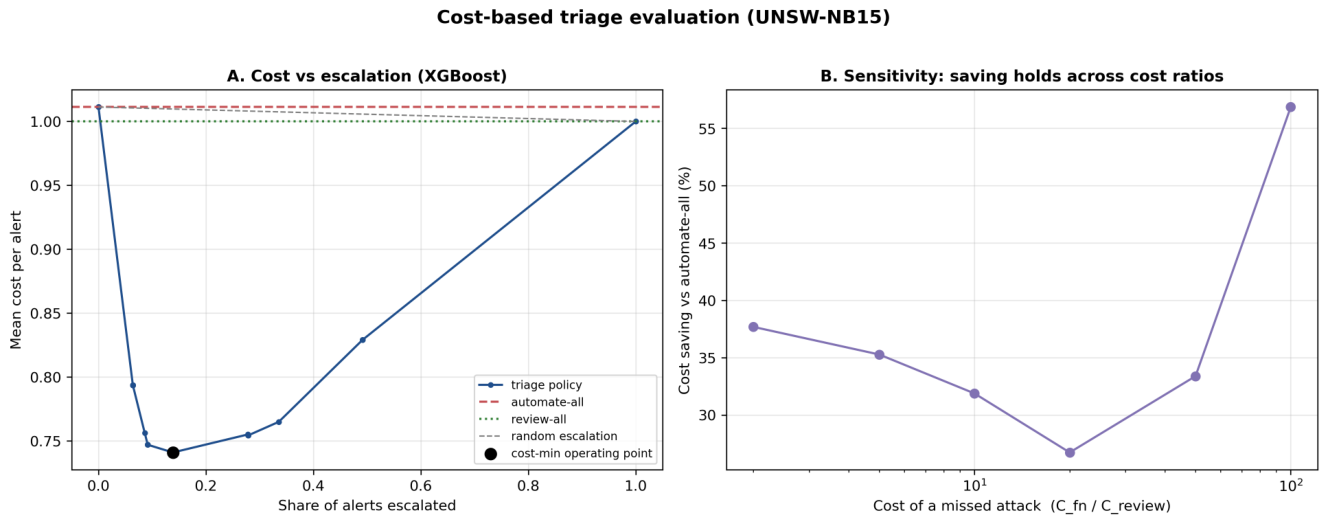
Under the illustrative cost weights of Section 4.4, and at each detector’s cost-optimal threshold, the triage policy reduces the mean cost per alert relative to automating every alert by for XGBoost to for the rule-based baseline (Figure A2), and the saving stays positive across missed-attack cost ratios from 2 to 100. This cost-optimal threshold is a different operating point from the fixed used for the coverage results above (for XGBoost it escalates rather than ), and we keep the two separate.
The framework abstains on the near-saturated control.
On CIC-IDS2017, where the tree detectors are already reliable for every attack type (Section 6.1), the policy escalates nothing: both XGBoost and the random forest escalate of alerts (Figure 8). The framework thus abstains where there is no confusion to triage, and only the weaker CIC detectors, which retain some unreliable classes, escalate at all.
The triage card.
For each escalated alert, the framework assembles the computed quantities, the assigned action, the attack-type reliability, the posterior over the true attack type, the contrastive evidence for the prediction over its twin, and any detrimental feature group, into a compact triage card (Figure 9). The card is a proposed decision aid: we report the information it would present, and its usefulness to a working analyst is left to future evaluation.
7. Discussion
The results show that a detector’s aggregate score, even a macro-F1, says little about how far any single prediction can be trusted: on UNSW-NB15 the primary detector’s per-attack-type reliability ranges from almost worthless to almost certain (Section 6.2). The three findings that follow each answer one of the questions left open by the literature (Section 3), and together they turn a detector’s predictions into a per-attack-type account that an analyst can act on. We discuss each in turn, and then the limits of what has been shown.
7.1. Reliability for Each Attack Type
The reliability profile addresses the first gap, that detection is reported in aggregate and hides where a detector is untrustworthy. It shows that a detector’s confidence is not its reliability: on the rarest attacks the detector is both least reliable and most overconfident, so a confidence threshold, the basis of most selective-classification and learning-to-defer methods [21,22], would automate precisely the alerts that most need a human. Because the profile is estimated from predicted labels alone, stays stable across training runs, and transfers from validation to unseen traffic, it is usable in deployment rather than only in hindsight. It gives an analyst what a single score cannot: a calibrated, per-attack-type estimate of trust, together with the attack that a prediction is most likely confused with.
7.2. Validated Explanations
The evidence profile addresses the second gap, that explanations of intrusion-detection decisions are seldom checked. Two findings matter. First, the explanations are faithful for almost every routed attack type; faithfulness is rarely tested, and where it is, attribution methods often fall short [5,7]. The one exception, Backdoor, is also among the least reliably detected attack types, so the detector is hardest to explain exactly where it is hardest to trust. Second, the features a detector weights most heavily are not always the ones that strengthen its predictions: a feature group ranked important by SHAP can degrade an attack type’s F1. This separates two questions that explainability usually conflates, why the model decided and whether the decision is well founded, and it gives the analyst a signal of where the detector is being misled rather than informed.
7.3. Reliability-Driven Triage
The triage policy addresses the third gap, that alert-handling decisions rest on a single, poorly calibrated confidence score. Routing by attack-type reliability catches most of the detector’s errors at a modest escalation rate and, on the near-saturated control, escalates almost nothing, so the framework spends analyst attention only where the detector is actually unreliable. Routing by reliability is not, however, more accurate than routing by confidence at the same workload, which is consistent with the softmax confidence being a strong and often hard-to-beat baseline for selective prediction [21], and with a concurrent triage study that likewise reports no gain over a simple selective gate [45]. A small per-attack-type reliability profile matches a per-alert confidence score on error coverage: the same routing quality comes from an object that is calibrated, defined per attack type, and shown to the analyst, so the decision is interpretable and auditable where a raw confidence score is not. Under illustrative cost weights the policy also lowers the expected cost per alert, which suggests, but does not establish, an operational benefit; those figures are model outputs under assumed parameters, not measurements from a live centre.
7.4. Limitations
Several limits bound these claims. The framework is a proposed decision aid: we measure the information it would present to an analyst, not an analyst’s behaviour, and its usefulness in practice must be established in a study with security analysts, which we leave to future work. The cost and workload figures come from established models under illustrative parameters and a sensitivity analysis, not from a deployed system. The contrastive explanation is instantiated with tree-based SHAP on the primary detector; extending it to non-tree detectors with model-agnostic or deep-model variants remains to be done, although the reliability and routing components already apply to any classifier. Finally, the evaluation uses two public benchmarks under a single stratified split repeated over five seeds; wider datasets and live traffic would test how far the profile and the policy generalize.
8. Conclusion
Deciding how far to trust an individual alert is a per-attack-type judgement, and it is one that detection, explanation, and alert triage, pursued largely in isolation, have not equipped an analyst to make. We proposed a confusion-aware triage framework that unifies these three concerns: from a trained detector’s predictions it estimates the reliability of each attack type, validates the explanations of its decisions, and routes each alert by that reliability into automatic handling, analyst assistance, or escalation, presenting each escalated alert as a compact decision card. Evaluating the framework on two benchmarks with six detectors over five seeds, we found that per-attack-type reliability can be estimated, is stable across training runs, and transfers to unseen traffic; that the explanations are faithful for almost every routed attack type, while a feature’s importance to the model is not the same as its usefulness to it; and that routing by reliability catches most of the detector’s errors at a modest escalation rate and abstains where the detector is already reliable. Routing by reliability is not more accurate than routing by confidence at the same workload, but it routes on a calibrated, per-attack-type quantity that an analyst can read and audit, which a confidence score cannot provide. The framework is a proposal rather than a validated system: we measure the information it would present, together with its cost and analyst workload under illustrative models, but not its use by working analysts. Overall, our results indicate that a detector’s per-attack-type reliability can be estimated, validated, and turned into an interpretable triage decision, with the framework’s value to a working analyst left to establish in future work.
Author Contributions
Conceptualization, T.E.E. and R.D.; methodology, T.E.E.; software, T.E.E.; validation, T.E.E.; formal analysis, T.E.E.; investigation, T.E.E.; data curation, T.E.E.; writing—original draft preparation, T.E.E.; writing—review and editing, T.E.E. and R.D.; visualization, T.E.E.; supervision, R.D. All authors have read and agreed to the published version of the manuscript.
Funding
This research received no external funding.
Data Availability Statement
All datasets used are public. All code, fixed data splits, configuration, and figure-generating scripts are openly available at https://github.com/Thommartial/multi-model-ids-project. Every figure and table in this paper is regenerated by a named script in that repository.
Conflicts of Interest
The authors declare no conflicts of interest.
Appendix A. Supporting Figures
Figure A1.
Triage operating point per detector on UNSW-NB15: escalation rate and the share of errors caught. Less reliable detectors escalate more, and every detector improves on random escalation.
Figure A1.
Triage operating point per detector on UNSW-NB15: escalation rate and the share of errors caught. Less reliable detectors escalate more, and every detector improves on random escalation.
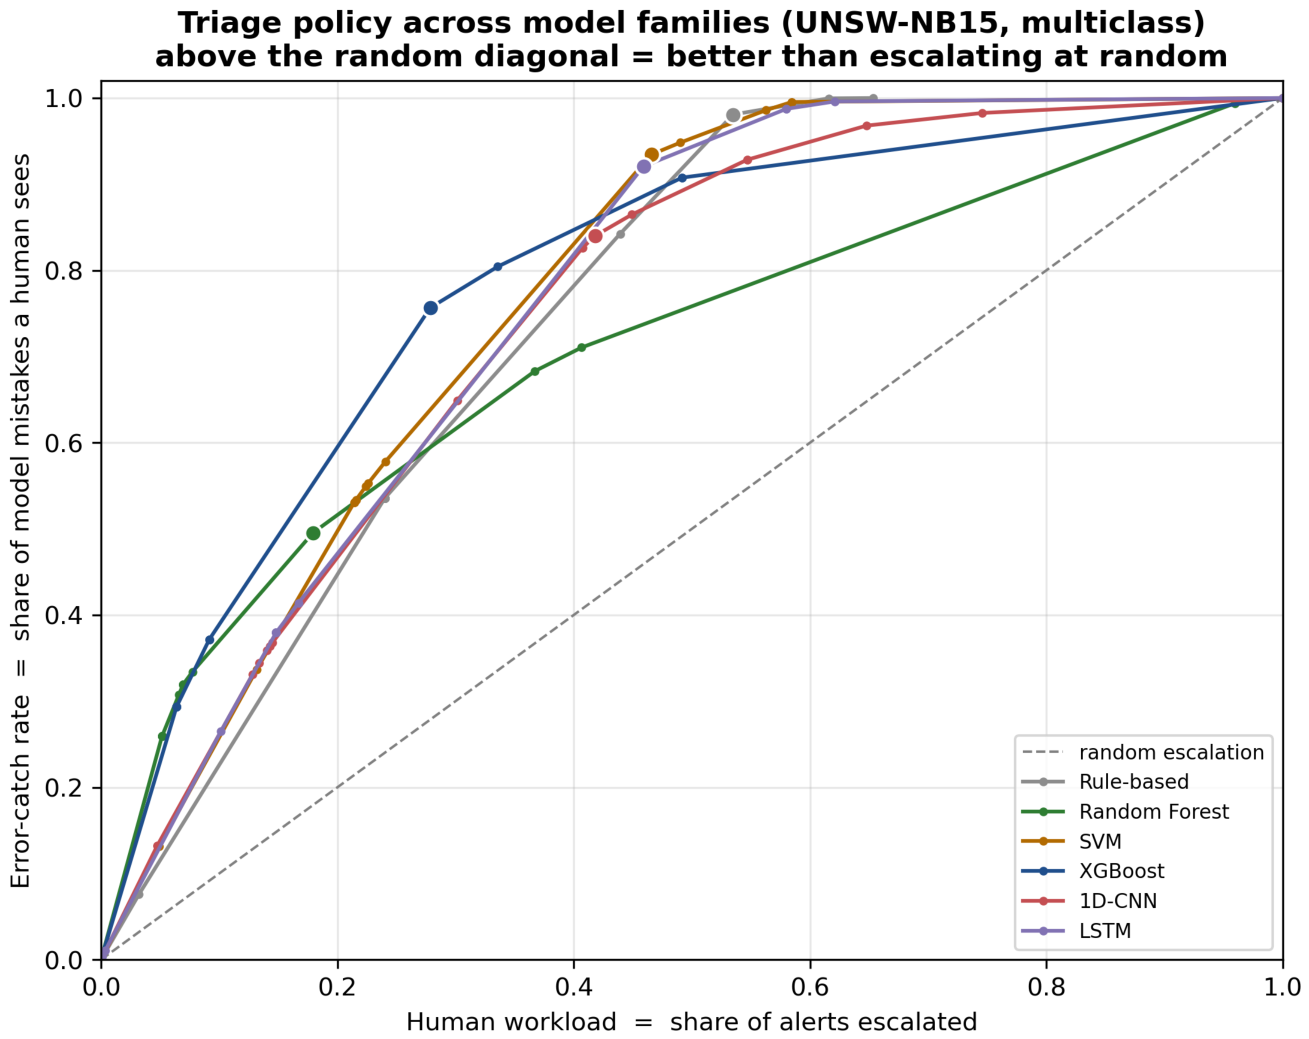
Figure A2.
Cost saving of the triage policy relative to automating every alert, per detector on UNSW-NB15, under the illustrative cost weights and each detector’s cost-optimal threshold.
Figure A2.
Cost saving of the triage policy relative to automating every alert, per detector on UNSW-NB15, under the illustrative cost weights and each detector’s cost-optimal threshold.
References
- Abdulganiyu, O.H.; Ait Tchakoucht, T.; Saheed, Y.K. A systematic literature review for network intrusion detection system (IDS). International Journal of Information Security 2023, 22, 1125–1162. [CrossRef]
- Arnob, A.K.B.; Chowdhury, R.R.; Chaiti, N.A.; Saha, S.; Roy, A. A comprehensive systematic review of intrusion detection systems: emerging techniques, challenges, and future research directions. Journal of Edge Computing 2025, 4, 73–104. [CrossRef]
- Bulavas, V.; Marcinkevičius, V.; Rumiński, J. Study of Multi-Class Classification Algorithms’ Performance on Highly Imbalanced Network Intrusion Datasets. Informatica 2021, 32, 441–475. [CrossRef]
- Le Jeune, L.; Goedeme, T.; Mentens, N. Machine Learning for Misuse-Based Network Intrusion Detection: Overview, Unified Evaluation and Feature Choice Comparison Framework. IEEE Access 2021, 9, 63995–64015. [CrossRef]
- Ogunseyi, T.B.; Thiyagarajan, G.; He, H.; Bist, V.; Du, Z. Performance Analysis of Explainable Deep Learning-Based Intrusion Detection Systems for IoT Networks: A Systematic Review. Sensors 2026, 26, 363. [CrossRef]
- Neupane, S.; Ables, J.; Anderson, W.; Mittal, S.; Rahimi, S.; Banicescu, I.; Seale, M. Explainable Intrusion Detection Systems (X-IDS): A survey of current methods, challenges, and opportunities. IEEE Access 2022, 10, 112392–112415. [CrossRef]
- Kalakoti, R.; Vaarandi, R.; Bahşi, H.; Nõmm, S. Evaluating Explainable AI for Deep Learning-Based Network Intrusion Detection System Alert Classification. Proceedings of the 11th International Conference on Information Systems Security and Privacy (ICISSP). SciTePress, 2025, pp. 47–58. [CrossRef]
- Jalalvand, F.; Baruwal Chhetri, M.; Nepal, S.; Paris, C. Alert Prioritisation in Security Operations Centres: A Systematic Survey on Criteria and Methods. ACM Computing Surveys 2024, 57, 1–36. [CrossRef]
- Baruwal Chhetri, M.; Tariq, S.; Singh, R.; Jalalvand, F.; Paris, C.; Nepal, S. Towards Human-AI Teaming to Mitigate Alert Fatigue in Security Operations Centres. ACM Transactions on Internet Technology 2024, 24, 1–22. [CrossRef]
- Seo, J.-H. Evolutionary Data Preprocessing to Alleviate Class Imbalance. Security and Communication Networks 2022, 2022, 3761205. [CrossRef]
- Ma, Z.; Li, J.; Song, Y.; Wu, X.; Chen, C. Network Intrusion Detection Method Based on FCWGAN and BiLSTM. Computational Intelligence and Neuroscience 2022, 2022, 6591140. [CrossRef]
- Ren, H.; Tang, Y.; Dong, W.; Ren, S.; Jiang, L. DUEN: Dynamic ensemble handling class imbalance in network intrusion detection. Expert Systems with Applications 2023, 229, 120420. [CrossRef]
- Mohammad, R.; Saeed, F.; Almazroi, A.A.; Alsubaei, F.S.; Almazroi, A.A. Enhancing Intrusion Detection Systems Using a Deep Learning and Data Augmentation Approach. Systems 2024, 12, 79. [CrossRef]
- Alshinwan, M.; Batyha, R.M.; Alayed, W.; Alqahtany, S.S.; Abuowaida, S.; Mashagba, H.A.; Abd Aziz, A.B.; Al-Bawri, S.S. Enhancing intrusion detection systems using hybrid AI-based approaches. Computers, Materials & Continua 2026, 87, 97. [CrossRef]
- Lundberg, S.M.; Lee, S.-I. A unified approach to interpreting model predictions. Advances in Neural Information Processing Systems (NeurIPS), 2017, pp. 4765–4774.
- Wang, M.; Zheng, K.; Yang, Y.; Wang, X. An Explainable Machine Learning Framework for Intrusion Detection Systems. IEEE Access 2020, 8, 73127–73141. [CrossRef]
- Patil, S.; Varadarajan, V.; Mazhar, S.M.; Sahibzada, A.; Ahmed, N.; Sinha, O.; Kumar, S.; Shaw, K.; Kotecha, K. Explainable Artificial Intelligence for Intrusion Detection System. Electronics 2022, 11, 3079. [CrossRef]
- Keshk, M.; Koroniotis, N.; Pham, N.; Moustafa, N.; Turnbull, B.; Zomaya, A.Y. An explainable deep learning-enabled intrusion detection framework in IoT networks. Information Sciences 2023, 639, 119000. [CrossRef]
- Alabdulatif, A. A Novel Ensemble of Deep Learning Approach for Cybersecurity Intrusion Detection with Explainable Artificial Intelligence. Applied Sciences 2025, 15, 7984. [CrossRef]
- Khan, N.; Ahmad, K.; Al Tamimi, A.; Alani, M.M.; Bermak, A.; Khalil, I. Explainable AI-Based Intrusion Detection Systems for Industry 5.0 and Adversarial XAI: A Systematic Review. Information 2025, 16, 1036. [CrossRef]
- Geifman, Y.; El-Yaniv, R. Selective classification for deep neural networks. Advances in Neural Information Processing Systems (NeurIPS), 2017, pp. 4878–4887.
- Mozannar, H.; Sontag, D. Consistent estimators for learning to defer to an expert. Proceedings of the 37th International Conference on Machine Learning (ICML). PMLR, 2020, Vol. 119, pp. 7076–7087.
- Kawaguchi, H.; Nakatani, Y.; Okada, S. IDPS signature classification with a reject option and the incorporation of expert knowledge. 2022 21st IEEE International Conference on Machine Learning and Applications (ICMLA). IEEE, 2022, pp. 623–628. [CrossRef]
- de Oliveira, P.R.; Viegas, E.K.; Santin, A.O.; Horchulhack, P.; de Matos, É. Toward a reliable network-based intrusion detection model for SCADA: A classification with reject option approach. 2024 International Joint Conference on Neural Networks (IJCNN). IEEE, 2024. [CrossRef]
- Ban, T.; Takahashi, T.; Ndichu, S.; Inoue, D. Breaking Alert Fatigue: AI-Assisted SIEM Framework for Effective Incident Response. Applied Sciences 2023, 13, 6610. [CrossRef]
- Wang, X.; Yang, X.; Liang, X.; Zhang, X.; Zhang, W.; Gong, X. Combating alert fatigue with AlertPro: Context-aware alert prioritization using reinforcement learning for multi-step attack detection. Computers & Security 2024, 137, 103583. [CrossRef]
- Moustafa, N.; Slay, J. UNSW-NB15: A comprehensive data set for network intrusion detection systems (UNSW-NB15 network data set). 2015 Military Communications and Information Systems Conference (MilCIS). IEEE, 2015, pp. 1–6. [CrossRef]
- Moustafa, N.; Slay, J. The evaluation of network anomaly detection systems: Statistical analysis of the UNSW-NB15 data set and the comparison with the KDD99 data set. Information Security Journal: A Global Perspective 2016, 25, 18–31. [CrossRef]
- Sharafaldin, I.; Lashkari, A.H.; Ghorbani, A.A. Toward generating a new intrusion detection dataset and intrusion traffic characterization. Proceedings of the 4th International Conference on Information Systems Security and Privacy (ICISSP), 2018, pp. 108–116. [CrossRef]
- Hamed, T.; Dara, R.; Kremer, S.C. Network intrusion detection system based on recursive feature addition and bigram technique. Computers & Security 2018, 73, 137–155. [CrossRef]
- Al-Daweri, M.S.; Zainol Ariffin, K.A.; Abdullah, S.; Md. Senan, M.F.E. An analysis of the KDD99 and UNSW-NB15 datasets for the intrusion detection system. Symmetry 2020, 12, 1666. [CrossRef]
- Lee, W.; Fan, W.; Miller, M.; Stolfo, S.J.; Zadok, E. Toward Cost-Sensitive Modeling for Intrusion Detection and Response. Journal of Computer Security 2002, 10, 5–22. [CrossRef]
- Gaffney, J.E.; Ulvila, J.W. Evaluation of Intrusion Detectors: A Decision Theory Approach. Proceedings 2001 IEEE Symposium on Security and Privacy (S&P). IEEE, 2001, pp. 50–61. [CrossRef]
- Elkan, C. The Foundations of Cost-Sensitive Learning. Proceedings of the 17th International Joint Conference on Artificial Intelligence (IJCAI), 2001, pp. 973–978.
- Demšar, J. Statistical Comparisons of Classifiers over Multiple Data Sets. Journal of Machine Learning Research 2006, 7, 1–30.
- Cortes, C.; Vapnik, V. Support-Vector Networks. Machine Learning 1995, 20, 273–297.
- Chen, T.; Guestrin, C. XGBoost: A Scalable Tree Boosting System. Proceedings of the 22nd ACM SIGKDD International Conference on Knowledge Discovery and Data Mining (KDD), 2016, pp. 785–794.
- Hochreiter, S.; Schmidhuber, J. Long Short-Term Memory. Neural Computation 1997, 9, 1735–1780.
- Breiman, L. Random Forests. Machine Learning 2001, 45, 5–32.
- Fisher, A.; Rudin, C.; Dominici, F. All Models are Wrong, but Many are Useful: Learning a Variable’s Importance by Studying an Entire Class of Prediction Models Simultaneously. Journal of Machine Learning Research 2019, 20, 1–81.
- Samek, W.; Binder, A.; Montavon, G.; Lapuschkin, S.; Müller, K.-R. Evaluating the Visualization of What a Deep Neural Network Has Learned. IEEE Transactions on Neural Networks and Learning Systems 2017, 28, 2660–2673.
- Petsiuk, V.; Das, A.; Saenko, K. RISE: Randomized Input Sampling for Explanation of Black-box Models. Proceedings of the British Machine Vision Conference (BMVC), 2018.
- Hooker, S.; Erhan, D.; Kindermans, P.-J.; Kim, B. A Benchmark for Interpretability Methods in Deep Neural Networks. Advances in Neural Information Processing Systems (NeurIPS), 2019, Vol. 32, pp. 9737–9748.
- Gombar, M. From Detection to Triage: Explainable Suspicious Flow Prioritization for Multiclass Intrusion Detection Using CSE-CIC-IDS2018. Electronics 2026, 15, 2739.
- Le, T.D.; Arifuzzaman, M.; Bao, Y. TRACE: Feature-Space Feasible Action Contracts for Explainable Intrusion Triage. Electronics 2026, 15, 3291.
Figure 1.
Overview of the proposed confusion-aware triage framework. A trained detector’s predictions on a validation fold yield a per-attack-type reliability profile and an evidence profile; a triage policy then sends each alert to automatic handling, analyst assistance, or escalation, presenting the evidence profile with the alerts it escalates.
Figure 1.
Overview of the proposed confusion-aware triage framework. A trained detector’s predictions on a validation fold yield a per-attack-type reliability profile and an evidence profile; a triage policy then sends each alert to automatic handling, analyst assistance, or escalation, presenting the evidence profile with the alerts it escalates.
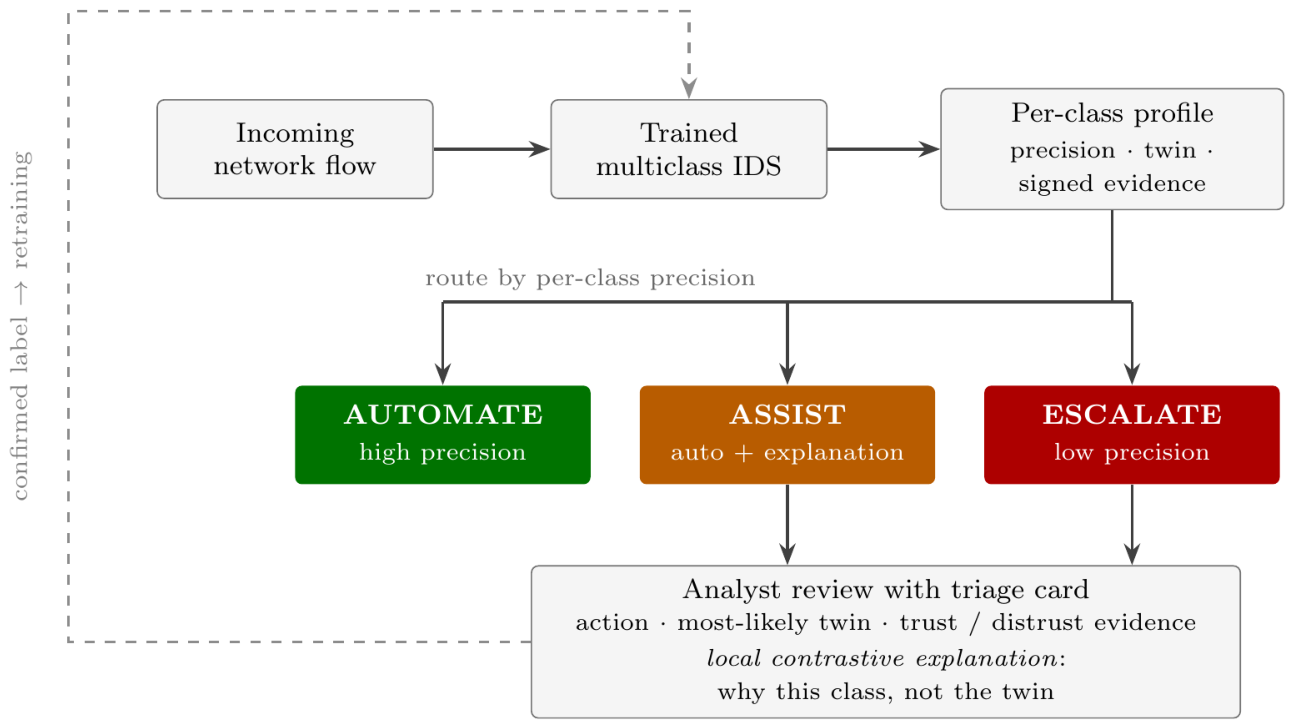
Figure 2.
Per-attack-type detection F1 for each detector on UNSW-NB15. The rare attacks (Analysis, Backdoor, DoS, Worms) are the hardest for every detector, and the aggregate macro-F1 conceals this spread.
Figure 2.
Per-attack-type detection F1 for each detector on UNSW-NB15. The rare attacks (Analysis, Backdoor, DoS, Worms) are the hardest for every detector, and the aggregate macro-F1 conceals this spread.
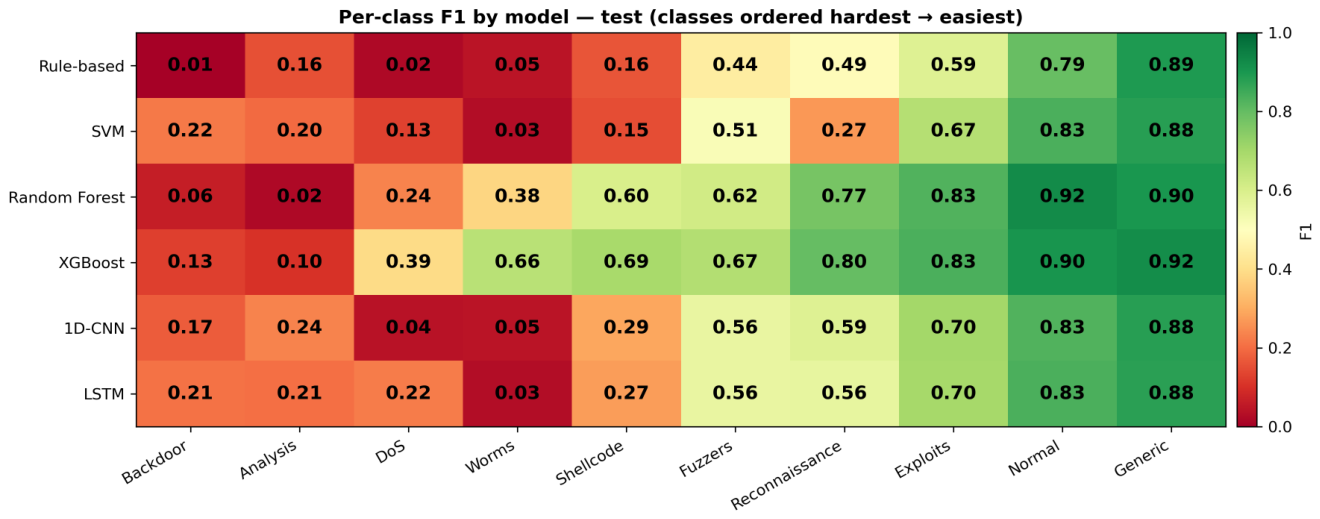
Figure 3.
Confidence against reliability per attack type for XGBoost on UNSW-NB15. Confidence systematically overstates reliability for the rare attacks, so a confidence threshold is a poor basis for deciding what to automate.
Figure 3.
Confidence against reliability per attack type for XGBoost on UNSW-NB15. Confidence systematically overstates reliability for the rare attacks, so a confidence threshold is a poor basis for deciding what to automate.
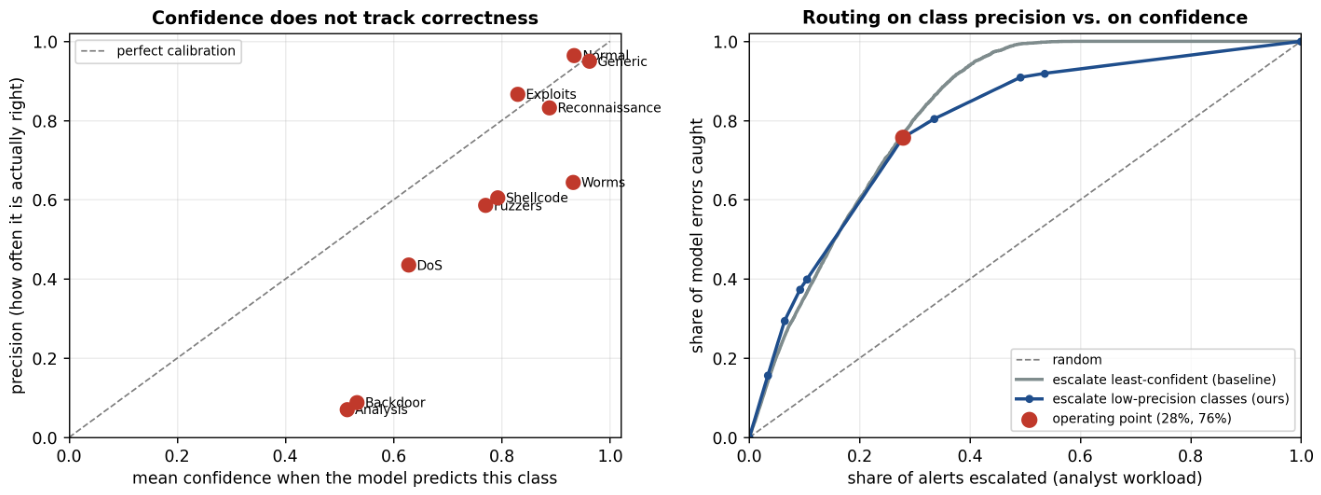
Figure 4.
Per-attack-type difficulty and confusion structure for XGBoost on UNSW-NB15. Each attack type’s twin, the attack type it is most often confused with, is stable across the five seeds.
Figure 4.
Per-attack-type difficulty and confusion structure for XGBoost on UNSW-NB15. Each attack type’s twin, the attack type it is most often confused with, is stable across the five seeds.
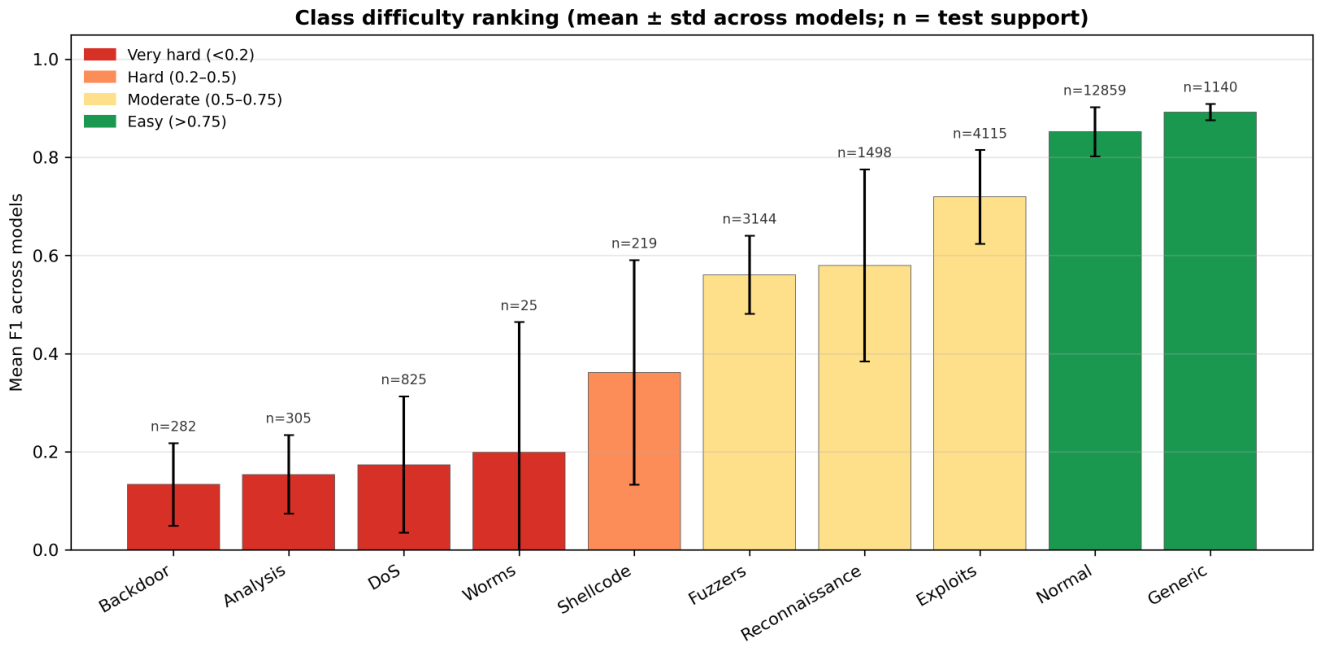
Figure 5.
Contrastive attribution for XGBoost on UNSW-NB15: the contribution of each feature group to the margin between a predicted attack type and its twin. Positive bars support the prediction, negative bars support the twin.
Figure 5.
Contrastive attribution for XGBoost on UNSW-NB15: the contribution of each feature group to the margin between a predicted attack type and its twin. Positive bars support the prediction, negative bars support the twin.
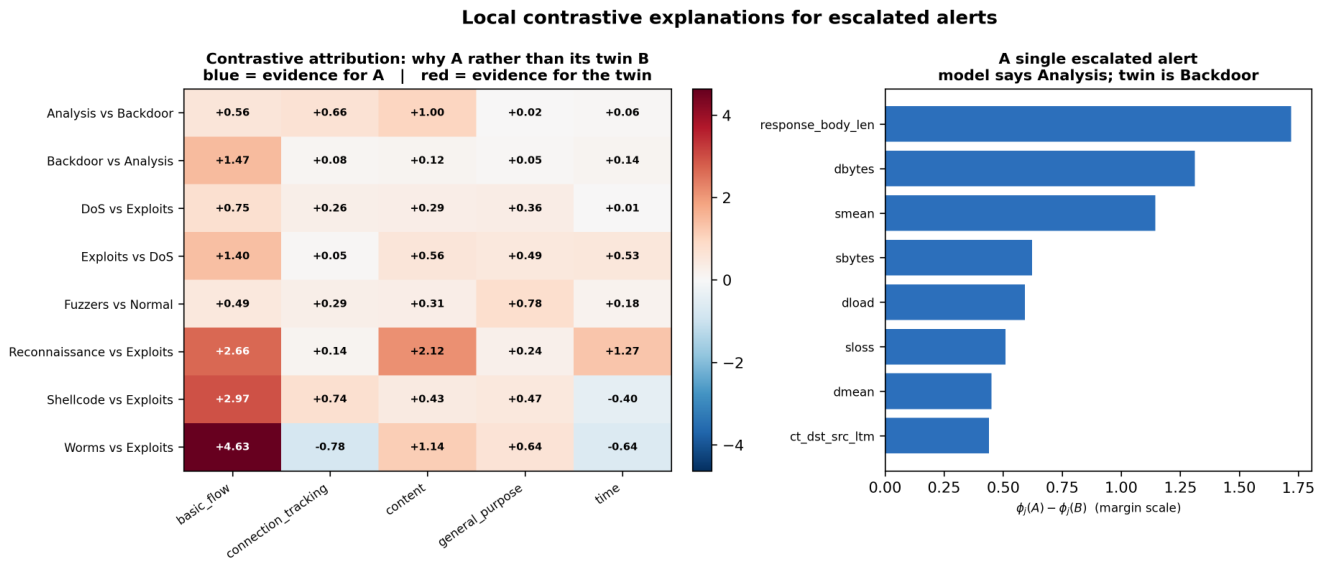
Figure 6.
Global SHAP magnitude against signed permutation importance per feature group for XGBoost on UNSW-NB15. Connection-tracking is ranked important by SHAP but has negative permutation importance for Analysis and Backdoor, so removing it improves their F1.
Figure 6.
Global SHAP magnitude against signed permutation importance per feature group for XGBoost on UNSW-NB15. Connection-tracking is ranked important by SHAP but has negative permutation importance for Analysis and Backdoor, so removing it improves their F1.
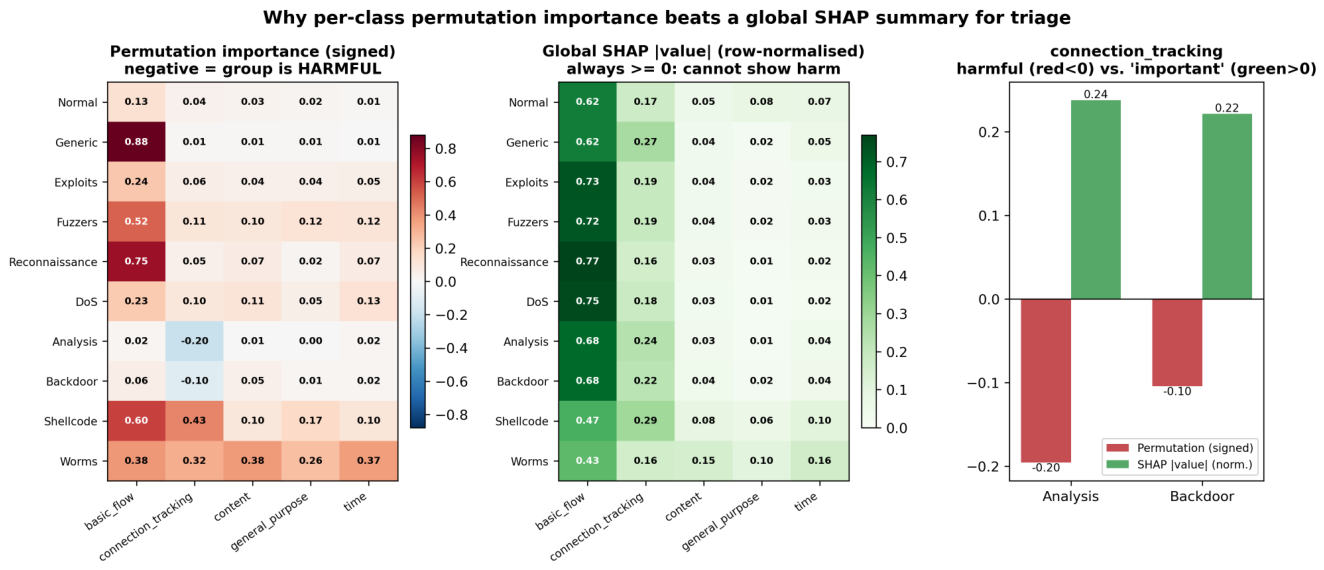
Figure 7.
Error coverage against escalation rate for XGBoost on UNSW-NB15. Routing by attack-type reliability catches far more of the detector’s errors than escalating the same fraction of alerts at random.
Figure 7.
Error coverage against escalation rate for XGBoost on UNSW-NB15. Routing by attack-type reliability catches far more of the detector’s errors than escalating the same fraction of alerts at random.
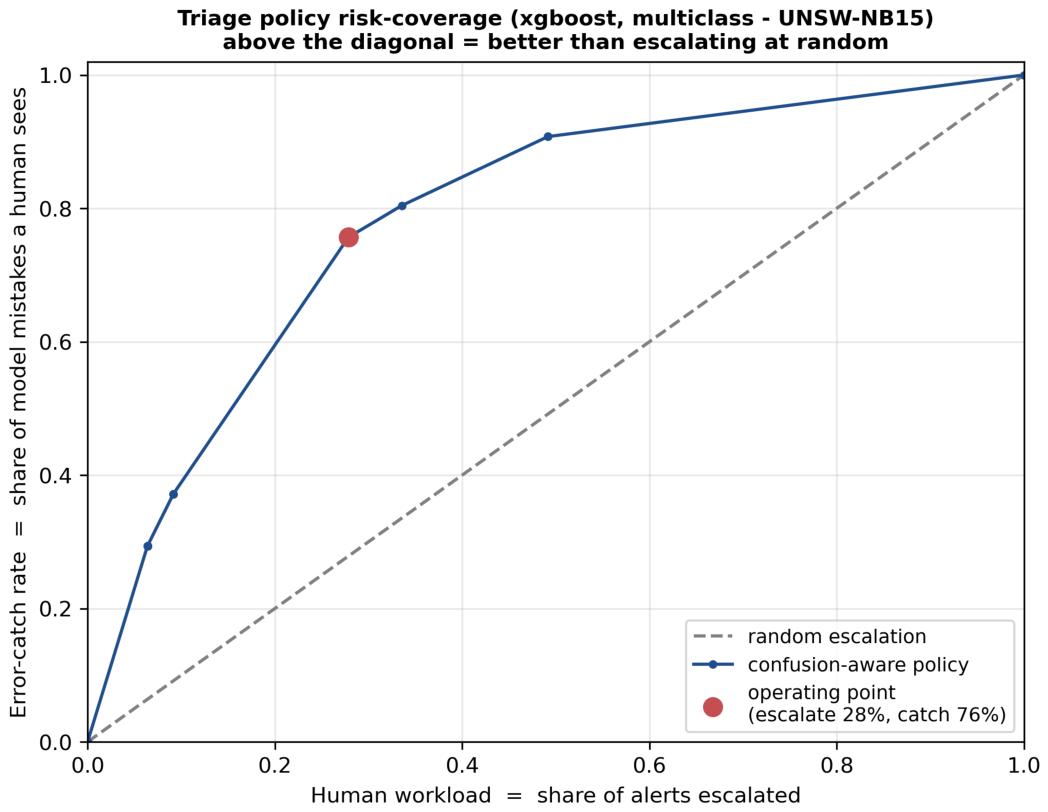
Figure 8.
Triage across both datasets. On UNSW-NB15, the policy escalates the unreliable attack types; on the near-saturated CIC-IDS2017, the reliable tree detectors escalate almost nothing, so the framework abstains where the detector is already trustworthy.
Figure 8.
Triage across both datasets. On UNSW-NB15, the policy escalates the unreliable attack types; on the near-saturated CIC-IDS2017, the reliable tree detectors escalate almost nothing, so the framework abstains where the detector is already trustworthy.
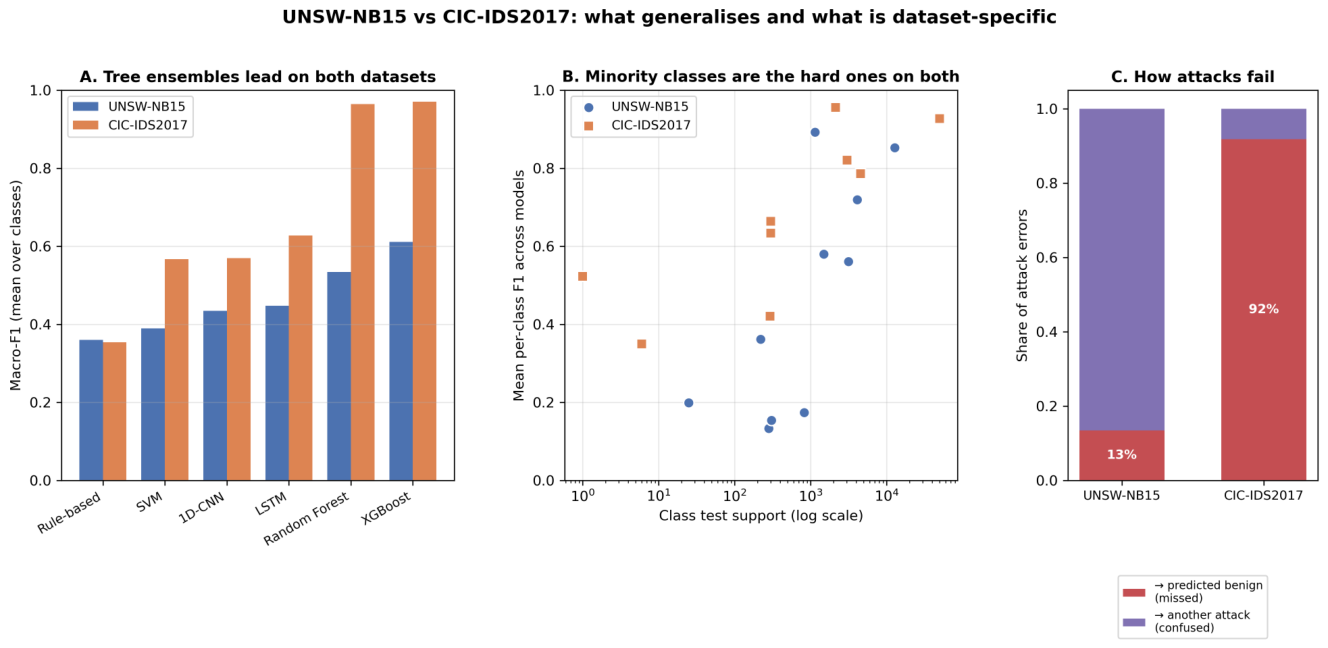
Figure 9.
Example triage cards for escalated attack types. Each card carries the assigned action, the attack-type reliability, the posterior over the true attack type, the contrastive evidence for the prediction over its twin, and any feature group found detrimental for that attack type.
Figure 9.
Example triage cards for escalated attack types. Each card carries the assigned action, the attack-type reliability, the posterior over the true attack type, the contrastive evidence for the prediction over its twin, and any feature group found detrimental for that attack type.
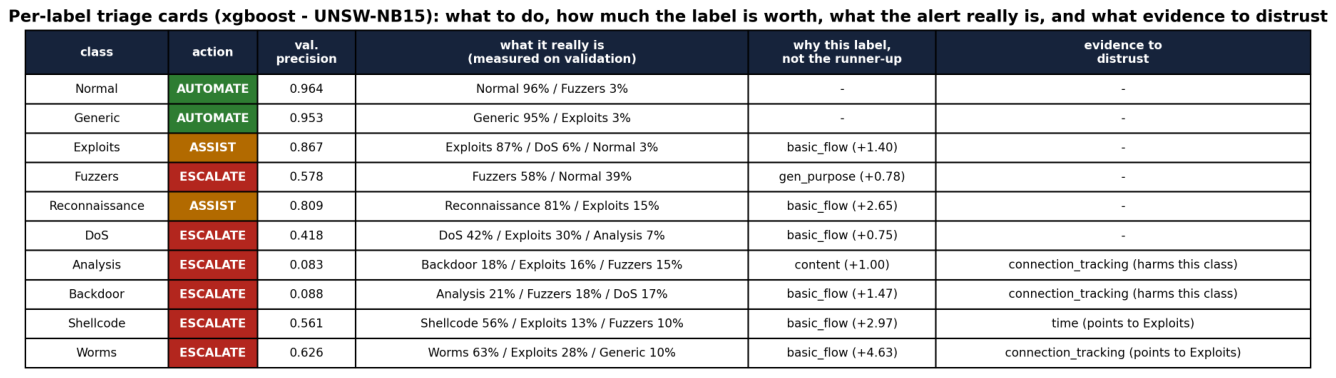

Table 1.
Detection performance (mean ± standard deviation over five seeds), per detector on both datasets, ordered by macro-F1. Macro-F1 is the primary metric; accuracy is reported to show that under class imbalance it can favour a weaker detector (on UNSW-NB15 the random forest has higher accuracy but lower macro-F1 than XGBoost). The primary detector is in bold.
Table 1.
Detection performance (mean ± standard deviation over five seeds), per detector on both datasets, ordered by macro-F1. Macro-F1 is the primary metric; accuracy is reported to show that under class imbalance it can favour a weaker detector (on UNSW-NB15 the random forest has higher accuracy but lower macro-F1 than XGBoost). The primary detector is in bold.
| Dataset | Detector | Accuracy | Macro-precision | Macro-recall | Macro-F1 |
| UNSW-NB15 | XGBoost | ||||
| Random forest | |||||
| LSTM | |||||
| SVM | |||||
| 1D-CNN | |||||
| Rule-based | |||||
| CIC-IDS2017 | XGBoost | ||||
| Random forest | |||||
| LSTM | |||||
| 1D-CNN | |||||
| SVM | |||||
| Rule-based |
Table 2.
Per-attack-type reliability of the primary detector (XGBoost) on UNSW-NB15, ordered by reliability. is the precision of a prediction, estimated on validation; mean confidence is the detector’s average predicted probability on test; is the total variation distance between the validation and test posteriors. and are reported as mean ± standard deviation over the five seeds; mean confidence is the seed mean.
Table 2.
Per-attack-type reliability of the primary detector (XGBoost) on UNSW-NB15, ordered by reliability. is the precision of a prediction, estimated on validation; mean confidence is the detector’s average predicted probability on test; is the total variation distance between the validation and test posteriors. and are reported as mean ± standard deviation over the five seeds; mean confidence is the seed mean.
| Attack type | Reliability | Mean confidence | |
| Analysis | 0.51 | ||
| Backdoor | 0.53 | ||
| DoS | 0.63 | ||
| Shellcode | 0.79 | ||
| Fuzzers | 0.77 | ||
| Worms | 0.93 | ||
| Reconnaissance | 0.89 | ||
| Exploits | 0.83 | ||
| Generic | 0.96 | ||
| Normal | 0.93 |
Table 3.
Faithfulness of the contrastive explanation for XGBoost on UNSW-NB15. For each routed attack type, the drop in the prediction-versus-twin margin when the ten highest-ranked features are deleted (mean ± standard deviation over five seeds) is compared with deleting ten random features. The explanation passes when the top-ten deletion collapses the margin by at least twice the random baseline; the last column counts the seeds in which it passes.
Table 3.
Faithfulness of the contrastive explanation for XGBoost on UNSW-NB15. For each routed attack type, the drop in the prediction-versus-twin margin when the ten highest-ranked features are deleted (mean ± standard deviation over five seeds) is compared with deleting ten random features. The explanation passes when the top-ten deletion collapses the margin by at least twice the random baseline; the last column counts the seeds in which it passes.
| Attack type | Twin | Margin drop (top-10) | Margin drop (random-10) | Faithful seeds (of 5) |
| Analysis | Backdoor | 0.13 | 5 | |
| Backdoor | Analysis | 0.20 | 3 | |
| DoS | Exploits | 0.20 | 5 | |
| Exploits | DoS | -0.04 | 5 | |
| Fuzzers | Normal | 0.16 | 5 | |
| Reconnaissance | Exploits | 0.23 | 5 | |
| Shellcode | Exploits | 0.50 | 5 | |
| Worms | Exploits | 0.37 | 5 |
Disclaimer/Publisher’s Note: The statements, opinions and data contained in all publications are solely those of the individual author(s) and contributor(s) and not of MDPI and/or the editor(s). MDPI and/or the editor(s) disclaim responsibility for any injury to people or property resulting from any ideas, methods, instructions or products referred to in the content. |
© 2026 by the authors. Licensee MDPI, Basel, Switzerland. This article is an open access article distributed under the terms and conditions of the Creative Commons Attribution (CC BY) license (http://creativecommons.org/licenses/by/4.0/).
Copyright: This open access article is published under a Creative Commons CC BY 4.0 license, which permit the free download, distribution, and reuse, provided that the author and preprint are cited in any reuse.