
Submitted:
10 September 2026
Posted:
11 September 2026
You are already at the latest version
Abstract
Background/Objectives: Inpatient fall risk evolves during hospitalization and may not be adequately represented by admission-based assessment alone. Although assessments obtained closer to fall events can outperform admission scores, less is known about how fall-risk trajectories differ between patients who fall and those who remain fall-free. This study characterized temporal changes in Hendrich II scores, compared risk trajectories between fall cases and temporally aligned controls, and identified factors associated with risk escalation. Methods: We conducted a retrospective matched case-control study using routinely collected inpatient data from a tertiary care hospital. Fall cases were matched to nonfall controls by admission date with temporally aligned event/index assessments. Change in risk (ΔScore) was calculated as the event/index score minus the admission score. Logistic regression evaluated associations with falls, and receiver operating characteristic analysis compared discrimination at admission and event/index time. Results: Among 10,407 encounters (276 falls and 10,131 controls), fall cases had higher admission Hendrich II scores than controls (6.66 vs. 3.27). In the temporally aligned subset, scores increased substantially among fall cases but remained relatively stable among controls (mean ΔScore, +2.55 vs. −0.20; p < 0.001). Each 1-point increase in ΔScore was associated with 69% higher odds of falling (OR, 1.69; 95% CI, 1.57–1.83). Event-time factors independently associated with falls included confusion, elimination problems, antiepileptic medication use, and moderate mobility impairment. Discrimination increased from admission (AUC, 0.724) to event time (AUC, 0.831; p < 0.001). Conclusions: Patients who experienced inpatient falls demonstrated substantial escalation in Hendrich II risk not observed among temporally aligned controls. Monitoring score trajectories may provide clinically useful information beyond admission screening and warrants prospective evaluation as a strategy for guiding fall-prevention interventions.
Keywords:
inpatient falls
; Hendrich II Fall Risk Model
; fall risk assessment
; dynamic risk
; patient safety
; ROC analysis
1. Introduction
Inpatient falls remain a persistent and clinically significant patient safety issue worldwide, contributing to increased morbidity, prolonged hospitalization, higher healthcare costs, and, in severe cases, mortality. As one of the most frequently reported adverse events in acute care, falls are widely considered preventable and reflect both patient-level vulnerability and system-level factors, including care processes, environmental conditions, and clinical decision-making [1,2]. Consequently, fall prevention remains a major priority within hospital quality and safety programs.
To support risk stratification, several clinical prediction tools have been developed and implemented in routine practice. Among these, the Hendrich II Fall Risk Model is widely used because of its practicality and incorporation of clinically relevant domains, including cognitive status, mood, elimination patterns, medication exposure, and functional mobility [1]. The model provides a structured, point-based score to guide preventive interventions, and validation studies have demonstrated moderate predictive performance, with area under the curve (AUC) values generally ranging from 0.72 to 0.77 [2,3].
Fall risk, however, is inherently dynamic. Patients’ clinical conditions evolve during hospitalization because of acute illness, treatment effects, medication changes, and functional decline. Delirium, sedative exposure, changes in elimination status, and worsening mobility may emerge after admission and substantially alter risk. Consequently, a baseline assessment provides only a snapshot of a patient's risk state and may not capture subsequent deterioration. Previous studies have shown that maximum or assessments obtained closer to a fall event can outperform admission-based scores, establishing the importance of repeated assessment and temporal proximity [4].
Less well characterized is the trajectory of Hendrich II risk during hospitalization: the magnitude by which scores change among patients who subsequently fall compared with patients who remain fall-free, and which individual components account for this divergence. Understanding these changes may be more clinically informative than simply demonstrating that a proximal assessment has greater discrimination than an admission assessment. Furthermore, comparisons of longitudinal risk may be affected by unequal observation periods if cases and controls are not aligned according to time at risk. Temporally matched assessment windows therefore provide a useful framework for distinguishing changes associated with fall events from changes occurring during hospitalization more generally.
In this study, we analyzed routinely collected fall risk assessments and incident reports from a large tertiary care hospital using a matched case-control design with temporally aligned event and index assessments. We aimed to characterize changes in Hendrich II scores from admission to event or index time, determine whether risk trajectories differed between patients with and without inpatient falls, and identify the individual components associated with risk escalation. We additionally compared the discriminative performance of admission and event-time scores. By focusing on the evolution of risk rather than a single assessment, this study seeks to inform more responsive approaches to fall-risk monitoring and prevention during hospitalization.
2. Materials and Methods
2.1. Study Design and Setting
We conducted a retrospective matched case-control study using routinely collected inpatient data from Bumrungrad International Hospital, Bangkok, Thailand, between January 2021 and December 2025. The study characterized changes in Hendrich II fall risk during hospitalization, compared risk trajectories between patients with and without inpatient falls, and evaluated the individual components associated with fall risk at time points proximal to fall events.
2.2. Study Population and Matching
All adult inpatients who experienced a documented fall during hospitalization were included as cases. For each case, non-fall controls were selected from patients admitted on the same date, thereby controlling for calendar time and admission cohort effects.
To ensure temporal comparability, controls were required to have fall risk assessments recorded at both admission and a corresponding index time aligned with the event date of the case. This approach provided comparable observation windows from admission to the event or index time and enabled comparison of changes in risk over equivalent periods of hospitalization.
The design approximated risk-set (incidence density) sampling, whereby controls represented patients at risk at the time the corresponding fall occurred. Cases and controls were therefore drawn from the same underlying inpatient population with comparable opportunities for time-dependent exposure.
When multiple eligible controls were available within a matched stratum, controls were randomly sampled while preserving the matching structure. Matching was performed on admission date only; demographic and clinical variables were not used as matching criteria and were considered in subsequent analyses.
2.3. Variables and Measurements
Fall risk was assessed using the Hendrich II Fall Risk Model at two clinically relevant time points: admission and the event or matched index time. The model comprises weighted components including male sex, confusion or disorientation, symptomatic depression, altered elimination, dizziness or vertigo, use of antiepileptic medications, use of benzodiazepines or sedatives, and functional mobility assessed using the Get-Up-and-Go (GUG) test.
The GUG component was categorized into mutually exclusive levels corresponding to scores of 0, 1, 3, or 4. Total Hendrich II scores were calculated as the sum of the weighted components, with higher scores indicating greater fall risk.
In the study dataset, present risk factors were recorded using their corresponding weighted values, whereas absent components were coded as missing. For reconstruction of the Hendrich II score, these missing values were treated as zero, consistent with the data structure in which missing component values represented absence of the corresponding risk factor.
For cases, the event score was defined as the assessment recorded immediately before the fall. For controls, the corresponding score was obtained from the assessment recorded at the matched index time aligned with the event date of the corresponding case.
The primary measure of temporal change was ΔScore, calculated as the event or index score minus the admission score. Positive values indicated increasing Hendrich II risk during hospitalization, whereas negative values indicated decreasing risk. Individual Hendrich II components were also examined at admission and event or index time to characterize factors associated with differences in risk trajectories. Demographic variables included age, sex, and nationality.
2.4. Outcome
The primary outcome was the occurrence of an inpatient fall during hospitalization.
2.5. Statistical Analysis
Continuous variables are presented as means with standard deviations and categorical variables as counts and percentages. Between-group comparisons were performed using independent t tests for continuous variables and χ² tests for categorical variables.
Temporal change in fall risk was evaluated by comparing ΔScore between fall cases and controls. Logistic regression was used to estimate the association between ΔScore and inpatient falls. Multivariable logistic regression incorporating event-time Hendrich II components and demographic variables was used to identify factors independently associated with falls.
As a complementary analysis, receiver operating characteristic (ROC) curves were used to evaluate the discriminative performance of Hendrich II scores at admission and event or index time. Areas under the curve (AUCs) were estimated and compared, and optimal thresholds were determined using the Youden index.
Sensitivity analyses accounting for the matched design using conditional logistic regression were also performed. All statistical tests were two-sided, and p values < 0.05 were considered statistically significant.
2.6. Patient and Public Involvement
Patients and members of the public were not involved in the design, conduct, reporting, or dissemination of this study because it was based on retrospective analysis of de-identified data derived from routinely collected inpatient fall risk assessments and incident reports.
2.7. Data Quality Assurance
All Hendrich II scores were recalculated from component variables to ensure internal consistency. GUG categories were verified to be mutually exclusive within each assessment. Temporal alignment of admission and event or index assessments between cases and controls was confirmed before analysis.
3. Results
3.1. Baseline Characteristics and Evaluation of Fall Risk
A total of 10,407 inpatient encounters were included, comprising 276 fall cases and 10,131 controls (Table 1). Analyses of admission Hendrich II scores included 10,387 observations with complete data (257 falls and 10,130 controls), whereas event-time analyses were conducted in a temporally aligned subset of 2,621 observations (254 falls and 2,367 controls).
Patients who experienced falls were older than controls (62.6 ± 17.3 vs 51.7 ± 18.5 years, p < 0.001) and were more likely to be male (61.2% vs 44.7%, p < 0.001). The study population was internationally diverse, with Thai patients comprising the largest proportion (51.9%). Fall rates were generally low across most nationality groups, including Thai (1.6%), American (2.5%), Chinese (2.1%), and Myanmar (1.2%) patients. Patients from Qatar had a substantially higher observed fall rate (22.5%, p < 0.001).
At admission, fall cases already had higher Hendrich II scores than controls (6.66 ± 4.96 vs 3.27 ± 3.89, p < 0.001). By the event or matched index time, the between-group difference had widened substantially, with mean scores of 9.27 ± 5.61 among fall cases and 3.16 ± 3.74 among controls (p < 0.001). Thus, fall cases demonstrated both higher baseline risk and greater subsequent escalation in Hendrich II scores, whereas scores among controls remained comparatively stable.
3.2. Discriminative Performance of Admission and Event-Time Scores
Receiver operating characteristic (ROC) analysis was performed in the subset with complete data for both admission and event Hendrich II scores (n = 2,609). The admission score showed moderate discrimination (AUC, 0.724; 95% CI, 0.695–0.752) (Figure 1), whereas the event-time score demonstrated good discrimination (AUC, 0.831; 95% CI, 0.807–0.855). The difference between the 2 AUCs was statistically significant (χ² = 72.07, p < 0.001).
Using the Youden index, the optimal cutoff for the admission score was ≥4, corresponding to a sensitivity of 68.5% and specificity of 66.1%. For the event-time score, the optimal cutoff was ≥5, yielding a sensitivity of 78.7% and specificity of 71.9%.
Thus, the event-time assessment demonstrated greater discrimination than the admission assessment, consistent with the observed divergence in Hendrich II risk trajectories during hospitalization.
3.3. Changes in Individual Hendrich II Components
The distribution of individual Hendrich II components at admission and event or matched index time is presented in Table 2.
At admission, fall cases had a higher prevalence of confusion (11.6% vs 1.7%), antiepileptic medication use (10.1% vs 2.4%), and elimination problems (11.2% vs 6.2%) than controls (all p < 0.001). Dizziness (2.9% vs 3.0%, p = 0.92) and benzodiazepine use (24.3% vs 22.2%, p = 0.41) were similar between groups, whereas depression was uncommon overall.
Mobility status also differed at admission. Fall cases were less likely to have normal mobility (GUG 0; 11.9% vs 50.6%) and more likely to have impaired mobility, including GUG 1 (36.4% vs 24.3%) and GUG 3 (35.6% vs 16.1%) (p < 0.001).
At the event or matched index time, between-group differences were substantially larger across several components. Fall cases had higher prevalence of confusion (20.3% vs 0.5%), elimination problems (30.1% vs 1.7%), antiepileptic medication use (21.7% vs 0.6%), and benzodiazepine use (44.9% vs 5.4%) (all p < 0.001). Dizziness was also more frequent among fall cases (4.7% vs 0.6%, p < 0.001), whereas depression remained uncommon.
Mobility patterns also diverged at event or index time. Fall cases were more frequently classified as GUG 3 (55.6% vs 30.6%), whereas controls were more frequently classified as GUG 1 (28.9% vs 49.6%) (p < 0.001). The proportion classified as GUG 4 was similar between groups.
Overall, the case-control differences observed at admission widened by the event or index time, particularly for confusion, elimination problems, medication exposure, and mobility impairment. These component-level patterns accompanied the divergence in total Hendrich II scores during hospitalization.
3.4. Multivariable Analysis of Event-Time Fall Risk
In multivariable logistic regression analysis, several event-time factors were independently associated with inpatient falls (Table 3). Antiepileptic medication use showed the strongest association (odds ratio [OR], 6.83; 95% confidence interval [CI], 4.29–10.89; p < 0.001), followed by confusion (OR, 4.52; 95% CI, 2.73–7.49; p < 0.001) and elimination problems (OR, 2.86; 95% CI, 1.96–4.17; p < 0.001).
Mobility status was also associated with fall occurrence. Compared with patients with mild impairment (GUG 1), those with moderate impairment (GUG 3) had higher odds of falling (OR, 2.10; 95% CI, 1.47–3.02; p < 0.001), whereas severe impairment (GUG 4) was not significantly associated with higher odds of falling.
Male sex (OR, 1.77; p = 0.001) and increasing age (OR, 1.01 per year; p = 0.023) were also independently associated with falls. Benzodiazepine use (OR, 1.39; p = 0.054) and dizziness (OR, 1.98; p = 0.057) showed borderline associations but did not reach statistical significance.
Overall, antiepileptic medication use, confusion, elimination problems, and moderate mobility impairment showed the strongest independent associations with fall occurrence at the event or matched index time.
3.5. Change in Fall Risk over Time
Changes in Hendrich II scores between admission and event or matched index time (ΔScore) were evaluated in the temporally aligned subset with complete data (n = 2,609). Patients who experienced falls showed a marked increase in scores during hospitalization (mean ΔScore, +2.55 ± 5.11), whereas controls showed a slight decrease (−0.20 ± 1.48).
The between-group difference in ΔScore was statistically significant (mean difference, 2.76; 95% confidence interval [CI], 2.48–3.04; p < 0.001).
In logistic regression analysis, ΔScore was strongly associated with inpatient falls. Each 1-point increase in ΔScore was associated with a 69% increase in the odds of falling (odds ratio [OR], 1.69; 95% CI, 1.57–1.83; p < 0.001).
Overall, fall cases exhibited a substantially different risk trajectory from controls, characterized by progressive increases in Hendrich II scores rather than relative stability over the corresponding hospitalization period.
4. Discussion
In this matched case-control study, patients who experienced inpatient falls showed a distinct escalation in Hendrich II scores during hospitalization, whereas temporally aligned controls remained relatively stable. Each 1-point increase in ΔScore was associated with a 69% increase in the odds of falling, indicating that the trajectory of risk during hospitalization carries clinically relevant information beyond baseline assessment. Event-time Hendrich II scores also demonstrated better discrimination than admission scores, consistent with prior work showing that assessments closer to the fall event outperform admission-based measurements [4]. Rather than establishing the superiority of proximal assessment itself, our findings extend this literature by quantifying the magnitude of risk escalation and characterizing the component-level patterns associated with that divergence.
4.1. Dynamic Nature of Fall Risk
The marked divergence in Hendrich II scores between fall cases and controls indicates that inpatient fall risk evolves substantially over the course of hospitalization. Patients who experienced falls showed increasing scores from admission to the event, whereas controls remained stable or showed slight decreases over the corresponding observation period. The association between ΔScore and fall occurrence—an approximately 69% increase in the odds of falling for each 1-point increase—suggests that the direction and magnitude of change may provide information beyond the admission score alone.
These findings are consistent with prior evidence that fall risk is not static. Jung and Park showed that maximum and pre-event Hendrich II scores had greater predictive validity than admission scores [4]. Our study extends this observation by quantifying the longitudinal divergence between fall cases and temporally aligned controls, thereby distinguishing risk escalation associated with fall occurrence from changes that may occur during hospitalization more generally.
4.2. Factors Associated with Risk Escalation
The divergence in Hendrich II scores between fall cases and controls was accompanied by increasingly pronounced differences in several clinically relevant components at the event or matched index time. Confusion, elimination problems, and antiepileptic medication use showed the strongest independent associations with inpatient falls, whereas benzodiazepine use showed a borderline association after multivariable adjustment despite a substantial unadjusted difference between groups. These findings are consistent with previous studies identifying cognitive impairment and clinical instability as important correlates of inpatient falls [3].
The Hendrich II model incorporates both relatively stable characteristics and potentially time-varying clinical factors, including cognitive status, elimination, medication exposure, and functional mobility [1]. In our study, differences between fall cases and controls in several of these components were considerably greater at the event or index time than at admission. This pattern suggests that the divergence in total Hendrich II scores reflects clinically meaningful differences in patients’ evolving cognitive, pharmacological, elimination, and functional profiles during hospitalization.
Mobility showed a non-linear association with fall occurrence. Compared with mild impairment (GUG 1), moderate impairment (GUG 3) was associated with higher odds of falling, whereas severe impairment (GUG 4) was not independently associated with greater risk. One possible explanation is that patients with moderate impairment retain sufficient mobility to attempt ambulation while having inadequate stability, whereas those with severe impairment may be less exposed to unassisted mobility because of greater dependence on staff or mobility restrictions. This interpretation should be considered hypothesis-generating because assistance with ambulation and actual mobility exposure were not directly measured in this study.
4.3. Clinical Implications
These findings have several implications for inpatient fall prevention. First, the results support interpreting the Hendrich II score longitudinally rather than relying on the admission value alone. Repeated assessment is already incorporated into routine practice in many settings, including nursing reassessment during hospitalization [2]. Our findings suggest that greater attention should be paid not only to the absolute score at each assessment but also to the direction and magnitude of change over time.
Second, the optimal thresholds identified in this study (≥4 at admission and ≥5 at event time) are broadly consistent with previously reported cutoffs in the range of 4–5 [2,5,6]. However, the trajectory findings suggest that threshold-based classification alone may not fully capture evolving risk. A patient whose score rises substantially during hospitalization may warrant closer review even if the absolute score remains near a conventional cutoff.
Third, the component-level findings may help identify clinically relevant reasons for risk escalation. New or worsening confusion, elimination problems, medication exposure, and mobility impairment may prompt focused reassessment and preventive measures tailored to the patient’s changing condition. In practice, longitudinal Hendrich II information could potentially be incorporated into nursing workflows or electronic decision-support systems to highlight patients with rapidly increasing risk; however, the effectiveness of such trajectory-triggered interventions requires prospective evaluation.
4.4. Comparison with Existing Literature
Previous validation studies have generally reported moderate discrimination for admission-based use of the Hendrich II model, with AUC values of approximately 0.72–0.77 [2,3]. The admission-based performance observed in our study was consistent with this range. Event-time assessment achieved an AUC above 0.80, which is also consistent with prior evidence that maximum or pre-event Hendrich II scores outperform admission scores [4].
External validation studies have demonstrated variability in Hendrich II performance across populations and threshold definitions [5,6]. Our study adds to this literature by focusing on the trajectory of risk between admission and event or matched index time, rather than on proximal discrimination alone. By temporally aligning cases and controls, we quantified the divergence in Hendrich II scores over comparable observation windows and showed that increasing scores were strongly associated with fall occurrence.
These findings suggest that variation in Hendrich II performance across studies may reflect not only differences in patient populations and cutoff selection, but also the timing of assessment and the extent to which evolving clinical risk is captured.
4.5. Strengths and Limitations
This study has several strengths. The use of controls with temporally aligned event and index assessments approximated a risk-set sampling framework, improving comparability of observation windows and reducing bias arising from unequal time at risk. The availability of both admission and event or index assessments enabled direct evaluation of changes in Hendrich II scores over comparable periods of hospitalization. The relatively large overall sample provided greater statistical precision than many previous single-center validation studies [1,3,5]. In addition, component-level analyses and multivariable modeling allowed characterization of the clinical factors associated with divergence in fall-risk trajectories.
Several limitations warrant consideration. First, this was a single-center study conducted in a tertiary international hospital, and differences in patient case mix, nursing practices, fall-prevention protocols, and assessment frequency may limit generalizability to other settings [6]. Second, event-time analyses required Hendrich II assessments at both admission and the aligned event or index time and therefore included a substantially smaller subset of the overall cohort. The multivariable component analysis was further restricted to complete cases, potentially introducing selection bias if availability of repeated assessments was related to patients’ clinical condition or perceived fall risk.
Third, routinely collected clinical data are subject to measurement and documentation variability, particularly for clinical judgments such as confusion, elimination status, and mobility [3]. In addition, treating missing component values as absence of the corresponding risk factor depends on the underlying documentation structure; misclassification could occur if some missing values reflected lack of assessment rather than true absence.
Fourth, the event assessment for cases was obtained immediately before the fall. Although this temporal proximity is clinically relevant, it may enhance discrimination because the assessment captures deterioration already occurring close to the event. The present study therefore cannot establish how far in advance an increasing score can reliably identify impending falls or whether interventions triggered by ΔScore would prevent them.
Finally, residual confounding from unmeasured factors—including environmental hazards, staffing and supervision, mobility assistance, acute treatments, and other clinical changes—cannot be excluded. The observational design also precludes causal interpretation of the associations between individual Hendrich II components, score trajectories, and fall occurrence.
5. Conclusions
Inpatient fall risk is dynamic and may change substantially during hospitalization. Patients who experienced falls demonstrated increasing Hendrich II scores over time, whereas temporally aligned controls remained relatively stable. Differences in cognition, elimination status, medication exposure, and mobility accompanied this divergence in risk. These findings suggest that monitoring the trajectory of Hendrich II scores may provide clinically useful information beyond admission-based assessment alone. Prospective studies should evaluate whether trajectory-based monitoring and interventions triggered by increasing risk can reduce inpatient falls.
Author Contributions
Conceptualization, K.P. and J.T.; methodology, K.P.; software, N.N.; validation, K.P., N.N. and P.V.; formal analysis, J.T.; investigation, J.T.; resources, N.N.; data curation, P.T., L.N., J.T. and N.N.; writing—original draft preparation, K.P.; writing—review and editing, K.P., P.T., L.N., J.T., N.N., P.V. and P.L.; visualization, K.P.; supervision, P.V.; project administration, K.P. and P.L. All authors have read and agreed to the published version of the manuscript.
Funding
This research received no external funding.
Institutional Review Board Statement
This study used retrospective data derived from routinely collected inpatient fall risk assessments and fall incident reports as part of institutional quality and safety activities at Bumrungrad International Hospital. Data were extracted from hospital systems and de-identified before analysis, and no personally identifiable information was accessible to the investigators. The study protocol was reviewed and endorsed by the Bumrungrad Research Committee (BRC) in accordance with its Terms of Reference and was conducted under institutional policies governing the secondary use of de-identified routine clinical data for minimal-risk research.
Informed Consent Statement
Informed consent was not required for this study because it involved a retrospective analysis of de-identified, routinely collected data and did not involve direct interaction with or intervention involving individual participants.
Data Availability Statement
The data analyzed in this study are not publicly available because they were derived from routine clinical care and are subject to institutional data governance and privacy restrictions. De-identified data may be available from the corresponding author upon reasonable request, subject to approval by Bumrungrad International Hospital and applicable data-sharing regulations.
Conflicts of Interest
The authors declare no conflicts of interest.
Abbreviations
The following abbreviations are used in this manuscript:
| AUC | Area Under the Curve |
| BRC | Bumrungrad Research Committee |
| CI | Confidence Interval |
| GUG | Get-Up-and-Go |
| OR | Odds Ratio |
| ROC | Receiver Operating Characteristic |
References
- Hendrich, A.L.; Bender, P.S.; Nyhuis, A. Validation of the Hendrich II Fall Risk Model: a large concurrent case/control study of hospitalized patients. Appl. Nurs. Res. 2003, 16(1), 9–21. [Google Scholar] [CrossRef]
- Hendrich, A.L.; Bufalino, A.; Groves, C. Validation of the Hendrich II Fall Risk Model: The imperative to reduce modifiable risk factors. Appl. Nurs. Res. 2020, 53, 151243. [Google Scholar] [CrossRef] [PubMed]
- Ivziku, D.; Matarese, M.; Pedone, C. Predictive validity of the Hendrich fall risk model II in an acute geriatric unit. Int. J. Nurs. Stud. 2011, 48(4), 468–74. [Google Scholar] [CrossRef] [PubMed]
- Jung, H.; Park, H.A. Testing the Predictive Validity of the Hendrich II Fall Risk Model. West J. Nurs. Res. 2018, 40(12), 1785–99. [Google Scholar] [CrossRef] [PubMed]
- Zhang, C.; Wu, X.; Lin, S.; Jia, Z.; Cao, J. Evaluation of Reliability and Validity of the Hendrich II Fall Risk Model in a Chinese Hospital Population. PLoS ONE 2015, 10(11), e0142395. [Google Scholar] [CrossRef] [PubMed]
- Hu, C.Y.; Sun, L.C.; Lin, M.Y.; Chen, M.H.; Hsu, H.T. Validating the accuracy of the Hendrich II Fall Risk Model for hospitalized patients using the ROC curve analysis. Kaohsiung J. Med. Sci. 2024, 40(4), 404–12. [Google Scholar] [CrossRef] [PubMed]
Figure 1.
Improved discrimination of event vs admission Hendrich II scores for inpatient fall risk.
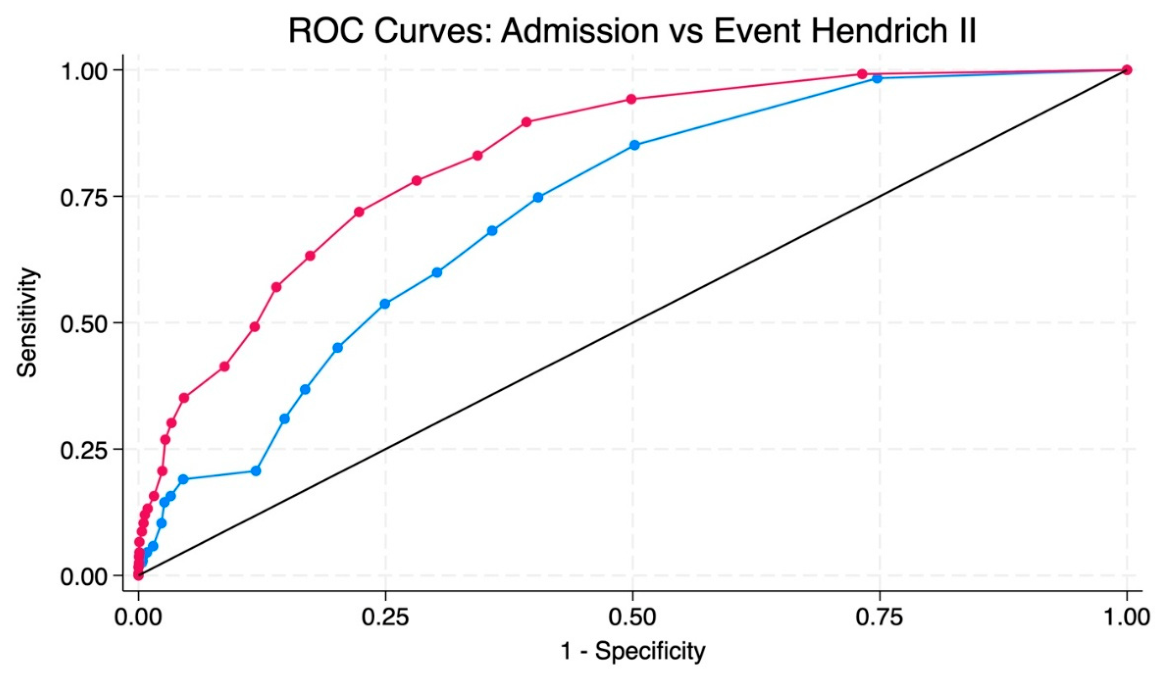

Table 1.
Characteristics of the Study Population.
| CHARACTERISTIC | OVERALL | FALL | CONTROL | P-VALUE |
| N (ADMISSION ANALYSIS) | 10,387 | 257 | 10,130 | — |
| AGE (YEARS) | 51.95 ± 18.51 | 62.61 ± 17.29 | 51.66 ± 18.46 | <0.001 |
| MALE (%) | 45.10% | 61.20% | 44.70% | <0.001 |
| NATIONALITY (%) | <0.001* | |||
| THAI | 51.90% | 31.20% | 52.50% | |
| MYANMAR | 6.60% | 2.90% | 6.70% | |
| AMERICAN | 5.80% | 5.40% | 5.80% | |
| QATARI | 3.30% | 28.30% | 2.70% | |
| BANGLADESHI | 3.30% | 2.90% | 3.30% | |
| CAMBODIAN | 3.80% | 1.10% | 3.90% | |
| CHINESE | 2.70% | 2.20% | 2.70% | |
| BRITISH | 2.10% | 1.10% | 2.10% | |
| OTHERS | 24.50% | 25.00% | 24.30% | |
| ADMIT HENDRICH II SCORE | 3.35 ± 3.96 | 6.66 ± 4.96 | 3.27 ± 3.89 | <0.001 |
| N (EVENT ANALYSIS) | 2621 | 254 | 2367 | — |
| EVENT HENDRICH II SCORE | 3.75 ± 4.35 | 9.27 ± 5.61 | 3.16 ± 3.74 | <0.001 |
Values are presented as mean ± standard deviation or percentage (%), as appropriate. Comparisons between fall and control groups were performed using two-sample t-tests for continuous variables and chi-square tests for categorical variables. Analyses of admission Hendrich II scores were restricted to observations with complete data, while event-time analyses were conducted in a matched subset with aligned event or index assessments. The event time was defined as the time of fall for cases and the corresponding matched index time for controls.
Table 2.
Components of the Henrich II score at admission and event time.
| VARIABLE | OVERALL (%) | FALL (%) | CONTROL (%) | P-VALUE |
| ADMISSION COMPONENTS | ||||
| CONFUSION | 2 | 11.6 | 1.7 | <0.001 |
| DEPRESSION | 0.3 | 1.5 | 0.3 | <0.001 |
| ELIMINATION (INCONTINENCE) | 6.4 | 11.2 | 6.2 | <0.001 |
| DIZZINESS | 3 | 2.9 | 3 | 0.92 |
| ANTIEPILEPTIC USE | 2.6 | 10.1 | 2.4 | <0.001 |
| BENZODIAZEPINE USE | 22.3 | 24.3 | 22.2 | 0.41 |
| ADMISSION GUG | <0.001 | |||
| 0 (NORMAL) | 49.6 | 11.9 | 50.6 | |
| 1 (MILD IMPAIRMENT) | 24.6 | 36.4 | 24.3 | |
| 3 (MODERATE IMPAIRMENT) | 16.6 | 35.6 | 16.1 | |
| 4 (SEVERE IMPAIRMENT) | 9.2 | 16.2 | 9 | |
| EVENT COMPONENTS | ||||
| CONFUSION | 1 | 20.3 | 0.5 | <0.001 |
| DEPRESSION | 0.1 | 1.8 | 0.1 | <0.001 |
| ELIMINATION (INCONTINENCE) | 2.4 | 30.1 | 1.7 | <0.001 |
| DIZZINESS | 0.7 | 4.7 | 0.6 | <0.001 |
| ANTIEPILEPTIC USE | 1.2 | 21.7 | 0.6 | <0.001 |
| BENZODIAZEPINE USE | 6.5 | 44.9 | 5.4 | <0.001 |
| EVENT GUG | <0.001 | |||
| 1 (MILD IMPAIRMENT) | 46.2 | 28.9 | 49.6 | |
| 3 (MODERATE IMPAIRMENT) | 34.7 | 55.6 | 30.6 | |
| 4 (SEVERE IMPAIRMENT) | 19.1 | 15.5 | 19.8 |
Values are presented as column percentages (%). P-values were derived from chi-square tests comparing fall and control groups. Admission and event components were defined based on assessments recorded at admission and at the event or matched index time, respectively. Event-time analyses were conducted in a matched subset with variable-specific completeness. The Get-Up-and-Go (GUG) categories represent mutually exclusive levels of mobility impairment.
Table 3.
Multivariable logistic regression analysis of factors associated with inpatient falls.
| VARIABLE | ODDS RATIO (OR) | 95% CI | P-VALUE |
| AGE (PER YEAR) | 1.01 | 1.00 – 1.02 | 0.023 |
| MALE SEX | 1.77 | 1.28 – 2.45 | 0.001 |
| EVENT GUG | |||
| 1 (MILD IMPAIRMENT) | Reference | — | — |
| 3 (MODERATE IMPAIRMENT) | 2.1 | 1.47 – 3.02 | <0.001 |
| 4 (SEVERE IMPAIRMENT) | 0.62 | 0.37 – 1.06 | 0.08 |
| CONFUSION | 4.52 | 2.73 – 7.49 | <0.001 |
| ELIMINATION (INCONTINENCE) | 2.86 | 1.96 – 4.17 | <0.001 |
| ANTIEPILEPTIC USE | 6.83 | 4.29 – 10.89 | <0.001 |
| BENZODIAZEPINE USE | 1.39 | 0.99 – 1.94 | 0.054 |
| DIZZINESS | 1.98 | 0.98 – 4.00 | 0.057 |
Odds ratios (ORs) and 95% confidence intervals (CIs) were estimated using multivariable logistic regression, adjusted for age, sex, event GUG category, and event-time Hendrich II components. The reference category for mobility was GUG 1 (mild impairment). Event-time variables were defined as measurements recorded at the fall event for cases and the matched index time for controls. Analyses were restricted to the matched subset with complete data (n = 1,399). A p-value < 0.05 was considered statistically significant.
Disclaimer/Publisher’s Note: The statements, opinions and data contained in all publications are solely those of the individual author(s) and contributor(s) and not of MDPI and/or the editor(s). MDPI and/or the editor(s) disclaim responsibility for any injury to people or property resulting from any ideas, methods, instructions or products referred to in the content. |
© 2026 by the authors. Licensee MDPI, Basel, Switzerland. This article is an open access article distributed under the terms and conditions of the Creative Commons Attribution (CC BY) license (http://creativecommons.org/licenses/by/4.0/).
Copyright: This open access article is published under a Creative Commons CC BY 4.0 license, which permit the free download, distribution, and reuse, provided that the author and preprint are cited in any reuse.