

Submitted:
05 September 2026
Posted:
10 September 2026
You are already at the latest version
Abstract
Liver regeneration is critical determinant of survival following acetaminophen (APAP) overdose, is driven primarily by proliferation of surviving hepatocytes. Hepatic progenitor cells (HPCs) are bipotential cells activated when hepatocyte proliferation is impaired. Contribution of HPCs to liver regeneration after APAP overdose remains unclear. This study investigated the contribution of HPCs to hepatocyte repopulation after severe APAP overdose using lineage tracing mouse models. Two-month-old male C57BL/6J mice were fasted overnight and then administered a 600 mg/kg overdose of APAP (600APAP). For lineage tracing, male ROSAmT-mG mice were injected with AAV8-TBG-Cre to label hepatocytes. Two weeks after AAV administration, mice were fasted overnight and then administered a 600 mg/kg overdose of APAP. Liver and blood samples were collected multiple times. C57BL/6J mice treated with severe acetaminophen overdose (600APAP) show substantial liver injury, with peak serum ALT and hepatic necrosis at 72 h, followed by progressive recovery. HPC activation was evidenced by increased expression of EpCAM, A6, and CK19 during recovery phase. APAP administration to ROSAmT-mG mice induced liver injury and subsequent regeneration and recovery comparable to wild type mice. Detection of HNF4α/tdTomato double-positive cells, hepatocytes originating from HPCs, were detected after injury but represented only 0.3–0.6% of total hepatocytes. Taken together, this study indicates that despite an increase of HPCs markers, lineage tracing model demonstrate that HPCs transdifferentiation contribute minimally to hepatocyte replenishment following severe APAP-induced liver injury.
Keywords:
hepatic progenitor cells
; liver regeneration
; acetaminophen
1. Introduction
Liver regeneration is a remarkable process that permits the liver to replenish dead tissue after surgical resection, chemical injury and dietary stress [1,2,3]. At the center of liver regeneration is proliferation of parenchymal (hepatocytes) as well as non-parenchymal cells, which restore the liver mass, architecture, and function [1,2,3]. Hepatic progenitor cells (HPCs), also referred to as liver progenitor cells (LPCs) or oval cells in rodents, are bipotential epithelial cells capable of differentiating into both hepatocytes and cholangiocytes [4,5]. These cells reside within the canals of Hering and periportal regions, where they remain quiescent during homeostasis but can be activated in response to severe liver injury [4,5,6]. The activation of HPCs is a characteristic of chronic liver diseases. HPCs contribute to liver regeneration when the proliferative capacity of mature hepatocytes is impaired or insufficient to restore liver function [4,5,7].
Acetaminophen (APAP) overdose is the leading cause of acute liver failure (ALF) in the United States [8,9,10]. Extensive studies have shown that liver regeneration plays a critical role in survival after APAP overdose [11,12,13,14]. APAP induced acute liver injury results in necrotic cell death, which is followed by liver regeneration and recovery in a dose dependent manner [15]. Following moderate overdose, liver undergoes regeneration characterized by timely and effective hepatocytes proliferation where dead cells are replaced predominantly by proliferation of surviving hepatocytes [11,15]. However, following severe overdose, liver regeneration is delayed and inhibited, resulting in progression of liver injury and acute liver failure [15]. Studies have shown that in mice regenerative response to APAP overdose is dose-dependent [15,16]. Following administration of 300 mg/kg APAP, liver regeneration and recovery occur, while 600 mg/kg APAP treatment results in impaired regeneration, ALF, and mortality [11,15,16].
Previous studies have shown that following chronic or severe injury, liver regeneration is inhibited leading to HPC activation, proliferation and transdifferentiation into hepatocytes [5,17,18]. However, the contribution of HPCs to liver regeneration after APAP overdose has not been evaluated in detail. In this study, we analyzed the contribution of HPCs to hepatocyte replacement after a severe APAP overdose (600 mg/kg). Our results describe an increase in the HPCs markers; however, the transdifferentiation of HPCs into hepatocyte during liver recovery is limited.
2. Materials and Methods
2.1. Animals, Treatments, and Tissue Collection
All animal procedures were conducted according to the protocols approved by the Institutional Animal Care and Use Committee (IACUC) of the University of Kansas Medical Center (KUMC), in compliance with the ARRIVE guidelines. Mice were maintained in AAALAC-accredited facilities under a standard 12-hour light/dark cycle with ad libitum access to chow and water. 8-week-old males C57BL/6J mice (Strain #000664, The Jackson Laboratory) were fasted overnight and injected intraperitoneally with 600 mg/kg of body weight of APAP (Sigma, St. Louis, MO) dissolved in warm 0.9% saline. 8-week-old males B6.129(Cg)-Gt(ROSA)26Sortm4(ACTB-tdTomato,-EGFP)Luo/J (ROSAmT-mG mice; Strain #007676, The Jackson Laboratory) received a single intraperitoneal injection of AAV8-TBG-Cre (2×10¹¹ genome copies [GC]/mouse, VB1724, Vector Biolabs). Two weeks later, mice were fasted overnight and injected intraperitoneally with 600 mg/kg of APAP. Liver and blood samples were collected post-euthanasia at multiple time points after APAP overdose.
2.2. Biochemical Measurements
Serum alanine aminotransferase (ALT) activity was quantified using the ALT (SGPT) Liquid Reagents (A7526-625, Pointe Scientific) following the manufacturer’s instructions.
2.3. Histology and Immunohistochemistry
Formalin-fixed paraffin-embedded liver sections (5 µm thick) were used for hematoxylin and eosin (H&E) staining [19]. Immunohistochemistry was performed on 5-µm paraffin-embedded liver sections. Antigen retrieval was conducted in boiling citrate buffer (pH 6.0) for 30 min. Sections were blocked with 5% normal goat serum (005-000-121, Jackson ImmunoResearch Inc) for 1 h at room temperature and incubated overnight at 4 °C with primary antibodies (Table 1). Then incubation with biotinylated secondary antibodies (Table 1) for 30 min at room temperature, staining was developed using the VECTASTAIN Elite ABC-HRP Kit (PK-4000, Vector Laboratories, Newark, CA, USA), ImmPACT DAB Substrate (SK-4105, Vector Laboratories), and ImmPACT VIP Substrate (SK-4605, Vector Laboratories). Slides were counterstained with hematoxylin (GHS316, Sigma-Aldrich, Lenexa, KS, USA). Images were acquired using an Olympus DP74 color camera mounted on an Olympus BX51 microscope and analyzed with CellSens software (v2.3). CK19 quantification was performed on 200× magnification images, and positive cells were manually quantified using the Counting Panel tool from QuPath (version 0.7.0).
2.4. Immunofluorescence
Frozen OCT-embedded liver sections (5 µm thick) were fixed using 10% formalin for 10 min and then permeabilized in 0.1% Triton X-100 during 15 min later PBS was used to wash 3 times. The liver sections were blocked in 10% normal serum (donkey or goat 017-000-121, 005-000-121, Jackson Immuno Research Inc) in PBS for 1 hour at room temperature. The primary antibodies described in Table 2 were incubated at 4 °C overnight. PBS was used to wash 3 times and the fluorophore-conjugated secondary antibodies described in Table 2 were added and incubated for 1 hour at room temperature. Finally, Mounting Medium without DAPI (H-1700-2, Vector Laboratories) were added or Mounting Medium with DAPI (H-1200-10, Vector Laboratories) to visualize the nucleus were added to cover the slide. Photomicrographs were captured using an Olympus DP74 color camera mounted on an Olympus BX51 microscope with CellSens (Version 2.3) software. Quantification of A6- and EpCAM-positive cells was performed on 200× images using QuPath (v0.7.0). Cell segmentation was based on nuclear detection in the DAPI channel using the Cell Detection tool, with cell boundaries estimated by simulated cell expansion (10–20 µm). Independent single-measurement object classifiers were generated for each marker. Cells were classified according to the mean intensity of the green channel (Cy2) for A6 and EpCAM, with positivity thresholds empirically determined by visual inspection. For tdTomato reporter experiments, tdTomato- and HNF4α-positive cells were manually quantified using the Counting Panel tool from QuPath (version 0.7.0).
2.5. Statistical Analysis
Data shown as mean ± standard error of the mean (SEM) in bar graphs and result descriptions. Statistical analysis and graph generation were made using GraphPad Prism 10. All experiments were conducted with 3-5 mice per group. Comparisons between groups were conducted using unpaired Student’s T-test or one-way ANOVA, as appropriate. A p-value < 0.05 was considered statistically significant.
3. Results
3.1. APAP Overdose Induces Severe Liver Injury
We treated the C57BL6/J (wild type) mice with an overdose of 600 mg/kg of APAP (600APAP). Liver tissue and serum were collected to assess injury in a timeline manner (Figure 1A). At 120 h, we observed 33% survival after 600APAP (Figure 1B). Surviving mice exhibited significant liver injury as demonstrated by elevated serum ALT levels at 72 h after the APAP overdose, which rapidly declined at the baseline at 96 h and 120h (Figure 1C). Consistent with these findings, histological analysis by H&E staining revealed 25.92 ± 4.6% hepatic necrosis at 72 h (Figure 1D and E). Necrotic areas decreased to 9.8 ± 3.16% at 96 h and at 120 h after 600APAP the liver tissue is almost recovered (2.79 ± 2.19% of necrotic areas) (Figure 1D and E). These results show that 600APAP causes hepatic injury, followed by liver recovery at later time points.
3.2. Hepatic Progenitor Cells Markers Are Increased After Severe APAP Overdose
When hepatocytes are unable to restore liver function, hepatic progenitor cells (HPCs) are activated to support liver regeneration. To confirm HPC activation after APAP overdose, we assessed the expression of the HPCs markers EpCAM and A6 by immunofluorescence, and Cytokeratin 19 (CK19) using immunohistochemistry over time. EpCAM-positive cells increased to 115.11 ± 11.39 cells per field in the periportal region by 72 h and returned to baseline levels (54 ± 7.36 cells per field) by 96 h and 120 h after 600APAP (Figure 2). Similarly, A6-positive cells increase from 24.22 ± 0.89 positive cells at baseline to 78.83 ± 8.57 cells per field at 72 h after 600APAP and remain elevated through 120 h (Figure 3).
We performed the double immunohistochemical analysis of CK19, marker for biliary epithelial cells, HPCs, and HNF4α markers for hepatocyte. Dual staining shows nuclear HNF4α in brown and cytoplasmic CK19 in purple (Figure 4A). Non-treated animals (0 h) exhibit CK19 expression restricted to the biliary ducts. However, after acute injury by 600APAP, its expression increases and extends into the sinusoids, presenting as elongated cells. CK19 expression is significantly increased, from 35.11 ± 10.33 positive cells at baseline to 111.11 ± 14.86 positive cells by 96 h post-APAP, and this elevated level is maintained by 120 h after 600APAP. CK19/HNF4α double-positive cells were not found. Together, the increased expression of EpCAM, A6 and CK19 demonstrate HPCs activation and expansion after severe APAP overdose.
3.3. Hepatic Progenitor Cells Have a Minimal Transdifferentiation to Hepatocyte During Liver Recovery After Severe APAP Overdose
Studies in C57BL/6J mice using severe APAP overdose showed significant activation of HPCs in surviving mice. However, it is not clear whether these HPCs transdifferentiate into hepatocytes and contribute to liver regeneration. To determine the contribution of HPCs to hepatocyte repopulation during liver regeneration after APAP-induced acute liver injury, we used a lineage-tracing approach. As described before, ROSAmT-mG mice are treated with AAV8-TBG-Cre, which induces Cre-mediated excision of the tdTomato cassette and force permanent expression of membrane-targeted GFP (mGFP) specifically in the hepatocytes, while non-parenchymal cells remain tdTomato-positive [20]. The hepatocytes express mGFP (green fluorescence), while the non-parenchymal cells express tdTomato (red fluorescence) allowing tracing these cells.
Next, the ROSAmT-mG mice were treated with 600APAP, and liver tissue and serum were collected to evaluate injury at multiple time points (Figure 5A). We observed that 34% of the mice survive after 120 h, similar survival to wild type mice (Figure 1B). Serum ALT levels increased to 2442.96 ± 525.51 U/L at 72 h after 600APAP and decreased to 96 h and 120h (Figure 5B). Histological analysis showed 24.53 ± 8.94% necrotic area at 72 h (Figure 5C and D). Necrosis decreased to 12.6 ± 6.33% at 96 h and was nearly resolved by 120 h after 600APAP, with only 1.4 ± 0.24% necrotic area remaining (Figure 5C and D). These results demonstrate that 600APAP induces comparable liver injury in ROSAmT-mG mice and C57BL/6J mice. To determine the percentage of HPCs that transdifferentiated into hepatocyte following severe APAP-induced liver injury, we performed immunofluorescence staining for the hepatocyte marker HNF4α. HPC-derived transdifferentiated hepatocytes were identified by the co-expression of HNF4α and tdTomato. HNF4α/tdTomato double-positive cells increased to 0.45% of total HNF4α-positive hepatocytes at 72 h post-APAP, decreased to 0.28% at 96 h, and at 120 h we found 0.41% (Figure 6). Despite this increase, HPC-derived hepatocytes contributed minimally to hepatocyte replenishment, representing only ~3-6 cells per 200x field relative to the total HNF4α-positive hepatocyte population after APAP-induced liver injury.
4. Discussion
The liver is well known for its exceptional regenerative capacity [3,11,21]. Liver regeneration is conducted by proliferation of remaining hepatocytes followed by nonparenchymal cells [1,21]. However, during severe liver injury, either due to progressive diseases or massive loss of hepatocytes due to chemical exposure, ability of liver to regenerate fails [5,15]. In these cases, hepatic progenitor cells are activated, undergo proliferation and then differentiation into hepatocytes [4,5,17,22]. However, most studies indicate that HPCs make only a limited contribution to hepatocyte replenishment during liver regeneration [23,24,25].
Previous studies have investigated activation of HPCs after APAP-induced liver injury [26] but whether the activated and proliferating HPCs contribute to regeneration by undergoing transdifferentiation has not been studied [27]. Our study corroborated previous results and showed increased expression of markers such as EpCAM, A6, and CK19 after severe APAP overdose, which indicates activation and expansion of HPCs after liver injury. However, lineage tracing using the ROSAmT-mG mice revealed that HPC-derived hepatocytes represented less than 1% of the total hepatocyte population.
Our observation of periportal HPC activation after APAP overdose is consistent with Kofman et al. (2005), who described a dose- and time-dependent oval cell reaction confined to the smallest portal tracts, consistent with derivation from the canals of Hering [26]. EpCAM is a marker of immature hepatic progenitors and biliary epithelial cells, reflecting early progenitor activation [28]. A6 identifies reactive ductular cells and activated progenitors [22], whereas CK19 is a cholangiocyte marker that increases during the ductular reaction [22]. CK19+ elongated cells extending from biliary ducts into sinusoids that we observed are characteristic of the ductular reaction, a phenomenon widely associated with HPC activation across injury models [29,30]. Similar HPCs reactions have been identified after sublethal APAP doses in mice and in APAP-induced ALF patients with severe necrosis [6,26]. Additionally, the transient increase in EpCAM and sustained A6 and CK19 expression is associated with HPC proliferation rather than cell transdifferentiation to hepatocytes, suggesting roles beyond hepatocyte replacement.
Multiple studies have shown the role of hepatocytes in liver recovery during APAP-induced liver injury [11,13,15,31,32]. For example, increased PCNA, Ki67 and BrdU staining show hepatocyte proliferation surrounding the necrotic area beginning at 12-24 h post APAP [31,33,34]. scRNA-seq and spatial transcriptomics have identified proliferating hepatocytes as a distinct population that emerges in a zonal and time-dependent pattern after APAP injury [35]. Additionally, a study combining snRNA-seq, spatial profiling, and 4D intravital imaging identified ANXA2+ migratory hepatocytes as mediators of the closure of the necrotic area [35].
The minimal HPCs to hepatocyte transdifferentiation we observed, aligns with accumulating lineage-tracing evidence that progenitor contribution to hepatocyte regeneration is limited, particularly in acute liver injury [23,24,25]. Clonal labeling of Sox9+ ductal progenitors across multiple oval cell injury models (CDE, DDC, CCl4) has demonstrated <1% contribution to the hepatocyte pool, with hepatocyte chimera models confirming that non-parenchymal-derived hepatocytes remain below ~1% and are not required for survival or liver function [23]. Complementary fate-tracing studies have demonstrated that hepatocyte self-duplication, rather than progenitor cell differentiation, is the predominant regenerative mechanism in these models [24,25].
Acute liver injury and subsequent acute liver failure following APAP overdose are hyperactive clinical phenomena, which occur extremely fast, 3 to 96 h post-overdose from initiation of injury to resolution of injury in mice [36], and from approximately 12 h to 10 days in humans [37]. The rapid progression and resolution of APAP-induced liver injury may limit the time required for HPC to transdifferentiate to hepatocyte, which is more commonly observed during chronic liver injury. Further, the limited transdifferentiation observed after APAP overdose may also reflect the spatial organization of liver injury. APAP causes centrilobular necrosis [38], whereas HPCs reside within the periportal canals of Hering [6]. This anatomical separation and the rapid regenerative response of surviving hepatocytes limit the migration and differentiation of HPCs into injured regions. In contrast, chronic liver diseases generate sustained cell cycle arrest, inflammation and tissue remodeling that favor progenitor expansion and migration of HPCs in these models [39,40].
Whereas HPCs do not meaningfully replace hepatocytes, their activation may serve as alternative functions. The ductular reaction is increasingly recognized as paracrine signaling process [41,42]. The CK19+ sinusoidal cells we observed may contribute to the secretion of cytokines and chemokines that modulate inflammatory cell recruitment and hepatocyte proliferation [41,42]. Thus, HPC activation may represent a default response to severe injury, increasing with damage regardless of hepatocyte regenerative capacity [43,44]. Notably, cells expressing progenitor markers during injury may arise from dedifferentiation of mature hepatocytes or biliary epithelial cells rather than from a distinct stem cell niche [27,41].
Several limitations of our study should be acknowledged. Although EpCAM, A6, and CK19 are established HPC markers, none of them are completely specific, and they can also label mature cholangiocytes, ductular reaction cells, or reprogrammed hepatocytes [5,27,45]. This marker overlap complicates the design of lineage-tracing strategies aimed at capturing HPCs specifically. In addition, analysis after APAP overdose following 600 mg/kg dose is subject to survival bias, as only mice with favorable outcomes survived for evaluation. Therefore, the contribution of HPCs to non-surviving mice with more severe injury and impaired regeneration remains unknown. Overall, our findings demonstrate that severe APAP overdose induces HPC response and expansion; however, this activation contributes minimally to hepatocyte repopulation.
Supplementary Materials
The following supporting information can be downloaded at the website of this paper posted on Preprints.org.
Author Contributions
Conceptualization, Udayan Apte; Methodology, Diego Paine Cabrera, Giselle Sanchez-Guerrero, Dakota Robarts, Manasi Kotulkar and Udayan Apte; Investigation, Udayan Apte; Data curation, Diego Paine Cabrera; Writing—original draft, Diego Paine Cabrera, Giselle Sanchez-Guerrero and Udayan Apte; Writing—review & editing, Diego Paine Cabrera; Supervision, Udayan Apte. All authors have read and agreed to the published version of the manuscript.
Funding
Supported by NIH R01DK98414.
Institutional Review Board Statement
The animal study protocol was approved by the Institutional Animal Care and Use Committee (IACUC) of the University of Kansas Medical Center (protocol code IPROTO-23-09-346 and 13 March 2025).
Informed Consent Statement
Not applicable.
Conflicts of Interest
The authors reported no conflicts of interest.
References
- Michalopoulos, G.K. Principles of liver regeneration and growth homeostasis. Compr. Physiol. 2013, 3(1), 485–513. [Google Scholar] [CrossRef]
- Pu, W.; Zhou, B. Hepatocyte generation in liver homeostasis, repair, and regeneration. Cell Regen. 2022, 11(1), 2. [Google Scholar] [CrossRef] [PubMed]
- Michalopoulos, G.K.; Bhushan, B. Liver regeneration: biological and pathological mechanisms and implications. Nat. Rev. Gastroenterol. Hepatol. 2021, 18(1), 40–55. [Google Scholar] [CrossRef] [PubMed]
- Michalopoulos, G.K.; Khan, Z. Liver Stem Cells: Experimental Findings and Implications for Human Liver Disease. Gastroenterology 2015, 149(4), 876–882. [Google Scholar] [CrossRef] [PubMed]
- So, J.; et al. Liver progenitor cell-driven liver regeneration. Exp. Mol. Med. 2020, 52(8), 1230–1238. [Google Scholar] [CrossRef] [PubMed]
- Kuwahara, R.; et al. The hepatic stem cell niche: identification by label-retaining cell assay. Hepatology 2008, 47(6), 1994–2002. [Google Scholar] [CrossRef] [PubMed]
- Bria, A.; et al. Hepatic progenitor cell activation in liver repair. Liver Res. 2017, 1(2), 81–87. [Google Scholar] [CrossRef] [PubMed]
- Stravitz, R.T.; et al. Future directions in acute liver failure. Hepatology 2023, 78(4), 1266–1289. [Google Scholar] [CrossRef] [PubMed]
- Centers, A.s.P., U.S. Poison Centers Report No National Increase in Acetaminophen Exposures. 2025.
- Towers, E.B.; et al. Xenobiotic-Induced Liver Injury in the United States: A 25-Year Retrospective Analysis of National Poison Data System. Clin. Gastroenterol. Hepatol. 2026. [Google Scholar] [CrossRef] [PubMed]
- Bhushan, B.; Apte, U. Regeneration and Recovery after Acetaminophen Hepatotoxicity. Livers 2023, 3(2), 300–309. [Google Scholar] [PubMed]
- Bhushan, B.; et al. Dual Role of Epidermal Growth Factor Receptor in Liver Injury and Regeneration after Acetaminophen Overdose in Mice. Toxicol. Sci. 2017, 155(2), 363–378. [Google Scholar] [CrossRef] [PubMed]
- Kotulkar, M.; et al. Role of HNF4alpha-cMyc interaction in liver regeneration and recovery after acetaminophen-induced acute liver injury. Hepatology 2023, 78(4), 1106–1117. [Google Scholar] [CrossRef] [PubMed]
- Schmidt, L.E.; Dalhoff, K. Alpha-fetoprotein is a predictor of outcome in acetaminophen-induced liver injury. Hepatology 2005, 41(1), 26–31. [Google Scholar] [CrossRef] [PubMed]
- Bhushan, B.; et al. Pro-regenerative signaling after acetaminophen-induced acute liver injury in mice identified using a novel incremental dose model. Am. J. Pathol. 2014, 184(11), 3013–25. [Google Scholar] [CrossRef] [PubMed]
- Borude, P.; Bhushan, B.; Apte, U. DNA Damage Response Regulates Initiation of Liver Regeneration Following Acetaminophen Overdose. Gene Expr. 2018, 18(2), 115–123. [Google Scholar] [CrossRef] [PubMed]
- Pu, W.; et al. Bipotent transitional liver progenitor cells contribute to liver regeneration. Nat. Genet 2023, 55(4), 651–664. [Google Scholar] [CrossRef] [PubMed]
- Raven, A.; et al. Cholangiocytes act as facultative liver stem cells during impaired hepatocyte regeneration. Nature 2017, 547(7663), 350–354. [Google Scholar] [CrossRef] [PubMed]
- Fischer, A.H.; et al. Hematoxylin and eosin staining of tissue and cell sections. CSH Protoc. 2008, 2008, pdb prot4986. [Google Scholar] [PubMed]
- Muzumdar, M.D.; et al. A global double-fluorescent Cre reporter mouse. Genesis 2007, 45(9), 593–605. [Google Scholar] [CrossRef] [PubMed]
- Fausto, N.; Campbell, J.S.; Riehle, K.J. Liver regeneration. Hepatology 2006, 43 (2 Suppl 1), S45–53. [Google Scholar] [CrossRef] [PubMed]
- Kohn-Gaone, J.; et al. The role of liver progenitor cells during liver regeneration, fibrogenesis, and carcinogenesis. Am. J. Physiol. Gastrointest. Liver Physiol. 2016, 310(3), G143–54. [Google Scholar] [CrossRef] [PubMed]
- Tarlow, B.D.; Finegold, M.J.; Grompe, M. Clonal tracing of Sox9+ liver progenitors in mouse oval cell injury. Hepatology 2014, 60(1), 278–89. [Google Scholar] [CrossRef] [PubMed]
- Yanger, K.; et al. Adult hepatocytes are generated by self-duplication rather than stem cell differentiation. Cell Stem Cell 2014, 15(3), 340–349. [Google Scholar] [CrossRef] [PubMed]
- Malato, Y.; et al. Fate tracing of mature hepatocytes in mouse liver homeostasis and regeneration. J. Clin. Invest 2011, 121(12), 4850–60. [Google Scholar] [CrossRef] [PubMed]
- Kofman, A.V.; et al. Dose- and time-dependent oval cell reaction in acetaminophen-induced murine liver injury. Hepatology 2005, 41(6), 1252–61. [Google Scholar] [CrossRef] [PubMed]
- Ko, S.; et al. Liver Progenitors and Adult Cell Plasticity in Hepatic Injury and Repair: Knowns and Unknowns. Annu Rev. Pathol. 2020, 15, 23–50. [Google Scholar] [CrossRef] [PubMed]
- Dolle, L.; et al. EpCAM and the biology of hepatic stem/progenitor cells. Am. J. Physiol. Gastrointest. Liver Physiol. 2015, 308(4), G233–50. [Google Scholar] [CrossRef] [PubMed]
- Tan, J.; et al. Immunohistochemical evidence for hepatic progenitor cells in liver diseases. Liver 2002, 22(5), 365–73. [Google Scholar] [CrossRef] [PubMed]
- Kohn-Gaone, J.; et al. Divergent Inflammatory, Fibrogenic, and Liver Progenitor Cell Dynamics in Two Common Mouse Models of Chronic Liver Injury. Am. J. Pathol. 2016, 186(7), 1762–1774. [Google Scholar] [CrossRef] [PubMed]
- Ben-Moshe, S.; et al. The spatiotemporal program of zonal liver regeneration following acute injury. Cell Stem Cell 2022, 29(6), 973–989 e10. [Google Scholar] [CrossRef] [PubMed]
- James, L.P.; et al. Tumour necrosis factor receptor 1 and hepatocyte regeneration in acetaminophen toxicity: a kinetic study of proliferating cell nuclear antigen and cytokine expression. Basic Clin. Pharmacol. Toxicol. 2005, 97(1), 8–14. [Google Scholar] [CrossRef] [PubMed]
- Walesky, C.M.; et al. Functional compensation precedes recovery of tissue mass following acute liver injury. Nat. Commun. 2020, 11(1), 5785. [Google Scholar] [CrossRef] [PubMed]
- Aoyagi, T.; et al. Two types of regenerative cell populations appear in acute liver injury. Stem Cell Rep. 2025, 20(6), 102503. [Google Scholar] [CrossRef] [PubMed]
- Matchett, K.P.; et al. Multimodal decoding of human liver regeneration. Nature 2024, 630(8015), 158–165. [Google Scholar] [CrossRef] [PubMed]
- Bhushan, B.; Apte, U. Acetaminophen Test Battery (ATB): A Comprehensive Method to Study Acetaminophen-Induced Acute Liver Injury. Gene Expr. 2020, 20(2), 125–138. [Google Scholar] [CrossRef] [PubMed]
- Yoon, E.; et al. Acetaminophen-Induced Hepatotoxicity: a Comprehensive Update. J. Clin. Transl. Hepatol. 2016, 4(2), 131–42. [Google Scholar] [CrossRef] [PubMed]
- Jaeschke, H.; Ramachandran, A. Acetaminophen Hepatotoxicity: Paradigm for Understanding Mechanisms of Drug-Induced Liver Injury. Annu Rev. Pathol. 2024, 19, 453–478. [Google Scholar] [CrossRef] [PubMed]
- Itoh, T. Stem/progenitor cells in liver regeneration. Hepatology 2016, 64(2), 663–8. [Google Scholar] [CrossRef] [PubMed]
- Williams, M.J.; Clouston, A.D.; Forbes, S.J. Links between hepatic fibrosis, ductular reaction, and progenitor cell expansion. Gastroenterology 2014, 146(2), 349–56. [Google Scholar] [CrossRef] [PubMed]
- Sato, K.; et al. Ductular Reaction in Liver Diseases: Pathological Mechanisms and Translational Significances. Hepatology 2019, 69(1), 420–430. [Google Scholar] [CrossRef] [PubMed]
- Aguilar-Bravo, B.; et al. Ductular Reaction Cells Display an Inflammatory Profile and Recruit Neutrophils in Alcoholic Hepatitis. Hepatology 2019, 69(5), 2180–2195. [Google Scholar] [CrossRef] [PubMed]
- Carpino, G.; et al. Stem/Progenitor Cell Niches Involved in Hepatic and Biliary Regeneration. Stem Cells Int 2016, 3658013. [Google Scholar]
- Elssner, C.; et al. Nuclear Translocation of RELB Is Increased in Diseased Human Liver and Promotes Ductular Reaction and Biliary Fibrosis in Mice. Gastroenterology 2019, 156(4), 1190–1205.e14. [Google Scholar] [CrossRef] [PubMed]
- Han, J.; et al. Liver Progenitor Cells: Cellular Origins, Plasticity, and Signaling Pathways in Liver Regeneration. Biology 2025, 14(10). [Google Scholar] [CrossRef] [PubMed]
Figure 1.
Severe liver injury after 600APAP in wild type mice. (A) Experimental design. (B) Kaplan-Meier survival analysis. Survival curves were compared using Log-rank (Mantel-Cox) test p value 0.9476. (C) Serum ALT activity. (D) Representative micrographs of H&E-stained liver sections. Black dashed lines indicate necrotic areas. Portal trials (PT) and central veins (CV) are indicated. Scale bar = 100 µm. (E) Quantification of liver necrosis from H&E-stained liver sections. *p < 0.05, **p < 0.01, ***p < 0.001.
Figure 1.
Severe liver injury after 600APAP in wild type mice. (A) Experimental design. (B) Kaplan-Meier survival analysis. Survival curves were compared using Log-rank (Mantel-Cox) test p value 0.9476. (C) Serum ALT activity. (D) Representative micrographs of H&E-stained liver sections. Black dashed lines indicate necrotic areas. Portal trials (PT) and central veins (CV) are indicated. Scale bar = 100 µm. (E) Quantification of liver necrosis from H&E-stained liver sections. *p < 0.05, **p < 0.01, ***p < 0.001.
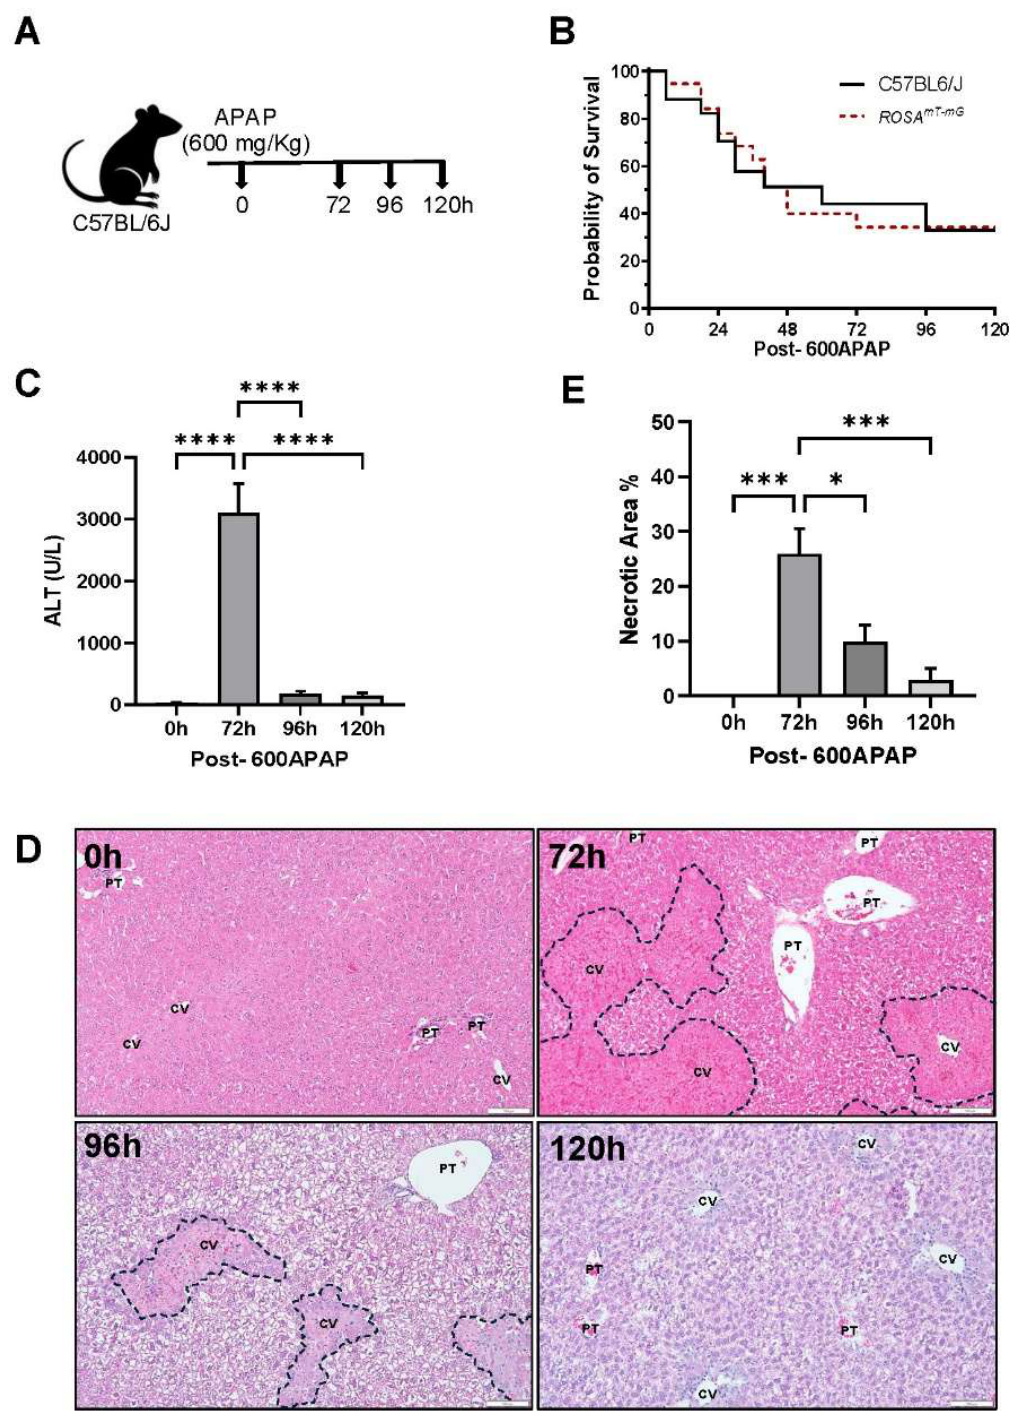
Figure 2.
EpCAM expression increases after 600APAP in wild type mice. Representative photomicrographs of EpCAM immunofluorescence staining (green) in liver sections. Nuclei are counterstained with DAPI (blue). Scale bar = 100 µm. Dotted white line represents portal vein area, PT: portal trial, and yellow arrows indicate positive cells. (B) Quantification of EpCAM-positive cells per field in liver sections. *p < 0.05, **p < 0.01.
Figure 2.
EpCAM expression increases after 600APAP in wild type mice. Representative photomicrographs of EpCAM immunofluorescence staining (green) in liver sections. Nuclei are counterstained with DAPI (blue). Scale bar = 100 µm. Dotted white line represents portal vein area, PT: portal trial, and yellow arrows indicate positive cells. (B) Quantification of EpCAM-positive cells per field in liver sections. *p < 0.05, **p < 0.01.
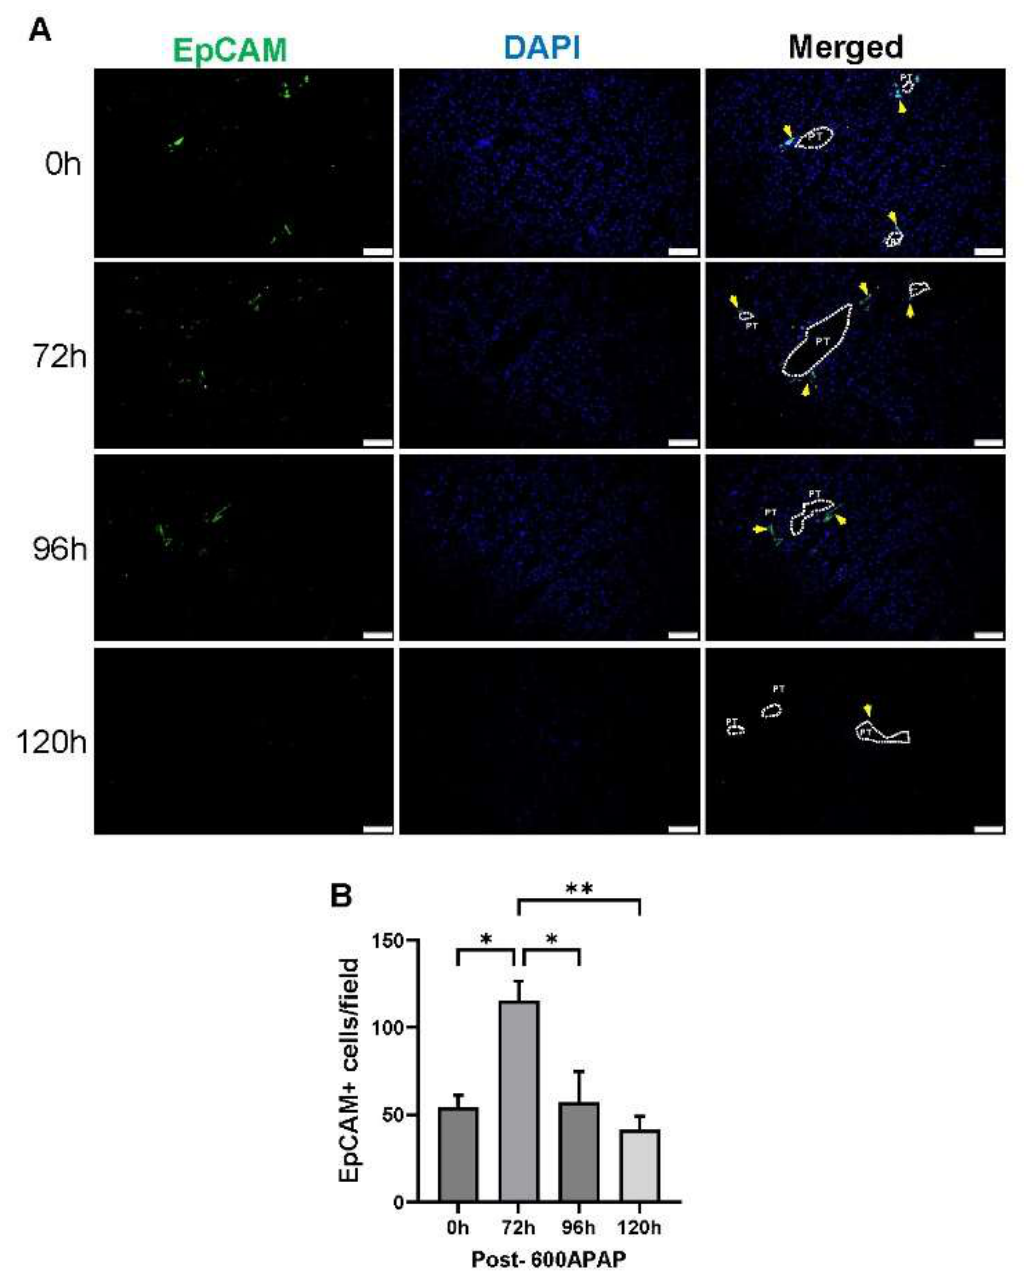
Figure 3.
A6 expression increases after 600APAP in wild type mice. (A) Representative micrographs of A6 immunofluorescence staining (green) in liver sections. Nuclei are counterstained with DAPI (blue). Scale bar = 100 µm. Dotted white line represents portal vein area, PT: portal trial, and yellow arrows indicate positive cells. (B) Quantification of A6-positive cells per field in liver sections. *p < 0.05.
Figure 3.
A6 expression increases after 600APAP in wild type mice. (A) Representative micrographs of A6 immunofluorescence staining (green) in liver sections. Nuclei are counterstained with DAPI (blue). Scale bar = 100 µm. Dotted white line represents portal vein area, PT: portal trial, and yellow arrows indicate positive cells. (B) Quantification of A6-positive cells per field in liver sections. *p < 0.05.
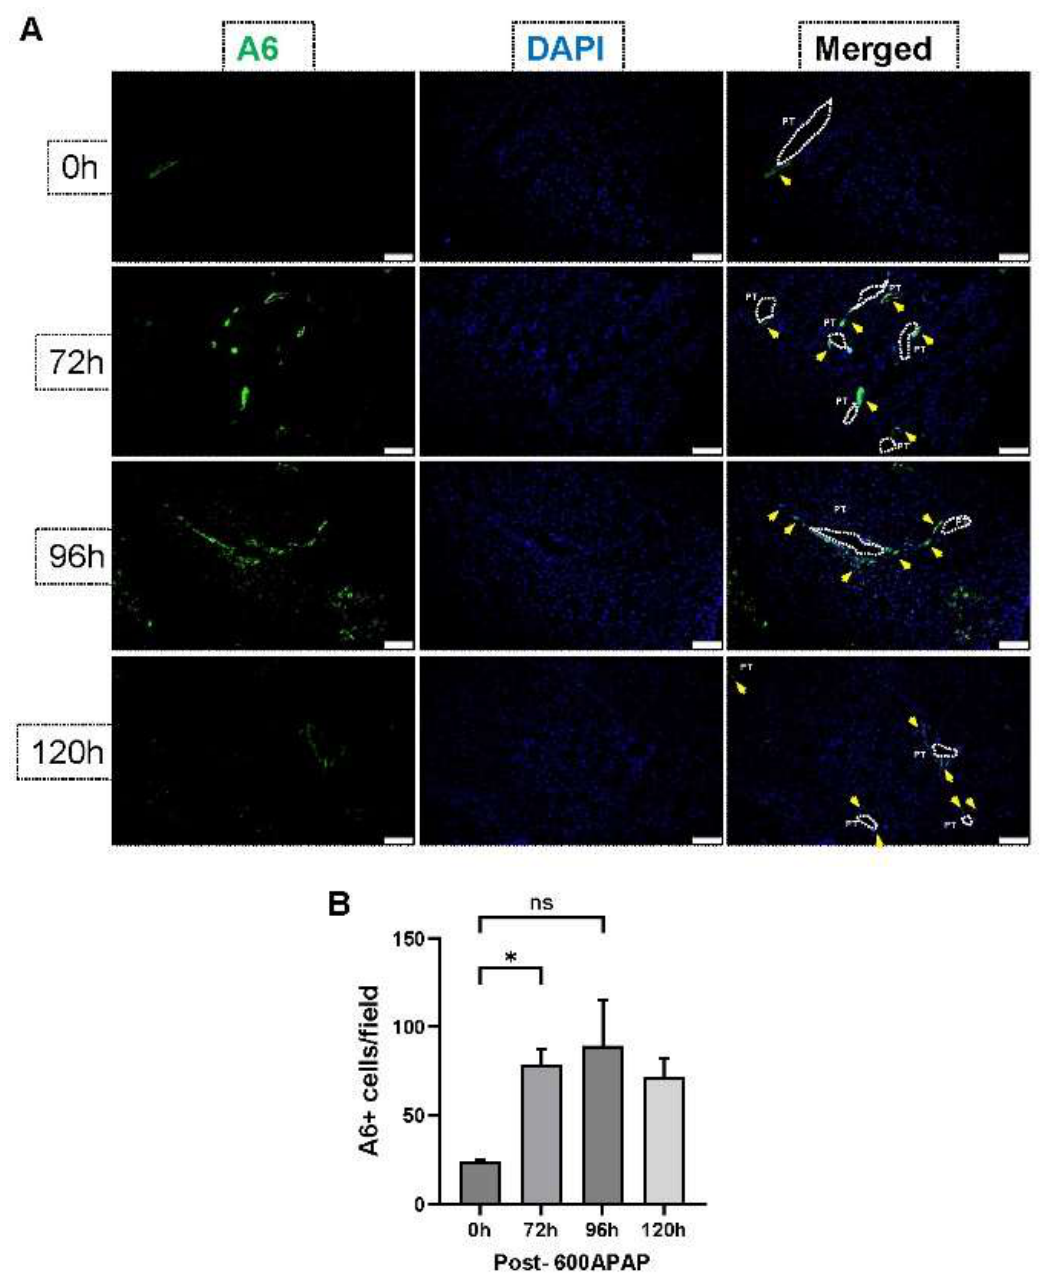
Figure 4.
CK19 expression increases after 600APAP in wild type mice. Representative micrographs of CK19 (purple) and HNF4α (brown) co-immunohistochemical staining in liver sections including portal trials region magnification (15,000x magnification). Scale bar = 100 µm. (B) Quantification of CK19-positive cells per field in liver sections. *p < 0.05, **p < 0.01.
Figure 4.
CK19 expression increases after 600APAP in wild type mice. Representative micrographs of CK19 (purple) and HNF4α (brown) co-immunohistochemical staining in liver sections including portal trials region magnification (15,000x magnification). Scale bar = 100 µm. (B) Quantification of CK19-positive cells per field in liver sections. *p < 0.05, **p < 0.01.
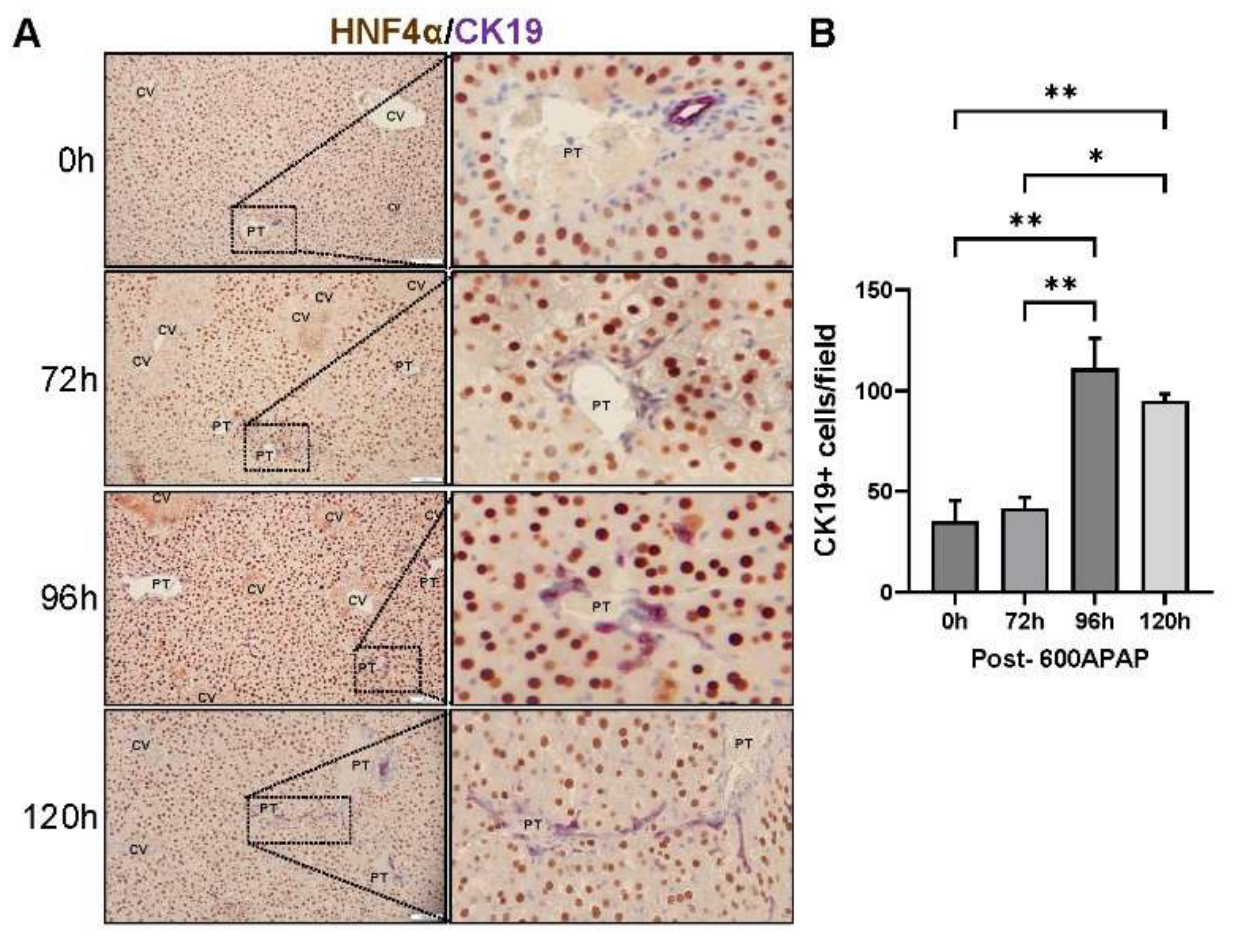
Figure 5.
Severe liver injury after 600APAP in ROSAmT-mG mice. (A) Experimental design. (B) Serum ALT activity. (C) Representative micrographs of H&E-stained liver sections. Black dashed lines indicate necrotic areas. Portal trials (PT) and central veins (CV) are indicated. Scale bar = 100 µm. (D) Quantification of liver necrosis from H&E-stained liver sections. ****p < 0.0001.
Figure 5.
Severe liver injury after 600APAP in ROSAmT-mG mice. (A) Experimental design. (B) Serum ALT activity. (C) Representative micrographs of H&E-stained liver sections. Black dashed lines indicate necrotic areas. Portal trials (PT) and central veins (CV) are indicated. Scale bar = 100 µm. (D) Quantification of liver necrosis from H&E-stained liver sections. ****p < 0.0001.
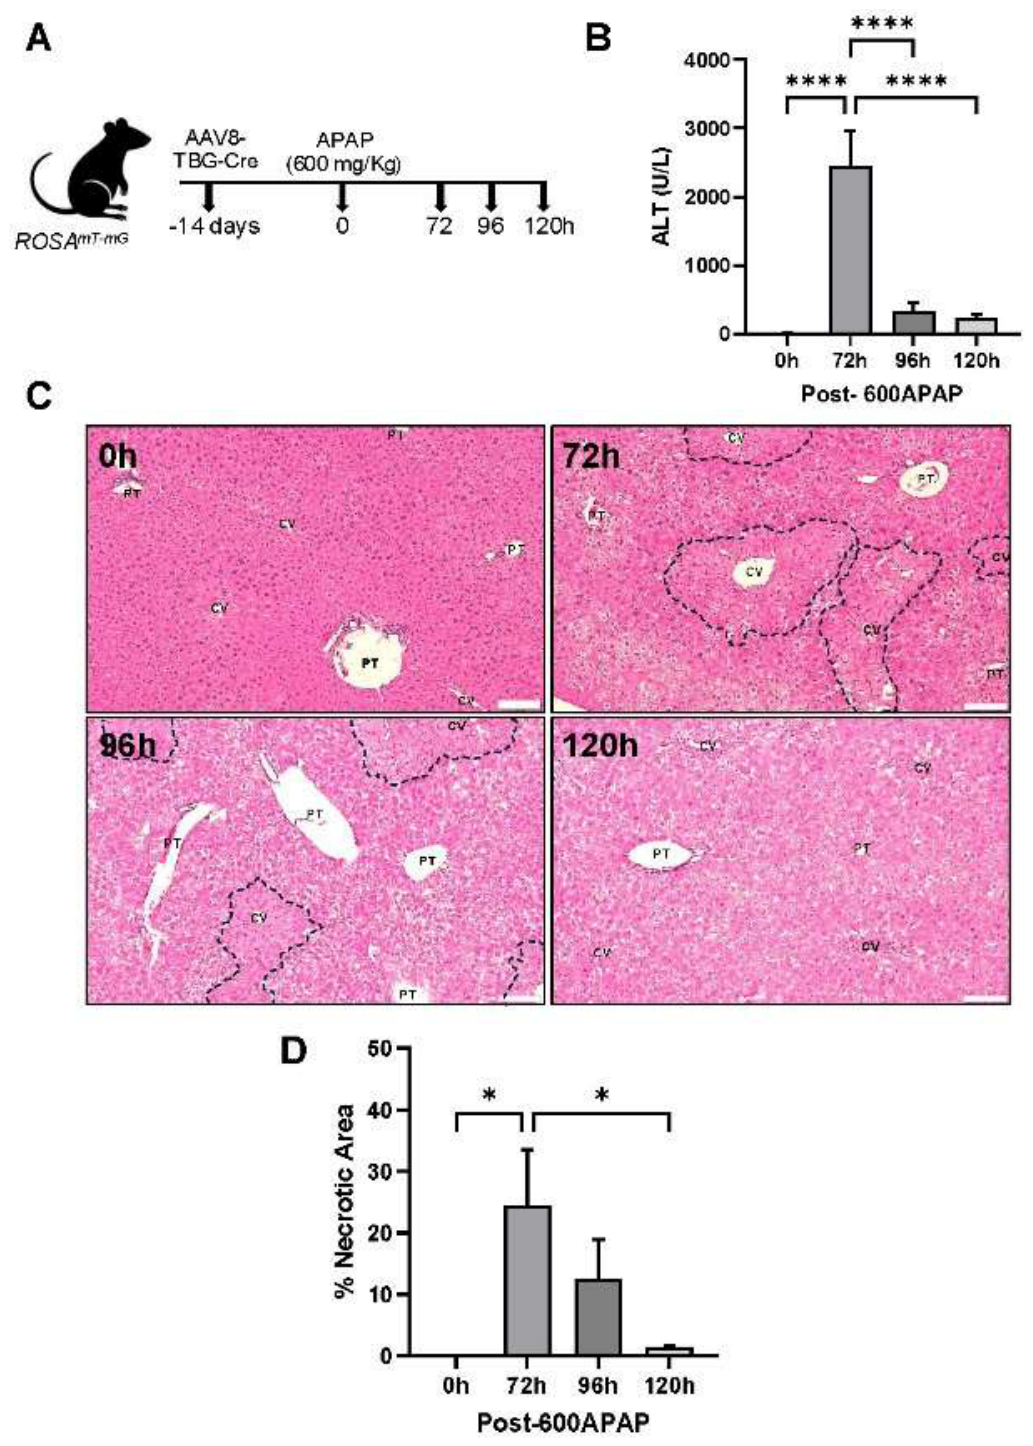
Figure 6.
Minimal transdifferentiation of hepatic progenitor cells into hepatocytes after 600APAP. (A) Representative micrographs of liver sections from the lineage-tracing model (ROSAmT-mG mice) showing hepatocytes expressing GFP (green) and non-parenchymal cells expressing tdTomato (red) including portal trials region magnification (15,000x magnification). HNF4α immunofluorescence staining is shown in blue. Scale bar = 100 µm. (B) Quantification of HNF4α/tdTomato double-positive cells and total HNF4α-positive cells in liver sections. *p < 0.05.
Figure 6.
Minimal transdifferentiation of hepatic progenitor cells into hepatocytes after 600APAP. (A) Representative micrographs of liver sections from the lineage-tracing model (ROSAmT-mG mice) showing hepatocytes expressing GFP (green) and non-parenchymal cells expressing tdTomato (red) including portal trials region magnification (15,000x magnification). HNF4α immunofluorescence staining is shown in blue. Scale bar = 100 µm. (B) Quantification of HNF4α/tdTomato double-positive cells and total HNF4α-positive cells in liver sections. *p < 0.05.
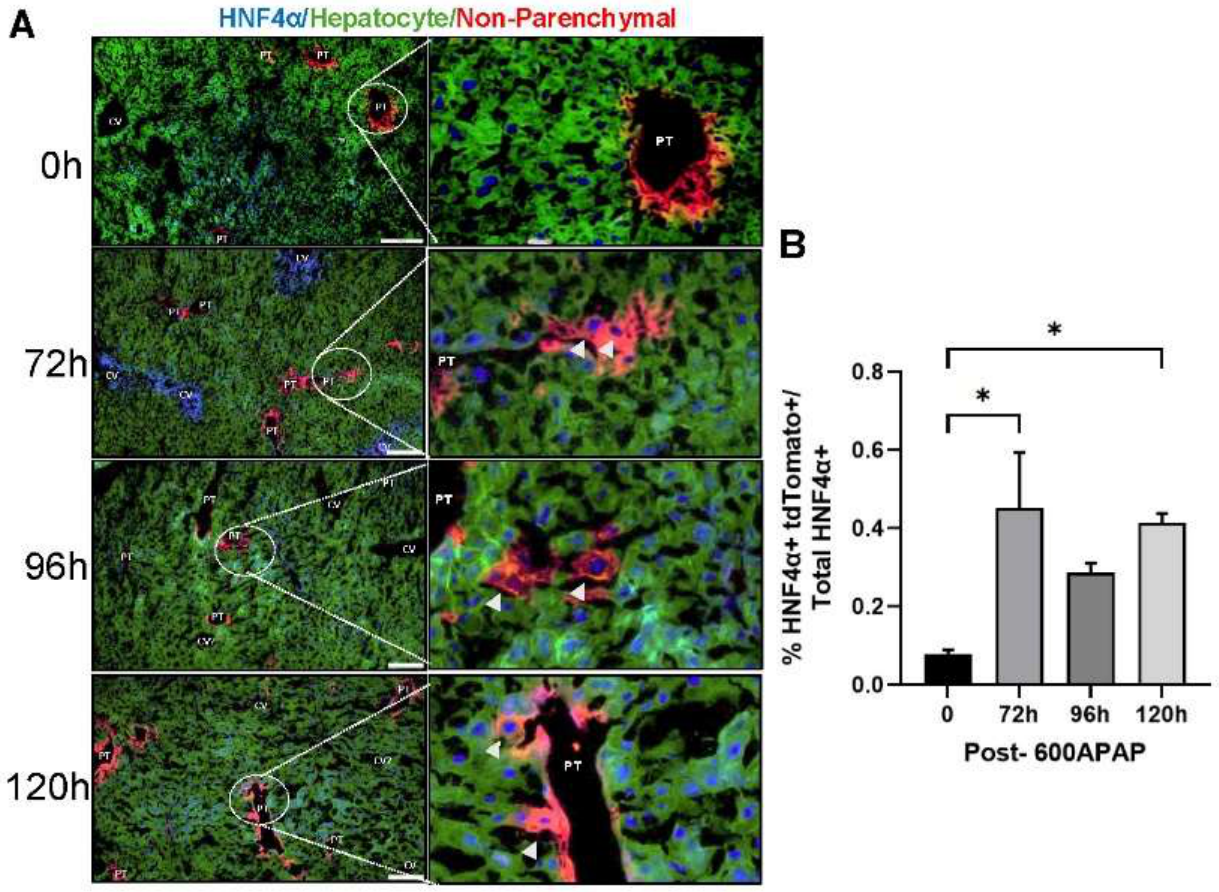

Table 1.
Immunohistochemistry antibodies.
| Antibody | Catalog Number, Source | Dilution |
| Human HNF4 alpha | PP-H1415-0C, Perseus Proteomics | 1:1000 |
| Anti-Cytokeratin 19 [EP1580Y] | ab52625, Abcam | 1:600 |
| Biotin-SP AffiniPure® Goat Anti-Mouse IgG | 115-065-072, Jackson ImmunoResearch Inc. | 1:500 |
| Biotin-SP AffiniPure® Goat Anti-Rabbit IgG (H+L) | 111-065-003, Jackson ImmunoResearch Inc. | 1:500 |
Table 2.
Immunofluorescence antibodies.
| Antibody | Catalog Number, Source | Dilution |
| Human HNF4 alpha | PP-H1415-0C, Perseus Proteomics | 1:1000 |
| CK19 | ab52625, Abcam | 1:600 |
| EpCAM | ab71916, Abcam | 1:300 |
| A6 BCM | Developmental Studies Hybridoma Bank | 1:100 |
| Cy2 anti-rat | 112-225-175, Jackson ImmunoResearch Inc | 1:500 |
| Cy2 anti-rabbit | 211-222-171, Jackson ImmunoResearch Inc | 1:500 |
| AMCA AffiniPure® Donkey Anti-Mouse IgG (H+L) | 715-155-150, Jackson ImmunoResearch Inc | 1:50 |
Disclaimer/Publisher’s Note: The statements, opinions and data contained in all publications are solely those of the individual author(s) and contributor(s) and not of MDPI and/or the editor(s). MDPI and/or the editor(s) disclaim responsibility for any injury to people or property resulting from any ideas, methods, instructions or products referred to in the content. |
© 2026 by the authors. Licensee MDPI, Basel, Switzerland. This article is an open access article distributed under the terms and conditions of the Creative Commons Attribution (CC BY) license (http://creativecommons.org/licenses/by/4.0/).
Copyright: This open access article is published under a Creative Commons CC BY 4.0 license, which permit the free download, distribution, and reuse, provided that the author and preprint are cited in any reuse.