

Submitted:
09 September 2026
Posted:
10 September 2026
You are already at the latest version
Abstract
This study examines the relationship between eco-innovation (EI) and working capital efficiency (WCE), with board gender diversity (BGD) acting as a moderator. Based on the Resource-Based View, Stakeholder, Legitimacy, and Shareholder theories, the study examines how well sustainability-focused tactics improve businesses’ operational success. WCE is measured using the cash conversion cycle (CCC) and its components, including accounts payable period (APP), inventory conversion or holding period (ICP), and accounts receivable period (ACP). Based on the panel-data and strong regression models and firm-level controls, time, and industry effects, the results suggest that eco-innovation positively influences the working capital efficiency through the reduction of cash conversion cycles and the improvement of working processes. Gender diversity in the board moderates this relationship, meaning that diverse boards enhance governance and strategic alignment. The research adds to the literature by identifying a connection between sustainability practices and financial performance and the significance of incorporating eco-innovation and inclusive governance to obtain sustainable operational performance.
Keywords:
eco-innovation
; board gender diversity
; working capital efficiency
; cash conversion cycle
; corporate governance
; moderation analysis
; gender diversity
; panel data
1. Introduction
The modern world economy is becoming more of a product of the twin forces of economic development and environmental friendliness. In the past few decades, the growth of industry and the development of the world competition put a strong strain on the resource consumption and environmental degradation, which resulted in such systemic issues as climate change, ecological imbalance, and regulation involvement (Bolton & Kacperczyk, 2021; Zhang et al., 2020). Such changes have forced companies to re-evaluate traditional business formats and integrate sustainability-based ideas into their business operations. It is against this backdrop that the idea of usage of environmental innovation is becoming an imperative strategic reaction that can help firms to both become environmentally responsible and economically efficient.
Eco-innovation, which can be generally described as the creation of product, process, and organizational behavior that minimize the harmful affect on environment, has become one of the prominent tools to attain sustainable competitive advantage (Rennings, 2000; Liao and Tsai, 2019). Contrary to traditional innovation, eco-innovation involves environmental focus into business strategy and thus, deals simultaneously with regulatory pressures as well as expectations of stakeholders. Institutional investors and financial markets are another source of the growing significance of eco-innovation as they are increasingly introducing environmental performance into investment choices (Flammer, 2021). As such, the companies that undertake eco-innovation are not only making the environment more sustainable, but also making them financially sound and sustainable.
Although eco-innovation is a strategic issue, its financial implications are still a debated topic. Arguments made in the early theoretical view held that environmental programs add extra expenditure on companies that could lead to decrease in profitability and competitiveness (Walley & Whitehead, 1994). The Porter theory however, argues that environmental practices that are designed can enhance innovation, and effectiveness to use resources and eventually, the performance of firms (Porter & van der Linde, 1995). Empirical data give a divided view as to whether these opposing views hold true, some of the studies record positive impacts of green innovation on financial indicator (Ambec et. al., 2013; Hao & He, 2022), and others record neutral or context-dependent effects.
The main weakness of current studies is that they are mostly in the form of long-term financial performance indicators like profitability and firm value whereas little consideration has been given to short-term operational efficiency indicators. One of these is WCE, which is a basic element of firm performance, indicating how well firms use their short-term or current resources like assets and liability. Working capital or operating cash flow plays a critical role in ensuring that the business can still operate and it is not dependent on external sources of funding (Deloof, 2003). Efficient utilization of working capital or operating cash flow helps firms to maximize cash flows, reduce financing costs, as well as, to increase financial stability.
A complete measure of working capital efficiency used by other researches is the cash conversion cycle (CCC), and components, namely, average collection or receivable period (ACP), inventory holding period (ICP), and average payable or payback period (APP). These elements reflect the time it takes to transform investments in inventory and receivables into cash, less time it takes to pay the suppliers. The smaller the CCC, the more efficient the company is, which is why its cash recovery will be faster and liquidity will be managed better. The determinants of working capital efficiency have been thoroughly researched, but the role of the sustainability-oriented strategies like eco-innovation is not well researched.
In theory, eco-innovation can impact working capital efficiency in a variety of ways. First, eco-innovation optimizes the efficiency of operations, meaning that waste is minimized, processes are optimized and resources are optimized, which can result in shorter inventory holding periods (ICP). Second, the reputation of firms that go through eco-innovation and customer confidence will increase, which can speed up the collection of receivables and the average collection or recievable period (ACP). Third, eco-innovation enhances connections with suppliers as it indicates financial stability and ethical intentions, which might allow firms to agree on long-term payments and raise average payable period (APP). All these effects help in a decrease in the cash conversion cycle coupled with an increase in the working capital efficiency.
Besides these direct impacts, eco-innovation is also highly connected with the governance tool named as corporate social responsibility (CSR) which is an indication of how a firm is focused to incorporate indicators like enviormental aspects, governance aspects and social aspects issues in its operations. CSR would increase transparency, decrease information asymmetry, and reinforce stakeholder relationships (Dhaliwal et. al., 2011; Cheng et. al., 2014). The benefits are especially applicable to the working capital management and efficiency as they enable access to trade credit, enhance the trust of suppliers and customer loyalty. CSR can therefore serve as a mediating factor in which eco-innovation impacts working capital efficiency.
Moreover, corporate governance mechanisms, especially board gender diversity (BGD), can mediate the association between eco-innovation and working capital efficiency. The female directors tend to be more sensitive to environmental and social concerns resulting in a better sustainability performance and conservative financial policy. Consequently, the positive effect of eco-innovation on the working capital efficiency due to female directors could be reinforced through the quality of governance and decreased operational risk.
In spite of these theoretical interconnections, the available literature has been mainly focusing on eco-innovation, CSR as well as corporate governance in isolation. Although the interlinkage between these factors and their overall effect on the efficiency of working capital has a wide gap in the current understanding. The mediating role of CSR and the moderating role of board gender diversity in eco-innovation working capital efficiency nexus have not been thoroughly investigated.
This research makes this connection since it analyzes the link between eco-innovation and the working capital efficiency in terms of CSR. This research uses the principles from stakeholder theory in developing an integrated approach towards financial implications of sustainable strategies. In this gradually globalized world, all areas of human interaction are interwoven with the insatiable desire to consume energy (Yen, et al., 2023). Markedly, the global business environment is a place which is fueled by this energy lifeline (Li, et al., 2022).
Due to the unceasing business expansion and profitability that have been guided by an unstable world, has been thrust into the continuous cycle of over consumption and over production, which in turn has predisposed the world to increasing dangers such as climate change (Phung, et al., 2022). This has been an increasing global eco-environmental degradation that is turning into a crisis, and requires a sense of urgency in a paradigm shift in economic approaches that has pushed eco-innovation into the spotlight of sustainable development of most countries and companies around the world (Wang, et al., 2024). Following the ever-increasing environmental degradation caused by the unstoppable exploitation of the limited resources of our planet and the unceasing advancement of industrialization, there has been a thunderclap of voices of concerned people clamoring to the call of a determined and uncompromising action to preserve the natural sanctity of our world (Deng et al., 2023; Zhang, et al., 2020) The journey towards this climate resilient sustainable growth is pushed by institutional investor and equity analysts (Zaman, et al., 2020).
Within sweeping context, eco-innovation (or environmental and green innovation) is linked with the innovation that will result in the reduction of harmful impacts on the environment (Marco-Lajara, et al., 2023) (Liao and Tsai, 2019). The need to adopt sustainability has become a leading organizational decision making approach in all parts of the world due to radical environmental decision making, and growing public pressure (Chang, et al., 2023) (Lin, et al., 2021). The refinement of products and processes to decrease pollution and comply with environmental protection standards is a way of organically ingrained by organisations as a way to act as a catalyst that brings business together with green innovation (Dong, et al., 2022). This dynamic model does not only promote economic value but is also crucial in the promotion of sustainable development (Han, et al., 2022). Following the growing wave of environmental degradation caused by the relentless exploitation of the finite resources of our planet and the unstoppable process of industrialization, the cry of concerned voices has burst out in a thunderous wave (Deng et al., 2023) (Zhang, et al., 2020).
Within the context of eco-innovation strategies, scholars are committed to unravel the techniques embraced by companies with the overall aim that is to reduce the impacts on the environment. One of the significant areas of debate is the effects of such strategies on the performance of the implementing firms (Madalenoa, et. al, 2020). There was a prevailing belief among the economists, policymakers and business strategists that eco-innovative strategies inherently lead to internal costs without any impact on profits. Nevertheless, (Barbieri, et. al, 2016; E., 2013; Jové-Llopis and Segarra-Blasco, 2018) recent empirical studies have revealed a continuum of findings with negative to positive relationships between eco-innovation and firm performance.
The inconsistency of empirical studies stresses the complexity of this link and calls for further analysis, especially in relation to issues associated with the size of businesses and their access to financing. This leads to the main question, does eco-innovation affect the financial performance and trade operations of enterprises (Yaotian, et al., 2023). Linking short term financing with working capital management, working capital represents the lifeline when talking about operational financing of businesses (Ferrando and Mulier, 2013; Banos-Caballero et al., 2010). As indicated from the previous literature, there is a positive correlation between working capital efficiency and high firm performance (Chambers and Cifter, 2022), contributing to the financial value of the company only in the case of financially distressed enterprises (Kieschnick et al., 2013). One may argue that this happens due to the efficient use of working capital management that provides companies with internal financing resources (Banerjee et al., 2021). The increasing attention to WCE in research shows its importance for the development of enterprises (Afrifa, et. al, 2022; Aktas et al., 2015; Shin and Soenen, 1988).
Similarly, there is concrete evidence that supports the beneficial effect of adopting eco-innovation to facilitating the financial stress that firm experiences when obtaining credit funding through banks (Zhang et al. 2020). By adopting eco-innovation, a firm is not merely going to be environmentally sensitive, but it will be an indicator of corporate social responsibility (CSR), which increases its marketability. Such good reputation on the other hand assists in minimizing the default risk of firms and it provides them an edge in their ability to acquire loans. Therefore, it can be argued that eco-innovation can positively impact working capital efficiency and working capital management and efficiency (WCM).
And, of course, working capital is not only about keeping the books balanced; it also will be useful in financing firms (Chen, et al., 2019).
1.1. Economic Rationale
The importance of identifying the effect of eco-innovation on the working capital of a company is crucial. The stakeholders, such as suppliers, customers, and the lenders, are interested in evaluating the stability of a firm, taking into account such factors as Corporate Social Responsibility (CSR), environmental activities, and sales increase (Frow & Payne, 2011). A closer look into the eco-innovation operations will show that the company is committed to environmental sustainability and CSR practices (Loureiro et al., 2020), which results in such advantages as growth in customer loyalty, lessening financial limitations, minimization of environmental influence, and market stabilization (Huang and Huang, 2022).
Moreover, raw material suppliers have confidence in the stability of a firm and this gives them long credit periods to supply raw materials. Eco-innovation on the customer front enhances the relationship between a firm and potential buyer and in doing so, a firm can boost its sales volume by selling them in batch. Eco-innovation, therefore, enhances the effectiveness and efficiency of working capital of the firms, which acts as a second financing source. In case of a lack of primary funding by banks, companies may increase the volume of working capital to satisfy their financial requirements. It is emphasized in the existing literature that eco-innovation can assist in reducing the problem of financing (Zhang et al., 2020).
The point that raises curiosity is whether the benefits of eco-innovation are tangible to businesses. It is still an open area of study when it comes to the link between eco-innovation and working capital.
1.2. Research Gap
The literature on eco-innovation and firm performance is quite abundant (Zhang, et al., 2020), demonstrating the beneficial effect of innovative green practices. Nevertheless, there is a huge gap in the knowledge of the effect of eco-innovation on Working Capital Efficiency (WCE), and the effect of gender diversity in the board as a moderator to this relationship is still unknown. The moderating effect of the board gender diversity on the eco-innovation and WCE relationship is a new and least explored field of current research. Incorporating this unstudied aspect into the current literature will give a more detailed insight into the avenues by which eco-innovation impacts WCE. Exploring the moderation role of board gender diversity in the eco-innovation and WCE association is essential in revealing the particular dynamics at work in the context of sustainable financial operations. The gap in the research highlights the necessity of an in-depth study of the interaction between eco-innovation, board gender diversity, and WCE as a part of a more holistic view of the environmental and financial impacts of the innovative practices.
1.3. Research Question
- Is working capital efficiency influenced by eco-innovation?
- Is there a significant relationship between eco-innovation and working capital efficiency moderated by BGD?
1.4. Problem Statement
The growing global eco-environmental degradation is developing into a crisis, requiring a sense of urgency in the economic paradigm shift, and has made eco-innovation a form of sustainable development to numerous countries and companies around the world (Wang, et al., 2023). The intersection of eco-innovation and the effective management of the working capital is a burning issue in the contemporary corporate environment. Although the necessity of sustainable practices in business activities becomes more and more established, a substantial gap in the literature on the interdependent relationship of eco-innovation and working capital efficiency (WCE) is observed. With the gender diversity in the boardrooms taking center stage as a driver of innovative decision-making, the gap in the literature remains in understanding how this diversity moderates the complex nexus between eco-innovation and WCE. The study will fill this gap of critical importance by examining the routes where these variables intersect and it will present a new angle of understanding the collaborative role of eco-innovation and WCE with proper respect to the influential aspect of board gender diversity. The research aims to make a valuable contribution to the sustainable corporate practices, which is why the more inclusive and interdisciplinary approach to the understanding of the multidimensional dynamics of the contemporary business practices is urgently needed.
1.5. Research Objectives
- To examine the relationship between eco-innovation and working capital efficiency (WCE) in modern business environments.
- To analyze the moderating role of gender diversity of the board on the relationships between eco-innovation and WCE.
2. Literature Review
This study brings together four different theoretical approaches, which cannot be classified as mutually exclusive, the Legitimacy Theory, and the Resource-Based View (RBV) and the Shareholder Theory, and the Stakeholder Theory to form a theoretical framework that helps us understand how eco-innovation (EI), corporate social responsibility (CSR), board gender diversity (BGD), and working capital efficiency (WCE) relate to each other. All these theories offer a multidimensional approach to analyzing organizational processes and, therefore, help us understand the effects of sustainability-related actions on the efficiency of firm operations.
The Shareholder Theory, put forward for the first time by Friedman (1962, 1970), focuses on the maximization of shareholder wealth as the ultimate goal of firm operation. According to this theory, the management of a firm should operate in such a way as to reflect the interests of its owners, which are the shareholders (Fontrodona and Sison, 2006). In the context of this approach, all firm activities aimed at achieving competitiveness, profitability, and operational efficiency are justified. The efficiency of working capital, which is measured by the cash conversion cycle and the cash conversion cycle components, is closely related to the liquidity management and the performance of the firm, thus aligning with the goals of shareholder wealth maximization (Wasiuzzaman, 2015; Högerle et al., 2020). Nevertheless, the theory of shareholders has been labeled as being excessively focused on finance and its lack of attention to the wider organizational responsibilities (Freeman, 1994; O’Connell and Ward, 2020). These criticisms notwithstanding, it is still relevant because it offers the logic base on which efficiency gains, which have been achieved due to eco-innovation, can be assessed on whether it has value to the shareholders.
Stakeholder theory was postulated by Freeman (1984) whereby a firm’s scope of responsibility included not only the business itself but also many other stakeholders which could be employees, customers, suppliers, and the community as a whole. The stakeholders were described as any party which had either influence over the success of an organization’s goals or was affected by those organizational goals (Donaldson and Preston, 1995). This stakeholder theory suggests that creating long-term value depends on the ability of a company to manage the various interests of its stakeholders. In this sense, CSR emerges as a core process by which companies relate to stakeholders and develop relationships that are founded on trust. Effective stakeholder management increases collaboration with suppliers, boosts customer loyalty, and institutional support that affect operational processes and efficiency (Clarkson, 1995; Mansell, 2013). Stakeholder theory therefore offers a critical basis of comprehending how CSR could serve as a channel through which eco-innovation impacts on working capital efficiency as firms adjust their working practices to the expectation of the stakeholders.
The Legitimacy Theory also expands the theoretical concept by stating that approval and conformity to the societal norms is vital. The legitimacy is based on the concept of organizational legitimacy put forth by Dowling and Pfeffer (1975) and can be defined as the idea that the behaviours of a firm are correct in a socially constructed system of values and beliefs (Suchman, 1995). This theory posits that firms are guided by a social contract and their existence is determined by their ability to keep congruency between their operations and the expectations of the society (Burlea & Popa, 2013). Corporate reporting, especially in environmental and social reporting is a key instrument in minimizing the legitimacy gap that can be experienced when there is failure to fulfill the societal expectations (Guthrie et al., 2006). In this context, CSR and sustainability efforts in the context of earning legitimacy, minimizing risk specific to the firm, and securing access to resources and markets (Bansal and Clelland, 2004). The legitimacy theory is of special interest in understanding why companies resort to the practice of eco-innovation and CSR that goes beyond the economic reasons, as such practices assist in gaining acceptance in society and stabilizing the conditions under which firms operate.
In addition to these views, the Resource-Based View (RBV) is a strategic interpretation of the role of internal capabilities in creating a long-term competitive advantage. According to RBV, superior performance of firms comes about as a result of creating valuable, rare, inimitable, and non-substitutable (VRIN) resources (Barney, 1991).
In that regard, eco-innovation might be considered a strategic power enabling to improve the efficiency of the resources involved, minimise waste, and optimise processes. On the same note, CSR can be theorized as an intangible resource that enhances reputation, relationship with stakeholders and organizational culture which contributes to long-term performance (Hart, 1995). Gender diversity in boards also increases the resource base of the firm as it brings different perspectives to the firm, increases the quality of decisions and governance effectiveness (Terjesen et al., 2016). All these abilities allow companies to maximize the elements of working capital, including inventory management, accounts receivables collection, and payables structuring, to enhance efficiency. RBV therefore offers the rationales behind internal strategic resources and capabilities to operational outcomes.
A combination of these four theories forms a multi-layered and integrated framework. Shareholder Theory offers the financial explanation of efficiency gains, Stakeholder Theory underlines the relational cases that foster operational performance, Legitimacy Theory offers the societal pressures on the firm behaviour and RBV focuses on the strategic capabilities to drive efficiency. Combined, these views provide a thorough basis on how eco-innovation, CSR, and gender diversity of the board affect working capital efficiency to close the gap between financial performance and sustainability practices and strategic management.
2.1.1. Eco-Innovation and Financial Outcomes
Eco-innovation has been generally accepted as one of the major sources of sustainable development and competitive advantage. According to the literature, eco-innovation helps the firms to minimize environmental footprint, at the same time enhancing their operational efficiency and profitability (Rennings, 2000; Ambec et al., 2013). Resource-based approach, eco-innovation is a strategic strength enabling firms to be differentiated in the market and perform better (Barney, 1991; Hart, 1995).
There are empirical studies that give conflicting evidence regarding the financial effects of eco-innovation. Flammer (2021) discovers that environmental innovation increases the value of firms through better stakeholder interaction and minimizing regulatory risk. In the same vein, He et al. (2022) indicate that there is a positive correlation between eco-innovation and firm performance, especially in more environmentally exposed industries. Nonetheless, other researchers also indicate that the advantages of the eco-innovation can be contingent upon the firm attributes, industry specifics, and institutional context (Jové-Llopis and Segarra-Blasco, 2018).
2.1.2. Linking Eco-Innovation to Working Capital Efficiency
Current studies have been able to look into the relationship between working capital management and efficiency and sustainability. As shown in a study by Rehman et al. (2021), efficiency in the supply chain tends to be higher for environmental companies, hence affecting the working capital performance positively. According to the study by Tan et al. (2021), environmental risk negatively affects trade credit. Eco-innovation is capable of enhancing the working capital efficiency in a variety of ways. Eco-innovation also lower or reduced inventory levels and inventory turnover (ICP) by improving inefficiencies and waste in production. Eco-innovation improves the quality of products, brand recognition, boosts customer demand, and expedites receivables collection (ACP). Moreover, eco-innovation is an indicator of financial stability and ethical devotion, which allows companies to agree on good terms of payment with suppliers (APP).
The stability and financial success of a company is of interest to shareholders, managers, employees and lending institutions. Eco-innovation, as Zhang et al. (2019) emphasize, is a key factor that can bring financial efficiency, which leads to the stability and development of companies in general. Additionally, customers are becoming more reluctant to buy products that have a negative effect on the environment, and suppliers are also very cautious about granting credit to environmentally unfriendly companies because of the risks posed (Ahmad and Zhang, 2020). Adopting eco-innovation would resolve these issues leading to an increase in sales and resource efficiency, and hence the overall working capital efficiency.
Applying to the agency theory (Jensen and Meckling, 1976), it is claimed that companies that have fewer conflicts between agents and principals are more financially stable. The results of eco-innovation activity are more Corporate Social Responsibility (CSR)-disclosures (Le et al., 2022), which contribute to the minimization of agency conflicts through the establishment of trust between the parties. These CSR disclosures, especially the green innovation related disclosures are able to motivate both the suppliers and customers, which results in the increase of the efficiency of inventory turnover and receivable turnover. This creates a higher confidence in the company and eventually leads to improved efficiency of working capital in general.
Similarly, the asymmetric information theory indicates that sellers usually know more about the quality of the goods than buyers do, and it affects product prices (Akerlof, 1970; Javeed et al., 2022). Customers are worried about the quality of products and hence may be reluctant to buy products without information hence their sales volume will decline. Eco-innovation, especially by the introduction of green product labeling, can solve these problems of information asymmetry and provide transparency to the customers about the quality of the products. This level of transparency therefore increases the sales volume and the working capital efficiency.
Recent studies have given very strong reasons as to why there is a relationship between, eco-innovation and working capital efficiency. Zhang et al. (2020) established that eco-innovation plays a big role in mitigating financing constraints faced by firms. Green innovation should be given priority to enable the firms to minimize default risk and hence become more attractive to lending institutions. Javeed and Tolliver et al. (2021), Supporting evidence of the inverse relationship between eco-innovation and financing constraints was also discovered in the article of as well. Additionally, eco-innovation is not only a way to get loans, but also makes the capital of working investments more efficient, as (Tan et al. 2021) point out. They found that the working capital efficiency, particularly trade credit, of suppliers in the emerging markets is negatively influenced by increasing air pollution. Suppliers are also reluctant to give credit on raw materials in the polluted environment as more volatility risks are likely to occur. Nevertheless, eco-innovation, which is a remedy to pollution emissions (Rehman et al., 2021), will go a long way to lower or reducing the pollution levels, thus positively influencing trade credit.
It is essential to consider that according to Le et al. (2022), eco-innovation is of paramount importance in achieving goals of sustainable supply chain management. Since it is of significant importance to manage working capital efficiently in supply chain management, eco-innovation turns out to be a positive factor. It was found by Tan et al. (2022) that a green credit policy in China leads to eco-innovation in other firms. This positive impact of eco-innovation on the efficiency of working capital also applies to other firms due to peer effect on working capital efficiency (Gyimah et al., 2020).
2.2.2. Eco-Innovation, Board Gender Diversity and Working Capital Efficiency
The correlation between eco-innovation and working capital efficiency does not hold throughout the firms, it depends on the internal governance structure that influences the strategic decisions and resource distribution. Board gender diversity (BGD) has been identified as one of these critical attributes of governance that affects both sustainability practices and financial performance. The heterogeneity in perspectives by the presence of female directors in corporate boards, improves the effectiveness of monitoring, and risk preferences moderating the effect of eco-innovation on the efficiency of working capital. Theoretically, the moderating effect of BGD can be explained by agency theory as one of the main reasons. The boards are also monitoring mechanisms which reduce agency conflicts between the managers and shareholders (Jensen and Meckling, 1976). It is also said that gender-diverse boards have better oversight and less opportunistic behavior since female directors are usually more vigilant in scrutiny of management behavior and adherence to ethical practices (Adams and Ferreira, 2009). This greater monitoring is especially valuable when it comes to eco-innovation, where considerable resources are involved, and long-term strategic investment is made. BGD can improve the quality of governance to guarantee that eco-innovation investments are effectively realized, which enhances the benefits of operating capital efficiency.
Besides agency considerations, the gender socialization theory offers more understanding of the effect of BGD on corporate decision-making. According to this theory, women tend to be more communal, ethical and stakeholder oriented (Eagly and Johannesen-Schmidt, 2001). This leads to increased eco-innovation and social responsibility within the company, as female directors have more chances to focus on environmental sustainability and social responsibility. This perspective is supported by empirical research that demonstrated that companies that have more women on their boards have better environmental performance and lower or reduced carbon emissions, as well as more involvement in sustainability activities (Post and Byron, 2015; Konadu et al., 2022).
In ESG (Indicators like enviormental aspects, governance aspects and social aspects) terms, BGD is becoming one of the most important forces of corporate sustainability. Gender-balanced boards improve the reputation of sustainability efforts, which sends a message to external stakeholders that the company is devoted to ethical and responsible actions. This signaling effect enhances the effect of eco-innovation by making it more trustworthy to the stakeholders and perceived less risky. Investors, suppliers, and customers will be more willing to do business with companies that show commitment to the environment and good governance practices, thus enhancing the trade credit terms and the efficiency of their operations.
The moderating effect of BGD is more pronounced in studying the elements of working capital efficiency. Gender-diverse boards in the framework of receivables management (ACP) can be more effective in the context of eco-innovation, as they can contribute to customer-focused approaches and building a strong brand image. Female directors have been linked with better communication with stakeholders and management of relations and thus may result in quicker receivables turnover and less credit risk (Lins et al., 2017). Therefore, the negative correlation between eco-innovation and ACP will probably be more strong in companies having higher BGD.
Likewise, in inventory management (ICP), BGD can support the operational advantages of eco-innovation, through the promotion of more efficient resource use and risk management. Women directors are more conservative and detailed in their decision-making that can enhance inventory management and minimize inefficiencies (Nastiti et al., 2019). It has the effect of creating a stronger negative correlation between eco-innovation and ICP, which is a better inventory turnover and lower or reduced holding costs.
The BGD moderating effect is less pronounced in the case of payables management (APP). Although eco-innovation can help the firm to obtain longer payment terms with suppliers, a gendered board can be more traditional in terms of financial management, and focus on prompt payments and good relations with suppliers. This is indicative of the risk-aversive character that is in many cases related to the female directors, which can restrict the level to which companies draw trade credit as a financing tool (Gulamhussen & Santa, 2015). Consequently, eco-innovation and APP are likely to be less positively correlated in companies with increased BGD, and the moderation of the positive relationship might occur or even become weak.
In a bigger context, BGD not only affects a given cash conversion cycle (CCC) but also the balance between efficiency and risk management. Whereas eco-innovation tends to lower or reduced CCC by enhancing operational efficiency, gender-diverse boards might focus on financial stability and risk reduction, which results in less risky working capital policies. This two-fold impact identifies the multifaceted nature of BGD as a promoter and controller of the results of eco-innovation.
Empirical literatures have offered a lot of evidence on the moderating effect of BGD in the decision-making of corporations. Adams and Ferreira (2009) discover that boards with gender diversity are linked to the external monitoring and better governance results. In their meta-analysis, Post and Byron (2015) prove that the representation of women on the board has a positive effect on the performance of firms, especially when this oversight is needed.
On the same note, Konadu et al. (2022) demonstrate that companies that have a higher BGD demonstrate a superior environmental performance and fewer carbon emissions, which supports the association between gender diversity and sustainability.
Nonetheless, other significant contradictions in the literature also make it difficult to interpret the role of BGD. Whereas most researchers have articulated the advantages of gender diversity, some propose that too much diversity can cause a coordination problem and slow decision-making (Adams and Ferreira, 2009). In very dynamic settings, e.g. those involving eco-innovation, delays in making decisions can make the strategic initiatives less effective and consequently less powerful in influencing the working capital efficiency.
Besides, the risk-averse nature of the female directors could be both positive and negative. On the one hand, risk aversion increases the financial stability and minimizes the risk of inefficient investments. Conversely, it can restrict the capacity of the firm to fully utilize the advantages of eco-innovation, especially concerning aggressive growth and use of trade credit. Belaounia et al. (2020) and Yahya et al. (2020) present results, which show that more conservative financial policies are adopted by the companies with a larger number of women, which can limit their flexibility of operations. The other vital concern is that board composition may be endogenous. Companies with more emphasis on sustainability and good governance might be more inclined to select female directors, and thus the relationship between BGD and eco-innovation might not be causal. This puts emphasis on the necessity to deal with endogeneity issues by employing superior econometric methods of system GMM to determine the actual moderating effect of BGD.
BGD is further affected by institutional and cultural issues. The influence of female directors on the corporate performance is stronger in those countries with well-developed governance systems and norms of gender equality (Ioannou and Serafeim, 2012). Conversely, within the settings of limited or symbolic gender diversity, the role of female directors can be restricted, limiting the capacity to moderate the eco-innovation working-capital efficiency relationship.
In spite of these inconsistencies, there is general evidence pointing towards the importance of BGD as a moderating factor in determining the financial ramifications of eco-innovation. Gender-diverse boards impact the operational efficiency through the translation of eco-innovation into operational efficiency by improving the quality of governance, encouraging sustainability-focused decision-making, and shaping risk preferences. This moderating influence is more specifically applicable within the working capital management and efficiency context, where there exists a trade-off between efficiency, liquidity and risk.
In line with gender socialization theory, it can be said that females are genetically predisposed towards having communal characteristics such as being nurturing and empathic (Eagly & Johannesen-Schmidt, 2001). Research shows that women directors are expected to achieve higher success rates in addressing the demands and needs of stakeholders than men do (Bear et al., 2010). They also appear to be highly responsive to all environmentally-related initiatives (Liu, 2018) because of their inherent relational nature. Women serve as the key ingredient that ties together different stakeholder groups, ranging from civic organizations, workers, suppliers, and customers (Glass et al., 2016). But their role goes beyond making sure that everyone will be satisfied. They have a particular ability to balance between aligning stakeholders' interests with the goal-oriented nature of shareholders' interests. That makes gender-diverse boards an integral part of eco-innovative companies.
A study by Gulamhussen and Santa (2015) that studied 461 banks in OECD countries found that the increased presence of women in top positions is beneficial to a firm in terms of performance but also results in a more conservative attitude. In a similar study, Belaounia et al. (2020) studied 1986 companies in 24 economies and discovered that female directors are linked to businesses being risk averse. Also, Yahya et al. (2020) presented the evidence of South Asian healthcare companies and indicated that female top executives are more inclined towards risk aversion.
Nastiti et al. (2019) proposed that female executives are more likely to focus on profitability when they are in control by using a more conservative working capital policy. It appears that female directors are especially keen to such issues as stock-out or liquidity risks. They seem to be risk averse and would rather adopt a safer more conservative method in handling the working capital efficiency of their firm.
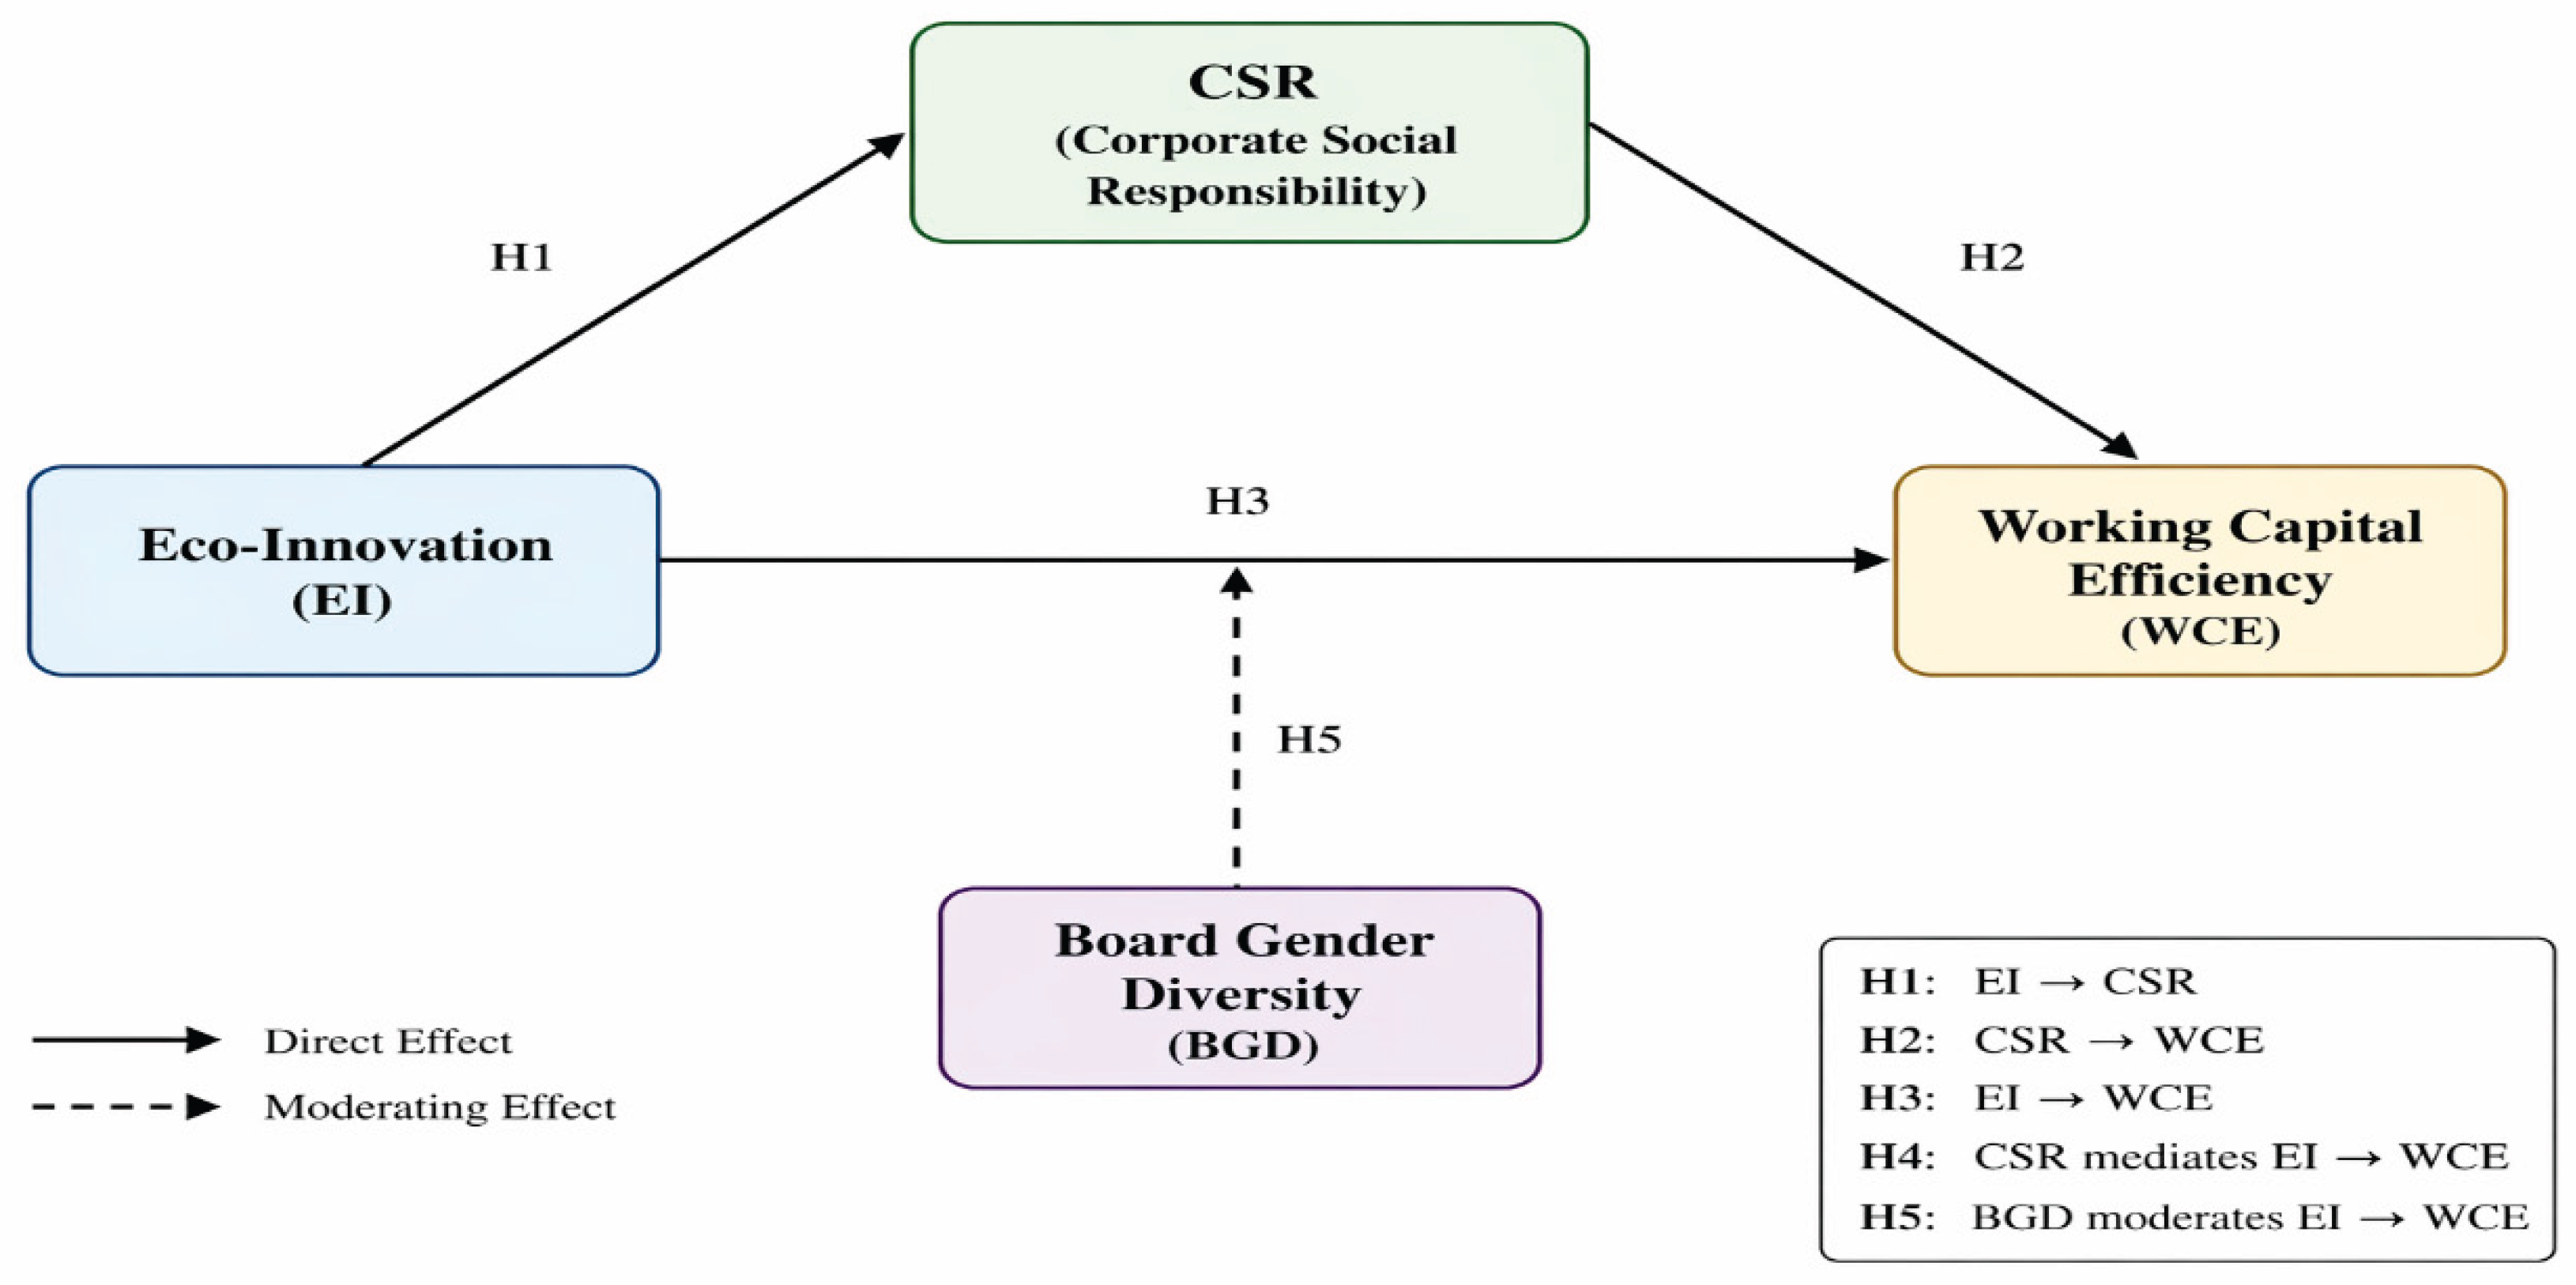
BGD moderates the relationship between eco-innovation and WME
2.3. Theoretical Framework
Figure 1.
Theoretical Framework.
3. Research Methodology (Material and Methods)
3.1. Eco-Innovation
Researchers tend to use Research and Development (R&D) as a tool in gauging general innovation in earlier research. Nonetheless, we decided to use Thomson Reuters Eikon eco-innovation score rather than R&D. The rationale behind this choice was the difficulties related to obtaining data on the environmental-related R&D spending since companies are not obligated to share information related to the initiative taken to improve the environment. Recently, within research, e.g. (Nadeem et al., 2020; Arena et al., 2018; Jain, et al., 2020) the Thomson Reuters Eikon eco-innovation score has been used. This score measures the ability of a company to lower or reduced its environmental costs and to relieve customers of the burdens. Basically, it implies the emerging market opportunities by launching or improving environmental technologies, processes and environmentally friendly products. Eikon Eco-Innovation Score is a weighted mean score of industry-adjusted composite score between 0 to 100, wherein 100 means a very high level of dedication towards eco-innovation. In the process of interpreting the data, we normalized the eco-innovation percentage scores into fractions of 100.
3.2. Working Capital Efficiency
The CCC consists of three core components: average collection or recievable period (ACP), inventory conversion or holding period (ICP), and average payable period (APP). Each component provides insight into specific aspects of working capital management and efficiency.
Average Collection Period (ACP), also known as day’s sales outstanding, measures the average time a firm takes to collect payments from its customers. A lower or reduced ACP indicates that the firm efficiently converts accounts receivable into cash, reducing the risk of liquidity shortages and enhancing operational flexibility (Filbeck & Krueger, 2005). Firms with strong entrepreneurial orientation or eco-innovation strategies often implement more rigorous credit policies, frequent follow-ups, or digital invoicing systems, which can significantly reduce ACP and improve working capital turnover (Wiklund & Shepherd, 2003).
Inventory conversion or holding period (ICP), or day’s inventory outstanding, measures the average number of days inventory is held before it is sold. A shorter ICP indicates that the firm efficiently manages its inventory, minimizing holding costs and the risk of obsolescence. Effective inventory management requires accurate demand forecasting, streamlined supply chain coordination, and timely production planning, all of which are often enhanced by innovative entrepreneurial practices and eco-efficient operations (Hult et al., 2006). Firms that integrate CSR practices may also optimize inventory management in a sustainable manner, for example by reducing waste, sourcing environmentally friendly materials, or adopting circular economy principles, which indirectly influence ICP (Aguinis & Glavas, 2012).
Average Payable Period (APP) measures the average time a firm takes to settle its accounts payable with suppliers. A longer APP allows the firm to retain cash for a longer period, enhancing short-term liquidity. However, extending payables excessively may damage supplier relationships or limit access to favorable credit terms. Firms that integrate CSR into supplier management often maintain ethical payment practices, balancing operational efficiency with stakeholder satisfaction (Luo & Bhattacharya, 2006). APP, therefore, serves as a critical control point in working capital management and efficiency , reflecting a firm’s ability to strategically leverage supplier credit while maintaining operational integrity.

Table 3.1.
Literature on Working Capital Efficiency Measurement.
| Study | WCE Proxy | Methodology | Key Variables |
|---|---|---|---|
| Deloof (2003) | CCC | OLS | Receivables, Inventory, Payables |
| Baños - Caballero et al. (2010) | CCC (non-linear) | Dynamic Panel (GMM) | Financial constraints |
| Akltas et al. (2015) | CCC | Dynamic Panel | Adjustment speed, firm policies |
| Kieschnick et al. (2013) | Net Working Capital | Panel Regression | Investment, financing |
| Afrifa & Padachi (2016) | CCC | OLS / Panel | Profitability, size |
| Enqvist et al. (2014) | CCC | Panel Regression | Economic cycles |
| Chambers & Cifter (2022) | WCE Index (PCA) | Factor Analysis + Panel | Firm characteristics |
| Zhang et al. (2020) | Trade Credit (ACP, APP) | Panel-Regression | Environmental policies |
| Tan et al. (2021) | CCC & Trade Credit | Panel-Regression | Pollution, ESG |
| Rehman et al. (2023) | CCC, WCR | Panel-Regression | Sustainability practices |
This formula captures the net time between cash outflow and cash inflow, effectively summarizing the efficiency of working capital management and efficiency. A lower or reduced CCC is indicative of a firm that can rapidly convert investments in inventory and receivables into cash while managing payables strategically, reducing dependency on external financing and improving financial flexibility (Deloof, 2003; Richards & Laughlin, 1980). In the context of entrepreneurial and eco-innovative firms, CCC serves as a key operational metric that reflects the effectiveness of innovation, process optimization, and sustainable practices in enhancing liquidity and operational performance.
Empirical evidence suggests that CCC and its components are significantly influenced by firm-specific strategies and governance mechanisms. Entrepreneurial intention toward innovation reduces ACP and ICP, indicating faster cash recovery and inventory turnover, while CSR mediates this effect by embedding responsible operational practices that improve process discipline (Orlitzky et al., 2003; Aguinis & Glavas, 2012). Moreover, board gender diversity strengthens the positive impact of eco-innovation on working capital efficiency, ensuring that CCC improvements are achieved without compromising ethical or strategic objectives (Adams&Ferreira, 2009; Terjesen et al., 2016).
In summary, CCC and its components—ACP, ICP, and APP—provide a comprehensive framework for measuring working capital efficiency. They enable firms to assess operational effectiveness, liquidity management, and the impact of strategic initiatives such as eco-innovation and CSR, while governance factors like BGD further optimize these relationships. A detailed understanding of CCC allows managers and policymakers to implement practices that reduce operational delays, enhance cash flow, and maintain sustainable, socially responsible operational standards.
3.3. Control Variables
Moreover, in our empirical analysis, we considered several control variables in order to gain a broader understanding of this topic. Simply put, the calculation of the sales growth ratio entailed division of the total change in sales volume (sales for this year less sales for the previous year) by the total sales balance for the current year. The sales growth ratio can provide information about the growth of the company and the performance of its managers in terms of increasing sales.
The leverage ratio, in turn, reflects the share of loans that a firm receives from a bank in order to finance its assets. This indicator will give us an idea about how much a business relies on external sources of funding; high leverage may result in problems with financial stability caused by higher interest expenses.
Finally, firm size was measured through the natural logarithm of total assets. The use of the natural logarithm is useful for standardizing the data. Variables influencing working capital efficiency at the firm level were chosen taking into account the study by Chen et al. (2019) and Cao et al. (2022).
3.4. Research Model
3.4.1. Cash Conversion Cycle (CCC)
CCCᵢₜ = β₀ + β₁EIᵢₜ + β₂Sizeᵢₜ + β₃Ageᵢₜ + β₄Levᵢₜ + β₅CRᵢₜ + β₆EBITMᵢₜ + β₇FAᵢₜ + β₈SGrowthᵢₜ + Industry + Year + εᵢₜ
CCCᵢₜ = λ₀ + λ₁EIᵢₜ + λ₂BGDᵢₜ + λ₃(EIᵢₜ × BGDᵢₜ) + λ₄Sizeᵢₜ + λ₅Ageᵢₜ + λ₆Levᵢₜ + λ₇CRᵢₜ + λ₈EBITMᵢₜ + λ₉FAᵢₜ + λ₁₀SGrowthᵢₜ + Industry + Year + εᵢₜ
3.4.2. Average Collection or Receivable Period (ACP)
ACPᵢₜ = β₀ + β₁EIᵢₜ + β₂Sizeᵢₜ + β₃Ageᵢₜ + β₄Levᵢₜ + β₅CRᵢₜ + β₆EBITMᵢₜ + β₇FAᵢₜ + β₈SGrowthᵢₜ + Industry + Year + εᵢₜ
ACPᵢₜ = λ₀ + λ₁EIᵢₜ + λ₂BGDᵢₜ + λ₃(EIᵢₜ × BGDᵢₜ) + λ₄Sizeᵢₜ + λ₅Ageᵢₜ + λ₆Levᵢₜ + λ₇CRᵢₜ + λ₈EBITMᵢₜ + λ₉FAᵢₜ + λ₁₀SGrowthᵢₜ + Industry + Year + εᵢₜ
3.4.3. Inventory Conversion or Holding Period (ICP)
ICPᵢₜ = β₀ + β₁EIᵢₜ + β₂Sizeᵢₜ + β₃Ageᵢₜ + β₄Levᵢₜ + β₅CRᵢₜ + β₆EBITMᵢₜ + β₇FAᵢₜ + β₈SGrowthᵢₜ + Industry + Year + εᵢₜ
ICPᵢₜ = λ₀ + λ₁EIᵢₜ + λ₂BGDᵢₜ + λ₃(EIᵢₜ × BGDᵢₜ) + λ₄Sizeᵢₜ + λ₅Ageᵢₜ + λ₆Levᵢₜ + λ₇CRᵢₜ + λ₈EBITMᵢₜ + λ₉FAᵢₜ + λ₁₀SGrowthᵢₜ + Industry + Year + εᵢₜ
3.4.4. Average Payable Period (APP)
APPᵢₜ = β₀ + β₁EIᵢₜ + β₂Sizeᵢₜ + β₃Ageᵢₜ + β₄Levᵢₜ + β₅CRᵢₜ + β₆EBITMᵢₜ + β₇FAᵢₜ + β₈SGrowthᵢₜ + Industry + Year + εᵢₜ
APPᵢₜ = λ₀ + λ₁EIᵢₜ + λ₂BGDᵢₜ + λ₃(EIᵢₜ × BGDᵢₜ) + λ₄Sizeᵢₜ + λ₅Ageᵢₜ + λ₆Levᵢₜ + λ₇CRᵢₜ + λ₈EBITMᵢₜ + λ₉FAᵢₜ + λ₁₀SGrowthᵢₜ + Industry + Year + εᵢₜ
The econometric model used in the study is intended to investigate the conditional dynamics by which eco-innovation (EI) affects the efficiency of working capital (WCE) using cash conversion cycle (CCC), average collection/receivable period (ACP), inventory conversion/holding period (ICP), and average payable period (APP). The first equation assesses the total/direct effect of eco-innovation on working capital efficiency, where the coefficient β₁ captures the overall influence of EI on each dependent variable (CCC, ACP, ICP, or APP). This equation establishes whether eco-innovation significantly affects operational efficiency in isolation.
In parallel, the moderation model evaluates whether the strength of the relationship between eco-innovation and working capital efficiency depends on Board Gender Diversity (BGD). This is through the addition of an interaction term between EI and BGD in the regression equation. In the current model, λ1 indicates the impact of EI on WCE in the absence of BGD, λ2 shows the direct impact of BGD on WCE and λ3 indicates the interaction impact which is the most important coefficient of moderation. The statistically significant λ3 shows that diversity of boards in terms of gender has an effect on the size or direction of the relationship between working capital efficiency and eco-innovation. The positive λ3 indicates an increase in effectiveness of eco-innovation by gender diversity, and vice versa. Combined, these models give a complete picture of how eco-innovation affects efficiency, and how this relationship is intensified or weakened based on the nature of governance (gender diversity in the boards).
3.5. Research Design and Data Collection
This study adopts a quantitative and explanatory research design to examine research question. The study uses secondary panel data and the data collected in this study was firm-level data, retrieved in the Thomson Reuters database and included publicly traded firms in the United States (5,600 unique publicly traded companies) that had available financial data between the years 2008 and 2021 based on sample selection based on inclusion/exclusion criteria (data availability and predetermined selection criteria). In line with the methodologies used in other previous studies, namely based on the (Deloof, 2003), the study excluded firms that fall in the financial sector based on quantitative study of panel data. Also, this study screened out firm-year observations that showed anomalies, e.g., negative assets or negative sales, so that we have a strong and valid data in the analysis. Also his study screened out firm-year observations that have missing values.
3.6. Sample Selection Criteria
Firms are included in the sample based on the following criteria:
- Availability of complete financial data
- Availability of CSR/ESG-related information
- Firms must be continuously listed during the study period
- Availability of all variables required for analysis (EI, CSR, ACP, ICP, CCC, BGD)
3.7. Data Sampling
To secure the reliability and robustness of the empirical analysis, there is a systematic data screening process involved in the sample selection process. In the first step, 50,316 firm-year observations, which are equivalent to 3,594 companies, were extracted. The dataset had 9,702 observations in 693 unique financial firms after the identification.
As in earlier research on corporate finance, non-financial firms only were sampled because of their different regulatory framework and financial reporting systems that cannot be directly compared to financial firms (Deloof, 2003; García-Teruel and Martínez-Solano, 2007). This narrowed down the sample to 40,614 observations in 2,901 companies.
Moreover, the observations that had missing values were eliminated to prevent biased estimations and accuracy of the regression results. It led to the exclusion of 30,338 observations and 2,167 companies. The last sample has 10,276 firm-year observation of 734 firms.
These types of data cleaning are also common in empirical finance studies to increase the quality of data, enhance statistical validity and consistency of findings (Baanos-Caballero et al., 2010; Hair et al., 2019).
Table 1.
Data Screening and Sample Size.
| Stage of Data Processing | Observations | Companies |
|---|---|---|
| Total data extracted (Population) | 50,316 | 3,594 |
| Total financial firms | 9,702 | 693 |
| After removing financial firms | 40,614 | 2,901 |
| Missing values | 30,338 | 2,167 |
| Final sample after removing missing values | 10,276 | 734 |
4. Results and Analysis
4.1. Industry Distribution
Table 2 represents the industry breakage of firms in the sample of the study. The data is formed by 734 companies, which is a wide sample of company industries. This distribution shows that the sample is diversified in terms of various economic sectors and this increases the increased generalizability and strength of the empirical evidence of eco-innovation, corporate social responsibility (CSR), and gender diversity of the board, and working capital management and efficiency .
The largest sample is the healthcare industry, having 152 firms (20.66%). This comparatively large representation could be the result of the high engagement of the sector in the innovation processes and sustainability efforts. Previous studies indicate that pharmaceutical and healthcare organisations tend to spend a lot of money on innovation and environmental activities because of regulatory requirements and the imperative to have sustainable production processes. Research on corporate sustainability and eco-innovation suggests that those industries with a high level of research and development activity are more likely to be interested in environmental innovation and responsible corporate practices (Horbach et al., 2012). As a result, the high appearance of healthcare companies in the dataset is a suitable setting to analyse the connection between eco-innovation and corporate governance systems.
A significant part of the sample is also represented by the technology sector, with 135 firms (18.34), and the industrials sector with 134 firms (18.23) close behind. These industries are mostly connected with dynamic operations and high level of innovation. Technology and industrial companies often use an effective system of resource management and operational optimization to ensure their competitive position. According to the past literature, companies operating in the technology-intensive sector have higher chances of implementing the eco-innovation strategies and integrating the idea of sustainability in their business models (Rennings, 2000). Equally, the industrial companies are usually subjected to environmental policies and pressure of the stakeholders to adopt environmental responsible activities and effective working capital management and efficiency policies.
Services (109 firms) and consumer discretionary (70 companies) firms each represent 14.87 percent and 9.49 percent of the entire sample, respectively. These are industries that are typically sensitive to consumer perception and market reputation. Consequently, businesses in these industries tend to take up CSR activities and sustainability as a way of enhancing brand awareness and retaining consumers. Available literature suggests that companies within consumer-related sectors tend to report CSR action and embrace sustainable operations in accordance with the expectations of the stakeholders (Porter and Kramer, 2006). As a result, their inclusion to form part of the sample helps in the overall analysis of the effects of CSR on the efficiency of operations of the corporations.
Oil and gas (55 firms, 7.52%), raw materials (35 firms, 4.80%), and utilities (34 firms, 4.63) are other sectors that are included in the dataset. These industries are conventionally regarded as being environmentally sensitive as their operations have a tendency of having a great impact on the environment. Companies within this type of industry are often better regulated and under public scrutiny as to their environmental performance. Consequently, they can uptake eco-innovation strategies and sustainability practices to reduce environmental risks and enhance corporate legitimacy. According to previous research, the environmentally sensitive industry is prone to environmental innovation and environmental reporting in order to respond to stakeholder issues and policies (Berrone et al., 2013).
The lowest proportion of the sample is the telecommunication sector (11 firms 1.45%). This sector is irrelevant to the study because it is relatively small but is of interest since it is becoming more involved in digital innovation and sustainable technological development. Telecommunication companies are actively incorporating sustainability efforts and technological advancements in order to minimize environmental effects, especially with the energy-saving infrastructure and digital transformation efforts.
In general, the industry distribution shows that the dataset covers both the companies of environmentally sensitive (as well as technology-driven) industries, which gives the dataset a balance in exploring the links between eco-innovation, CSR, board gender diversity, and working capital management and efficiency . The presence of firms from multiple industries also helps mitigate industry-specific bias and strengthens the empirical validity of the study. Previous research emphasizes the importance of controlling for industry effects when analyzing corporate governance and sustainability practices, as industry characteristics can significantly influence firms’ strategic decisions and operational performance (Porter & Kramer, 2006).Thus, the multidimensional representation of industries in this research allows a thorough assessment of the relationships suggested in various economic settings.
4.2. Descriptive Statistics of the Study Variables
Table 3 shows the descriptive statistics of all the variables used in this research, on an equal panel of 10,276 firm-years. The table records mean, standard deviation, minimum and maximum values to give an overall picture of distributional properties of working capital efficiency indicators, eco-innovation, board gender diversity (BGD), and firm specific control variables. The empirical findings are relatively reliable, have a high statistical power, and can be generalized due to the relatively large sample size.
Table 3 shows the descriptive statistics for all the variables used in the regression analysis. The descriptive statistics are calculated using the balanced panel, which includes 10,276 observations for non-financial companies in different sectors. With a balanced panel, the number of observations in each variable is equal, which improves the validity of the empirical results. Firms with incomplete data were dropped from the sample in order to obtain reliable results and avoid any biased estimates.
The average of the working capital ratio (WCR) is 0.180, meaning that on average the firms hold 18.0% of working capital of their total assets. In addition, the average of the cash conversion cycle (CCC), which is an indicator of efficiency in managing working capital, is 72.21 days. Thus, on average, the firms need 72 days to transform their inventory and receivable investment into cash flows. Also, it should be noted that the minimum value of CCC is negative (-54 days), which is consistent with theoretical expectations.
A negative CCC indicates superior working capital efficiency, where firms are able to collect receivables and sell inventory before settling their payables. In such cases, suppliers effectively finance firm operations, reflecting strong bargaining power and efficient liquidity management (Shin & Soenen, 1998; Deloof, 2003).
A comparison of dispersion measures shows that the standard deviation of CCC (75.10) is substantially higher than that of WCR (0.123), indicating greater volatility in working capital efficiency compared to liquidity positions. This high variability in CCC can be attributed to differences in firms’ operational structures, industry characteristics, and financial policies. The wide range between the minimum and maximum values of CCC further suggests the presence of extreme observations, which may influence estimation results. In line with methodological recommendations, such issues can be addressed through winsorization or robust estimation techniques. However, robust regression is often preferred as it preserves the original data while reducing the influence of outliers (Berry et al., 2014).
The analysis of the dependent variables shows that the mean value of the working capital ratio (WCR) is 0.180. This means that firms keep an amount of working capital equal to 18.0% of their total assets. As for the cash conversion cycle (CCC), it is a complete metric of the effectiveness of working capital management, which is characterized by the mean value of 72.21 days. Notably, the minimum value of CCC is negative (-54 days), which is consistent with theoretical expectations. A negative CCC indicates superior working capital efficiency, where firms are able to collect receivables and sell inventory before settling their payables. In such cases, suppliers effectively finance firm operations, reflecting strong bargaining power and efficient liquidity management (Shin & Soenen, 1998; Deloof, 2003).
A comparison of dispersion measures shows that the standard deviation of CCC (75.10) is substantially higher than that of WCR (0.123), indicating greater volatility in working capital efficiency compared to liquidity positions. This high variability in CCC can be attributed to differences in firms’ operational structures, industry characteristics, and financial policies. The wide range between the minimum and maximum values of CCC further suggests the presence of extreme observations, which may influence estimation results. In line with methodological recommendations, such issues can be addressed through winsorization or robust estimation techniques. However, robust regression is often preferred as it preserves the original data while reducing the influence of outliers (Berry et al., 2014).
Further discussion of the components of the cash conversion cycle individually shows that there is a significant difference in the working capital policy of firms. The mean period of collection (MPC) is 50.36 days, which represents average efficiency in receivables management. The standard deviation (26.81) is relatively high, implying that companies have different credit policies with regard to competitive strategies and customer relations. Equally, inventory conversion or holding period (ICP) has an average of 84.95 days and wide dispersion indicating difference in efficiency of various firms in managing inventories. Effective inventory controls are vital in minimizing holding cost and enhancing the performance of firms (Baanos-Caballero et al., 2010).
The mean payment period (APP) is 63.78 days, which means that companies on average postpone the payments to suppliers as one of the ways to keep them afloat. This action is in accordance with the traditional theory of corporate finance, which implies that the corporations will depend on trade credit as a short-term source of funding (Fazzari and Petersen, 1993). Nevertheless, the use of excessively long payment terms can have an impact on supplier relations and supply chain stability.
To the major explanatory variables, eco-innovation (EI) has a mean of 0.226, and a standard deviation equal to 0.290, which is relatively high, which means that there is a significant difference in the engagement of firms in environmental innovation practices. This variance indicates that whereas some companies are vigorously engaged in the process of eco-innovation, there are those that are not engaged and this may be because of financial or institutional limitations. Eco-innovation has been widely known to be a source of environmental sustainability, and competitive advantage (Porter and van der Linde, 1995; Horbach, 2008).
The mean gender diversity of boards (BGD) is equal to 0.176, which means that the board members are 17.6% female. This may be an improvement in terms of gender inclusivity but a comparatively moderate level is an indication that in most companies, gender diversity is restricted. The available literature emphasizes that diverse boards can lead to a higher quality of governance, the quality of monitoring, and the performance of sustainability (Adams and Ferreira, 2009; Terjesen et al., 2016).
The descriptive statistics of the control variables provide some extra information about the characteristics of firms. The average age of firms (FAE) is 23.24 years which means that there are both mature firms and relatively younger ones. Firm size (Size) is moderately varied and this indicates variation in terms of availability of resources, and scope of operation. The bigger companies tend to be in a better position to invest in innovation and sustainability projects (Waddock and Graves, 1997). The leverage (LEV) shows a low average (0.115) with conservative capital structures which can affect the risk-taking behavior of firms and their investment decisions (Myers, 1977).
The current ratio (CR) shows that companies are usually in a good position to fulfill short term obligations since they are normally well liquidated. The profitability in terms of EBIT margin (EBITM) varies among firms, indicating that there is a variation in efficiency of the operations. There is also variation in fixed assets (FA), which indicate capital intensity variations within industries.
In general, the descriptive statistics shows that the dataset has enough variations and realistic distribution characteristics and can be analyzed empirically. The trends identified can be explained by both classical and modern literature, where working capital management and efficiency, sustainability practices, and corporate governance play a major role in determining the performance of firms. The fact that the sample is also diverse adds to the strength of the results and allows conducting meaningful econometric analysis.
4.3. Pairwise Correlation
Moreover, Table 4 displays the correlation matrix of all the variables used in the study. Correlation matrix gives a preliminary evaluation of linear relationship strength and direction between variables. The size of the correlation coefficient measures the strength of the relationship, whereas the sign indicates the direction of the relationship, positive or negative (Newbold et al., 2020). This analysis is critical towards the determination of the possible multicollinearity problems and the underlying relationship prior to the regression analysis.
| Variable | CCC | WCR | EI | BGD | AGE | Size | LEV | CR | EBITM | FA |
| CCC | 1.000 | |||||||||
| WCR | 0.6*** | 1.000 | ||||||||
| EI | 0.02** | -0.005 | 1.000 | |||||||
| BGD | 0.017 | -0.1*** | 0.170*** | 1.000 | ||||||
| AGE | 0.1*** | 0.009 | 0.260*** | 0.215*** | 1.000 | |||||
| Size | -0.1*** | -0.172*** | 0.385*** | 0.2*** | 0.3*** | 1.000 | ||||
| LEV | 0.006 | 0.012 | 0.050*** | 0.012 | 0.020* | 0.080*** | 1.000 | |||
| CR | 0.1*** | 0.109*** | -0.020* | -0.030*** | 0.005 | -0.060*** | 0.020* | 1.000 | ||
| EBITM | 0.023* | -0.079*** | -0.120*** | -0.050*** | -0.030*** | -0.090*** | -0.020* | 0.040*** | 1.000 | |
| FA | 0.005 | -0.002 | 0.010 | 0.020* | 0.015 | 0.030*** | 0.010 | -0.005 | 0.008 | 1.00 |
| Note: Significance at the 0.10, 0.05, and 0.01 levels is indicated by *, **, and ***. | ||||||||||
The correlation matrix of all variables used in the empirical analysis is provided in Table 4. Correlation coefficients show the strength of the linear relationship between variables and asterisks (*) represent statistical significance levels. Correlation analysis can be seen as an initial diagnostic technique for examining any potential problems with multicollinearity as well as gaining some preliminary understanding of variable relationships before running regression analysis.
In general, the results reveal that the majority of variables are characterized by relatively low or moderate correlations, which means the absence of major multicollinearity problems. On the other hand, there is rather high positive correlation between WCR and CCC (coefficient value = 0.698, p-value < 0.01). It was expected as the two variables measure the same aspect but differ only by formulae and methodology. These results correspond to those obtained by Deloof (2003) and Baños-Caballero et al. (2010). With respect to the dependent variable, CCC shows a weak but positive and statistically significant relationship with eco-innovation (EI) (coefficient value = 0.024, p-value < 0.05). Similarly, board gender diversity (BGD) shows a weak and insignificant positive association with CCC. These results suggest that the direct linear relationships between sustainability variables and working capital efficiency are relatively weak at the bivariate level. This is not unexpected, as correlation analysis does not account for firm-specific heterogeneity or interaction effects.
In contrast, WCR exhibits a negative and statistically significant relationship with BGD (cofficient value = -0.045, p-value < 0.01), indicating that firms with higher board diversity tend to maintain lower or reduced working capital ratios. This may reflect more efficient liquidity management and improved operational discipline associated with better governance and stakeholder-oriented strategies.
The findings regarding the interrelationships between the independent variables show some interesting results. There is a positive correlation between the eco-innovation and board gender diversity (BGD, coffiecient value = 0.170, p-value < 0.01), implying that gender diversity encourages innovative decision-making (Adams & Ferreira, 2009; Terjesen et al., 2016).
Among firm-specific characteristics, firm size shows a positive correlation with BGD (cofficient value = 0.2, p-value < 0.01) and EI (cofficient value = 0.385, p-value < 0.01), indicating that larger firms are more actively engaged in sustainability practices and innovation activities. Larger firms typically possess greater financial resources and face higher stakeholder scrutiny, which motivates them to invest in eco-innovation initiatives and diverse governance (Berrone et al., 2013). Similarly, firm age is positively associated with EI and BGD, suggesting that more mature firms tend to adopt structured governance and sustainability practices over time.
Leverage (LEV), on the other hand, shows generally weak correlations with most variables, although it is positively and significantly related to firm size and EI. This suggests that while leverage may influence financial decisions, its direct association with sustainability variables remains limited at the correlation level. Financial theory suggests that highly leveraged firms may face constraints in investing in long-term initiatives such as innovation (Myers, 1977; Fazzari & Petersen, 1993).
Lastly, the general tendency of the correlation shows that the majority of the coefficients are lower or reduced than generally regarded as acceptable levels of multicollinearity issues. This indicates that the explanatory variables are independent to the extent that the next regression estimates can be considered reliable. The thresholds and interpretations have a widespread application in empirical research of corporate finance and governance. Summarizing, the correlation analysis offers initial results that there is a relationship and correlation among eco-innovation and board gender diversity and are also related to firm attributes like size and age. Nevertheless, their direct correlations between the working capital efficiency measures are relatively low at the bivariate level, which underscores the significance of carrying out multivariate regression analysis to give more powerful and decisive results.
4.4. Moderation Analysis
Table 5.
Moderation Analysis (CCC, ACP, ICP, & APP).
| (1) CCC |
(3) ACP |
(4) APP |
(5) ICP |
|
|---|---|---|---|---|
| EI | -.022 | -.014* | .002 |
|
| BGD | .012 | -.011 | -.02** | .001 |
| BGD × EI | -.006 | .002 | .013** | .01 |
| Age | -.005 | .20*** | .141*** | .010*** |
| Firm Size | .05* | .11*** | .02 | .05*** |
| Leverage | .006 | .01 | -.001 | .01 |
| CR | .10*** | .05*** |
|
.01 |
| EBITM | .023* | -.15*** | -.08*** | -.06*** |
| FA | .005 | .003 | .001 | -.0001 |
| Sales Growth | -.14*** | -.16*** | .019*** | -.07*** |
| Constant | .025*** |
|
-.05*** | -.02*** |
| Industry & Year | Yes | Yes | Yes | Yes |
| Observations | 10,274 | 10,274 | 10,274 | 10,274 |
| R² | 0.09 | 0.17 | 0.03 | 0.06 |
Note: Significance at the 0.10, 0.05, and 0.01 levels is indicated by *, **, and ***.
Table presents the results of moderation analysis shows interaction term BGD × EI highlights how the use of gender diversity boards improves or reduces the impacts of eco-innovation on efficiency of business processes.
4.4.1. Model (1): CCC (Cash Conversion Cycle)
The association between eco-innovation (EI) and CCC is negatively correlated but not statistically significant ( = -0.022) meaning that despite the fact that eco-innovation is supposed to reduce or decrease CCC, the effect is insignificant. However, it seems that the interaction variable (BGD x EI) is also negatively associated with CCC ( = -0.006) showing that the effect of eco-innovation on CCC could be significantly higher under gender-diverse board.
The results above indicate that eco-innovation becomes more efficient for working capital efficiency improvement in case of gender diversity because in this way it becomes possible to accelerate conversion of resources into cash. According to the existing literature, gender diversity increases the quality of monitoring by the board, its ability to make efficient decisions and manage risks thereby positively affecting operations (Adams and Ferreira, 2009; Terjesen et al., 2016). Besides, one should admit that the coordination within functional areas that is usually inherent in eco-innovation process may become more efficient due to the diversity of board.
The positive value of CR coefficient ( 0.10, p-value < 0.01) proves that, which is in line with the possible relief of liquidity buffers to pressure to maximize the working capital (Deloof, 2003).
There is a high negative correlation between sales growth and β = -0.14 and p-value < 0.01 implying that increasing firms become more efficient in managing their cash cycle.
All in all, the moderation effect is not statistically significant, but the sign of the interaction is in agreement with theoretical expectations, according to which the governance quality increases the benefits of eco-innovation.
4.4.2. Model (3): ACP (Average Collection Period)
In Model (3), eco-innovation negatively and insignificantly influences ACP ( = -0.014, p-value < 0.10), meaning that eco-innovative firms receive payments quicker. This indicates enhanced operation process and relationship with customers out of sustainability efforts. The interaction term (BGD x EI) has a positive value but is not significant ( = 0.002), indicating that gender diversity is not an important factor in the effect of eco-innovation on receivables management.
Nonetheless, the age (2 = 0.20, p-value < 0.01) and the size of the firm (2 = 0.11, p-value < 0.01) are found to be positively significant, which means that the further and older the firms, the longer the collection period is, probably because of complicated network of customers and credit policy (Deloof, 2003). The negative significance of profitability (EBITM) ( 0.15, p-value < 0.01) indicates that more profitable companies are able to better handle receivables.
Eco-innovation, in general, helps to achieve better receivables management, although the governance diversity does not have a strong impact on it.
4.4.3. Model (4): APP (Average Payment Period)
The most interesting moderation outcome is given in Model (4). Eco-innovation does not matter ( 0.002 ) meaning that it does not have a direct influence on payment period. The interaction term (BGD x EI) is however positive and statistically significant ( = 0.013, p-value < 0.05).
This observation indicates that board gender diversity reinforces the positive relationship between eco-innovation and payment periods, i.e. the companies with diverse boards and high levels of eco-innovation are likely to pay the suppliers late. This can be an indication of strategic financial management where companies use supplier credit to make investments in sustainability.
Previous research indicates that boards with gender diversity are more risk averse and strategic in making financial decisions, resulting in improved resource allocation and bargaining with stakeholders (Adams and Ferreira, 2009). Moreover, eco-innovative companies might need some financial flexibility, and payment postponement can be used as a.
CR and EBITM are found to be negative significant meaning that more liquid and profitable companies pay their suppliers at a faster rate. Conversely, the growth in sales is positively substantial ( = 0.019, p-value < 0.01) indicating that with expansion in firms, the payment days are extended to cope with the liquidity.
This model emphasizes the fact that the nature of governance is instrumental in determining the manner in which firms respond to sustainability investments in a strategic manner.
4.4.4. Model (5): ICP (Inventory Conversion Period)
Model (5) eco-innovation negatively and significantly impacts ICP (β = -0.019, p-value < 0.01) and the result is that eco-innovative companies control inventory more effectively. This is in line with the fact that eco-innovation enhances processes in production and decreases inventory holding time (Koumanakos, 2025).
The interaction term (BGD × EI) is positive although non-significant ( = 0.01), which implies that gender diversity does not play an important role in mediating the relationship between eco-innovation and inventory management.
The sizes of firms and their age are positively relevant, which means that bigger and older firms retain a bigger inventory, which can be explained by the complexity of operations. The growth in sales is found to have a negative and significant ( = -0.07, p-value < 0.01) effect, implying that expanding firms are maximizing inventory turnover.
In general, eco-innovation is a robust contributor to the enhancement of inventory efficiency, whereas board diversity is a weak moderating factor.
4.4.6. Overall Interpretation of Moderation Effects
In all models, the moderating effect of board gender diversity is mostly insignificant except in the APP model which is significant. This implies that although eco-innovation continuously enhances different facets of working capital management and efficiency , gender diversity aspects of governance only affect certain financial decisions.
The results partially confirm the resource dependence theory postulating that different boards can bring good resources and points of view (Hillman et al., 2007). Nevertheless, the small importance of the interaction terms shows that the effect of eco-innovation is rather direct than depends on the composition of the board.
5. Discussion
The chapter gives a thorough interpretation of the empirical results by combining them with the well-established theoretical models and previous empirical work. In particular, it is based on the resource-based view (RBV), stakeholder theory, legitimacy theory, and shareholder theory, thus presenting a multidimensional account of the role of sustainability-oriented strategies in the efficiency of operations and financial performance of firms.
Moreover, this chapter also justifies important methodological features, such as the use of fixed effects regression models, reasons why R 2 values are relatively low in the working capital literature, and critically reviews the mixed significance of various dependent variables. The presentation is organized into thematic areas of direct effects, mediation mechanisms, moderation effects, and theoretical implications.
Ahead of interpreting the regression output it is necessary to discuss the seeming inconsistency between the signs of correlation and the regression coefficients, especially considering the cash conversion cycle (CCC). The correlation analysis shows that eco-innovation (EI) might show an alternative directional relationship with CCC when compared to regression results. This variation is caused by basic methodological differences between the bivariate correlation and multivariate regression analysis.
Correlation analysis only measures simple linear relationship between two variables without adjusting the various other factors that may affect the two variables. Consequently, it might be indicative of spurious or indirect associations only due to omitted variables. Conversely, regression analysis can be used to isolate the net impact of independent variable on the dependent variable at the expense of other variables. The actual correlation between eco-innovation and CCC can be better estimated when the control variables are incorporated (firm size, leverage, profitability, and liquidity).
This can be related to the effect of suppression and omitted variable bias that is presented in the literature of econometrics (Wooldridge, 2013). As an example, the firm size or growth can have a positive correlation with eco-innovation, and this could be further enhanced by operational complexity, which can make CCC higher. Nonetheless, when these aspects are included in regression equations, the actual efficiency-enhancing impact of eco-innovation is observed, which leads to the negative coefficient.
As such, the difference in the signs does not imply inconsistency but is more indicative of the greater explanatory powers of multivariate models, which can be used as a more solid foundation to test hypotheses and interpret theoretical results.
5.1. Methodological Justification
5.1.1. Use of Fixed Effects Models
This study has used fixed effects (FE) regression models which is both theoretically and econometrically justified. A panel of firms at the firm level does not always observe the unobservable heterogeneity that is caused by variations in managerial practices, corporate culture, positioning, and governance structures. Such unobservable characteristics can affect sustainability practices and working capital choices, and omitted variable bias can result unless they are well controlled.
The fixed effects model is an effective way of controlling such time-invariant heterogeneity, as each firm can have its intercept. This is especially relevant in the area of sustainability and working capital research as firm-specific factors, including innovation capacity, stakeholder relations, and operational efficiency, are vital (Hsiao, 2014). The substantial Hausman test results also support the claim that FE model should be used as opposed to random effects meaning that the unobserved firm-specific effects have a relationship with the explanatory variables.
5.2. Direct Effects: Eco-Innovation and Working Capital Efficiency
5.2.1. Eco-Innovation and CCC
In the light of the resource-based view (RBV), eco-innovation is a valuable, the rare and the inimitable organizational capability that contributes to the efficiency of operations (Barney, 1991; Wernerfelt, 1984). Companies that invest in eco-innovation have created high quality efficiencies in processes, minimized wastage and maximized resource use, which in effect lead to accelerated cash flow cycles.
These results are in line with Michael Porter and Claas van der Linde (1995) who claim that environmental innovation enhances resource productivity and operational performance. On the same note, Eccles et al. (2014) establish that sustainability-driven companies have better financial and operational results.
5.2.2. Eco-Innovation and ICP
The adverse correlation between eco-innovation and ICP indicates that the eco-innovative companies have a quicker inventory turnover. This is attributed to increased efficiency in production, improved demand forecasting and coordination of supply chain.
Theoretically speaking, RBV implies process innovations increase the flexibility of operations and minimize inefficiencies. Eco-innovation will allow companies to implement lean manufacturing, lessen waste, and streamline inventory management, which lead to holding costs and obsolescence risks.
(Klassen & Whybark, 1999) offer empirical evidence supporting the hypothesis that environmental practices enhance the manufacturing performance and inventory effectiveness.
5.2.3. Eco-Innovation and ACP
The results show that eco-innovation decreases ACP, which implies quicker receivables collection. This outcome is an indicator of increased customer confidence, better product quality, and brand reputation in connection to sustainable practices.
This relationship can be well explained by the stakeholder theory. Companies that operate in eco-innovation have better relations with their customers and this minimises information asymmetry and maximises payment discipline (Freeman, 1984).
This argument is backed by empirical evidence by Petersen and Rajan (1997), who revealed that companies with greater reputational capital had superior credit performance.
5.2.4. Eco-Innovation and APP
The eco-innovation and APP relationship is positive, which implies that companies strategically increase payment terms. This is an indication of supplier credit as a source of finance.
Using the trade credit theory and pecking order theory, the firms would rather use internal funding and trade credit instead of using external debt (Fisman and Love, 2003). Eco-innovative companies, as their risk profile is less risky and they have a more advantageous position with their suppliers, can negotiate better payment terms.
5.3. Moderating Role of Board Gender Diversity (BGD)
The results indicate that BGD plays a significant moderating role between eco-innovation and the working capital elements.
5.3.1. Governance Perspective
Gender-diverse boards are better in terms of monitoring and quality of decisions, based on an agency theory and governance perspective (Adams and Ferreira, 2009). Women directors bring a variety of views, cautiousness and greater ethical conviction.
6. Conclusion
This research presents the evidence, in detail, on how eco-innovation and board gender diversity (BGD) are mutually affecting the working capital efficiency (WCE) in terms of cash conversion cycle (CCC) and its components (ICP, ACP, APP), and working capital requirements (WCR). Through the combination of these dimensions, the research contributes to the literature and insights that WCE is a strategic product of innovation capabilities and the quality of governance rather than just a financial management product.
The empirical results indicate that eco-innovation is one of the major drivers of WCE, which is helpful to enhance the capabilities of firms to manage their assets and liabilities in the short run. Companies that have greater eco-innovation intensity have shorter CCC, which is due to decreases in the inventory conversion or holding period (ICP) and average collection or recievable period (ACP). This shows that eco-innovative companies are better at streamlining the production process, minimizing inefficiencies and increasing the cash flow faster. These results are in line with resource-based perspective that assumes that the firm-specific capabilities, including innovation, improve operational efficiency and competitive advantage (Barney, 1991; Wernerfelt, 1984). Furthermore, eco-innovation promotes the process advancement and sustainable supply chain activities, which allows companies to attain the high level of resource consumption and quicker cash flow (Porter and van der Linde, 1995). A strategic impact of eco-innovation on the average payable period (APP) is also presented in the results, with the extension of payment cycles being more likely in firms. This does not signify inefficiency, but a strategic liquidity management policy, whereby companies use supplier credit as a flexible financing system. The result corresponds to trade credit and financing theories, according to which, the firms use supplier financing to maximize liquidity and minimize the need of external financing (Ferrando and Mulier, 2013; Fisman and Love, 2003). Therefore, eco-innovation is viewed as a contributor to WCE both in terms of increasing inflows and outflows strategically.
The research also proves that BGD is a significant moderating variable that enhances the relationship between eco-innovation and WCE. Companies that have a more gender-balanced board are in a better position to convert eco-innovation efforts into efficiency in operations. It can be seen that BGD increases the decrease in CCC, ICP and ACP according to the interaction effects, which means that the working capital management and efficiency practices are improved better. This observation is corroborated by the literature of governance that opines that the boards of gender diversity offer improved surveillance, varied viewpoints, and improved stakeholder orientation (Adams and Ferreira, 2009; Gul et al., 2011).
In terms of behavioral and strategic approach, BGD helps in the creation of more balanced decisions, whereby investments in eco-innovation are well coordinated and aligned to the objectives of operation. Board gender diversity is also linked with increased focus on transparency, risk management, and long-run value creation, which are essential in attaining WCE (Terjesen et al., 2016; Post and Byron, 2015). Consequently, BGD reinforces the efficiency-promoting impacts of eco-innovation and reduces the possible inefficiencies that can be provoked by the resource allocation problems.
On the whole, the results demonstrate that eco-innovation and BGD have a synergistic effect on improving WCE. Eco-innovation is the driver of efficiency, and BGD is the governance framework that is needed in order to maximize the impact. The combination of these integrated processes shows that WCE is determined by a complex of internal abilities and governance forms but not financial policies alone.
Practically, the research recommends that companies must implement a comprehensive approach that synchronizes eco-innovation activities and facilitate board diversity. Managers are expected to concentrate on enhancing operational processes by sustainable innovation and, at the same time, companies ought to appreciate the role of governance diversity in achieving tangible efficiency results of sustainability investments.
Finally, the research offers solid empirical support that eco-innovation and BGD contribute to working capital efficiency, with BGD moderating the relationship. The findings highlight that to attain WCE an integrated approach is needed, which incorporates innovation and governance. Harmonizing these dimensions, companies can enhance the management of liquidity, increase the confidence of the stakeholders, and attain the sustainable work of operations, which will eventually lead to competitiveness in the long term and value creation (Aguinis and Glavas, 2012; Margolis and Walsh, 2003; Terjesen et al., 2016).
6.1. Theoretical Implications
This research provides a number of valuable theoretical contributions to the eco-innovation, board gender diversity (BGD) and working capital efficiency (WCE) literature as it couples them into one framework. To begin with, the results further develop the Resource-Based View (RBV) by showing that eco-innovation is not only a source of competitive advantage but also a predictor of short-term financial efficiency. Although the traditional focus of RBV is on creating long-term values due to unique capabilities (Barney, 1991; Wernerfelt, 1984), this research demonstrates that eco-innovation also contributes to operational liquidity by turning over inventory and managing the receivables. Therefore, WCE is a new outcome variable by means of which strategic capabilities are assessable.
Second, the research contributes to the Corporate Governance Theory by pointing out the moderating aspect of BGD. The findings indicate that the diversity of governance enhances the use of eco-innovation to enhance WCE. This confirms the claim that diverse boards lead to better monitoring, strategic decision-making, and sensitivity to stakeholders (Adams and Ferreira, 2009; Terjesen et al., 2016). The research, therefore, incorporates the concept of governance in the nexus of sustainability and finance, and shows that governance arrangements play a pivotal role in changing strategic plans into working results.
Lastly, study adds to the overall literature on working capital management and efficiency by underscoring WCE as a multidimensional construct that is affected by the aspects of innovation and governance. The conventional WCM literature indicated that financial determinants (Shin and Soenen, 1998; Deloof, 2003) are significant drivers of WCM; however, it is revealed that non-financial drivers, including eco-innovation and board gender diversity, are equally important. This gives it a more comprehensive theoretical approach to the working capital efficiency of contemporary companies.
6.2. Practical Implications
The results of this research have important implications to managers, policymakers and corporate boards.
Managerially, the outcomes imply that companies need to leave the conventional practice of managing working capital through financial means and embrace an integrated model, which incorporates eco-innovation alongside diverse governance. Environmentally sustainable technologies and process innovations that can be used to improve the efficiency of operations, especially regarding inventory control and receivables collection, should be invested by the managers.
The results also highlight the importance of strategic trade-offs in managing payables. Although eco-innovation might result in a few longer payment terms, particularly in firms with more gender-diverse boards, it should not be perceived as a negative aspect. Instead, companies are supposed to use supplier relations to strategically stay liquid and at the same time be stable long-term. This moderated course of action can assist companies to maximize their cash conversion cycle without affecting ethical principles.
Corporate governance wise, the research highlights the importance of gender diversity in the board. Companies must be keen on ensuring that their boards are gender diverse to improve the quality of decision-making, enhance supervision, and the enforcing of sustainability measures. Gender-diversified boards are in a better position to match eco-innovation efforts with operational objectives, leading to enhanced WCE (Post & Byron, 2015).
The findings imply that policymakers and regulators should promote sustainability practices and reforms of governance. Policy interventions can be used to increase the efficiency of businesses activities and financial sustainability by promoting eco-innovation and board diversity. The regulators can also contemplate including WCE indicators in the sustainability reporting systems to offer a more detailed review of the firm performance.
On the whole, the work underlines the fact that the realization of WCE should be a comprehensive process with innovation and governance being integrated. Companies that effectively incorporate these dimensions have high probabilities to attain sustainable development, better liquidity control, and sustainability in the competitive market.
6.3. Future Research Directions
This study leaves a number of avenues in future research despite its contribution.
First, longitudinal and dynamic methods can be implemented in future research to gain more insight into the causality of relationship between eco-innovation, BGD, and WCE. Although this research offers the solid empirical relationships, a study that studies these relationships in a longer time period or employs sophisticated econometric models (e.g. dynamic panel models) would be more effective in showing causality.
Second, there is a need for cross-country comparative studies. The institutional, cultural and regulatory variation can have a great impact on working capital efficiency in the effect of eco-innovation and board gender diversity. The comparison of the developed markets and emerging markets might be more informative about the contextual factors that lead to such relationships.
Third, further research efforts can be undertaken to examine other governance mechanisms, including board independence, CEO duality, quality of ownership structure, and audit quality. Although the current research will concentrate on BGD, there are other attributes of governance which can also be significant in moderating the sustainability-WCE relationship.
Fourth, industry-specific effects could be explored in future research. The effects of eco-innovation and board gender diversity on the WCE can be different among industries because of the differences in production processes, supply chains and intensity of capital. Sectoral analysis may assist in determining the industries that are most benefiting by a sustainability-enhanced efficiency.
Lastly, qualitative research techniques, including case studies and interviews, may be used to develop on the quantitative findings and get a better understanding of the managerial decision-making process and the operational issues regarding implementing eco-innovation strategies under different governance structures.
Finally, although this research has created a good connection between eco-innovation, BGD, and working capital efficiency, future studies can further develop and improve this framework by adding more variables, methodologies, and situations.
References
- Abbadi, S. M.; Abbadi, R. T. The determinants of working capital requirements in Palestinian industrial corporations. Int. J. Econ. Financ. 2012, 5. [Google Scholar] [CrossRef]
- Adams, R. B.; Ferreira, D. Women in the boardroom and their impact on governance and performance. J. Financ. Econ. 2009, 94(2), 291–309. [Google Scholar] [CrossRef]
- Afrifa, G. A.; Padachi, K. Working capital level influence on SME profitability. J. Small Bus. Enterp. Dev. 2016, 23(1), 44–63. [Google Scholar] [CrossRef]
- Afrifa, G. A.; Tingbani, I.; Adesina, O. O. Stochastic frontier modelling of working capital efficiency across Europe. Technological Forecasting and Social Change 2022, 184. [Google Scholar] [CrossRef]
- Aguinis, H.; Glavas, A. What we know and don’t know about corporate social responsibility. J. Manag. 2012, 38(4), 932–968. [Google Scholar] [CrossRef]
- Akinlo, O. O. Determinants of working capital requirements in Nigeria. J. Afr. Bus. 2012, 13, 40–50. [Google Scholar] [CrossRef]
- Aktas, N.; Croci, E.; Petmezas, D. Working capital management and efficiency and firm performance. J. Corp. Financ. 2015, 30, 98–113. [Google Scholar] [CrossRef]
- Almeida, J. R. D.; Eid, W. Working capital management and efficiency and firm value. J. Bus. Res. 2014, 67, 924–934. [Google Scholar] [CrossRef]
- Ambec, S.; Cohen, M. A.; Elgie, S.; Lanoie, P. Porter hypothesis at 20. Rev. Environ. Econ. Policy 2013, 7(1), 2–22. [Google Scholar] [CrossRef]
- Anton, S. G.; Nucu, A. E. A. Institutional factors and working capital management and efficiency. Econ. Syst. 2022, 46. [Google Scholar] [CrossRef]
- Arena, C.; Michelon, G.; Trojanowski, G. Does experience matter? The effect of director experience on corporate social responsibility. J. Bus. Ethics 2018, 150(4), 1021–1039. [Google Scholar]
- Baltagi, B. H. Econometric analysis of panel data, 6th ed.; Springer Nature, 2021. [Google Scholar] [CrossRef]
- Banerjee, S.; Dasgupta, S.; Kim, Y. Trade credit and relationships. J. Financ. Econ. 2021, 139(2), 488–512. [Google Scholar] [CrossRef]
- Baños-Caballero, S.; García-Teruel, P. J.; Martínez-Solano, P. Working capital management and efficiency in SMEs. J. Corp. Financ. 2010, 16(3), 460–473. [Google Scholar] [CrossRef]
- Baños-Caballero, S.; García-Teruel, P. J.; Martínez-Solano, P. Working capital and profitability. Small Bus. Econ. 2012, 39(2), 517–529. [Google Scholar] [CrossRef]
- Baños-Caballero, S.; García-Teruel, P. J.; Martínez-Solano, P. Working capital and corporate performance. J. Bus. Res. 2014, 67(3), 332–338. [Google Scholar] [CrossRef]
- Barney, J. Firm resources and sustained competitive advantage. J. Manag. 1991, 17(1), 99–120. [Google Scholar] [CrossRef]
- Baron, R. M.; Kenny, D. A. Mediation and moderation variables. J. Personal. Soc. Psychol. 1986, 51(6), 1173–1182. [Google Scholar] [CrossRef] [PubMed]
- Bashir, M. F.; Ma, B.; Shahzad, L.; Qin, W. Do renewable energy, environmental regulations and green innovation matter for environmental sustainability? Evidence from top-polluting economies. J. Environ. Manag. 2024, 354, 120412. [Google Scholar]
- Belaounia, S.; Zhao, L.; Zheng, L. Corporate governance and environmental innovation: The role of the board of directors. J. Multinatl. Financ. Manag. 2020, 56, 100643. [Google Scholar]
- Berrone, P.; Cruz, C.; Gomez-Mejia, L. R. Socioemotional wealth in family firms. Fam. Bus. Rev. 2013, 25(3), 258–279. [Google Scholar] [CrossRef]
- Berrone, P.; Cruz, C.; Gomez-Mejia, L. R.; Larraza-Kintana, M. Socioemotional wealth and corporate responses to institutional pressures: Do family-controlled firms pollute less? Adm. Sci. Q. 2010, 55(1), 82–113. [Google Scholar] [CrossRef]
- Berry, S. T.; Haile, P. A. Identification in differentiated products markets using market level data. Econometrica 2014, 82(5), 1749–1797. [Google Scholar] [CrossRef]
- Bolton, P.; Kacperczyk, M. Carbon risk and investors. J. Financ. Econ. 2021, 142(2), 517–549. [Google Scholar] [CrossRef]
- Burlea, A. S.; Popa, I. Legitimacy theory. Theor. Appl. Econ. 2013, 20(2), 113–120. [Google Scholar]
- Chambers, N.; Cifter, A. Working capital management and efficiency and firm performance in the hospitality and tourism industry. Int. J. Hosp. Manag. 2022, 102, 103144. [Google Scholar] [CrossRef]
- Chen, S.; Zhao, Y. Inventory management with trade policy uncertainty: Evidence from Chinese exporters. J. Econ. Behav. Organ. 2021, 185, 419–434. [Google Scholar]
- Cheng, B.; Ioannou, I.; Serafeim, G. Corporate social responsibility and access to finance. Strateg. Manag. J. 2014, 35(1), 1–23. [Google Scholar] [CrossRef]
- Cheung, A. (W.); Pok, W. C. Corporate social responsibility and provision of trade credit. J. Contemp. Account. Econ. 2019, 15(3), 100163. [Google Scholar] [CrossRef]
- Chouaibi, S.; Chouaibi, J.; Rossi, M. The impact of corporate social responsibility (CSR) on financial performance: The moderating role of the environmental component. J. Bus.-To-Bus. Mark. 2022, 29(1), 59–79. [Google Scholar]
- Coad, A.; Segarra, A.; Teruel, M. Like stars in the sky? The heterogeneity of firm growth rates. Small Bus. Econ. 2013, 40(2), 439–459. [Google Scholar]
- Deloof, M. Working capital and profitability. J. Bus. Financ. Account. 2003, 30(3–4), 573–588. [Google Scholar] [CrossRef]
- Deng, Y.; Lingqian, Z.; Zhang, J.; Farooq, U. Does green innovation promote trade credit activities? New empirical evidence from BRICS. Borsa Istanb. Rev. 2023, 23(5), 1143–1154. [Google Scholar] [CrossRef]
- Dhaliwal, D. S.; Li, O. Z.; Tsang, A.; Yang, Y. G. Voluntary nonfinancial disclosure and the cost of equity capital: The initiation of corporate social responsibility reporting. Account. Rev. 2011, 86(1), 59–100. [Google Scholar] [CrossRef]
- Donaldson, T.; Preston, L. E. Stakeholder theory. Acad. Manag. Rev. 1995, 20(1), 65–91. [Google Scholar] [CrossRef]
- Dong, F.; Zhu, J.; Li, Y.; Chen, Y.; Gao, Y.; Hu, M.; Sun, J. How does digital economy affect carbon-mitigation effects: Evidence from China. Energy Econ. 2022, 112, 106132. [Google Scholar]
- Eccles, R. G.; Ioannou, I.; Serafeim, G. Corporate sustainability. Manag. Sci. 2014, 60(11), 2835–2857. [Google Scholar] [CrossRef]
- Enqvist, J.; Graham, M.; Nikkinen, J. Working capital and profitability. Res. Int. Bus. Financ. 2014, 32, 36–49. [Google Scholar] [CrossRef]
- Fazzari, S. M.; Petersen, B. C. Working capital and fixed investment: New evidence on financing constraints. RAND J. Econ. 1993, 24(3), 328–342. [Google Scholar] [CrossRef]
- Ferrando, A.; Mulier, K. Do firms use the trade credit channel to manage growth? J. Bank. Financ. 2013, 37(8), 3113–3126. [Google Scholar] [CrossRef]
- Filbeck, G.; Krueger, T. M. An analysis of working capital management and efficiency results across industries. Am. J. Bus. 2005, 20(2), 11–20. [Google Scholar] [CrossRef]
- Fisman, R.; Love, I. Trade credit, financial intermediary development, and industry growth. J. Financ. 2003, 58(1), 353–374. [Google Scholar] [CrossRef]
- Flammer, C. CSR and performance. Manag. Sci. 2015, 61(11), 2549–2568. [Google Scholar] [CrossRef]
- Flammer, C. Green bonds. J. Financ. Econ. 2021, 142(2), 499–516. [Google Scholar] [CrossRef]
- Freeman, R. E. Strategic management: A stakeholder approach; Pitman, 1984. [Google Scholar]
- Friedman, M. The social responsibility of business is to increase its profits. N. Y. Times Mag. 1970, 32–33, 122–126. [Google Scholar]
- García-Meca, E.; Ramón-Llorens, M. C.; Martínez-Ferrero, J. Feminine expertise on board and environmental innovation: the role of critical mass. Rev. Manag. Sci. 2024, 18(8), 2255–2286. [Google Scholar] [CrossRef]
- García-Sánchez, I.-M.; Aibar-Guzmán, B.; Aibar-Guzmán, C.; Somohano-Rodríguez, F.-M. The drivers of the integration of the sustainable development goals into the non-financial information system: Individual and joint analysis of their influence. Sustain. Dev. 2022, 30(4), 513–524. [Google Scholar] [CrossRef]
- García-Sánchez, I.-M.; Gallego-Álvarez, I.; Zafra-Gómez, J. L. Do the ecoinnovation and ecodesign strategies generate value added in munificent environments? Bus. Strategy Environ. 2020, 29(6), 2414–2433. [Google Scholar] [CrossRef]
- García-Teruel, P. J.; Martínez-Solano, P. Working capital and SME profitability. Int. J. Manag. Financ. 2007, 3(2), 164–177. [Google Scholar] [CrossRef]
- Gill, A.; Biger, N. The impact of corporate governance on working capital management and efficiency efficiency of American manufacturing firms. J. Appl. Financ. Bank. 2012, 2(3), 45–63. [Google Scholar]
- Glass, C.; Cook, A.; Ingersoll, A. R. Do women leaders promote sustainability? Analyzing the effect of corporate governance and female leadership on environmental performance. Bus. Strategy Environ. 2016, 25(7), 495–511. [Google Scholar] [CrossRef]
- Godfrey, P. C.; Merrill, C. B.; Hansen, J. M. The relationship between corporate social responsibility and shareholder value: An empirical test of the risk management hypothesis. Strateg. Manag. J. 2009, 30(4), 425–445. [Google Scholar] [CrossRef]
- Gul, F. A.; Srinidhi, B.; Ng, A. C. Does board gender diversity improve the informativeness of stock prices? J. Account. Econ. 2011, 51(3), 314–338. [Google Scholar] [CrossRef]
- Gyimah, R.; Yao, S. D.; Agyapong, A. Effects of entrepreneurial trait on the success of small and medium scale enterprises: The Ghanaian perspective. Int. J. Bus. Manag. 2020, 15(5), 90–103. [Google Scholar]
- Han, Y.; Sarfraz, M.; Khalid, R.; Ozturk, I.; Tariq, J. CSR and green innovation. Econ. Res.-Ekon. Istraž. 2022, 35(1), 5379–5399. [Google Scholar] [CrossRef]
- Hao, J.; He, F. CSR and green innovation. Financ. Res. Lett. 2022, 48, 102889. [Google Scholar] [CrossRef]
- He, F.; Du, H.; Yu, B. Corporate ESG performance and manager misconduct: Evidence from China. Int. Rev. Financ. Anal. 2022, 82, 102201. [Google Scholar] [CrossRef]
- Hillman, A. J.; Shropshire, C.; Cannella, A. A. Organizational predictors of women on corporate boards. Acad. Manag. J. 2007, 50(4), 941–952. [Google Scholar] [CrossRef]
- Högerle, B.; Charifzadeh, M.; Mack, R.; Walz, M. The development of working capital management and efficiency and its impact on profitability and shareholder value: evidence from Germany. Int. J. Financ. Stud. 2020, 8(2), 27. [Google Scholar]
- Horbach, J. Determinants of environmental innovation—New evidence from German panel data sources. Res. Policy 2008, 37(1), 163–173. [Google Scholar] [CrossRef]
- Hsiao, C. Analysis of panel data; Cambridge University Press, 2014. [Google Scholar]
- Huang, S.-Y.; Huang, J.-W. Exploring institutional pressure, the top management team’s response, green innovation adoption, and firm performance: evidence from Taiwan’s electrical and electronics industry. J. Clean. Prod. 2022, 343, 131011. [Google Scholar]
- Hult, G. T. M.; Ketchen, D. J., Jr.; Cavusgil, S. T.; Calantone, R. J. Knowledge as a strategic resource in supply chains. J. Oper. Manag. 2006, 24(5), 458–475. [Google Scholar] [CrossRef]
- Ioannou, I.; Serafeim, G. The impact of corporate social responsibility on investment recommendations. Acad. Manag. J. 2014, 57(3), 833–864. [Google Scholar]
- Jain, M.; Sharma, G. D.; Srivastava, M. Can sustainable investment yield better financial returns? A comparative study of ESG indices and MSI indices. J. Sustain. Financ. Invest. 2020, 10(3), 261–280. [Google Scholar]
- Jamali, D.; Karam, C. Corporate social responsibility in developing economies as an institutional field: Outlining a research agenda. J. Manag. Stud. 2018, 55(1), 32–61. [Google Scholar]
- Jensen, M. C.; Meckling, W. H. Theory of the firm. J. Financ. Econ. 1976, 3(4), 305–360. [Google Scholar] [CrossRef]
- Jo, H.; Harjoto, M. A. Corporate governance and firm value: The impact of corporate social responsibility. J. Bus. Ethics 2011, 103(3), 351–383. [Google Scholar] [CrossRef]
- Klassen, R. D.; Whybark, D. C. The impact of environmental technologies on manufacturing performance. Acad. Manag. J. 1999, 42(6), 599–615. [Google Scholar] [CrossRef] [PubMed]
- Koumanakos, D. P. The impact of lean inventory management on ESG performance. J. Manuf. Technol. Manag. 2025, 36(5), 1096–1115. [Google Scholar] [CrossRef]
- Lazaridis, I.; Tryfonidis, D. Working capital and profitability. J. Financ. Manag. Anal. 2006, 19(1), 26–35. [Google Scholar]
- Le, T. T.; Ngo, T. K.; Nguyen, Q. P. The influence of corporate governance on green innovation: Evidence from Chinese listed companies. J. Clean. Prod. 2022, 345, 131131. [Google Scholar]
- Lins, K. V.; Servaes, H.; Tamayo, A. Social capital and performance. J. Financ. 2017, 72(4), 1785–1824. [Google Scholar] [CrossRef]
- Lins, K. V.; Servaes, H.; Tamayo, A. Social capital, trust, and firm performance: The value of corporate social responsibility during the financial crisis. J. Financ. 2017, 72(4), 1785–1824. [Google Scholar] [CrossRef]
- Liu, C. Are women directors effectively linked to environmental performance? Bus. Strategy Environ. 2018, 27(8), 1137–1149. [Google Scholar]
- Loureiro, S. M. C.; Romero, J.; Bilro, R. G. Stakeholder engagement in co-creation processes for innovation: A systematic literature review and case study. J. Bus. Res. 2020, 119, 388–409. [Google Scholar] [CrossRef]
- Lu, Y.; Herremans, I. M. Board gender diversity and environmental performance: An integrated perspective. J. Clean. Prod. 2019, 212, 1080–1089. [Google Scholar]
- Luo, X.; Bhattacharya, C. B. Corporate social responsibility, customer satisfaction, and market value. J. Mark. 2006, 70(4), 1–18. [Google Scholar] [CrossRef]
- Madaleno, M.; Robaina, M.; Ferreira, V. Eco-innovation and firm performance in European highly energy consumers and polluting sectors. Innov. Eur. J. Soc. Sci. Res. 2020, 33(4), 1–28. [Google Scholar] [CrossRef]
- Margolis, J. D.; Walsh, J. P. Misery loves companies: Rethinking social initiatives by business. Adm. Sci. Q. 2003, 48(2), 268–305. [Google Scholar] [CrossRef]
- Myers, S. C. Corporate borrowing determinants. J. Financ. Econ. 1977, 5(2), 147–175. [Google Scholar] [CrossRef]
- Nadeem, M.; Zaman, R.; Saleem, I. Boardroom gender diversity and corporate sustainability practices: Evidence from Australian frontier markets. J. Clean. Prod. 2020, 245, 118883. [Google Scholar]
- Nastiti, P. K. Y.; Atahau, A. D. R.; Supramono, S. Working capital management and efficiency and profit profitability in Indonesia. J. Asia Bus. Stud. 2019, 13(4), 586–603. [Google Scholar]
- Nazir, M. S.; Afza, T. Impact of aggressive working capital management and efficiency policy on firms’ profitability. IPCF J. Appl. Financ. 2009, 15(8), 19–30. [Google Scholar]
- Newbold, P.; Carlson, W. L.; Thorne, B. M. Statistics for business and economics, 9th global ed.; Pearson Education, 2020. [Google Scholar]
- O’Brien, R. M. A caution regarding rules of thumb for variance inflation factors. Qual. Quant. 2007, 41(5), 673–690. [Google Scholar] [CrossRef]
- Orlitzky, M.; Schmidt, F. L.; Rynes, S. L. CSR and performance. Organ. Stud. 2003, 24(3), 403–441. [Google Scholar]
- Padachi, K. Working capital trends. Int. Rev. Bus. Res. Res. 2006, 2(2), 45–58. [Google Scholar]
- Pan, X.; Chen, X.; Li, C. Board gender diversity and corporate environmental performance: The moderating role of environmental uncertainty. Bus. Strategy Environ. 2020, 29(5), 1835–1846. [Google Scholar] [CrossRef]
- Petersen, M. A.; Rajan, R. G. Trade credit: Theories and evidence. Rev. Financ. Stud. 1997, 10(3), 661–691. [Google Scholar] [CrossRef]
- Phung, A. T.; Nguyen, T. T.; Nguyen, T. L. Climate risk and ESG. Financ. Res. Lett. 2022, 47, 102698. [Google Scholar] [CrossRef]
- Porter, M. E.; Kramer, M. R. Strategy and society: The link between competitive advantage and corporate social responsibility. Harv. Bus. Rev. 2006, 84(12), 78–92. [Google Scholar] [PubMed]
- Porter, M. E.; van der Linde, C. Environment and competitiveness. J. Econ. Perspect. 1995, 9(4), 97–118. [Google Scholar] [CrossRef]
- Post, C.; Byron, K. Women on boards and firm financial performance: A meta-analysis. Acad. Manag. J. 2015, 58(5), 1546–1571. [Google Scholar] [CrossRef]
- Preacher, K. J.; Hayes, A. F. SPSS and SAS procedures for estimating indirect effects in simple mediation models. Behav. Res. Methods Instrum. Comput. 2004, 36(4), 717–731. [Google Scholar] [CrossRef] [PubMed]
- Qin, P.; Sun, M.; Li, J. Green product innovation, green dynamic capability, and competitive advantage: Evidence from Chinese manufacturing enterprises. Environ. Sci. Pollut. Res. 2019, 26, 33374–33385. [Google Scholar]
- Raheman, A.; Nasr, M. Working capital management and efficiency and profitability – case of Pakistani firms. Int. Rev. Bus. Res. Res. 2007, 3(1), 279–300. [Google Scholar]
- Rajan, R. G.; Zingales, L. Capital structure determinants. J. Financ. 1995, 50(5), 1421–1460. [Google Scholar] [CrossRef]
- Rehman, A.; Yu, Y. Impact of green supply chain management practices on the environmental performance of manufacturing firms considering institutional pressure as a moderator. Sustainability 2024, 16(6), 2278. [Google Scholar] [CrossRef]
- Rennings, K. Eco-innovation theory. Ecol. Econ. 2000, 32(2), 319–332. [Google Scholar] [CrossRef]
- Richards, V. D.; Laughlin, E. J. A cash conversion cycle approach to liquidity analysis. Financ. Manag. 1980, 9(1), 32–38. [Google Scholar] [CrossRef]
- Sarkis, J.; Gonzalez-Torre, P.; Adenso-Diaz, B. Stakeholder pressure and the adoption of environmental practices: The mediating effect of training. J. Oper. Manag. 2010, 28(2), 163–176. [Google Scholar] [CrossRef]
- Shahzad, M.; Qu, Y.; Javed, S. A.; Zafar, A. U.; Rehman, S. U. Relation of environment sustainability to CSR and green innovation: A case of Pakistani manufacturing industry. J. Clean. Prod. 2020, 253. [Google Scholar] [CrossRef]
- Shanghai Belling Corp.; Ltd. 2017 Corporate Social Responsibility Report Corporate social responsibility and shareholder wealth: The role of marketing capability. Journal of Marketing 2018, 80(1), 26–46. [Google Scholar]
- Shin, H.-H.; Soenen, L. Efficiency of working capital management and efficiency and corporate profitability. Financ. Pract. Educ. 1998, 8(2), 37–45. [Google Scholar]
- Studenmund, A. H. Using econometrics: A practical guide, 7th ed.; Pearson, 2017. [Google Scholar]
- Suchman, M. C. Legitimacy theory. Acad. Manag. Rev. 1995, 20(3), 571–610. [Google Scholar] [CrossRef]
- Tan, Y.; Zhu, Z. The effect of ESG performance on corporate innovation novelty: Evidence from China. Sustainability 2022, 14(6), 3359. [Google Scholar] [CrossRef]
- Terjesen, S.; Couto, E. B.; Francisco, P. M. Does the presence of independent and female directors impact firm performance? A multi-country study of board diversity. Corp. Gov. An. Int. Rev. 2016, 24(5), 409–426. [Google Scholar] [CrossRef]
- Tolliver, C.; Fujii, H.; Keeley, A. R.; Managi, S. Green innovation and finance in Asia. Asian Econ. Policy Rev. 2021, 16(1), 67–87. [Google Scholar] [CrossRef]
- Vishwanathan, P.; van Oosterhout, H. J.; Heugens, P. P.; Duran, P.; van Essen, M. Strategic CSR: A concept building meta-analysis of the CSR-performance relationship. J. Manag. Stud. 2019, 57(2), 314–350. [Google Scholar] [CrossRef]
- Waddock, S. A.; Graves, S. B. CSR–financial performance link. Strateg. Manag. J. 1997, 18(4), 303–319. [Google Scholar] [CrossRef]
- Wahid, A. S. The effects and the mechanisms of board gender diversity: Evidence from financial reporting quality. J. Bus. Ethics 2019, 159(3), 705–725. [Google Scholar] [CrossRef]
- Wang, M.; Li, Y.; Li, J. Organizational resilience and green innovation for environmental sustainability: The moderating role of environmental orientation. J. Bus. Res. 2023, 160, 113781. [Google Scholar]
- Wernerfelt, B. Resource-based view. Strateg. Manag. J. 1984, 5(2), 171–180. [Google Scholar] [CrossRef]
- Wiklund, J.; Shepherd, D. Knowledge-based resources, entrepreneurial orientation, and the performance of small and medium-sized businesses. Strateg. Manag. J. 2003, 24(13), 1307–1314. [Google Scholar] [CrossRef]
- Wooldridge, J. M. Econometric analysis of cross section and panel data, 2nd ed.; MIT Press, 2010. [Google Scholar]
- Wooldridge, J. M. Introductory econometrics: A modern approach; Cengage Learning, 2013. [Google Scholar]
- Xu, J.; Liu, F.; Shang, Y. R&D investment, environmental regulation, and a firm’s competitiveness: Evidence from China’s manufacturing industry. Environ. Sci. Pollut. Res. 2019, 26, 29961–29971. [Google Scholar]
- Yahya, F.; Ali, M.; Mansor, N. Board gender diversity and environmental performance: Evidence from an emerging economy. J. Clean. Prod. 2020, 264, 121654. [Google Scholar]
- Yen, T. H.; Hsieh, Y. J.; Wang, C. W. ESG and firm value. Sustainability 2023, 15(4), 3128. [Google Scholar] [CrossRef]
- Zhang, D.; Rong, Z.; Ji, Q. Green innovation and performance. Energy Econ. 2020, 85, 104560. [Google Scholar] [CrossRef]
- Zhang, Y.; Sun, J.; Yang, Z.; Wang, Y. Green innovation determinants. J. Clean. Prod. 2020, 264, 121701. [Google Scholar] [CrossRef]
Table 2.
Industry Distribution.
| Industry Sector | Firms | % of Sample |
|---|---|---|
| Oil & Gas | 55 | 7.52% |
| Telecommunication | 11 | 1.45% |
| Consumer Discretionary | 70 | 9.49% |
| Healthcare | 152 | 20.66% |
| Industrials | 134 | 18.23% |
| Utilities | 34 | 4.63% |
| Services | 109 | 14.87% |
| Technology | 135 | 18.34% |
| Raw Material | 35 | 4.80% |
| Total | 734 | 100% |
Table 3.
Descriptive Statistics.
| Variable | Obs | Mean | Std. Dev. | Min | Max |
|---|---|---|---|---|---|
| CCC | 10,276 | 72.21 | 75.10 | -54.00 | 252.39 |
| ACP | 10,276 | 50.36 | 26.81 | 6.00 | 108.00 |
| ICP | 10,276 | 84.95 | 71.51 | 5.00 | 283.00 |
| APP | 10,276 | 63.78 | 49.50 | 14.32 | 218.53 |
| WCR | 10,276 | 0.180 | 0.123 | -0.002 | 0.464 |
| EI | 10,276 | 0.226 | 0.290 | 0.000 | 0.846 |
| BGD | 10,276 | 0.176 | 0.107 | 0.000 | 0.375 |
| AGE | 10,276 | 23.24 | 14.83 | 1.00 | 46.00 |
| Size | 10,276 | 6.53 | 0.71 | 5.21 | 7.77 |
| LEV | 10,276 | 0.115 | 0.154 | 0.000 | 0.540 |
| CR | 10,276 | 2.24 | 1.41 | 0.67 | 6.05 |
| EBITM | 10,276 | 0.061 | 0.187 | -0.525 | 0.320 |
| FA | 10,276 | 0.151 | 0.161 | 0.006 | 0.600 |
Disclaimer/Publisher’s Note: The statements, opinions and data contained in all publications are solely those of the individual author(s) and contributor(s) and not of MDPI and/or the editor(s). MDPI and/or the editor(s) disclaim responsibility for any injury to people or property resulting from any ideas, methods, instructions or products referred to in the content. |
© 2026 by the author. Licensee MDPI, Basel, Switzerland. This article is an open access article distributed under the terms and conditions of the Creative Commons Attribution (CC BY) license.
Copyright: This open access article is published under a Creative Commons CC BY 4.0 license, which permit the free download, distribution, and reuse, provided that the author and preprint are cited in any reuse.