

Submitted:
08 September 2026
Posted:
09 September 2026
You are already at the latest version
Abstract
Financial inclusion has expanded rapidly, yet rising access does not necessarily translate into convergence in digital financial use. Using five Global Findex waves (2011–2024) and individual-level 2024 microdata, this study distinguishes account access from effective digital financial participation. Balanced-economy trends show account ownership rising from 53.0% in 2011 to 80.6% in 2024, while gender and income access gaps narrow. In contrast, income gaps in digital use remain large, and the richest–poorest gap in digital merchant payments increases from 15.4 to 18.7 percentage points between 2021 and 2024. Analysis of 62,480 phone-owning adults across 74 economies uses Findex-weighted logit models with economy fixed effects and economy-clustered inference. Internet use, basic messaging capability, and secure autonomous device control are independently associated with 6.9, 7.7, and 8.3 percentage-point higher probabilities of digital merchant payment. Digital mechanisms attenuate but do not eliminate education, income, rural, and gender gaps. Results are robust to wild-cluster bootstrap, CR2/Satterthwaite correction, alternative weighting, LMIC-only estimation, alternative security definitions, and leave-one-region-out tests. The findings indicate that expanding access alone is insufficient: effective digital participation remains stratified by capability, device control, and socioeconomic resources.

Keywords:
financial inclusion
; digital payments
; digital divide
; device security
; global findex
; financial inequality
1. Introduction
Digital finance has moved from the periphery of financial inclusion policy to the center of everyday economic exchange. Mobile money, app-based bank accounts, card-linked wallets, and internet-enabled payments have reduced geographic and transactional frictions and created new ways for households to receive income, transfer funds, save, borrow, and pay merchants. The welfare potential is substantial: digital financial services can lower transaction costs, support risk sharing, and widen the practical reach of formal finance (Jack & Suri, 2014; Suri & Jack, 2016; Aron, 2018). The central policy question, however, is changing. As account ownership expands, the relevant margin is increasingly not whether people can enter the financial system, but whether they can use digital finance effectively and safely once connected.
This distinction between access and use is increasingly important. The Global Findex Database 2025 documents nationally representative surveys conducted during 2024 and introduces the first globally comparable module on mobile phone ownership, internet use, and digital safety alongside established measures of financial access and use (Klapper et al., 2025). The new measurement environment makes it possible to examine a gap that earlier Findex waves could only observe indirectly: the distance between digital connectivity and realized financial participation. The issue is not merely technological. Financial access can increase while effective use remains concentrated among adults with higher income, education, digital capability, or greater control over their devices.
The present study uses this new measurement environment to separate device access, basic digital capability, and device-level security within a common individual-level model of merchant-payment use, while anchoring the 2024 analysis in balanced historical trends. This positioning complements the descriptive Global Findex report and recent studies of institutions, literacy, and inequality without treating connectivity as synonymous with realized financial inclusion.
Recent research reinforces the need to separate financial inclusion's extensive and intensive margins. Allen et al. (2016) show that individual and country characteristics jointly shape formal account ownership and use. Grohmann et al. (2018) further demonstrate that financial literacy is especially relevant for using financial services, not simply accessing infrastructure. More recently, Peng et al. (2026) distinguish the uptake of accounts from the use of saving, borrowing, and digital payments across 144 economies and show that institutional barriers condition financial inclusion. Cao et al. (2026) show that digital finance can coexist with cross-country inequality, while Trotta et al. (2026) characterize the barriers that sit inside the 'black box' of digital financial inclusion. Recent JRFM evidence likewise shows that coverage breadth, usage depth, and digitisation capture distinct dimensions of digital financial inclusion (Hu et al., 2026), and that trust and perceived risk are relevant to actual digital-payment use (Jagrič et al., 2026). Together, these studies suggest that aggregate expansion does not guarantee distributional convergence.
A parallel literature on digital inequality provides a useful theoretical lens. Research has moved from a first-level divide in physical access to a second-level divide in skills and patterns of use, and then to a third-level divide in tangible outcomes obtained from being online (van Deursen & Helsper, 2015; Lythreatis et al., 2022). Applied to finance, connectivity is therefore better viewed as an enabling resource than as financial inclusion itself. A smartphone or internet connection can create the possibility of digital finance, but capabilities are needed to navigate interfaces, and security or autonomy may be necessary to transact with confidence and control. This interpretation is consistent with evidence linking financial literacy to inclusion (Grohmann et al., 2018), digital financial literacy to service use (Ferilli et al., 2024; Pak et al., 2026), and trust and security to FinTech adoption (Jafri et al., 2024).
This study develops and evaluates an access–capability–security framework for effective digital financial participation using Global Findex data. It combines two complementary empirical layers. First, balanced sets of economies are used to trace changes in account ownership, digital payments, merchant payments, and mobile money across the 2011, 2014, 2017, 2021, and 2024 waves. This historical layer asks whether gaps in access and gaps in use are converging at the same rate. Second, the 2024 microdata are used to examine how phone ownership, smartphone access, internet use, basic messaging capability, and secure autonomous device control are associated with digital merchant payments after controlling for education, income, gender, age, labor-force participation, rurality, and economy fixed effects.
The paper makes four contributions. First, it documents a distributional pattern that is obscured by headline inclusion rates: access convergence has proceeded faster than use convergence. In balanced economy sets, account ownership rises from 53.0% in 2011 to 80.6% in 2024, and the gender gap in account ownership falls from 8.9 to 3.7 percentage points. Yet the richest–poorest gap in any digital payment remains about 17.0 percentage points in 2024, and the corresponding gap in digital merchant payments increases from 15.4 to 18.7 points between 2021 and 2024. Second, the study separates connectivity from capability and device security. Internet use, basic messaging capability, and secure device control each contribute additional explanatory power, with secure device control showing the largest standardized association with merchant-payment use. Third, it quantifies how digital mechanisms attenuate—but do not eliminate—structural gaps. Education remains the dominant divide after digital factors are introduced. Fourth, it subjects the findings to an unusually extensive robustness architecture, including wild-cluster bootstrap inference, CR2/Satterthwaite correction, alternative weighting, lower- and middle-income-economy restriction, alternative security measurement, and leave-one-region-out analyses.
The remainder of the paper is organized as follows. Section 2 develops the conceptual framework and hypotheses. Section 3 describes the data and empirical strategy. Section 4 presents the historical and individual-level results. Section 5 discusses their implications for international finance, digital inclusion, and policy. Section 6 concludes.
2. Conceptual Framework and Hypotheses
2.1. From Financial Access to Effective Digital Participation
Financial inclusion is commonly defined through both access to and use of appropriate financial services. These dimensions need not move together. Account ownership captures an extensive margin, the existence of a formal or mobile-money entry point, while saving, receiving payments, transferring funds, and paying merchants reflect progressively more intensive forms of participation. The distinction matters because opening an account may be induced by wage or government-payment programs even when the account remains weakly integrated into everyday financial behavior. Peng et al. (2026) similarly emphasize that barriers can affect access and actual use differently.
The digitalization of finance amplifies this distinction. Digital channels reduce distance and operating costs, but they also move part of the transaction process from institutions to users. Users must possess or access an appropriate device, connect to the internet or mobile network, interpret digital interfaces, manage credentials, and evaluate risks. As a result, the marginal constraint can shift from physical access to what individuals are able to do with access. Ozili (2018) describes this dual potential of digital finance: it can expand inclusion while also creating new risks related to technology and uneven capabilities.
2.2. A Three-Level Digital Inequality Interpretation
Digital inequality research distinguishes access, skills/use, and outcomes (van Deursen & Helsper, 2015; Lythreatis et al., 2022). In the financial domain, the first level corresponds to device and network connectivity. The second concerns practical capability—the ability to read and send messages, navigate digital tools, and perform digital tasks. The third concerns realized financial outcomes, such as holding a digitally enabled account or making a merchant payment. This framework implies that connectivity is a necessary but incomplete condition for financial participation.
The Global Findex 2024 connectivity module allows this hierarchy to be operationalized with globally comparable individual data. We distinguish smartphone access and recent internet use from a basic digital-capability measure based on reading and sending text or messaging-app messages. The latter is intentionally parsimonious: it captures a minimum operational skill required for many authentication, notification, and payment workflows without equating general education with digital proficiency.
2.3. Device Security as a Conversion Factor
Security is often treated as a negative barrier—perceived risk reduces adoption—but digital safety can also be conceptualized positively as a capability that allows users to convert connectivity into controlled financial use. A locked device reduces exposure to unauthorized access, while the ability to change a PIN or password without assistance signals autonomy over credentials. Trust and security are repeatedly identified as important determinants of FinTech and digital banking adoption (Shaikh & Karjaluoto, 2015; Jafri et al., 2024). Recent work also connects cybersecurity awareness to financial inclusion under rising fraud risk (Afzal et al., 2025).
We therefore define secure device control as the conjunction of device protection and credential autonomy. This construct differs from general trust: it is behaviorally anchored in the user's control of the device rather than an attitudinal judgment about financial providers. It is also distinct from scam exposure, which may itself be a consequence of greater digital activity. For that reason, scam exposure is not placed in the core explanatory sequence; it is examined separately as part of an opportunity–risk analysis.
2.4. Structural Stratification and Hypotheses
Digital mechanisms operate within existing distributions of economic and social resources. Income affects device quality, data affordability, and the opportunity cost of transaction fees. Education influences both financial and digital capabilities. Rural residents may face weaker network quality, fewer accepting merchants, and thinner financial ecosystems. Gender gaps can reflect unequal income, device ownership, autonomy, and social constraints. The central proposition is thus not that digital mechanisms erase inequality, but that they account for part of the observed gap while leaving residual structural stratification.
- H1. Digital connectivity—smartphone access and recent internet use—is positively associated with effective digital financial participation.
- H2. Basic digital capability and secure autonomous device control add explanatory power beyond connectivity and are positively associated with digital merchant payment.
- H3. Adding connectivity, capability, and device security attenuates, but does not eliminate, education, income, rural, and gender gaps in digital merchant payment.
- H4. Over 2011–2024, convergence in financial access outpaces convergence in digital financial use; therefore, use inequalities persist despite substantial growth in account ownership.
3. Materials and Methods
3.1. Data Architecture
The analysis uses the World Bank Global Findex Database (World Bank, 2025). The 2025 edition is based on nationally representative surveys conducted during 2024 and covers approximately 148,000 adults in 141 economies; it is the first Findex wave with globally comparable measures of mobile-phone ownership, internet use, and digital safety (Klapper et al., 2025). The public world microdata file used here contains 144,090 individual records across 140 economies. The difference reflects the released microdata universe and does not affect the published global aggregates.
Two data layers are combined without pooling incompatible measures. The historical layer uses the Global Findex country/subgroup indicator file for 2011, 2014, 2017, 2021, and 2024. For each outcome, we construct a balanced set of economies observed in every available wave for that series and compute adult-population-weighted prevalence. This prevents changing country coverage from being mistaken for temporal change. The individual layer uses the 2024 world microdata for multivariable inference. Because the financial and detailed safety modules were not administered identically in every economy, analytical universes are explicitly reported rather than treating structural missingness as random nonresponse. Table 1 summarizes the resulting analytical universes and sample sizes.
3.2. Outcomes and Explanatory Variables
The primary outcome is digital merchant payment (merchantpay_dig), coded 1 when the respondent made a digital merchant payment in the previous year and 0 otherwise. The Findex definition includes purchases made in store using a debit or credit card or mobile phone and online payment for an internet purchase. We use merchant payment as the primary outcome because it captures integration of digital finance into routine market exchange rather than account possession alone.
Connectivity is represented by smartphone status and internet use during the previous three months. In a broader sample we also estimate a model using mobile-phone ownership and internet use because detailed device-security questions are conditional on phone ownership. Basic digital capability equals 1 when the respondent reports having ever both read and sent a text message (including messaging applications) and 0 when either task cannot be performed. Secure device control equals 1 when the respondent's phone is protected by a PIN, password, or fingerprint and the respondent can change the PIN/password without assistance; it equals 0 when the phone is unlocked or protected but the respondent cannot change the credentials independently.
Structural covariates are gender, age and age squared, education (primary or less, secondary, tertiary or more), within-economy household income quintile, labor-force participation, and rural residence. Economy fixed effects absorb economy-level characteristics common to respondents within each 2024 economy, including regulatory, macroeconomic, institutional, and infrastructure conditions.
Secondary outcomes are a digitally enabled account, any digital payment, and an emergency-fund measure indicating that obtaining the Findex reference amount within 30 days would not be difficult. Scam exposure and distrust of card/phone payments among cash-only users are analyzed separately because contemporaneous scam exposure may be partly generated by digital activity and should not be interpreted as an exogenous determinant of payment use.
3.3. Empirical Strategy
The core specification is a weighted logistic regression using Findex sampling weights, economy fixed effects and standard errors clustered by economy. All sequential models are estimated on the same primary sample of 62,480 adults in 74 economies to ensure that changes in coefficients or fit are not driven by sample composition. The models are nested as follows:
S0: merchant payment = structural covariates + economy fixed effects;
S1: S0 + smartphone + internet use;
S2: S1 + basic digital capability;
S3: S2 + secure device control.
The sequential design is associational and sequential rather than a causal-mediation design. Sequential fit metrics are reproduced in Supplementary Table S2. A decline in a group gap between S0 and S3 is described as model-based attenuation because the data are cross-sectional and the ordering of mechanisms cannot be identified experimentally. Model fit is compared using log-likelihood, AIC, pseudo-R2, and block Wald tests.
For interpretation, we compute standardized probability contrasts. For each binary focal variable, predicted merchant-payment probabilities are calculated after setting that variable to 0 and then to 1 for all observations while leaving all other observed covariates unchanged; the weighted mean difference is the reported adjusted probability contrast. Education and income contrasts similarly compare tertiary versus primary education and the fifth versus first income quintile. Uncertainty for primary contrasts is obtained from 499 economy-cluster bootstrap resamples. The historical analysis computes weighted prevalence and group gaps only within balanced economy sets. Because different indicators were introduced in different Findex waves, the number of balanced economies varies by series. This component is descriptive and is not interpreted as a panel of individuals or as causal change.
3.4. Robustness and Finite-Cluster Inference
The inferential strategy is deliberately conservative. First, the primary logit uses economy-clustered standard errors, following standard practice for clustered inference (Cameron & Miller, 2015). Second, a weighted linear probability model with identical covariates and economy fixed effects is estimated and tested with a 9,999-replication wild-cluster bootstrap using Rademacher weights. Third, CR2 cluster-robust standard errors with Satterthwaite degrees-of-freedom correction are calculated following Pustejovsky and Tipton (2018). The fixed-effects coefficients from the absorbed and explicit-dummy formulations agree to machine precision.
Additional checks re-estimate the core model using population-scaled weights, restrict the sample to lower- and middle-income economies, redefine security using device lock/PIN alone, and sequentially omit each World Bank region. Heterogeneity in the association of security with gender and Latin America and the Caribbean (LAC) is treated as exploratory and adjusted for multiple testing using the Benjamini–Hochberg false-discovery-rate procedure.
3.5. Research Ethics and Reproducibility
The study is a secondary analysis of publicly available, de-identified survey data and involves no direct interaction with participants. The World Bank is responsible for the original survey design, consent procedures, and fieldwork. The analysis was conducted in R 4.6.0. The authors independently verified sample construction, model specifications, outputs, tables, figures, and robustness checks against the Global Findex data. The final analytical pipeline records the sample construction, model specifications, standardized contrasts, historical balanced panels, and all robustness checks. The underlying Findex data are publicly available from the World Bank. The final analytical code and machine-readable output tables are supplied as supplementary replication materials with this submission; the raw Global Findex microdata are not redistributed.
4. Results
4.1. Financial Access Expands Faster than Digital Use Converges
Figure 1 shows the long-run transition in balanced economy sets. Account ownership rises from 53.0% in 2011 to 64.6% in 2014, 72.7% in 2017, 77.2% in 2021, and 80.6% in 2024 across 108 economies observed in every account-ownership wave. In the 74 economies with comparable digital-payment data, the prevalence of making or receiving a digital payment increases from 35.6% in 2014 to 62.4% in 2024. Mobile-money account ownership rises even more sharply—from 4.1% in 2014 to 29.9% in 2024 across 50 balanced economies. Digital merchant payment increases from 36.3% in 2021 to 39.9% in 2024.
The distributional pattern differs from the aggregate trend. The male–female gap in account ownership declines from 8.9 percentage points in 2011 to 3.7 points in 2024. The richest-60% versus poorest-40% account gap falls from 18.1 to 9.6 points over the same period. By contrast, the income gap in any digital payment remains 17.0 points in 2024, compared with 18.4 points in 2014, and the income gap in digital merchant payment widens from 15.4 points in 2021 to 18.7 points in 2024. The merchant-payment gender gap also increases slightly from 5.7 to 6.4 points. These patterns support H4: access is converging more quickly than effective digital use. Table 2 summarizes these balanced-economy trends and structural gaps.
4.2. Connectivity Is Strongly Associated with Merchant-Payment Use
The broad connectivity model uses 96,939 adults in 96 economies. Conditional on structural covariates and economy fixed effects, mobile-phone ownership is associated with odds of merchant-payment use almost three times as high (OR≈2.97), while recent internet use is associated with OR≈3.46. These estimates establish that connectivity is strongly related to digital financial participation, but the detailed safety sample allows us to ask whether device type, capability, and security carry additional information.
In the common 62,480-person sample, sequential model fit improves at every stage. Adding smartphone and internet access to the structural model reduces AIC by 1,186 points; adding basic digital capability reduces it by a further 409 points; and adding secure device control reduces AIC by another 534 points. Pseudo-R2 rises from 0.308 in S0 to 0.339 in S3. Joint Wald tests reject the null contribution of the connectivity, capability, and security blocks at p<0.001. Table 3 reports the full sequence of economy-fixed-effects estimates.
4.3. Capability and Secure Device Control Add Beyond Connectivity
The fully adjusted S3 model supports H1 and H2. Smartphone status is positively associated with merchant-payment use (OR=1.25), recent internet use with OR=1.77, basic digital capability with OR=1.89, and secure device control with OR=1.93. The standardized probability contrasts provide a more interpretable scale. Holding the observed covariate distribution constant, smartphone status corresponds to a 2.8 percentage-point difference in predicted merchant-payment probability (95% cluster-bootstrap CI 0.9–4.7), internet use to 6.9 points (4.9–8.9), basic digital capability to 7.7 points (6.0–9.2), and secure device control to 8.3 points (6.7–9.8).
The security result is not an artifact of the composite coding. When device lock/PIN alone replaces secure autonomous control, the odds ratio is 1.92 compared with 1.93 in the core specification. Moreover, excluding one World Bank region at a time leaves the secure-device-control OR between 1.83 and 2.12, significant in all seven runs. Internet and capability are similarly stable across region exclusions; smartphone ownership is positive but less geographically stable. Figure 2 displays the standardized probability contrasts, and Table 4 reports their numerical estimates and 95% confidence intervals.
4.4. Digital Mechanisms Attenuate—but Do Not Eliminate—Structural Gaps
The residual inequalities are economically large. In S3, the standardized probability of merchant-payment use is 19.6% for adults with primary education or less, 27.0% with secondary education, and 40.1% with tertiary education. The tertiary–primary adjusted gap is therefore 20.4 percentage points (95% CI 17.9–23.0). Across income quintiles, adjusted probabilities rise monotonically from 20.5% in Q1 to 31.5% in Q5, leaving an 11.1-point Q5–Q1 gap (8.6–13.3). Rural residence remains associated with a 3.5-point disadvantage, while the residual female–male difference is 1.2 points.
Figure 3 traces these gaps through the sequential models. The absolute female–male gap falls by 48.2% between S0 and S3, the tertiary–primary gap by 30.2%, the rural–urban gap by 26.1%, and the Q5–Q1 gap by 22.2%. These reductions are model-based attenuation, not causal mediation. The key substantive result is that digital mechanisms account for part of the observed gaps in the sequential models but leave large education and income gradients, supporting H3.
4.5. The Mechanisms Extend Across the Digital Participation Chain
The same mechanisms are associated with multiple stages of digital financial participation. Internet use is associated with standardized differences of 8.9 points for a digitally enabled account, 8.6 points for any digital payment, and 6.9 points for merchant payment. Basic digital capability corresponds to 9.2, 9.0, and 7.7 points, respectively. Secure device control corresponds to 9.1 points for a digital account, 8.0 points for any digital payment, and 8.3 points for merchant payment. Smartphone status is consistently positive but substantially smaller. This pattern supports the interpretation of capability and secure control as cross-cutting conversion factors rather than outcome-specific correlates. Figure 4 summarizes these standardized contrasts across the digital financial participation chain.
4.6. Heterogeneity, Downstream Resilience, and Opportunity–Risk Tension
Two exploratory interactions survive Benjamini–Hochberg correction. The secure-device-control association is stronger among women (interaction q=0.036): predicted merchant-payment use rises from 20.1% to 29.1% for women when secure device control changes from 0 to 1, compared with 22.1% to 29.7% for men. The security association is also stronger in LAC (interaction q=0.036): the standardized contrast is 12.6 percentage points in LAC versus 7.1 points outside LAC. By contrast, the Internet×LAC and capability×LAC interactions are not statistically significant after correction. These results are treated as secondary heterogeneity rather than confirmatory hypotheses.
Effective participation is also associated with financial robustness. In the emergency-fund model, digital merchant payment corresponds to a 4.6-point higher adjusted probability of reporting that emergency funds would not be difficult to obtain; a digitally enabled account corresponds to 2.2 points, secure device control to 1.8 points, and internet use to 1.4 points. Women and rural adults retain disadvantages of 3.8 and 1.3 points, respectively. These associations are downstream and cross-sectional and are not interpreted as causal effects of digital finance on resilience.
Digital participation has a risk side. Greater digital activity is positively associated with exposure to unsolicited requests to send money. Among respondents who continue to use cash for in-store purchases, scam exposure is also positively associated with citing distrust of card or phone payments as the main reason for cash-only behavior. We interpret this as an opportunity–risk tension: the same digital engagement that expands financial participation can increase exposure to threats that undermine trust. Scam exposure is therefore deliberately excluded from the core explanatory sequence.
4.7. Robustness
Table 5 summarizes the full set of robustness and finite-cluster inference checks. Detailed finite-cluster p-values are reported in Supplementary Table S3, and the broader sensitivity results are summarized in Supplementary Table S4.
Finite-cluster checks confirm the primary inference. In the weighted linear probability model, wild-cluster bootstrap p-values are 0.015 for smartphone, 0.0002 for internet use, <0.0001 for capability and secure device control, 0.037 for female, and <0.0001 for rural residence. CR2/Satterthwaite tests yield the same conclusions. The core security coefficient is the most stable across specifications. By contrast, smartphone and gender are not significant in every leave-one-region-out run, so they are interpreted more cautiously than Internet, capability, security, and rurality.
5. Discussion
5.1. Access Convergence Without Use Convergence
The central finding is a divergence between the trajectory of financial access and the distribution of effective digital use. Account ownership has expanded dramatically and important access gaps have narrowed, particularly by gender. Yet inequalities in digital transactions remain persistent, and the income gap in merchant payments is wider in 2024 than in 2021 within a balanced set of economies. This pattern is consistent with the third-level digital-divide perspective: equalizing entry into a system does not equalize the outcomes users obtain from it (van Deursen and Helsper, 2015). It also extends the access–use distinction in financial inclusion research by showing that the distributional problem becomes more visible as the outcome moves closer to everyday market participation.
The result complements Peng et al. (2026), who show that institutions and financial barriers shape different dimensions of inclusion, Cao et al. (2026), who document cross-country inequality in digital finance, and Hu et al. (2026), who demonstrate that coverage breadth and usage depth can have distinct economic implications. Our contribution is at the individual conversion margin: once finance becomes digitally available, effective use is stratified by capability, device security, education, income, and place. Consequently, headline account-ownership targets may increasingly overstate practical inclusion if they are not paired with measures of active use.
5.2. Connectivity Is Necessary, Capability and Security Are Conversion Factors
The results suggest that an infrastructure-only view of digital financial inclusion is incomplete. Connectivity is strongly associated with merchant-payment use, but its explanatory contribution is incomplete. Basic messaging capability adds substantial information after smartphone and internet access are controlled, consistent with evidence that skills determine whether users can translate access into outcomes (Lythreatis et al., 2022) and with findings that financial literacy is particularly relevant for service use (Grohmann et al., 2018). Recent evidence on digital financial literacy similarly links knowledge and skills to the use and benefits of digital financial services (Ferilli et al., 2024; Pak et al., 2026).
More novel is the magnitude and robustness of secure device control. A protected phone combined with autonomous credential management is associated with an 8.3-point higher standardized probability of digital merchant payment, the largest core digital contrast. The association survives alternative measurement, LMIC-only restriction, population reweighting, and every regional omission. This suggests that digital safety should be understood not only as risk mitigation but also as a functional component of participation. Users who can secure and manage their devices may be better positioned to receive authentication messages, retain control over financial credentials, and transact without relying on others. This interpretation aligns with the trust and security literature (Jafri et al., 2024) and with recent JRFM evidence linking perceived risk and trust to actual digital-payment use (Jagrič et al., 2026), while moving from perceived security to an observable form of device-level control.
5.3. Structural Inequality Remains After Digital Mechanisms
The largest remaining divide is educational. Even in the fully adjusted model, tertiary education corresponds to a predicted merchant-payment probability about 20 points higher than primary education or less. The income gradient is also monotonic and substantial. These results imply that digital finance does not mechanically decouple financial participation from accumulated human and economic capital. Rather, it can reproduce advantages through differences in skills, device quality, confidence, opportunity, and merchant environments.
This persistence is consistent with evidence from other financial-access domains showing that expanded formal access can coexist with selective inclusion and socioeconomic exclusion when eligibility and resource constraints remain unevenly distributed (Castro Hernández et al., 2026).
Rural disadvantage is smaller than the education and income gaps but unusually stable across regional sensitivity analyses. This is consistent with the continued importance of acceptance infrastructure and local market ecosystems. By contrast, the adjusted gender gap is smaller and less geographically stable. This does not imply that gender is unimportant; the historical gender gap in account ownership remains visible and the security interaction is stronger for women. Instead, the results suggest that a considerable portion of the contemporary gender difference in merchant payment overlaps with measured digital and socioeconomic resources.
5.4. International and Policy Implications
The policy implication is a shift from account-opening metrics toward conversion capacity. First, connectivity policy remains foundational, but device and data access should be evaluated alongside actual financial use. Second, basic digital skills deserve a place in financial-inclusion strategies. Simple capabilities—reading messages, sending messages, recognizing authentication flows, and managing account notifications—are part of the infrastructure of digital finance even though they are acquired by individuals rather than installed by providers. Third, device-security capability should be treated as inclusion policy, not only cybersecurity policy. Providers and regulators can support secure default settings, accessible credential recovery, user-controlled PIN changes, and authentication designs that reduce dependence on family members or agents.
The LAC heterogeneity result is particularly relevant for the region's rapidly expanding digital-finance ecosystem. The security association is materially larger in LAC while the internet and capability interactions are not distinguishable from other regions. This pattern is exploratory, but it suggests that improving perceived and practical control over devices may be especially consequential where digital payment ecosystems are growing amid high fraud awareness and uneven trust. The result warrants dedicated regional research rather than a universal policy claim.
The opportunity–risk tension also argues against evaluating digital inclusion solely by uptake. Fraud exposure is more common among digitally active users, and exposure is associated with distrust among cash-only consumers. Expansion and protection therefore need to advance together. A system that rapidly increases transaction opportunities without improving user security may generate adoption and distrust simultaneously.
5.5. Limitations and Future Research
Several limitations define the scope of inference. First, the individual-level evidence is cross-sectional. Economy fixed effects control for unobserved country-level heterogeneity, but reverse causality and unobserved individual traits remain possible. The language of association is therefore intentional. Second, the detailed safety module is conditional on phone ownership, so the deep model describes conversion among phone-owning adults rather than the full population. We address this by first estimating a broad connectivity model in a larger sample. Third, module coverage varies across economies, especially for the detailed financial-use outcomes; analytical universes are therefore reported explicitly and balanced historical sets are used for trend comparisons.
Fourth, basic messaging capability is a deliberately narrow indicator rather than a validated scale of digital financial literacy. Future work should combine Findex with richer skills instruments or experimental tasks. Fifth, secure device control may capture unobserved sophistication or prior digital-finance experience; longitudinal or quasi-experimental designs are needed to identify causal effects. Sixth, merchant acceptance, transaction pricing, consumer protection, and digital identity are relevant country-level mechanisms that are absorbed by economy fixed effects rather than directly modeled. Future multi-level work could combine Findex microdata with regulatory and infrastructure data to test those channels.
6. Conclusions
Global financial inclusion is entering a new phase. The first phase was dominated by the extensive margin: whether adults could obtain an account. On that dimension, progress has been substantial and several traditional gaps have narrowed. The next phase is more demanding: whether people can translate connectivity into safe, routine, economically meaningful use.
Using Global Findex evidence from 2011–2024 and 2024 individual microdata, this study documents access convergence without equivalent use convergence. Internet use, basic digital capability, and secure autonomous device control are independently and robustly associated with effective digital participation, while education, income, and rurality continue to stratify use. The strongest policy message is therefore not simply to connect more people or open more accounts. It is to build the capabilities and security conditions that allow connected adults to use finance effectively.
Supplementary Materials
The following supporting information can be downloaded at the website of this paper posted on Preprints.org: Table S1: Construct operationalization; Table S2: Sequential model fit metrics; Table S3: Finite-cluster inference; Table S4: Robustness summary; and a replication archive containing the final R scripts, machine-readable analytical outputs, and README file.
Author Contributions
Omitted from the anonymized manuscript for peer review.
Funding
This research received no external funding.
Institutional Review Board Statement
Ethical review and approval were not required for this secondary analysis of publicly available, de-identified survey data. The World Bank was responsible for the original survey design, consent procedures, and fieldwork.
Informed Consent Statement
Not applicable to this secondary analysis. Consent procedures for the original Global Findex surveys were managed as part of the World Bank survey process.
Data Availability Statement
The underlying Global Findex data are publicly available through the World Bank Global Findex Database and Microdata Library. The analytical R code, variable-construction documentation, and machine-readable output tables used to reproduce the reported results are supplied as supplementary replication materials with this submission. The raw Global Findex microdata are not redistributed.
Acknowledgments
The authors acknowledge the World Bank Global Findex team for making the Global Findex data and documentation publicly available.
Conflicts of Interest
The authors declare no conflicts of interest.
References
- Afzal, M.; Meraj, M.; Kaur, M.; Ansari, M. S. How does cybersecurity awareness help in achieving digital financial inclusion in rural India under escalating cyber fraud scenario? J. Cyber Secur. Technol. 2025, 9(2), 88–126. [Google Scholar] [CrossRef]
- Allen, F.; Demirgüç-Kunt, A.; Klapper, L.; Martinez Peria, M. S. The foundations of financial inclusion: Understanding ownership and use of formal accounts. J. Financ. Intermediation 2016, 27, 1–30. [Google Scholar] [CrossRef]
- Aron, J. Mobile money and the economy: A review of the evidence. World Bank. Res. Obs. 2018, 33(2), 135–188. [Google Scholar] [CrossRef]
- Cameron, A. C.; Miller, D. L. A practitioner's guide to cluster-robust inference. J. Hum. Resour. 2015, 50(2), 317–372. [Google Scholar] [CrossRef]
- Cao, H.; Shen, Y.; Zheng, A. Digital finance, economic development, and global inequality: A decomposition approach. Res. Int. Bus. Financ. 2026, 90, 103532. [Google Scholar] [CrossRef]
- Castro Hernández, J. E.; Rodríguez Cruz, S.; Echeverría Mayorga, C. A. Frontiers of housing financialization in El Salvador: State, mortgage credit and residential exclusion. Front. Sustain. Cities 2026, 8, 1850950. [Google Scholar] [CrossRef]
- Ferilli, G. B.; Palmieri, E.; Miani, S.; Stefanelli, V. The impact of FinTech innovation on digital financial literacy in Europe: Insights from the banking industry. Res. Int. Bus. Financ. 2024, 69, 102218. [Google Scholar] [CrossRef]
- Grohmann, A.; Klühs, T.; Menkhoff, L. Does financial literacy improve financial inclusion? Cross-country evidence. World Dev. 2018, 111, 84–96. [Google Scholar] [CrossRef]
- Hu, S.; Xiang, W.; Wan, Y. Digital financial inclusion and economic growth: Multi-dimensional evidence from coverage, depth, and digitisation. J. Risk Financ. Manag. 2026, 19(4), 284. [Google Scholar] [CrossRef]
- Jack, W.; Suri, T. Risk sharing and transactions costs: Evidence from Kenya's mobile money revolution. Am. Econ. Rev. 2014, 104(1), 183–223. [Google Scholar] [CrossRef]
- Jafri, J. A.; Mohd Amin, S. I.; Abdul Rahman, A.; Mohd Nor, S. A systematic literature review of the role of trust and security on FinTech adoption in banking. Heliyon 2024, 10(1), e22980. [Google Scholar] [CrossRef]
- Jagrič, V.; Tominc, P.; Rožman, M. Explaining behavioral intention and actual use of digital payment systems: A structural equation modeling approach among university students. J. Risk Financ. Manag. 2026, 19(8), 556. [Google Scholar] [CrossRef]
- Klapper, L.; Singer, D.; Starita, L.; Norris, A. The Global Findex Database 2025: Connectivity and financial inclusion in the digital economy. In World Bank; 2025. [Google Scholar] [CrossRef]
- Lythreatis, S.; Singh, S. K.; El-Kassar, A.-N. The digital divide: A review and future research agenda. Technol. Forecast. Soc. Change 2022, 175, 121359. [Google Scholar] [CrossRef]
- Ozili, P. K. Impact of digital finance on financial inclusion and stability. Borsa Istanb. Rev. 2018, 18(4), 329–340. [Google Scholar] [CrossRef]
- Pak, T.-Y.; Chatterjee, S.; Choung, Y. Navigating digital finance: How digital financial literacy influences digital financial services use and benefits in Korea. Financ. Innov. 2026, 12, 42. [Google Scholar] [CrossRef]
- Peng, Y.; Hermes, N.; Lensink, R. Formal institutions and financial inclusion: Evidence from cross-country analysis. Res. Int. Bus. Financ. 2026, 87, 103407. [Google Scholar] [CrossRef]
- Pustejovsky, J. E.; Tipton, E. Small-sample methods for cluster-robust variance estimation and hypothesis testing in fixed effects models. J. Bus. Econ. Stat. 2018, 36(4), 672–683. [Google Scholar] [CrossRef]
- Shaikh, A. A.; Karjaluoto, H. Mobile banking adoption: A literature review. Telemat. Inform. 2015, 32(1), 129–142. [Google Scholar] [CrossRef]
- Suri, T.; Jack, W. The long-run poverty and gender impacts of mobile money. Science 2016, 354(6317), 1288–1292. [Google Scholar] [CrossRef]
- Trotta, A.; Gallucci, C.; Rania, F.; Strano, E.; Tipaldi, R. The 'black box' of digital finance: An umbrella review of the challenges and drawbacks in advancing financial inclusion. Res. Int. Bus. Financ. 2026, 81, 103188. [Google Scholar] [CrossRef]
- van Deursen, A. J. A. M.; Helsper, E. J. The third-level digital divide: Who benefits most from being online? In Communication and Information Technologies Annual; Robinson, L., Cotten, S. R., Schulz, J., Eds.; Emerald, 2015; pp. 29–52. [Google Scholar] [CrossRef]
- World Bank. The Global Findex Database 2025: Data download and documentation. 2025. Available online: https://www.worldbank.org/en/publication/globalfindex/download-data (accessed on 3 September 2026).
Figure 1.
Long-run transition in financial inclusion using balanced economy sets. Notes: Each series includes only economies observed in every available wave for that indicator; prevalence is adult-population weighted.
Figure 1.
Long-run transition in financial inclusion using balanced economy sets. Notes: Each series includes only economies observed in every available wave for that indicator; prevalence is adult-population weighted.
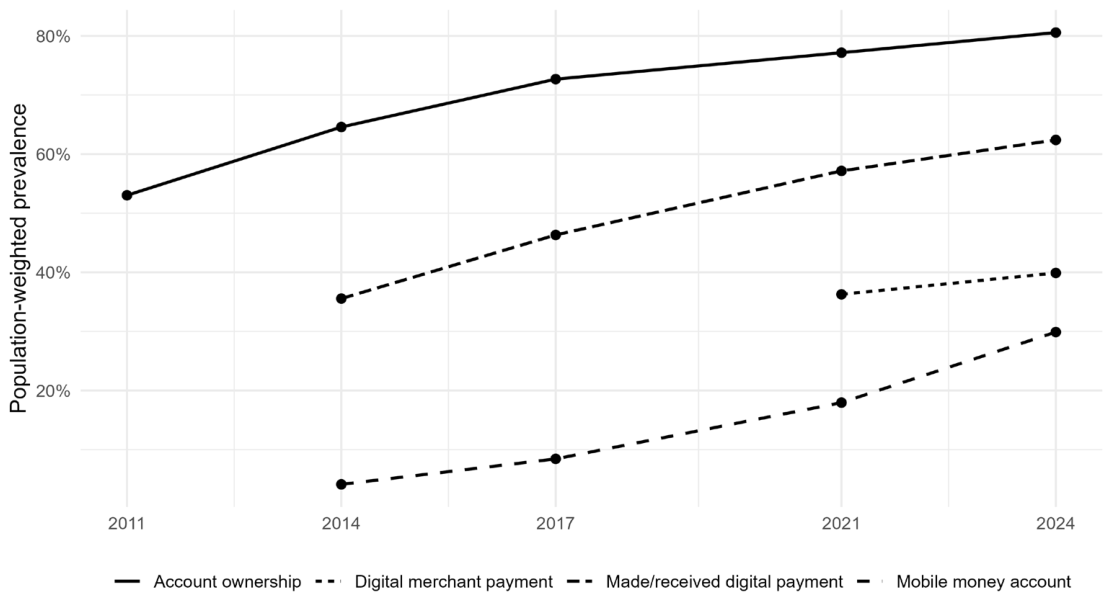
Figure 2.
Standardized probability contrasts for digital merchant payment. Error bars show 95% confidence intervals from 499 economy-cluster bootstrap resamples.
Figure 2.
Standardized probability contrasts for digital merchant payment. Error bars show 95% confidence intervals from 499 economy-cluster bootstrap resamples.
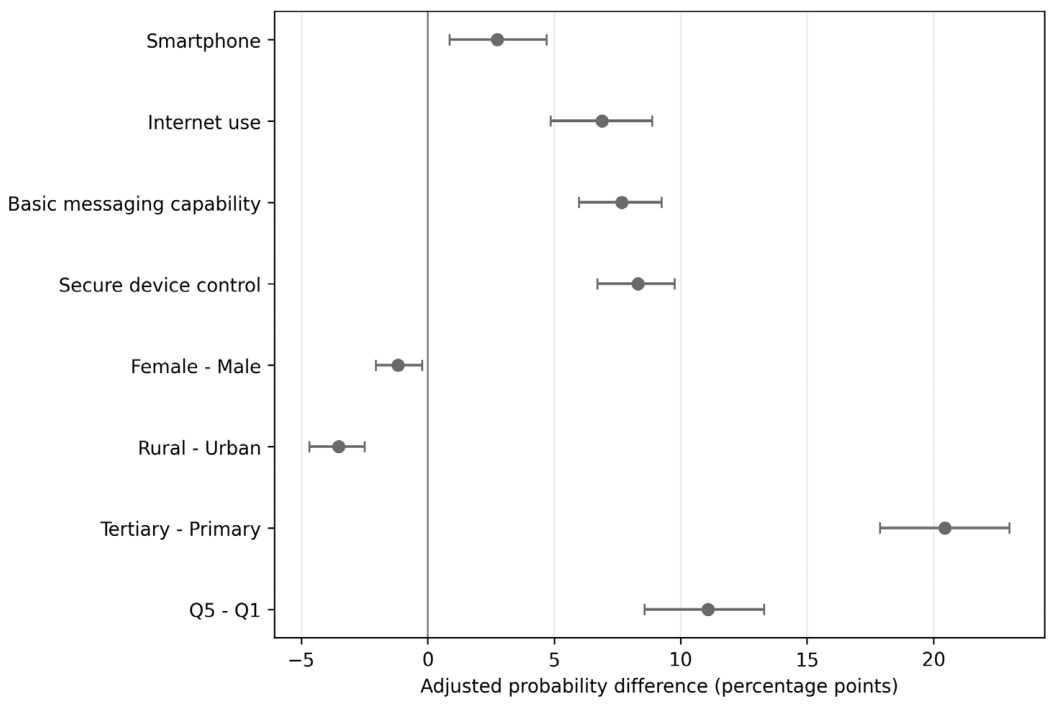
Figure 3.
Sequential attenuation of adjusted structural gaps. S0=structural covariates; S1=+connectivity; S2=+digital capability; S3=+secure device control.
Figure 3.
Sequential attenuation of adjusted structural gaps. S0=structural covariates; S1=+connectivity; S2=+digital capability; S3=+secure device control.
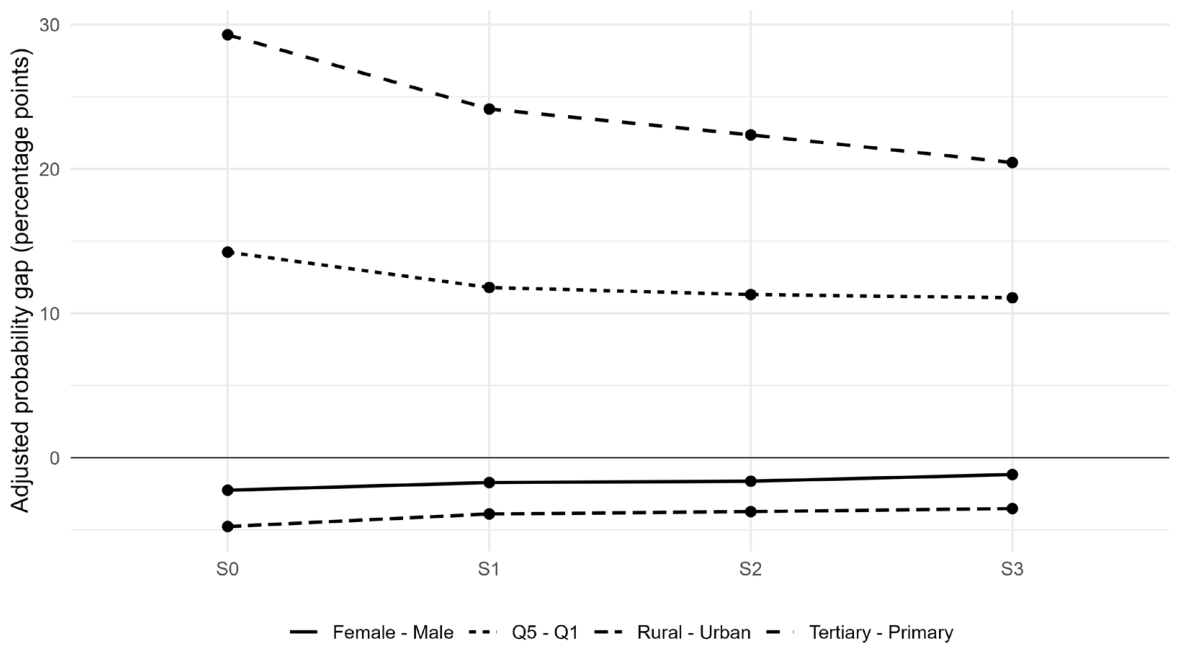
Figure 4.
Standardized probability contrasts across the digital financial participation chain.
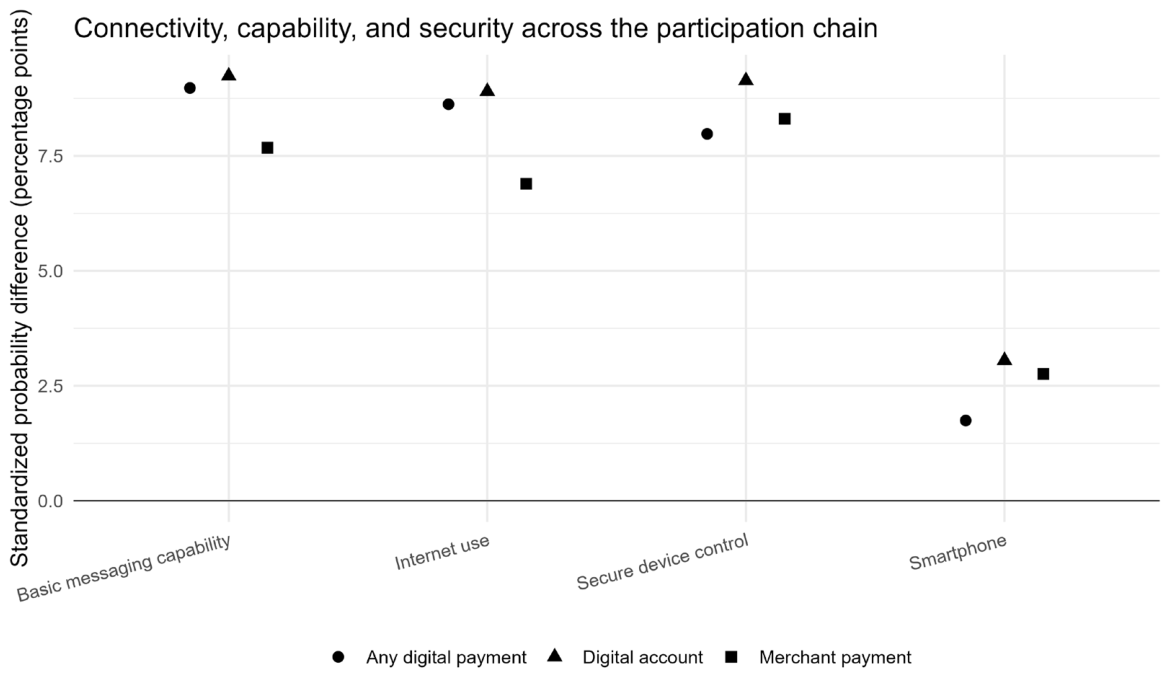

Table 1.
Analytical universes and sample sizes.
| Analytical universe | Adults (n) | Economies |
|---|---|---|
| Raw world microdata | 144,090 | 140 |
| Merchant outcome observed | 102,954 | 98 |
| Broad connectivity common sample | 96,939 | 96 |
| Primary safety common sample | 62,480 | 74 |
| Risk/scam common sample | 62,378 | 74 |
| Financial chain common sample | 62,480 | 74 |
| Emergency-fund common sample | 60,817 | 74 |
| Cash-only trust common sample | 26,046 | 74 |
Notes: The primary safety sample consists of phone-owning adults with complete information on merchant payment, smartphone status, internet use, digital capability, secure device control, covariates, survey weight, and economy. Module coverage explains the decline from the raw world file to the primary analytical sample. Construct definitions and coding rules are reported in Supplementary Table S1.
Table 2.
Balanced-economy trends and structural gaps.
| Series | Start | Value | End | Value | Economies |
|---|---|---|---|---|---|
| Account ownership | 2011 | 53.0 | 2024 | 80.6 | 108 |
| Any digital payment | 2014 | 35.6 | 2024 | 62.4 | 74 |
| Digital merchant payment | 2021 | 36.3 | 2024 | 39.9 | 74 |
| Mobile money account | 2014 | 4.1 | 2024 | 29.9 | 50 |
| Account gender gap | 2011 | 8.9 pp | 2024 | 3.7 pp | 101 |
| Account income gap | 2011 | 18.1 pp | 2024 | 9.6 pp | 98 |
| Any digital payment income gap | 2014 | 18.4 pp | 2024 | 17.0 pp | 61 |
| Merchant payment income gap | 2021 | 15.4 pp | 2024 | 18.7 pp | 43 |
Notes: Gaps are percentage-point differences. Gender gap = men minus women. Income gap = richest 60% minus poorest 40%.
Table 3.
Sequential economy-fixed-effects logit models for digital merchant payment.
| Variable | S0 Structural | S1 + Connectivity | S2 + Capability | S3 + Security |
|---|---|---|---|---|
| Female | -0.173*** (0.040) | -0.136*** (0.038) | -0.129*** (0.037) | -0.094* (0.038) |
| Age/10 | 0.323*** (0.083) | 0.299*** (0.078) | 0.284*** (0.077) | 0.333*** (0.076) |
| (Age/10)2 | -0.059*** (0.011) | -0.048*** (0.010) | -0.043*** (0.010) | -0.043*** (0.010) |
| Secondary education | 0.971*** (0.057) | 0.756*** (0.056) | 0.667*** (0.055) | 0.599*** (0.054) |
| Tertiary education | 1.960*** (0.071) | 1.685*** (0.076) | 1.582*** (0.078) | 1.473*** (0.079) |
| Income quintile 2 | 0.251*** (0.056) | 0.218*** (0.054) | 0.205*** (0.054) | 0.206*** (0.056) |
| Income quintile 3 | 0.463*** (0.064) | 0.376*** (0.064) | 0.357*** (0.064) | 0.358*** (0.065) |
| Income quintile 4 | 0.721*** (0.069) | 0.612*** (0.070) | 0.585*** (0.070) | 0.587*** (0.071) |
| Income quintile 5 | 1.082*** (0.080) | 0.918*** (0.079) | 0.887*** (0.077) | 0.882*** (0.078) |
| In workforce | 0.677*** (0.050) | 0.677*** (0.050) | 0.671*** (0.050) | 0.660*** (0.049) |
| Rural | -0.361*** (0.051) | -0.304*** (0.048) | -0.293*** (0.048) | -0.281*** (0.047) |
| Smartphone | — | 0.501*** (0.073) | 0.388*** (0.073) | 0.224** (0.077) |
| Internet use | — | 0.854*** (0.084) | 0.666*** (0.079) | 0.569*** (0.077) |
| Basic digital capability | — | — | 0.736*** (0.071) | 0.637*** (0.067) |
| Secure device control | — | — | — | 0.658*** (0.050) |
| Pseudo-R2 | 0.308 | 0.325 | 0.331 | 0.339 |
| AIC | 48,224 | 47,038 | 46,629 | 46,095 |
Notes: N=62,480 in all models. Economy fixed effects included. Findex sampling weights applied; standard errors clustered by economy in parentheses. Education reference = primary or less; income reference = quintile 1. *** p<0.001; ** p<0.01; * p<0.05.
Table 4.
Standardized probability contrasts in the final model.
| Contrast | Difference (pp) | 95% CI low | 95% CI high |
|---|---|---|---|
| Smartphone | 2.76 | 0.86 | 4.71 |
| Internet use | 6.89 | 4.87 | 8.89 |
| Basic messaging capability | 7.68 | 5.98 | 9.25 |
| Secure device control | 8.31 | 6.71 | 9.77 |
| Female - Male | -1.17 | -2.04 | -0.22 |
| Rural - Urban | -3.52 | -4.68 | -2.48 |
| Tertiary - Primary | 20.44 | 17.89 | 23.00 |
| Q5 - Q1 | 11.08 | 8.57 | 13.31 |
Table 5.
Robustness summary.
| Robustness check | Result |
|---|---|
| Wild-cluster bootstrap, B=9,999 | Internet p=0.0002; capability p<0.0001; security p<0.0001; rural p<0.0001 |
| CR2/Satterthwaite | Internet p=0.0001; capability p<0.0001; security p<0.0001; rural p<0.0001 |
| LMIC-only | Core ORs nearly unchanged: Internet 1.75; capability 1.89; security 1.92 |
| Population-scaled weights | Core directions persist; Internet 2.25; capability 2.38; security 1.99 |
| Alternative security definition | PIN/lock-only OR 1.92 vs. composite OR 1.93 |
| Leave-one-region-out | Internet, capability, security, and rurality significant in all 7 omissions |
| Exploratory FDR | Security×Female q=0.036; Security×LAC q=0.036 |
Disclaimer/Publisher’s Note: The statements, opinions and data contained in all publications are solely those of the individual author(s) and contributor(s) and not of MDPI and/or the editor(s). MDPI and/or the editor(s) disclaim responsibility for any injury to people or property resulting from any ideas, methods, instructions or products referred to in the content. |
© 2026 by the authors. Licensee MDPI, Basel, Switzerland. This article is an open access article distributed under the terms and conditions of the Creative Commons Attribution (CC BY) license.
Copyright: This open access article is published under a Creative Commons CC BY 4.0 license, which permit the free download, distribution, and reuse, provided that the author and preprint are cited in any reuse.