

Submitted:
07 September 2026
Posted:
09 September 2026
You are already at the latest version
Abstract
The Internet of Things (IoT) has enabled smart electricity metering as part of smart city infrastructure, enabling automated consumption reporting, accurate billing, real-time outage visibility & demand response, and remote operational control. However; this advancement creates additional cyber physical attack surface in addition to the existing one, including those related to smart meters, gateways, brokers, edge nodes, and utility head end systems (HES). Recently reported literature continued to reflect growing concerns over IoT cybersecurity, smart meter threats, edge computing, and covert channel behavior in IoT environments. This article introduces Adaptive Steganography Trust Signaling (ASTS), which is a defensive network steganography framework that embeds very small, authenticated trust signals within normal smart meter traffic to enable tamper evidence, and edge level integrity verification. The purpose of malicious covert channels is to hide unauthorized communications; however, ASTS is both policy-bound and rate-limited for auditing purposes and to serve as an additional layer of support for conventional cryptographic authentication methods. The flow of smart electricity meter data (and other utility services) is supported by ASTS using bounded timing and ordering, which is provided by policy and protocol definitions within that framework. A risk-based decision model embedded in the framework identifies the appropriate method to embed ASTS into networks based on various factors including anomaly detection, network conditions, device trust levels, and the level of importance of the services being utilized. This paper provides algorithms for adaptive embedding, verification, and policy driven adaptation. A synthetic evaluation model representing periodic meter readings, replay attempts, tampering events, intermittent network degradation, and data manipulation events are used to evaluate performance prior to field deployments. The contribution of this work is a complete framework for adaptive defensive network steganography in smart electricity metering. From the experiments conducted, the proposed ASTS model outperformed static models, and related models from the state-of-the-art previous studies.
Keywords:
network steganography
; ASTS
; MQTT
; CoAP
; internet of things
; cryptography
; LPWAN
; COSEM
; smart metering
; DLMS
1. Introduction
Smart grids are an example of how IoT can be used to make cities smarter. They are referred to as the most operational IoT-based application that exists in the world today [1,2,3]. The new generation of smart meters are no longer simply a means of collecting usage data, but rather they are endpoints that collect real-time data from the field and participate in both billing and demand response. These smart meters also have the ability to receive command updates remotely, and transfer data back to the HES via gateways, brokers, and edge platforms [4,5,6,7,8]. Due to these advancements, deployments of smart meters exist at the crossroads of cybersecurity, cyber-physical resiliency, data governance, and public trust [7,8,9,10,11,12,13,14,15,16,17].
Additionally, the connectivity of smart meters varies widely. The data collected from these endpoints may travel over low power wide area network (LPWAN), cellular links, radio mesh networks, local gateways, constrained application control (CoAP), message queue telemetry transport (MQTT) brokers, device language messaging specification (DLMS) or companion specification for energy metering (COSEM) based interfaces, utility HES. Some examples of current research being done in areas of communication for smart grids, and IoT enabled grids highlight the importance of balancing reliability, throughput, latency, scalability, energy consumption and security requirements. MQTT and CoAP are popular due to their low overhead design which allows for lightweight telemetry exchange [7,11,17,18,19,20].
Traditional controls such as authentication, encryption, access control, intrusion detection systems, anomaly detection, and firmware management remain necessary for securing IoT enabled smart meters [21,22]. Unfortunately, numerous studies continue to demonstrate that despite all of the efforts made to secure them, many IoT systems including smart meter systems continue to be vulnerable to threats such as unauthorized access, replay attacks, data manipulation, denial-of-service (DoS), malware, weak authentication mechanisms, and outdated software [10,14,15,23,24,25,26,27,28,29,30]. Research and datasets focused on MQTT have demonstrated that developing effective detection systems for IoT and smart meter systems will require traffic features representative of realistic attack scenarios and evaluation methods [11,26,27,28,29,30,31,32,33,34,35].
Technically, network steganography is relevant to this problem. In its offensive form, network steganography uses a variety of mechanisms to hide information in various aspects of protocol data units (PDUs), packet timing & ordering, or other forms of network traffic features. Research conducted by Cabaj et al., examined distributed covert channels for IoT environments, and Smolarczyk et al. proposed multilayer network steganography detection using scalable steganalytic considerations [1,2]. Recent surveys and taxonomies provide evidence that covert channels and network steganography continue to be active concerns across modern and IoT enabled networks [4,13,28,29,30].
Figure 1 below illustrates an end-to-end architecture of a smart electricity metering system.
Instead of using network steganography to enable covert and unauthorized communications, we use this technique to provide trusted, approved and rate limited signaling as part of the normal flow of legal data transmission between devices. The purpose of our signaling is to create an additional layer of verifiable integrity observability that can be examined by the receiving endpoint gateway or HES. Since a signaling message will indicate whether there has been manipulation, replay, policy deviation, or delay from normal signaling sequence, the receiver gets additional information about the occurrence of tampering and/or degradation in communications [1,23,31,32].
This article’s contributions include: a defensive ASTS system model for smart electricity metering; risk-based policy driven adaptive embedding models; integration at protocol level of MQTT; embedding, extraction & adaptation algorithms; a step-by-step experimental implementation; and a testbed.
This paper is organized into ten sections. Section 2 outlines previous similar state-of-the-art works and summarizes the contribution of this study in line with the identified study gaps and relevance. Section 3 presents the proposed scheme/framework and methodology. In Section 4, the proposed system model and assumptions are discussed, including the proposed model architecture. Section 5 presents the decision model and adaptation workflow as part of the proposed framework. A protocol-level integration for the smart electricity metering case study is presented in Section 6. The experimental setup with step-by-step implementation framework is presented in Section 7. In Section 8, synthetic implementation, evaluation, and discussion is presented. Finally, Section 9 concludes the work and presents the limitations and ideas of future work.
2. Related Works
Recent research has identified six streams that intersect with this research project [1,2,3,4,5,6,7,8,9,10,11,12,13,14,15,16,17,18]:
- Cybersecurity of smart meters (in smart grids context)
- Smart grid communication using IoT enabled smart grids
- Security of IoT protocols (including their application in smart grids)
- LPWAN and constrained communication methods (for smart meters and other IoT devices)
- Edge/cloud computing for smart cities
- Network steganography and covert channel detection.
Each of these streams focuses on different aspects of the problem; however, no one stream provides a complete implementation and evaluation of adaptive defensive network steganography, specifically addressing smart electricity metering.
Tightiz & Yang evaluated the characteristics of protocols used in smart grid communications, while Kirmani et al. and Goudarzi et al. reviewed smart grid architecture and its associated challenges [7,9,17]. This state-of-the-art prior work motivated evaluations based on protocol awareness because smart metering is fundamentally dependent upon communication processes in order to function properly. Nambundu et al.’s review focused on cyber threats and vulnerabilities related to smart meters. Other researchers have described the increased potential for attacks due to digitization and expansion of the attack surface in smart grids [10,18,23].
MQTT & CoAP are two examples of communication protocols which are relevant to gateways for metering and sensor telemetry in smart cities. MQTT is an OASIS standardized lightweight client-server publish/subscribe message transport protocol. CoAP is an internet engineering task force (IETF) standardized web transfer protocol for constrained node networks in low power or lossy networks [19,20]. Research into MQTT security, along with the creation of MQTT-IoT-IDS2020 datasets indicate that features of traffic, benchmarks for datasets, and methods of detecting intrusions will all be important in developing and evaluating solutions for IoT systems [11,26,27].
DLMS/COSEM and IEC 62056 are important because smart metering requires standardized data exchange and object models. DLMS UA describes DLMS/COSEM as an internationally adopted data model and data format for data exchange in smart management and smart metering, and international electrotechnical commission (IEC) 62056-8-12 defines DLMS/COSEM usage over LPWANs including long range wide area network (LoRaWAN)-oriented profiles [21,22]. The purpose of these standards is based on the determination to exclude ASTS from the payload of semantic metering and to include trust signaling in a gateway (north bound) envelope.
The study of network steganography and covert channels supports both defensive designs and threat models. In particular, Cabaj et al. provide evidence of distributed network covert channels in IoT traffic, whereas Smolarczyk et al. suggest an approach to detect covert channels using multiple layers. Additionally, Wendzel and others have discussed taxonomic issues as well as descriptive approaches to detect covert channels. Recent IEEE surveys have also provided a comprehensive overview of how to construct/detect covert channels in networks [1,2,29,30]. Cyber-physical and industrial security research has also established connections between network steganography and industrial control system (ICS)/cyber-physical system (CPS) environments. As such, it is related to electricity metering and the operation of smart grids [31,32].
Adaptive trust decision making will be facilitated by edge computing. Surveys on smart cities enabled by edge-computing have emphasized the importance of low-latency and localized data processing. Furthermore, security work on smart cities has indicated that IoT applications need to employ real-time detection and policy-based mitigation [13,15,18]. NIST SP 800-82 Rev. 3 is also relevant because it frames OT security around systems that interact with the physical environment and require reliability, safety and performance-aware safeguards [23].
Table 1 below expands the positioning of this work against recent similar works.
3. Proposed Scheme/Framework and Methodology
The proposed system will be referred to as Adaptive Steganographic Trust Signaling (ASTS). The ASTS is an integrity-based message embedding and verification mechanism for trusted smart meter communication. The trust message will be created through use of a pseudorandom function (PRF), using a secret key as input. The PRF will include, but not limited to; meter identity, epoch number, sequence number, digest of meter readings, risk state, and policy ID.
The trust message is embedded into one or more approved carriers that are observable by protocols. These can be an established timing offset, a specific order of packets that occur within a small timeframe. In contrast to other systems that hide operational commands and transmit validation tokens to check integrity and prevent replay attacks, this design follows the same principle [1,2,29,30].
The proposed ASTS uses five main components for security:
- Defensive purpose
- Bounded capacity
- Auditability
- Compatibility
- Adaptive control
The defensive purpose component ensures that an authenticated token of trust, and authentication fragments are sent along with the payload. In addition, the second component (bounded capacity) restricts how much information may be communicated. Auditability records the risk assessment taken by each embedded mode and stores the results of extraction in order to track decisions made as well as provide an auditing record. The fourth element (compatibility) provides that the metering payload remains intact and allows for the insertion of gateways into legacy systems. The last component, which is adaptive control, dynamically adjusts the amount of signal that is used when verifying the integrity of normal versus suspect or high-risk activity, by increasing the amount of signals sent during higher risk transactions [10,21,22,23].
The proposed methodology follows the design-science-research methodology. The research artifact consists of the ASTS framework (algorithms, and policy models) as well as an experimental pipeline for the implementation of the ASTS framework. The requirements are based on smart meter cyber threats, IoT protocols limitations, network steganography literature, and OT reliability requirements. Evaluation will be carried out by means of a reproducible synthetic smart metering traffic model and a protocol-level testbed which will instantiate using real MQTT broker, CoAP proxy, DLMS/COSEM gateway and network emulation tool (Docker Desktop) [10,11,12,19,20,23,26].
4. Proposed System Model
The system model that has been proposed is composed of six entities that include: smart meters (SM); gateway/data concentrator (GW); edge trust engine (ETE); message broker/protocol mediator (BR); head-end system (HES); and security operations center (SOC). Smart meters measure energy consumption by producing readings at regular intervals. GW collects all messages from the various smart meter devices in the neighborhood, as well as to translate protocols used for field communications to IP based telemetry. The ETE will calculate the risk state of each smart meter reading, select an appropriate embedding method for each reading, verify each trust signal received with the utility’s policies and write an audit record. The HES will consume these readings after they have been validated to make operational decisions regarding billing, forecasting, etc. The SOC will then review each suspicious integrity event and policy exception.
Let denote the smart meter. At the reporting epoch , the meter generates a measurement and sequence identifier . A metering-state digest is computed as . Given the normalized risk state , policy identifier , and trust key , an adaptive trust token is generated as . The token is fragmented and mapped to policy-approved network carriers (as per algorithms 1 & 2 presented in Appendices A.1 and A.2). At the receiver, the embedded fragments are reconstructed to obtain , which is compared against the independently generated expected token . Verification is successful if . Otherwise, a decision-making function is determined by a specific policy which is mapping the measure of discrepancy to one of four states: Accept; Warn; Quarantine; or Reject (see algorithm 3 in appendix A.3), and therefore it allows us to provide trust signaling that can be verified through mathematical evidence as well as for operations under limited IoT smart meter communication environments.
(a) Trust Signal Generation Model
Let
is defined as a set of smart electricity meters in a network, where represents meter .
At reporting epoch , meter generates:
which is an electric consumption measurement, and
which is a sequence number for communications.
The metering-state digest is computed as
where:
- is a cryptographic hash function;
- denotes concatenation.
(b) Trust Token Construction (Adaptive)
Let
Represent the network-risk level as evaluated by the ETE at the current time, and
Denote an active security policy identifier to be applied during epoch .
The adaptive trust token is generated according to equation 2 below:
where:
- represents a symmetric trust key associated with ;
- represents the keyed hash-message authentication function;
- is the policy-defined length for the generated trust tokens;
- generates the first bits of the HMAC result.
Thus,
(c) Trust-Token Fragmentation and Carrier Mapping
The generated token is partitioned into trust fragments:
subject to
Each fragment is then mapped to a policy-approved carrier
where:
denotes the set of permissible embedding carriers (e.g., bounded timing offsets, packet-order patterns, or metadata carriers).
The embedding operation is defined by
where denotes the observable trust signal embedded into legitimate network traffic.
(d) Trust-Token Reconstruction and Verification
At the verification entity (gateway or head-end),
reconstructs the recovered trust token
The expected trust token is independently computed as
Verification is therefore expressed as
(e) Policy-Based Decision Function
Let
be the Hamming distance between the received and expected trust tokens.
The verification decision is defined as
where:
are policy-defined warning and quarantine thresholds.
The model assumes four operating states: Normal, Degraded, Suspicious, and Critical. Smart metering in normal state uses a minimal amount of embedding. Degraded state reflects losses to the network, jitter and queueing. The suspicious state reflects anomaly indicators, tamper flags, sequence gaps, replay suspicions, and authentication warnings. Critical state is used for confirmed tampering and high-value operational actions, as well as repeated integrity failures.
Below Figure 2 shows an illustration of the proposed architecture for smart electricity metering.
Table 2 below summarizes the function of each component within the architecture.
(f) Precision, Recall, and F1-Score Evaluation Formulae
The equations below will be used to calculate the performance parameters for B0, B1, and P1 in the results section.
where:
- TP means true positive, which indicates a correct positive prediction
- FP means false positive, which is an incorrect positive prediction (also known as a type 1 error)
- FN is false negative, which indicates an incorrect negative prediction (also known as a type 2 error)
5. Policy-Driven Adaptation and Risk-Based Decision Model
The ASTS risk score will be represented by (risk value) on a scale of [0,1] that represents an individual SM risk. The risk score is based on four components that are combined: device trust deficit ; anomaly confidence ; network degradation ; and service criticality [10,11,23,26].
Device trust deficit includes:
- Trust deficit due to firmware status
- Sequence consistency
- Number of failures in prior verification events
Anomaly confidence includes:
- Tamper flags
- Prior consumption transitions (normal versus abnormal)
- Suspicion of replay activity
- Broker alerts
Network degradation includes:
- Packet loss
- Jitter (max allowable)
- Late packets (count and time allowed)
- Gateway queue length
Service criticality includes:
- Routine readings
- Outage events
- Tamper alarms
- Command acknowledgements
- Billing-critical time intervals
The decision function is calculated as follows:
where α + β + γ + δ = 1 and all inputs are normalized to [0,1].
The policy π maps to a mode and a parameter vector (, , , , ) where is token length, is packet window size, is carrier set, is a redundancy factor, and is audit severity. Additionally, it includes in its policy repository information on the maximum jitter allowed per network segment, maximum data that can be used by metadata for each network segment, minimum period allowed between events, and what carriers are permitted for each of these network segments.
Figure 3 below shows the flow diagram of the risk model and policy adaptation.
The table below indicates the weighted risk score mapping to the embedding parameters.

Table 3.
Risk mapping to embedding parameters.
| Mode | Risk Interval | Min Token Bits | Window Size | Carrier Set | Audit Action |
|---|---|---|---|---|---|
| Normal | [0, 0.25) | 16 | 8 packets | Metadata/Timing only at the Gateway | Store summary |
| Degraded | [0.25, 0.50) | 24 | 6 packets | Sequence pattern + Timing | Store event detail |
| Suspicious | [0.50, 0.75) | 32 | 4 packets | Metadata + Timing + Redundant | Compare immediately to determine match/mismatch. Alert on mismatch |
| Critical | [0.75, 1] | 48 | 3 packets | Redundant Approved Carriers | On mismatch, quarantine & send SOC alert |
6. Protocol-Level Integration for SM
ASTS provides two main modes of operation: meter native and gateway augmented. Meter native has several requirements; the meter firmware must have token generation capability, and fragment encoding capability. Gateway augmented is more suitable for legacy environments. The SM will send standard readings to GW, and then the GW will calculate the digest, add trust fragments to north bound telemetry and forward the secure flow to HES. The use of this method maintains the existing object semantics and supports smart city telemetry using MQTT/CoAP [19,20,21,22].
The proposed ASTS framework does not alter the billing payload when sending a meter reading using MQTT-type integration. Instead, the GW adds authenticated trust indicators via approved metadata, audit topic, or bounded inter-publication timing. For CoAP type of integration, ASTS may use GW side option patterns or bound time responses with re-transmission and lost packets policies. ASTS will extract tokens from the DLMS/COSEM based exchanges when data is being exchanged for secured metered objects and create trust fragments that are placed in either a north bound envelope or GW audit stream [19,21,22,23].
ASTS implements protocol integrations utilizing carrier abstraction. Each carrier exposes encoding (bit fragment, flow state & policy) and decoding (flow observation & policy) methods. Additionally, each carrier declares capacity, jitter cost, metadata cost, compatibility, and detection risk. The risk engine selects carriers which are expected to result in minimum operational impact given the selected mode.
Figure 4 illustrates the holistic protocol level integration workflow and demonstrates how ASTS will operate across multiple types of meter exchanges.
7. Experimental and Implementation Setup
In this section we describe how the experiment was conducted, including the experimental configuration. For this testbed, we used a number of different components that were designed to simulate real-world traffic and then to analyze it to measure the performance of our proposed architecture. These components included a synthetic SM generator, an ASTS GW service, two transport profiles for MQTT/CoAP, a fault injection module and a metrics collector. The implementation was executed on Docker Desktop v4.82.0, a containerized testbed. No live customer data was used during the experiment. The experimental analysis was completed in Jupyter Notebook using Python 3.0.
The testbed setup consists of 10 000 synthetic smart electricity meters which are simulated in Docker, spanning across 1 epoch. Each meter emits 0,1 seconds interval readings, sequence numbers, and event flags. Using these modules, the GW calculated digests (a hash function applied to the data that has been collected from the smart meters to ensure that the integrity of the data is maintained during transmission), computed a risk score (the GW assigns a risk score based on the characteristics of the data being transmitted), and computed a trust token (the GW assigns a trust token based on the identity of the data transmitter). Each time a message is sent from one of the SM outputs, there are three possible transport protocols available; B0 (only encryption), B1 (with static trust signal), and P1 (with our proposed ASTS). Additionally, using the same transport protocols (B0, B1, P1) the messages generated by the GW will be transmitted with five types of faults injected into them as follows: None (S0), Replay (S1), Manipulation (S2), Delay/degradation (S3), Critical tampering (S4), and Packet loss/Mixed (S5). A metrics collector was also employed to compare all three of the above-mentioned transport protocols across all six possible fault injections.
Figure 5 illustrates the overall experimental design.
Table 4 below shows the experimental components and their respective outputs.
8. Evaluation Results and Discussion
This section provides a synthesis evaluation of results from the experimental process carried out in the Docker Desktop environment. The tables below provide the optimal selected risk parameters for selecting an adaptive policy, as well as those identified through experimentation and reference to literature. The full results are presented as ‘Verifications_results.csv’ submitted as part of the supplementary materials, due to the length of the full results obtained over the 10 000 synthetic smart meters and 1 epoch.
The sum of the weight parameters in Table 5 is equal to 1, as per literature.
Table 5.
Alpha, Beta, Gamma, and Delta optimal values for Risk calculation.
| Parameter | Meaning | Weight |
|---|---|---|
| Alpha | Multiplier for the device deficit trust | 0.25 |
| Beta | Multiplier for the anomaly confidence | 0.40 |
| Gamma | Multiplier for the network degradation component | 0.15 |
| Delta | Multiplier for the service criticality component | 0.20 |
Table 6.
S0-S5 scenario summary and the respective weighted components for Risk calculation.
| Scenario | Device Deficit Trust ( | Anomaly Confidence ( | Network Degradation Factor ( | Service Criticality Factor ( |
|---|---|---|---|---|
| S0 (Normal) | 0.05 | 0.05 | 0.05 | 0.20 |
| S1 (Replay) | 0.15 | 0.70 | 0.10 | 0.40 |
| S2 (Manipulation) | 0.25 | 0.85 | 0.10 | 0.70 |
| S3 (Degraded network) | 0.10 | 0.20 | 0.90 | 0.25 |
| S4 (Critical tamper) | 0.80 | 1.00 | 0.20 | 1.00 |
| S5 (Mixed attack) | 0.70 | 1.00 | 0.80 | 1.00 |
8.1. Comparative Attack Detection Rate for B0, B1, and Proposed P1 Across All Attack Scenarios (S0-S5)
Table 7 below presents the summary of the results obtained after running the experiment.
Figure 6 illustrates the per-scenario detection rate heatmap for the B0, B1, and P1 variants. The figure shows substantial differences in terms of each variant’s sensitivity to different scenarios. All three variants showed zero percent detection when operating under normal traffic conditions (S0), which is in line with theory because no fault was injected for S0. Therefore, the inclusion of adaptive trust signaling resulted in no false positive readings when operating in a reported normal-traffic condition.
In comparison to B0 and B1, P1 provides the greatest competitive advantage in terms of replay detection rates (S1) where P1 provided a detection rate of 96.97% and B1 and B0 each provided a detection rate of 17.647% and 0% respectively. In addition, these results indicate that adaptive operation can significantly improve an observer’s ability to identify replayed data readings.
Comparative performance in detecting manipulated values is illustrated by the detection rates shown under manipulation scenario S2. B1 achieved 100% detection while P1 achieved 90.476% detection; therefore, it appears that the static trust-signaling approach used by B1 has a comparative advantage over the adaptive scheme implemented by P1 in this specific manipulation scenario, since B1 had a 9.524 percentage point greater per-scenario detection rate. However, the fact that B0 failed to detect any manipulated values demonstrates that both trust-signaling approaches are superior to B0. Since B0 is a baseline reference implementation and neither the B1 nor P1 implementations have been previously tested, it will be necessary to use verification logs and other forms of analysis to determine why some manipulation events were not detected by P1.
The results provided under S3 clearly illustrate the capabilities of the degradation awareness component included in the P1 design. P1 successfully identified 97.436% of the records associated with degraded networks while B0 and B1 reported zero percent detection. It is essential to interpret the results obtained under S3 in the context of degradation awareness rates rather than attack detection rates, because S3 represents packet delays, losses, jitters, queuing times, etc., which may or may not represent malicious activity. By making this differentiation, we avoid reporting valid P1 warning responses related to degraded transportation mechanisms as false positives. Additionally, we ensure that our experimental methodology establishes explicit associations between S3 and network degradation, partial token reconstruction, warn decision-making processes and latency-related issues.
Since all three variants demonstrated 100% detection of the critical tampering events under S4, S4 cannot be used to distinguish the various schemes based on raw detection rates. Rather, we suggest evaluating P1’s added value under S4 through risk mode escalations, quarantine decision-making processes, token strength adaptations and audit severities.
Finally, since all three variants demonstrated 100% detection for the critical tampering events represented by S4, we suggest that all three variants are equally effective at maintaining strong detection levels when multiples faults occur during mixed-condition operations (S5).
8.2. Results and Analysis of the P1 Mode Distribution by Scenario
The P1 operating mode distribution shown in Figure 7 demonstrates the adaptive characteristics of the proposed ASTS system.
Unlike B0 and B1, the P1 operating modes do not have a uniform trust-signal configuration assigned to each reading. The P1 edge-trust engine produces a risk score based on the provided input at each epoch. This epoch-based risk score is used as an index to map it to one of four different operational states that include; normal, degraded, suspicious, and critical. Once the appropriate operational state has been established by the epoch-based risk score, all of the configurable parameters (token length, packet window size, carrier permissions, redundancy, and audit severity) will be applied in accordance with their corresponding state.
As demonstrated in S0, the dominance of the normal mode indicates that the vast majority of benign readings are classified withing the lowest risk-interval. As previously stated, the results also indicate no false-warnings or detected anomalies were identified using the P1 operating mode during the normal traffic runs. Therefore, it appears that the adaptive nature of the ASTS policy does not achieve its higher attack-detection sensitivity through arbitrarily increasing normal meter reads to a suspicious read.
As seen in S1, replaying traffic creates transitions away from normal towards degraded; due to increases in both sequence consistency and replay confidence. These transitions correspond to a P1 detection-rate of 96.970%, which is significantly better than the B1 (17.647) and B0 (0%) detection rates. Thus, these results support the notion that state-aware adaptive verification is more detectable for replay observable attacks than static token signaling alone.
In S2, we see most of the readings concentrated in suspicious; since reading-manipulation can cause changes to payload integrity and anomaly confidence. However, P1 detects 90.476% of manipulated reads under S2; where B1 recorded 100% in the same test. This shows the importance of measuring the risk detection and ability to escalate risk separately. The correct mode classification helps us interpret the correct policies; however, if a detection fails during token reconstruction or with thresholds, it may still produce a valid report.
As expected, degraded is the dominant mode for S3, due to the fact that P1 can determine whether there are issues with transport conditions as opposed to determining an occurrence of an attack. Under S3, P1 has 97.436% degraded awareness rate; while B0 and B1 have 0%. We believe this behavior should be considered as degraded awareness rather than reporting false-positive attack detection; since the degraded mode supports controlled resilience actions without always treating network degradation as malicious activity.
In S4 and S5, we observe a transition into the critical mode; due to the combination of confirmed tampering indicators, high anomaly confidence, service criticality, and multiple simultaneous fault signals. While all three schemes record 100% S4 detection; the value in P1 lies in the policy driven classification and action taken after detection. For S5, P1 is again able to achieve 100% detection, and has a greater detection rate than B1 (90.909%).
8.3. Risk Score Distribution Analysis for the Proposed P1 Scheme
Figure 8 below illustrates the spread of adaptive ASTS risk scores among all five tested scenarios (S0-S5).
The figure shows how varying levels of operating conditions directly influence the resultant risk level through the demonstration of the proposed risk-based decision process. As such it is evident that under normal traffic conditions (S0), the majority of the data points are still located in the low-risk interval (normal region). Thus, this supports our proposition that an adaptive approach will allow us to preserve benign smart-meter operations without causing an unnecessary escalation.
On the other hand, as can be seen from both replay (S1), and manipulated (S2) attack scenarios, there are increasingly larger values assigned to risk. Therefore, these two types of malicious behavior have contributed significantly to risk determination.
However, we note that degraded network (S3) has a higher risk than normal traffic but lower than replay and manipulation scenarios. We believe this is due to the weighted strategy used when developing the ASTS framework. That is, the ASTS framework intentionally weights integrity compromise greater than communications quality. Therefore, while packet loss, delay, jitter, and queuing stimulate policy awareness, they do so without being treated as equal to intentional malicious attacks.
With respect to the critical tamper events (S4) and mixed compromise (S5), all of their risk score distributions indicate that the combined effect of anomaly confidence, device trust deficit, service criticality, and network degradation cause their sustained operation to remain in the critical policy region. These outcomes demonstrate that the risk model can differentiate routine smart-meter activity from serious operational threats and provide a mathematically consistent foundation for adaptive trust signaling.
8.4. Results of Processing Latency Comparisons Between B0, B1 and Proposed P1
Comparative graphs of the average latency (milliseconds) of B0, B1 and proposed P1 are shown in Figure 9 and Figure 10 below.
Figure 9 and Figure 10 illustrate the relationship between attack-detection performance and average latency for the B0, B1, and P1 variants. On the vertical scale, it shows the proportion of attacks successfully detected out of total number of attack records; specifically, in replay, manipulation, critical-tampering, and mixed-scenario context.
The horizontal scale consists of the end-to-end record-weighted averages of latency. As such any effective security system should be located at the top left area of the chart as this indicates both high detection levels and low costs in terms of latency.
As can be observed from the experimental results shown in Figure 10, there is a considerable increase in the ability to observe attacks from B0 to B1 and further increases from B1 to P1. In terms of the number of each type of attack (S1, S2, etc.) included in each variant’s sample set and the corresponding detection rates, we found that B0 detected attacks at about a 44.88% rate, B1 detected them at about 77.61%, and P1 at about 96.32%. Therefore, P1 improved its weighted attack-detection performance by approximately 51.44% over that of B0, and 18.71% over that of B1. The primary reason for these improvements was due to the adaptive scheme’s highly favorable reaction to replay and mixed attacks.
Although the addition of several new operations (adaptive risk scoring, mode selection, token creation/verification) did cause a slight increase in the time required to process each record, the mean latency times for all three variants remained relatively close together. B0 had an end-to-end average latency of approximately 151501.43 milliseconds, B1 had an average of about 151563.07 milliseconds, and P1 had an average of approximately 151525.54 milliseconds. Although P1 showed a large increase in its detection capability, its end-to-end average latency was almost exactly equivalent to those of B0 and B1.
The end-to-end average latency in this experiment includes all the processes that were executed in Docker (broker queuing, scheduler variability within containers, emulator-induced delays within the network, and the length of time between when a record was generated by the simulator and processed by the verifier), not only the execution of the variant’s schemes. The broker and verifier logs (submitted as broker_logs.txt and verifier_logs.txt as part of supplementary materials) contain the component-timestamp data for specific scheme’s latency details.
Hence, although P1 does incur higher computational expenses than either B0 or B1 in order to achieve higher detection capabilities (in terms of end-to-end experimental latency), since P1 had both superior detection rates than B0 and B1, and also incurs roughly the same amount of latency as they do, it is reasonable to conclude that P1 offers a better tradeoff given the parameters of this study.
8.5. Bandwidth Overhead Comparison for the B0, B1, and P1 Variants
The amount of data exchanged per message for each of the three schemes (B0, B1, and P1) is shown in Figure 11.
The results demonstrate a trend where increasing message sizes move progressively toward the dynamic adaptation provided by ASTS. B0 has the least amount of traffic, since there is no information about trust tokens within the flow of messages.
B1 uses a static trust token and therefore produces an intermediate-sized message. P1 produces the greatest average amount of payload since P1 adjusts the length and redundancy of trust tokens, which are carried via carriers, and includes audit metadata based on the level of risk currently experienced. The increased bandwidth seen for P1 does not represent unnecessary communication overhead. Rather, this increased bandwidth represents the operational costs associated with enabling adaptive integrity observability.
Compared to B1 (whose communication overhead is independent of its surrounding security environment), P1’s communication overhead will only grow if higher levels of risk are being observed. Consequently, more bandwidth is used during those situations where a greater degree of protection is required (i.e., replay attacks, manipulations, critical-tamper attacks, mixed compromise attacks).
Another significant finding is that the increase in average message size is accompanied by an even greater increase in the ability to detect attacks. Thus, this adaptive strategy provides an optimal balance between security and communications bandwidth when compared to two baseline methods (B0 & B1) which were employed to assess performance. While P1 generates the most overhead in terms of communication, it generates a greater degree of verification regarding trust tokens, attack detection, audit logs, and adaptive response to threats than are possible through B0 or B1.
The results thus demonstrate the ability to create a practical trade-off between the need to maximize the efficient use of communications bandwidth and to ensure the highest level of cyber-physical security using adaptive trust signaling. Rather than paying a perpetual price for the added costs of security, P1 only requires a linear increase in bandwidth consumption commensurate with the operational risks being incurred. The proportional nature of the increase in bandwidth usage is reflective of the key design objectives of the proposed ASTS, such as enabling risk-aware security controls while maintaining compliance with communication constraints associated with smart electricity meters.
8.6. S0 False Warning Rate Analysis for B0, B1, and P1
This section provides an analysis of false warning under normal traffic scenario (S0). It evaluates whether B0, B1, or P1 incorrectly raise security alerts for benign traffic.
Figure 12 provides a comparison of the false warning rates for the three variants (B0, B1, and P1) under normal traffic conditions (S0). The false warning rate represents the portion of benign S0 records misclassified as either warn, reject, or quarantine. Each of the variants demonstrated a 0% false warning rate based on the respective number of S0 records (as per table 7). None of the 196 (B0), 193 (B1), and 192 (P1) smart-meter readings generated during the reported experimental run were incorrectly escalated by any of the three evaluated variants.
Testing results indicate that even though P1 had many more verification features than B0 and B1, when tested under normal flow conditions (S0), the number of false alarms (which were zero) is consistent with the finding that increased sensitivity to attacks through P1 does not come at the expense of labeling every normal data sample as malicious.
The results are also consistent with our determination about how well calibrated P1’s risk function was. That is, when running on normal flow, all P1’s risk function input values (device deficit, anomaly confidence level, network degradation indicator, and service criticality) were sufficiently low so as to require no higher-than-minimum policy configuration settings than those required for collecting normal meter readings.
In addition to providing high-quality attack-detection capabilities during both replay and mixed attacks, the ability of P1 to produce a zero observed false-warning rate in normal traffic provides additional evidence for what we consider to be an attractive trade-off between sensitivity and specificity.
8.7. Decision Distribution Graph for the Three Tested Variants
This section demonstrates how each of the experimental variants respond after processing a smart electricity meter record.
Figure 13 shows the distributions of outcomes (accept, warn, reject, and quarantine) generated from the B0, B1, and P1 schemes. It expands on the detection rate analysis (in section 8.1) and illustrates how the schemes differ in their handling of verified, degraded, suspicious, and critical meter reading data. The analysis is significant because; two variants could have similar detection rates yet respond very differently to the same sets of input data.
The B0 distribution is highly skewed toward the accepts since no form of adaptive trust-token verification is used in B0. While using this approach prevents any disruptions to the normal flow of messages, one must consider the high number of accepts along with B0’s poor performance under replay, manipulation, and degraded networks. Our results demonstrated 0% detection rates for S0, S2, and S3 for the B0 scheme.
In contrast to B0, B1 implements a static trust-token verification which significantly enhances its ability to identify meter readings that have been directly modified. B1 was able to achieve 100% detection for S2 but only 17.647% for S1 and 0% for S3. These results suggest that static verification performs well at identifying inconsistencies within payloads; however, it is relatively insensitive to both replay and network degradation scenarios.
The decision-making process used by P1 is much more varied due to the combination of adaptive risk assessment with four separate operating modes (normal, degrading, suspicious, and critical). P1 can adjust token length, packet window size, redundancy, and audit severity as the risk level of a given transaction increase. Therefore, P1 can provide warn decisions for degraded transport situations and quarantine decisions for integrity issues at elevated risk levels rather than simply accepting or rejecting each verification attempt.
When P1 generates warnings during the S3 scenario, it should be viewed as a means of recognizing degradation in transport quality rather than incorrect labeling of attacks. When P1 generates a high quarantine percentage under S1, S2, S4, or S5, it is indicative of successful detection coupled with a decision to preserve evidence prior to deleting the records. This response type would be preferred by many utilities in terms of managing intelligent metering systems because suspicious or tampering related billing information can be immediately isolated for secondary review without being deleted permanently.
Lack of P1 rejection does not indicate that the system is providing lower overall security protection. It indicates a change in response semantics. B1’s primary function is to determine if tokens are valid. P1 determines whether a verification failed based on a set of risk factors and then decides what actions should be taken against the record, such as issuing a warning (indicating potential compromise), placing the record into quarantine (as evidence preserving measure prior to permanent deletion of the records), or terminating the record outright.
8.8. The Analysis of the Adaptive Token Length for P1 for All the Scenarios (S0-S5)
Figure 14 shows how much on average the P1 scheme’s trust-token was, as a function of each scenario (S0-S5); and n represents the number of events per scenario. This analysis helps us in the evidence of adaptive security behavior of the proposed P1 scheme; since trust-token is sized based on the risk-state calculated. Static trust signaling schemes are generally fixed verification payloads, which will not adapt to varying operational contexts. On the other hand, the proposed ASTS varies the amount of token strength in response to operational risks.
In the normal scenario (S0), we observe the smallest trust-token sizes. Therefore, benign smart electricity meter traffic results in the least possible signaling costs. This is shown to be possible by the determination of how the proposed ASTS provides both secure communication and effective communication so long as all risks stay below what can be considered as normal. We also observe an increased trend in average token size for each type of replay, manipulation, and degradation; indicating that there is need for more verification, as with increased uncertainty.
We have seen that critical tamper (S4) and mixed fault (S5) scenarios produce the largest trust-tokens; this corresponds to the use of the strongest verification mechanisms available under the critical policy specification. The results show how the proposed ASTS model uses robust verification techniques to cover those cases in which threats are higher. Summarizing, we can say that ASTS develops an adaptive relation between the effort to assure security and the gravity of the threat. Instead of paying a high price for security at all times regardless of operational risks, the costs for security will be scalable based on the severity and probability of an attack against the integrity of the system.
8.9. A Precision, Recall, and f1 Analysis of the Proposed P1 Scheme
This section of the results describes how accurately B0, B1, and P1 distinguish attack records from benign records. To illustrate this point, we consider the Precision and Recall values for each variant as per Figure 15 and Figure 16. Precision represents the ratio of true alarms out of all alarms generated. It captures how well a classifier avoids reporting false warnings. Recall represents the proportion of actual attacks among all relevant attacks. The F1-score captures both quantities. The computation formulae for the three metrics are presented in section 4 (f).
In the experiments presented, the Precision values of all three variants are almost equal with 100%, since there are no false positives under normal traffic scenarios (S0) as per Figure 12. The B0 variant had only 6 true positive and 190 true negative records during S0 (and similarly for B1 and P1). In other words, none of the 196 B0, 193 B1, or 192 P1 S0 records were incorrectly escalated into a false alarm. Hence, the testbed schemes preserved all benign meter traffic in the sample experiment. However, Precision alone is insufficient to discriminate between the three variants. From literature, a very conservative detector maintains high Precision by generating very few detections.
B0 had the lowest approximate Recall due to its insensitivity to replay, manipulation, and network degradation. However, B0 was able to detect explicit critical tampering and mixed attack conditions. B1 increased Recall by means of static trust token verification which was mainly effective against manipulation. Although static verification can provide a certain level of confidence in some cases, it does not effectively address S3 and provides very little replay protection. P1 obtained the best Recall since it effectively addresses all attack types (replay, manipulation, degraded network, critical tampering, and mixed attacks conditions) through adaptive risk scoring and policy driven verification.
The inclusion of S3 is important when evaluating the entire benefit from utilizing an ASTS system. P1’s S3 warn decisions are accurate representations of the degradation of the network. Therefore, these decisions should not be viewed as false positives. The inclusion of the network degradation terms in P1 allows for the identification of packet delay, jitter, loss, and queuing issues which could affect the overall reliability of the verification process. Thus, this capability will increase P1’s Recall with no increase to the observed S0 false warning rate.
On an aggregate basis, the approximate Recall values with S3 included were 0.349 for B0, 0.594 for B1, and 0.964 for P1. With an assumed Precision value of approximately 1.00, the associated F1 scores were approximately 0.518, 0.745, and 0.982 respectively. These results demonstrate that P1 has the greatest trade-off between recognizing normal traffic and identifying security attacks and reduced operating conditions.
8.10. Comparison of the Proposed ASTS Model with Prior State-of-the-Art Studies
This section compares the proposed methodology with other state-of-the-art works completed previously.
8.10.1. Al Hanif et al. [11] – Effective Feature Engineering Framework for Securing MQTT Protocol in IoT Environments
The state-of-the-art previous study presented in [11] enhances the detection efficiency of an MQTT traffic intrusion detection system (IDS). They proposed an approach to develop a binary balanced MQTT dataset with an effective machine learning and feature engineering framework to increase the robustness of MQTT traffic. Table 8 below shows the performance comparison between the proposed P1 scheme and work presented in [11] and [27].
The results presented in Table 8 illustrate that the proposed ASTS model is highly competitive with some recently completed state-of-the-art studies by Al Hanif et al. and Hindi et al.
9. Conclusions
This paper presented a proposed adaptive steganographic trust signaling (ASTS) model, which is a policy-driven defensive network steganography scheme to enhance IoT communication security in smart electricity metering systems. The proposed model is a layer of trust observability rather than an offending model. This model incorporates an authenticated sign to include in a SM reading, time/sequence of events, epoch, risk and adaptive policy for verifiable audit at very low overheads. Comparatively, P1 was shown to have good performance as opposed to B0 and B1, demonstrating high levels of both reliability and robustness
Previous state-of-the-art studies show that a wide range of covert channel types exist using timing, protocol fields and ordering. However, it is generally accepted that a defensive metering system will be designed to have lower capacity to prevent potential misuse of the system. These results demonstrate that a significant design tradeoff exists between system capacity and level of operational distortion.
A native smart meter-based implementation provides a greater degree of association between the actual physical smart meter and generated tokens. Native implementations require strong lifecycle management and firmware support.
Future work will compare both synthetic and physical/hardware deployment options and will integrate with artificial intelligence for automation [41,42,43]. Additionally, future work will attempt to isolate the different types of latency (gateway-processing time, network-latency and token-verifier processing time) so that a more accurate measure of how much extra computational expense P1 incurred compared to B0 and B1 will be available.
Supplementary Materials
The following supporting information can be downloaded at the website of this paper posted on Preprints.org.
Author Contributions
Conceptualization, M.C.N.; methodology, M.C.N.; software, M.C.N.; validation, M.C.N., A.A. and E.E.; formal analysis, M.C.N., A.A. and E.E.; investigation, M.C.N.; resources, A.A. and E.E.; data curation, A.A. and E.E.; writing—original draft preparation, M.C.N.; writing—review and editing, A.A. and E.E.; visualization, M.C.N.; supervision, A.A. and E.E.; project administration, M.C.N.; funding acquisition, A.A. and E.E. All authors have read and agreed to the published version of the manuscript. All authors have read and agreed to the published version of the manuscript.
Funding
The APC was funded by the University of Johannesburg’s Department of Electrical and Electronic Engineering Technology and the University of South Africa’s Center for Artificial Intelligence and Multidisciplinary Innovations, College of Research and Graduate Studies.
Data Availability Statement
All new data obtained in this work is available and has been submitted as part of Supplementary Materials.
Acknowledgments
During the preparation of this manuscript/study, the author(s) used Docker Desktop, v4.82.0 for the purposes of executing the experiments conducted in this work. M365 Copilot was used to enhance graphics of the model figures (Figure 1, Figure 3 and Figure 4). The authors have reviewed and edited the output and take full responsibility for the content of this publication.
Conflicts of Interest
The authors declare no conflicts of interest.
Abbreviations
The following abbreviations are used in this manuscript:
| MQTT | Message Queuing Telemetry Transport |
| CoAP | Constrained Application Protocol |
| DLMS | Device Language Message Specification |
| LoRaWAN | Long Range Wide Area Network |
| LPWAN | Low Power Wide Area Network |
| TN | True Negative |
| TP | True Positive |
| FN | False Negative |
| FP | False Positive |
Appendix A
Appendix A.1
| Algorithm 1: Proposed Adaptive Steganography Trust Signaling Embedding | |
| Input: M, x_t, s_t, e_t, K_M, policy P, flow state F_t Output: modified flow observations F*_t containing bounded trust fragments | |
|
|
Appendix A.2
| Algorithm 2: Proposed Adaptive Steganography Trust Signaling Extraction and Verification | |
|
Input: observed flow F*_t, M, x_t, s_t, e_t, K_M, policy P Output: decision D in [accept, warn, quarantine, reject] | |
|
|
Appendix A.3
| Algorithm 3: Proposed Policy Driven Adaptation Function |
|
Input: risk score R_t, policy P = {theta_1, theta_2, theta_3, mode_table} Output: tuple (l, w, c, rho, audit)
|
References
- Cabaj, K.; Zorawski, P.; Nowakowski, P.; Purski, M.; Mazurczyk, W. Efficient distributed network covert channels for Internet of Things environments. J. Cybersecur. 2020, 6, tyaa018. [Google Scholar] [CrossRef]
- Smolarczyk, M.; Szczypiorski, K.; Pawluk, J. Multilayer Detection of Network Steganography. Electronics 2020, 9, 2128. [Google Scholar] [CrossRef]
- Djebbar, F. Securing IoT Data Using Steganography: A Practical Implementation Approach. Electronics 2021, 10, 2707. [Google Scholar] [CrossRef]
- Driss, M.; Berriche, L.; Atitallah, S.B.; Rekik, S. Steganography in IoT: A Comprehensive Survey on Approaches, Challenges, and Future Directions. IEEE Access 2025, 13, 74844–74875. [Google Scholar] [CrossRef]
- Duan, C. A deep learning based covert communication method in Internet of Things. Telecommun. Syst. 2025, 88, 41. [Google Scholar] [CrossRef]
- Biswas, S.; Goswami, R.S.; Reddy, K.H.K. Advancing quantum steganography: A secure IoT communication with reversible decoding and customized encryption technique for smart cities. Clust. Comput. 2024, 27, 9395–9414. [Google Scholar] [CrossRef]
- Tightiz, L.; Yang, H. A Comprehensive Review on IoT Protocols Features in Smart Grid Communication. Energies 2020, 13, 2762. [Google Scholar] [CrossRef]
- Almuhaya, M.A.M.; Jabbar, W.A.; Sulaiman, N.; Abdulmalek, S. A Survey on LoRaWAN Technology: Recent Trends, Opportunities, Simulation Tools and Future Directions. Electronics 2022, 11, 164. [Google Scholar] [CrossRef]
- Kirmani, S.; Mazid, A.; Khan, I.A.; Abid, M. A Survey on IoT-Enabled Smart Grids: Technologies, Architectures, Applications, and Challenges. Sustainability 2023, 15, 717. [Google Scholar] [CrossRef]
- Nambundo, J.M.; Gomes, O.S.M.; Souza, A.D.; Machado, R.C.S. Cybersecurity and Major Cyber Threats of Smart Meters: A Systematic Mapping Review. Energies 2025, 18, 1445. [Google Scholar] [CrossRef]
- Al Hanif, A.; Ilyas, M. Effective Feature Engineering Framework for Securing MQTT Protocol in IoT Environments. Sensors 2024, 24, 1782. [Google Scholar] [CrossRef] [PubMed]
- D’Ortona, C.; Tarchi, D.; Raffaelli, C. Open-Source MQTT-Based End-to-End IoT System for Smart City Scenarios. Future Internet 2022, 14, 57. [Google Scholar] [CrossRef]
- Trigka, M.; Dritsas, E. Edge and Cloud Computing in Smart Cities. Future Internet 2025, 17, 118. [Google Scholar] [CrossRef]
- Dritsas, E.; Trigka, M. A Survey on Cybersecurity in IoT. Future Internet 2025, 17, 30. [Google Scholar] [CrossRef]
- IEEE. IoT Security Challenges in Modern Smart Cities. IEEE Xplore. 2024. Available online: https://ieeexplore.ieee.org/document/10533174 (accessed on 12 July 2026).
- Ishak, K.K.; Razali, N.A.M.; Malizan, N.A.; Sulong, G.; Md Johar, M.G. Smart Cities Cybersecurity and IoT: Challenges and Future Research Directions. IAENG Int. J. Comput. Sci. 2024, 51, 725–737. [Google Scholar]
- Goudarzi, A.; Ghayoor, F.; Waseem, M.; Fahad, S.; Traore, I. A Survey on IoT-Enabled Smart Grids: Emerging Applications, Challenges, and Outlook. Energies 2022, 15, 6984. [Google Scholar] [CrossRef]
- Khan, L.U.; Yaqoob, I.; Tran, N.H.; Kazmi, S.M.A.; Dang, T.N.; Hong, C.S. Edge-Computing-Enabled Smart Cities: A Comprehensive Survey. IEEE Internet Things J. 2020, 7, 10200–10232. [Google Scholar] [CrossRef]
- OASIS. MQTT Version 5.0; OASIS Standard: Burlington, MA, USA, 2019; Available online: https://www.oasis-open.org/standard/mqtt-v5-0-os/ (accessed on 12 July 2026).
- Shelby, Z.; Hartke, K.; Bormann, C. The Constrained Application Protocol (CoAP); RFC 7252; Internet Engineering Task Force (IETF): Fremont, CA, USA, 2014. [Google Scholar]
- DLMS User Association. DLMS/COSEM Core Specifications: International Standard for Data Exchange; DLMS UA: Cham, Switzerland; Available online: https://www.dlms.com/core-specifications/ (accessed on 12 July 2026).
- IEC. IEC 62056-8-12:2023; Electricity Metering Data Exchange—The DLMS/COSEM Suite—Part 8-12: Communication Profile for LPWANs. International Electrotechnical Commission: Geneva, Switzerland, 2023.
- Stouffer, K.; Pease, M.; Tang, C.Y.; Zimmerman, T.; Pillitteri, V.; Lightman, S.; Hahn, A.; Saravia, S.; Sherule, A.; Thompson, M. Guide to Operational Technology (OT) Security; NIST Special Publication 800-82 Rev. 3; National Institute of Standards and Technology: Gaithersburg, MD, USA, 2023. [Google Scholar] [CrossRef]
- IEEE. IEEE Std 2030.5-2023; IEEE Standard for Smart Energy Profile Application Protocol. IEEE: New York, NY, USA, 2023.
- IEEE Standards Association. IEEE Std 2030.5-2018; IEEE Standard for Smart Energy Profile Application Protocol. IEEE SA: Piscataway, NJ, USA, 2018.
- Hindy, H.; Tachtatzis, C.; Atkinson, R.; Bayne, E.; Bellekens, X. MQTT-IoT-IDS2020: MQTT Internet of Things Intrusion Detection Dataset. IEEE DataPort 2020. [Google Scholar] [CrossRef]
- Hindy, H.; Bayne, E.; Bures, M.; Atkinson, R.; Tachtatzis, C.; Bellekens, X. Machine learning based IoT intrusion detection system: An MQTT case study. Lect. Notes Netw. Syst. 2021, 180, 73–84. [Google Scholar] [CrossRef]
- Khaleefah, R.; Abed, A.; Al-Shareeda, M. Empirical Evaluation of MQTT, CoAP and HTTP for Smart City IoT Applications. Int. J. Mechatron. Robot. Artif. Intell. 2025, 1, 74–81. [Google Scholar] [CrossRef]
- IEEE. A Survey of Network Covert Channel: Construction and Detection. IEEE Xplore. 2025. Available online: https://ieeexplore.ieee.org/document/11006820 (accessed on 12 July 2026).
- Wendzel, S.; Kraetzer, C.; Dittmann, J.; Caviglione, L.; Mileva, A.; Schmidbauer, T.; Vielhauer, C.; Zander, S. Combining Different Existing Methods for Describing Steganography Hiding Methods. arXiv 2025, arXiv:2506.01700. [Google Scholar]
- Zillien, S.; Petrov, D.; Ruffing, P.; Gross, F. A Development Framework for TCP/IP Network Steganography Malware Detection. In Proceedings of the ACM Workshop on Information Hiding and Multimedia Security (IH&MMSec 2024); ACM: New York, NY, USA, 2024; pp. 95–100. [Google Scholar] [CrossRef]
- Zhang, X.-G.; Yang, G.-H.; Ren, X.-X. Network steganography based security framework for cyber-physical systems. Inf. Sci. 2022, 609, 963–983. [Google Scholar] [CrossRef]
- Neubert, T.; Caballero Morcillo, A.J.; Vielhauer, C. Improving Performance of Machine Learning Based Detection of Network Steganography in Industrial Control Systems. In Proceedings of the 17th International Conference on Availability, Reliability and Security (ARES 2022); ACM: New York, NY, USA, 2022; pp. 1–8. [Google Scholar] [CrossRef]
- Wu, Z.; Guo, J.; Zhang, C.; Li, C. Steganography and steganalysis in voice over IP: A review. Sensors 2021, 21, 1032. [Google Scholar] [CrossRef] [PubMed]
- IETF. RFC 8724: SCHC—Generic Framework for Static Context Header Compression and Fragmentation; Internet Engineering Task Force (IETF): Fremont, CA, USA, 2020. [Google Scholar]
- Republic of South Africa. Protection of Personal Information Act 4 of 2013 (POPIA). Available online: https://www.gov.za/documents/protection-personal-information-act (accessed on 12 July 2026).
- Republic of South Africa. Cybercrimes Act 19 of 2020. Available online: https://www.gov.za/documents/acts/cybercrimes-act-19-2020-english-afrikaans-01-jun-2021 (accessed on 12 July 2026).
- Republic of South Africa. Critical Infrastructure Protection Act 8 of 2019. Available online: https://www.gov.za/documents/acts/critical-infrastructure-protection-act-8-2019-english-isixhosa-28-nov-2019 (accessed on 12 July 2026).
- Eskom Holdings SOC Ltd. Smart Meter Programme. Available online: https://www.eskom.co.za/distribution/smart-meters/ (accessed on 12 July 2026).
- MyBroadband. South Africa’s Big IoT Smart Meter Push. Available online: https://mybroadband.co.za/news/internet-of-things/558576-south-africas-big-iot-smart-meter-push.html (accessed on 12 July 2026).
- Nkuna, M.C.; Esenogho, E.; Ali, A. Using Steganography and Artificial Neural Network for Data Forensic Validation and Counter Image Deepfakes. Computers 2026, 15, 61. [Google Scholar] [CrossRef]
- Ajibade, G.A.; Esenogho, E.; Modisane, C.T. Explainable AI for Anomaly Detection in 5G Networks: Bridging Accuracy and Interpretability. IEEE Access 2026, 14, 122848–122864. [Google Scholar] [CrossRef]
- Nkuna, M.C.; Ali, A.; Esenogho, E. Integrating Image Steganography Techniques into an Existing Efficient Image Recognition Artificial Neural Network for Optimal Performance. In Proceedings of the IEEE PES/IAS Power Africa Conference, Johannesburg, South Africa, 7-11 October 2024; pp. 1–5. [Google Scholar] [CrossRef]
Figure 1.
Smart metering system.
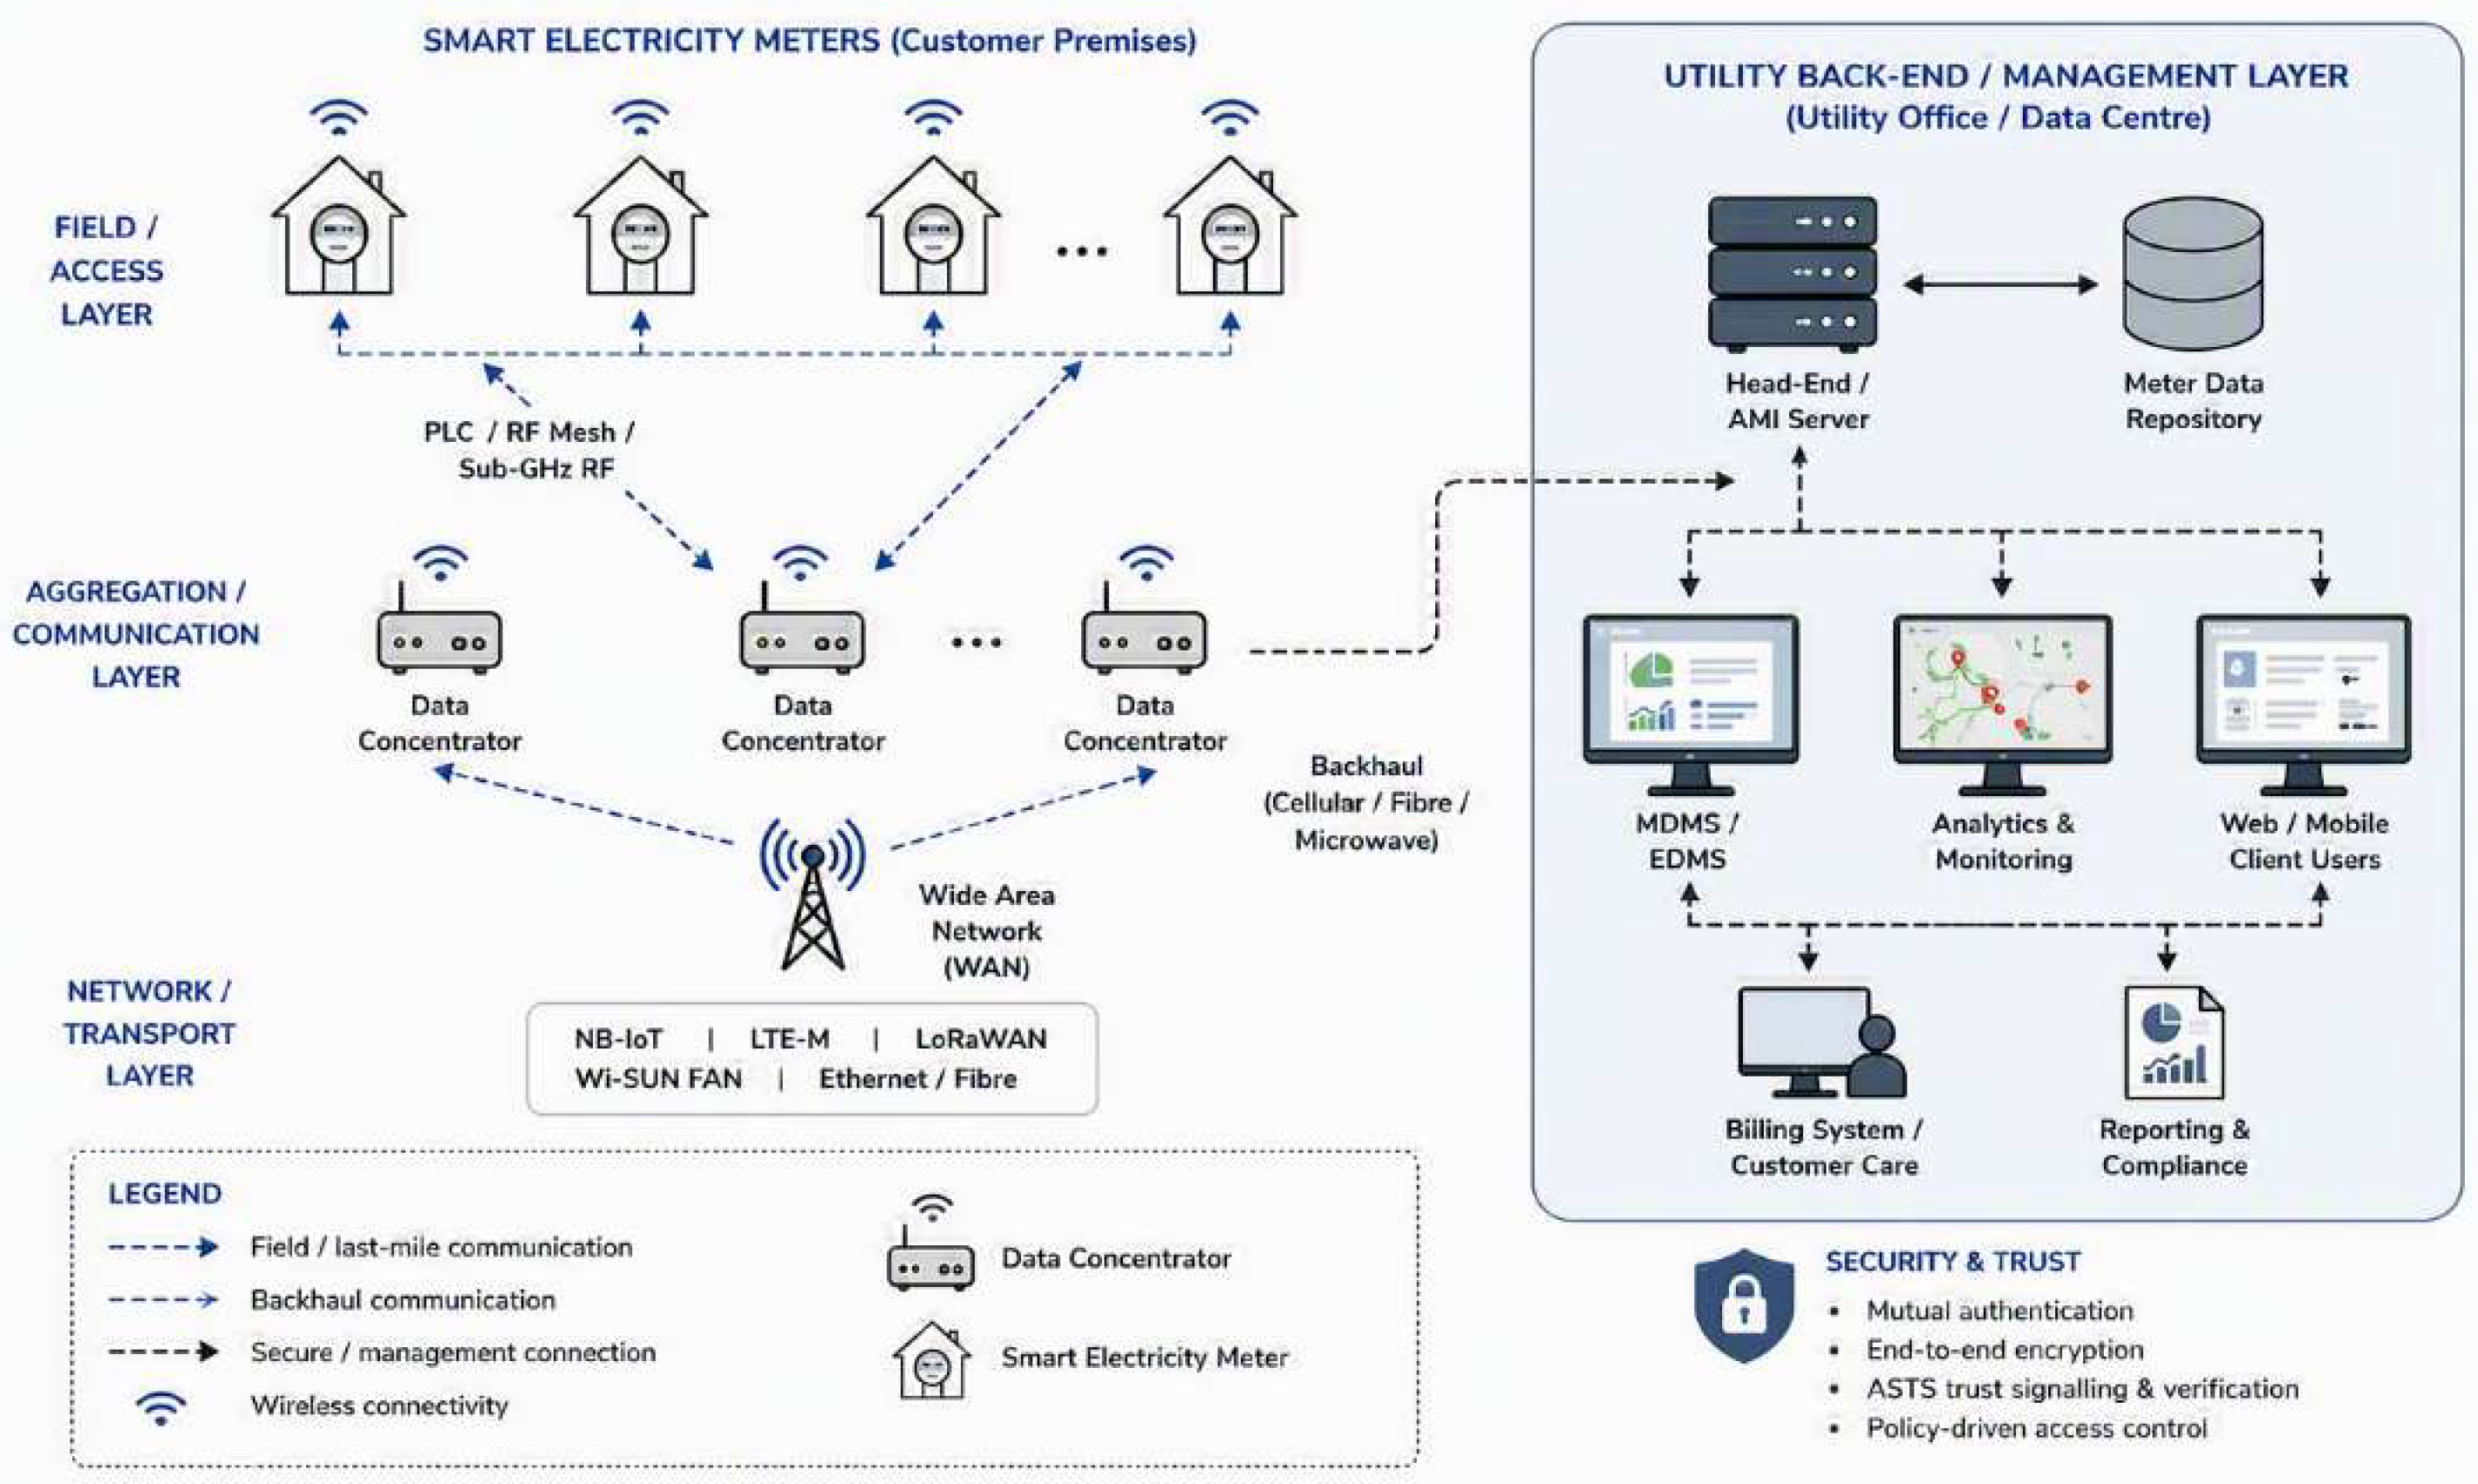
Figure 2.
The proposed ASTS architecture.
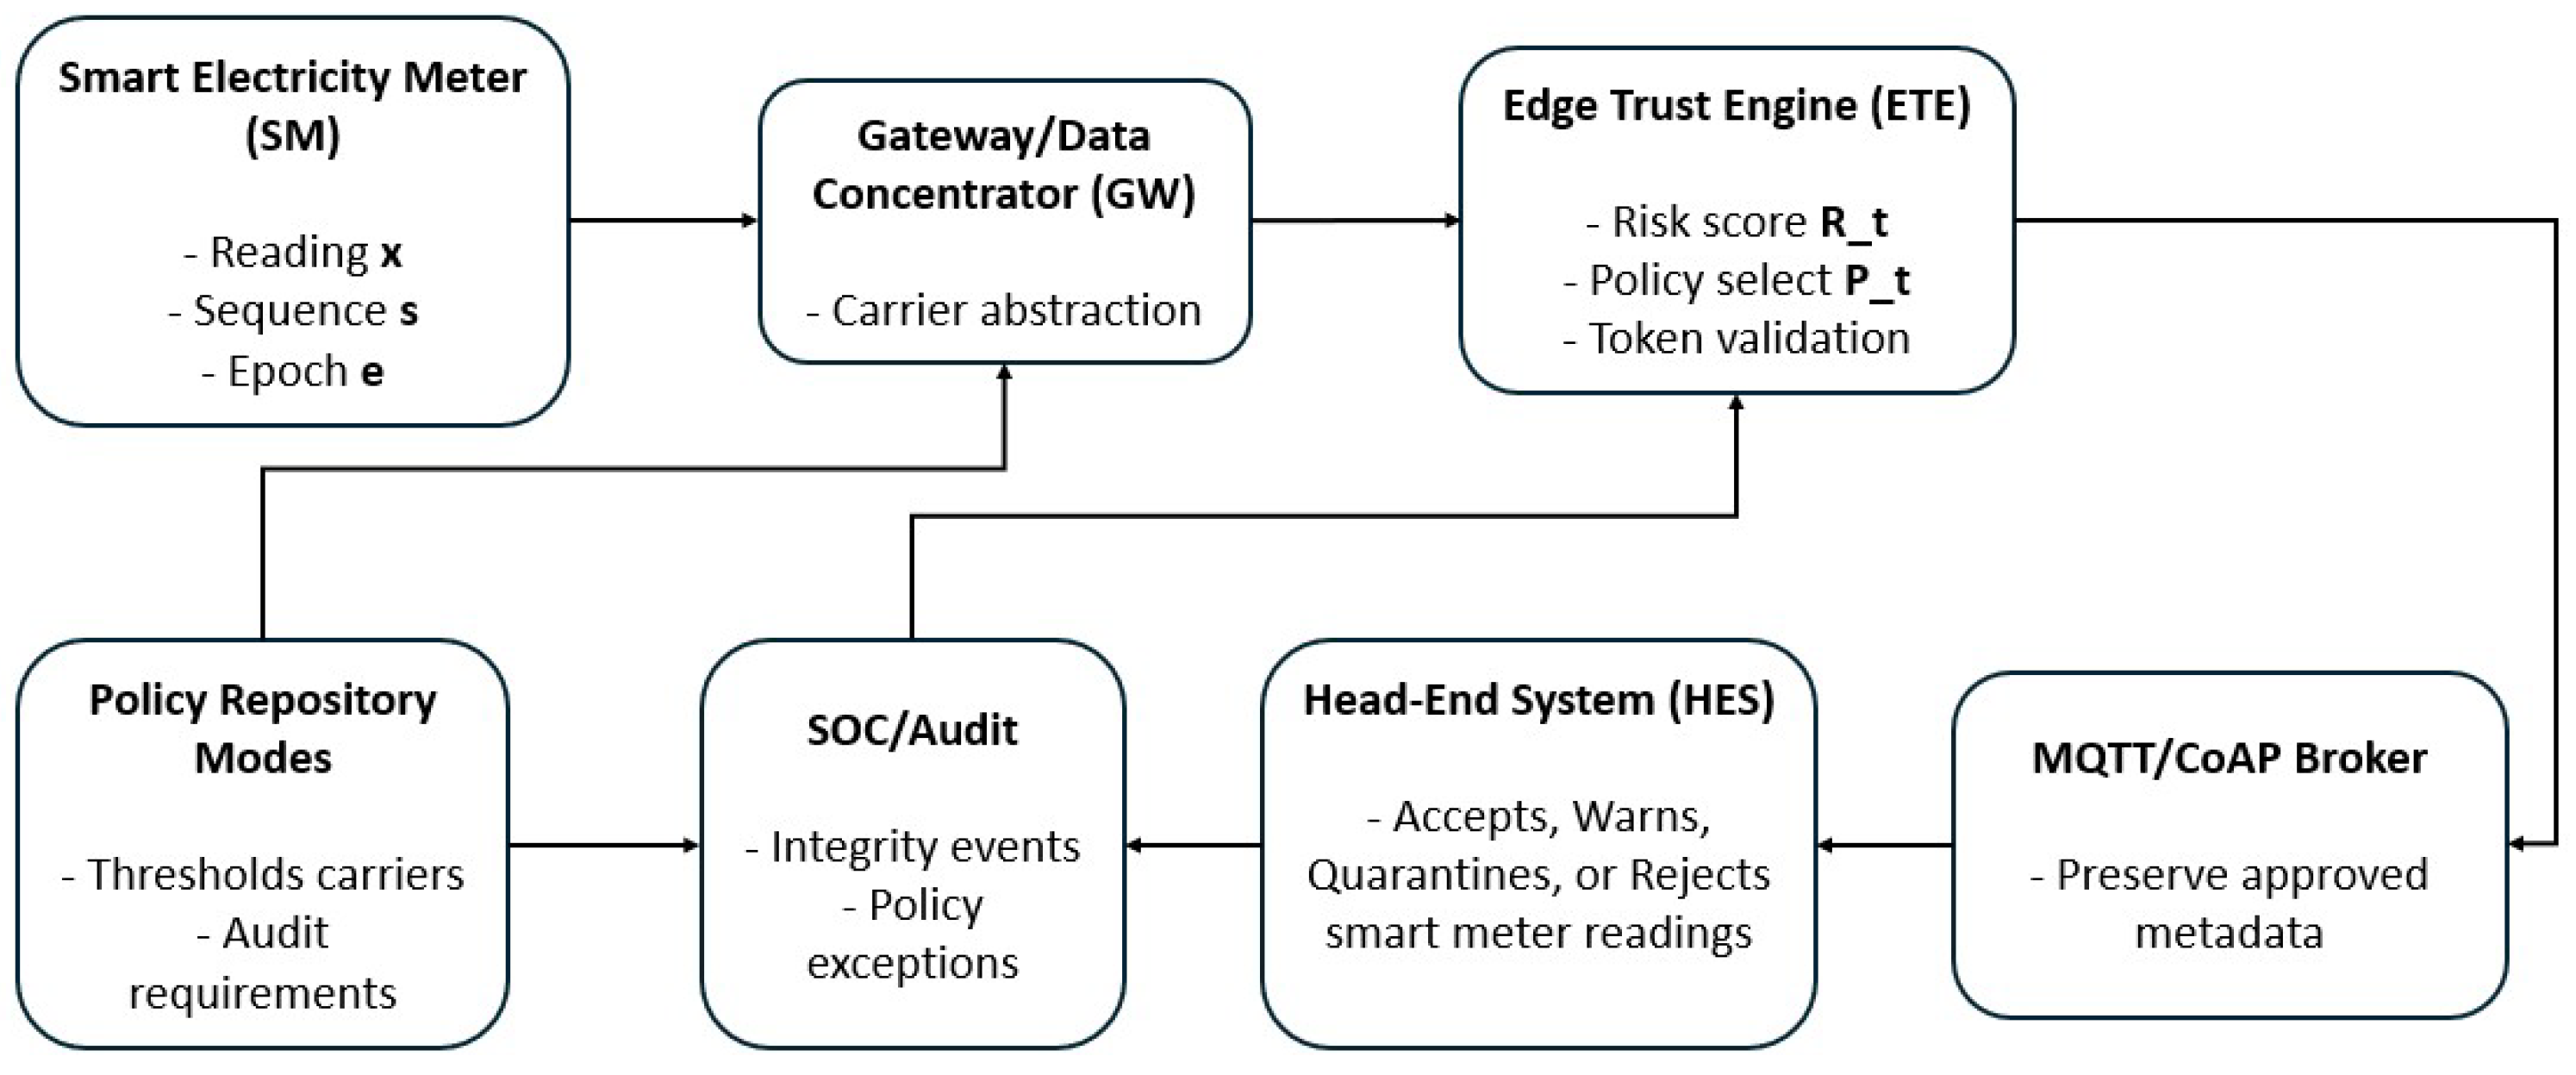
Figure 3.
Flow diagram of the risk model and policy adaptation framework.
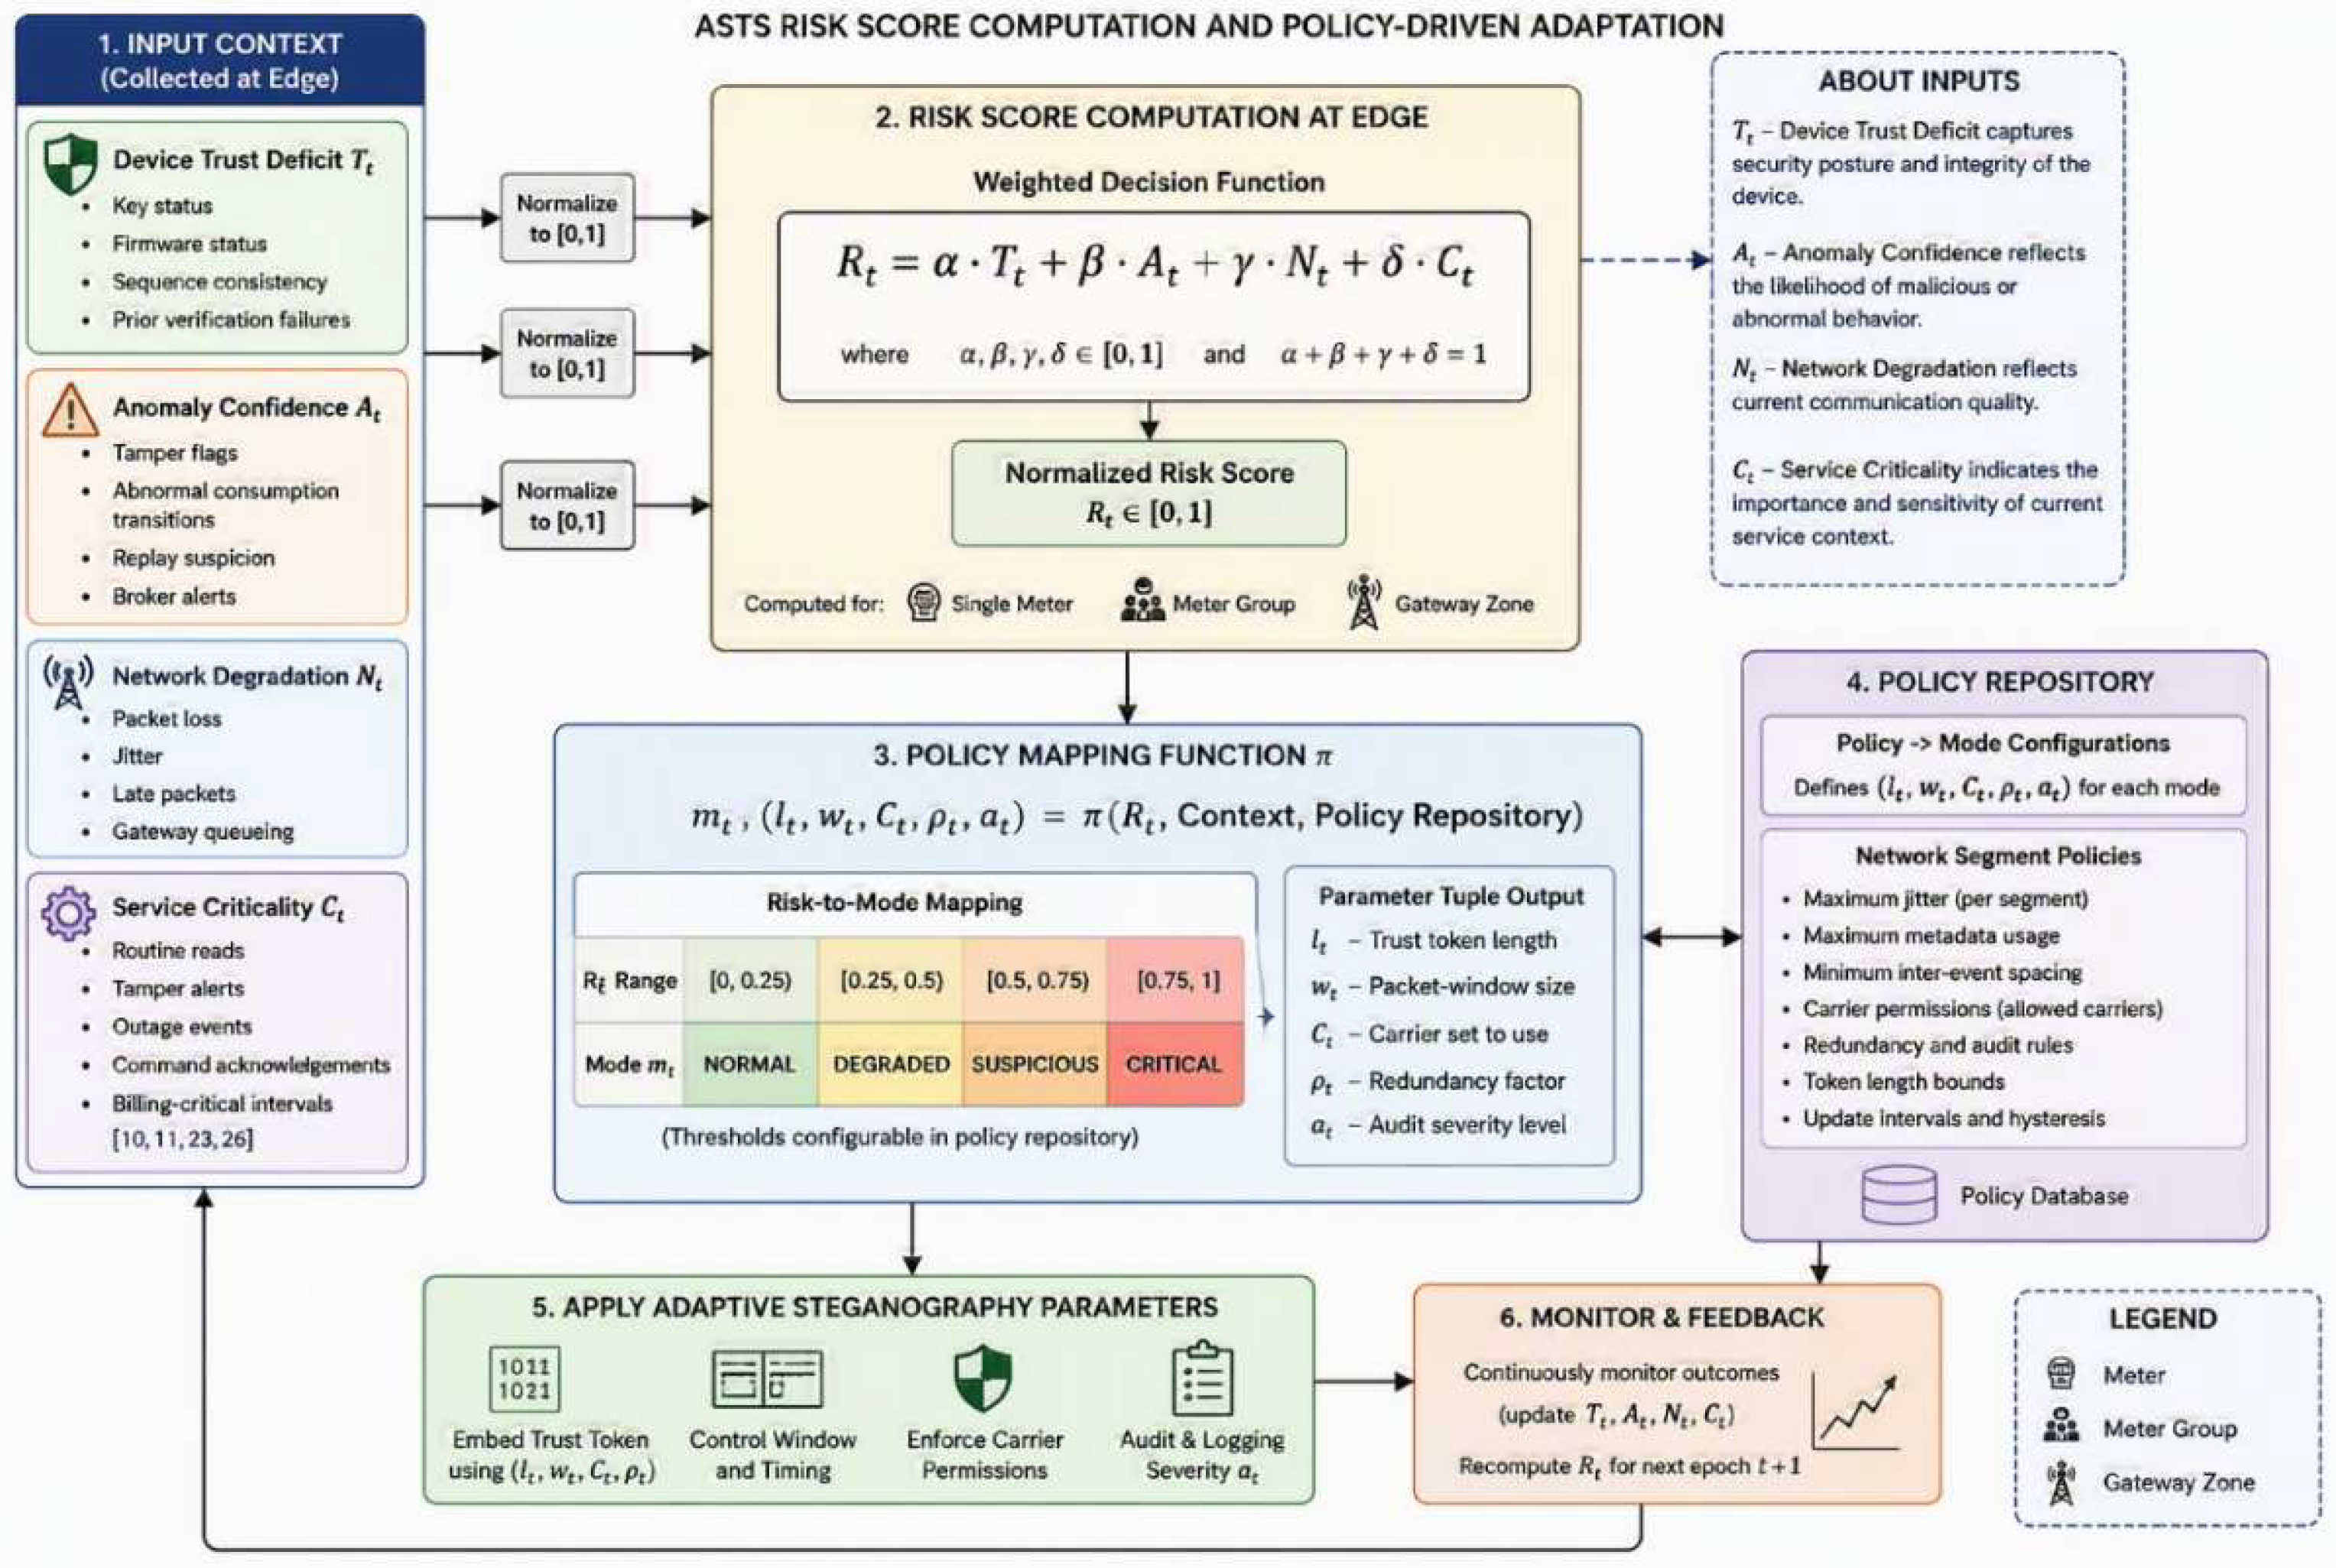
Figure 4.
Protocol-level integration of the proposed ASTS model.
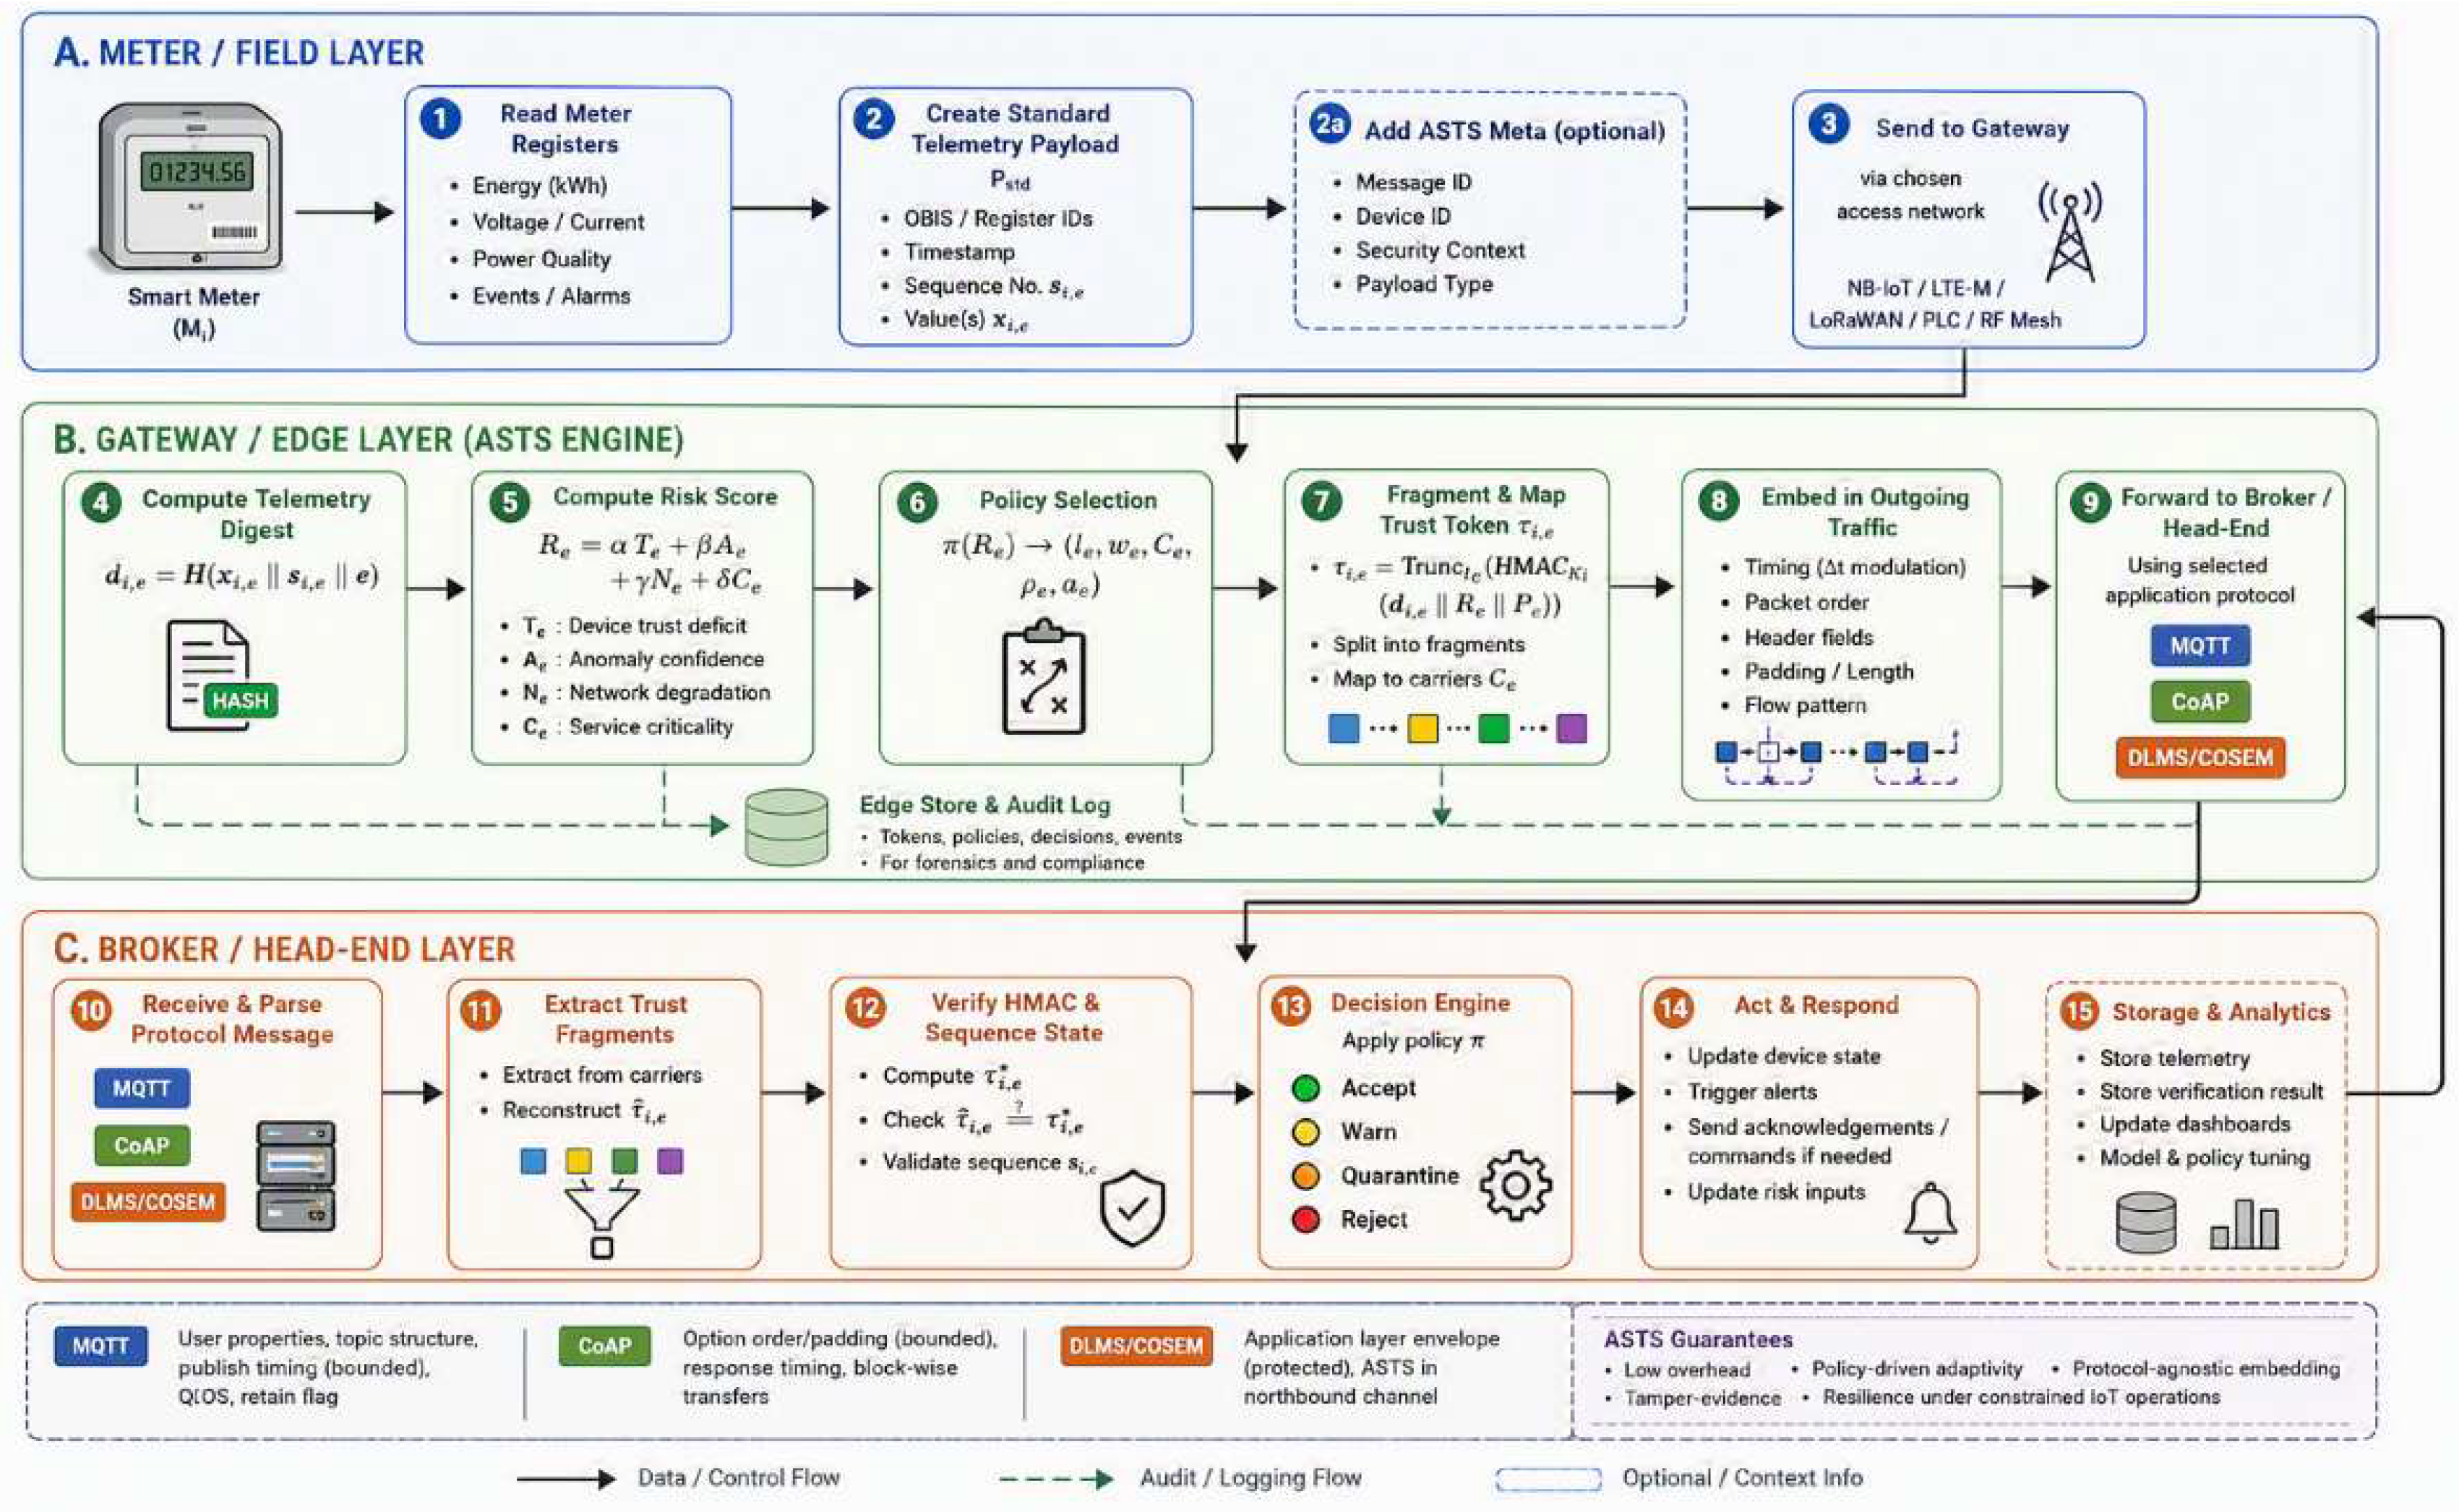
Figure 5.
Experimental setup for the proposed model.
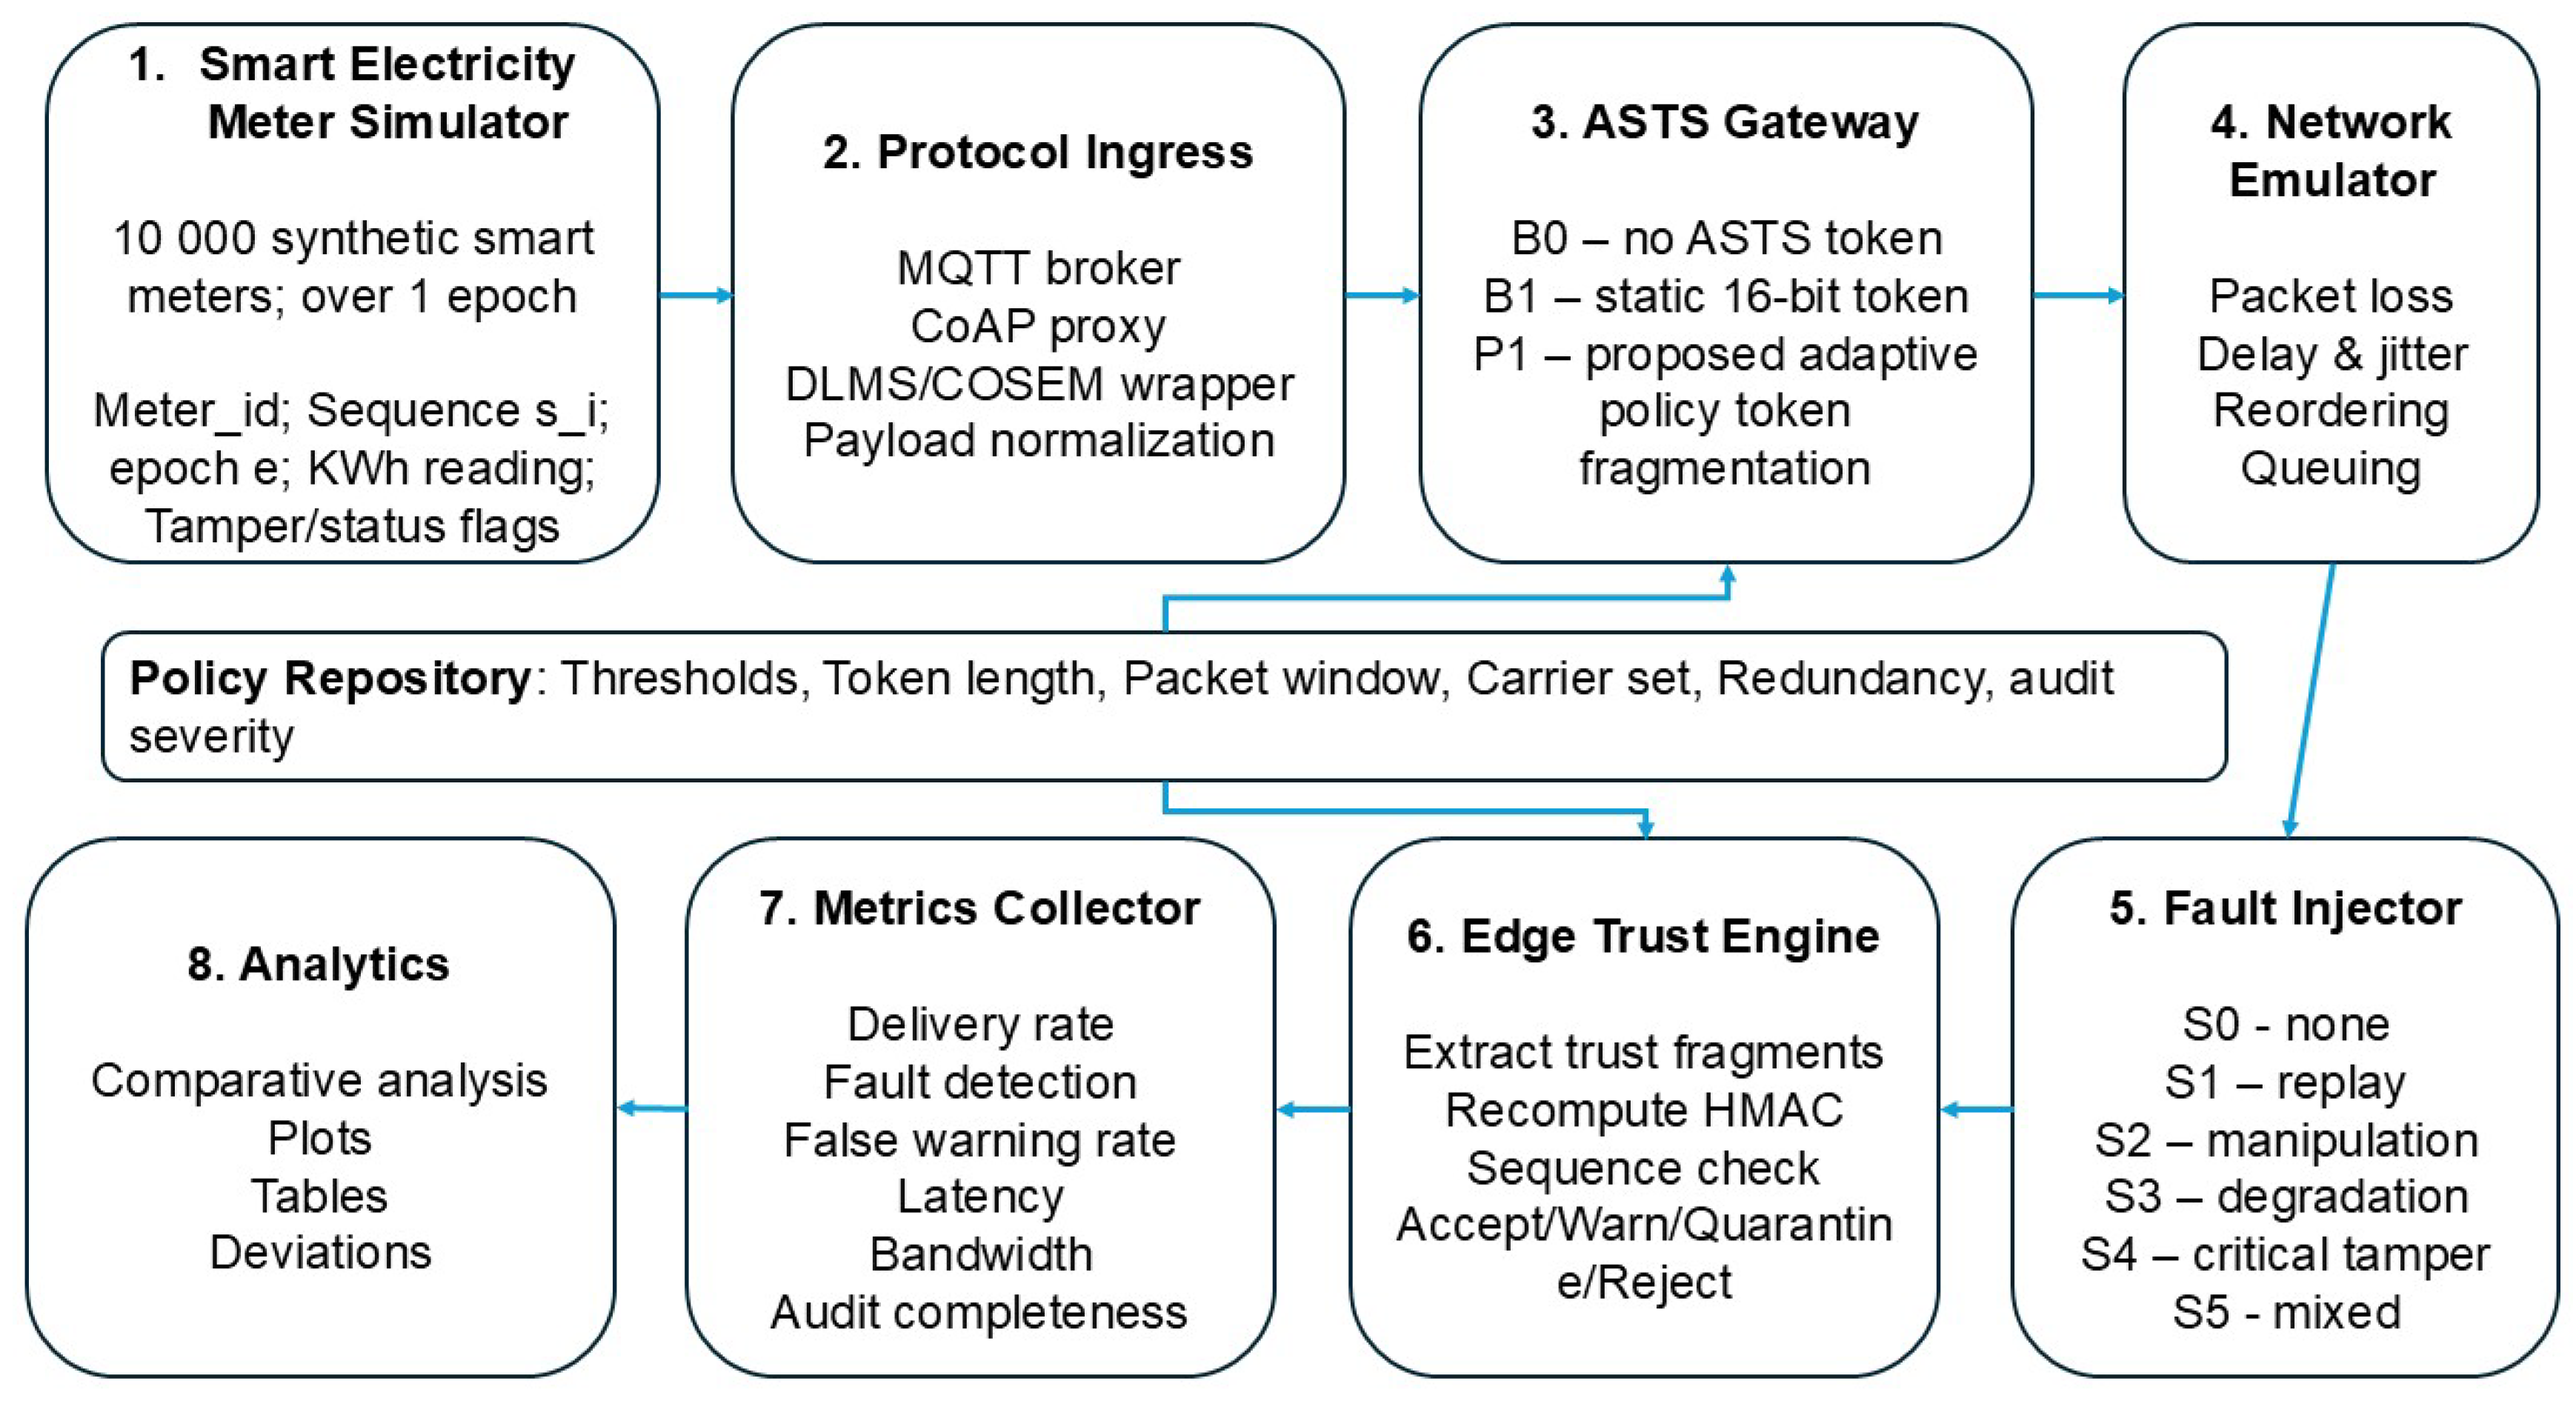
Figure 6.
Per-scenario detection-rate heatmap for B0, B1, and proposed P1 across all investigated scenarios (S0-S5).
Figure 6.
Per-scenario detection-rate heatmap for B0, B1, and proposed P1 across all investigated scenarios (S0-S5).
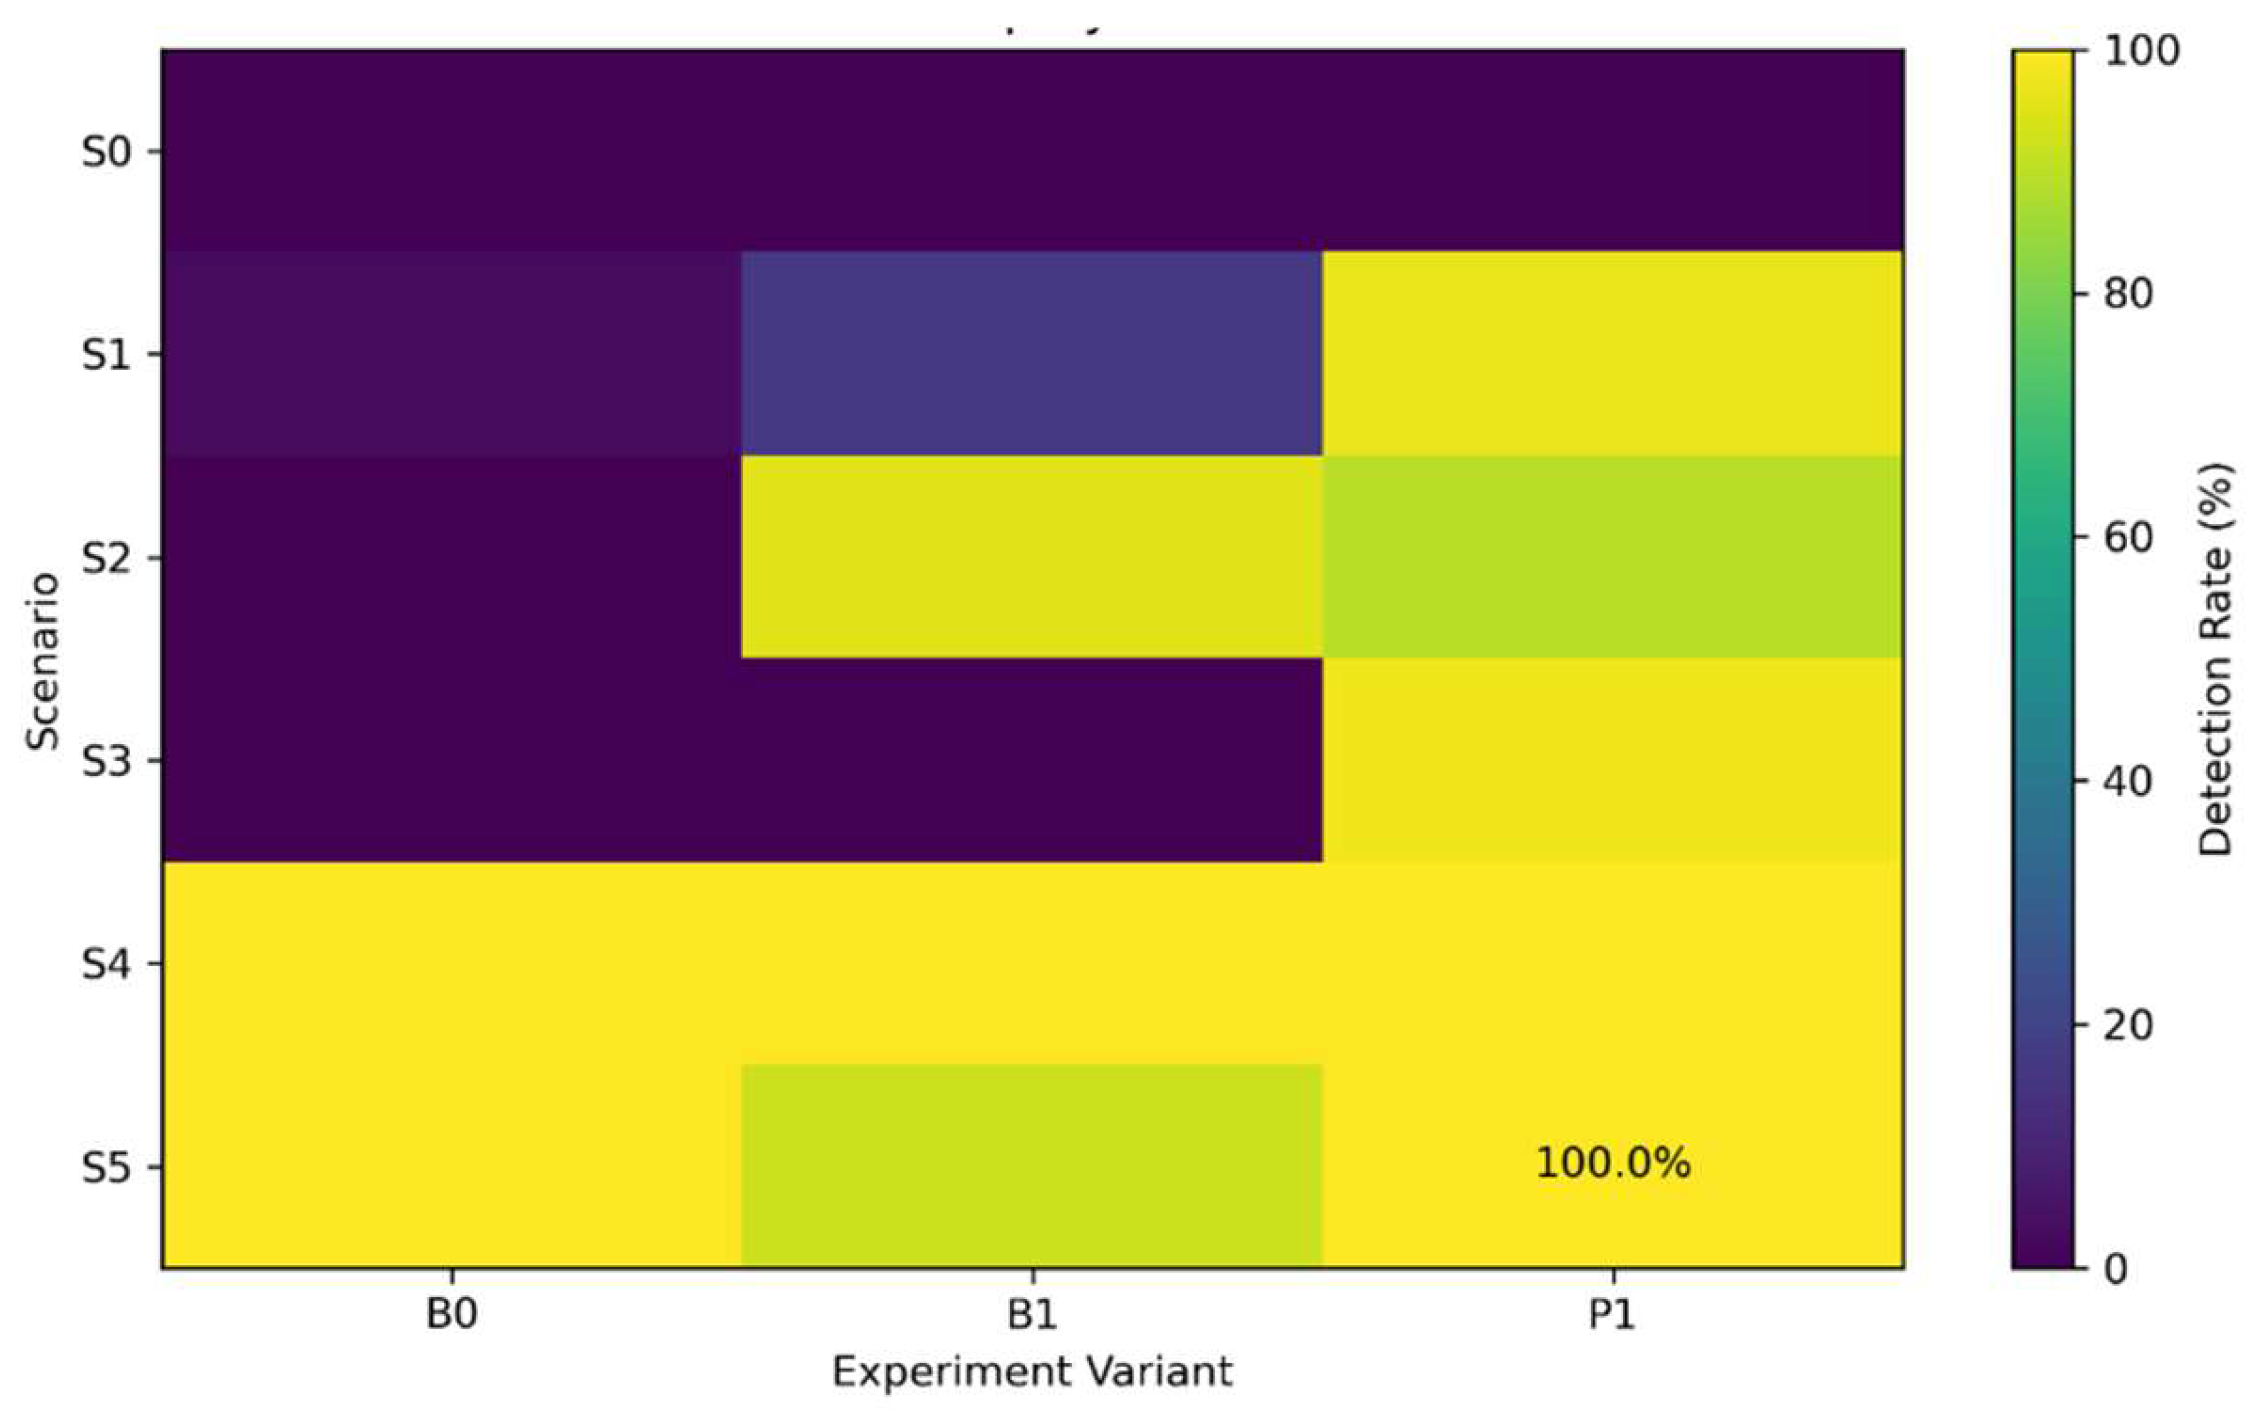
Figure 7.
A Scenario vs. Number of Events distribution bar graph for the P1 scheme.
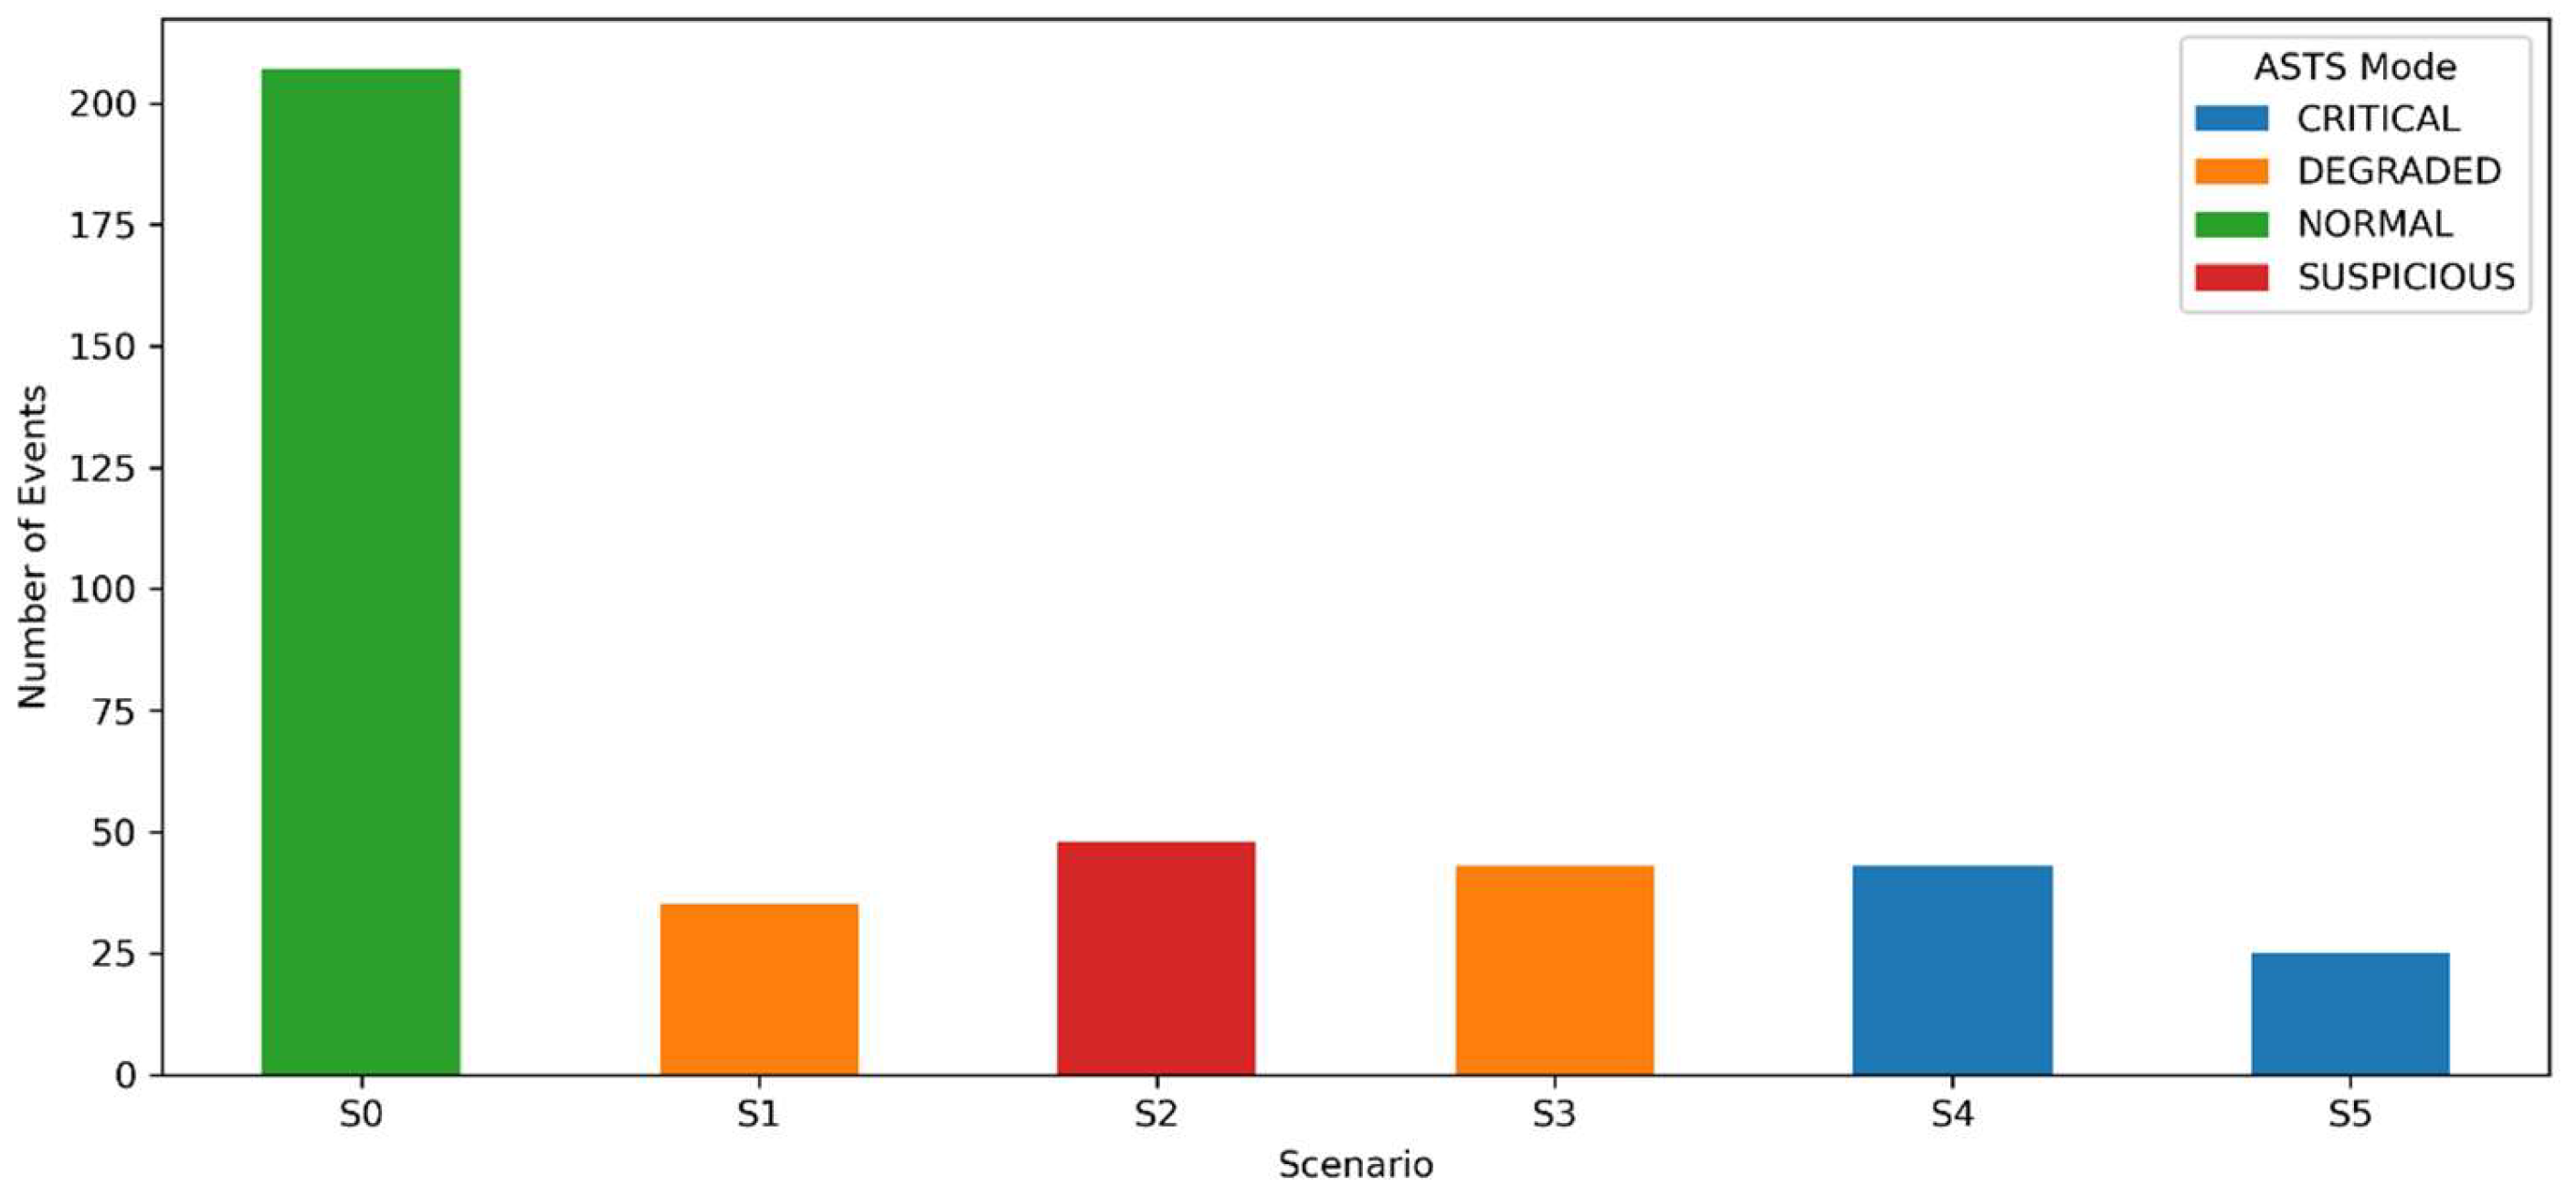
Figure 8.
P1 Mean Risk Score by experimental scenario (S0-S5).
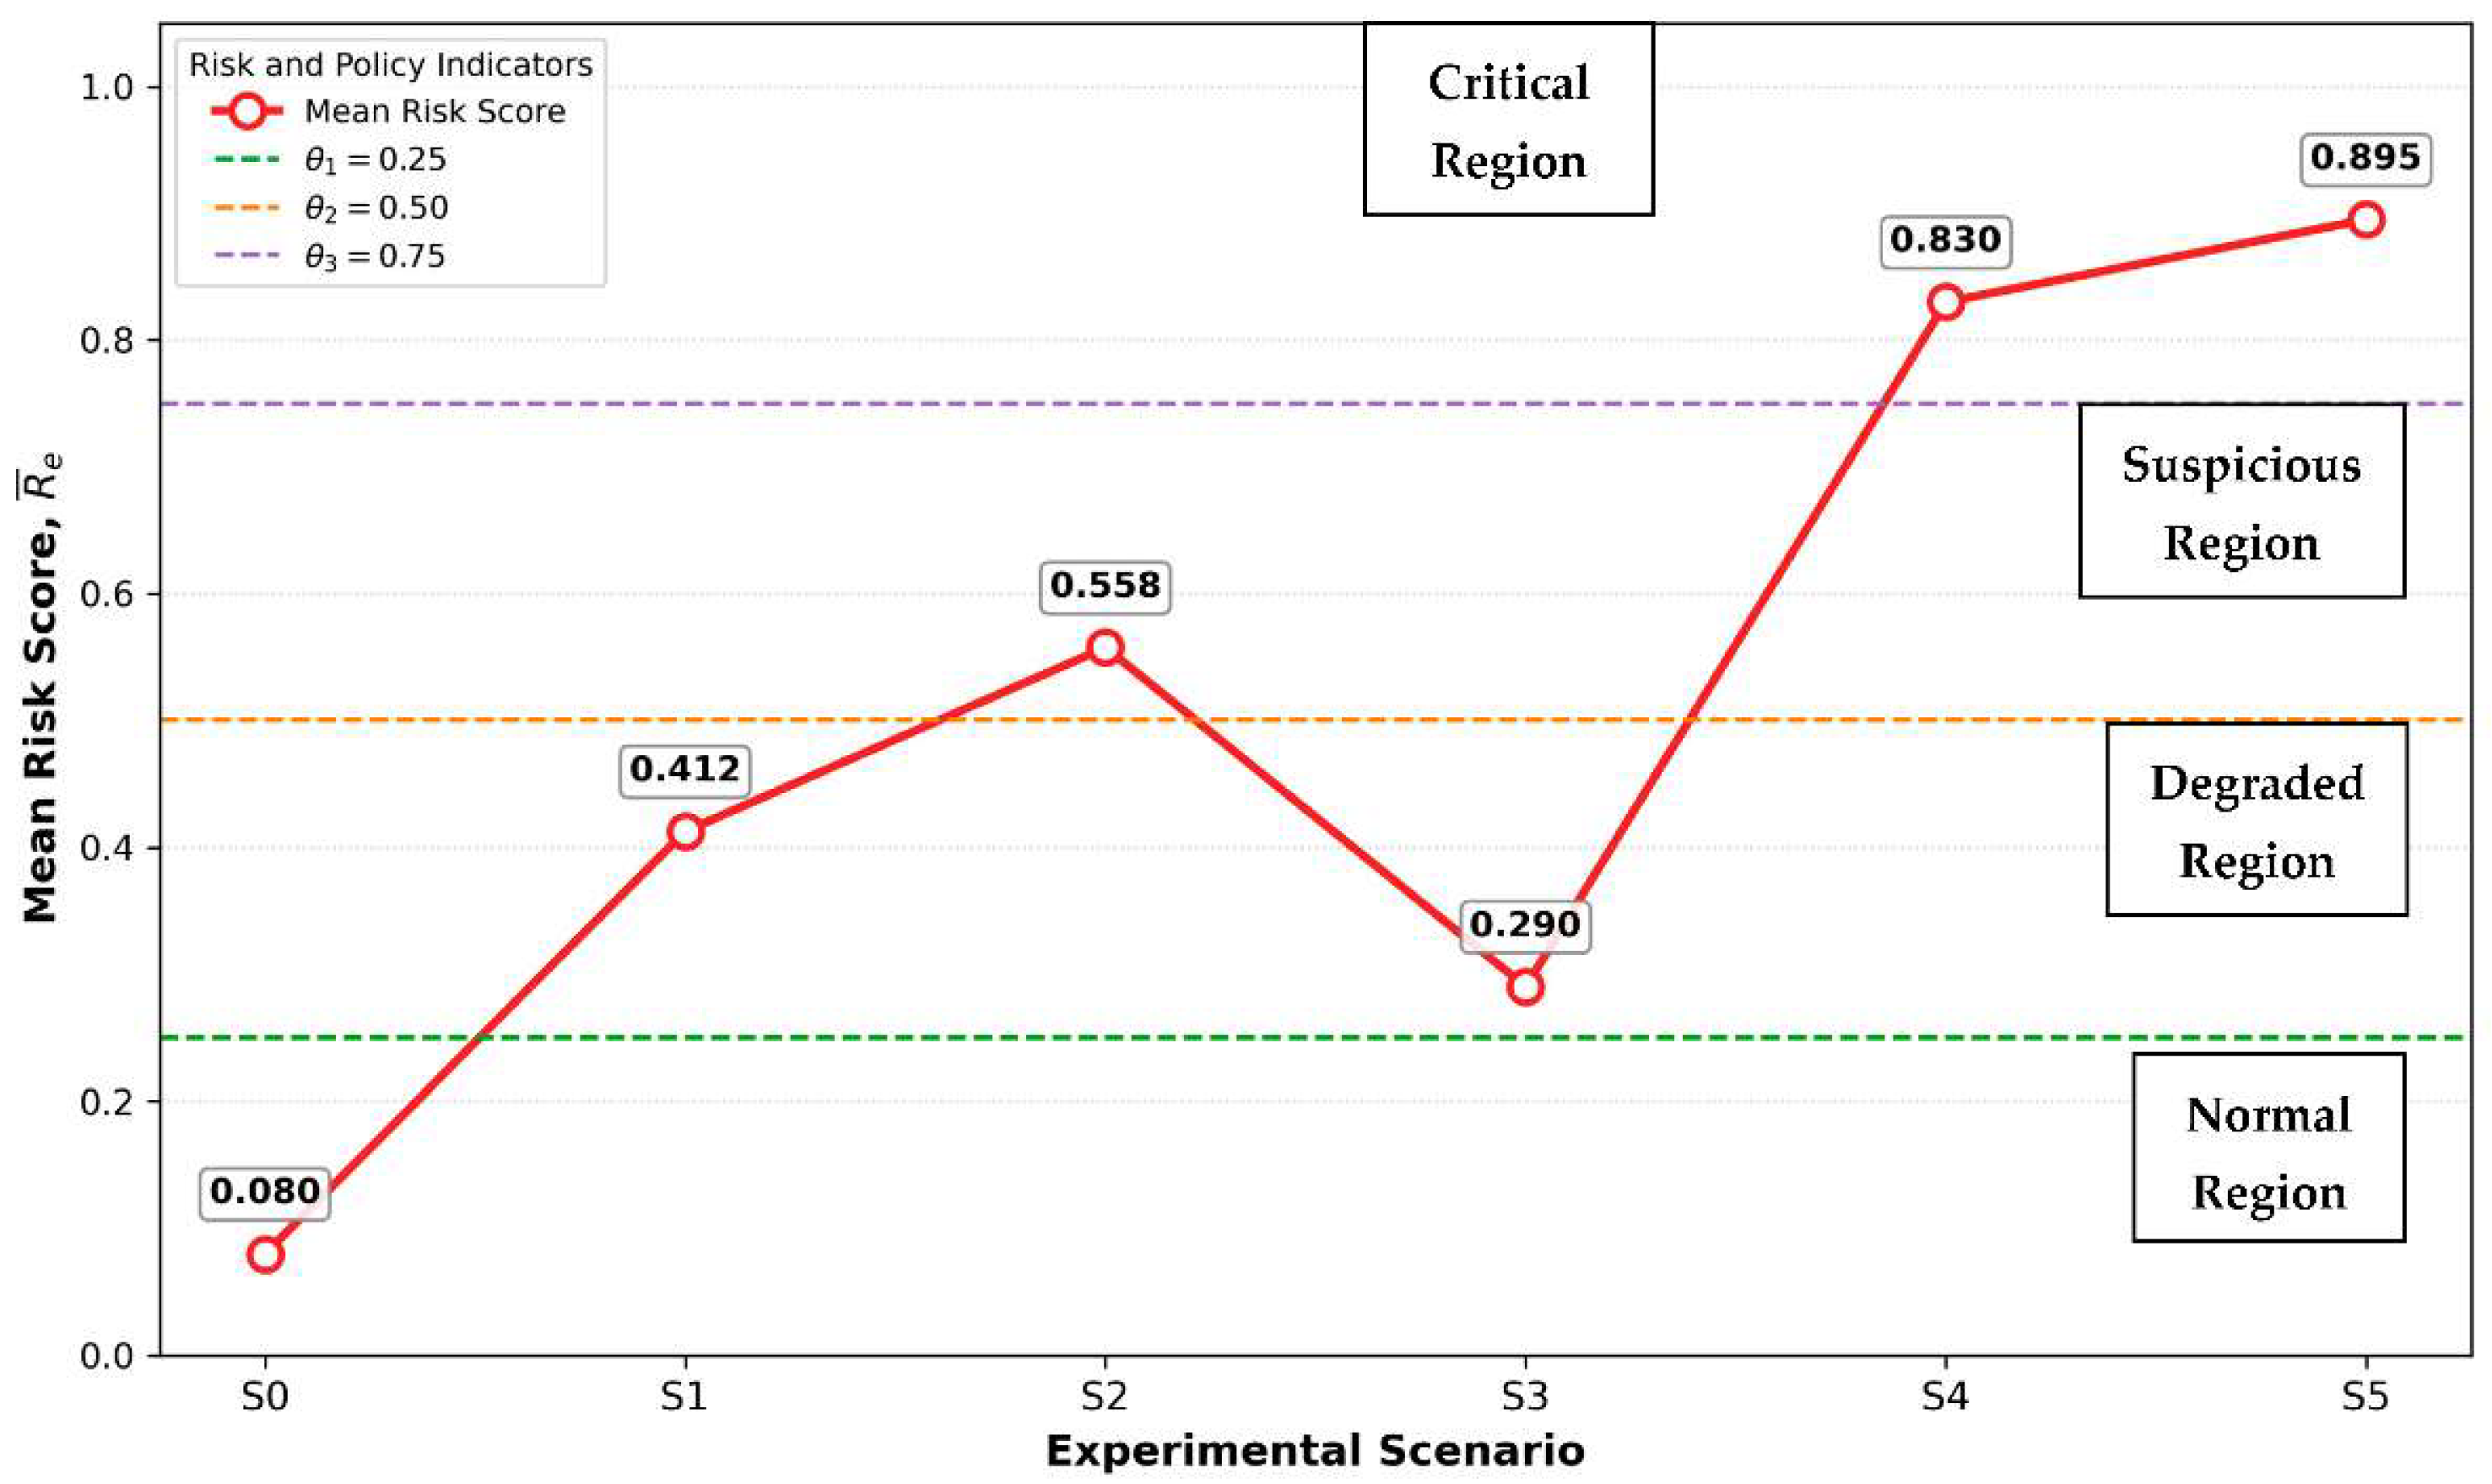
Figure 9.
Average latency for B0, B1, and P1 modes (Jupyter Notebook).
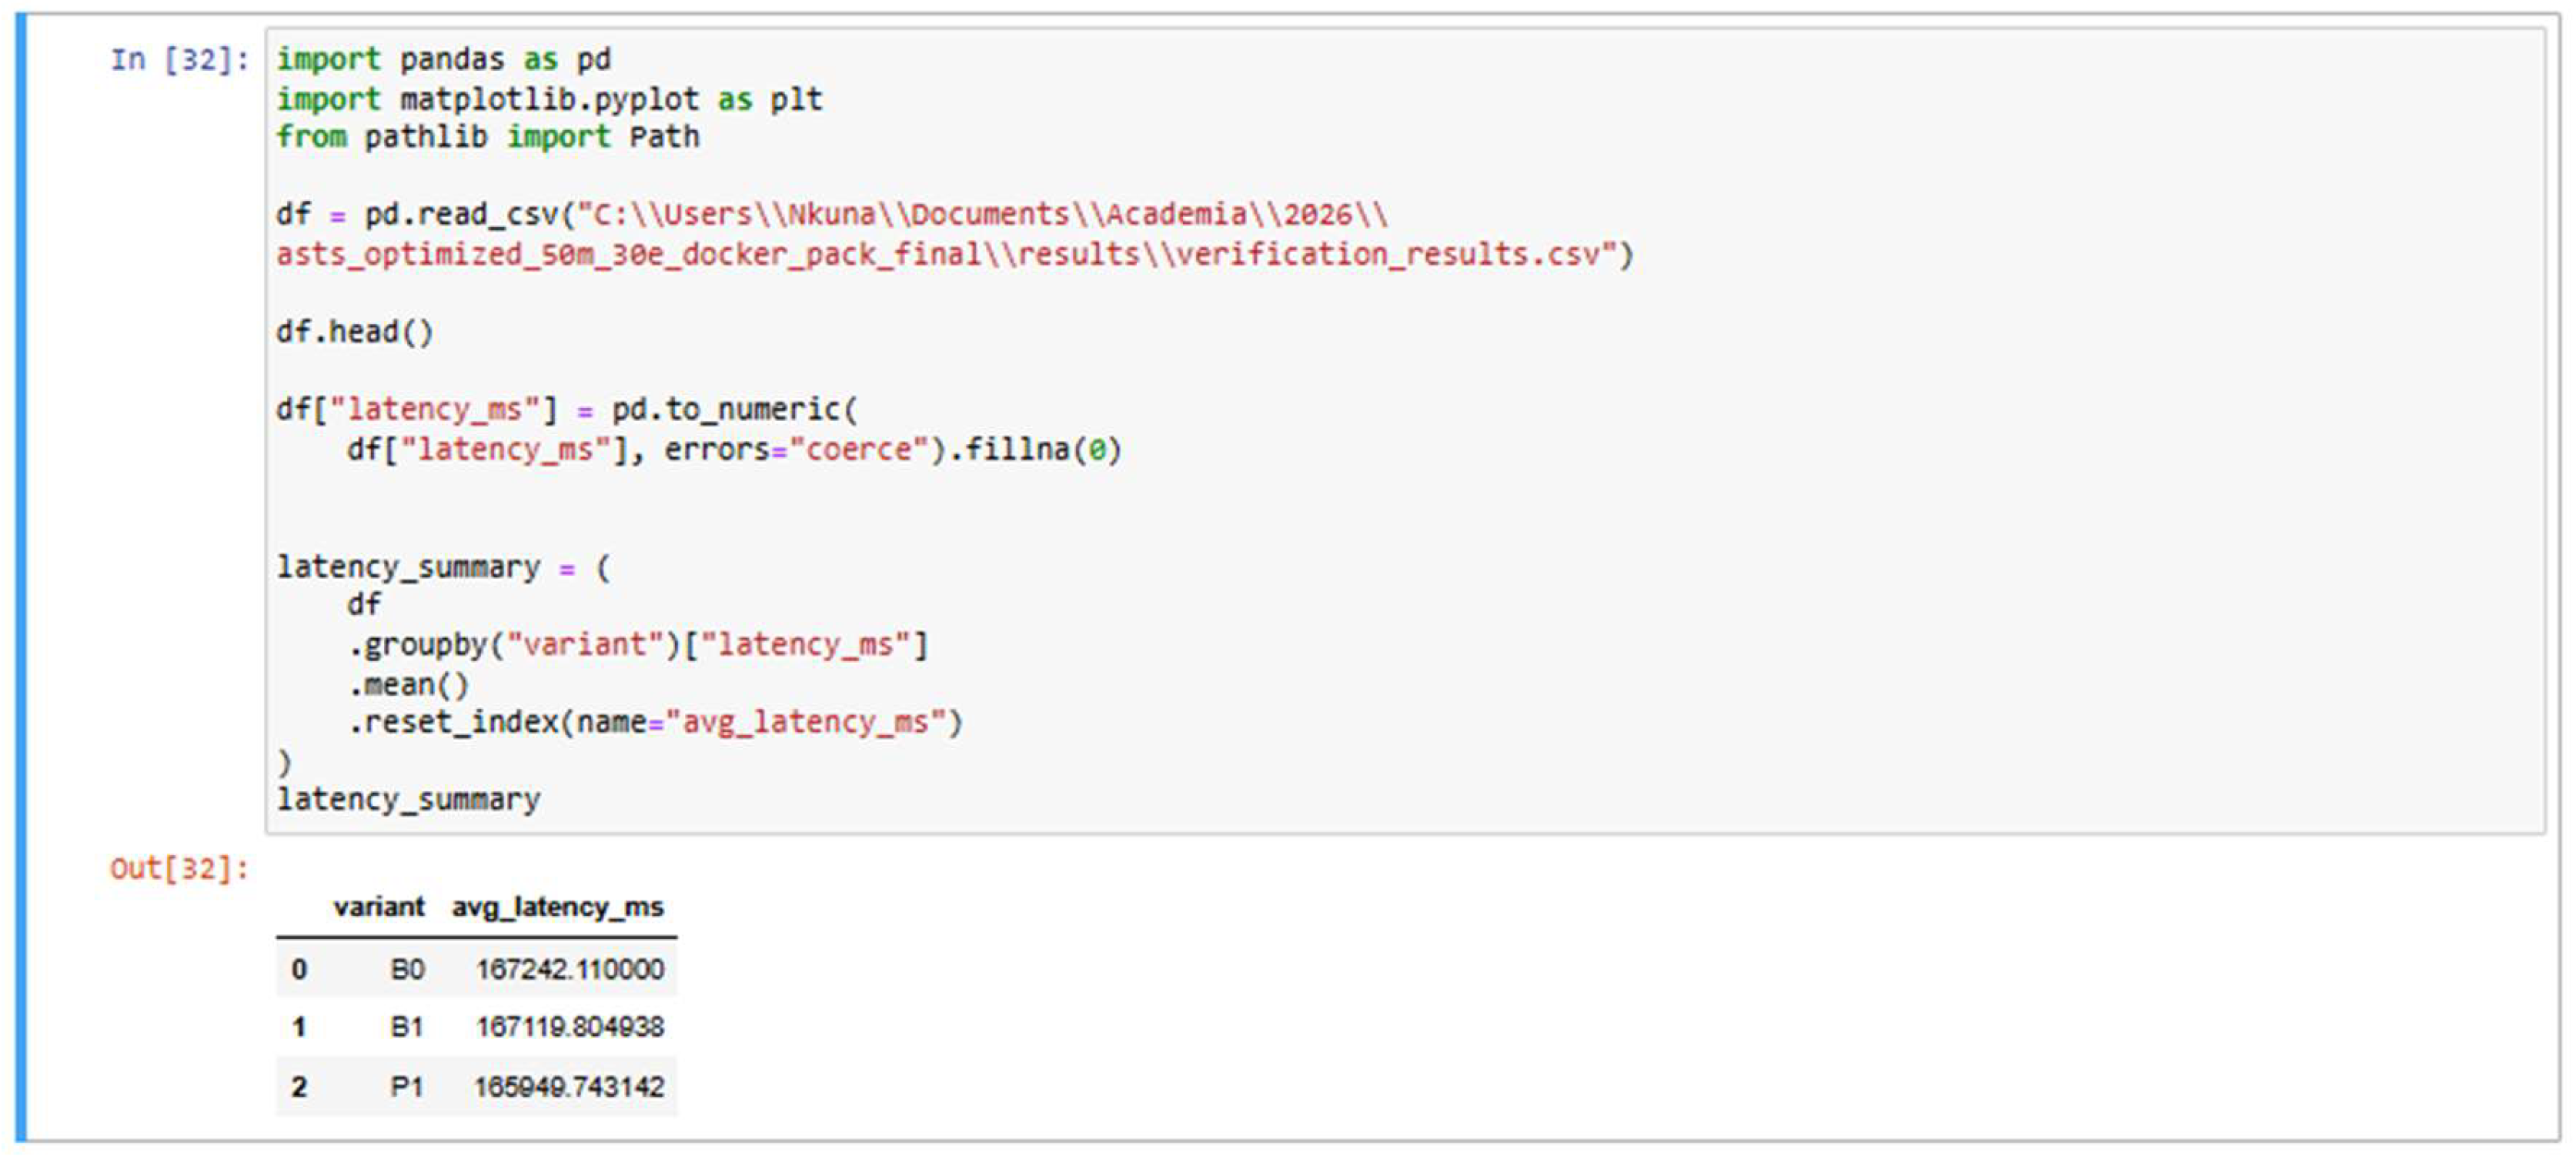
Figure 10.
Attack-detection performance vs. average latency bubble plot for B0, B1, and P1 modes.
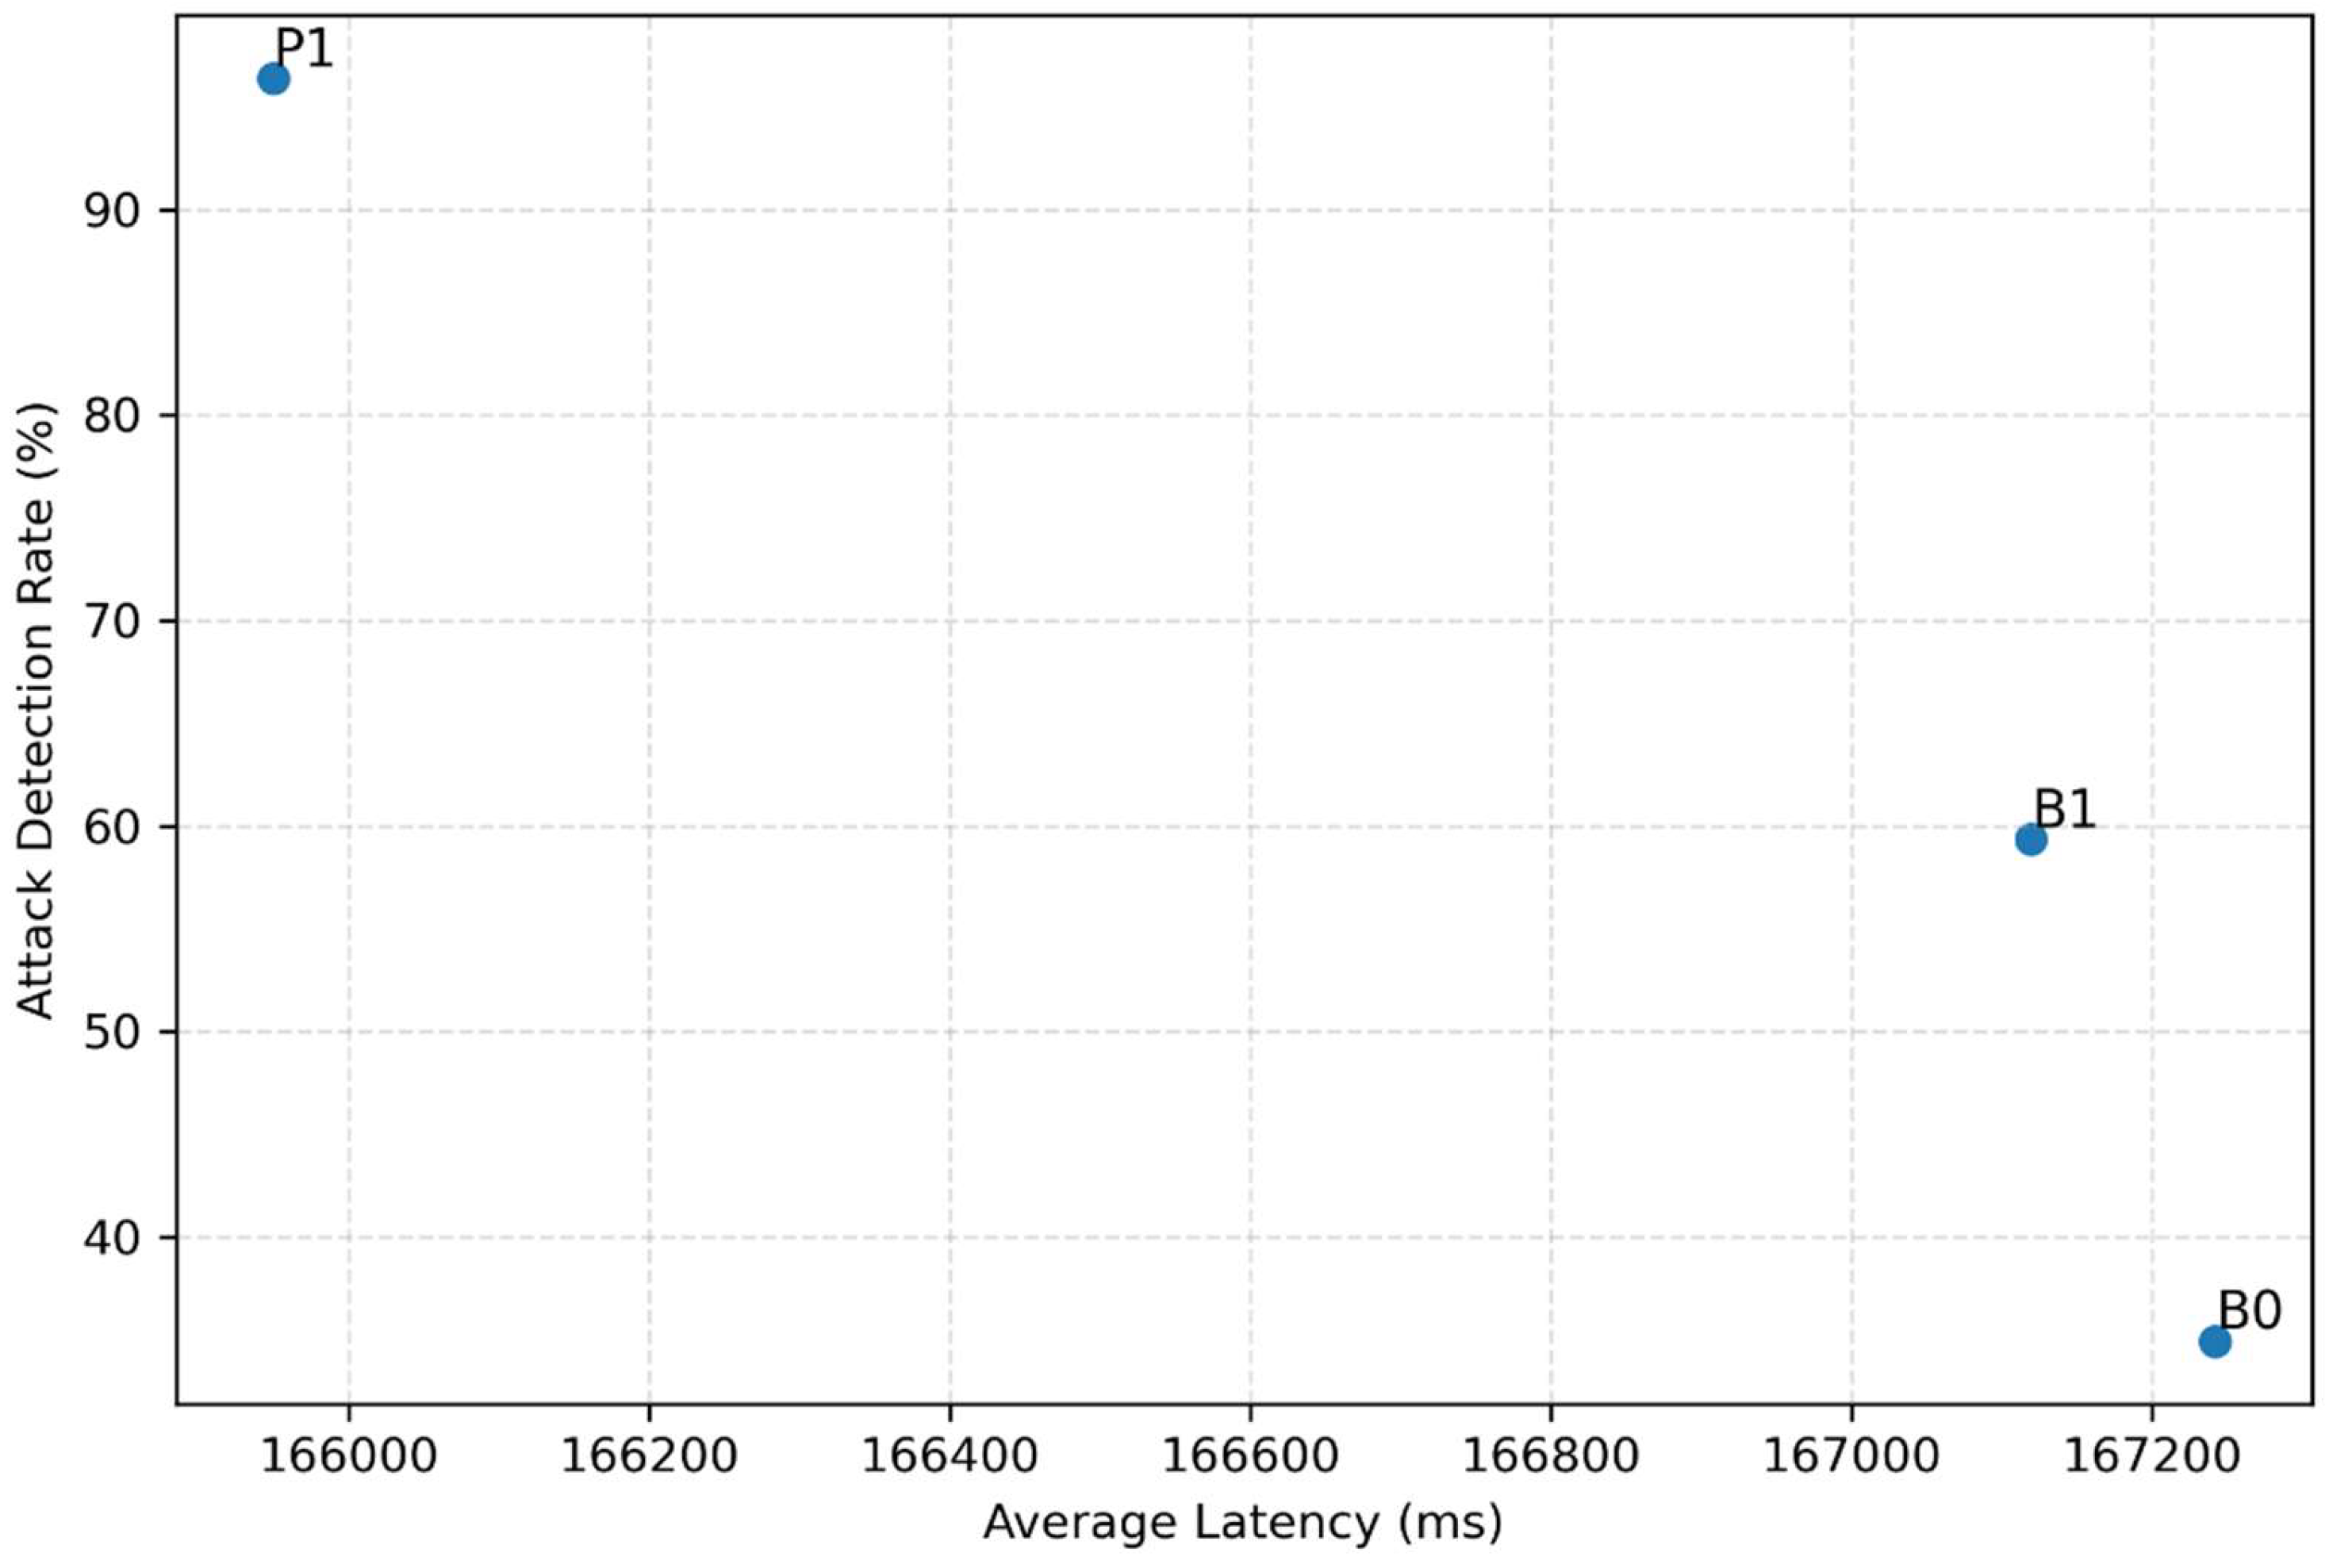
Figure 11.
Average bandwidth overhead by variant.
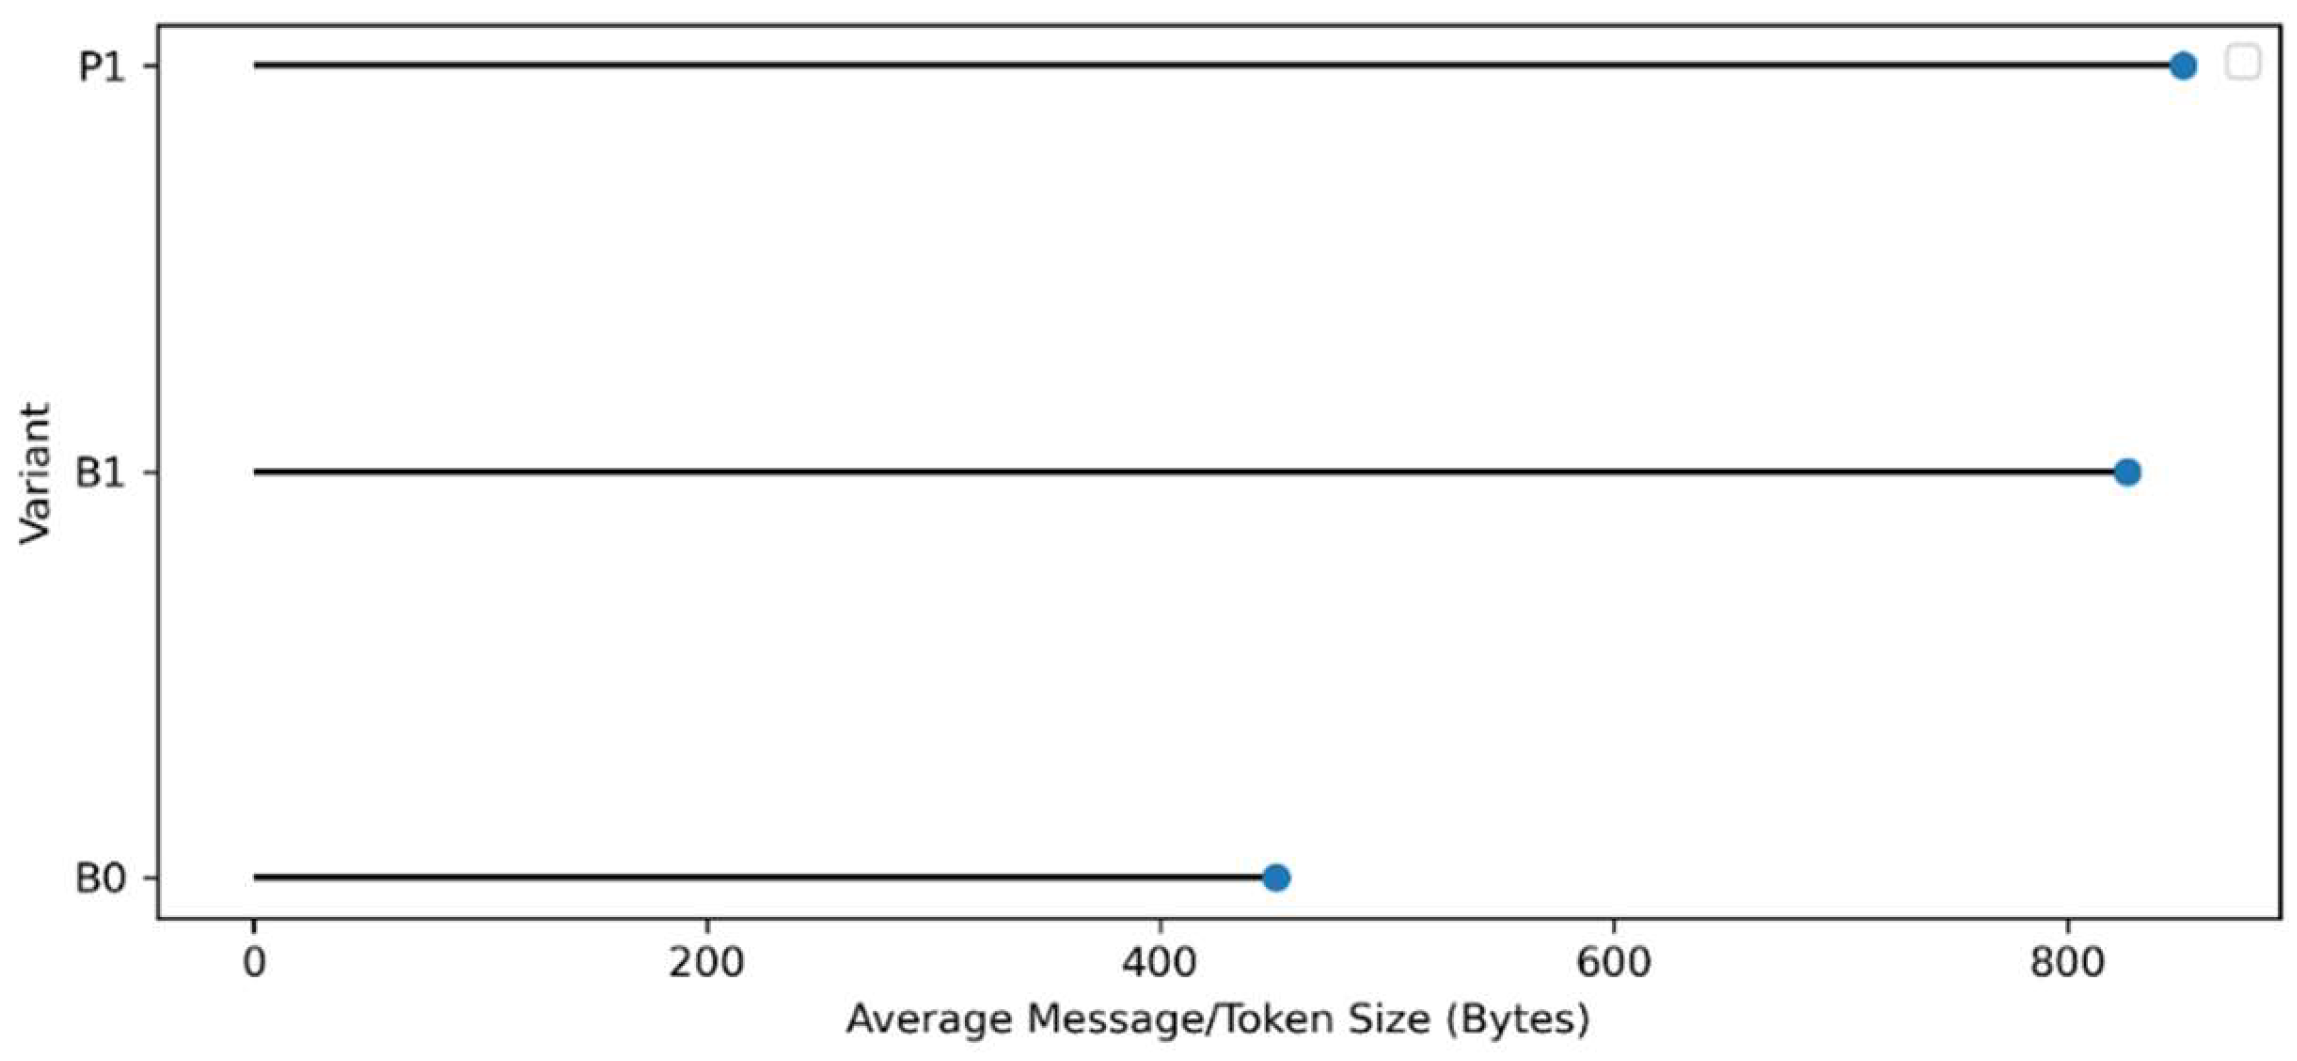
Figure 12.
S0 false warning rate plot for the three variants B0, B1, and P1.
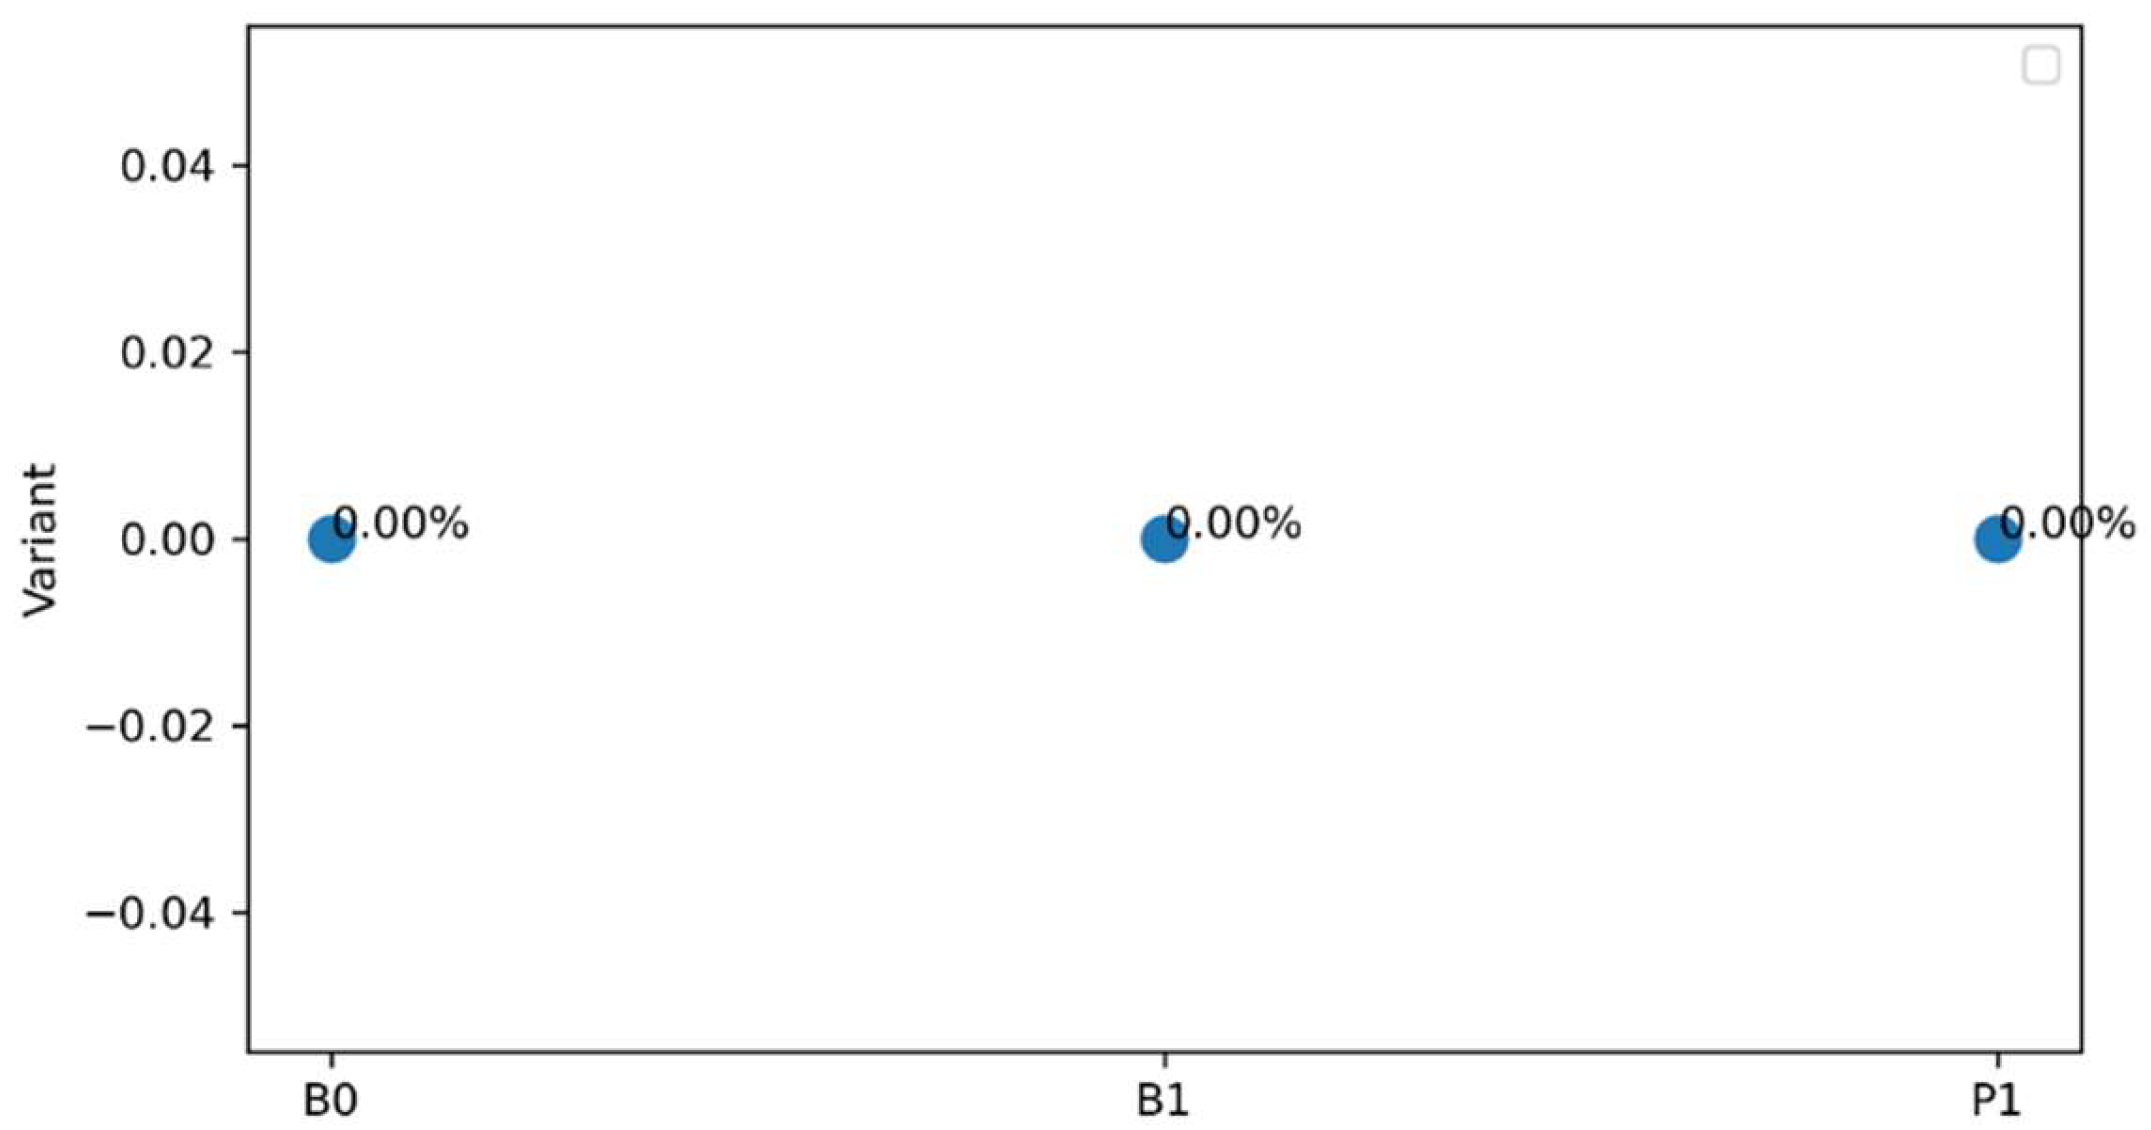
Figure 13.
A decision distribution graph for the tested B0, B1, and P1 schemes.
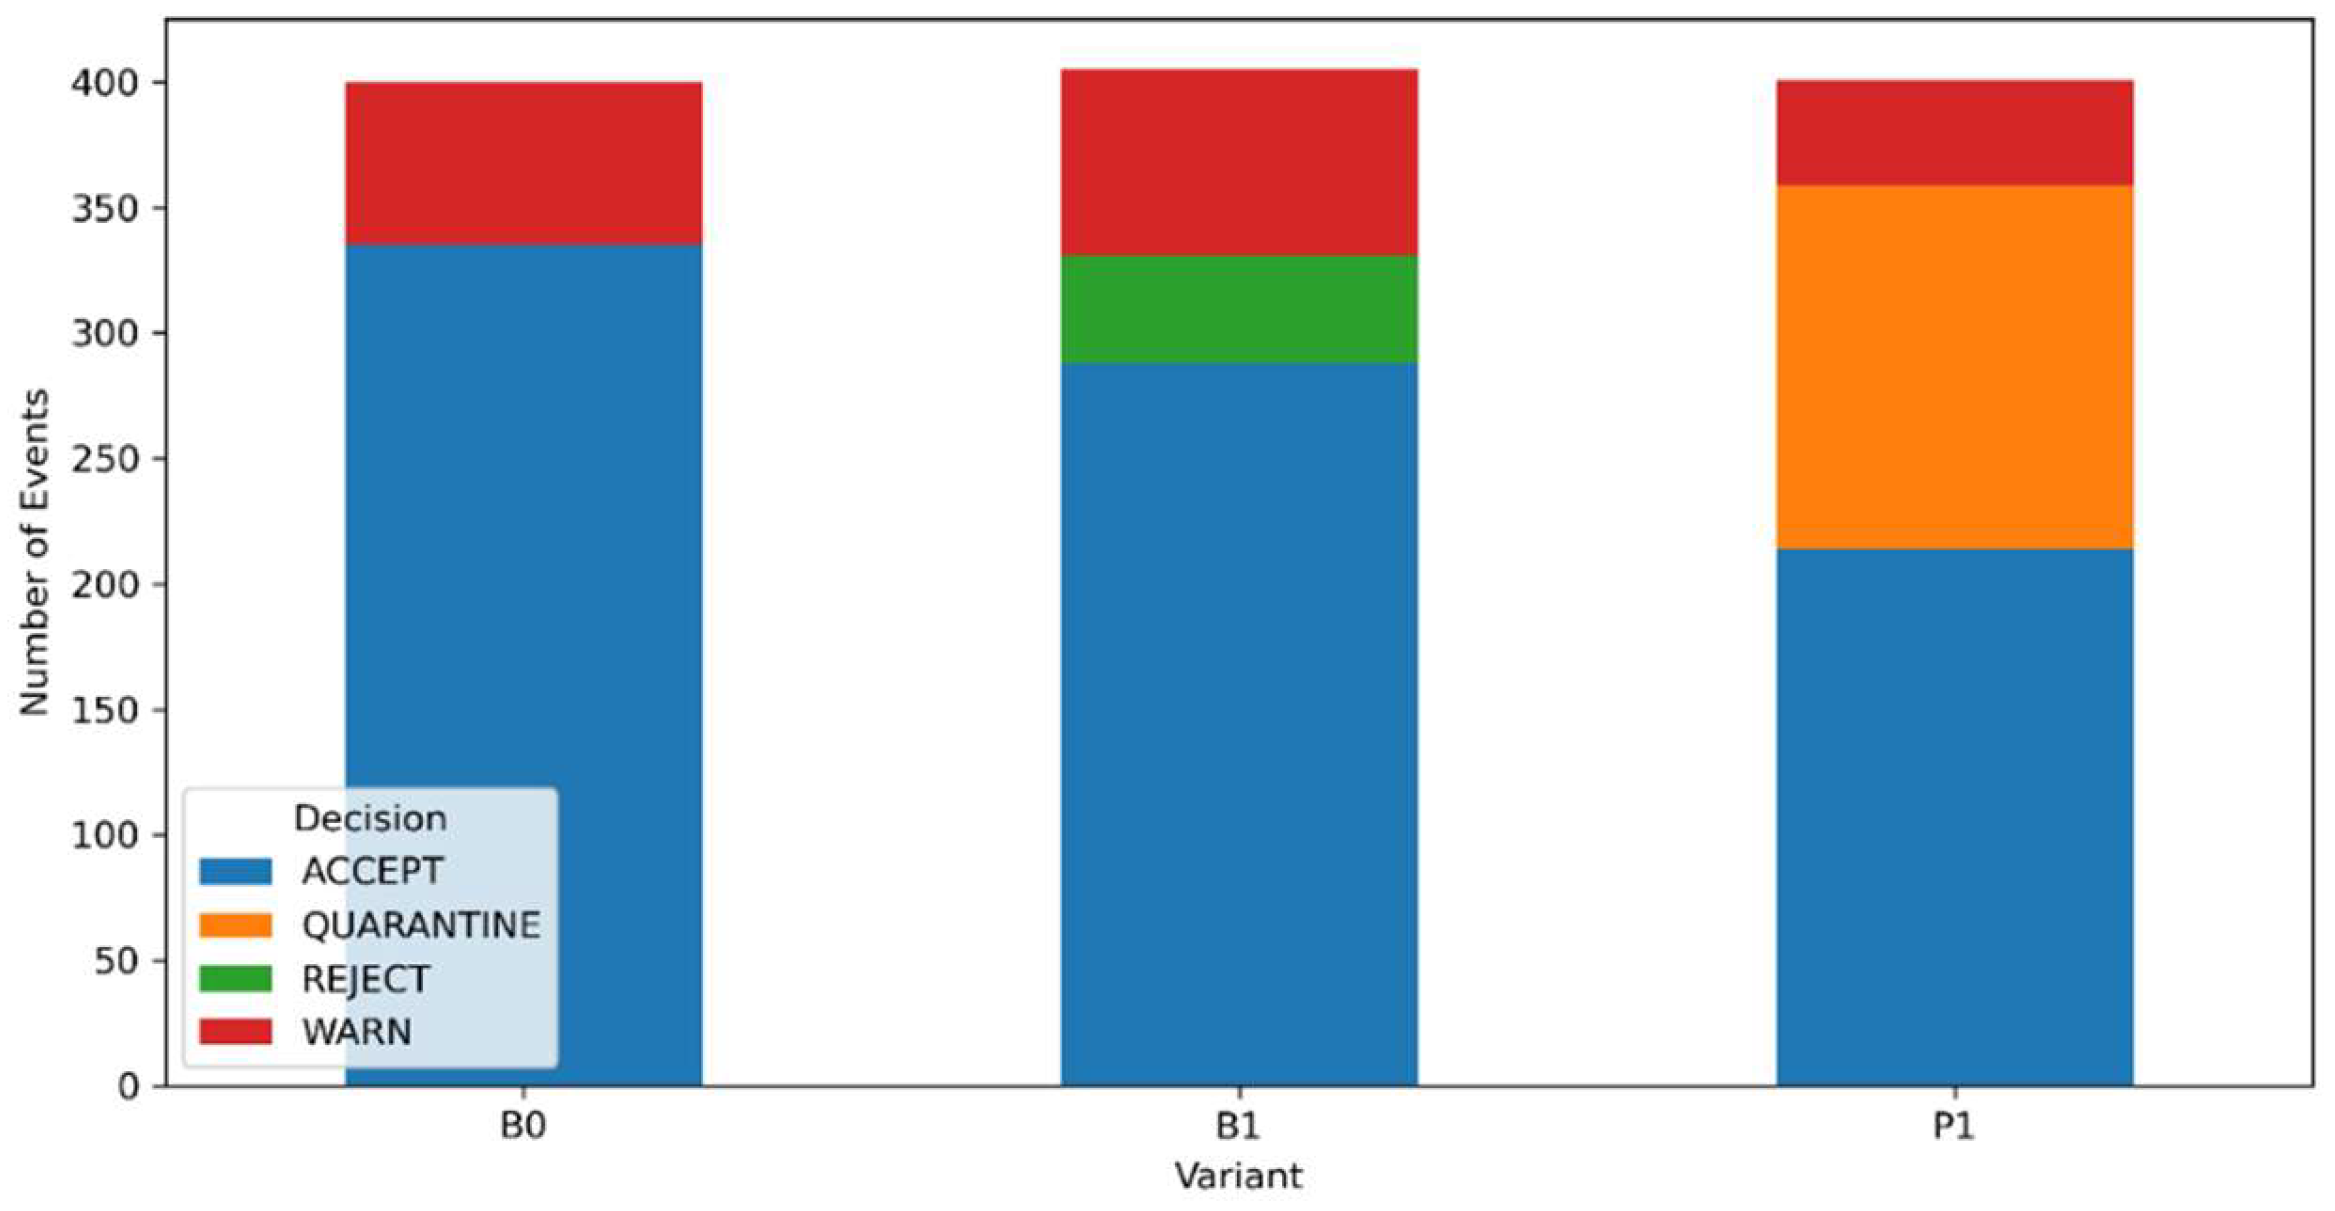
Figure 14.
A graph of adaptive trust token length for P1 across all scenarios (S0-S5).
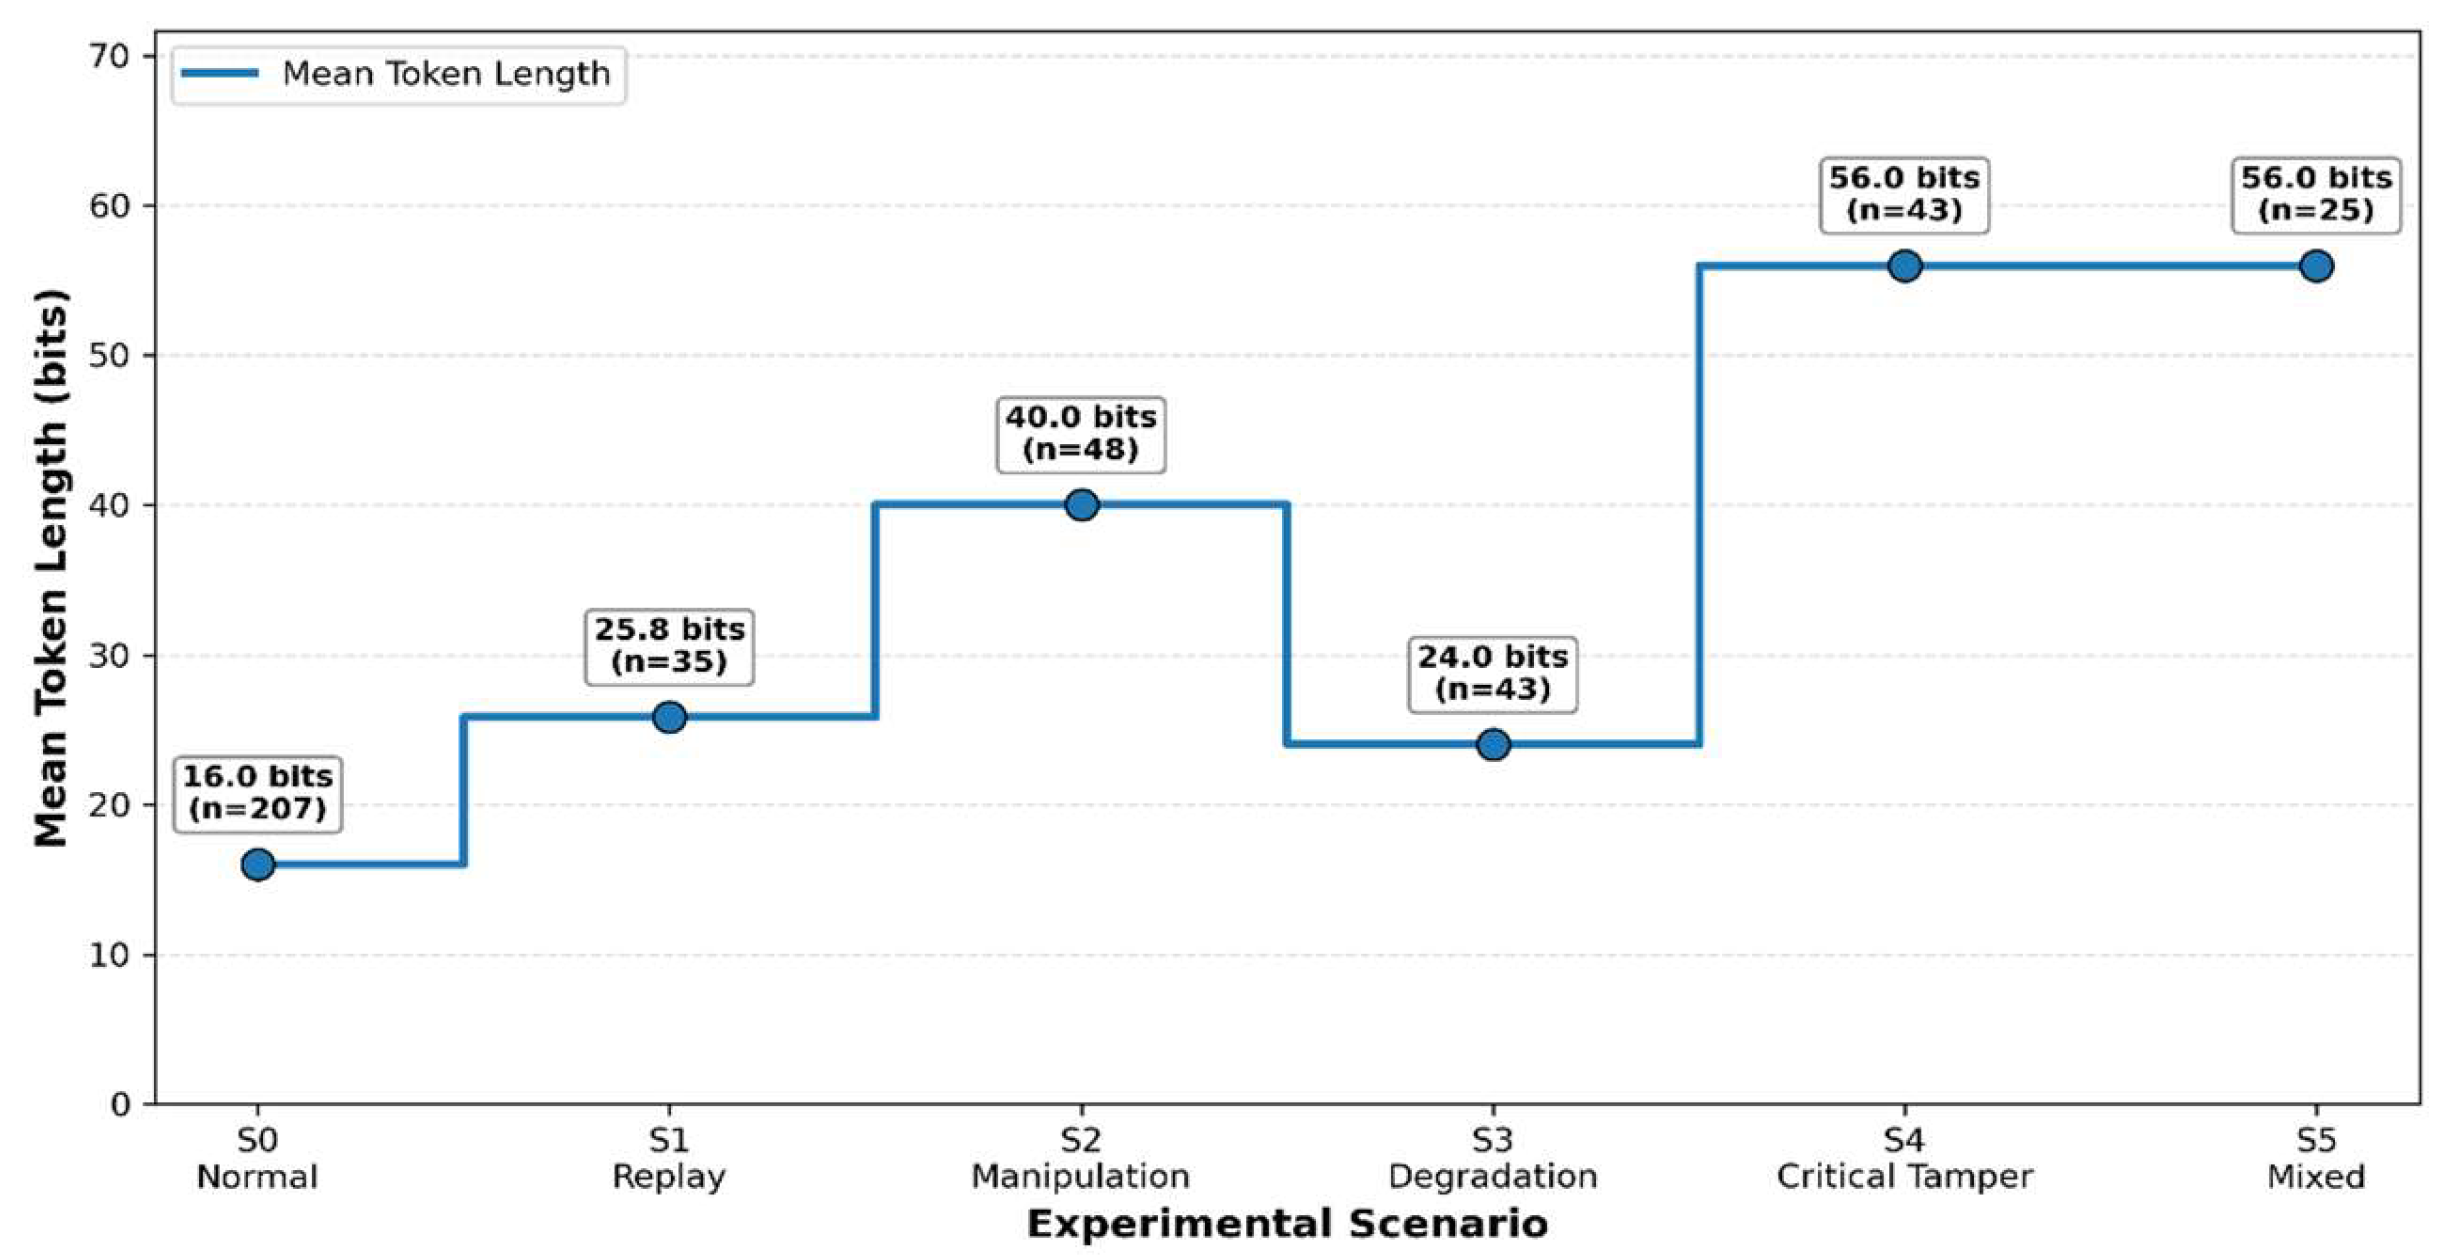
Figure 15.
TN, TP, FN, and FP evaluation plot for S0-S5 scenarios across all the experimental variants.
Figure 15.
TN, TP, FN, and FP evaluation plot for S0-S5 scenarios across all the experimental variants.
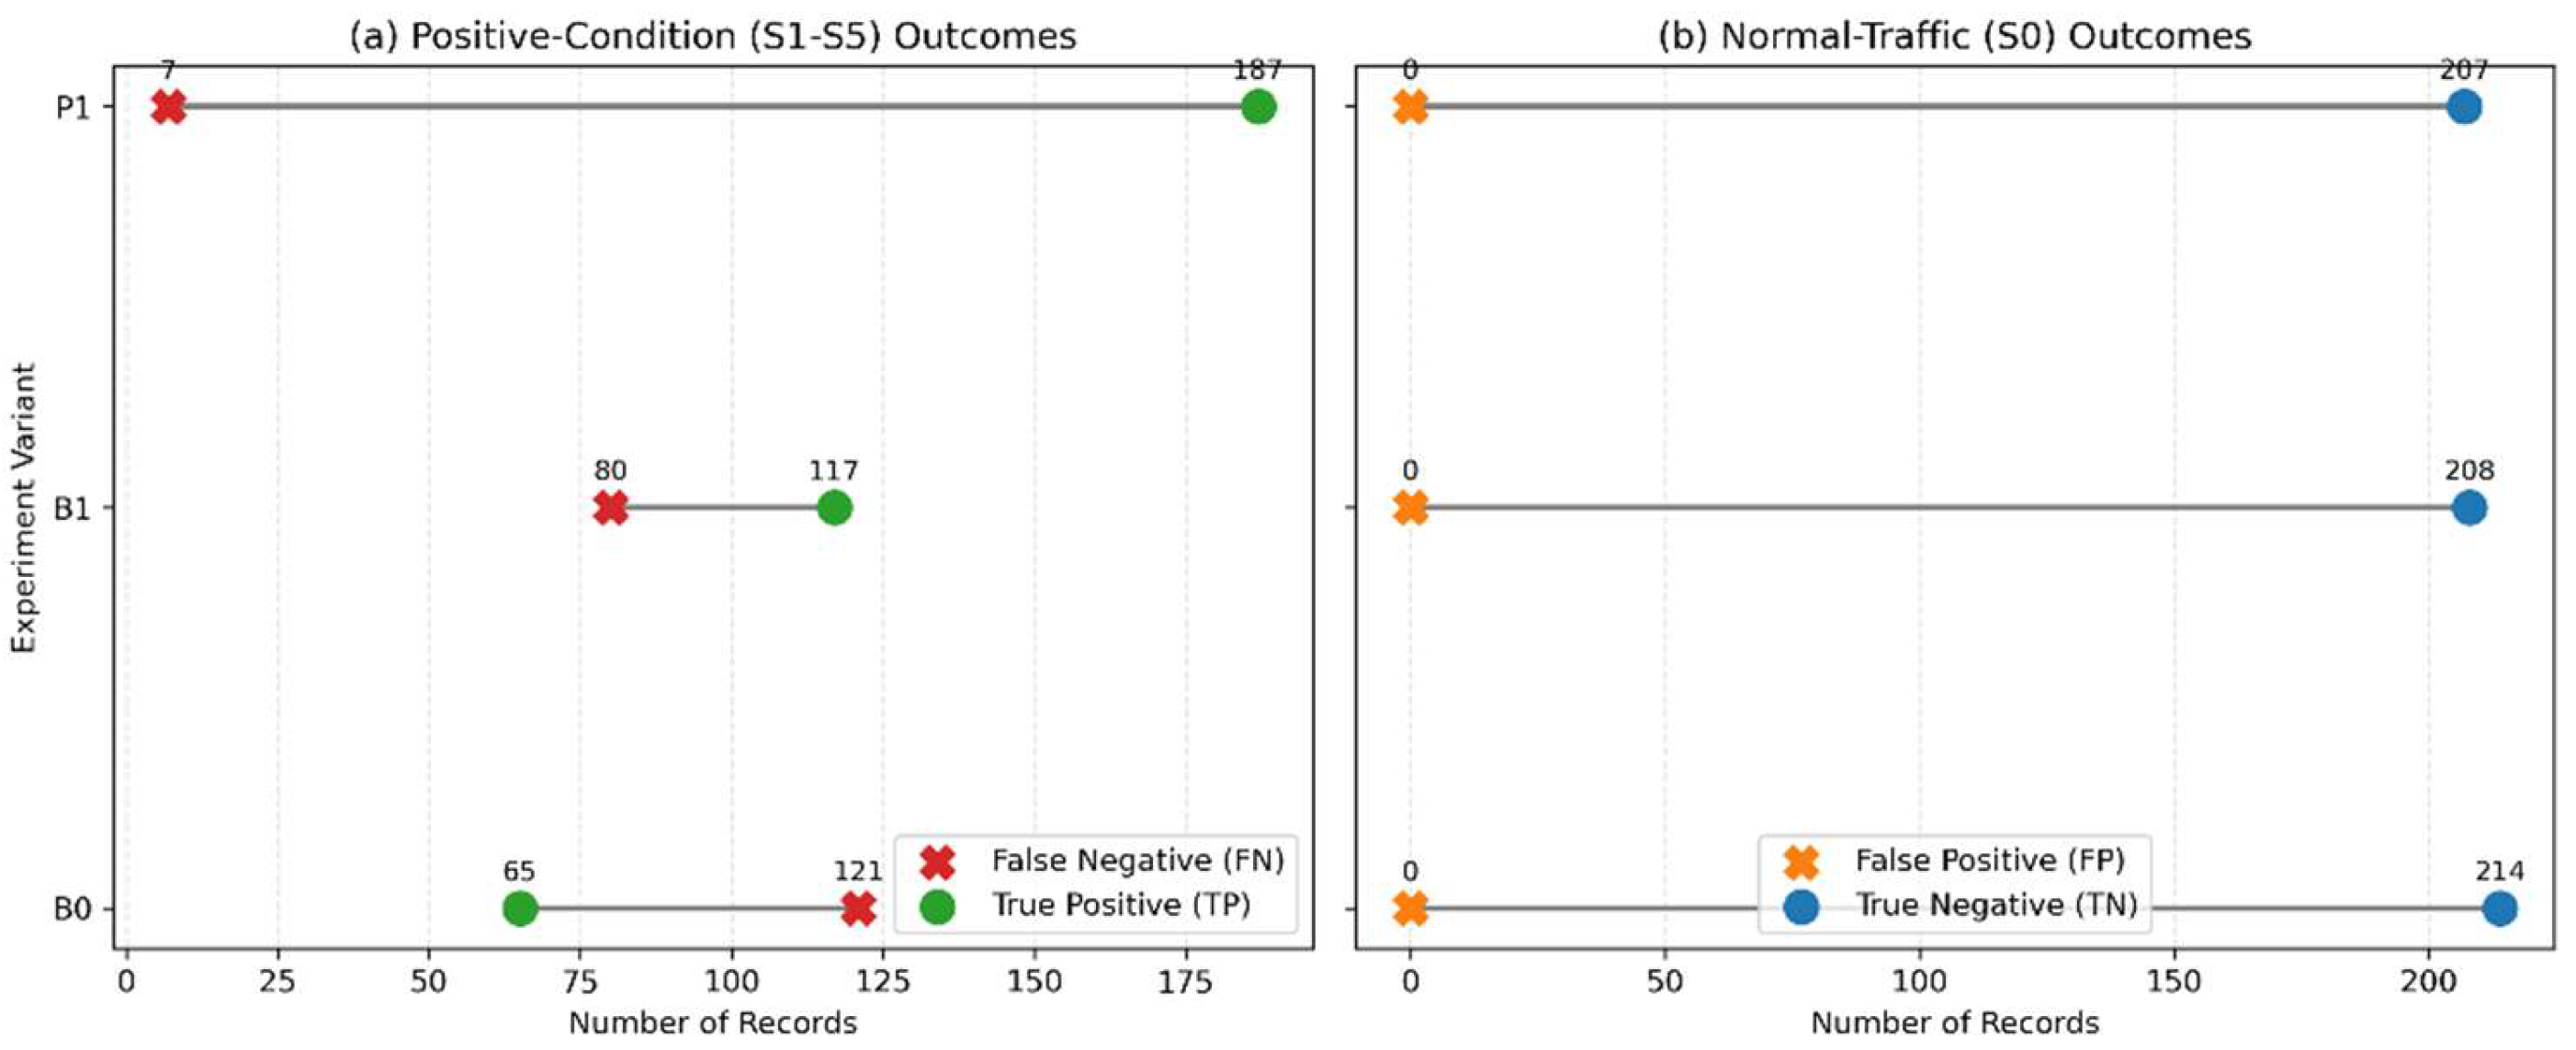
Figure 16.
Precision, Recall, and F1-score for abnormal-condition awareness.
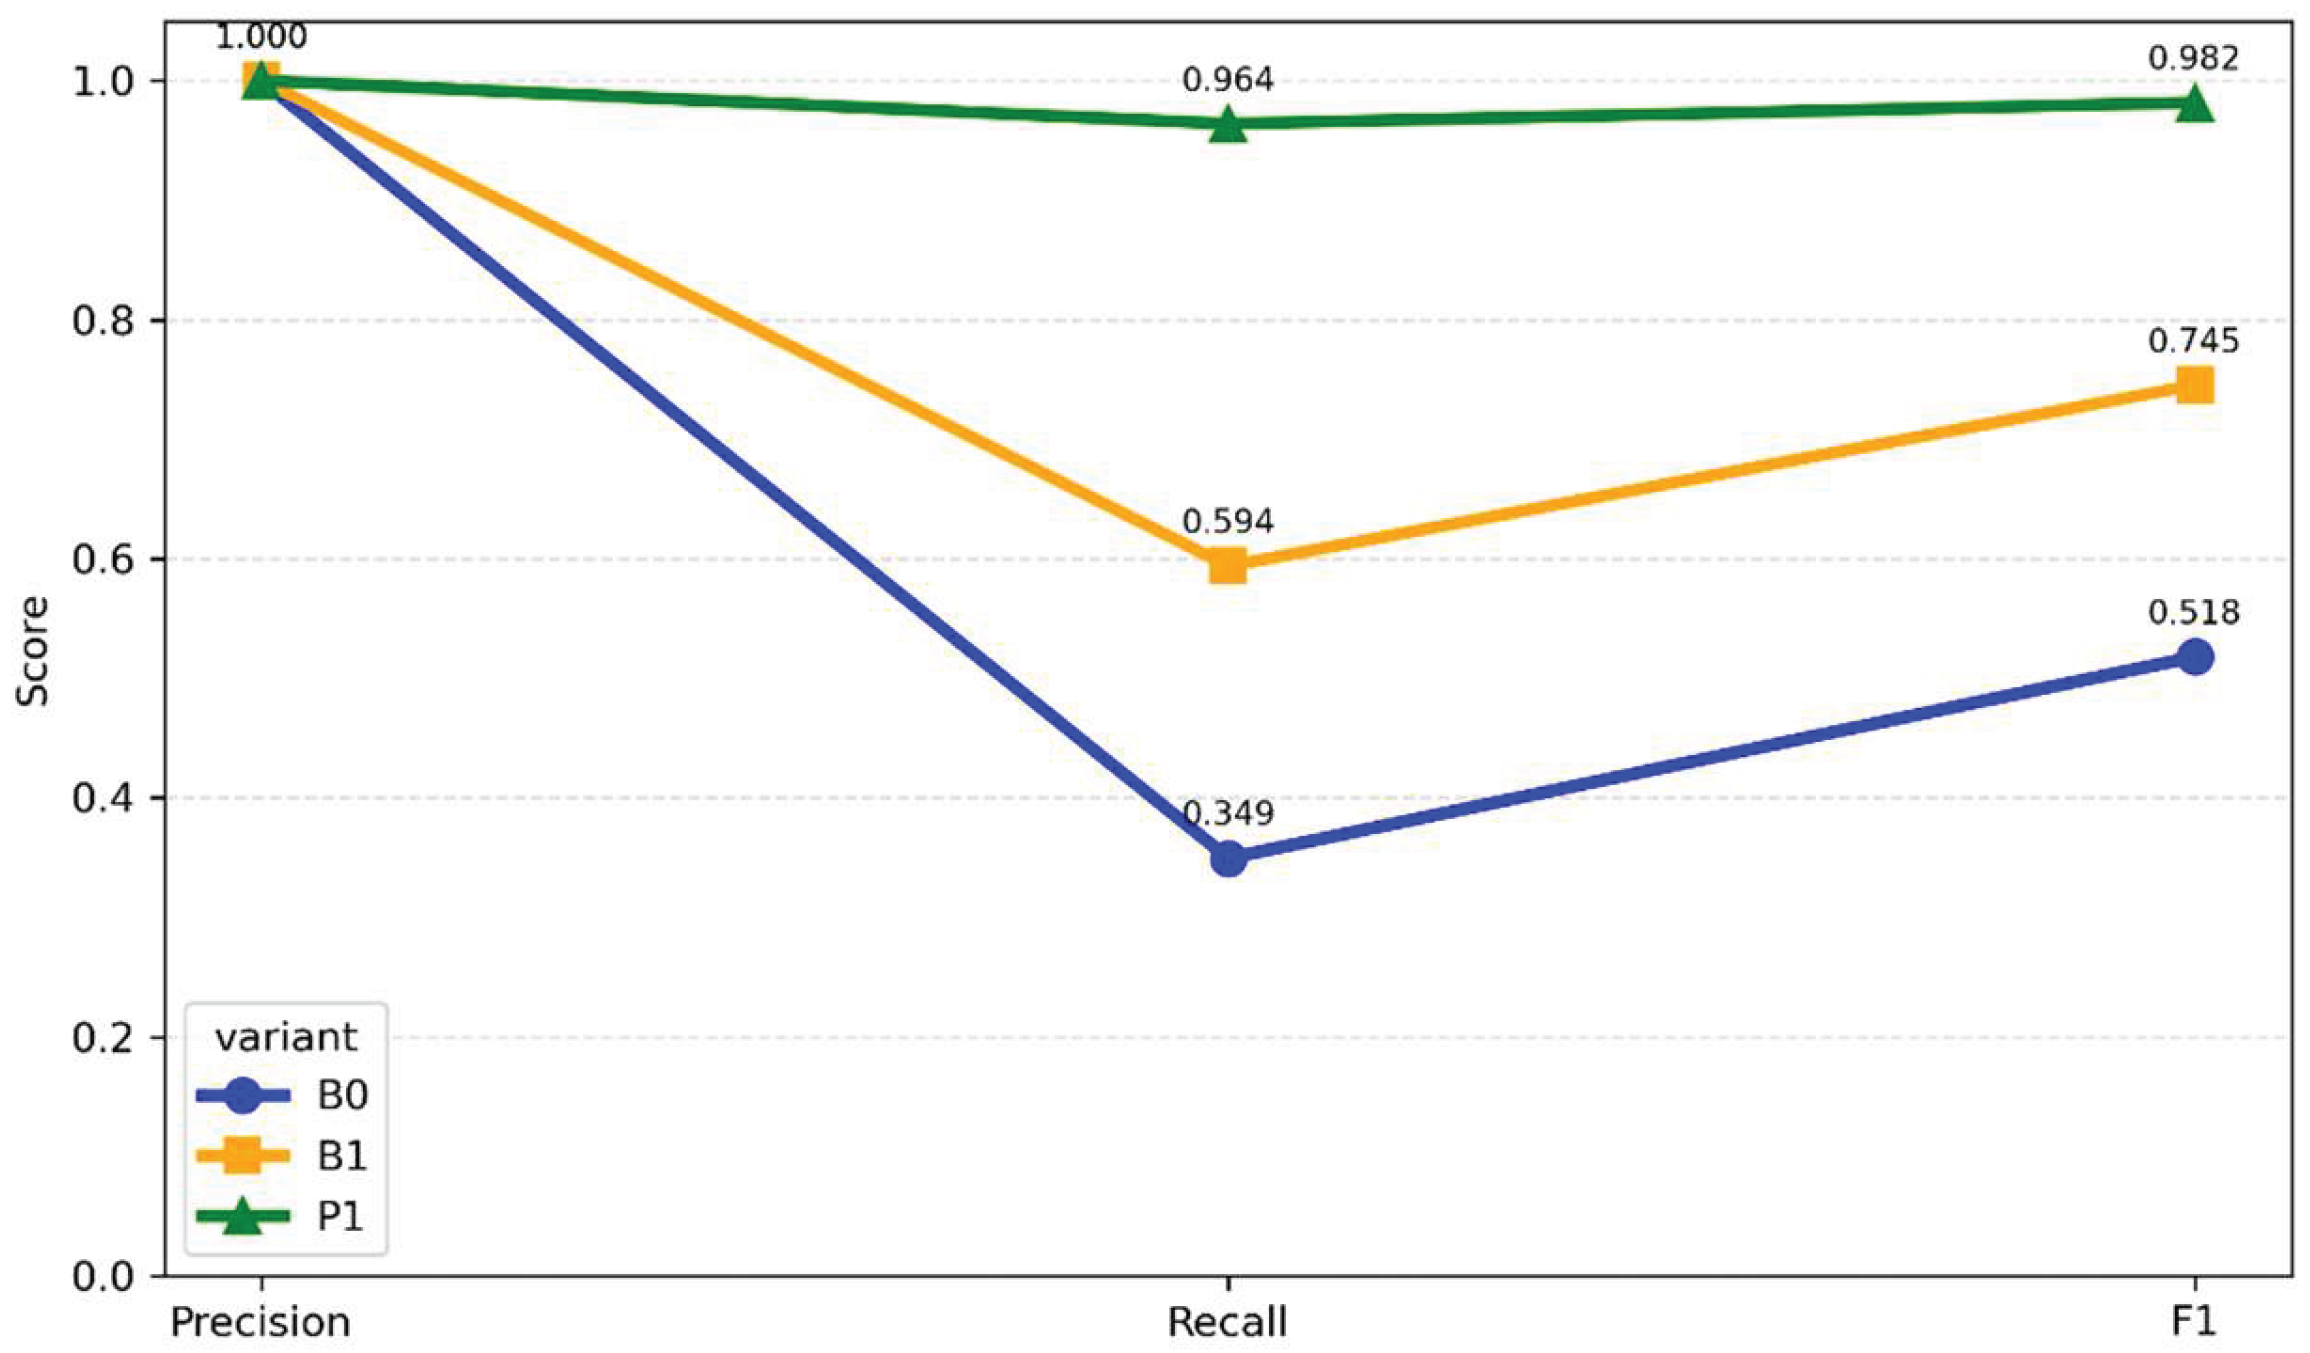
Table 1.
Positioning of the proposed scheme against some recent similar works.
| Theme | Representative references | Relevance to this work |
|---|---|---|
| IoT enabled smart-grids | [7,9,17,18] | Smart-grid communications, architecture, and limitations for secure deployments |
| Cybersecurity in smart meter systems | [10,23,24,38,39] | Identifies vulnerabilities and what is required to protect a smart meter system |
| MQTT/CoAP telemetry for smart grid applications | [11,12,19,20,26] | Supports both gateway-broker based implementations as well as additional testing features for the smart grid applications |
| Metering standards such as DLMS/COSEM | [21,22,40] | Justifies maintaining the existing semantic representations of metering objects by applying gateway envelopes around these representations |
| LPWAN & other constrained networks | [8,22,25] | LPWAN has limited overhead and packet sizes. Duty cycle is also an issue when it comes to the network |
| Steganographic methods for smart city edge/cloud | [1,2,4,13,29,30,31,32,33,34] | Provides a basis for carrier concepts, threat models, and constrained steganalysis |
| Edge-based risk scoring, local verification, and low latency audit for smart city edge/cloud security | [13,15,16,18] | Supports edge-based risk scoring, local verification, and low latency auditing |
| Governance for OT/critical infrastructure defense | [23,37] | Supports safe, approved, and auditable defensive deployments |
Table 2.
Summary of the functions of the architecture entities.
| Entity | Role | Proposed ASTS Function | Security Assumption |
|---|---|---|---|
| Smart Meter (SM) | Measures the electricity usage, sends data back to the utility | Provides a digest and states in a sequence | The SM is securely assigned an identity and keys |
| Gateway (GW) | Takes all the SM data, bundles it up and sends it to the utility | Holds trusted fragments and carrier rules for enforcement | GW is monitored and audited |
| Edge Trust Engine (ETE) | Controls local risk and verifies tokens | Calculates risk level; chooses mode or policy based on risk level; verifies token | Policy repository is protected |
| Broker/Mediator (BR) | Sends data over IP, CoAP, MQTT | Protects approved metadata and order constraints | BR retains necessary information |
| Head-End System (HES) | Utility’s application endpoint | Receives, warns, isolates, or reject SM readings | HES also receives audit events |
| SOC/Audit | Compliance and real-time monitoring | Reviews of integrity failures and policy violations | Logs are tamper-evident |
Table 4.
Experimental implementation components and their outputs.
| Component | Role in the Implementation | Input | Output |
|---|---|---|---|
| Smart Electricity Meter Simulator | It produces periodic (0,1 seconds) interval readings and events, spanning 10 000 synthetic smart electricity meters over 1 epoch | Smart Meter IDs, event schedule, load profile | Telemetry records |
| MQTT Broker/CoAP Proxy | Transports meter telemetry (Eclipse Mosquitto MQTT broker) | Protocol payload information | Timing logs and messages delivered |
| ASTS Gateway | Calculates digest values for trust fragment embedding (Applies B0, B1, and proposed P1 algorithms) | Readings, Keys, Policy | Modified flow observation |
| Edge Trust Engine | Token verification and risk assessment | Flow state (meter readings) | Accept/Warn/Quarantine/Reject flow state |
| Fault Injector | Generates manipulation, replay, delay, and traffic drop scenarios (S0-S5) | Scenario profile | Modified traffic with fault injected |
| Metrics Collector | Computes security and performance metrics | Logs, and decisions | Plots, and tables |
Table 7.
Findings summary for the B0, B1, and proposed P1 variants over S0-S5 scenario events.
| Variant | Scenario | Number of Records (#) | Attack Detection Rate (%) | False Warning Rate (%) | Average Latency (ms) | Average bandwidth (bytes) |
|---|---|---|---|---|---|---|
| B0 | S0 | 196 | 0.0 | 0.0 | 154780.077 | 448.811 |
| B1 | S0 | 193 | 0.0 | 0.0 | 153001.57 | 825.534 |
| P1 | S0 | 192 | 0.0 | 0.0 | 154670.448 | 825.536 |
| B0 | S1 | 33 | 0.0 | 0.0 | 169472.848 | 416.212 |
| B1 | S1 | 34 | 17.647 | 0.0 | 167118.794 | 792.735 |
| P1 | S1 | 33 | 96.97 | 0.0 | 164881.242 | 813.97 |
| B0 | S2 | 37 | 0.0 | 0.0 | 143842.541 | 460.973 |
| B1 | S2 | 38 | 100.0 | 0.0 | 143739.421 | 835.895 |
| P1 | S2 | 42 | 90.476 | 0.0 | 143714.976 | 879.714 |
| B0 | S3 | 41 | 0.0 | 0.0 | 138165.512 | 456.585 |
| B1 | S3 | 42 | 0.0 | 0.0 | 150552.071 | 830.214 |
| P1 | S3 | 39 | 97.436 | 0.0 | 146967.077 | 862.692 |
| B0 | S4 | 39 | 100.0 | 0.0 | 150154.179 | 470.0 |
| B1 | S4 | 40 | 100.0 | 0.0 | 150355.075 | 843.3 |
| P1 | S4 | 39 | 100.0 | 0.0 | 145315.795 | 931.051 |
| B0 | S5 | 18 | 100.0 | 0.0 | 131891.5 | 465.556 |
| B1 | S5 | 22 | 90.909 | 0.0 | 132542.818 | 834.273 |
| P1 | S5 | 22 | 100.0 | 0.0 | 138045.636 | 907.5 |
Table 8.
Accuracy, Precision, Recall, and F1-score performance comparison of the proposed ASTS model and other recent works.
Table 8.
Accuracy, Precision, Recall, and F1-score performance comparison of the proposed ASTS model and other recent works.
| Method | Al Hanif et al. [11] DT | Al Hanif et al. [11] RF | Hindi et al. [27] SVM (Linear Kernel) Bi | Proposed ASTS scheme (P1) |
|---|---|---|---|---|
| Detection accuracy | 0.9629 | 0.9633 | - | 0.9632 |
| Precision | 0.9639 | 0.9639 | 0.9955 | 1.00 |
| Recall | 0.9629 | 0.9629 | 0.9871 | 0.964 |
| F1-score | 0.9629 | 0.9632 | 0.9913 | 0.982 |
Table 9.
Overall performance comparison for the proposed P1 scheme and some previous works.
| Capability | [1] | [2] | [11] | [27] | Proposed ASTS Framework |
|---|---|---|---|---|---|
| Replay Detection | Limited | Limited | Partial | Partial | Yes |
| Manipulation Detection | Partial | Partial | Yes | Yes | Yes |
| Network Degradation Awareness | No | No | No | No | Yes |
| Risk-adaptive Signaling | No | No | No | No | Yes |
| Policy-based Response | No | No | No | No | Yes |
| Smart-meter Specific | No | No | Partial | Partial | Yes |
Disclaimer/Publisher’s Note: The statements, opinions and data contained in all publications are solely those of the individual author(s) and contributor(s) and not of MDPI and/or the editor(s). MDPI and/or the editor(s) disclaim responsibility for any injury to people or property resulting from any ideas, methods, instructions or products referred to in the content. |
© 2026 by the authors. Licensee MDPI, Basel, Switzerland. This article is an open access article distributed under the terms and conditions of the Creative Commons Attribution (CC BY) license (http://creativecommons.org/licenses/by/4.0/).
Copyright: This open access article is published under a Creative Commons CC BY 4.0 license, which permit the free download, distribution, and reuse, provided that the author and preprint are cited in any reuse.