
Submitted:
08 September 2026
Posted:
09 September 2026
You are already at the latest version
Abstract
Small office and home office networks are increasingly targeted by adversaries exploiting the growing population of IoT devices, yet most machine learning-based intrusion detection systems for IoT are limited to “attack classification” and provide little insight into where an intrusion sits within the broader attack lifecycle. This study develops a two-phase machine learning-based intrusion detection for small office and home office IoT traffic that extends conventional intrusion detection into “Cyber Kill Chain” stage classification and incorporates explainable AI to support transparent, actionable defences. Using the CICIoT2023 six-class dataset, Random Forest, Decision Tree and LightGBM were trained and evaluated. Random Forest achieved the highest accuracy while LightGBM offered a favourable trade-off between accuracy and computational efficiency. LightGBM was used to classify detected intrusions into four Cyber Kill Chain stages, achieving near-perfect precision and recall for reconnaissance and delivery-stage traffic, but comparatively weaker performance for exploitation and command-and-control traffic. Feature importance and SHAP analysis identified inter-arrival time and flow duration as the dominant drivers of stage classification. These findings show that machine learning-based intrusion detection can combine high accuracy with stage-aware explainable contextualisation, offering a practical foundation for proactive defence strategies in small office and home office environments.
Keywords:
intrusion detection system
; internet of things
; small office small home networks
; cyber kill chain
; machine learning
; explainable AI
1. Introduction
The Internet of Things (IoT) has become integral to Small Office and Home Office (SOHO) environments, where devices such as smart thermostats, microphones, cameras, and voice assistants now sit alongside conventional computing equipment. Global IoT deployment exceeded 14 billion devices in 2024 and is projected to surpass 25 billion by 2030 [1], and this growth has been matched by expansion of the attack surface available to adversaries. IoT ecosystems are particularly exposed because devices vary widely in protocols and vendor standards, frequently ship with weak default credentials, receive infrequent patching and lack the processing headroom needed for conventional endpoint protection [2]. SOHO networks further compound this exposure: unlike enterprise environments, they typically lack layered defences or dedicated monitoring, making them disproportionately attractive targets. Once compromised, such devices are readily conscripted into large-scale botnets as demonstrated by the Mirai campaign that disrupted major internet services in 2016 [3].
These risks are not hypothetical. In 2024, the UK National Cyber Security Centre and international partners issued a joint advisory describing how a China state-sponsored threat group had exploited outdated, unsupported SOHO devices as a launching pad for attacks against Australian networks, precisely because such devices are easier to compromise and better able to conceal malicious traffic [4]. In 2025, threat hunters uncovered a network of over 1,000 compromised SOHO devices supporting a sustained Cyber-espionage campaign, LapDogs, affecting victims across the United States and Southeast Asia [5]. Separately, a destructive attack in 2024 disabled more than 600,000 SOHO routers, cutting Internet access for customers across 18 U.S. states [6]. Collectively, these incidents illustrate that SOHO IoT compromises carry consequences well beyond the individual household or business, extending into regional connectivity, critical services and international security.
Machine learning (ML) techniques have emerged as a promising alternative to signature- and rule-based Intrusion Detection Systems (IDSs), offering the ability to detect anomalous or novel traffic patterns without relying on known attack signatures [7]. Numerous studies have applied ML algorithms to IoT intrusion detection with strong results, including on the CICIoT2023 dataset used in this study (see Section 2). However, the overwhelming majority of this work stops at classifying traffic as benign or as one of several attack types. This leaves a practically important gap: Knowing that traffic is malicious does not, by itself, indicate where in an attack’s lifecycle a defender is intervening, information that is critical for prioritising response. The Cyber Kill Chain (CKC) framework [8], which decomposes an attack into sequential stages from reconnaissance through actions on objectives, offers a natural structure for this kind of stage-aware contextualisation. Yet, its application to IoT-specific traffic and to SOHO environments in particular remains largely unexplored [9].
1.1. Research Objectives and Contribution
This study addresses the above gap by developing a two-phase ML-based IDS for SOHO IoT traffic that (i) detects and classifies intrusions using the CICIoT2023 six-class dataset [10], and (ii) extends detection into CKC stage classification, supported by SHAP-based explainability to keep the resulting model’s decisions interpretable for defenders. In doing so, the study makes three contributions:
- It provides a comparative evaluation of Random Forest, Decision Tree, and LightGBM for IoT intrusion detection on a class-balanced version of CICIoT2023,
- It operationalises, to the best of the our knowledge for the first time on IoT-specific traffic, a machine learning classifier that maps detected intrusions onto CKC stages. And finally,
- It applies feature importance and SHAP analysis to identify which traffic characteristics drive stage-level classification decisions, offering interpretable insight for both researchers and practitioners.
1.2. Structure of the Paper
The rest of the paper is structured as follows. In Section 2, we review some of the state-of-the-art literature most relevant to our paper. In Section 3, we give details the dataset, preprocessing and modelling methodology. In Section 4, we report the intrusion detection and CKC stage classification results, together with the feature importance and SHAP analysis. In Section 5, we interpret these results in light of the existing literature and consider their theoretical, practical and policy relevance. Finally, in Section 6, we conclude the paper summarising the study’s limitations and directions for future work.
2. Related Work
Cybersecurity research has long emphasised robust attack detection, and while SOHO environments attract less attention than higher-stakes sectors such as healthcare or critical infrastructure, the incidents outlined in Section 1 show that the consequences of SOHO compromise are far from trivial. Because SOHO-specific ML-IDS research remains limited, this review draws on three related bodies of work: studies using the CICIoT2023 dataset [10] specifically, broader ML-based IoT security research using other datasets and finally, prior work applying machine learning to CKC classification.
2.1. Machine Learning-Based Intrusion Detection Using CICIoT2023
Several studies have used CICIoT2023 to build IoT-specific intrusion detection models. For example, in [11] the authors combine two-step data clustering with a Multilayer Perceptron to manage the dataset’s high dimensionality, achieving 97.26% binary-classification accuracy. In [12], the authors applied hierarchical feature selection to reduce the feature space to 23 variables before training a CatBoost classifier, achieving 99.4% accuracy, precision, recall and F1-score across DoS, DDoS and Mirai subtypes with SHAP used to interpret feature contributions, an approach this study extends to CKC stage classification. In [13], a comparison among five classifiers was given under binary, grouped and fine-grained labelling schemes, with Decision Tree and Random Forest achieving near-100% accuracy and substantially outperforming SVM, which are results consistent with the Phase 1 results we report in Section 4.1. In [14], the authors proposed a stacking ensemble (Random Forest and Linear SVM base learners with a Logistic Regression meta-model) combined with SMOTE for class balancing, achieving 93% accuracy, though with reduced precision (85%) for reconnaissance traffic due to feature overlap. This challenge echoes the late-stage mis-classification pattern observed for exploitation and command-and-control traffic in our work. In [10], which also introduced the CICIoT2023 dataset, the authros reported 99.7% and 99.4% binary-classification accuracy for Random Forest and Deep Neural Networks respectively, but noted a marked drop in F1-score (approximately 71%) once classification was extended to the dataset’s full 34-class taxonomy, illustrating the general trade-off between classification granularity and accuracy that recurs across this literature.
2.2. Broader Machine Learning-Based IoT Security Techniques
Beyond CICIoT2023 [10], a wider body of work has evaluated ML and deep learning models for IoT and industrial IoT (IIoT) intrusion detection. For example, [15] compared XGBoost, SVM and deep convolutional neural networks across IoT-23, NSL-KDD, TON_IoT and a custom testbed, finding that XGBoost achieved the best accuracy (99.98%) while training substantially faster than the alternatives, which is an efficiency argument one can use relevantly to resource-constrained SOHO deployment. In [16], the authors proposed a dual-layer LSTM architecture with cryptography-integrated alerting, achieving 98% accuracy on UNSW-NB15, while in [17], the authors found Random Forest outperforming SVM and XGBoost for both binary (92.73%) and multiclass (82.67%) classification on the same dataset, with multiclass accuracy degrading for rare attack types. This again mirrors the exploitation and command-and-control weaknesses observed in our CKC results. In [18], an evaluation of ensemble techniques was provided within a fog-computing architecture across UNSW-NB15 and CICIDS2017, which found that stacking outperformed individual classifiers, including Random Forest though at the cost of increased model complexity and training time. In [19], the authors reported that deep learning architectures (Bi-LSTM, GRU) achieved near-perfect accuracy (99.99%) on an Industrial IoT dataset, outperforming classical ML methods but at considerably higher computational cost up to 1,207 seconds for multiclass Bi-LSTM training. In [20], ensemble ML was combined with software-defined networking and network function virtualisation to deliver 99.9% accuracy with a 0.1% false-positive rates, demonstrating that ML-based detection can be embedded within broader automated network defence architectures. Across this literature, tree-based ensembles consistently perform competitively with, and are often more efficient than, deep learning alternatives thus supporting the choice of Random Forest, Decision Tree and LightGBM as the Phase 1 classifiers in our study.
2.3. Machine Learning-Based Cyber Kill Chain Classification
Literature explicitly combining machine learning with Cyber Kill Chain classification is scarce. The most directly relevant study is [21], which proposes an ML framework for mapping security alerts to the seven canonical CKC stages in the context of Advanced Persistent Threats (APTs). Using Multiple Factor Analysis for feature extraction and OneR/InfoGain for feature selection, they found that Naive Bayes achieved 91.1% accuracy using only five optimised features, outperforming SVM and Random Forest on a dataset of 3,676 observations. While this confirms the general feasibility of combining CKC classification with machine learning, the work targets APT alerts rather than IoT network traffic. There are no CKC-aware classifiers proposed and trained specifically on IoT traffic, and certainly none for SOHO-relevant datasets such as CICIoT2023.
2.4. Summary and Research Gap
Table 1 summarises the reviewed literature against three criteria: use of the CICIoT2023 dataset, application of ML to IoT security, and inclusion of CKC-stage classification. No reviewed study satisfies all three simultaneously: studies using CICIoT2023 achieve strong detection performance but stop at attack-type classification (Section 2.1), while the one study to attempt CKC classification does so on non-IoT data (Section 2.3). This gap motivated the present study.
3. Methodology
This study followed a two-phase quantitative research design. Phase 1 developed and compared three supervised classifiers for intrusion detection in IoT network traffic. Phase 2 extended the detected intrusions into CKC stage classification using the best-suited classifier from Phase 1, supported by feature importance and SHAP-based explainability analysis. Both phases used the CICIoT2023 six-class dataset as their common foundation. All experiments were implemented in Python 3.13.2 using pandas, NumPy, scikit-learn, LightGBM, matplotlib, seaborn and SHAP. Figure 1 summarises the overall research methodology.
3.1. Dataset Description
The CICIoT2023 six-class dataset [10], developed by the Canadian Institute for Cybersecurity, was used for both phases of this study. It is a reduced, class-balanced derivative of the original CICIoT2023 dataset (45,807,617 instances across eight classes), retaining 1,800,000 network traffic instances distributed approximately evenly across six classes (benign traffic and five attack categories: DDoS, DoS, reconnaissance, Mirai and Web-based attacks). The dataset was selected in preference to conventional intrusion-detection benchmarks such as NSL-KDD [22] and UNSW-NB15 [23] because it was collected specifically from IoT traffic and captures attack types characteristic of consumer and SOHO device compromise. It was obtained as a single CSV file (df_FL_CICIoT2023_6_classes.csv, ≈ 1.2 GB uncompressed) from a public Zenodo repository, with file integrity confirmed against the repository’s published MD5 checksum prior to use.
Each instance is described by 17 fields: 16 numerical traffic features (flow duration, header length, protocol type, packet/byte rates, TCP flag counts, packet-size statistics, inter-arrival time, magnitude and variance) and one categorical label, sub_label, encoding benign traffic and five attack categories as shown in Table 2.
Because the dataset’s class balance was confirmed to be near-uniform (each class ≈ 16.67% of instances), the full dataset was used without additional sampling in either phase. Table 3 describes each of these 16 numerical features in turn. Because the dataset’s class balance was confirmed to be near-uniform (each class ≈ 16.67% of instances), the full dataset was used without additional sampling in either phase.
3.2. Data Preprocessing
A common preprocessing pipeline was applied in both phases: a dropna() check for missing values (none were found), verification of dataset integrity and structure (via info() and describe()), and an 80/20 stratified train–test split (, ) to preserve class balance across partitions. This yielded 1,440,000 training and 360,000 test instances, with 60,000 test instances per class.
For Phase 1, the sub_label column was retained as the multiclass target (benign vs. five attack types) without further transformation, and all 16 numerical features were used as model inputs. For Phase 2, sub_label was additionally mapped onto four stages of the CKC, producing a new target column, Kill_Chain_Stage. Benign traffic was retained as a non-attack baseline class rather than mapped onto the kill chain. Table 4 summarises this mapping and its rationale.
3.3. Exploratory Data Analysis
3.3.1. Dataset Structure and Feature Distributions
The info() and describe() outputs (Figure 2 and Figure 3) confirmed 1,800,000 complete records with 16 float64 features and one int64 label, requiring no categorical encoding. Table 5 summarises the central tendency and dispersion of key features. Several features exhibited strongly right-skewed distributions with long tails, notably Rate, Srate, and flow_duration, consistent with a small number of high-intensity flooding events (DoS/DDoS) amid a much larger volume of low-rate benign and reconnaissance traffic.
3.3.2. Feature Correlation Analysis
A clustered correlation heatmap of the twenty most influential features (Figure 4) was used to assess redundancy prior to modelling. Three clusters emerged.
A cluster (Magnitude, AVG, Tot sum, Tot size, Max, Min) showed strong mutual correlation (r ≈ 0.60–0.96), reflecting shared measurement of packet-size volume. A header/flag cluster (Header_Length, rst_count, urg_count) showed moderate-to-strong correlation (r ≈ 0.63–0.87), associated with header structure and control-flag behaviour. A third, low-correlation behavioural group (Rate, Srate, IAT, flow_duration, Protocol Type, Variance, syn_count) showed weak correlation both within the group and with the other clusters (|r| < 0.25), indicating these features capture distinct, complementary timing- and state-based traffic behaviour. Because tree-based ensembles such as Random Forest, Decision Tree, and LightGBM are largely insensitive to multicollinearity, all 16 features were retained for model training rather than removed or combined.
3.3.3. Class Distribution
The value_counts(normalize = True) method confirmed a near-uniform class distribution, with each of the six classes representing approximately 16.67% of the full dataset (≈ 300,000 instances per class), preserved as 60,000 instances per class in the stratified test split (Figure 5). This balance removes class-imbalance bias as a confounding factor in the evaluation of Phase 1 and Phase 2 classifiers.
3.4. Model Implementation
Phase 1 compared three classifiers commonly used in IDS research for their robustness on high-dimensional network traffic data: Random Forest, Decision Tree, and LightGBM. Each was trained with the hyperparameters in Table 6, using the 80% training partition (1,440,000 instances) and all 16 numerical features as input, with sub_label as the target. Phase 2 re-used LightGBM, retrained on the same feature set against the Kill_Chain_Stage target derived in Section 3.2, to classify detected traffic into CKC stages.
3.5. Evaluation Metrics
Model performance was assessed on the held-out 20% test partition using accuracy, precision, recall, and F1-score, computed per class via scikit-learn’s classification_report, together with confusion matrices for error analysis. For a given class, true positives (TP), true negatives (TN), false positives (FP), and false negatives (FN) were defined in the conventional one-vs-rest sense. The metrics were computed as:
These follow standard definitions: recall ([24]), precision ([25]), and F1-score ([26]). To interpret the drivers of Phase 2 classification decisions, split-gain feature importance and SHAP (SHapley Additive exPlanations) analysis were applied to the trained LightGBM CKC classifier, quantifying each feature’s marginal contribution to individual predictions and revealing interaction effects between features.
4. Results
4.1. Intrusion Detection Performance (Phase 1)
Random Forest achieved the highest overall accuracy (99.86%), followed by Decision Tree (99.74%) and LightGBM (95.00%). Table 7 reports per-class precision, recall, and F1-score for all three classifiers. Random Forest and Decision Tree achieved near-perfect scores across all six classes; LightGBM matched this performance for DDoS, DoS, and reconnaissance traffic but showed a measurable drop for benign, Mirai, and web-attack traffic (F1 = 0.91 for each), indicating greater difficulty separating these classes.
4.2. Cyber Kill Chain Stage Classification (Phase 2)
The LightGBM CKC classifier achieved perfect precision, recall, and F1-scores (1.00) for the reconnaissance and delivery stages (DDoS and DoS traffic). Performance was comparatively lower for the exploitation stage (web attacks; precision 0.93, recall 0.89, F1 0.91) and the command-and-control stage (Mirai; precision 0.91, recall 0.91, F1 0.91), with benign traffic showing the same reduced scores (precision 0.89, recall 0.93, F1 0.91) as in Phase 1 (Table 8).
The confusion matrix (Figure 6) shows strong diagonal dominance overall, confirming reliable separation of benign, reconnaissance, and delivery-stage traffic. Misclassification was concentrated between the exploitation and command-and-control stages, and between each of these and benign traffic, indicating that late-stage attack behaviours are harder to separate from normal communication patterns than early- and mid-stage behaviours such as scanning or flooding.
4.3. Model Explainability: Feature Importance and SHAP Analysis
Feature importance (split gain) and SHAP analysis were used to interpret the LightGBM CKC classifier’s predictions (Figure 7 and Figure 8). Table 9 summarises the ten most influential features. Inter-arrival time (IAT) was the dominant feature overall, consistent with its role in distinguishing timing-based attack signatures such as the sustained, high-rate flows characteristic of DDoS traffic. Header length and flow duration were the next most influential, followed by packet rate and urgent-flag counts.
SHAP interaction values corroborated these rankings: flow_duration and syn_count showed the widest interaction spread, particularly in combination with Rate and Protocol Type, explaining the classifier’s near-perfect performance on delivery-stage (DDoS/DoS) and reconnaissance traffic. Interaction effects involving Srate were comparatively weak in isolation but contributed to prediction confidence when combined with Rate and flow_duration, illustrating that low standalone importance does not preclude a meaningful interactive role. The features driving misclassification between benign, exploitation, and command-and-control traffic (chiefly Header_Length and flow_duration) were the same features with only moderate standalone importance, consistent with the subtler behavioural signatures of late-stage attacks noted in Section 4.2.
5. Discussion
5.1. Interpretation of Intrusion Detection Findings
The superior performance of Random Forest and Decision Tree over LightGBM is consistent with prior evaluations of tree-based classifiers on CICIoT2023: [13] similarly found RF and DT outperforming SVM and logistic regression, while [10] reported 99.7% accuracy for RF in binary IoT intrusion detection. The comparatively lower accuracy of LightGBM is plausibly explained by the balanced nature of the dataset used here: boosting methods such as LightGBM typically derive their advantage from focusing learning capacity on under-represented classes, an advantage that is largely neutralised when classes are already near-uniform in size ([27]). This is consistent with [14] observation that LightGBM, while computationally efficient, is more prone to misclassifying traffic in complex multiclass IoT settings than ensemble methods that aggregate multiple tree outputs. In this study, LightGBM’s precision and recall losses were concentrated in benign, Mirai, and web-attack traffic, the same three classes it struggled to separate in the CKC stage classification task (Section 4.2), suggesting a consistent, feature-level source of ambiguity across both phases rather than a phase-specific artefact.
Taken together, these results position Random Forest as the preferred classifier where detection accuracy is the priority, while LightGBM’s markedly lower training and inference cost may still justify its use in SOHO deployments where computational resources are severely constrained ([27]).
5.2. Interpretation of Cyber Kill Chain Classification Findings
Extending detection into CKC stage classification produced near-perfect results for reconnaissance and delivery-stage traffic but weaker performance for exploitation and command-and-control traffic. This gradient mirrors a recurring finding in the literature: late-stage attack behaviours often exhibit subtler signatures that more closely resemble legitimate traffic than early- or mid-stage behaviours such as scanning or flooding ([12]). Mirai command-and-control traffic, for example, typically consists of short, periodic keep-alive packets that can resemble legitimate IoT telemetry ([3]), while web-exploitation traffic (e.g., SQL injection, XSS) can initially resemble ordinary HTTP activity, plausibly explaining the partial misclassification of both stages as benign observed in Section 4.2.
Despite these late-stage challenges, the classifier demonstrates that CKC stage mapping is both feasible and useful within IoT traffic. Distinguishing reconnaissance from delivery, exploitation, and command-and-control activity provides defenders with lifecycle-aware context beyond a binary malicious/benign flag, potentially enabling earlier intervention, for example, blocking traffic at the reconnaissance stage, or disrupting persistence by identifying command-and-control channels. This capability is comparatively novel: while [21] demonstrated CKC-stage mapping using machine learning, their work targeted advanced persistent threats (APTs) rather than IoT traffic, and no directly comparable IoT-specific CKC classifier trained on CICIoT2023 was identified in the reviewed literature.
5.3. Explainability Insights
The integration of SHAP alongside split-gain feature importance served two purposes: clarifying why individual flows were assigned to a given CKC stage, and surfacing which traffic characteristics are most diagnostic of attack-stage behaviour. The consistent prominence of IAT, flow_duration, and Rate across both importance measures (Section 4.3) aligns with [12] finding that TCP flag counts and protocol-level features were critical in distinguishing DDoS subtypes on the same dataset, and reinforces the broader case for timing-based monitoring as an early-warning signal in SOHO deployments. At the same time, features with low standalone importance but meaningful interaction effects (notably Srate) illustrate a limitation of relying on importance rankings alone: some diagnostic signal is only visible through feature interactions, which are more costly to compute and less intuitive for non-specialist defenders to interpret, an issue also raised in the wider explainable-AI-for-cybersecurity literature ([28]).
5.4. Comparison with Related Literature
The Phase 1 results compare favourably with published work on CICIoT2023. [11] reported 97.26% binary and 96.26% multiclass accuracy using a multilayer perceptron; the 99.86% multiclass accuracy achieved here by Random Forest indicates a clear advantage for tree-based ensembles on this dataset. [12] achieved 99.4% accuracy for DoS/DDoS subtypes using CatBoost, closely matching the perfect scores obtained here for the same categories, though without extending to CKC classification. [13] similarly reported near-100% accuracy for Decision Tree and Random Forest on grouped attack categories, consistent with the Phase 1 findings. Beyond CICIoT2023, comparable accuracies have been reported on other IoT and network intrusion datasets, for example [15] with XGBoost on IoT-23/NSL-KDD (99.98%) and [19] with Bi-LSTM on ToN-IoT (99.99%), though generally without the SOHO-specific framing or CKC extension pursued in this study (Figure 9 and Figure 10).
For CKC-specific classification, the closest comparator remains [21], whose APT-focused Naive Bayes classifier achieved 91.1% accuracy. The 95% accuracy achieved here on IoT traffic, combined with the absence of a directly comparable IoT-specific CKC classifier in the reviewed literature, positions this study as an early contribution to operationalising kill-chain-aware detection specifically for IoT and SOHO contexts, an area explicitly identified as under-researched by [9].
5.5. Theoretical, Practical, and Policy Implications
Theoretically, this study extends IoT IDS research beyond binary or multiclass attack detection toward stage-aware classification, responding to calls for kill-chain-informed detection frameworks [9], and contributes one of the first applications of SHAP to CKC stage classification specifically within IoT traffic, identifying IAT, flow duration, and packet rate as the traffic dimensions most diagnostic of attack-stage progression.
Practically, the high accuracy achieved by Random Forest and Decision Tree (>99%) indicates that reliable detection can be deployed on hardware suitable for consumer-grade SOHO routers, while stage-aware classification enables more differentiated incident response, for example, escalating alerts differently depending on whether traffic reflects reconnaissance or active command-and-control activity.
At a policy level, the findings support arguments for embedding baseline detection capability into consumer IoT devices and SOHO routers. This is consistent with warnings from the UK National Cyber Security Centre regarding the systematic exploitation of SOHO devices ([4] and with existing consumer-IoT security guidance such as the UK Code of Practice for Consumer IoT Security ([29]). Evidence that ML-based, stage-aware IDS can be both accurate and computationally lightweight strengthens the case for mandating at least reconnaissance- and delivery-stage detection capability in internet service provider or device-manufacturer security requirements, given the continued exploitation of SOHO devices in large-scale botnet campaigns ([5]).
5.6. Strengths and Limitations
We can summarise the strengths of our study as follows:
- A novel application of CKC stage classification to IoT traffic, an area with very limited prior coverage in the CICIoT2023 literature.
- Use of a class-balanced dataset, mitigating imbalance effects that commonly undermine IDS evaluation.
- Integration of SHAP-based explainability, supporting transparency and trust in the classifier’s decisions.
- Explicit framing around SOHO environments, a segment often overlooked relative to enterprise or industrial IoT security research.
Several limitations should be considered when interpreting these findings:
- CICIoT2023 was collected in a controlled testbed; real-world SOHO traffic may exhibit greater noise and device heterogeneity, limiting generalisability.
- Only four of the seven canonical CKC stages (reconnaissance, delivery, exploitation, command-and-control) were represented, owing to constraints in the underlying dataset labels.
- Deep learning architectures (e.g., LSTM, CNN) were not evaluated, despite reported state-of-the-art results for such models in related IDS work.
- SHAP analysis, while informative, remains computationally intensive and non-trivial to interpret for non-specialist practitioners.
- Random Forest, the most accurate classifier, carries a larger resource footprint than Decision Tree or LightGBM, which may constrain deployment on the lowest-power SOHO hardware.
6. Conclusion
This study developed and evaluated a two-phase, ML-based intrusion detection system for SOHO IoT traffic that extends conventional attack classification into Cyber Kill Chain stage classification, supported by explainable AI. Using the CICIoT2023 six-class dataset, Random Forest and Decision Tree achieved detection accuracies above 99%, while LightGBM offered a favourable accuracy–efficiency trade-off (95%) suited to resource-constrained deployment. Extending detection with a LightGBM-based CKC classifier achieved near-perfect performance for reconnaissance and delivery-stage traffic and robust, though comparatively weaker, performance for exploitation and command-and-control traffic, with SHAP and feature-importance analysis identifying inter-arrival time, flow duration, and packet rate as the dominant drivers of stage classification. The study contributes academically by demonstrating, for IoT traffic specifically, that stage-aware intrusion classification is both feasible and explainable, addressing a gap between conventional binary/multiclass IDS research and kill-chain-informed defence frameworks. Practically, it shows that high-accuracy detection and stage classification can be achieved with models suited to commodity SOHO hardware, while the SHAP-based analysis offers defenders interpretable insight into which traffic characteristics distinguish each stage of an attack. At a policy level, the findings add empirical support to calls for embedding baseline, stage-aware detection capability into consumer IoT devices and SOHO routers. These contributions should be read alongside the limitations discussed in Section 5.6, particularly the controlled-environment origin of the dataset and the restricted coverage of CKC stages. Future work should prioritise: (i) validating the approach on real-world or noisier SOHO traffic; (ii) extending CKC coverage to additional stages, through synthetic data generation or supplementary datasets; (iii) evaluating deep learning architectures (e.g., LSTM, GRU, CNN) for their capacity to resolve the late-stage classification challenges identified here; (iv) exploring federated or edge-based training to address data-privacy constraints in SOHO settings; (v) combining signature-based and ML-based detection for improved robustness; and (vi) simplifying SHAP-based outputs into forms that are directly actionable for non-specialist practitioners.
Author Contributions
Conceptualization, B.A.; methodology, B.A.; validation, E.M. and U.O.; investigation, U.O.; writing—original draft preparation, B.A., E.M. and U.O.; writing—review and editing, B.A., E.M. and U.O.; visualization, U.O; supervision, B.A.; project administration, B.A.; All authors have read and agreed to the published version of the manuscript.
Funding
This research received no external funding.
Institutional Review Board Statement
Not applicable.
Informed Consent Statement
Not applicable.
Data Availability Statement
The original data presented in the study are openly available on the Canadian Institute for Cybersecurity (CIC) Website at https://www.unb.ca/cic/datasets/iotdataset-2023.html.
Conflicts of Interest
The authors declare no conflicts of interest.
References
- Statista. Number of IoT Connected Devices Worldwide 2019–2030; Statista Research Department, 2024. [Google Scholar]
- Micro, Trend. The State of IoT Security. Trend Micro Research. 2020.
- Antonakakis, M.; April, T.; Bailey, M.; Bernhard, M.; Bursztein, E.; Cochran, J.; Durumeric, Z.; Halderman, J.A.; Invernizzi, L.; Kallitsis, M.; et al. Understanding the Mirai botnet. In Proceedings of the 26th USENIX Security Symposium, 2017; pp. 1093–1110. [Google Scholar]
- NCSC. The NCSC and Partners Issue Alert About Evolving Techniques Used by China State-Sponsored Cyber Attackers. National Cyber Security Centre. 2024.
- The Hacker News. Over 1,000 SOHO Devices Hacked in China-Linked LapDogs Cyber Espionage Campaign. 2025. [Google Scholar] [PubMed]
- Cloud, Extech. Cyberattack Disables 600,000 SOHO Routers in US, 2024. [PubMed]
- Anderson, H. Artificial intelligence and its role in modern cybersecurity. J. Inf. Secur. 2018, 12, 45–59. [Google Scholar]
- Hutchins, E.M.; Cloppert, M.J.; Amin, R.M. Intelligence-driven computer network defense informed by analysis of adversary campaigns and intrusion kill chains; Technical report; Lockheed Martin, 2011. [Google Scholar]
- EC-Council. The Cyber Kill Chain: The Seven Steps of a Cyberattack. Cybersecurity Exchange. 2022.
- Neto, E.C.P.; Dadkhah, S.; Ferreira, R.; Zohourian, A.; Lu, R.; Ghorbani, A.A. CICIoT2023: A real-time dataset and benchmark for large-scale attacks in IoT environment. Sensors 2023, 23, 5941. [Google Scholar] [CrossRef] [PubMed]
- Gheni, H.Q.; Al-Yaseen, W.L. Two-step data clustering for improved intrusion detection system using CICIoT2023 dataset. E-Prime – Adv. Electr. Eng. Electron. Energy 2024, 8, 100673. [Google Scholar]
- Hajjouz, A.; Avksentieva, E. Optimizing intrusion detection for DDoS, DoS, and Mirai attack subtypes using hierarchical feature selection and CatBoost on the CICIoT2023 dataset. Data Metadata 2024, 3, 577. [Google Scholar] [CrossRef]
- Kumar, A.G.; Rastogi, A.; Ranga, V. Evaluation of different machine learning classifiers on new IoT dataset CICIoT2023. In Proceedings of the 2024 International Symposium on Communication Systems, Networks and Digital Signal Processing (CSNDSP), 2024; pp. 1–6. [Google Scholar]
- Premalatha, D.V.; Ramanujam, S. Ensemble-based intrusion detection for IoT networks using the CICIoT2023 dataset. J. Inf. Syst. Eng. Manag. 2025, 10, 743–755. [Google Scholar] [CrossRef]
- Balega, M.; Farag, W.; Wu, X.W.; Ezekiel, S.; Good, Z. Enhancing IoT security: Optimizing anomaly detection through machine learning. Electronics 2024, 13, 2148. [Google Scholar] [CrossRef]
- Mahdi, M.A. Secure and efficient IoT networks: An AI and ML-based intrusion detection system. In Proceedings of the 2024 IEEE International Conference on Artificial Intelligence, Internet of Things (AIIoT), 2024; pp. 1–6. [Google Scholar]
- M, S.Y.; P, V.; Pinto, C.; Correia, N.E.; Miranda, M.C.; Dsouza, J.R. SmartDefend – IoT security using machine learning. In Proceedings of the 2024 IEEE International Conference on Distributed Computing, VLSI, Electrical Circuits and Robotics (DISCOVER), 2024; pp. 109–114. [Google Scholar]
- Rashid, M.M.; Kamruzzaman, J.; Hassan, M.M.; Imam, T.; Gordon, S. Cyberattacks detection in IoT-based smart city applications using machine learning techniques. Int. J. Environ. Res. Public Health 2020, 17, 9347. [Google Scholar] [CrossRef] [PubMed]
- Soliman, S.; Oudah, W.; Aljuhani, A. Deep learning-based intrusion detection approach for securing industrial Internet of Things. Alex. Eng. J. 2023, 81, 371–383. [Google Scholar] [CrossRef]
- El-Sofany, H.; El-Seoud, S.A.; Karam, O.H.; Bouallegue, B. Using machine learning algorithms to enhance IoT system security. Sci. Rep. 2024, 14, 12077. [Google Scholar] [CrossRef] [PubMed]
- Ahmed, A.; Mahmood, A.; Hu, J. A machine learning framework for mapping alerts to cyber kill chain stages for APT detection. J. Inf. Secur. Appl. 2021, 60, 102860. [Google Scholar]
- Available online: https://www.kaggle.com/datasets/hassan06/nslkdd.
- Available online: https://www.kaggle.com/datasets/mrwellsdavid/unsw-nb15.
- Powers, D.M.W. Evaluation: From precision, recall and F-measure to ROC, informedness, markedness and correlation. J. Mach. Learn. Technol. 2011, 2, 37–63. [Google Scholar]
- Han, J.; Kamber, M.; Pei, J. Data Mining: Concepts and Techniques, 3rd ed.; Morgan Kaufmann: Waltham, MA, 2012. [Google Scholar]
- Sammut, C.; Webb, G.I. (Eds.) Encyclopedia of Machine Learning; Springer: New York, 2010. [Google Scholar]
- Ke, G.; Meng, Q.; Finley, T.; Wang, T.; Chen, W.; Ma, W.; Ye, Q.; Liu, T.Y. LightGBM: A highly efficient gradient boosting decision tree. In Proceedings of the Advances in Neural Information Processing Systems (NeurIPS), 2017; Vol. 30. [Google Scholar]
- Holzinger, A.; Saranti, A.; Molnar, C.; Biecek, P.; Samek, W. Explainable AI in cybersecurity: State-of-the-art and future directions. Inf. Fusion 2022, 81, 84–102. [Google Scholar]
- DCMS. Code of Practice for Consumer IoT Security. Technical report, 2021; UK Department for Digital, Culture, Media and Sport. [Google Scholar]
Figure 1.
Overview of the two-phase research methodology from data collection through preprocessing, model development and evaluation, to CKC model analysis.
Figure 1.
Overview of the two-phase research methodology from data collection through preprocessing, model development and evaluation, to CKC model analysis.
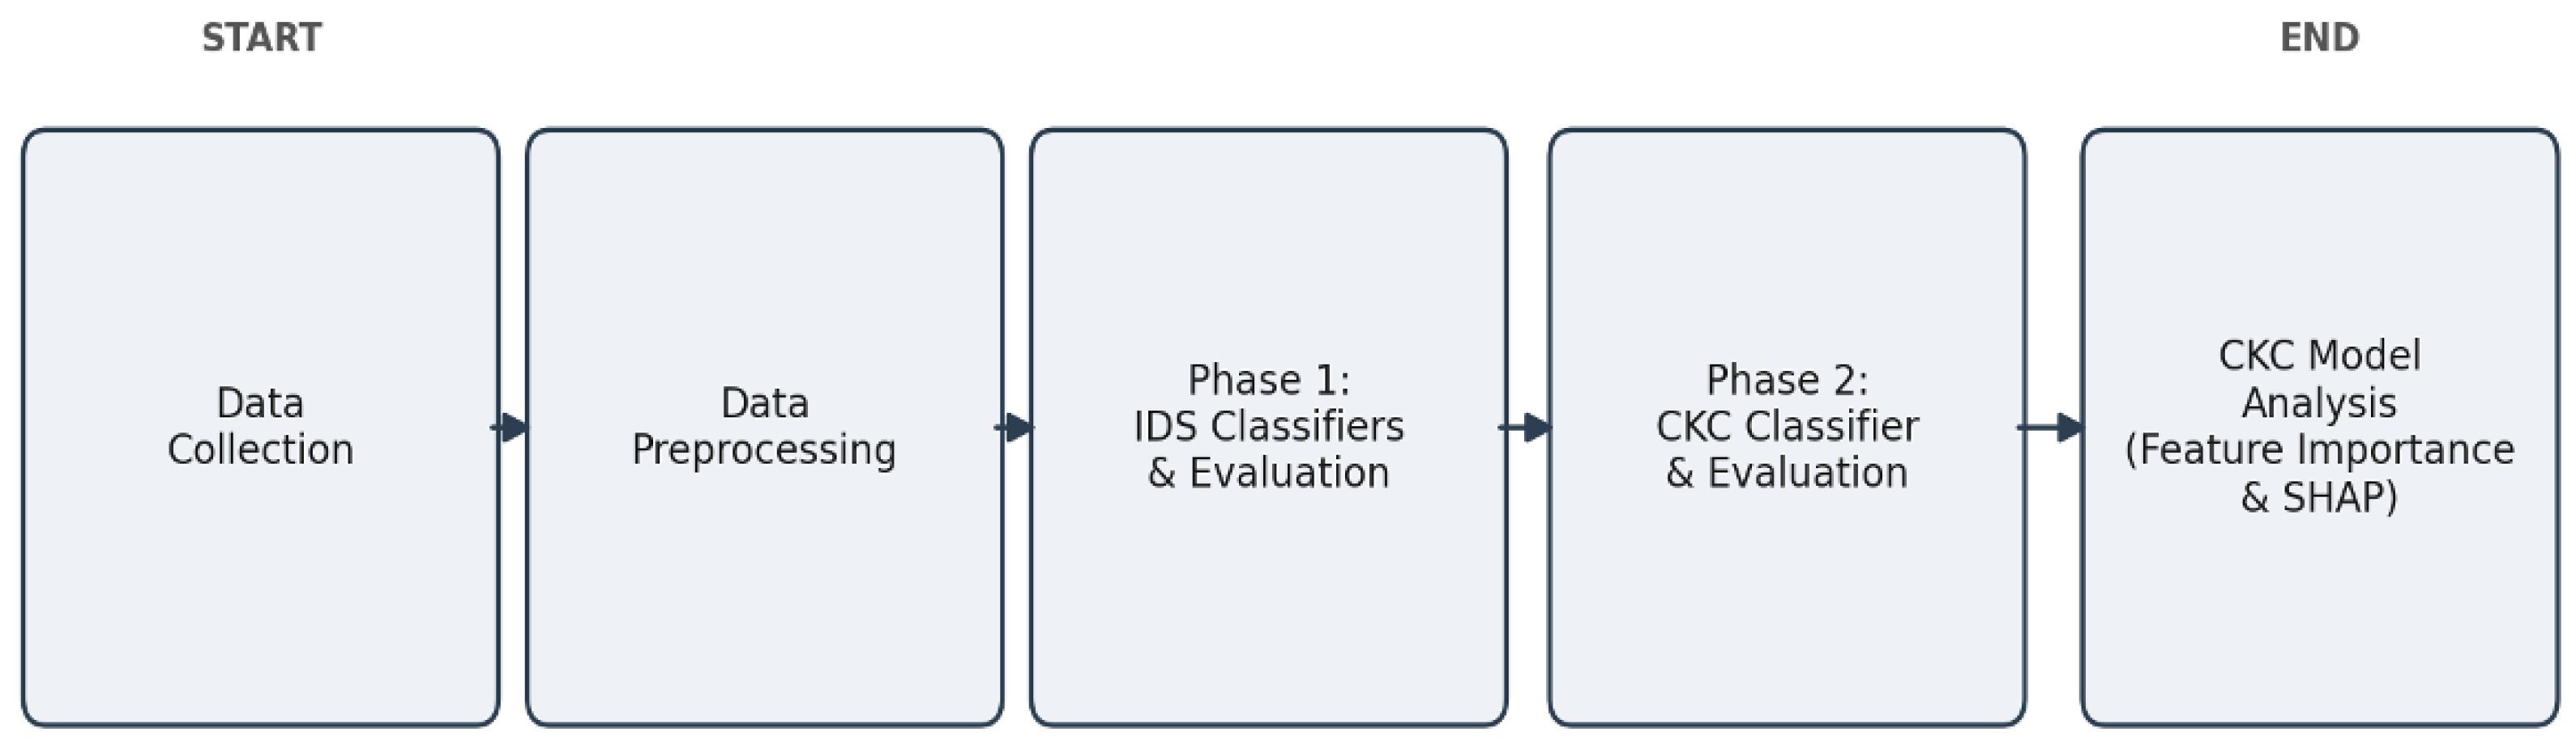
Figure 2.
Output of the pandas info() method describing the structure of the CICIoT2023 six-class dataset
Figure 2.
Output of the pandas info() method describing the structure of the CICIoT2023 six-class dataset

Figure 3.
Output of the pandas describe() method showing summary statistics for the numerical features.
Figure 3.
Output of the pandas describe() method showing summary statistics for the numerical features.
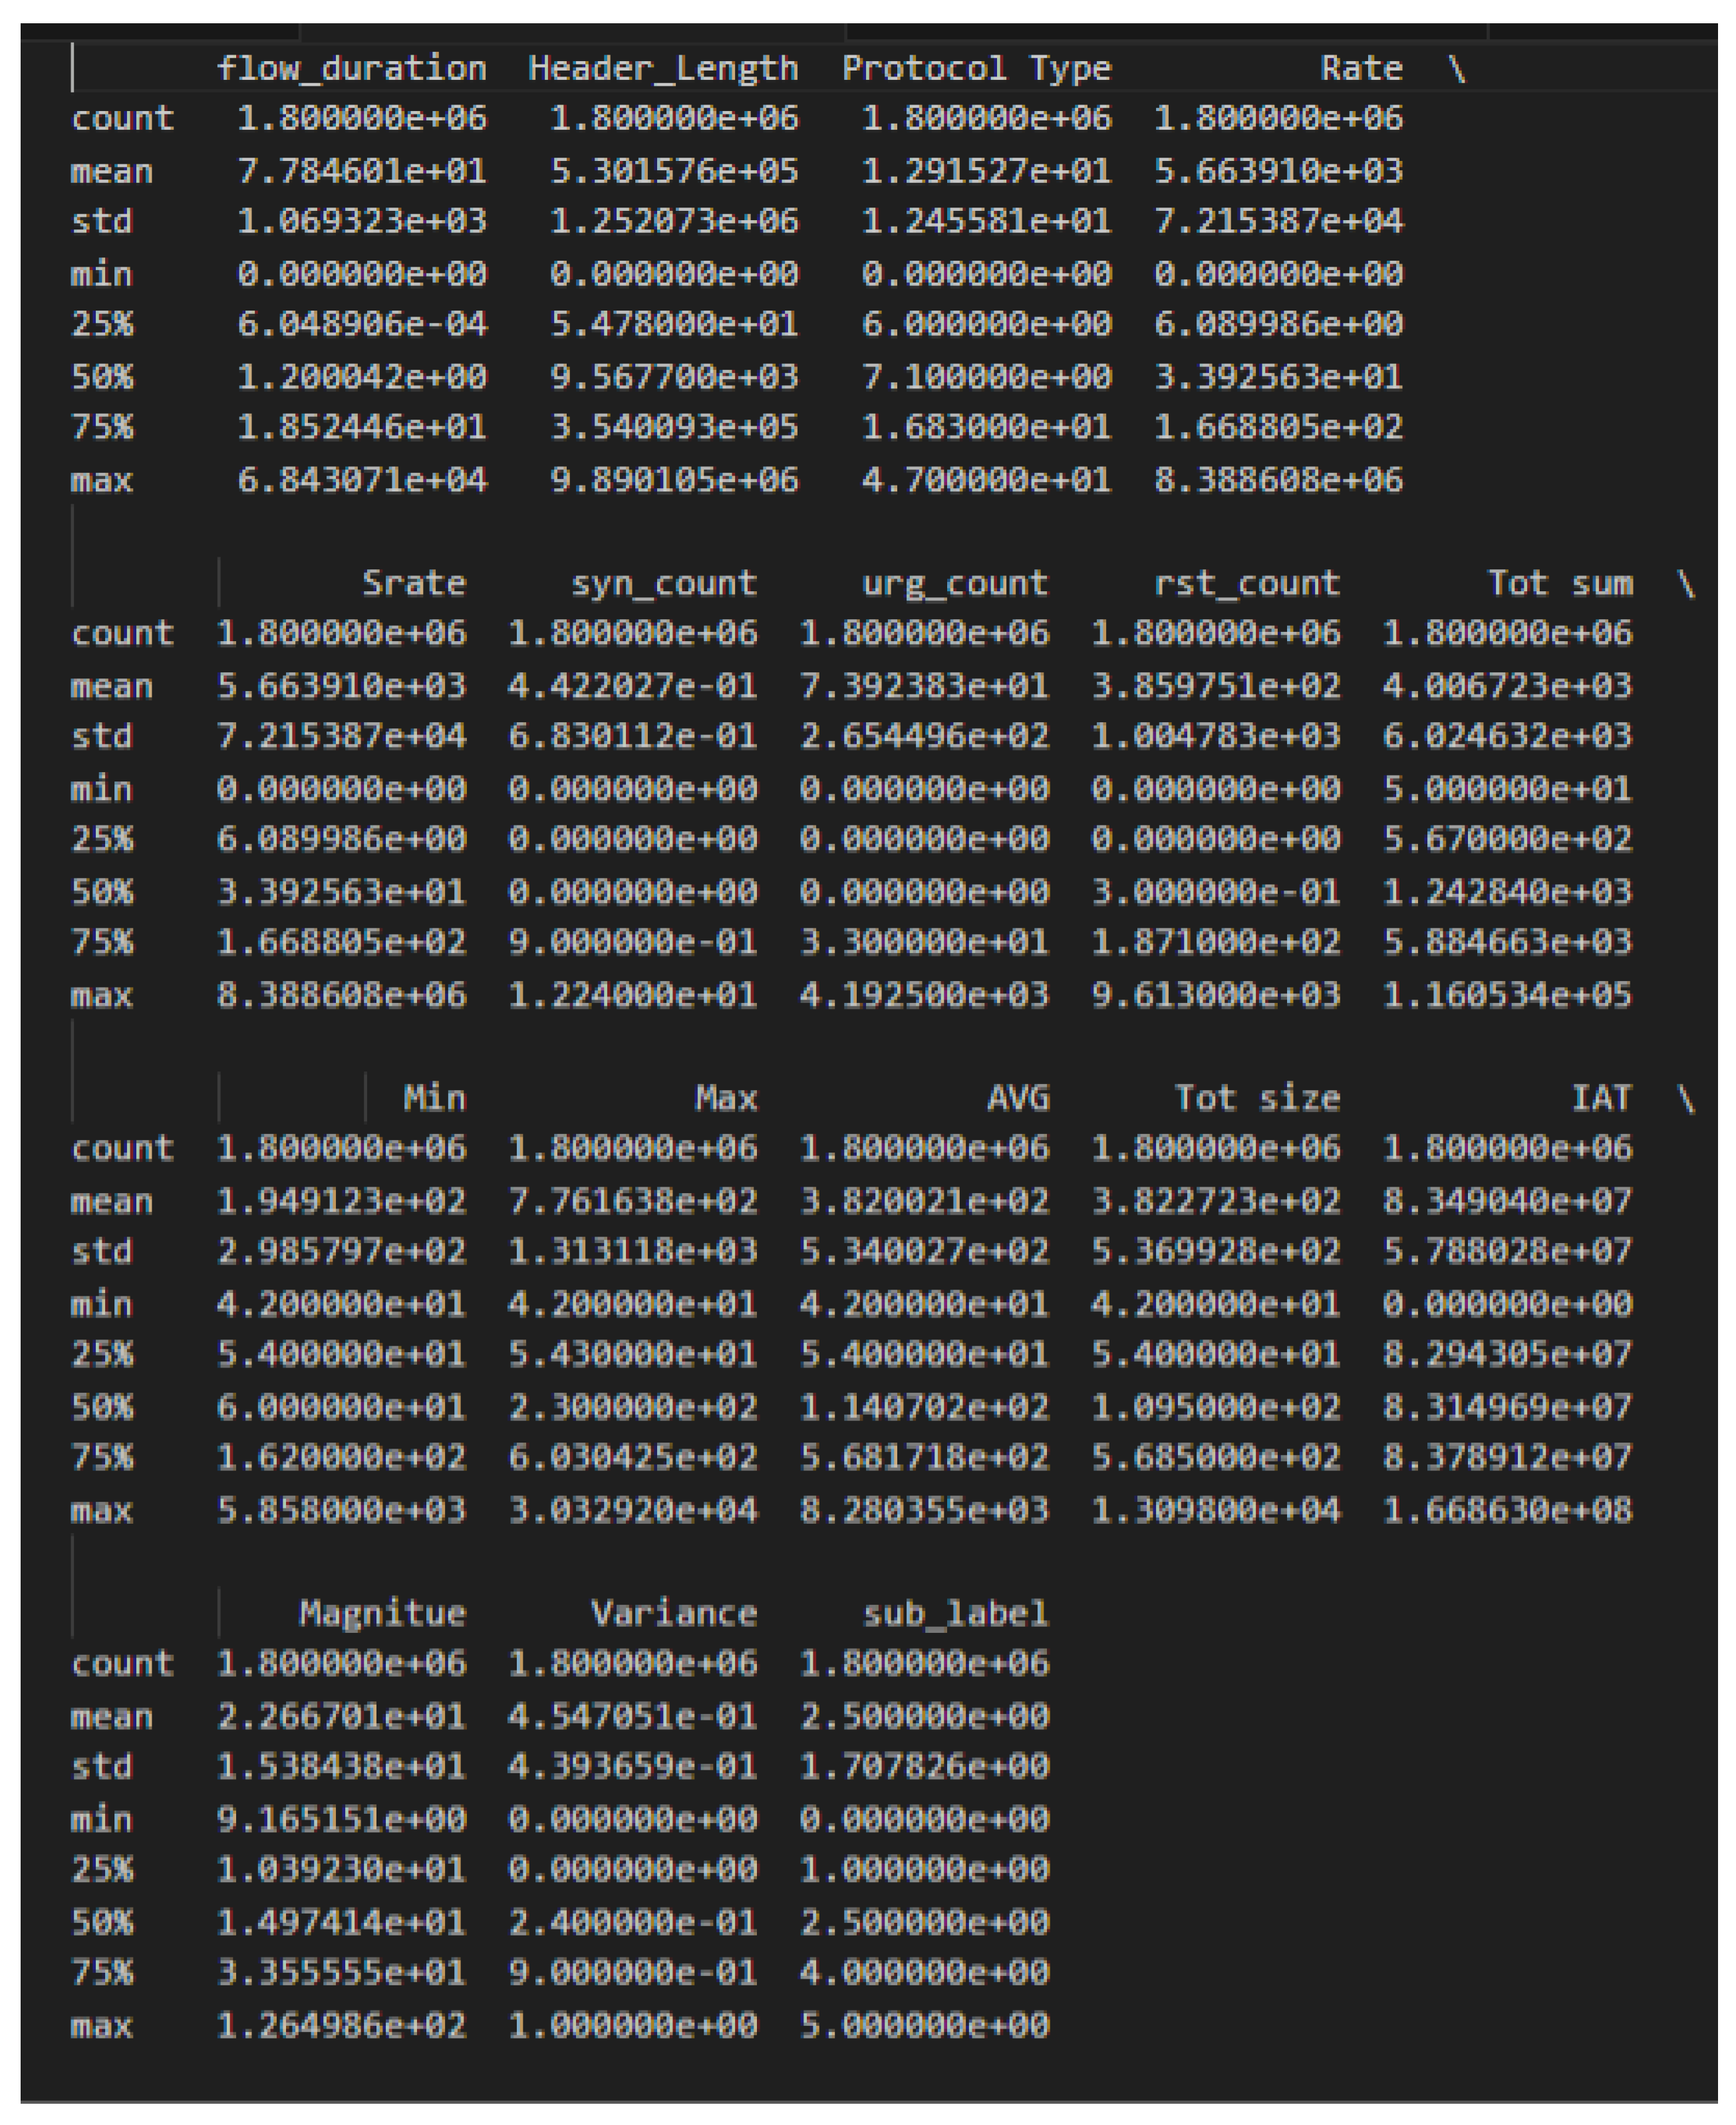
Figure 4.
Clustered correlation heatmap of the twenty most influential dataset features.
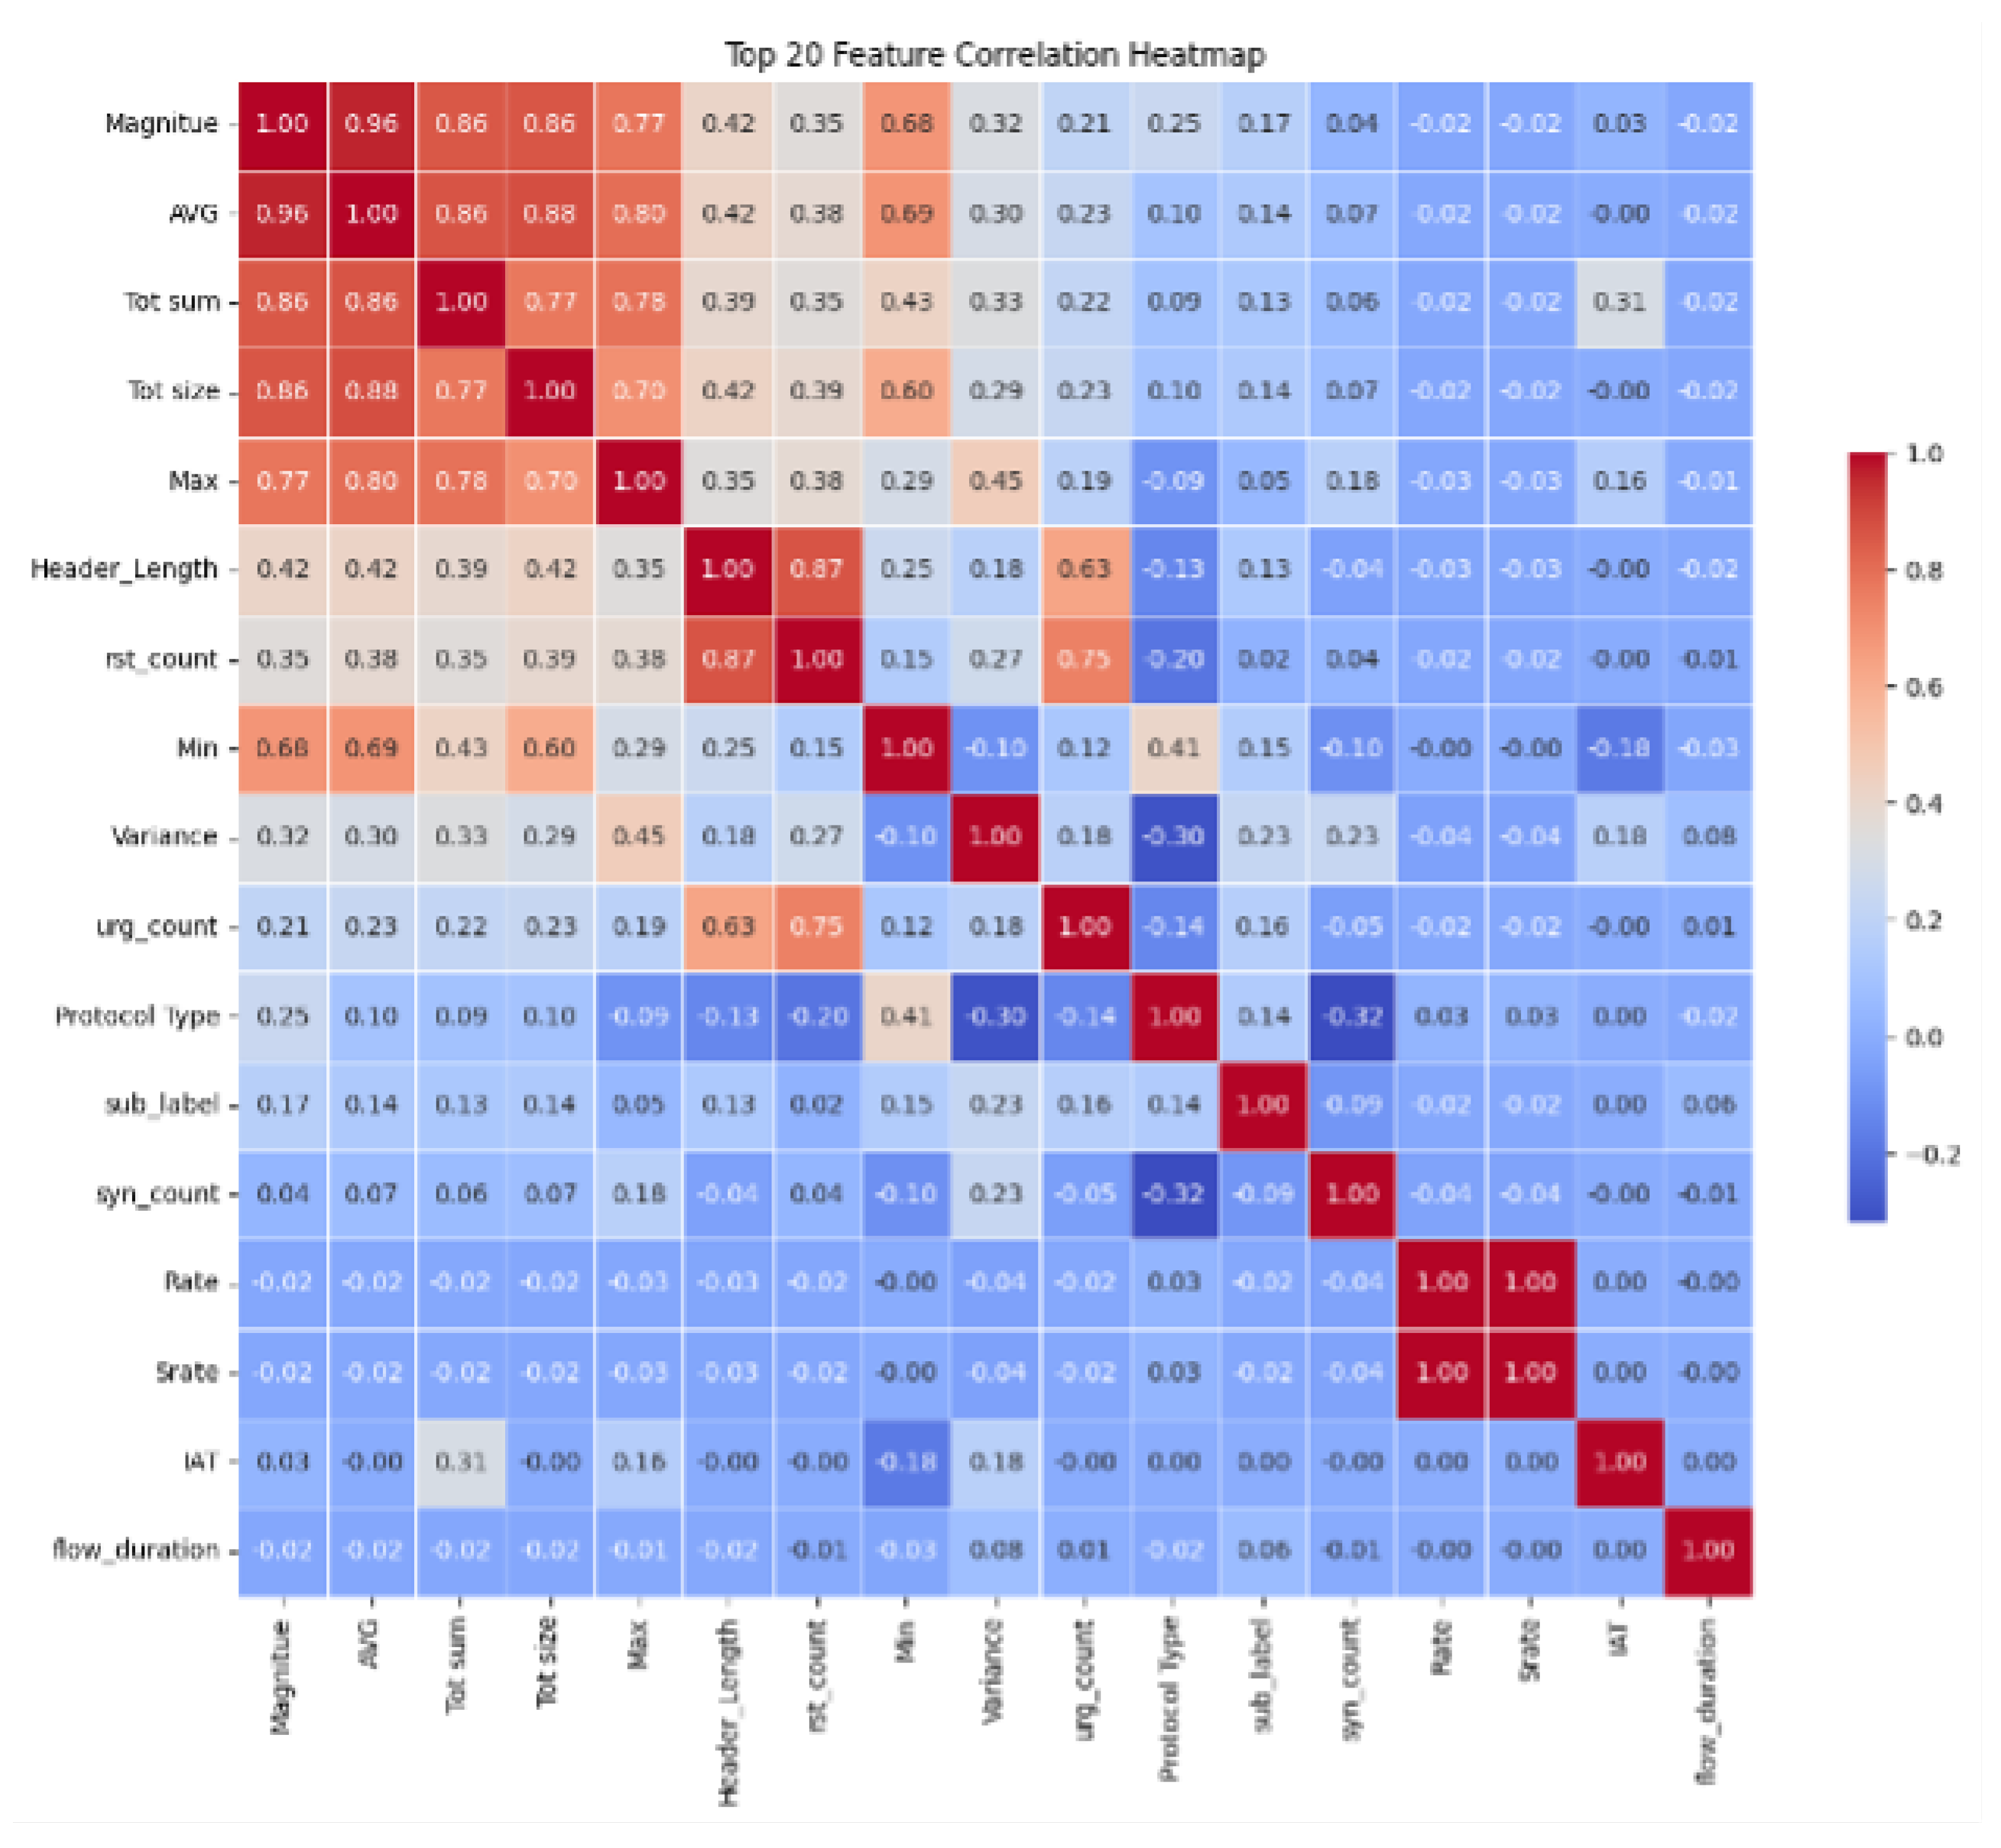
Figure 5.
Distribution of the six traffic classes in the CICIoT2023 dataset.
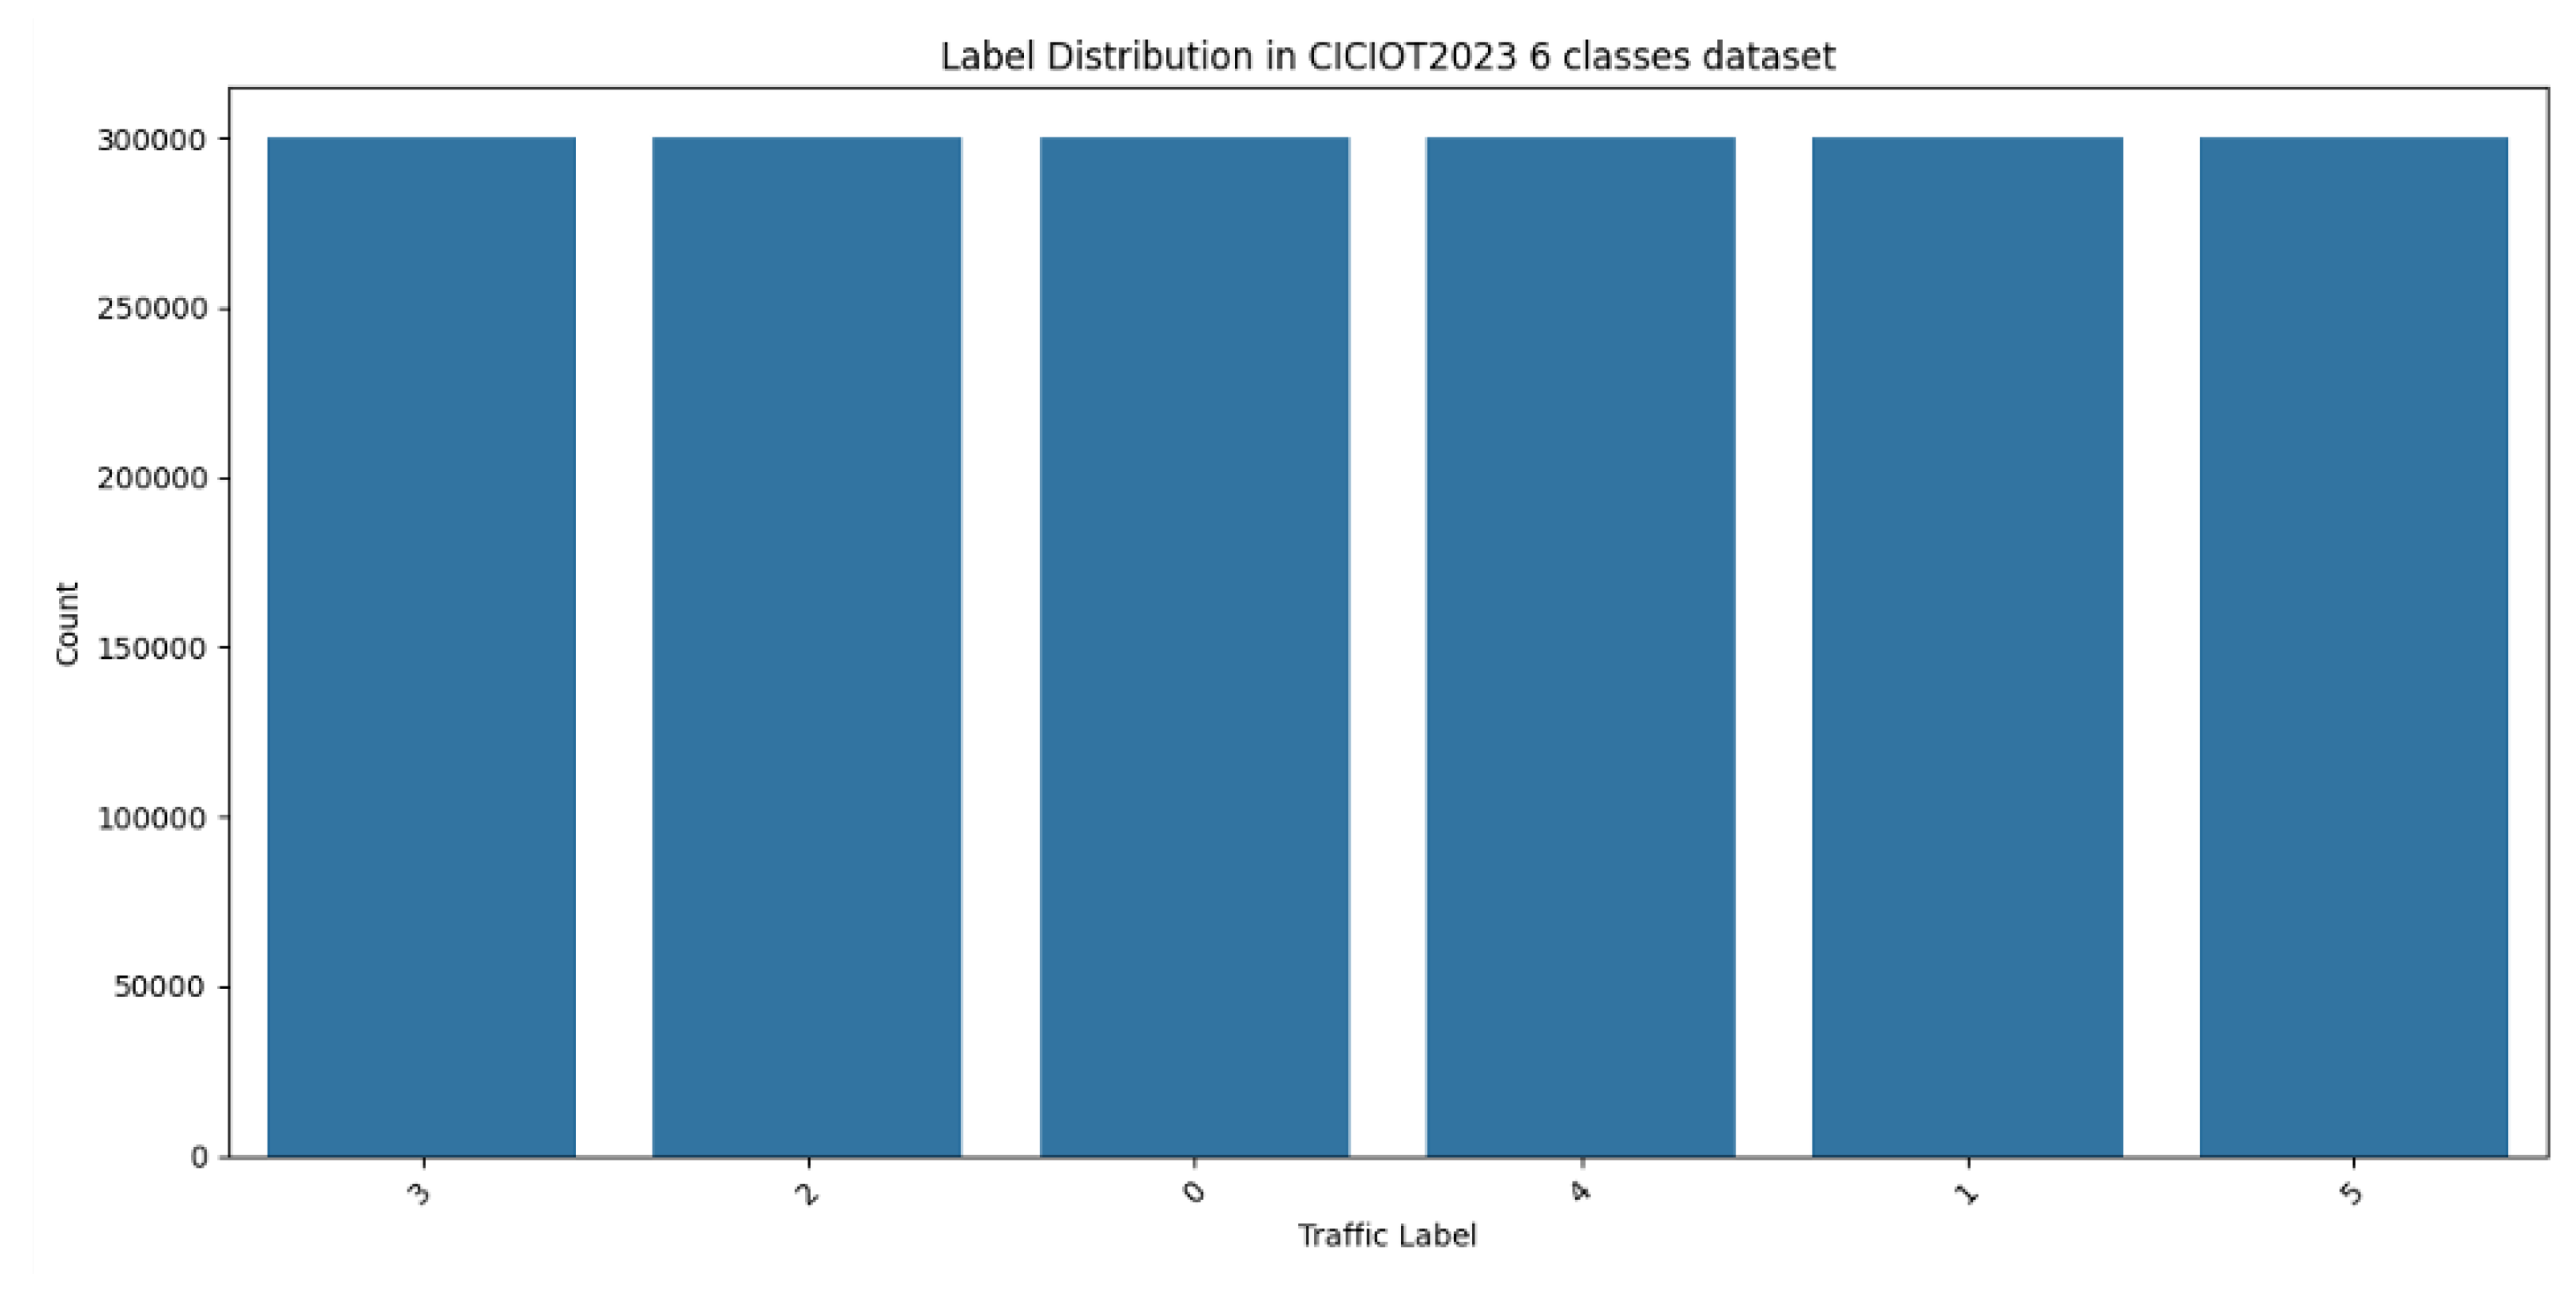
Figure 6.
Confusion matrix for the LightGBM Cyber Kill Chain stage classifier.
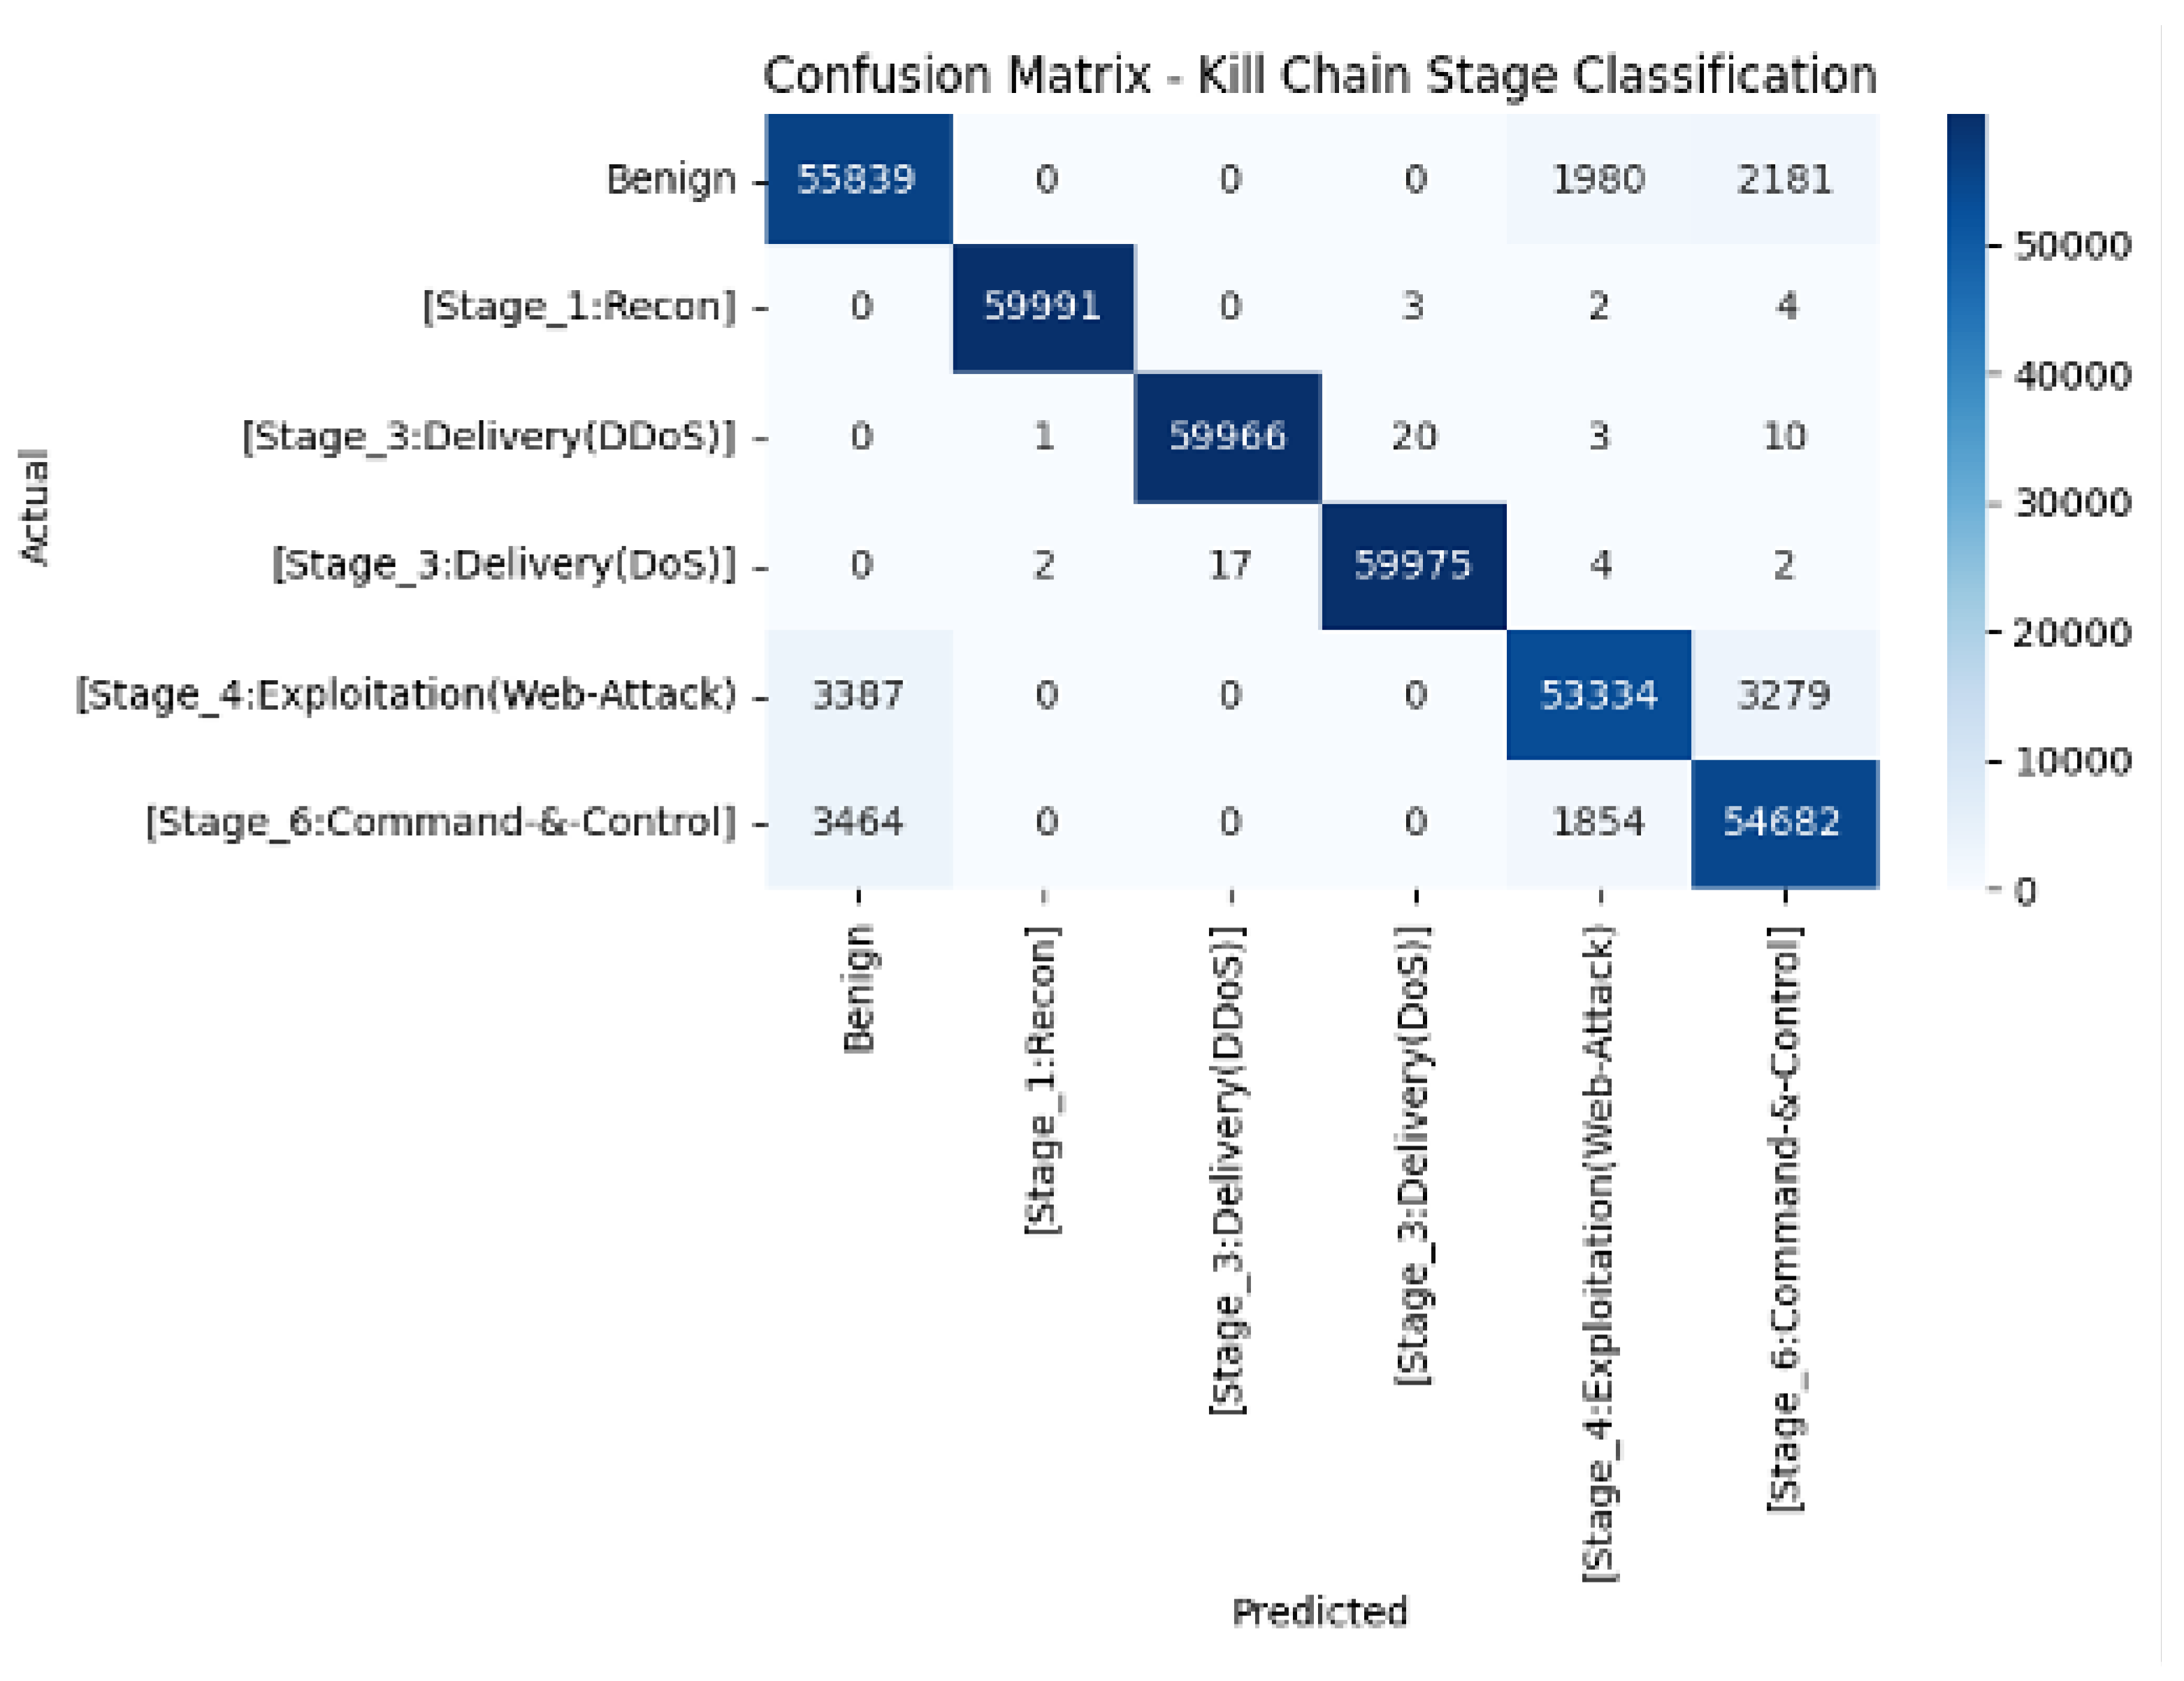
Figure 7.
SHAP interaction-value summary for the LightGBM Cyber Kill Chain stage classifier.
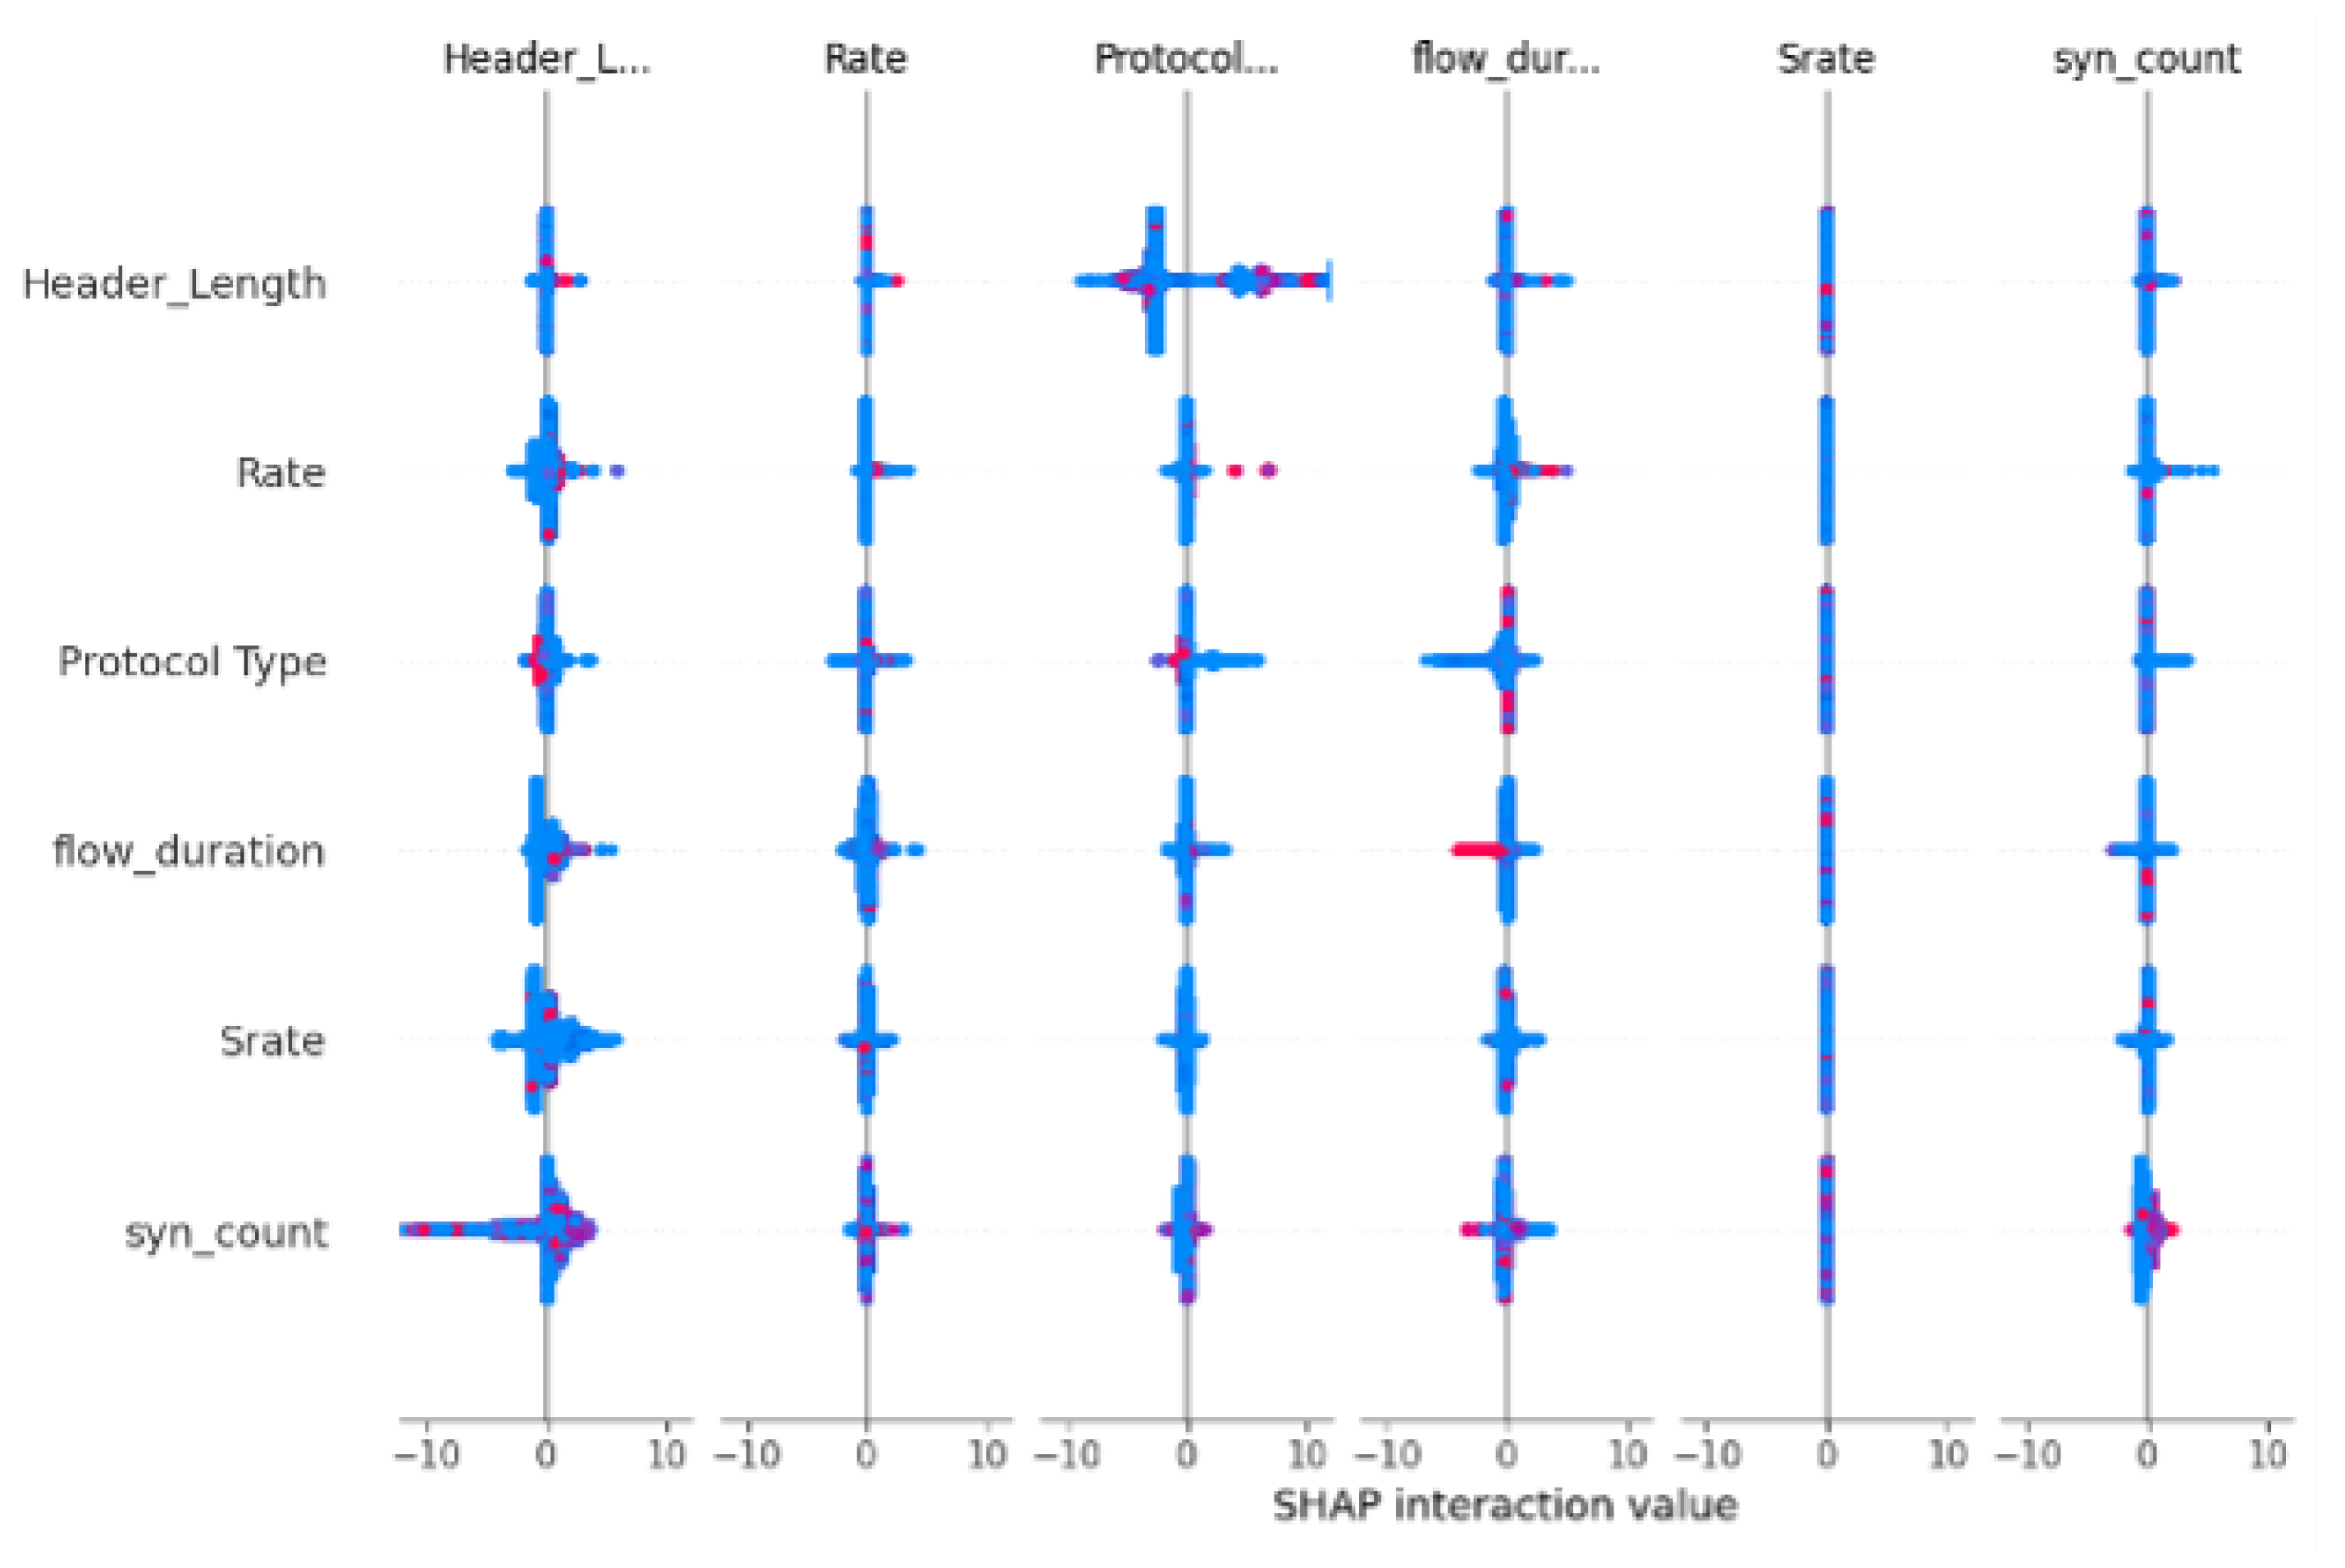
Figure 8.
Split-gain feature importance for the LightGBM Cyber Kill Chain stage classifier.
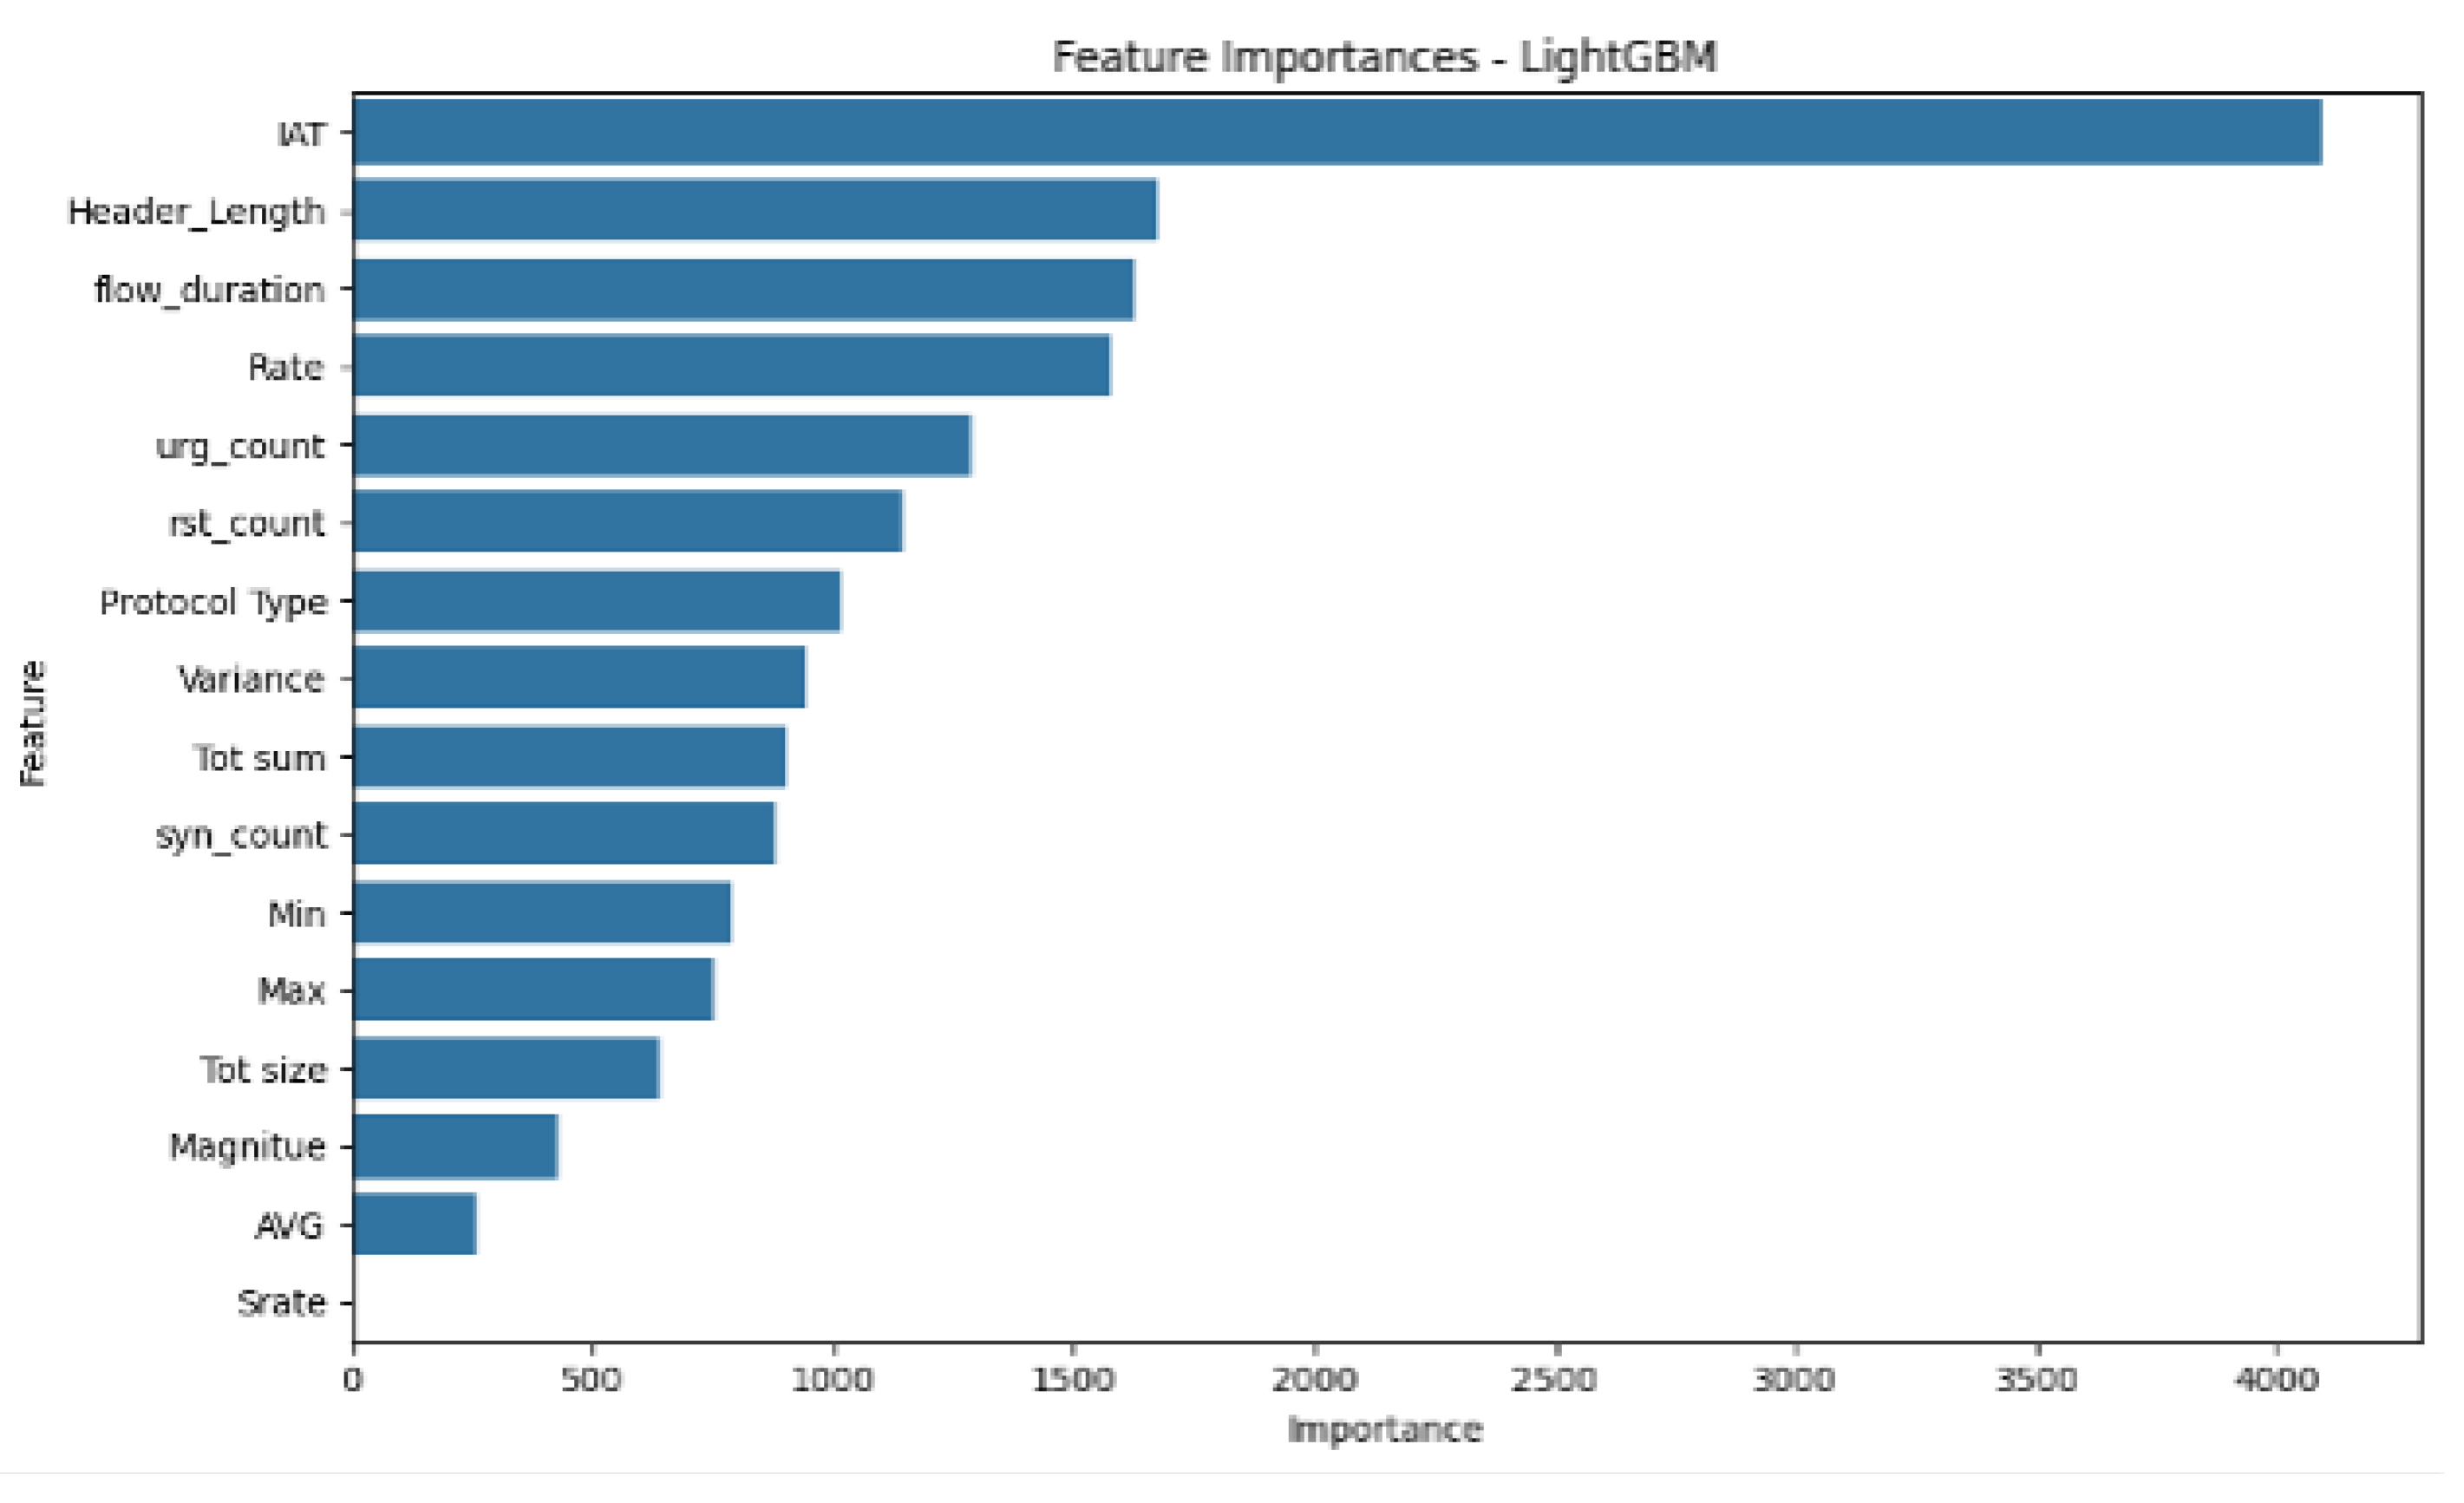
Figure 9.
Comparison of this study’s classification accuracy against related literature, ordered chronologically.
Figure 9.
Comparison of this study’s classification accuracy against related literature, ordered chronologically.
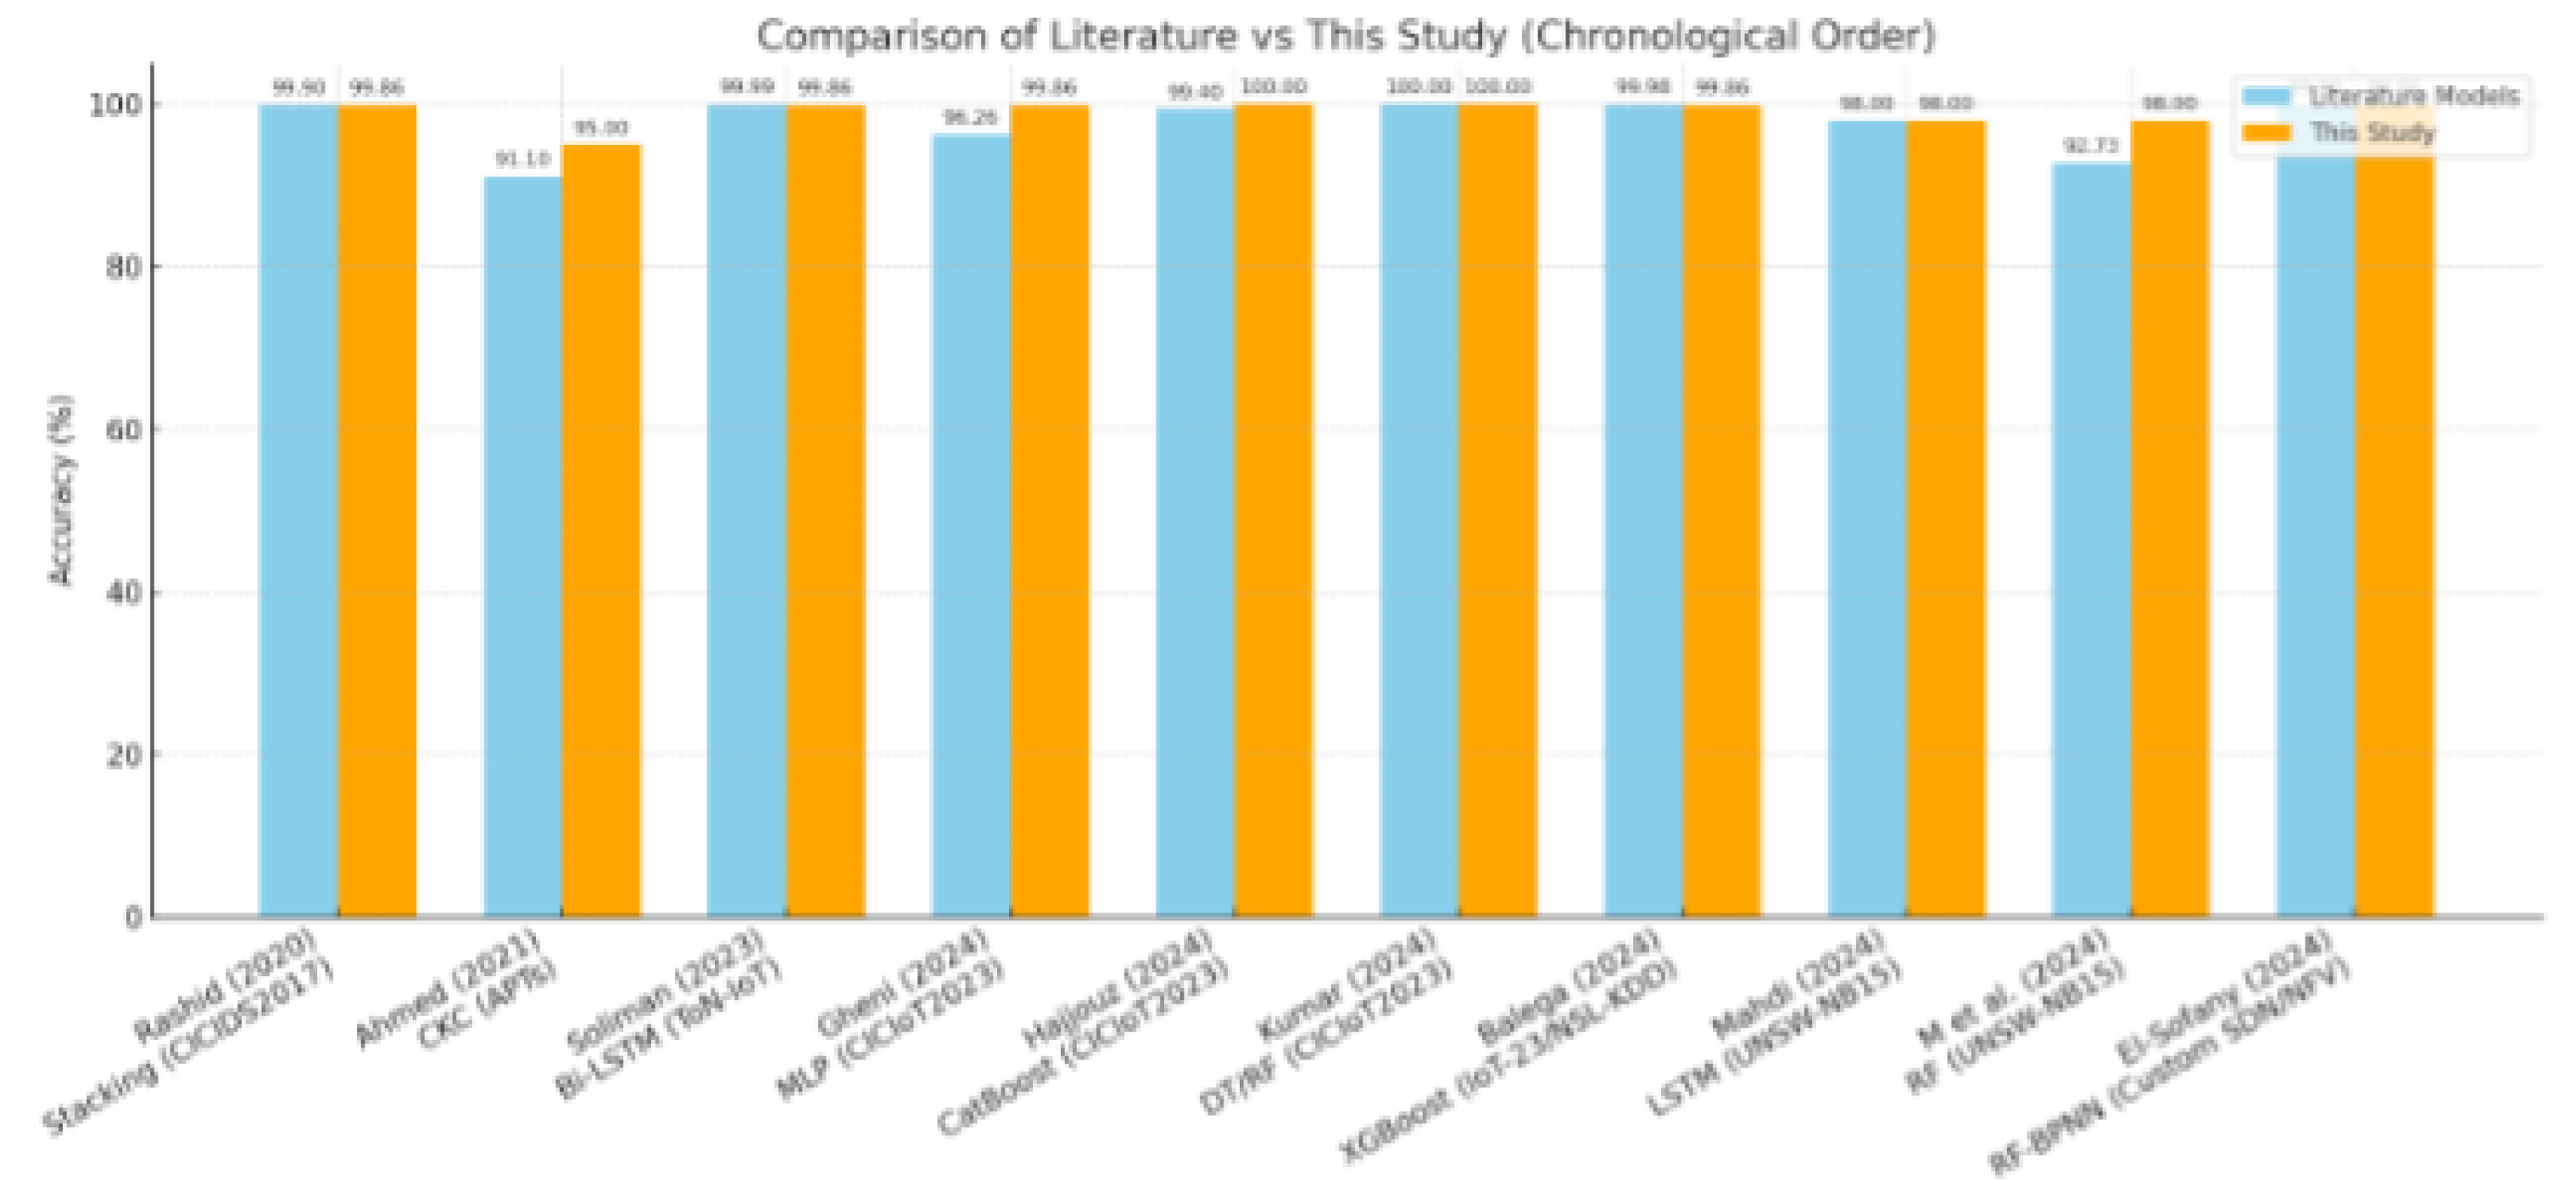
Figure 10.
Comparison of this study’s classification accuracy against related literature, grouped by dataset.
Figure 10.
Comparison of this study’s classification accuracy against related literature, grouped by dataset.
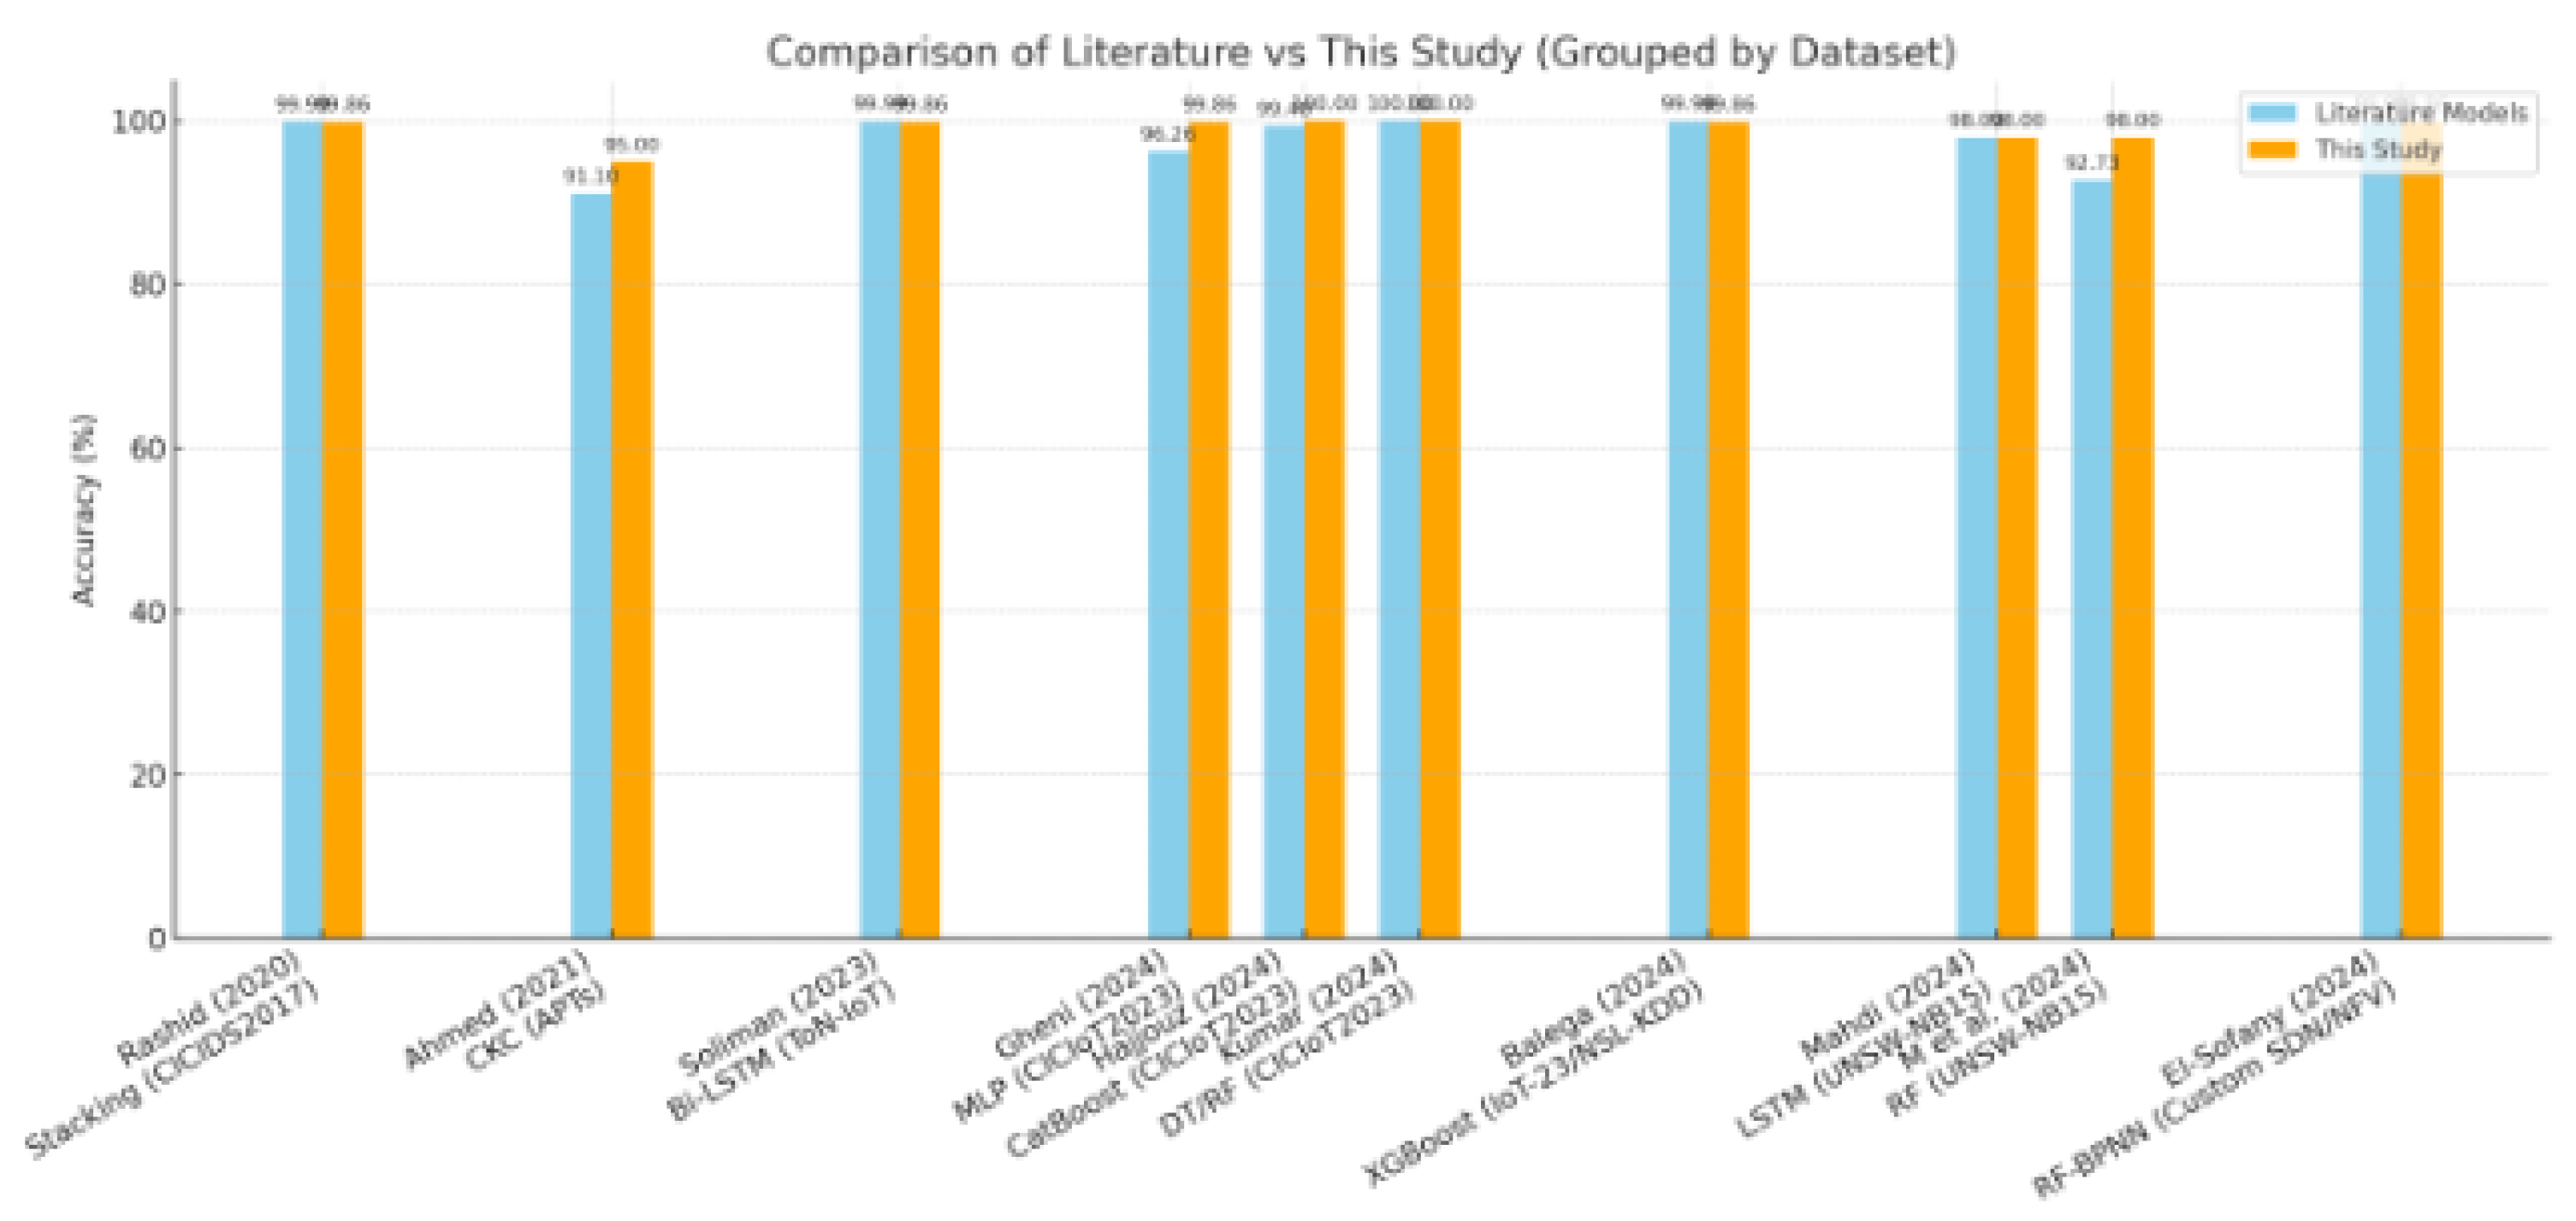

Table 1.
Coverage of dataset, ML-based IoT security and CKC classification across the reviewed literature.
Table 1.
Coverage of dataset, ML-based IoT security and CKC classification across the reviewed literature.
| Study | CICIoT2023 dataset | ML-based IoT security | CKC classifier |
|---|---|---|---|
| Gheni and Al-Yaseen (2024) | ✓ | ✓ | × |
| Hajjouz and Avksentieva (2024) | ✓ | ✓ | × |
| Kumar, Rastogi and Ranga (2024) | ✓ | ✓ | × |
| Premalatha and Ramanujam (2025) | ✓ | ✓ | × |
| Neto et al. (2023) | ✓ | ✓ | × |
| Balega et al. (2024) | × | ✓ | × |
| Mahdi (2024) | × | ✓ | × |
| M et al. (2024) | × | ✓ | × |
| Rashid et al. (2020) | × | ✓ | × |
| Soliman et al. (2023) | × | ✓ | × |
| El-Sofany et al. (2024) | × | ✓ | × |
| Ahmed et al. (2021) | × | × | ✓ |
| This study (2025) | ✓ | ✓ | ✓ |
Table 2.
Attack categories represented by the sub_label field.
| sub_label | Category | Constituent attack types |
|---|---|---|
| 0 | Benign | — |
| 1 | DDoS | ACK fragmentation, UDP flood, SlowLoris, ICMP flood, RSTFIN flood, PSHACK flood, HTTP flood, UDP fragmentation, TCP flood, SYN flood, SynonymousIP flood |
| 2 | DoS | TCP flood, HTTP flood, SYN flood, UDP flood |
| 3 | Reconnaissance | Ping sweep, OS scan, vulnerability scan, port scan, host discovery |
| 4 | Mirai | GREIP flood, GREETH flood, UDPPlain |
| 5 | Web attack | SQL injection, command injection, backdoor malware, upload attack, XSS, browser hijacking |
Table 3.
Description of the numerical features in the dataset.
| Feature | Description |
|---|---|
| flow_duration | Duration of the network flow (s) |
| Header_Length | Total length of packet headers (bytes) |
| Protocol Type | Encoded network protocol (e.g., TCP = 6, UDP = 17, GRE = 47) |
| Rate, Srate | Overall and source packet transmission rate (packets/s) |
| syn_count, urg_count, rst_count | Counts of TCP SYN, URG, and RST flags in the flow |
| Tot sum, Min, Max, AVG, Tot size | Packet-size statistics for the flow |
| IAT | Inter-arrival time between packets |
| Magnitude, Variance | Derived packet-size magnitude and variance measures |
Table 4.
Mapping of CICIoT2023 attack categories onto CKC stages.
| Attack category | CKC stage | Rationale |
|---|---|---|
| Benign | Not mapped (baseline) | Legitimate traffic; retained only to differentiate normal from malicious behaviour |
| DDoS | Stage 3 – Delivery | Flood traffic is delivered directly to the victim to exhaust resources and deny service |
| DoS | Stage 3 – Delivery | As DDoS, but launched from a single source rather than a distributed botnet (Mirkovic and Reiher, 2004) |
| Reconnaissance | Stage 1 – Reconnaissance | Probing of ports, services, and hosts to gather information prior to exploitation |
| Mirai | Stage 6 – Command & Control | Compromised devices connect to a C2 infrastructure for persistent remote control |
| Web attack | Stage 4 – Exploitation | Exploits web-service vulnerabilities (e.g., SQL injection, XSS) to gain unauthorised access |
Table 5.
Descriptive statistics for selected features of the CICIoT2023 six-class dataset.
| Feature | Mean | Std. dev. | Min | Max |
|---|---|---|---|---|
| flow_duration (s) | 77.85 | 1,069.32 | 0.00 | 68,430.71 |
| Header_Length | 530,157.6 | 1,234,567.8 | 0.00 | 9,890,105 |
| Protocol Type | 12.92 | 15.34 | – | – |
| Rate / Srate | 5,663.91 | 125,432.1 | – | 8,388,608 |
| syn_count | 0.44 | 2.10 | – | – |
| urg_count | 73.92 | 245.60 | – | – |
| rst_count | 385.98 | 1,234.50 | – | – |
| Tot sum | 4,006.72 | 5,678.90 | – | – |
| IAT | 83,490,400 | – | – | |
| Variance | 0.45 | 1.20 | – | – |
Table 6.
Classifier hyperparameters used in Phase 1 (intrusion detection) and Phase 2 (CKC stage classification).
Table 6.
Classifier hyperparameters used in Phase 1 (intrusion detection) and Phase 2 (CKC stage classification).
| Classifier | Phase | Hyperparameters |
|---|---|---|
| Random Forest | 1 | n_estimators = 100; max_depth = None; random_state = 42 |
| Decision Tree | 1 | criterion = ’gini’; max_depth = None; random_state = 42 |
| LightGBM | 1 and 2 | n_estimators = 100; learning_rate = 0.1; random_state = 42 |
Table 7.
Per-class precision (P), recall (R), and F1-score (F1) for the three Phase 1 classifiers on the held-out test set (support = 60,000 per class for Random Forest and LightGBM; Decision Tree support varies slightly, 59,581–60,330, owing to stratified split rounding).
Table 7.
Per-class precision (P), recall (R), and F1-score (F1) for the three Phase 1 classifiers on the held-out test set (support = 60,000 per class for Random Forest and LightGBM; Decision Tree support varies slightly, 59,581–60,330, owing to stratified split rounding).
| Random Forest | Decision Tree | LightGBM | |||||||
|---|---|---|---|---|---|---|---|---|---|
| Class | P | R | F1 | P | R | F1 | P | R | F1 |
| Benign | 1.00 | 0.99 | 1.00 | 1.00 | 0.99 | 1.00 | 0.89 | 0.93 | 0.91 |
| DDoS | 1.00 | 1.00 | 1.00 | 1.00 | 1.00 | 1.00 | 1.00 | 1.00 | 1.00 |
| DoS | 1.00 | 1.00 | 1.00 | 1.00 | 1.00 | 1.00 | 1.00 | 1.00 | 1.00 |
| Reconnaissance | 1.00 | 1.00 | 1.00 | 1.00 | 1.00 | 1.00 | 1.00 | 1.00 | 1.00 |
| Mirai | 1.00 | 1.00 | 1.00 | 0.99 | 1.00 | 1.00 | 0.91 | 0.91 | 0.91 |
| Web attack | 1.00 | 1.00 | 1.00 | 0.99 | 1.00 | 1.00 | 0.93 | 0.89 | 0.91 |
| Overall accuracy | 0.9986 | 0.9974 | 0.9500 | ||||||
Table 8.
LightGBM classification report for Cyber Kill Chain stage classification (Phase 2).
| CKC stage | Precision | Recall | F1-score | Support |
|---|---|---|---|---|
| Benign (baseline) | 0.89 | 0.93 | 0.91 | 60,000 |
| Stage 3 – Delivery (DDoS) | 1.00 | 1.00 | 1.00 | 60,000 |
| Stage 3 – Delivery (DoS) | 1.00 | 1.00 | 1.00 | 60,000 |
| Stage 1 – Reconnaissance | 1.00 | 1.00 | 1.00 | 60,000 |
| Stage 6 – Command & Control | 0.91 | 0.91 | 0.91 | 60,000 |
| Stage 4 – Exploitation (web attack) | 0.93 | 0.89 | 0.91 | 60,000 |
Table 9.
Ten most influential features for CKC stage classification, ranked by split-gain importance.
Table 9.
Ten most influential features for CKC stage classification, ranked by split-gain importance.
| Rank | Feature | Approx. importance | Primary role |
|---|---|---|---|
| 1 | IAT | 4,000 | Timing-based anomaly detection; dominant driver of delivery-stage (DDoS/DoS) classification |
| 2 | Header_Length | 2,100 | Packet-structure analysis; supports benign vs. attack separation |
| 3 | flow_duration | 2,000 | Duration-based differentiation of sustained attacks |
| 4 | Rate | 1,900 | Traffic-intensity indicator, complements IAT and flow_duration for delivery-stage detection |
| 5 | urg_count | 1,600 | Urgent-flag behaviour associated with attack traffic |
| 6 | rst_count | 1,400 | Connection-reset behaviour |
| 7 | Protocol_Type | 1,300 | Protocol-specific context (e.g., TCP/UDP vs. HTTP) |
| 8 | Variance | 1,200 | Packet-size consistency |
| 9 | Tot_sum | 1,100 | Total data-volume indicator |
| 10 | syn_count | 1,000 | Connection-initiation behaviour, supports reconnaissance detection |
Disclaimer/Publisher’s Note: The statements, opinions and data contained in all publications are solely those of the individual author(s) and contributor(s) and not of MDPI and/or the editor(s). MDPI and/or the editor(s) disclaim responsibility for any injury to people or property resulting from any ideas, methods, instructions or products referred to in the content. |
© 2026 by the authors. Licensee MDPI, Basel, Switzerland. This article is an open access article distributed under the terms and conditions of the Creative Commons Attribution (CC BY) license (http://creativecommons.org/licenses/by/4.0/).
Copyright: This open access article is published under a Creative Commons CC BY 4.0 license, which permit the free download, distribution, and reuse, provided that the author and preprint are cited in any reuse.