

Submitted:
03 September 2026
Posted:
07 September 2026
You are already at the latest version
Abstract
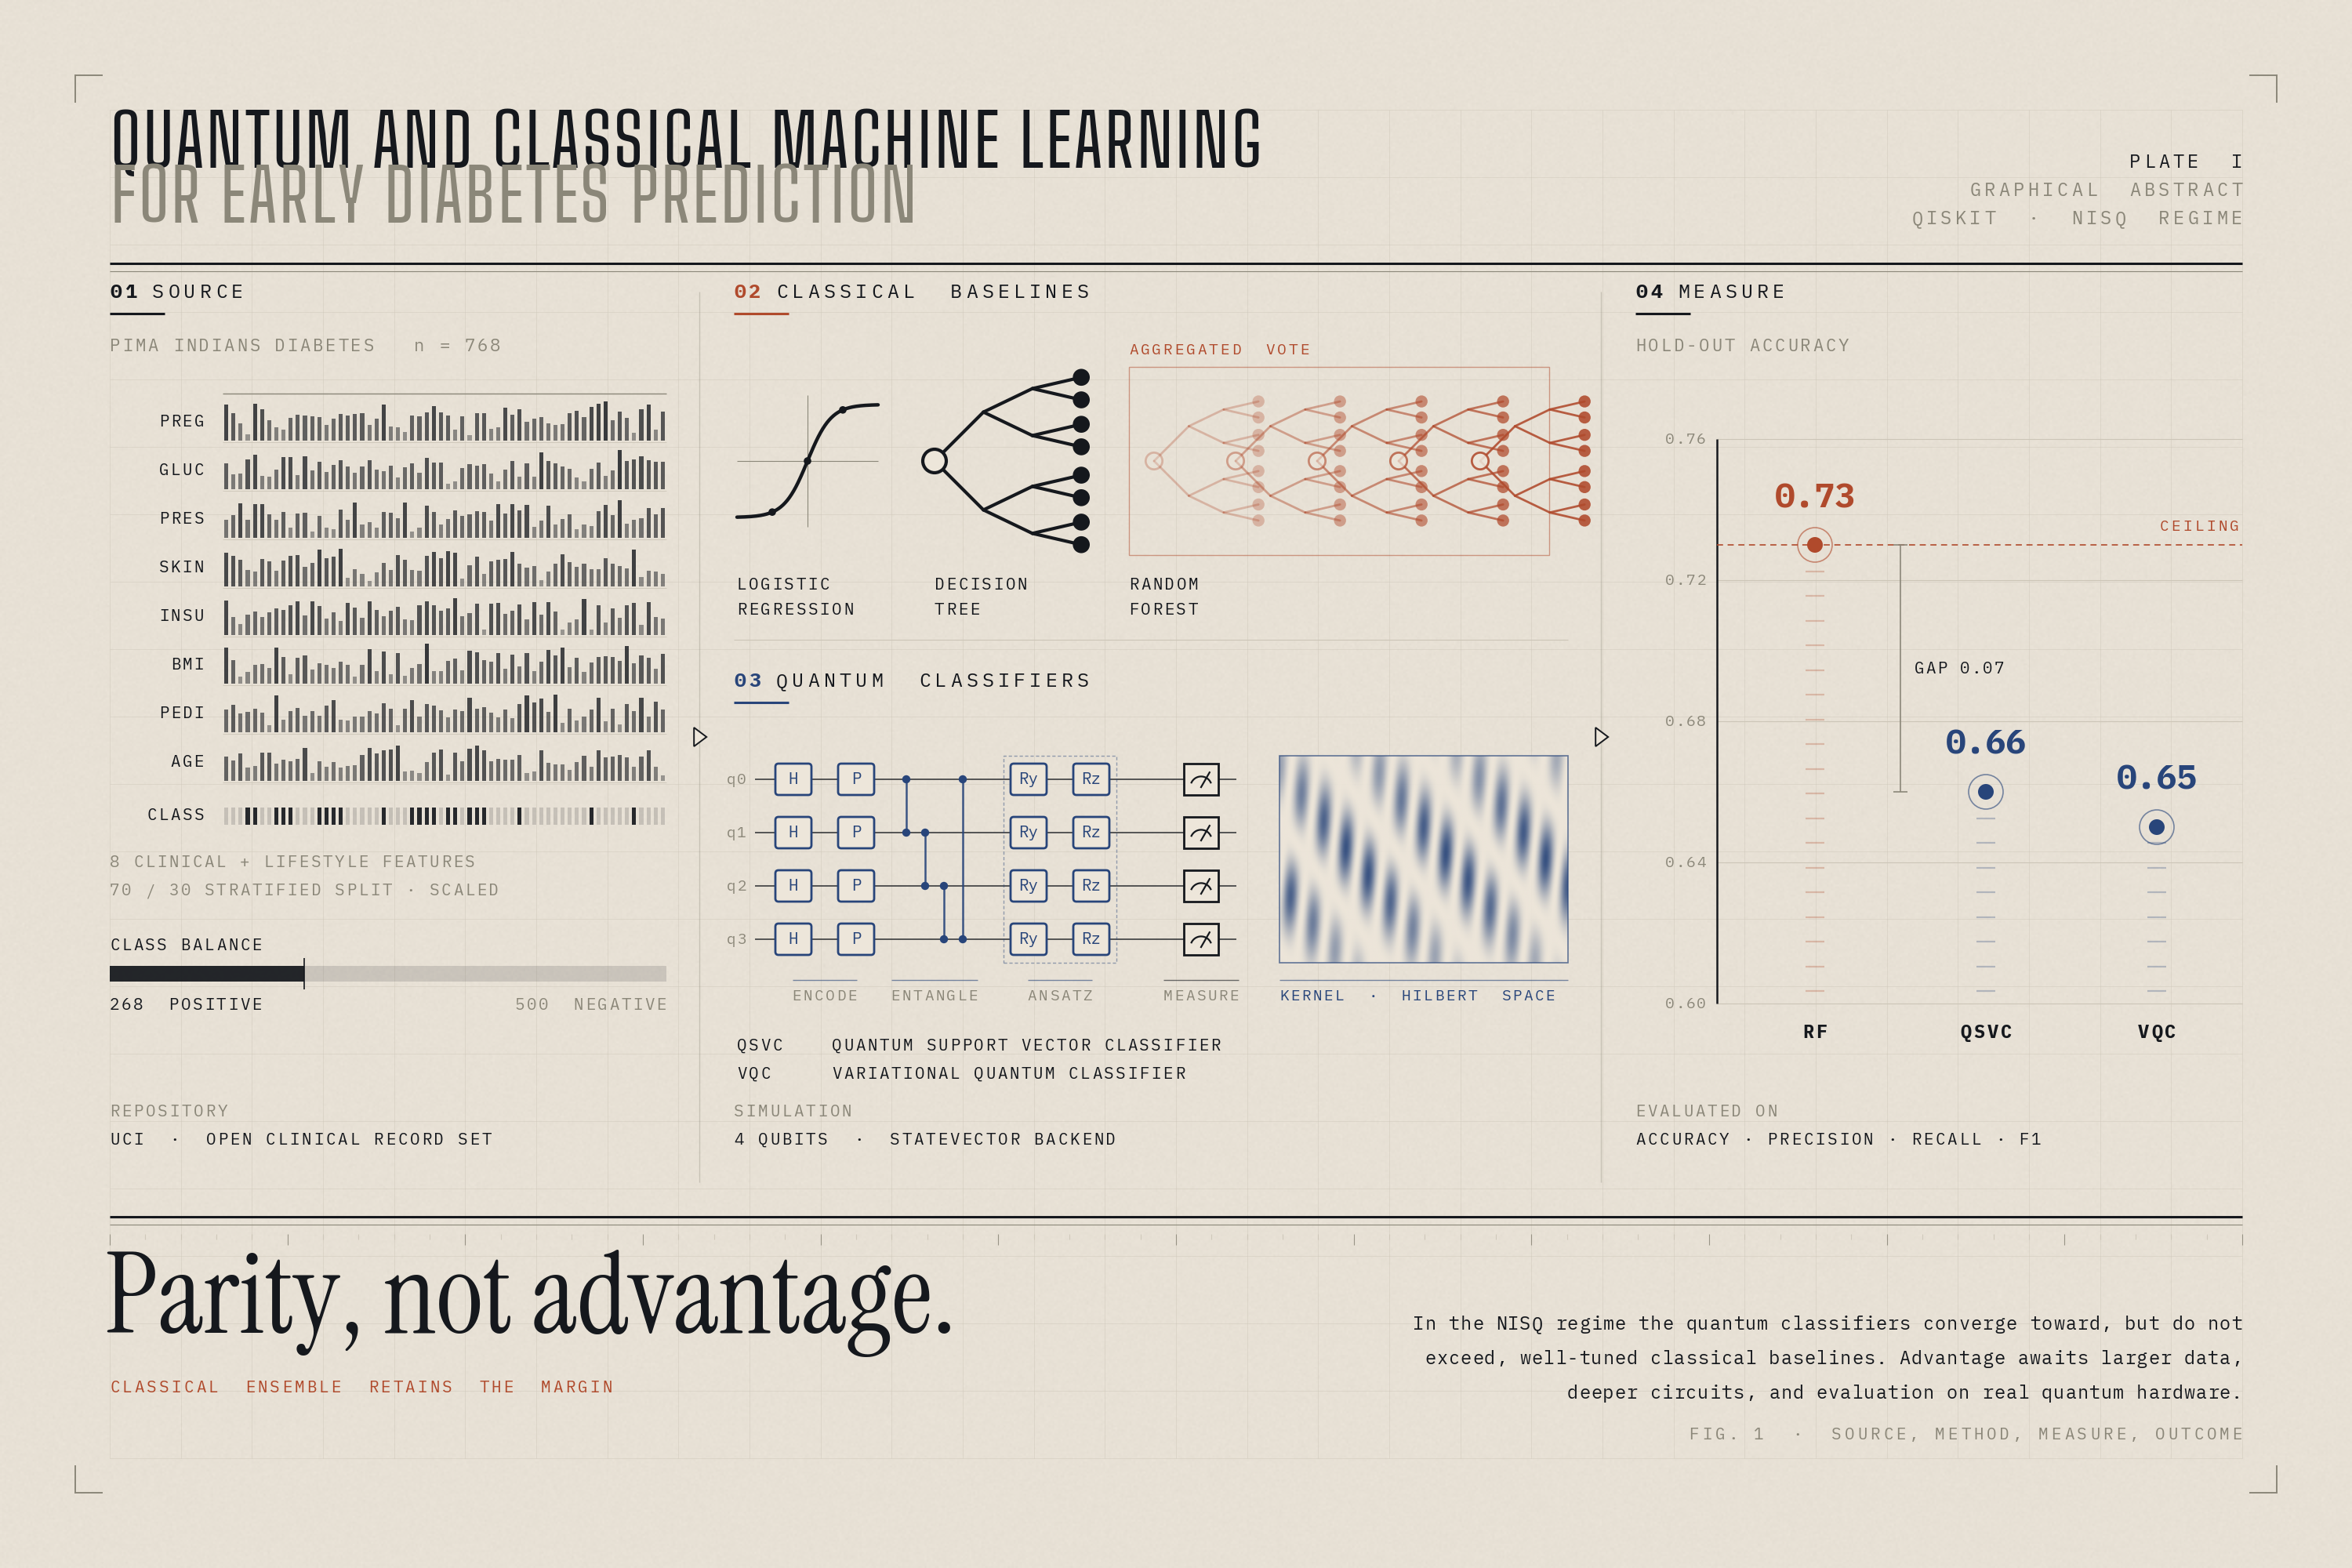
Diabetes remains one of the common chronic diseases around the world and finding a good early prediction from clinical and lifestyle data is very important for timely help. Classical machine learning models such as regression, decision trees and random forests have been used for this purpose but the complicated non‑linear connections among clinical features might need richer ways of representation. Quantum Machine Learning (QML) gives an approach using quantum feature encoding and variational circuits to find patterns that are expensive to express with classical methods. In this study we show a diabetes prediction pipeline that compares baseline models—logistic regression, decision tree and random forest—with two quantum classifiers built in Qiskit: a Quantum Support Vector Classifier (QSVC) and a Variational Quantum Classifier (VQC). Using the Pima Indians Diabetes dataset we test all models on accuracy, precision, recall and F1‑score. The results show that the classical Random Forest classifier reaches the accuracy (0.73) beating both quantum classifiers. The Quantum Support Vector Classifier (QSVC 0.66) and the Variational Quantum Classifier (VQC 0.65) are still competitive. Do not outdo the classical baselines. These results agree with reports that in the present Noisy Intermediate‑Scale Quantum (NISQ) era quantum models usually match rather than surpass well‑tuned classical approaches on standard health‑care data and that a real quantum advantage will need larger data, deeper circuits and testing, on real quantum hardware.
Keywords:
quantum machine learning
; diabetes prediction
; variational quantum classifier
; Qiskit
; classical baseline
; healthcare
1. Introduction
Diabetes mellitus is one of the common long-term illnesses in the world. It is also a reason for heart disease, kidney failure and other serious health problems. Finding out about diabetes mellitus early and predicting the risk of diabetes mellitus accurately are very important. They help give care lower long-term health costs and make life better for people who have diabetes mellitus. I believe that people are using intelligence, especially machine learning and deep learning increasingly to predict diseases with patient data. Classic machine learning models can predict diabetes mellitus well when they use everyday health measurements, like glucose, body mass index, blood pressure, age and other health signs [2,3].
Recently quantum machine learning has become a research direction for classifying data. Quantum machine learning is based on the idea that quantum feature spaces, which we reach by encoding data into circuits can show complex data patterns and make different groups easier to separate than normal feature spaces [8,9]. Among many quantum machine learning methods, the variational quantum classifier attracts a lot of attention. It mixes quantum circuits with classical optimization to do supervised classification [10,15].
2. Related Work
Predicting diabetes from clinical checks has been a hot topic in machine learning for over thirty years. The Pima Indians Diabetes dataset, first studied by Smith et al. With the ADAP adaptive learning algorithm [1] has grown into a go-to benchmark for testing classification models in this field. Many later papers have tried an array of classic algorithms—logistic regression, k-nearest neighbors, decision trees, support vector machines and ensemble tools such as random forests and gradient boosting—usually reporting accuracies between 0.70 and 0.97 depending on how data is cleaned and features are chosen [2,3,4]. Ensemble and mixed models often turn out to be classic baselines. Laila et al. Reached high as 97% accuracy with a Random Forest on UCI early-stage diabetes data [3] while Ahmed et al. Hit 94.87% using a blend of support-vector, artificial-neural-network and fuzzy-logic approaches [2]. Kurbanov et al. Offer a comparison of classic machine-learning methods, for diabetes prediction showing that tree-based ensembles stay hard to beat [4].
Beyond table tests, classical machine learning has grown to handle large clinical and administrative data sets. Ravaut et al. Predicted diabetes complications from the health records of more than one million patients reaching an AUC of 0.777 [6] and electronic-health-record (EHR) gradient-boosting frameworks such as LightGBM have achieved AUC values as high as 0.969 [7]. Systematic reviews of machine learning for diabetes management in care [5] and meta-analyses of artificial intelligence and machine learning for patient-data management in related chronic conditions such as hemodialysis [23] highlight both the promise and the reproducibility challenges of these approaches. Related work on predicting life expectancy from lifestyle factors [22] and on deep-learning-based patient monitoring [21] further illustrates the breadth of machine learning applications, across clinical and lifestyle health data.
In parallel quantum machine learning has become a way to solve classification tasks that could use richer feature representations. Havlíček et al. Showed that quantum circuits can transform inputs into high-dimensional Hilbert spaces and they proposed two supervised methods: a quantum kernel estimator that works with a classical support-vector machine and a variational quantum classifier that learns directly on the quantum feature map [8]. Killoran clarified the link between quantum feature maps and kernel methods proving that data encoded into a quantum state is automatically placed in a feature Hilbert space where inner products give a kernel [9]. These basic results directly inspire the Quantum Support Vector Classifier (QSVC) and Variational Quantum Classifier (VQC) that we evaluate in this study.
A growing number of studies have used these methods for diabetes prediction with the Pima Indians dataset. The evidence that appears however shows that quantum models usually match, than beat well-tuned classical baselines. Gupta et al. Compared quantum machine learning with learning and found 86% accuracy for the quantum model versus 95% for a classical deep network [10]. Vimal obtained 74% accuracy with a QSVC compared with 76% for a SVM on the same Pima data [13] and Genç found that a quantum SVM reached 84.3% versus 85% for logistic regression on the larger BRFSS Diabetes Health Indicators dataset [14]. Maheshwari et al. Reported that an ensemble Qboost classifier achieved 69% accuracy but with a 55-fold speed-up over the classical pipeline [11] while Prakash et al. Reported accuracies high as 97% for a quantum algorithm on a diabetes-mellitus dataset [12]. The best quantum results come from tuned variational circuits: Khan et al. Examined 76 VQC variants across four- and eight-qubit configurations and found that the best model—six layers with a ZZ feature map and a COBYLA optimizer—reached 85% accuracy on eight qubits (versus 80% on four) beating SVM, Random Forest, Decision Tree and Logistic Regression baselines [15]. Quantum-inspired models that run entirely on hardware have also shown strong performance; the QISICGM framework of Young reported an F1-score of 0.893 and an AUC of 0.870 on augmented Pima data surpassing Random Forest and XGBoost [16]. Table 1 summarizes representative comparisons, for diabetes prediction.
Two limitations keep appearing in this research. First quantum models for predicting diabetes have mostly been tested on the Pima dataset. They have not been checked on datasets in real hospital environments or using large electronic health records [10,15]. This is a problem that also affects classical models in the same area [5]. Second, the choice of feature maps the optimizer used, the depth of the quantum circuit and the number of qubits all have an impact on how well a quantum model performs [15]. This makes it hard to compare quantum models fairly. The current study helps fill this gap by providing a controlled comparison between QSVC and VQC and three classical models. It uses datasets, preprocessing steps and evaluation methods for all models. This adds to the number of studies that can reliably compare quantum and classical approaches, for predicting diabetes risk.
3. Materials and Methods
3.1. Dataset Overview
The dataset used in this study is called diabetes.csv which was created by the National Institute of Diabetes and Digestive and Kidney Diseases and shared by Smith et al. [1]. This dataset has 768 records each one showing a person with different medical and personal details that are connected to diabetes risk. Each record has eight features that can predict something and one target variable that’s. Yes or no as shown in Table 2. All the people in the dataset are female, at 21 years old and belong to the Pima Indian group.
3.2. Data Preprocessing
Several physiological features in the dataset—Glucose, BloodPressure, SkinThickness, Insulin, and BMI—contain zero entries that are not biologically plausible and therefore represent missing values. These entries were identified as missing and addressed during preprocessing. Because both the margin-based classical models and the quantum feature-encoding models are sensitive to the magnitude of the input features, all predictors were standardized to a comparable scale before training; feature scaling is especially important for the quantum classifiers, whose ZFeatureMap encodes each feature as a single-qubit rotation angle. The processed data were then partitioned into training and test subsets, and the identical split was used for every classical and quantum model to ensure a fair comparison.
3.3. Classical Machine Learning Models
Three classical baselines were implemented with the scikit-learn library [17] to establish performance benchmarks. Each classifier was configured with standard hyper-parameters chosen to limit overfitting on the relatively small dataset, as described below.
3.3.1. Model Architectures
From my perspective the logistic regression model acts as a classifier that converts input features into a probability of a class using the logistic function. The logistic regression model was regularized by setting an inverse-regularization strength of C = 0.1 solved with the routine and limited to one hundred iterations. The decision tree classifier splits the feature space by using the Gini impurity criterion. Was capped at a maximum depth of five with at least five samples required to split an internal node, which helps prevent overfitting. The random forest classifier is a group of one hundred decision trees; each decision tree grows to a depth of ten and considers the square root of the total number of features at each split. By averaging predictions, from decorrelated decision trees the random forest classifier improves generalization and as reported in Section 4, the random forest classifier provides the strongest classical baseline in our experiments.
3.4. Quantum Machine Learning Models
Quantum models were implemented using the Qiskit Machine Learning library [18,19], leveraging quantum kernels and parameterized circuits for binary classification:
3.4.1. Quantum Support Vector Classifier (QSVC)
The QSVC takes every record and turns it into a quantum state using a ZFeatureMap. This ZFeatureMap uses single-qubit rotations that are controlled by the input features. These rotations help move the data into a dimensional quantum Hilbert space. After that a quantum kernel is found by looking at how much the feature-mapped states overlap with each other. This kernel matrix is then given to a support-vector machine. The support-vector machine uses this information to find the decision boundary. The number of qubits used is the same, as the number of features that are encoded. The feature map uses a number of repetitions to manage how deep the circuit is. Since it is very hard to simulate the kernel the QSVC was trained on a sample of the training data.
3.4.2. Variational Quantum Classifier (VQC)
The Variational Quantum Classifier follows the paradigm that was introduced by Havlíček and colleagues in reference [8]. The VQC first takes inputs and embeds them using the same ZFeatureMap. Then the classifier applies a trainable RealAmplitudes ansatz, which is a hardware-efficient circuit that alternates single-qubit rotations and entangling gates. The Variational Quantum Classifier uses one repetition of the ansatz to keep the circuit shallow and to avoid trainability problems such as barren plateaus. After measurement the classifier maps the outputs to class labels. The VQC then uses the gradient-free COBYLA optimizer to adjust the circuit parameters and minimize the classification loss. As with the QSVC the VQC performed training on a reduced subset of the data because of simulation constraints.
3.5. Experimental Setup and Evaluation Metrics
All models were trained and evaluated on the same training and test partitions. The three classical baselines were implemented in scikit-learn [17] with the hyper-parameters described in Section 3.3, whereas the two quantum classifiers were implemented in Qiskit Machine Learning [18,19] and executed on a classical statevector simulator rather than on physical quantum hardware. Because simulating the quantum kernel and the variational circuits is computationally expensive, the QSVC and VQC were trained on a reduced subset of the training data, as noted in Section 3.4.1 and Section 3.4.2.
Model performance was assessed using four standard classification metrics—accuracy, precision, recall, and the F1-score—computed from the confusion-matrix counts of true positives (TP), true negatives (TN), false positives (FP), and false negatives (FN):
Here the positive class corresponds to patients diagnosed with diabetes (Outcome = 1). Because the dataset is class-imbalanced, with negative cases outnumbering positive ones, the F1-score is reported alongside accuracy as a more informative measure of performance.
4. Results
This section reports the performance of the classical and quantum classifiers on the held-out test set, organized by model family and concluding with a direct comparison of all five models.
4.1. Classical Model Performance

Table 3.
Accuracy of the classical machine learning models.
| Model | Accuracy | Precision | Recall | F1-Score |
|---|---|---|---|---|
| Logistic Regression | 0.72 | 0.58 | 0.70 | 0.64 |
| Decision Tree | 0.68 | 0.56 | 0.46 | 0.51 |
| Random Forest | 0.73 | 0.62 | 0.59 | 0.60 |
4.2. Confusion Matrices
All classical machine learning models were evaluated using confusion matrices, as shown in Figure 1.
4.3. Quantum Model Performance
Table 4.
Accuracy of the quantum machine learning models.
| Model | Accuracy | Precision | Recall | F1-Score |
|---|---|---|---|---|
| QSVC | 0.66 | 0.65 | 0.60 | 0.62 |
| VQC | 0.65 | 0.60 | 0.58 | 0.59 |
4.4. Comparative Performance
The performance metrics for all models were compiled into a single table for comparison (Table 5).
5. Discussion
The comparative analysis of the applied models shows key points. The classical Random Forest classifier delivered the accuracy at 0.73 and neither quantum model was able to outperform it. The QSVC achieved an accuracy of 0.66. This quantum approach seemed to capture some -linear relationships between features like glucose, BMI and age. However, the decision boundary created by QSVC was not strong enough to compete with the tree-based method. A major limitation is that QSVC was trained on a portion of the data due to simulation limits. So, its performance should be seen as a bound and not an exact measure. The VQC reached an accuracy of 0.65. This result is like classical models but still lower than the Random Forest. Its performance appears limited by factors: the circuit depth is shallow the number of qubits is small and issues like barren plateaus made optimization difficult. Across all models’ precision values were generally lower than recall values. This trend was especially clear in the Decision Tree and Logistic Regression classifiers. This pattern reflects the class imbalance in the dataset—there are more negative cases than positive ones. In total neither quantum model beat the classical baseline on this dataset. The QSVC performed better than the VQC. Both fell short compared to the Random Forest. These results match studies that show quantum models tend to match, rather than surpass well-optimized classical models when predicting diabetes, in the current NISQ era [10,13,14].
6. Conclusions
This study carried out a comparison between machine learning algorithms, such as Logistic Regression, Decision Trees and Random Forests and new quantum-enhanced classifiers namely the Quantum Support Vector Classifier (QSVC) and the Variational Quantum Classifier (VQC) all used for classifying diabetes cases. Our findings indicate that although classical ensemble methods, Random Forest still set strong performance standards quantum-hybrid models show promise when data dimensions are reduced. We saw that VQC and QSVC can learn non-linear decision lines inside high-dimensional Hilbert spaces highlighting their ability to act as feature-mapping tools. However, the gap in performance between quantum simulations run on classical machines and well-known classical deep learning systems points to serious difficulties. These problems mainly come from limits on data encoding and, from the size of quantum feature maps that exist during the Noisy Intermediate-Scale Quantum or NISQ era.
7. Future Work
To push forward the integration of quantum machine learning into diagnostic applications, future work will follow three paths. The first path is featuring encoding. We will look at expressive quantum embeddings, such as angle or amplitude encoding to raise the amount of information stored in quantum states and to close the gap with classical deep-learning models. The second path is hybrid optimization. We will combine powerful classical optimizers with hybrid training methods—for example quantum natural gradient descent - to cut the time needed for convergence and to make VQC training more stable on larger data sets. The third path is real-hardware benchmarking. We will move from simulation to running on real quantum processing units (QPUs). This will let us see how decoherence, gate noise and measurement error affect classification accuracy and give a picture of quantum advantage in noisy diagnostic situations. Finally, we must validate these models on groups and, on large electronic health records not just the Pima dataset, which is an important next step. Validating these models on external cohorts and large-scale electronic health records, beyond the Pima dataset, remains an important further step [15].
Author Contributions
All authors contributed to the conception and design of the study. K.K. led the implementation of the classical and quantum models and drafted the manuscript; S.C. and S.V. contributed to data preprocessing and experimental evaluation; F.F. and A.K. contributed to results analysis and visualization. Review and text refinement was done by R.I. and K.K. All authors have read and agreed to the published version of the manuscript.
Funding
This research received no external funding.
Institutional Review Board Statement
Not applicable. This study used a publicly available, fully de-identified dataset and did not involve any new experiments on humans or animals.
Informed Consent Statement
Not applicable.
Data Availability Statement
To ensure full experimental reproducibility in accordance with Preprints.org transparency guidelines, all source code, quantum simulation scripts, and pre-trained model artifacts are publicly available in the project GitHub repository at: https://github.com/Senghab-Cheng/Quantum_Machine_Learning.git.
Acknowledgments
The authors thank the Department of Computer Science at Paragon International University for its support and guidance throughout this project.
Conflicts of Interest
The authors declare no conflicts of interest.
Generative AI Disclosure: During the preparation of this manuscript, the authors used generative AI tools solely to improve the English language and to polish the readability of the text. No AI tool was used to generate research data, results, analyses, or scientific content. The authors reviewed and edited all AI-assisted text and take full responsibility for the content of the publication.
References
- Smith, J. W.; Everhart, J. E.; Dickson, W. C.; Knowler, W. C.; Johannes, R. S. Using the ADAP learning algorithm to forecast the onset of diabetes mellitus. Proc. Symp. Comput. Appl. Med. Care 1988, 261–265. [Google Scholar]
- Ahmed, U.; Issa, G.; Khan, M. A.; Aftab, S.; Khan, M. F.; Said, R. A.; Ghazal, T. M.; Ahmad, M. Prediction of diabetes empowered with fused machine learning. IEEE Access 2022, vol. 10, 1–11. [Google Scholar] [CrossRef]
- Laila, U.; Mahboob, K.; Khan, A. W.; Khan, F.; Taekeun, W. An ensemble approach to predict early-stage diabetes risk using machine learning: An empirical study. Sensors 2022, vol. 22(no. 14), art. 5247. [Google Scholar] [CrossRef] [PubMed]
- Kurbanov; Isaev, R.; Gimaletdinova, G. Diabetes prediction using machine learning techniques: A comprehensive analysis. 2024. [Google Scholar] [CrossRef]
- Rahimi, K.; Canfell, O. J.; Chan, W.; Sly, B. P.; Pole, J.; Sullivan, C.; Shrapnel, S. Machine learning models for diabetes management in acute care using electronic medical records: A systematic review. Int. J. Med. Inform. 2022, vol. 162, art. 104758. [Google Scholar] [CrossRef] [PubMed]
- Ravaut, M.; Sadeghi, H.; Leung, K. K.; Volkovs, M.; Kornas, K.; Harish, V.; Watson, T.; Lewis, G.; Weisman, A.; Poutanen, T.; Rosella, L. Predicting adverse outcomes due to diabetes complications with machine learning using administrative health data. npj Digit. Med. 2021, vol. 4, art. 24. [Google Scholar] [CrossRef] [PubMed]
- Ye; Shen, Z.; Ji, A.; Jiao, Y.; Niu, Y.; Zuo, K.; Hu, P.; Li, W. Advances in electronic health record analysis for diabetes risk prediction: A machine learning-enhanced framework. Proc. 5th Int. Conf. Artif. Intell. Comput. Eng. (ICAICE), 2024; pp. 830–839. [Google Scholar] [CrossRef]
- Havlíček, V.; Córcoles, A. D.; Temme, K.; Harrow, A. W.; Kandala, A.; Chow, J. M.; Gambetta, J. M. Supervised learning with quantum-enhanced feature spaces. Nature 2019, vol. 567, 209–212. [Google Scholar] [CrossRef] [PubMed]
- Schuld, M.; Killoran, N. Quantum machine learning in feature Hilbert spaces. Phys. Rev. Lett. 2019, vol. 122(no. 4), art. 040504. [Google Scholar] [CrossRef] [PubMed]
- Gupta, H.; Varshney, H.; Sharma, T. K.; Pachauri, N.; Verma, O. P. Comparative performance analysis of quantum machine learning with deep learning for diabetes prediction. Complex Intell. Syst. 2021, vol. 8, 3073–3087. [Google Scholar] [CrossRef]
- Maheshwari; Garcia-Zapirain, B.; Sierra-Sosa, D. Machine learning applied to diabetes dataset using quantum versus classical computation. Proc. IEEE Int. Symp. Signal Process. Inf. Technol. (ISSPIT), 2020; pp. 1–6. [Google Scholar] [CrossRef]
- Prakash, B.; Naveen, B.; Akhiluzzama, M.; Rajarajeswari, P. Comparative performance analysis of quantum algorithm with machine learning algorithms on diabetes mellitus. Proc. Int. Conf. Intell. Innov. Technol. Comput. Electr. Electron. (IITCEE) 2023, 1178–1183. [Google Scholar] [CrossRef]
- Vimal. PIMA diabetes prediction using machine learning and quantum machine learning techniques. Proc. ITU Kaleidoscope: Innov. Digit. Transform. Sustainable World (ITU K), 2024; pp. 1–7. [Google Scholar] [CrossRef]
- Genç, S. Performance analysis of quantum and classical machine learning models for feature selection and classification of the diabetes health indicators dataset. Proc. 8th Int. Artif. Intell. Data Process. Symp. (IDAP), 2024; pp. 1–7. [Google Scholar] [CrossRef]
- Khan, W. R.; Kamran, M. A.; Khan, M. U.; Ibrahim, M. M.; Kim, K.; Ali, M. U. Diabetes prediction using an optimized variational quantum classifier. Int. J. Intell. Syst. vol. 2025, art. 1351522, 2025. [CrossRef]
- Young, K. G. Quantum-inspired stacked integrated concept graph model (QISICGM) for diabetes risk prediction. arXiv 2025, arXiv:2509.12259. [Google Scholar] [CrossRef]
- Pedregosa, et al. Scikit-learn: Machine learning in Python. J. Mach. Learn. Res. 2011, vol. 12, 2825–2830. [Google Scholar]
- Aleksandrowicz, et al. Qiskit: An open-source framework for quantum computing. Zenodo 2019. [Google Scholar] [CrossRef]
- Treinish, M.; et al. “Qiskit machine learning,” IBM/Qiskit Community, 2023. Available online: https://github.com/qiskit-community/qiskit-machine-learning.
- Powell, M. J. D. A direct search optimization method that models the objective and constraint functions by linear interpolation. In Advances in Optimization and Numerical Analysis; Kluwer Academic: Dordrecht, The Netherlands, 1994; pp. 51–67. [Google Scholar] [CrossRef]
- Abdillaeva, N.; Isaev, R. Swelling-aware face recognition for hemodialysis patients using contrastive deep learning. Proc. IEEE 15th Int. Conf. Syst. Eng. Technol. (ICSET), Oct. 2025; pp. 445–450. [Google Scholar]
- Bopushova; Isaev, R. Analysis and prediction of life expectancy using machine learning methods based on behavioral and lifestyle factors. 2025. [Google Scholar] [CrossRef]
- Nazira; Rehman, S. U.; Isaev, R. R. Meta-analysis: The role of AI and machine learning in the management of hemodialysis patient data. Int. J. Innov. Res. Sci. Stud. 2025, vol. 8(no. 3), 2206–2215. [Google Scholar] [CrossRef]
Figure 1.
Confusion matrices for the Decision Tree, Random Forest, and Logistic Regression models..
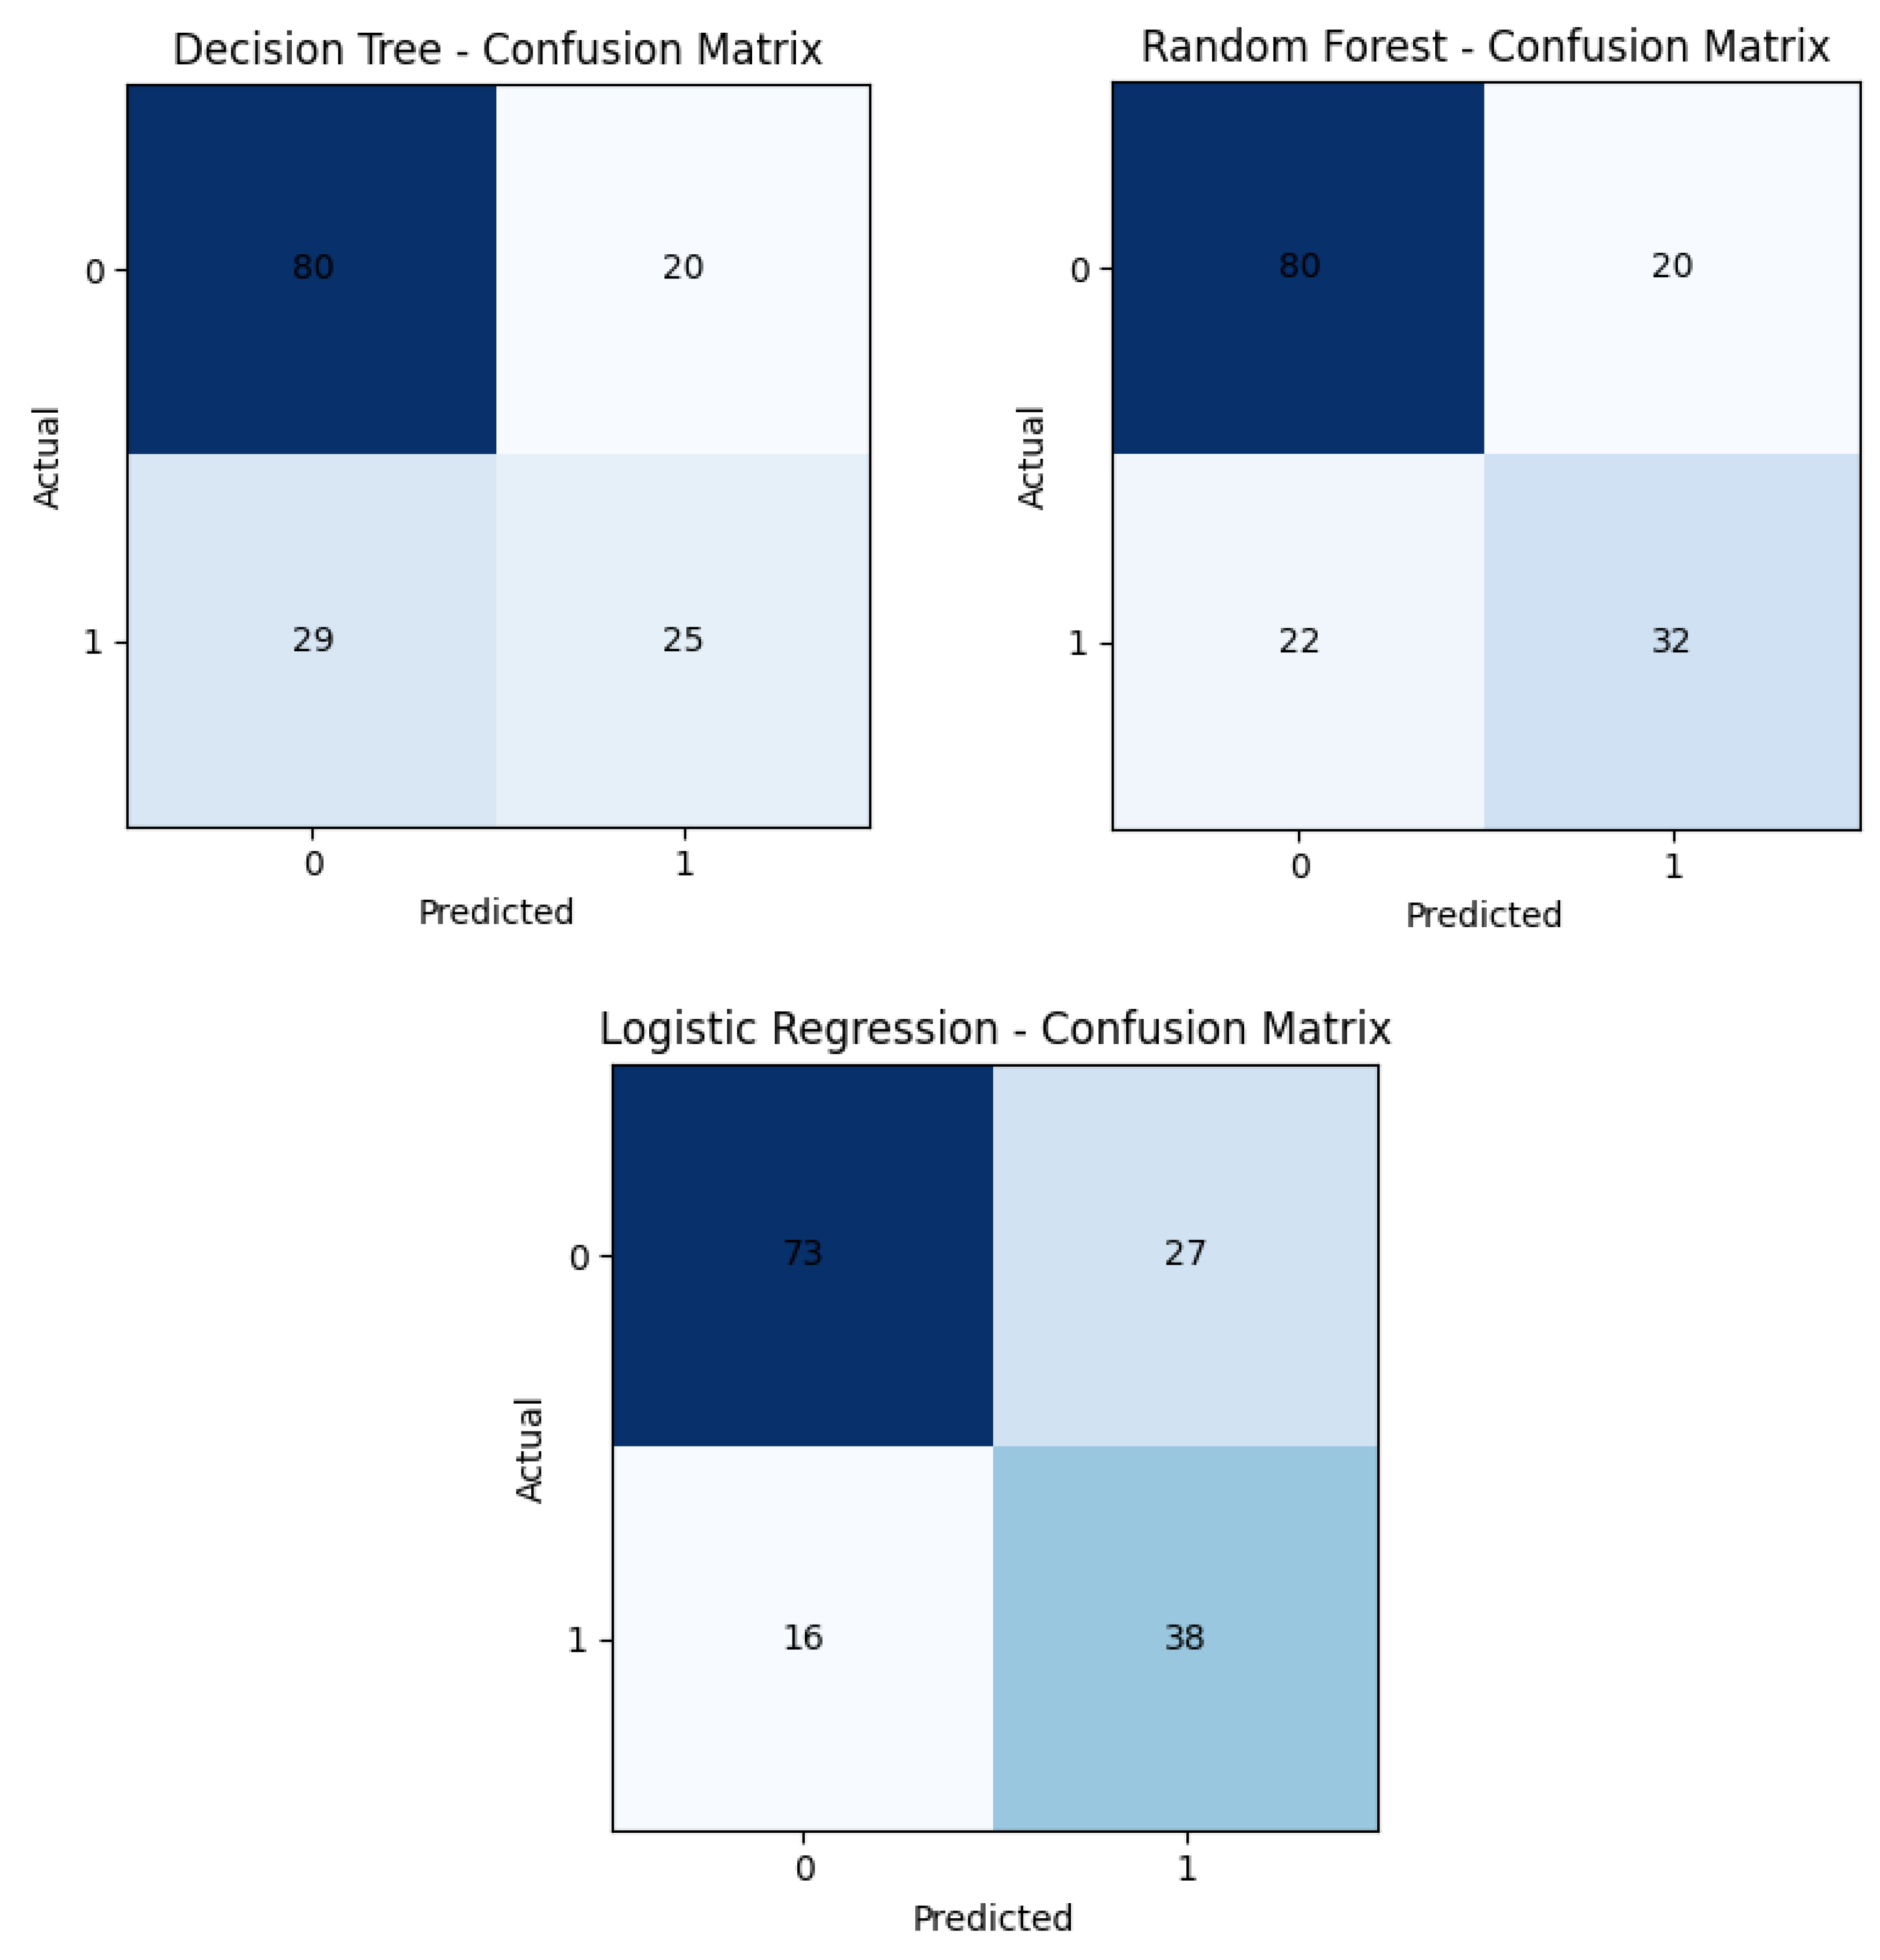
Table 1.
Representative quantum-versus-classical studies for diabetes prediction.
| Study | QML model | QML accuracy | Best classical model | Classical accuracy | Dataset |
|---|---|---|---|---|---|
| Gupta et al. (2021) [10] | QML | 86% | Deep learning | 95% | Pima |
| Maheshwari et al. (2020) [11] | Qboost ensemble | 69% | Classical ensemble | — | Pima |
| Prakash et al. (2023) [12] | Quantum algorithm | 97% | — | — | Diabetes Mellitus |
| Vimal (2024) [13] | QSVC | 74% | SVM | 76% | Pima |
| Genç (2024) [14] | QSVM | 84.3% | Logistic Regression | 85% | BRFSS |
| Khan et al. (2025) [15] | VQC (8 qubits) | 85% | SVM / RF / DT / LR | < 85% | Pima |
| Young (2025) [16] | Quantum-inspired | F1 = 0.893 | RF / XGBoost | lower | Pima (aug.) |
| This work | QSVC / VQC | 0.66/0.65 | Random Forest | 0.73 | Pima |
Table 2.
Description of the dataset features.
| Feature | Type | Description |
|---|---|---|
| Pregnancies | Discrete | Number of times pregnant |
| Glucose | Continuous | Plasma glucose concentration at 2 h in an oral glucose tolerance test |
| BloodPressure | Continuous | Diastolic blood pressure (mm Hg) |
| SkinThickness | Continuous | Triceps skinfold thickness (mm) |
| Insulin | Continuous | 2-hour serum insulin (µU/ml) |
| BMI | Continuous | Body mass index (weight in kg / height in m2) |
| DiabetesPedigreeFunction | Continuous | Diabetes pedigree score based on family history |
| Age | Continuous | Patient age in years |
| Outcome (target) | Binary | 0 = negative, 1 = positive for diabetes |
Table 5.
Performance comparison of the classical and quantum models.
| Model | Accuracy | Precision | Recall | F1-Score | Training Time (s) |
|---|---|---|---|---|---|
| Logistic Regression | 0.7208 | 0.5846 | 0.7037 | 0.6387 | 0.0085 |
| Decision Tree | 0.7208 | 0.6038 | 0.5926 | 0.5981 | 0.0028 |
| Random Forest | 0.7143 | 0.5962 | 0.5741 | 0.5849 | 0.2178 |
| QSVC | 0.6688 | 0.5789 | 0.2037 | 0.3014 | 1239.6194 |
| VQC | 0.6558 | 0.5143 | 0.3333 | 0.4045 | 104.2117 |
Disclaimer/Publisher’s Note: The statements, opinions and data contained in all publications are solely those of the individual author(s) and contributor(s) and not of MDPI and/or the editor(s). MDPI and/or the editor(s) disclaim responsibility for any injury to people or property resulting from any ideas, methods, instructions or products referred to in the content. |
© 2026 by the authors. Licensee MDPI, Basel, Switzerland. This article is an open access article distributed under the terms and conditions of the Creative Commons Attribution (CC BY) license (http://creativecommons.org/licenses/by/4.0/).
Copyright: This open access article is published under a Creative Commons CC BY 4.0 license, which permit the free download, distribution, and reuse, provided that the author and preprint are cited in any reuse.