
Submitted:
31 August 2026
Posted:
31 August 2026
You are already at the latest version
Abstract
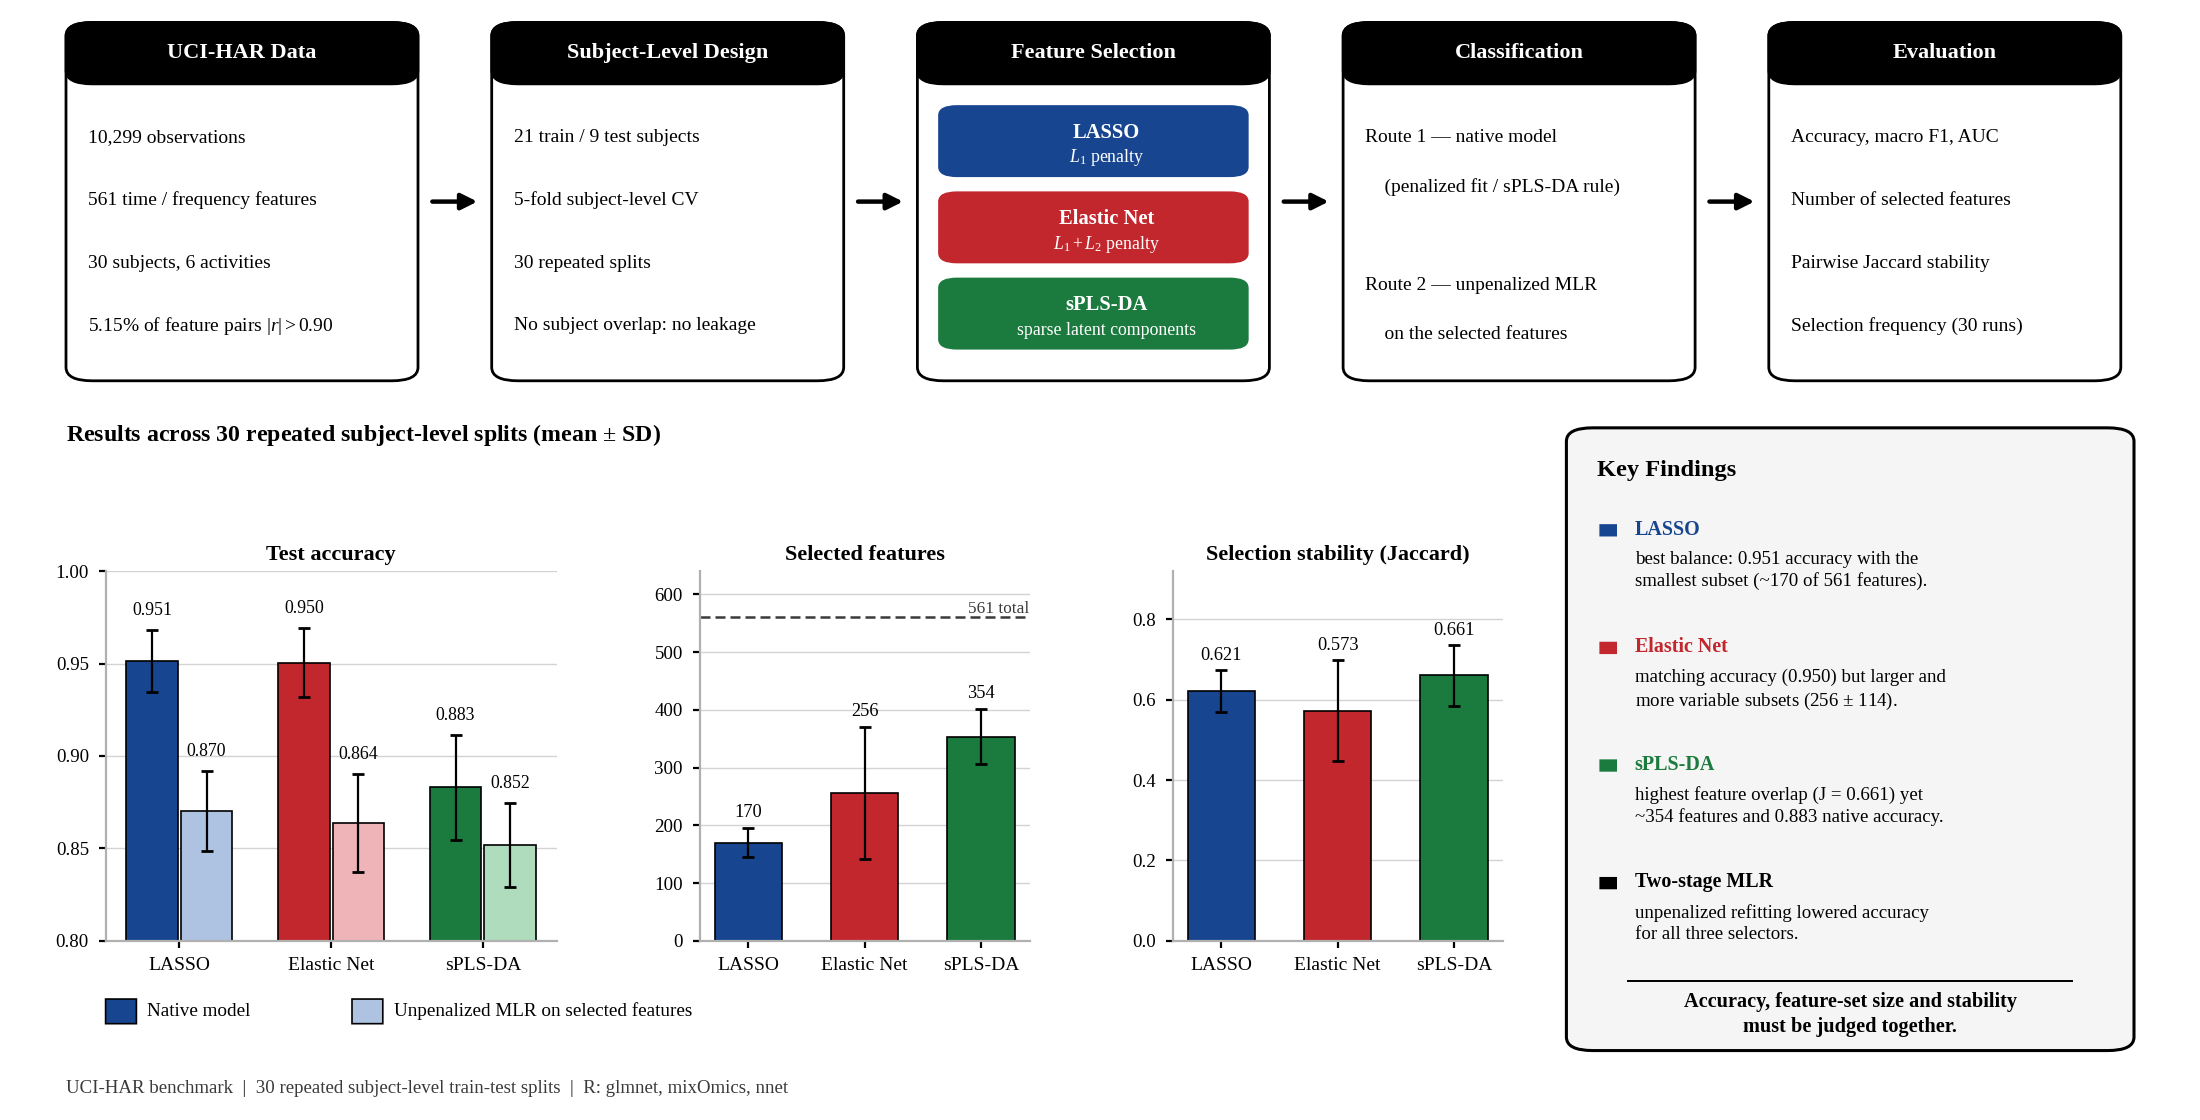
Smartphone-based human activity recognition (HAR) uses features collected from smartphone sensors to distinguish between different human activities. The large number of correlated features generated by smartphone sensors can make feature selection and model interpretation challenging. This study evaluates a two-stage feature selection and classification framework for HAR, in which sparse partial least squares discriminant analysis (sPLS-DA) is used primarily as a supervised feature selection method, while multinomial logistic regression is employed as the subsequent classifier. The approach is compared with LASSO and Elastic Net regularization under consistent training, testing, and cross-validation procedures. The experiment used 30 repetitions. In each repetition, 21 subjects were used for training and nine subjects were used for testing, with five-fold subject-level cross-validation inside the training set. The original variables selected by each method were also tested with the same unpenalized multinomial logistic regression (MLR) classifier. Native LASSO and Elastic Net gave the highest predictive performance, with mean accuracies of 0.9514 ± 0.0166 and 0.9504 ± 0.0187, respectively, and mean multiclass AUC values of about 0.997. LASSO selected 169.8 ± 25.4 features on average, while Elastic Net selected 255.5 ± 114.4. sPLS-DA selected 353.7 ± 47.5 features on average, while its native max.dist classifier reached a mean accuracy of 0.8831 ± 0.0283 and the selected feature sets had the highest mean pairwise Jaccard overlap (0.6611). Using unpenalized MLR on the selected feature subsets reduced accuracy for all three methods. Overall, LASSO gave the best balance between predictive performance and a smaller feature set, while sPLS-DA showed higher feature-set overlap but kept many more features. These results show that predictive performance, feature-set size, and selection stability should be considered together in smartphone-based HAR.
Keywords:
human activity recognition
; UCI-HAR
; feature selection
; Sparse PLS-DA
; LASSO
; Elastic Net
1. Introduction
Human activities reflect people's daily routines, physical condition, and behavioral patterns. The ability to recognize these activities automatically has attracted considerable attention because it supports a wide range of applications, including healthcare monitoring, elderly care, rehabilitation, fitness tracking, and smart environments. This research area, commonly known as Human Activity Recognition (HAR), aims to identify human activities from sensor data without requiring continuous human observation.
In recent years, smartphones have become one of the most widely used platforms for HAR because they are equipped with built-in inertial sensors, such as accelerometers and gyroscopes, that can continuously capture body movements during everyday life. Their widespread availability and low cost have made smartphone-based HAR an active research area and encouraged the development of increasingly accurate activity recognition methods.
Among the publicly available benchmark datasets for smartphone-based HAR, the Human Activity Recognition Using Smartphones (UCI HAR) dataset introduced by Anguita et al. [1] is one of the most widely used. The dataset contains sensor data collected from 30 volunteers performing six daily activities while carrying a waist-mounted smartphone. From the accelerometer and gyroscope signals, the original study extracted 561 time- and frequency-domain features using statistical measures such as mean, energy, entropy, correlation, and signal magnitude area. Although these engineered features provide useful information for activity recognition, many of them are derived from the same underlying sensor signals. As a result, the dataset contains a large number of highly correlated and redundant variables. This characteristic makes feature selection an important step for reducing redundancy and identifying the most informative features before building a classification model.
Several feature selection approaches have been applied to this problem. One common approach is dimensionality reduction. For example, Ravi [2] used principal component analysis (PCA) on the UCI-HAR dataset and reduced the original feature space to 200 components while retaining 99.75% of the variance. Recent work has also integrated sparse principal component analysis into high-dimensional partially linear models, combining dimensionality reduction with local polynomial estimation [3]. Other studies have focused on selecting the original features rather than creating new components. Filter-based methods such as ReliefF have been applied to smartphone accelerometer and gyroscope data from able-bodied, elderly, and stroke populations [4]. Similarly, Doewes et al. [5] applied minimum Redundancy Maximum Relevance (mRMR) to the UCI-HAR dataset to reduce the number of selected features while maintaining classification performance. Another group of methods consists of embedded approaches, such as LASSO [6] and Elastic Net [7]. In these methods, feature selection is performed during model fitting by shrinking some regression coefficients toward zero. Direct applications of these methods to smartphone-based HAR appear to be more limited. For example, Ariza et al. [8] applied LASSO with stability selection to a four-class HAR dataset based on accelerometer and gyroscope data. Elastic Net, in particular, has received less attention in smartphone-based sensor HAR, although it is theoretically useful when predictors are highly correlated. These embedded methods are attractive because they can produce a sparse subset of the original features while also fitting a predictive model. However, high correlation among sensor-derived features can make variable selection difficult. LASSO may select one feature from a group of highly correlated variables while excluding the others. Elastic Net was introduced to reduce this problem through its grouping effect, which encourages strongly correlated predictors to be selected together [7]. However, this grouping effect comes from the penalty structure of Elastic Net rather than from an explicit representation of the relationships among the sensor-derived features.
Sparse Partial Least Squares Discriminant Analysis (sPLS-DA) is another method that can be used for feature selection when the predictors are highly correlated. It combines Partial Least Squares (PLS) with discriminant analysis and uses a sparsity constraint to select some variables from the original feature set [9]. Instead of selecting variables based only on their individual regression coefficients, sPLS-DA creates latent components using the predictor variables and the activity classes. Only selected variables are used to build these components. This can be useful for smartphone-based HAR because several features may come from the same sensor signals and can therefore have similar information. In this way, sPLS-DA can select features while also considering their relationships with the activity classes [9].
Since sPLS-DA combines feature selection and classification in a single framework, it is difficult to evaluate the contribution of its selected features separately from its classification procedure. To examine this issue, this study uses a two-stage framework in which sPLS-DA is used for feature selection and multinomial logistic regression is used for classification. This allows the selected features to be evaluated independently of the native sPLS-DA classification procedure and compared with LASSO and Elastic Net under the same classification framework. The native sPLS-DA classifier is also included as a reference to examine the effect of separating feature selection from classification. The methods are evaluated using repeated subject-level train/test splits, with the same data partitions and cross-validation scheme used across methods. In addition to classification performance, the stability of the selected feature sets across repeated splits is examined. The remainder of this paper is organized as follows: Section 2 reviews related work; Section 3 details the methodology; Section 4 discusses the theoretical properties of the compared methods; Section 5 presents the HAR dataset study and empirical results; Section 6 discusses the findings; and Section 7 concludes the study.
2. Related Work
Previous studies on smartphone-based human activity recognition have explored different datasets, feature representations, feature-selection methods, and classification approaches. This section reviews the UCI-HAR benchmark and previous feature-selection methods, with a focus on regularization-based methods and sparse PLS-DA that are relevant to the present study.
2.1. UCI HAR Dataset and Benchmark Performance
The UCI HAR dataset used in this study was introduced by Anguita et al. [1], who collected triaxial accelerometer and gyroscope signals from 30 volunteers performing six activities of daily living with a waist-mounted smartphone. The raw signals were segmented into 2.56-second sliding windows with 50% overlap, and 561 time- and frequency-domain features were derived using standard measures such as mean, standard deviation, energy, entropy, and autoregression coefficients. As a benchmark, the original authors reported a 96% overall accuracy using a multiclass Support Vector Machine (SVM) with a one-vs-all scheme and Gaussian kernels, tuned via 10-fold cross-validation. Notably, they observed the weakest performance on the sitting activity (88% recall), which was frequently confused with standing, a limitation attributed to the waist-mounted sensor's difficulty in distinguishing static postures. This benchmark provides a useful reference point for evaluating the classification performance of the feature selection methods examined in the present study, although comparisons should account for differences in evaluation protocol (e.g., subject-level versus random splits).
2.2. Feature Selection in Smartphone-Based HAR
Feature selection is an important component of smartphone-based human activity recognition (HAR), particularly because sensor-derived datasets may contain a large number of features generated from related signals. Dentamaro et al. [10] reviewed smartphone-based HAR studies across different preprocessing, feature extraction, feature selection, and classification approaches. Their review identifies feature selection as an important step for reducing the dimensionality of the feature space, removing less discriminative variables, and reducing computational complexity while retaining information relevant to activity classification.
The review also highlights substantial variation in the datasets, sensors, feature representations, preprocessing procedures, and classification algorithms used across HAR studies. Consequently, reported classification results cannot always be directly compared because experimental and testing conditions may differ, even when the same dataset is used. This observation motivates the evaluation of alternative feature-selection methods under a common experimental framework.
Several studies have therefore investigated dimensionality reduction or feature selection for smartphone-based HAR. Ravi [2], for example, applied principal component analysis (PCA) to the UCI-HAR dataset and reduced the original feature space to 200 components while retaining 99.75% of the variance. Although this approach provides a compact representation, the resulting components are combinations of the original variables and therefore do not directly identify which sensor-derived features are most relevant. Other studies have focused on selecting original variables. Capela et al. [4] investigated feature selection for wearable and smartphone-based HAR using data from able-bodied individuals, elderly participants, and stroke patients, while Doewes et al. [5] applied minimum redundancy maximum relevance (mRMR) to the UCI-HAR dataset. These studies illustrate the use of feature selection to reduce the input space while retaining information relevant to activity classification. Manca et al. [11] investigated feature selection across multiple mobile-sensor HAR benchmarks and emphasized that feature-selection methods should be evaluated not only in terms of predictive performance but also according to the stability of the selected feature subsets under changes in the training data. Hybrid feature-selection approaches have also been investigated in smartphone-based HAR. Ahmed et al. combined filter- and wrapper-based selection to reduce high-dimensional smartphone sensor features before multiclass SVM classification [12].
2.3. Regularization-Based Feature Selection
Embedded feature-selection methods provide an alternative to filter-based approaches because variable selection is performed during model estimation. LASSO is a regularization method that uses an L1 penalty on the regression coefficients. This penalty can shrink some coefficients to exactly zero, which gives a sparse model [6]. In multiclass classification, LASSO can be used to select a subset of predictors related to different activity classes while fitting the classification model.
Regularization is useful when sensor-derived predictors are correlated. When several variables contain similar information, LASSO may keep one variable and set the coefficients of other correlated variables to zero. The selected features can therefore change across different training samples. Zou and Hastie [7] proposed Elastic Net by combining L1 and L2 regularization. The L1 part produces sparsity and allows feature selection, while the L2 part penalizes large coefficients and helps correlated predictors to be selected together. This property is known as the grouping effect. Elastic Net can therefore be useful when the predictors have strong correlations.
Feature selection methods can suffer from instability because small changes in the training data may lead to different selected variables. To address this issue, Meinshausen and Bühlmann [13] introduced stability selection, a resampling-based framework that evaluates the consistency of variable selection across multiple subsamples. By repeatedly applying a feature selection method and measuring selection frequencies, stability selection identifies variables that are selected more consistently across different samples. In smartphone-based HAR, Ariza et al. [8] applied LASSO combined with stability selection for activity classification using accelerometer and gyroscope measurements. Their study used a different HAR dataset from the UCI-HAR dataset used in the present study. The results showed that feature selection alone does not always provide a stable set of features across different samples. This suggests that feature stability is also important when the aim is to obtain a small and interpretable feature set.
LASSO and Elastic Net both select variables through regression coefficients, and their handling of correlated predictors mainly depends on their penalty structures [6,7]. Related work has also extended penalty and shrinkage strategies to right-censored partially linear regression and Bayesian Elastic Net Cox models for high-dimensional time-to-event prediction [14,15]. In contrast, sPLS-DA constructs latent components to represent relationships between predictors and activity classes [9]. This difference is relevant to smartphone-based HAR, where many correlated features are derived from sensor signals.
2.4. Sparse PLS-DA and Its Relationship to Two-Stage Feature Selection
Sparse partial least squares discriminant analysis (sPLS-DA) provides a different approach to supervised variable selection. Lê Cao et al. [9] introduced sPLS-DA as a sparse extension of PLS-DA for multiclass problems. The method combines latent-component construction with a sparsity constraint, allowing variables to be selected while constructing components related to the class structure. The authors evaluated sPLS-DA on several multiclass biological datasets and compared it with sparse discriminant and wrapper-based approaches, including recursive feature elimination, Random Forest, and Nearest Shrunken Centroids. Their results showed that sPLS-DA achieved competitive classification performance while requiring less computation and providing graphical tools for interpreting the selected variables.
An important characteristic of sPLS-DA is its treatment of correlated variables. Instead of considering predictors only through individual regression coefficients, sPLS-DA constructs latent components from selected variables to represent the relationship between predictors and class labels. This makes the method relevant to datasets where several correlated variables may contain related information. Lê Cao et al. [9] also used stability analysis to help determine the number of variables selected on each component. Their approach estimated variable-selection frequencies across repeated bootstrap samples of the training data.
sPLS-DA also differs from LASSO and Elastic Net because feature selection and classification are performed within the same framework. Chung and Keleş [16] proposed a two-stage extension of sPLS-DA, where sparse PLS is first used for variable selection and dimension reduction, followed by a separate classifier. This design allows different classifiers to be used after the variable-selection step. Their results showed that sPLS-DA had competitive classification performance compared with other PLS-based classification approaches, while also providing a more flexible choice of classifier for the second stage.
This two-stage idea is relevant to the present study. Here, sPLS-DA is used primarily for feature selection, and the selected variables are then used in multinomial logistic regression. The aim is to evaluate whether the variables selected by sPLS-DA remain useful when they are evaluated with a separate classifier. This approach also allows the contribution of feature selection to be considered separately from the classification mechanism of the native sPLS-DA model.
Previous studies have examined several feature-selection approaches for HAR, including filter methods, regularization-based methods, and supervised sparse methods. However, these approaches have often been evaluated using different datasets, classifiers, and validation procedures, which makes direct comparison difficult. A direct comparison of LASSO, Elastic Net, and sPLS-DA under a common experimental framework remains limited. In addition, the use of LASSO for HAR in the literature considered in this study has focused on datasets other than UCI-HAR. The present study therefore compares LASSO, Elastic Net, and sPLS-DA using the UCI-HAR dataset and a common evaluation framework. sPLS-DA is evaluated primarily as a feature-selection method, with the selected variables subsequently used in multinomial logistic regression. Feature-selection stability is also evaluated across repeated subject-level splits.
3. Methodology
3.1. Dataset
The UCI Human Activity Recognition Using Smartphones (UCI-HAR) dataset [1] is used in this study. It contains 10,299 observations and 561 time- and frequency-domain features extracted from accelerometer and gyroscope signals. The data include six activities: walking, walking upstairs, walking downstairs, sitting, standing, and laying. The data were collected from 30 subjects using a smartphone placed at the waist. The publicly released version provides a fixed 70/30 train-test partition; however, this study does not rely on a single fixed partition. Instead, repeated subject-level resampling is performed to obtain multiple train/test splits because observations from the same subject can be correlated, particularly when overlapping sliding windows are used [17].
3.2. General Framework
The framework used in this study consists of two stages. In the first stage, one of three feature-selection methods, LASSO, Elastic Net, or sPLS-DA, is applied to the training data to identify a reduced subset of features. In the second stage, multinomial logistic regression (MLR) is fitted using only the selected features and evaluated on the held-out test data. For each repeated split, the data are divided into training and test sets at the subject level. Feature selection and parameter tuning are performed only using the training data. The test data are used only for the final evaluation.
For comparison, the native classification models are also evaluated. For LASSO and Elastic Net, the regularized multinomial regression models are used as the native classifiers. For sPLS-DA, the native sPLS-DA classification result is also recorded. This comparison allows the contribution of feature selection to be evaluated separately from the classification mechanism of the original model. The overall procedure can be summarized as:
UCI-HAR data → subject-level split → feature selection → selected features → MLR → test-set evaluation
The procedure is repeated across multiple subject-level splits to evaluate predictive performance and feature-selection stability.
3.3. Feature Selection Methods
3.3.1. LASSO
LASSO (Least Absolute Shrinkage and Selection Operator) performs variable selection by shrinking regression coefficients through an absolute-value penalty that can produce exactly zero coefficients [18]. The optimization objective of LASSO can be expressed as follows [6]:
where X is the predictor matrix, y is the response, is the vector of regression coefficients, and controls the strength of the penalty. A larger value of produces stronger shrinkage and can result in fewer selected variables.
For the multiclass HAR problem, multinomial LASSO is fitted using the glmnet package with a grouped multinomial penalty, so that the class-specific coefficients associated with each predictor are penalized jointly. The penalty parameter λ is selected by cross-validation within the training data. A feature is considered selected when its grouped coefficient vector across the six activity classes is nonzero at the selected value of λ. The resulting feature subset is then used in the second-stage MLR model.
3.3.2. Elastic Net
Elastic Net combines L1 and L2 penalties and was proposed by Zou and Hastie [7]. Its objective function can be expressed in a commonly used formulation as follows:
where controls the overall penalty strength and controls the balance between the L1 and L2 components. When , Elastic Net becomes LASSO, while lower values of give a larger contribution from the L2 penalty.
The L1 component produces sparse coefficients and allows variable selection. The L2 component helps correlated predictors to remain in the model together. In this study, multinomial Elastic Net is fitted using the glmnet package with the same grouped multinomial penalty as LASSO. The mixing parameter α and penalty parameter λ are tuned using cross-validation on the training data. As in the LASSO model, the multinomial coefficients associated with each predictor are penalized jointly across the activity classes. A feature is retained when its grouped coefficient vector is nonzero at the selected α and λ. The selected features are subsequently used in the second-stage MLR model.
3.3.3. Sparse PLS-DA
Sparse Partial Least Squares Discriminant Analysis (sPLS-DA) is used as a supervised feature-selection method for the multiclass HAR problem. The method extends PLS-DA by adding a sparsity constraint, which allows only a subset of predictor variables to contribute to each latent component [9]. In sPLS-DA, the response variable is represented by a dummy matrix Y, where each column represents one activity class. Feature selection is performed only on the predictor matrix X. For each component h, let
be the cross-product matrix between the predictor and response matrices. The sPLS-DA optimization problem can be written as
where and are the loading vectors for the predictor and response matrices, respectively, and denotes the Frobenius norm. The penalty introduces sparsity into the loading vector of X, so that some variable weights become zero. Variables with nonzero weights are retained as selected features. This formulation allows sPLS-DA to construct latent components while selecting variables that are related to the activity classes.
The sPLS-DA model is implemented using the mixOmics package [19]. In practice, mixOmics allows the number of variables to be selected directly instead of requiring the penalty parameter to be specified. Therefore, the main tuning parameters are the number of components (ncomp) and the number of variables retained on each component (keepX). These parameters are selected using cross-validation on the training data only. In the sPLS-DA framework, the main tuning choices are the number of components and the number of variables retained per component.
A feature is considered selected if it has a nonzero loading on at least one of the selected components. The union of the selected variables across all components forms the final feature subset. These selected features are then used as predictors in the second-stage multinomial logistic regression model. The native sPLS-DA classification result is also retained as a reference, allowing the predictive value of the selected features to be evaluated separately from the native classification procedure.
3.4. Classification
Multinomial logistic regression is used as the common second-stage classifier for the feature subsets obtained from LASSO, Elastic Net, and sPLS-DA. The response variable contains six activity classes, and only the features selected by the corresponding feature-selection method are used as predictors. For each method, the MLR model is fitted using the training data and then applied to the held-out test data. Using the same classifier for all three feature-selection methods provides a common basis for comparing the predictive value of their selected feature subsets.
This two-stage procedure is especially important for sPLS-DA. The native sPLS-DA model performs both feature selection and classification within the same framework. By applying MLR to the selected variables separately, the predictive usefulness of the selected features can be evaluated independently of the native sPLS-DA classifier.
3.5. Experimental Design and Data Leakage Control
The evaluation uses repeated subject-level train-test splits to prevent information leakage and to provide a reliable measure of model performance. In each repetition, all observations from one subject are placed either in the training set or in the test set. Therefore, observations from the same subject are not divided between the two sets. This is important because overlapping sliding windows from the same subject may contain similar information.
All feature selection and parameter tuning are performed using the training data only. Feature selection is repeated separately for each subject-level split and is not performed once using the full dataset. This process includes tuning the penalty parameters for LASSO and Elastic Net, the mixing parameter for Elastic Net, and the parameters for sPLS-DA. The test data are not used during feature selection or parameter tuning.
After the feature subset is selected, an MLR model is trained using the selected features from the training data. The fitted model is then evaluated using the test data. This procedure is repeated across several subject-level splits. The repeated evaluation is used to measure the average predictive performance and to examine how consistent the selected features are across different data splits.
Within each outer training set, hyperparameter tuning is performed using subject-level cross-validation, such that all observations from the same subject remain within the same fold. The same inner cross-validation folds are used for LASSO, Elastic Net, and sPLS-DA within each repetition to ensure a consistent comparison across methods.
3.6. Evaluation Metrics
The methods are evaluated from three main aspects: classification performance, feature-set size, and feature-selection stability.
3.6.1. Classification Performance
Accuracy is calculated as the proportion of correctly classified observations in the test set. Because the problem contains six activity classes, macro F1-score is also considered to give equal weight to each class. Multiclass AUC is used as an additional measure of class discrimination following the pairwise multiclass formulation of Hand and Till [20] and calculated using the pROC package [21]. Class-wise performance measures were derived from confusion matrices using the caret package [22], while the main reported metrics were accuracy, macro F1-score, and multiclass AUC.
3.6.2. Number of Selected Features
The number of unique features selected by each method is recorded for each repetition. A smaller feature set indicates a more compact representation, provided that predictive performance remains competitive.
3.6.3. Feature-Selection Stability
The stability of the selected feature sets is evaluated across repeated subject-level splits. Feature-selection stability reflects the reproducibility of selected variables when the training sample changes [23]. Selection frequency is first used to identify how often each feature is selected across the repetitions, following the stability analysis approach of Lê Cao et al. [9]. The Jaccard index measures the overlap between two selected feature sets [24]. As an exploratory complement, the Kuncheva index adjusts the observed overlap by taking the overlap expected by chance into account [24].
3.7. Software and Tools
All analyses were carried out in R. The glmnet package was used to run the multinomial LASSO and Elastic Net models, while sPLS-DA was carried out using the mixOmics package. The nnet package was used for multinomial logistic regression [25]. Data preparation, repeated evaluation, calculation of model performance, and analysis of the selected features were done using standard R functions and other supporting packages.
4. Theoretical Properties of the Compared Methods
This section discusses the main theoretical properties of LASSO, Elastic Net, and sparse Partial Least Squares Discriminant Analysis (sPLS-DA) that are relevant to the UCI-HAR data. The aim is not to present new theoretical results, but to explain how these methods may behave when the data contain many correlated predictors obtained from related sensor signals. The discussion focuses on sparsity, correlated predictors, multiclass classification, the separation of feature selection from classification, and the relationship between feature selection stability and interpretability.
4.1. Sparsity, Bias-Variance, and Selection Behavior of LASSO
The L1 penalty used by LASSO makes the model sparse by shrinking some coefficients exactly to zero. This penalty also affects the bias-variance trade-off of the model. Stronger shrinkage can reduce the variance of the estimates, but it can also increase the bias of the nonzero coefficients [6]. For feature selection, an important point is that LASSO selects individual predictors rather than explicitly grouping correlated predictors together.
This can be important when predictors are strongly correlated. If several sensor features contain similar information, LASSO may select one feature and exclude the others. Different training samples may therefore lead to different selected features, even when their predictive performance is similar. In linear-model theory, consistent feature selection with LASSO requires certain conditions on the design matrix, including the irrepresentable condition discussed by Zhao and Yu [26]. These theoretical results are mainly developed for linear models and are not assumed to apply directly to the multinomial logistic regression setting used in this study. Instead, they provide a reason to examine whether the selected features remain stable across different subject-level samples.
Therefore, a small number of features selected by LASSO does not necessarily mean that these features are the only important variables in the HAR data. When several features contain similar information from related accelerometer or gyroscope signals, predictive performance may remain similar even if the selected feature changes. For this reason, feature-selection stability is evaluated separately from predictive performance in the present study.
4.2. Grouping Effect and Stability-Parsimony Trade-off of Elastic Net
Elastic Net keeps the sparsity of the L1 penalty and adds an L2 penalty. The L2 component can improve coefficient stability when predictors are correlated. It also gives Elastic Net its grouping effect, where strongly correlated predictors tend to have more similar coefficient behavior than under LASSO alone [7]. This property is relevant to HAR feature sets because several variables may be obtained from the same underlying sensor signal.
The grouping effect creates a trade-off. Compared with LASSO, Elastic Net may keep several features from a correlated group instead of selecting only one. This can reduce the effect of small changes in the training data on which feature is selected. However, it can also result in a larger selected feature set. Therefore, higher feature-selection stability should be considered together with the number of selected features. A more stable model is not necessarily more interpretable if it keeps many redundant variables.
The grouping effect should therefore be considered as an expected property of Elastic Net, rather than a guarantee that it will produce the most stable feature set on UCI-HAR. The empirical analysis examines whether this property under correlated predictors leads to more consistent feature subsets while maintaining competitive predictive performance.
4.3. Sparse PLS-DA: Supervised Latent-Component Selection Under Correlation
sPLS-DA differs from penalized multinomial models because feature selection is performed while supervised latent components are being constructed. As described in Section 3.3.3, sparse loading vectors determine which original predictors contribute to each component, while the component directions are estimated in relation to the dummy-coded class matrix [9]. Therefore, the relevant theoretical property for HAR data is not only that sPLS-DA produces a sparse model, but also that feature selection is embedded within a multivariate representation of the relationship between predictors and activity classes.
This latent-component approach provides a different way to handle correlated predictors. Information from several related variables can contribute to the same discriminative direction rather than being evaluated only through individual penalized coefficients. However, this does not mean that sPLS-DA provides a formal grouping effect like Elastic Net. The selected variables depend on the estimated component directions and tuning choices, such as the number of components and the number of variables selected for each component. Therefore, correlated variables can be represented through the latent components, but the stability of the original selected variables still needs to be examined empirically.
Another important point is that feature selection and classification are conceptually different in sPLS-DA. The selected variables are used to construct the latent representation, while the native classifier assigns new observations using a classification rule in this latent space. Therefore, lower classification performance from the native sPLS-DA classifier does not necessarily mean that the selected variables contain little information for distinguishing the activity classes.
4.4. Separation of Feature Selection from Classification
The two-stage analysis used in this study separates feature selection from the final classification step. After sPLS-DA selects a subset of original UCI-HAR features, multinomial logistic regression is fitted using these selected variables. The same classifier is also applied to the feature subsets selected by LASSO and Elastic Net. Using the same classifier in the second stage makes it possible to compare the predictive information in the selected feature sets without using the native classification method of each feature-selection approach.
The general idea of combining sparse PLS-based dimension reduction with a separate classifier was proposed before the present study. Chung and Keles [16] introduced a sparse PLS classification framework in which sparse PLS is followed by a classifier such as logistic regression. Therefore, the present study does not claim to introduce the general two-stage approach. Instead, it focuses on applying and comparing sPLS-DA as a feature-selection method in smartphone-based HAR. In addition, the second-stage multinomial logistic regression is fitted to the selected original variables rather than to the latent scores produced by sparse PLS. This separation allows the contribution of feature selection and classification to be examined independently. Feature selection methods can be evaluated based on whether the selected original variables contain discriminative information, while the second-stage classifier evaluates whether these variables can support effective prediction. When both processes are performed within the same model, these two aspects are more difficult to distinguish. The repeated subject-level evaluation therefore enables an empirical assessment of both predictive performance and feature-selection consistency.
4.5. Finite-Sample Feature-Selection Stability and Interpretability
Interpretability in feature-selection studies depends not only on the number of selected features but also on how consistently they are selected [11]. In a finite sample, two training sets from the same population can give similar classification performance but select different variables. This can be especially relevant for UCI-HAR because several engineered features may contain similar information from the same underlying motion signals.
The three methods may show different types of selection variability. LASSO may select different variables from a group of correlated predictors because sparsity is imposed at the predictor level, while correlated predictors are not explicitly grouped together by the LASSO penalty. Elastic Net may reduce this effect through its L2 component and grouping effect, although it may also keep more variables. sPLS-DA may select different variables when the estimated component directions or tuning parameters change across training samples, even when the resulting latent components retain similar discriminative information. Therefore, these theoretical properties do not guarantee that one method will always have the most stable feature selection. For this reason, the study considers predictive performance and feature-selection stability separately. Accuracy, macro F1-score, and multiclass AUC are used to evaluate prediction on unseen subjects. The Jaccard index and selection frequencies described in Section 3.6.3 are used to evaluate how consistently the original features are selected. The Kuncheva index is reported as an exploratory measure for a fixed subset size. This distinction is important for determining whether a compact HAR model is also interpretable in a reproducible manner.
4.6. Comparative Theoretical Summary
Table 4.1 summarizes how the three methods are expected to behave when the predictors are correlated. The experimental results are then used to see whether these expected differences are observed in the UCI-HAR data.
5. Results for HAR Dataset Study
5.1. Dataset and Feature Correlation Structure
The empirical study uses the complete UCI Human Activity Recognition Using Smartphones (UCI-HAR) dataset [1]. The dataset contains 10,299 observations from 30 subjects performing six activities: walking, walking upstairs, walking downstairs, sitting, standing, and laying. Each observation contains 561 time- and frequency-domain features obtained from accelerometer and gyroscope signals. The original signals were divided into 2.56-second windows with 50% overlap.
The publicly available dataset has predefined training and test sets. In this study, these two sets are combined before resampling so that all 30 subjects can be included in the repeated subject-level evaluation. The original subject identifiers are kept. For each repetition, new training and test sets are created at the subject level. Therefore, all observations from the same subject remain in the same set. Combining the original training and test sets does not cause information leakage because the new training and test sets are created only after the complete set of subjects is reconstructed.
The feature matrix also shows a high level of redundancy. Among the 157,080 unique feature pairs, 8,093 pairs (5.15%) have an absolute Pearson correlation greater than 0.90. The approximate condition number of the full correlation matrix is 2.02 1012. These results indicate strong multicollinearity among the features and provide an empirical reason for comparing sparse feature-selection methods on the UCI-HAR dataset.
5.2. Repeated Subject-Level Experimental Design
Predictive performance is evaluated using repeated subject-level train-test splits. In each repetition, 21 of the 30 subjects (70%) are used as the training set, while the remaining nine subjects (30%) are kept as the test set. The subjects are assigned to the two sets without replacement within each repetition. Therefore, a subject cannot be included in both sets in the same repetition, and all observations from the same subject remain in one set.
This process is repeated 30 times using reproducible random seeds. The purpose of using 30 repetitions is not to suggest that this is the optimal number of repetitions. Instead, repeated splitting reduces the dependence on one particular train-test split and shows how model performance and selected features change when different subjects are used for testing. Thirty repetitions were chosen as a practical balance between obtaining results from different unseen-subject splits and the computational cost of tuning the three feature-selection methods. Since nine out of 30 subjects are used for testing in each repetition, a particular subject has a 0.30 probability of being selected for the test set in one repetition. Over 30 repetitions, a subject is therefore expected to appear in the test set about nine times. However, the procedure does not require every subject to appear exactly nine times.
For each repetition, the 21 training subjects are further divided into five folds for subject-level cross-validation. Each fold contains approximately four or five subjects. All observations from the same subject are kept in the same fold. The same five-fold partition is used for LASSO, Elastic Net, and sPLS-DA within each repetition. This allows the three methods to be tuned using the same validation subjects. The nine test subjects are kept separate and are not used for feature selection, hyperparameter tuning, or model fitting. The overall experimental configuration is summarized in Table 5.1.
5.3. Model Tuning and Implementation Settings
For the LASSO model, multinomial regression is fitted with alpha = 1 and a grouped multinomial penalty. The regularization path is evaluated using the subject-level inner folds, with deviance used as the cross-validation criterion. The value lambda.min is selected and used to fit the final model within each repetition. A predictor is considered selected when the L2 norm of its grouped coefficient vector across the six activity classes is nonzero at the selected lambda.
Elastic Net uses the same subject-level inner folds as LASSO. The mixing parameter alpha is tested at 0.1, 0.3, 0.5, 0.7, and 0.9. For each alpha value, the lambda values are evaluated using cross-validation, and the minimum cross-validation deviance and its corresponding lambda.min are obtained. The alpha value with the smallest minimum cross-validation deviance is then selected, together with its corresponding lambda.min. These two values are used to fit the final grouped multinomial model and determine the selected feature set.
The sPLS-DA model is tuned using the training data only. The number of latent components (ncomp) is searched from 1 to 10. The value 10 is used as the upper limit of the search, not as a fixed number of components. Therefore, the selected ncomp can be different across repetitions based on the inner cross-validation error. This range provides flexibility for the six-class problem while keeping the tuning process computationally manageable.
The candidate values for keepX are 5, 10, 20, 30, 50, 75, and 100 variables per component. Tuning is performed sequentially across the components. For each component, the keepX value with the lowest subject-level cross-validation classification error is selected before moving to the next component. The final number of components is then determined by the lowest inner cross-validation error along the tuned component path. The max.dist rule is used during tuning. After the final sPLS-DA model is fitted, its native classification performance is also evaluated using max.dist, centroids.dist, and mahalanobis.dist. These three rules are applied to the same fitted sPLS-DA model and are not treated as separate feature-selection procedures.
After feature selection, the original variables selected by LASSO, Elastic Net, and sPLS-DA are used as predictors in a common unpenalized multinomial logistic regression model fitted with the nnet package. Before fitting this second-stage classifier, the selected predictors are standardized using the mean and standard deviation calculated from the outer training set only. The same training-based values are then used to standardize the outer test set. This prevents information from the test subjects from being used during model preparation. Using the same downstream classifier for all three methods also allows the predictive value of their selected feature subsets to be compared independently of their native classification rules.
For each repetition, the analysis records the predictive metrics, confusion matrix, number and identity of selected features, tuning parameters, and computation time. A checkpoint file is saved after each completed repetition so that the final results can be compiled from all completed subject-level runs.
5.4. Predictive Performance Across Repeated Splits
Predictive performance across the 30 repeated subject-level test splits is summarized in Table 5.2. The native LASSO and Elastic Net models gave the best overall results. Native LASSO had a mean accuracy of 0.9514 ± 0.0166 and a mean macro F1-score of 0.9513 ± 0.0168. Native Elastic Net had a mean accuracy of 0.9504 ± 0.0187 and a mean macro F1-score of 0.9506 ± 0.0185. Their mean multiclass AUC values were also almost the same at about 0.9970. The difference in mean accuracy was only about 0.10 percentage points, showing that the two native regularized models had very similar predictive performance.
For native sPLS-DA, max.dist gave the best result, with a mean accuracy of 0.8831 ± 0.0283 and a mean macro F1-score of 0.8806 ± 0.0288. The mean accuracies for centroids.dist and mahalanobis.dist were 0.8685 and 0.8611, respectively. The three distance rules had the same mean AUC of 0.9855 ± 0.0054 because they used the same fitted sPLS-DA model and prediction scores, while the distance rule changed the final class decision. Overall, native sPLS-DA had lower accuracy and macro F1-score than the native LASSO and Elastic Net models in the repeated unseen-subject evaluation.
Using the same unpenalized MLR classifier after feature selection did not improve prediction. LASSO-selected features followed by MLR had a mean accuracy of 0.8702 ± 0.0216. Elastic-Net-selected features followed by MLR had a mean accuracy of 0.8637 ± 0.0267, while sPLS-DA-selected features followed by MLR had a mean accuracy of 0.8519 ± 0.0226. All three values were lower than the results from their native models. This shows that the performance of a selected feature set also depends on the classifier and on whether the native model uses regularization or a latent-space decision rule.
5.5. Feature-Set Size and Selection Stability
The three feature-selection methods kept different numbers of features across the 30 repetitions. LASSO selected 169.8 ± 25.4 features on average, with a range from 134 to 225. This is about 30% of the original 561 features. Elastic Net selected 255.5 ± 114.4 features on average, with a wider range from 157 to 519. sPLS-DA selected the largest feature sets, with an average of 353.7 ± 47.5 features and a range from 199 to 426. Compared with the full feature set, the average feature reductions were about 69.7% for LASSO, 54.5% for Elastic Net, and 37.0% for sPLS-DA.
The Jaccard results gave a different ranking from feature-set size. sPLS-DA had the highest mean Jaccard index at 0.6611 ± 0.0756, followed by LASSO at 0.6211 ± 0.0519 and Elastic Net at 0.5730 ± 0.1257. Elastic Net also had the largest variation in Jaccard values. This means that its grouping effect did not lead to the highest feature-set overlap in this dataset. However, the higher Jaccard value of sPLS-DA should be considered together with its larger feature sets, because larger sets can have more shared features while still being less compact.
The selection-frequency results also showed a stable group of sensor-based features. For example, tGravityAcc-mean()-X, tGravityAcc-mean()-Y, and tGravityAcc-max()-Y were selected in all 30 repetitions by LASSO, Elastic Net, and sPLS-DA. This shows that some gravity-acceleration features remained important even when the training subjects changed. The complete selection-frequency tables were produced separately for the three methods and can be used to identify other features that were selected often.
A fixed-size Kuncheva analysis was also calculated using the 30 highest-ranked selected features in each repetition. The values were 0.5840 for LASSO, 0.5870 for Elastic Net, and 0.5680 for sPLS-DA. These values are treated as exploratory because the choice of 30 features was not based on a specific HAR requirement and the main methods selected feature sets of different sizes. For this reason, the Jaccard index and selection frequencies are given more attention in the main stability analysis.

Table 5.3.
Feature-set size and pairwise Jaccard stability across 30 repetitions.
| Selector | Selected features, mean ± SD | Range | Jaccard, mean ± SD |
| LASSO | 169.8 ± 25.4 | 134–225 | 0.6211 ± 0.0519 |
| Elastic Net | 255.5 ± 114.4 | 157–519 | 0.5730 ± 0.1257 |
| sPLS-DA | 353.7 ± 47.5 | 199–426 | 0.6611 ± 0.0756 |
5.6. Summary of Empirical Findings
Overall, no single method was best for every evaluation criterion. Native LASSO and Elastic Net gave the best predictive performance, with almost the same mean accuracy and AUC. However, LASSO reached this performance with a much smaller and more consistent feature-set size than Elastic Net. Under the current tuning design, LASSO therefore gave the best balance between prediction performance and a compact feature set.
sPLS-DA had the highest mean Jaccard overlap, but it selected the largest feature sets and had lower native classification accuracy. In addition, using the selected original variables in a common unpenalized MLR did not improve sPLS-DA performance and also reduced performance for the LASSO- and Elastic-Net-selected feature sets. These results show that feature selection and the final classifier should be evaluated together. A feature set with high stability does not always give the best prediction when it is used with a different classifier.
6. Discussion
The repeated subject-level experiment showed a clear difference between the native regularized models and the two-stage models. Native LASSO and Elastic Net both reached mean accuracies of about 95%, while the best native sPLS-DA rule reached about 88%. The test subjects were not used during model fitting or tuning, so these results describe performance on unseen subjects. For this reason, the results should be interpreted within this subject-level validation design and should not be directly compared with results from studies that use different validation procedures.
LASSO and Elastic Net had very similar predictive performance, but they selected quite different numbers of features. Elastic Net is expected to keep correlated predictors together because of its L2 component. In this study, however, Elastic Net selected many more variables and had a lower mean Jaccard index than LASSO. This does not mean that the grouping effect is incorrect. It shows that the grouping effect does not always produce the most stable feature set in a finite sample. The large variation in the number of Elastic Net features also shows that different selected alpha and lambda values produced different levels of sparsity across the subject splits.
sPLS-DA showed a different trade-off. It had the highest mean Jaccard overlap, which means that its selected feature sets had relatively high agreement across repeated training samples. However, it selected more than 350 features on average, so it did not produce the most compact model. The max.dist rule also gave better native classification performance than centroids.dist and mahalanobis.dist on average. These results show that sPLS-DA produced relatively consistent selected feature sets across repeated splits, but this did not guarantee the smallest feature set or the best final class prediction.
One important result is that fitting unpenalized MLR on the selected original features reduced accuracy for all three methods. Under the repeated subject-level design, the native LASSO and Elastic Net models kept the benefit of regularization, while this shrinkage was removed in the second-stage MLR. For sPLS-DA, useful information may also depend on the latent components and the native decision rule, not only on the selected original variables. Therefore, the two-stage analysis is still useful even though it did not improve accuracy, because it shows that feature selection and classification are related and should not be treated as completely separate parts.
For interpretability, both feature-set size and selection consistency are important. LASSO kept about 30% of the original features and still had the highest mean accuracy. sPLS-DA had higher pairwise overlap, but it kept about 63% of the original features. Several gravity-acceleration features were selected in every repetition by all three methods, showing that there is a stable core of important predictors even though the full selected sets changed. In this study, interpretability is therefore better described by feature-set size, repeated feature selection, and predictive performance together rather than by one stability value alone.
This study has several limitations. First, the analysis uses one benchmark dataset with 30 subjects and six activities, so the results may differ for other devices, populations, or activity sets. Second, the reported results depend on the tuning ranges used for Elastic Net and sPLS-DA. For Elastic Net, in 6 of the 30 repetitions (20%), the inner cross-validation selected α ≤ 0.3, which corresponded to considerably larger feature sets (465–519 of the 561 variables, or about 83–92%). This pattern may be related to the limited number of subjects available per inner fold (approximately 4–5 subjects) and small differences in deviance across α values. For sPLS-DA, the selected number of components (ncomp) reached the upper bound of the tuning grid (ncomp = 10) in 27 of the 30 repetitions (90%), and the per-component keepX parameter reached its upper bound (100) in about 25.9% of component-level selections. Because the tuning grid was defined based on the scope of this study, wider grids may lead to different feature selection patterns. Therefore, the sPLS-DA results should be interpreted as conditional on the evaluated tuning range rather than as an absolute measure of model parsimony. Future studies should investigate wider tuning ranges and their effects on feature selection stability and model complexity.
Future research can extend this study by testing the three feature-selection methods on other HAR datasets, using other regularized or downstream classifiers, and examining different tuning settings for sPLS-DA. These studies can help determine whether the patterns found here are specific to UCI-HAR or also appear in other smartphone-based HAR problems.
7. Conclusions
This study compared LASSO, Elastic Net, and sPLS-DA for feature selection in smartphone-based human activity recognition using the complete UCI-HAR dataset. The evaluation used repeated subject-level train-test splits and the same subject-level inner folds for all three methods. This design allowed predictive performance, feature-set size, and selection stability to be compared under the same data-splitting procedure. The original features selected by each method were also tested with the same unpenalized multinomial logistic regression classifier to separate feature selection from the native classification rule.
The results showed that native LASSO and Elastic Net had the best predictive performance, with mean accuracies of 95.14% and 95.04%, respectively. LASSO reached this performance with the smallest average feature set, selecting about 170 of the 561 original variables, while Elastic Net selected about 256. sPLS-DA had the highest mean Jaccard overlap across repeated splits, but it selected about 354 variables on average and had lower native classification accuracy. Using the same unpenalized MLR on the selected feature sets reduced accuracy for all three methods. This shows that the quality of a selected feature set also depends on the classifier used after selection.
Overall, LASSO gave the best balance between predictive performance and a smaller feature set under the current experimental design. sPLS-DA showed that higher feature-set overlap can occur together with a much larger selected feature set. The results support the use of several evaluation criteria for HAR feature selection instead of using predictive accuracy alone.
Author Contributions
Conceptualization, N.K., S.E.A. and D.A.; methodology, N.K., E.Y. and D.A.; software, N.K. and E.Y.; validation, N.K. and E.Y.; formal analysis, N.K.; investigation, N.K.; data curation, N.K.; visualization, N.K.; writing—original draft preparation, N.K.; writing—review and editing, S.E.A., E.Y. and D.A.; supervision, S.E.A. and D.A. All authors have read and agreed to the published version of the manuscript.
Funding
This research received no external funding.
Institutional Review Board Statement
Not applicable.
Informed Consent Statement
Not applicable.
Data Availability Statement
The data analyzed in this study are publicly available in the UCI Machine Learning Repository, Human Activity Recognition Using Smartphones dataset.
Acknowledgments
The research of S. Ejaz Ahmed was supported by the Natural Sciences and the Engineering Research Council (NSERC) of Canada. During the preparation of this manuscript, the authors used ChatGPT (GPT-5.6 Sol) for language proofreading and code debugging. The authors have reviewed and edited the output and take full responsibility for the content of this publication.
Conflicts of Interest
The authors declare no conflict of interest.
References
- Anguita, D.; Ghio, A.; Oneto, L.; Parra, X.; Reyes-Ortiz, J. L. A Public Domain Dataset for Human Activity Recognition Using Smartphones. In Proceedings of the 21st European Symposium on Artificial Neural Networks, Computational Intelligence and Machine Learning (ESANN 2013), Bruges, Belgium, 2013; pp. 437–442. [Google Scholar]
- Ravi. Stacked Generalization for Human Activity Recognition. Sep 2020. Available online: http://arxiv.org/abs/2009.10312.
- Yilmaz, E.; Aydin, D. Integrating sparse principal component analysis in high-dimensional partially linear models: A local polynomial approach. In Advanced Studies in Nonlinear Dynamical Systems; Baleanu, D., Bayram, M., Secer, A., Eds.; Springer: Cham, Switzerland, 2025; vol. 41, pp. 35–51. [Google Scholar] [CrossRef]
- Capela, N. A.; Lemaire, E. D.; Baddour, N. Feature selection for wearable smartphone-based human activity recognition with able bodied, elderly, and stroke patients. PLoS ONE 2015, vol. 10(no. 4). [Google Scholar] [CrossRef]
- Doewes; Swasono, S. E.; Harjito, B. Feature Selection on Human Activity Recognition using Minimum Redundancy Maximum Relevance. In 2017 IEEE International Conference on Consumer Electronics-Taiwan (ICCE-TW); IEEE, 2017. [Google Scholar]
- Ahmed, S. E.; Ahmed, F.; Yüzbaşı, B. Post-Shrinkage Strategies in Statistical and Machine Learning for High Dimensional Data; CRC Press: Boca Raton, FL, USA, 2023. [Google Scholar]
- Zou, H.; Hastie, T. Regularization and variable selection via the elastic net. J. R. Stat. Soc. Ser. B Stat. Methodol. 2005, vol. 67(no. 2), 301–320. Available online: https://academic.oup.com/jrsssb/article/67/2/301/7109482. [CrossRef]
- Ariza, F. A.; Sutarman; Amalia, A. The Performance of Feature Selection with the Stability Selection Method in Human Activity Recognition (HAR) Classification Using the Lasso Regression Algorithm. in Proceedings - 2025 4th International Conference on Electronics Representation and Algorithm: Artificial Intelligence: Creating Tomorrow’s World Today, ICERA 2025, 2025; Institute of Electrical and Electronics Engineers Inc.; pp. 388–393. [Google Scholar] [CrossRef]
- Lê Cao, K. A.; Boitard, S.; Besse, P. Sparse PLS discriminant analysis: Biologically relevant feature selection and graphical displays for multiclass problems. BMC Bioinform. 2011, vol. 12. [Google Scholar] [CrossRef]
- Dentamaro, V.; Gattulli, V.; Impedovo, D.; Manca, F. Human activity recognition with smartphone-integrated sensors: A survey. Expert Syst. Appl. 2024, vol. 246. [Google Scholar] [CrossRef]
- Manca, M. M.; Pes, B.; Riboni, D. Exploiting Feature Selection in Human Activity Recognition: Methodological Insights and Empirical Results Using Mobile Sensor Data. IEEE Access 2022, vol. 10, 64043–64058. [Google Scholar] [CrossRef]
- Ahmed, N.; Rafiq, J. I.; Islam, M. R. Enhanced human activity recognition based on smartphone sensor data using hybrid feature selection model. Sensors 2020, vol. 20(no. 1). [Google Scholar] [CrossRef]
- Meinshausen, N.; Bühlmann, P. Stability selection. J. R. Stat. Soc. B 2010, 417–473. [Google Scholar] [CrossRef]
- Ahmed, S. E.; Aydın, D.; Yılmaz, E. Penalty and shrinkage strategies based on local polynomials for right-censored partially linear regression. Entropy 2022, vol. 24(no. 12, Art. no. 1833). [Google Scholar] [CrossRef]
- Yılmaz, E.; Ahmed, S. E.; Aydın, D. Bayesian Elastic Net Cox models for time-to-event prediction: Application to a breast cancer cohort. Entropy 2026, vol. 28(no. 3, Art. no. 264). [Google Scholar] [CrossRef]
- Chung, D.; Keles, S. Sparse partial least squares classification for high dimensional data. Stat. Appl. Genet. Mol. Biol. 2010, vol. 9(no. 1). [Google Scholar] [CrossRef]
- Dehghani; Glatard, T.; Shihab, E. Subject Cross Validation in Human Activity Recognition. 1904.02666. 2019. [Google Scholar] [CrossRef]
- Tibshirani, R. Regression Shrinkage and Selection via the Lasso. J. R. Stat. Soc. Ser. B 1996, vol. 58(1), 267–288. [Google Scholar] [CrossRef]
- Rohart, F.; Gautier, B.; Singh, A.; Lê Cao, K. A. mixOmics: An R package for ‘omics feature selection and multiple data integration. PLoS Comput. Biol. 2017, vol. 13(no. 11). [Google Scholar] [CrossRef]
- Hand, D. J.; Till, R. J. A Simple Generalisation of the Area Under the ROC Curve for Multiple Class Classification Problems. Mach. Learn. 2001, vol. 45, 171–186. [Google Scholar] [CrossRef]
- Robin, X.; et al. pROC: An open-source package for R and S+ to analyze and compare ROC curves. BMC Bioinform. 2011, vol. 12. [Google Scholar] [CrossRef]
- Kuhn, M. Building Predictive Models in R Using the caret Package. J. Stat. Softw. 2008, vol. 28(no. 5). Available online: http://www.jstatsoft.org/.
- Nogueira, S.; Sechidis, K.; Brown, G. On the Stability of Feature Selection Algorithms. J. Mach. Learn. Res. 2018, vol. 18, 1–54. Available online: http://jmlr.org/papers/v18/17-514.html. [CrossRef]
- Khaire, U. M.; Dhanalakshmi, R. Stability of feature selection algorithm: A review. J. King Saud Univ.-Comput. Inf. Sci. 2022, vol. 34(no. 4), 1060–1073. [Google Scholar] [CrossRef]
- Venables, W. N.; Ripley, B. D. Modern Applied Statistics with S, 4th ed.; Springer, 2002. [Google Scholar]
- Zhao, P.; Yu, B. On Model Selection Consistency of Lasso. J. Mach. Learn. Res. 2006, vol. 7, 2541–2563. [Google Scholar]
Table 4.1.
Comparative theoretical properties of the feature-selection methods under correlated predictors.
Table 4.1.
Comparative theoretical properties of the feature-selection methods under correlated predictors.
| Property | LASSO | Elastic Net | sPLS-DA |
| Expected feature-set size | Often relatively compact | Potentially larger than LASSO | Controlled by ncomp and keepX |
| Main finite-sample sensitivity | Substitution among correlated predictors | Parsimony-stability trade-off and alpha/lambda tuning | Component and keepX/ncomp dependence |
| Relationship between selection and classification | Selection and native multinomial model are coupled | Selection and native multinomial model are coupled | Sparse selection and latent-space decision rule can be evaluated separately |
| Empirical question in this study | Reproducibility of sparse feature sets across subjects | Whether grouping improves stability without excessive redundancy | Predictive and stability assessment of selected original features using a common MLR classifier |
| Primary selection mechanism | Sparse coefficient vectors with joint penalization across activity classes | Grouped penalized coefficient vectors with L2 stabilization | Sparse supervised component loadings for latent components |
Table 5.1.
Final experimental configuration used in the repeated subject-level study.
| Setting | Configuration |
| Total subjects | 30 |
| Outer training set | 21 subjects (70%) |
| Outer test set | 9 subjects (30%) |
| Outer repetitions | 30 |
| Inner validation | 5-fold subject-level cross-validation |
| Shared folds | Same inner subject folds for LASSO, Elastic Net, and sPLS-DA |
| LASSO | Multinomial L1 penalty; alpha = 1; lambda = lambda.min |
| Elastic Net alpha grid | 0.1, 0.3, 0.5, 0.7, 0.9 |
| Elastic Net lambda | lambda.min for the selected alpha |
| sPLS-DA ncomp search | 1-10 components |
| sPLS-DA keepX grid | 5, 10, 20, 30, 50, 75, 100 variables per component |
| sPLS-DA tuning distance | max.dist |
| Native sPLS-DA distances | max.dist, centroids.dist, mahalanobis.dist |
| Common downstream classifier | Unpenalized multinomial logistic regression |
Table 5.2.
Predictive performance across 30 repeated subject-level test splits (mean ± standard deviation).
Table 5.2.
Predictive performance across 30 repeated subject-level test splits (mean ± standard deviation).
| Method | Accuracy | Macro F1 | Multiclass AUC |
| LASSO native | 0.9514 ± 0.0166 | 0.9513 ± 0.0168 | 0.9970 ± 0.0020 |
| LASSO-selected + MLR | 0.8702 ± 0.0216 | 0.8690 ± 0.0218 | 0.9460 ± 0.0178 |
| Elastic Net native | 0.9504 ± 0.0187 | 0.9506 ± 0.0185 | 0.9970 ± 0.0020 |
| Elastic-Net-selected + MLR | 0.8637 ± 0.0267 | 0.8629 ± 0.0266 | 0.9614 ± 0.0124 |
| sPLS-DA native (max.dist) | 0.8831 ± 0.0283 | 0.8806 ± 0.0288 | 0.9855 ± 0.0054 |
| sPLS-DA native (centroids.dist) | 0.8685 ± 0.0228 | 0.8646 ± 0.0230 | 0.9855 ± 0.0054 |
| sPLS-DA native (mahalanobis.dist) | 0.8611 ± 0.0280 | 0.8556 ± 0.0297 | 0.9855 ± 0.0054 |
| sPLS-DA-selected + MLR | 0.8519 ± 0.0226 | 0.8505 ± 0.0236 | 0.9551 ± 0.0179 |
Disclaimer/Publisher’s Note: The statements, opinions and data contained in all publications are solely those of the individual author(s) and contributor(s) and not of MDPI and/or the editor(s). MDPI and/or the editor(s) disclaim responsibility for any injury to people or property resulting from any ideas, methods, instructions or products referred to in the content. |
© 2026 by the authors. Licensee MDPI, Basel, Switzerland. This article is an open access article distributed under the terms and conditions of the Creative Commons Attribution (CC BY) license.
Copyright: This open access article is published under a Creative Commons CC BY 4.0 license, which permit the free download, distribution, and reuse, provided that the author and preprint are cited in any reuse.