

Submitted:
30 August 2026
Posted:
31 August 2026
You are already at the latest version
Abstract
Background: Climate change poses increasing environmental and public health risk, particularly in arid regions, understanding how population perceives this risk and translating awareness into adoptive behavior is essential for effective climate resilience strategies. This study examined climate change risk perception and adoptive behavior among Hail region population in Saudi Araba using Health Belief Model (HBM). Methods: Cross-Sectional study was conducted among 460 participants using structured questionnaire based on HBM constructs. Data was analyzed by applying descriptive statistics, superman's correlation, logistic regression, and structural equation modeling to assess the predictors and pathways influencing adoptive behavior. Results: About half of participants stated high climate change risk perception (50.7%) and adoptive behavior (53.9%). Education, gender, and employment sector were significant predictors of risk perception, however adoptive behavior displayed constrained sociodemographic associations. Correlation analysis revealed strong relationships adoptive behavior and enabling constructs, particulary perceived benefits and self-efficacy than with susceptibility and severity. Path analysis demonstrated that risk perception significantly influenced adoptive behavior (β=1.00, p < 0.001) however, perceived barrier exerted strongest effect (β=0.70), followed by benefits, cues to action, and self-efficacy. The model displayed satisfactory fit and illuminated a substantial proportion of variance in adoptive behavior.Conclusion: The results confirm a perception- behaviors gap, indicate that climate change awearness alone does not ensure adoptive action. Enabling and related factors play a decisive role in behavioral adoption. Interventions should therefore be more beyond risk communication toward barrier reduction, capacity building, and supportive policy measures to enhance climate adaptation and public health resilience in arid sitting areas.
Keywords:
climate change
; public health
; perception
; awareness
; climate adaptation
1. Introduction
Climate change is a major global challenge affecting environmental, health, and socioeconomic development [1,2]. Rising temperatures, intensified heatwaves, water scarcity, and ecosystem degradation threaten human health and livelihoods, particularly on arid and semi-arid regions [1,3]. These impacts heights the need to understand community behaviors supporting climate change resilience, and sustainability [2]. Risk perception is central psychological determinant of responses to environmental and health-related threats [4,5]. It shows the individual subjective evaluation of the possibility and severity of harm and has constantly associated with the motivation to participate in protective and adoptive behaviors [4,6]. However, empirical evidence indicates that intensified risk perception does not essentially translate into sustained behavioral change [7]. Meta-analyses explain that risk appraisal may influence intention, actual adoptive behavior is often controlled by perceived barriers, limited self-efficacy, and background limitations [6,7]. Behavioral theories provide a systematic framework for explaining this perception-behavior gap [8]. The Health Belief Model (HBM) is among the most extensively applied and empirically validated models in health behavior research [9,10,11]. In recent years, HBM and linked socio-cognitive framework have been increasingly used to climate change adaptation research [12,13]. Studies demonstration climate change risk perception and efficacy beliefs are positively connected with adoptive and pro-environmental behaviors [14]. Research further highlights the role of adoptive capability, response ability, and psychological adaptation in manipulating personal responses to climate risks [1,13]. Moreover psychological distance and background limitations have been explained to moderate translation of climate concern into behavioral activity [5,15,16]. Despite these advances, important gaps remain in literature [2,13]. Most presented empirical evidence from Western, East Asian, or agriculture contexts, with constrained representation from arid regions and Gulf countries [3,15]. Many studies emphasize mitigation or policy preference rather than personal adoptive behaviors relevant to daily health protection [16]. Several studies report that although perceived susceptibility and severity are high, adoptive behaviors remain low, suggesting that enabling factors play a more decisive role than threat appraisal alone [17]. Emerging evidence shows growing public awareness of climate change in Saudi Arabia [18]. However, theory-driven population-based studies explicitly linking climate change risk perception to adoptive behavior remain scare in Saudi Arabia [19,20]. Regional climate variability and exposure pattern within Saudi Arabia have been well documented, providing important contextual understanding of climate risk [21]. Nevertheless, limited attention has been given to how these climatic realities are perceived by local populations and how such perception influence adoptive responses [13,15]. The Hail region exposure to extreme heat events, makes the relevant to setting for study climate change risk perception and adoptive behavior [18]. This study addressing the limited empirical understanding of the pathways linking risk perception to adoptive behaviors in arid-region population [13]. The objectives of this study are to assess the climate change risk perception and adoptive behaviors among the hail population, and examine the HBM relationships [9,10]. Evaluate the relative explanatory power of threat appraisal versus enabling constructs [6,15]. And test the applicability of HBM in climate change adaptation context in Saudi Araba [11]. By addressing these objectives, this study contributes to the growing literature on climate change related behavior adaptation by extending the application of HBM to an under-studied arid region population [12]. Finding will quid climate communication, public health intervention, and policy by highlighting barriers reduction, capacity building and institution support [2,18]
2. Materials and Methods
2.1. Study Design, Population, and Study Area
This cross-sectional study aimed to assess climate change risk perception and adoptive behaviors among the adult population of the Hail region, Saudi Arabia. We used the health belief model HBM as theoretically framework to develop the instrument, which was subsequently validated for its psychometric properties. The Hail province of Saudi Arabia is distinguished by a desert climate, resulting in extremely hot and dry summers where average daily maximum temperatures typically range from 35 °C to 40 °C [21]. Heatwaves are frequent, with temperatures often suppressing 45 °C; a record high of 48.5 °C was documented in July 2017. Significant heatwave events were documented in 2016, 2017, and 2019, with the July 2017 heatwave temperatures steadily above 46 °C for over a week, and the summer of 2019 the temperatures reach up to 47 °C [21].
Using Yamane’s formula [22]. to obtain the minimum sample size required from a population of 485,700 and a margin of error of approximately 0.05 (or 5%), was used as follows:
The minimum required sample size was increased by 15% to account for non-response, resulting in a total of 460 participants.
2.2. Inclusion and Exclusion Criteria
The following were considered as inclusion criteria: 1) Saudi nationality or legal residency in Saudi Arabia; 2) being 20 years of age or older; and 3) having the ability to understand and complete the questionnaire independently. In addition, individuals were excluded if they had cognitive or communication difficulties that affected comprehension or if they submitted incomplete or duplicate responses.
2.3. Measurement Tools
First, a comprehensive literature review was conducted to identify the main constructions regarding climate change awareness that were culturally appropriate to the study population, using HBM framework. HBM is a psychological framework that aims to explain and predict health-related behaviors by concentrating on individuals’ beliefs and attitudes [11] Hence, the authors created the initial instruments, encompassing six domains and 53 items. The items were rated using a five-point Likert scale, ranging from strongly disagree to strongly agree. This was then carefully drafted to reflect culturally appropriate and contextually specific phenomena.
Secondly, the initial draft, which used clear, accessible language for the study population, endured various rounds of critical review by experts in the health field, including researchers fluent in Arabic. Experts’ comments focused on contents validity, semantic clarity, and conceptual appropriateness. This feedback led to repetitive refinements that enhanced the precision and comprehensibility of the instrument.
Third, a pilot test was conducted with 43 participants from the study population. Additionally, an exploratory factor analysis, along with reliability and validity tests, was conducted to verify the validity and reliability of the instrument. According to the results, it is used to make the final version. We reach the final tool by excluding some questions and consolidating others with similar meaning. The outcome of this rigorous multi-process was a robust 6-domain instrument comprising 25 items, each item rated on a five-point Likert scale as shown in Table 1
Finally, the instrument was revised by the authors and experts and distributed to the target population. Several statistical tests were conducted to ensure the validity and reliability of the instrument.
2.4. Data Collection
Data was collected through an online survey between March 1 and May 1, 2025. The questionnaire was shared on Twitter and WhatsApp, utilizing a convenience sampling method. To ensure representation of the selected sample, focal people from different areas were assigned to recruit participants. Questionnaire links were distributed at different times and dates to raise response rates. Participants provided informed consent before completing the questionnaire.
2.5. Data Analysis
Data analysis was conducted using BM SPSS Statistics (version 23.0) for descriptive and inferential analysis and IBM SPSS AMOS (version 23.0) for confirmatory factor analysis and path modeling. All statistical tests were two tailed, and statistically significant was set at p < 0.05. The reliability and internal consistency of the questionnaire was assessed using Cronbach’s alpha, which evaluates the extent to which item within each construct consistency measures the same underlying concept. Cronbach’s alpha values range from 0 to 1 with values ≥0.90 considered excellent, 0.80–0.89 good, 0.70–0.79 acceptable, 0.60–0.69 questionable, 0.50–0.59 poor, and ≤0.50 unacceptable [23]. To establish structural validity, both exploratory factor analysis and confirmatory factor analysis were employed. Structure validity reflects the degree to which the observed variables adequately represent the theoretical constructs of interest [24]. Exploratory factor analysis was first conducted on pilot data to explore the latent factor structure and verify that items loading appropriately on to their intended Health belief model domains. This step facilitate refinement and ensured conceptual alignment prior to large scale application [25].
Confirmatory factor analysis was subsequently performed on the full study sample to confirm the factor structure identified by Exploratory factor analysis. A six-factor coordinated model correspondingly to Health Belief Model constructs was tested using maximum likelihood estimation, allowing correlation among latent variables according to the theory. Weighted Generalized Least Squares estimation and Promax rotation were applied to count for ordinal data and inter-factor correlations [26]. Model adequacy was evaluated using establish goodness-of-fit criteria: RMSEA <0.08, GFI and AGF > 0.90 , and CMIN/df < 2, while value below 5 were considered acceptable [27,28,29].
Risk perception was operationalized as a composite construct derived from perceived susceptibility and perceived severity, consistent with classical HBM theory, which conceptualizes threat as the interaction of these two components [9]. For each participant, total susceptibility and severity scores were multiplied to generate a continuous risk perception index. To facilitate regression analysis, the index was dichotomized into low and high-risk perception using median split.
Descriptive statistics were computed to summarize participant’s demographic characteristics and responses to HBM construct items. Frequencies and percentages were reported for categorical variables, while median and interquartile ranges (IQRs) were used for ordinal and non-normally distributed variables. HBM were categorized into low and high level using mean score the cut-off point method commonly applied in HBM-based research to enhance interpretability [10]. Sperman’s rank correlation coefficient was used to assess associations among HBM constructs due to the ordinal nature of Likert-scale data and deviations from normality. Correlation coefficients were interpreted as weak (<0.30). moderate (0.30-0.59) or strong (≥ 0.60). this analysis examined theoretical coherence among constructs and informed subsequent multivariate modeling [30].
Univariate logistic regression analyses were conducted to assess the crude association between demographic variables and tow binary outcome variables, risk perception low high and adoptive behavior low high. Predictor variables included age group. Gender, education level, employment status, employment sector. Variables with p ≤ 0.20 in univariate analysis were entered into multivariate logistic regression model to identify independent prediction while controlling confounding. Adjusted odd ratios (Ors) with 95% confidence intervals were reported, and multicollinearity were evaluated prior to model estimation [31].
To test the theoretical pathways proposed by health belief model, path analysis was conducted using AMOS perceived susceptibility and perceived severity were specified as exogenous predictors of risk perception, while risk perception, perceived benefits, perceived barrier, self-efficacy, and cues to action were modeled as predictors of adoptive behavior. Standardized path coefficient β, critical ratios (C.R), p-values, and coefficients of determination R2 were reported to assess effect size and explanatory power. Model fit was evaluated using X2/df<5, CFI/IFI/NFI≥ 0.90, and RMSA ≤ 0.08 [28]
3. Results
Table 1 tests whether socio-demographic properties describe variations in climate change risk perception and adoptive behavior. However, gender, education, and work sector were correlated with perceived risk, adoptive behavior demonstrated limited demographic patterning. This finding aligns with prior evidence that demographic variables alone inadequately explain adoptive behavior, reinforcing the importance of cognitive and contextual developments beyond population characteristics [2,6,13].
Table 2 displays that climate change risk perception is primarily influenced by education and institutional exposure rather than age or employment status. Higher education fulfillment remained a robust independent predictor after alteration, coherent with studies linking knowledge and cognitive appraisal to heightened climate risk awareness. These results support the HBM hypothesis that risk perception reflects informed threat appraisal process rather than demographic setting [4,5,11].
Table 3 explains why adoptive behavior was weakly expected by socio-demographic variables. After multivariable adjustment, most demographic variables effects reduced, indicating that behavioral adoption is not automatically driven by age, gender, or educational level. This finding is consistent with behavioral research showing that adoptive action depends more on perceived benefits, barriers, and efficacy than on demographic characteristics alone [3,13,32].
Table 4 Risk perception was computed by multiplying each participant’s total score for perceived Susceptibility and perceived severity. We calculated risk perception by multiplying each participant’s total scores for perceived susceptibility and perceived severity. We then dichotomized the total score for risk perception (low/high) using the median split to generate a dichotomous variable ().
Table 5 emphasizes a key perception - behavior gap. Although most participants stated high perceived susceptibility, severity, benefits, and self-efficacy, approximately half display low adoptive behavior. Similar discrepances have been documented in climate and health behavior research, where strong threat appraisal fail to produce action without sufficient enabling condition, supporting core propositions of the health belief model [6,10,13].
Table 6 This table provides level evidence to give an explanation observed behavioral gaps. High agreement with susceptibility and severity statements reflected climate awareness, while concurrent endorsement of barrier-related items highlights persistent structural and informational constraints. Such coexistence of concern and constraint has been reported in climate behavior studies and explain why awareness alone does not ensure adoptive action [3,7,18].

Table 6.
Participant’s responses to statements on perceptions in the context of the climate change scenario using constructs of the health belief model.
Table 6.
Participant’s responses to statements on perceptions in the context of the climate change scenario using constructs of the health belief model.
| Statements on perceptions (six constructs of the HBM) |
Strongly Disagree | Disagree | Neutral | Agree | Strongly Agree | |
| Perceived susceptibility | I have noticed there is an increase in environmental stress in my area due to drought, desertification, sandstorms, and pasture degradation. | 0% | 2.2% | 20.95 | 49.6% | 27.4% |
| I have noticed significant changes in biodiversity, including the emergence of new pests, the disappearance of certain species, and alterations in vegetation cover. | 1.7% | 7.0% | 28.3% | 39.1% | 23.9% | |
| Over the past decade, I believe there has been an increase in rainfall rates, flooding, and noticeable changes in the seasons. | 0% | 0.4% | 10.4% | 50.0% | 39.1% | |
| I think there is a rise in temperature and a change in the seasons of the year due to climate change. | 0% | 2.2% | 14.8% | 39.1% | 43.9% | |
| % | Climate change exacerbates crises due to the spread of infectious diseases and armed conflicts, threatening human survival. | 6.1% | 7.8% | 10.0% | 0.2% | 75.9% |
| Climate change exacerbates socio-economic problems such as poverty, economic instability, and population pressures, leading to societal vulnerability. | 3.9% | 13.0% | 34.8% | 29.6% | 18.7% | |
| Climate change threatens public health and ecological balance through water scarcity, biodiversity loss, resource depletion, and extreme temperatures | 0% | 1.3% | 23.0% | 36.1% | 39.6% | |
| Climate change has local impacts that threaten the health and safety of the community due to air and soil pollution and waste accumulation. | 0.4% | 1.3% | 2.2% | 13.9% | 82.2% | |
| Perceived Benefits | I consider climate change when I decide to reduce water and energy consumption. | 0% | 2.2% | 13.5% | 37.8% | 46.5% |
| I consider climate change when I decide to recycle waste. | 0% | 0.9% | 7.0% | 33.9% | 58.3% | |
| I consider climate change when deciding to reduce and control pollutant emissions. | 0% | 0.9% | 13.9% | 36.1% | 49.1% | |
| I consider climate change when making environmental sustainability decisions. | 1.3% | 1.7% | 17.0% | 31.7% | 48.3% | |
| Perceived Barriers | I sometimes avoid acting sustainably because I lack a clear understanding of environmental issues such as pollution, deforestation, and wildfires. | 1.7% | 18.7% | 34.3% | 26.5% | 18.7% |
| I find it difficult to connect large-scale phenomena like ocean currents and sandstorms with my daily environmental choices. | 4.3% | 12.6% | 31.7% | 23.5% | 27.8% | |
| Changing old habits and the lack of knowledge about sustainable options prevent me from adopting environmentally friendly practices. | 0% | 0.4% | 13.9% | 33.0% | 52.6% | |
| High costs, lack of local alternatives, and absence of support make it difficult for me to live more sustainably. | 0% | 1.7% | 15.2% | 38.3% | 44.8% | |
| Self- Efficacy | I am capable of adopting behaviors that reduce the production of harmful environmental waste. | 0.4% | 0.9% | 20.9% | 40.9% | 37.0% |
| I am capable of reducing my use of resources such as energy and water. | 1.3% | 4.8% | 22.2% | 38.3% | 33.5% | |
| I am capable of reducing gas emissions by using eco-friendly alternatives such as clean heating methods. | 0.9% | 4.3% | 25.2% | 33.9% | 35.7% | |
| I am capable of preserving natural vegetation by avoiding tree cutting and overgrazing. | 0% | 0.9% | 12.2% | 30.0% | 57.0% | |
| Cues to Action | Receiving information from trusted sources (such as experts or environmental organizations) encourages me to adopt eco-friendly behaviors. | 0.4% | 0.4% | 11.3% | 43.9% | 43.9% |
| The existence of environmental laws influences my behavior toward the environment. | 0.9% | 2.2% | 10.9% | 32.2% | 53.9% | |
| Following news or media campaigns about climate change motivates me to take actions that reduce its impact. | 0.9% | .9% | 15.2% | 35.7% | 47.4% | |
| My experiences with extreme climate events (e.g., droughts or floods) affect my decisions to support environmentally friendly behaviors. | 0.9% | 1.7% | 20.0% | 35.7% | 41.7% | |
| Participating in community events (such as tree planting or public area clean-ups) encourages me to commit to behaviors that reduce climate change. | 0.4% | 1.7% | 10.4% | 36.5% | 50.9% | |
Table 7.
Path Analysis Results with Standardized Coefficients and Explained Variance (R2) for Health belief model domain .
Table 7.
Path Analysis Results with Standardized Coefficients and Explained Variance (R2) for Health belief model domain .
| Endogenous Variables | Predictor | β(Standardized) | C.R | p-value | R2 | Direction | Interpretation |
| Risk Perception | Susceptibility | 0.574 | - | <0.001 | 0.39 | Positive | Moderate explanatory power |
| Severity | 0.279 | 4.42 | <0.001 | - | Positive | Additional but weaker contributor | |
| Adoptive Behavior | Risk Perception | 1.000 | 6.17 | <0.001 | - | Positive | Strong direct effect |
| Benefits | 0.590 | - | <0.001 | 0.348 | Positive | Moderate enabling effect | |
| Barriers | 0.701 | 7.96 | <0.001 | 0.492 | Positive* | Strong contextual influence |
|
| Cues to action | 0.595 | 7.58 | <0.001 | 0.354 | Positive | External triggers matter | |
| Self-Efficacy | 0.541 | 7.90 | <0.001 | 0.292 | Positive | Individual capacity effect |
Positive* Note: β values are standardized path coefficients. R2 values indicate the proportion of variance explained in each endogenous construct. This table empirically validates the proposed Health Belief Model structure. Risk perception significantly mediated the effect of perceived susceptibility and perceived severity, while adoptive behavior was primarily illuminated by perceived barriers, benefits, cues to action, and self-efficacy. Theses result mirror prior structural modeling studies indicating that enabling factors outweigh threat in shaping adoptive and health related behaviors [1,6,14].
Figure 1 This figure visually synthesizes the study’s theoretical contribution. Risk perception operates as an intermediary construct derived from susceptibility and severity. whereas adoptive behavior is driven mainly by perceived barriers, benefits, self-efficacy, and cues to action. The strong path coefficient and satisfactory model fit provide empirical support for applying Health Belief Model to climate change adaptation research [9,13,14].
4. Discussion
In this study aimed to investigate climate change risk perception and adoptive behaviors among the population of the Hail Region, Saudi Arabia, using health belief model to explain how cognitive and contextual factors influence willingness to act. The finding demonstrates that while climate change awareness is relatively high, behavior adoption is primary shaped by enabling and constraining factors rather than risk awareness alone. A pattern consistently reported in recent climate chang research [1,13,15]. Overall, 50.7% of participants exhibited high climate change risk perception, while 49.3% reported low risk perception. This is near to equal distribution indicates moderate internalization of climate risk at the individual level. Similar distribution has been reported in arid and semi-arid regions. Where climate impacts are visible but often normalized as part of everyday life [32,33]. The descriptive findings showed that more than 80% of respondents agreed or strongly agreed that climate change is associated with rising temperatures, seasonal variability, and environmental degradation. 82.2% strongly agreed that climate change threat local health and safety through pollution and waste accumulation.
Education was the most consistent demographic correlation of high-risk perception. In multivariate regression, risk perception increased with education: bachelor’s degree (AOR 1.975.95% CL1.053-3.705, p=0.034) and postgraduate (AOR 3.154 95% CL 1.318-7.545, p=0.010), compared with secondary education. This align with evidence that education improve climate health literacy, support interpretation scientific information, and increase perceive personal relevance [15,33]. Gender also remined significant in the adjusted model (female AOR 0,646.95% CL 0.432-0.966. p= 0.033), indicating that in Hail population, the likelihood of high perception risk differs by gender even by control by education. Males demonstrate significantly higher odd of high-risk perception than female.
Employment sectors further shaped risk perception. Governmental employees had higher risk perception than private sector workers, how were 71% less likely to report risk perception. (AOR=0.29). this finding support previous research suggesting that institutional exposure to environmental policies, climate reporting, and regulatory frameworks enhance risk awareness [8]. Although more than half of respondents 53.9% demonstrated high adoptive behavior, and substantially proportion remained unwilling or unable to act. This gap between awareness and action is widely documented in climate behavior literature and is often attributed, economic, and psychological barriers [1,2]. Age was associated with adoptive behavior at the bivariate level, with younger participants (20 to 30 years 48.3%) showing higher engagement. However, age lost significance in multivariate analysis, indicate that adoptive behavior it not primary driven by demographics characteristics once psychological factor are considered, consist with HBM based studies [34]. The structural equation model provides robust support for the HBM framework. Perceived susceptibility and perceived severity jointly explained approximately 33% of the variance in risk perception, with susceptibility exerting a stronger effect (β=0.57) than severity (β=0.28). This finding confirms that personal vulnerability is more influential than abstract judgments of harm in shaping climate risk perception, as observed in climate health and disaster-risk studies [5,14,35]. Risk perception had a strong and significant effect on adoptive behavior (β= 1.00, p < 0.001), supporting its role as motivational driver, however the total variance explained in adoptive behavior was substantially higher (R2 ≈0.49), emphasizing that behavioral adoption depends more on enabling conditions than on threat appraisal alone [36,37]. Among all HBM constructs, perceived Barriers were the most powerful predictors of adoptive behavior (β=0.70; R2 ≈0.49). More than 52% of respondents strongly agreed that changing habits and lack of knowledge impede sustainable practices, while 44.8% strongly agreed that high cost and lack of local alternative restrict action. This finding align with extensive evidence showing that financial constraints, limited infrastructure, and behavior inertia are major obstacles to climate adaptation in low – and middle-income setting [7,38,39].
Importantly, the strong effect of perceived barriers explains why high-risk perception does not necessarily translate into action. Even individuals who recognize climate threats may remain inactive when structural support is insufficient. Perceived benefits showed strong positive influence on adoptive behavior (β=0.59). Over 80% of participants reported that climate considerations influence decisions related to energy use, recycling, and pollution control. This finding reinforces evidence individuals are more willing to adopt adoptive behaviors when benefits ate tangible, immediate, and personally relevant [40].
Self-efficacy explained nearly 29% of the variance in adoptive behaviors(β=0.54). Notably 57.0% of participants strongly agreed that they could preserve natural vegetation, and over 70% expressed confidence in reducing waste and resource use. Self-efficacy has consistently been identified as a critical bridge between intention and action in climate adaptation research [3,41]. Cues to action were also influential (β=0.60), with high agreement for environmental laws 86.1% media campaigns 83.1% and community activities 87.4%. This finding highlights the importance of institutional trust, policy enforcement and social engagement in triggering climate- friendly behaviors [18,42].
In summary the finding validates the HBM as robust framework for understanding climate- related behavior in the Hail region, Saudi Arabia. While over 60% of participants reported high susceptibility, severity, benefits, self-efficacy, and cues to action [6], nearly half still demonstrated low adoptive behavior. These results indicate that effective climate interventions must move beyond risk communication toward barrier reduction, capacity building, and institutional support, in line with Saudi Arabia Vision sustainability agenda [43].
Public health and environmental interventions should therefore prioritize reducing structural and informational barriers, strengthening individual capacity, and reinforcing actionable cues. Policy strategies should integrate behavioral insights into climate communication, emphasizing practical support mechanisms alongside risk massaging to enhance community level climate resilience.
References
- Grothmann, T.; Patt, A. Adaptive capacity and human cognition: The process of individual adaptation to climate change. Glob. Environ. Change 2005, vol. 15(no. 3), 199–213. [Google Scholar] [CrossRef]
- Nielsen, K. S.; et al. Realizing the full potential of behavioural science for climate change mitigation. Nat. Clim. Change 2024, vol. 14(no. 4), 322–330. [Google Scholar] [CrossRef]
- Ullah, F.; Valente, M.; Hubloue, I.; Akbar, M. S.; Ragazzoni, L.; Barone-Adesi, F. Determinants of adaptive behaviors during heatwaves in Pakistan: a study based on personal heatwave experiences and hypothetical scenarios. Mitig. Adapt Strateg Glob. Change 2024, vol. 29(no. 5), 49. [Google Scholar] [CrossRef]
- Brewer, N. T.; Chapman, G. B.; Gibbons, F. X.; Gerrard, M.; McCaul, K. D.; Weinstein, N. D. Meta-analysis of the relationship between risk perception and health behavior: the example of vaccination. Health Psychol. 2007, vol. 26(no. 2), 136. [Google Scholar] [CrossRef] [PubMed]
- Van der Linden, S. The social-psychological determinants of climate change risk perceptions: Towards a comprehensive model. J. Environ. Psychol. 2015, vol. 41, 112–124. [Google Scholar] [CrossRef]
- Carpenter, C. J. A Meta-Analysis of the Effectiveness of Health Belief Model Variables in Predicting Behavior. Health Commun. 2010, vol. 25(no. 8), 661–669. [Google Scholar] [CrossRef] [PubMed]
- Sheeran, P.; Harris, P. R.; Epton, T. Does heightening risk appraisals change people’s intentions and behavior? A meta-analysis of experimental studies. Psychol. Bull. 2014, vol. 140(no. 2), 511. [Google Scholar] [CrossRef] [PubMed]
- Bandura. Health Promotion by Social Cognitive Means. Health Educ. Behav. 2004, vol. 31(no. 2), 143–164. [Google Scholar] [CrossRef] [PubMed]
- Rosenstock, M.; Strecher, V. J.; Becker, M. H. Social Learning Theory and the Health Belief Model. Health Educ. Q. 1988, vol. 15(no. 2), 175–183. [Google Scholar] [CrossRef] [PubMed]
- Champion, V. L.; Skinner, C. S. The health belief model. Health Behav. Health Educ. Theory Res. Pract. 2008, vol. 4, 45–65. [Google Scholar]
- Janz, N. K.; Becker, M. H. The Health Belief Model: A Decade Later. Health Educ. Q. 1984, vol. 11(no. 1), 1–47. [Google Scholar] [CrossRef] [PubMed]
- Bradley, G. L.; Babutsidze, Z.; Chai, A.; Reser, J. P. The role of climate change risk perception, response efficacy, and psychological adaptation in pro-environmental behavior: A two nation study. J. Environ. Psychol. 2020, vol. 68, 101410. [Google Scholar] [CrossRef]
- Van Valkengoed, M.; Perlaviciute, G.; Steg, L. From believing in climate change to adapting to climate change: The role of risk perception and efficacy beliefs. Risk Anal. 2024, vol. 44(no. 3), 553–565. [Google Scholar] [CrossRef] [PubMed]
- He, R.; Jin, J.; Kuang, F.; Zhang, C.; Guan, T. Farmers’ risk cognition, risk preferences and climate change adaptive behavior: A structural equation modeling approach. Int. J. Environ. Res. Public Health 2020, vol. 17(no. 1), 85. [Google Scholar]
- Okutan, P.; Otay, E. N. Climate Change Risk Perception, Adaptive Capacity and Psychological Distance in Urban Vulnerability: A District-Level Case Study in Istanbul, Türkiye. Sustainability 2025, vol. 17(no. 12), 5358. [Google Scholar] [CrossRef]
- Wang, Y.; et al. Knowledge, attitude, risk perception, and health-related adaptive behavior of primary school children towards climate change: a cross-sectional study in China. Int. J. Environ. Res. Public Health 2022, vol. 19(no. 23), 15648. [Google Scholar] [PubMed]
- Sheeran, P.; Harris, P. R.; Epton, T. Does heightening risk appraisals change people’s intentions and behavior? A meta-analysis of experimental studies. Psychol. Bull. 2014, vol. 140(no. 2), 511. [Google Scholar] [CrossRef] [PubMed]
- Almulhim, I. Citizens’ Awareness of Climate Change Impacts and Its Implications for Urban Sustainability in Saudi Arabia. Sustain. Dev. 2025, sd.70426. [Google Scholar] [CrossRef]
- Alotaibi, A.; Abbas, A.; Azeem, M. I.; Shahbaz, P.; ul Haq, S.; Nayak, R. K. Role of risk perception and climate change beliefs in adoption of climate-resilient agricultural practices in Saudi Arabia. Clim. Serv. 2025, vol. 38, 100552. [Google Scholar] [CrossRef]
- Azeem, M. I.; Alotaibi, B. Alhafi. Farmers’ beliefs and concerns about climate change, and their adaptation behavior to combat climate change in Saudi Arabia. PLoS ONE 2023, vol. 18(no. 1), e0280838. [Google Scholar]
- Almazroui, M.; Dambul, R.; Islam, M. N.; Jones, P. D. “Principal components-based regionalization of the Saudi Arabian climate.,” <italic>International Journal of Climatology</italic>, vol. 35, no. 9, 2015, Accessed: Jan. 29, 2026. [Online]. Available online: https://search.ebscohost.com/login.aspx?direct=true&profile=ehost&scope=site&authtype=crawler&jrnl=08998418&AN=108336987&h=qxFsEneDi05VaC4N4moK%2FW7%2BOsMXmBbCEVE2L%2BwmZa4le4ln8yOfseSQPkNgQ1ADvUrFZrtBmR29ieLYRGynHg%3D%3D&crl=c.
- Yamane, T. “Statistics: An introductory analysis,” 1973, Accessed: Jan. 29, 2026. Available online: https://www.researchgate.net/profile/Mazyar-Ghadiri-Nejad/post/Would_you_mind_sending_me_the_full_text_book_of_Yamane_Taro_1967_Statistics_Introduction_to_Analysis_New_York_Harper_and_Row/attachment/5a38faffb53d2f0bba456a9c/AS%3A573245188915200%401513683711929/download/252560191.pdf.
- Tavakol, M.; Dennick, R. Making sense of Cronbach’s alpha. Int. J. Med. Educ. 2011, vol. 2, 53. [Google Scholar] [CrossRef] [PubMed]
- R. B. Kline, <italic>Principles and practice of structural equation modeling</italic>. Guilford publications. 2023. Available online: https://books.google.com/books?hl=en&lr=&id=t2CvEAAAQBAJ&oi=fnd&pg=PP1&dq=Kline+RB.+Principles+and+practice+of+structural+equation+modeling.+Struct+Equ+Modeling.+2015%3B22:1%E2%80%933.&ots=sWXIZ5f0jN&sig=JkKnMAsufMA3ZvDsxrVwNLareYA (accessed on 29 January 2026).
- Fabrigar, L. R.; Wegener, D. T.; MacCallum, R. C.; Strahan, E. J. Evaluating the use of exploratory factor analysis in psychological research. Psychol. Methods 1999, vol. 4(no. 3), 272. [Google Scholar] [CrossRef]
- Brown, T. A. <italic>Confirmatory factor analysis for applied research</italic>. Guilford publications. 2015. Available online: https://books.google.com/books?hl=en&lr=&id=tTL2BQAAQBAJ&oi=fnd&pg=PP1&dq=Brown+TA.+Confirmatory+factor+analysis+for+applied+research.+Guilford+Press.+2015.&ots=amVrmLXNcK&sig=zR774gGNJ34sZHEBnCaD0BMZK5U (accessed on 2 February 2026).
- Hu, L.; Bentler, P. M. Cutoff criteria for fit indexes in covariance structure analysis: Conventional criteria versus new alternatives. Struct. Equ. Model. A Multidiscip. J. 1999, vol. 6(no. 1), 1–55. [Google Scholar] [CrossRef]
- Schreiber; Nora, A.; Stage, F.; Barlow, L.; King, J. Confirmatory factor analyses and structural equations modeling: an introduction and review. J. Educ. Res. 2006, vol. 99(no. 6). [Google Scholar] [CrossRef]
- Schreiber, B.; Nora, A.; Stage, F. K.; Barlow, E. A.; King, J. Reporting Structural Equation Modeling and Confirmatory Factor Analysis Results: A Review. J. Educ. Res. 2006, vol. 99(no. 6), 323–338. [Google Scholar] [CrossRef]
- W. J. Conover, <italic>Practical nonparametric statistics</italic>. john wiley & sons, 1999. Available online: https://books.google.com/books?hl=en&lr=&id=n_39DwAAQBAJ&oi=fnd&pg=PA1&dq=Conover+WJ.+Practical+nonparametric+statistics.+Wiley.+1999.&ots=LagrRKmlKb&sig=KUasWjiNFgI8LGppIXl05YEMvtc (accessed on 2 February 2026).
- Jr, D. W. H.; Lemeshow, S.; Sturdivant, R. X. Applied Logistic Regression; John Wiley & Sons, 2013. [Google Scholar]
- Arsad, F. S.; Hod, R.; Ahmad, N.; Baharom, M.; Tangang, F. The Malay-version knowledge, risk perception, attitude and practice questionnaire on heatwaves: development and construct validation. Int. J. Environ. Res. Public Health 2022, vol. 19(no. 4), 2279. [Google Scholar]
- Kim, D.; Sjølie, H. K.; Aguilar, F. X. Psychological distances to climate change and public preferences for biodiversity-augmenting attributes in family-owned production forests. For. Policy Econ. 2024, vol. 163, 103201. [Google Scholar] [CrossRef]
- Orji, R.; Vassileva, J.; Mandryk, R. Towards an Effective Health Interventions Design: An Extension of the Health Belief Model. Online J. Public Health Inform. 2012, vol. 4(no. 3), e61050. [Google Scholar] [CrossRef] [PubMed]
- Ward, R. V.; Jones, M. G.; May, K. Psychological Distance in Climate Change Communication: Insights from a Survey of Scientists’ Current Practices. Weather Clim. Soc. 2025, vol. 17(no. 4), 755–772. [Google Scholar] [CrossRef]
- Wang, Y.; et al. Knowledge, attitude, risk perception, and health-related adaptive behavior of primary school children towards climate change: a cross-sectional study in China. Int. J. Environ. Res. Public Health 2022, vol. 19(no. 23), 15648. [Google Scholar] [PubMed]
- Pundir, S.; et al. Exploring the socio-psychological drivers of climate adaptation among rural women in Uttarakhand: a TPB framework approach. Front. Sustain. Food Syst. 2025, vol. 9, 1558178. [Google Scholar] [CrossRef]
- McNeish, D. Thanks coefficient alpha, we’ll take it from here. Psychol. Methods 2018, vol. 23(no. 3), 412. [Google Scholar] [CrossRef] [PubMed]
- Raykov, T. Estimation of Composite Reliability for Congeneric Measures. Appl. Psychol. Meas. 1997, vol. 21(no. 2), 173–184. [Google Scholar] [CrossRef]
- Xia, Y.; Yang, Y. RMSEA, CFI, and TLI in structural equation modeling with ordered categorical data: The story they tell depends on the estimation methods. Behav. Res. 2019, vol. 51(no. 1), 409–428. [Google Scholar] [CrossRef] [PubMed]
- Weissbrodt, R.; et al. Adapting and mitigating: an exploratory Delphi approach to climate change impacts on healthcare institutions in Switzerland. Dialogues Health 2026, vol. 8, 100275. [Google Scholar] [CrossRef] [PubMed]
- How tailored climate information affects attitudes towards climate policy and psychological distance of climate change | npj Climate Action. Available online: https://www.nature.com/articles/s44168-024-00136-y (accessed on 5 February 2026).
- Blazy, R.; Hrehorowicz-Gaber, H.; Hrehorowicz-Nowak, A.; Płachta, A. The Synergy of Ecosystems of Blue and Green Infrastructure and Its Services in the Metropolitan Area—Chances and Dangers. Sustainability 2021, vol. 13(no. 4), 2103. [Google Scholar]
Figure 1.
Path analysis model illustrates the relationships between risk perception and adaptive behavior based on the Health Belief Model.
Figure 1.
Path analysis model illustrates the relationships between risk perception and adaptive behavior based on the Health Belief Model.
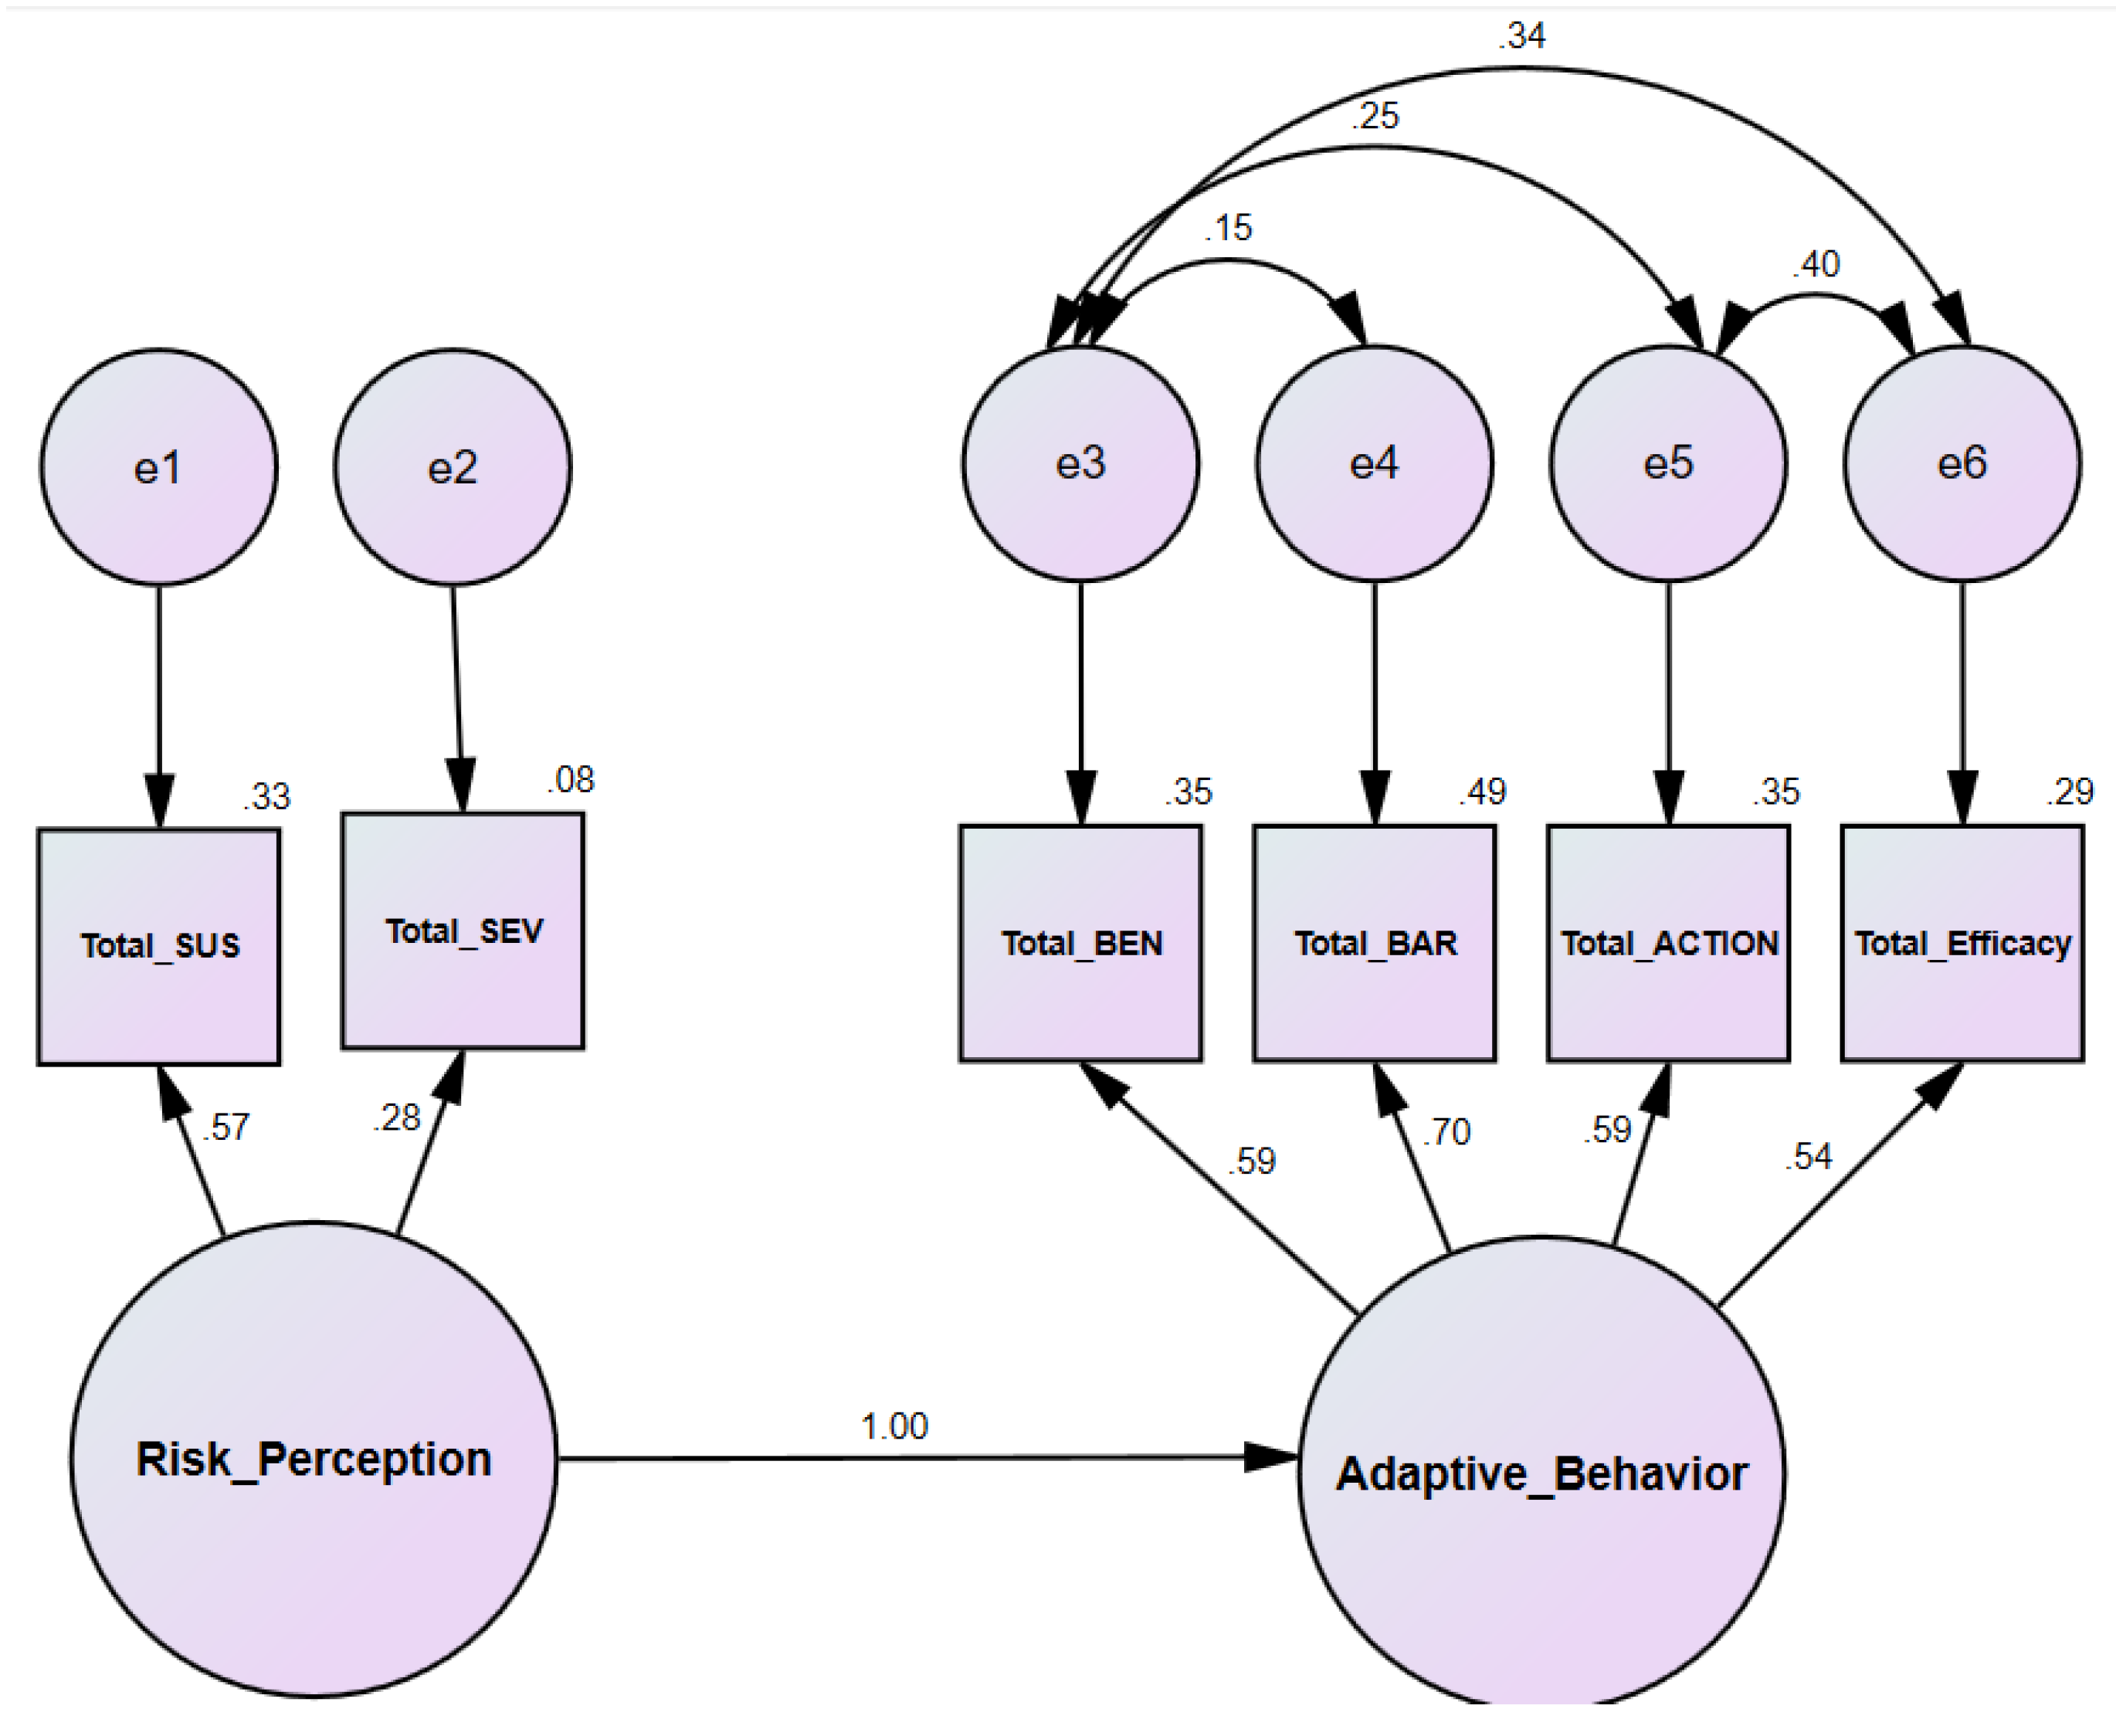
Table 1.
Demographic factors of the study population.
| Demographic | Total n (%) |
Perceived risk | P. Value | Adoptive Behavior | P. Value | ||
| Low n (%) | High n (%) | Low n (%) | High n (%) | ||||
| Age group | |||||||
| 20 to 30 Years | 222(48.3) | 114 (50.2) | 108 (46.4) | 0.650 | 116(54.7) | 106(42.7) | 0.008 |
| 31 to 40 years | 154(33.5) | 70(30.8) | 84(36.1) | 56 (26.4) | 98(39.5) | ||
| 41 to 50 Years | 70 (15.2) | 35(15) | 35(15) | 36(17) | 36(13.7) | ||
| 51 to 60 years | 14 (3) | 8 (3.5) | 6 (2.6) | 4(1.9) | 10(4) | ||
| Gender | |||||||
| Male | 264(57.4) | 117(51.5) | 147(63.1) | 0.012 | 122(57.5) | 142(57.3) | 0.950 |
| Female | 196(42.6) | 110(48.5) | 86(36.9) | 90(42.5) | 106(42.7) | ||
| Education Level | |||||||
| Secondary education | 56(12.2) | 36(15.9) | 20(8.6) | 0.005 | 26(12.3) | 30(12.1) | 0.139 |
| diploma | 80(17.4) | 47 (20.7) | 33(14.2) | 42(19.8) | 38(15.3) | ||
| Bachelor’s degree | 244 (53) | 114 (50.2) | 130(55.8) | 116(54.7) | 128(51.6) | ||
| Postgraduate | 80 (17.4 | 30(13.2) | 50(21.5) | 28(13.2) | 52(21) | ||
| Employment status | |||||||
| Student | 210 (45) | 108 (47.6) | 102 (43.8) | 0.775 | 110(51.9) | 100(40.3) | 0.196 |
| Employee | 230 (50) | 109(48) | 121(51.9) | 94(44.3) | 136(54.8) | ||
| Retired | 4 (0.9) | 2(0.9) | 2(0.9) | 2 (0.9) | 2(0.9) | ||
| Independent business owner | 6(1.3) | 4(1.8) | 2 (0.9) | 2 (0.9) | 4(1.6) | ||
| I don’t work | 10 (2.2) | 4 (1.8) | 6(2.6) | 4(1.9) | 6(2.4) | ||
| The Sector | |||||||
| Government institutions | 222(48.3) | 95(41.9) | 127(54.5) | 0.003 | 102(48.1) | 120(48.4) | 0.229 |
| Private Sectors | 60(13) | 40(17.6) | 20(8.6) | 22(10.4) | 38(15.3) | ||
| Other | 178 (38.7) | 92 (40.5) | 86 (36.9) | 88(41.5) | 90(36.3) | ||
Table 2.
Univariate and multiple logistic regression analyses for predictors of risk perception Climate Change.
Table 2.
Univariate and multiple logistic regression analyses for predictors of risk perception Climate Change.
| Predictor variables | Category | Univariate | Multivariate | ||
| OR (95% CL) | p-Value | OR (95% CL) | P-value | ||
| Age | 20-30 Years | 1(ref) | 1(ref) | ||
| 31 to 40 years | 1.267 (0.839-1.913) | 0.261 | 1.076(0.413-2.807) | 0.880 | |
| 41 to 50 Years | 1.056 (0.617-1.807) | 0.844 | 0.710(0.242-2.078) | 0.532 | |
| 51 to 60 years | 0.792(0.266-2.356) | 0.675 | 0.361(0.068-1.918) | 0.232 | |
| Gender | Male | 1.607 (1.108-2.332) | 0.012 | 1(ref) | |
| Female | 1(ref) | 0.646(0.432-0.966) | 0.033 | ||
| Education | Secondary | 1(ref) | 1(ref) | ||
| Diploma | 1.264(0.625-2.558) | 0.515 | 0.963(0.415-2.231) | 0.929 | |
| Bachelor’s | 2.058(1.125-3.746) | 0.019 | 1.975(1.053-3.705) | 0.034 | |
| Postgraduate | 3.000(1.475-6.100) | 0.002 | 3.154(1.318-7.545) | 0.010 | |
| Employment | Student | 1(ref) | 1(ref) | ||
| Employee | 1.175(0.808-1.709) | 0.398 | 1.105(0.367-3.328) | 0.859 | |
| Retired | 1.059(0.146-7.658) | 0.955 | 3.576(0.258-49.476) | 0.342 | |
| Independent | 0.529 (0.095-2.953) | 0.468 | 1.813(0.201-16.320) | 0.596 | |
| I don’t work | 1.588(0.436-5.792) | 0.483 | 1.644(0.404-6.685) | 0.487 | |
| The Sector | Government | 1(ref) | 1(ref) | ||
| Private | 0.374(0.205-0.681) | 0.01 | 0.286(0.147-0.557) | 000 | |
| Other | 0.699(0.470-1.039) | 0.077 | 0.724(0.362-1.446) | 0.359 | |
Table 3.
Univariate and multiple logistic regression analyses for predictors of Adoptive Behavior to Climate Change.
Table 3.
Univariate and multiple logistic regression analyses for predictors of Adoptive Behavior to Climate Change.
| Predictor variables | Category | Univariate | Multivariate | ||
| OR (95% CL) | p-Value | OR (95% CL) | P-value | ||
| Age | 20-30 Years | 1(ref) | 1(ref) | ||
| 31 to 40 years | 1.915(1.257-2.917) | 0.002 | 1.783(0.704-4.521) | 0.223 | |
| 41 to 50 Years | 1.034(0.604-1.769) | 0.904 | 0.856(0.303-2.416) | 0.769 | |
| 51 to 60 years | 2.736(0.833-8.985) | 0.097 | 3.001(0.475-18.961) | 0.243 | |
| Gender | Male | 1(ref) | 1(ref) | ||
| Female | 1.012(0.698-1.466) | 0.950 | 1.150(0.771-1.713) | 0.494 | |
| Education | Secondary | 1(ref) | 1(ref) | ||
| Diploma | 0.784(0.396-1.555) | 0.486 | 0.469(0.206-1.068) | 0.071 | |
| Bachelor’s | 0.956(0.534-1.712) | 0.880 | 0.842(0.460-1.543) | 0.579 | |
| Postgraduate | 1.610(0.801-3.234) | 0.181 | 1.076(0.459-2.520) | 0.866 | |
| Employment | Student | 1(ref) | 1(ref) | ||
| Employee | 1.591(1.091-2.321) | 0.016 | 1.883(0.641-5.592) | 0.248 | |
| Retired | 1.100(0.152-7.956) | 0.925 | 0.587(0.038-5.111) | 0.704 | |
| Independent | 2.200(0.394-12.272) | 0.369 | 4.602(0.496-42.618) | 0.179 | |
| I don’t work | 1.650(0.452-6.017) | 0.448 | 1.344(0.346-5.230) | 0.669 | |
| The Sector | Government | 1(ref) | 1(ref) | ||
| Private | 1.468(0.816-2.642) | 0.200 | 1.140(0.598-2.196) | 0.682 | |
| Other | 0.869(0.586-1.290) | 0.487 | 1.601(0.808-3.174) | 0.178 | |
Table 4.
Classification of participant’s perceptions in the context of the climate change scenario based on HBM and using mean as the cut-off points.
Table 4.
Classification of participant’s perceptions in the context of the climate change scenario based on HBM and using mean as the cut-off points.
|
Level of perceptions |
Low | High | Median | IQR | ||
| n | % | n | % | |||
| Perceived Susceptibility | 164 | 35.7 | 296 | 64.3 | 16 | 3 |
| Perceived Severity | 173 | 37.6 | 287 | 62.4 | 17 | 3 |
| Risk Perception | 227 | 49.3 | 233 | 50.7 | 272 | 95 |
| Perceived Benefits | 176 | 38.3 | 284 | 61.7 | 17 | 4 |
| Perceived Barriers | 202 | 43.9 | 258 | 56.1 | 16 | 4 |
| Self-Efficacy | 154 | 33.6 | 306 | 66.5 | 16 | 4 |
| Cues to Action | 180 | 39.1 | 280 | 60.9 | 21 | 5 |
| Adoptive Behavior | 212 | 46.1 | 248 | 53.9 | 73 | 10 |
Table 5.
Spearman’s Rank Correlation Coefficients Among Study Variables (N = 460.
| Domain | Perceived Susceptibility | Perceived Severity | Perceived Benefits | Perceived Barriers | Self-Efficacy | Cues to Action |
| Perceived Susceptibility | 1.00 | |||||
| Perceived Severity | 0.176** | 1.00 | ||||
| Perceived Benefits | 0.280** | 0.310** | 1.00 | |||
| Perceived Barriers | 0.415** | 0.312** | 0.477** | 1.00 | ||
| Self-Efficacy | .0324** | 0.192** | 0.508** | 0.412** | 1.00 | |
| Cues to Action | 0.282** | 0.213** | 0.552** | 0.396** | 0.603** | 1.00 |
Notes. Spearman’s rho correlation coefficients are presented. ** Correlation is significant at the 0.01 level (2-tailed). The sample size for all correlations was N = 460. Table 5 Spearman’s rank correlation analysis showed statistically significant positive associations among all study variables. Perceived benefits instruct moderate to strong correlations with perceived barriers, behavioral action, and self-efficacy, indicating their important role in shaping health-related behaviors. Self-efficacy showed the strongest relationship with behavioral action (ρ = .603, p < .01).
Disclaimer/Publisher’s Note: The statements, opinions and data contained in all publications are solely those of the individual author(s) and contributor(s) and not of MDPI and/or the editor(s). MDPI and/or the editor(s) disclaim responsibility for any injury to people or property resulting from any ideas, methods, instructions or products referred to in the content. |
© 2026 by the authors. Licensee MDPI, Basel, Switzerland. This article is an open access article distributed under the terms and conditions of the Creative Commons Attribution (CC BY) license (http://creativecommons.org/licenses/by/4.0/).
Copyright: This open access article is published under a Creative Commons CC BY 4.0 license, which permit the free download, distribution, and reuse, provided that the author and preprint are cited in any reuse.