
Submitted:
27 August 2026
Posted:
28 August 2026
You are already at the latest version
Abstract
Enterprise information systems generate extensive transaction traces, but transforming these records into trustworthy AI-enabled decision intelligence requires more than pattern discovery: data quality, interpretability, statistical qualification, temporal robustness, reproducibility, and human oversight must be integrated. This study develops and evaluates a reproducible, interpretable machine-learning architecture designed as an analytical layer between transaction-generating systems of record and human decision support. A point-of-sale subsystem is used as the empirical validation environment rather than as a full ERP implementation. The architecture combines deterministic data-quality controls, sparse basket reconstruction, normalized Shannon entropy, unsupervised association-rule learning, false-discovery screening, nonparametric inference, generalized linear models, temporal validation, and transparent rule prioritization. The empirical evaluation covers 31,157 transaction baskets, 139,396 valid item lines, 710 products, and 762 active sales days. The resulting incidence representation contains 22.12 million potential positions at 0.630% density, and 1,174 directional rules satisfy the prespecified screening criteria. Out-of-period validation shows that 93.6% of discovery rules retain lift above one, while 49.3% again satisfy all selection thresholds and rank correlations for support, confidence, and lift remain between 0.80 and 0.85. The contribution is an auditable enterprise analytics architecture that separates machine-learned discovery, statistical qualification, and human decision responsibility. The architecture provides a reproducible analytical foundation that can complement enterprise systems of record and business-intelligence or decision-support environments without assuming production ERP integration, cloud deployment, or autonomous decision making.
Keywords:
artificial intelligence
; enterprise systems
; interpretable machine learning
; enterprise transaction analytics
; association-rule mining
; business intelligence
; decision support systems
; explainable AI
; data governance
; human-in-the-loop decision support
; reproducible analytics
1. Introduction
Enterprise information systems increasingly function as systems of record for fine-grained operational activity. Point-of-sale, order-management, enterprise resource planning, customer relationship management, and related transaction-generating platforms continuously capture products, quantities, values, timestamps, and process events. Digital transformation research emphasizes that the value of such systems is not created by data accumulation alone, but by the organizational capacity to convert digital traces into improved processes and decision capabilities [1]. At the same time, organizational AI capability depends on more than model choice: data resources, technical infrastructure, skills, coordination, and readiness for AI-enabled work all shape whether analytical outputs can become useful organizational capabilities [2,3]. The practical challenge addressed in this study is therefore not simply how to mine transaction records, but how to turn them into decision evidence that remains traceable to the underlying enterprise data. From an enterprise-systems perspective, the relevant integration problem is not limited to embedding an analytical model within a specific ERP or cloud platform. It also concerns the construction of a traceable analytical layer that can receive validated transaction data from operational systems of record, preserve provenance and business semantics during transformation, and expose qualified evidence to business-intelligence or decision-support environments. This layered perspective separates operational transaction processing, analytical learning, and final decision authority. The present study evaluates this analytical middle layer; production ERP connectors, cloud deployment, and real-time orchestration remain deployment extensions rather than empirically implemented components.
Artificial intelligence in enterprise settings spans a continuum from automation to decision augmentation. Contemporary management research highlights autonomy, learning, and inscrutability as central properties that complicate the governance of AI systems [4]. Organizational decision-making research likewise shows that human and algorithmic judgment can be combined in different structures depending on interpretability, speed, search-space size, and the consequences of delegation [5]. For transaction analytics, this creates a strong case for interpretable machine learning when the objective is to support rather than replace managerial judgment. The present workflow uses association-rule learning as the principal unsupervised machine-learning component because its outputs remain inspectable as explicit antecedent-consequent relationships. Shannon entropy provides a complementary information-theoretic description of global distributional structure, while generalized linear models provide adjusted statistical explanations of basket-level outcomes. These analytical roles are kept distinct rather than being collapsed under a generic AI label.
Restaurant point-of-sale (POS) data provide a demanding empirical environment for evaluating such an enterprise-analytics architecture because they combine repeated transactions, sparse item incidence, temporal heterogeneity, skewed monetary values, and recurrent co-occurrence. Restaurant analytics has addressed revenue management, forecasting, consumer behavior, and recommendation-oriented applications [7], while recent longitudinal work has used association-rule mining to extract interpretable patterns from multi-year observational data [8]. In this study, however, the restaurant is an empirical validation setting rather than the theoretical object of the contribution. The POS source is treated as a transaction-generating operational information subsystem, not as a full ERP implementation. The methodological question is whether records already produced by an operational system can be transformed into an auditable analytical layer that supports business intelligence and human decision review without requiring an opaque predictive model or autonomous decision engine.
The objective is to develop and empirically evaluate a reproducible, interpretable enterprise transaction-analytics workflow that integrates data-veracity controls, sparse transaction representation, entropy-based characterization, unsupervised association-rule learning, statistical qualification, generalized linear modeling, temporal validation, and transparent decision prioritization. The empirical implementation covers 20 May 2024 to 28 June 2026 and provides internal temporal replication across 762 active sales days. With 31,157 reconstructed baskets and 710 products, the binary basket-product representation contains 22,121,470 potential positions, while the unconstrained unordered pair space contains 251,695 product pairs. These quantities motivate explicit treatment of sparsity and combinatorial pattern-space reduction. The study evaluates an analytical decision-support layer; it does not claim production ERP integration, cloud deployment, real-time inference, autonomous decision making, or population-level generalization beyond the observed case.
The contribution is fivefold. First, the study specifies an enterprise-data veracity layer based on deterministic source validation, relational linkage, duplicate control, arithmetic checks, anonymization, and publication-safe reconstruction before machine learning is applied. Second, it formalizes a sparse, semantically transparent transaction representation and quantifies the combinatorial search space that precedes association-rule screening. Third, it combines normalized entropy with interpretable association-rule learning so that global distributional dispersion and local machine-learned co-occurrence remain analytically distinguishable. Fourth, it introduces an evidence-qualification layer that combines multiplicity screening, effect-size estimation, out-of-period validation, threshold sensitivity, and cluster-robust generalized linear models, reducing the risk that algorithmic detectability is mistaken for substantive relevance. Fifth, it evaluates a transparent empirical decision-evidence prioritization layer based on four analytically active components and quantifies ranking sensitivity under alternative weighting schemes. Operational controllability and implementation feasibility are retained as conceptually relevant dimensions for future expert elicitation rather than treated as empirically observed determinants in the present study. The novelty is therefore architectural and integrative rather than a claim to invent a new association-rule algorithm.
The empirical analysis addresses four research questions:
RQ1. How can longitudinal enterprise transaction records be represented and characterized to preserve data veracity, sparsity, and interpretable demand structure across temporal contexts?
RQ2. Which machine-learned association-rule patterns remain statistically screened, interpretable, temporally persistent, and robust under out-of-period validation and plausible rule-selection thresholds?
RQ3. How are observed operational contexts associated with transaction breadth and transaction value after adjustment for calendar month and year?
RQ4. How stable is transparent decision-evidence prioritization under a ranking-equivalent empirical score and alternative weighting schemes, and what does that stability imply for human review in enterprise decision support?
2. Literature Review
2.1. Enterprise Transaction Systems, AI-Ready Data, and Data Veracity
AI-enabled enterprise analytics is fundamentally data-centric. Organizational AI capability depends on access to suitable data and technology as well as on the organizational resources required to use them effectively [2], while AI-readiness research identifies data availability, data quality, strategic alignment, skills, and organizational conditions as prerequisites for purposeful adoption [3]. At the analytical level, empirical evidence across classification, regression, and clustering tasks shows that accuracy, completeness, consistency, and related data-quality dimensions can materially alter machine-learning performance [9]. Contemporary tooling therefore incorporates data-quality assessment, leakage detection, feature screening, and reproducible preprocessing into the analytical lifecycle rather than treating them as invisible preparatory operations [10]. The present workflow adopts the same principle for transaction-bearing enterprise systems by making deletion filtering, identifier validation, relational reconstruction, duplicate control, and arithmetic consistency explicit and auditable components of the analytical method.
The empirical source comprises transaction-header and item-level POS records. These records are treated as the output of an operational system of record: they describe completed commercial transactions but not the full organizational process that surrounds them. The observable analytical boundary includes transaction identifiers, date and time, product composition, quantities, prices, line values, and selected operational identifiers. Customer motivations, refused demand, stockouts, staffing levels, preparation queues, local events, and subsequent managerial interventions are not observed. This boundary is consequential for both machine learning and statistical inference because discovered associations can only be explained using variables represented in the analytical dataset; unobserved mechanisms must not be retrofitted to algorithmic outputs.
The source architecture separates transaction headers from item lines, whereas machine-learning analysis requires stable units of observation. Reconstructing a basket therefore entails a sequence of veracity-preserving transformations: logical-deletion filtering, transaction validation, key assessment, relational linkage, item-line validation, duplicate detection, and arithmetic reconciliation. This sequence establishes a defensible AI-ready analytical substrate before entropy, association rules, or statistical models are computed. The emphasis on provenance is consistent with work on valuable and explainable data-driven systems, in which data quality and explainability are mutually reinforcing requirements for trustworthy decision processes [11]. In enterprise settings, such provenance is also important because analytical outputs may be consumed by managers who were not involved in source-system design or data preparation.
The resulting analytical representation is sparse and multi-resolution. At item level, product identity, quantity, unit price, and line value support frequency, value-contribution, and entropy calculations. At basket level, transaction value, distinct products, total quantity, date, weekday, hour, service interval, and a multi-product indicator support contextual modeling. For association-rule learning, each basket is additionally represented as a binary set of product presences. This preserves semantic traceability to source-system concepts and avoids latent representations whose operational meaning would require a separate explanation layer. For enterprise decision support, that traceability is valuable because users can connect an analytical pattern back to observable transaction attributes rather than to an opaque embedding.
The organizational setting remains an interpretive boundary rather than the principal theoretical contribution. Service-system theory emphasizes that digital records are embedded in configurations of people, technologies, and resources [12], while work-system theory cautions against interpreting information-system outputs independently of the processes that generate them [13]. Classical systems concepts concerning boundary specification and partial representations [14] reinforce the same point: an analytical model captures selected aspects of an operating system, not the complete organization. This distinction is particularly relevant to digital transformation, which concerns changes in organizational value creation and operating arrangements rather than the mere presence of digital records or analytical software [1]. Accordingly, the study examines an interpretable analytical layer that can complement transaction-generating systems; it does not claim to measure enterprise-wide digital transformation.
Three data characteristics are especially relevant for this analytical layer: a high-dimensional product universe relative to basket occupancy, a combinatorial candidate-pair space, and a stringent requirement for data veracity before pattern extraction. These characteristics create a nontrivial knowledge-discovery problem even though the study does not evaluate distributed storage or real-time streaming. The analytical scale is therefore described in bounded terms: longitudinal volume, dimensional variety, sparsity, combinatorial search, and veracity are measured explicitly, while infrastructure-scale claims remain outside scope. This positioning is consistent with the broader view that large-data machine learning involves interacting challenges of volume, variety, velocity, and veracity rather than a single record-count threshold [6].
2.2. Interpretable Machine Learning for Enterprise Transaction Knowledge Discovery
Shannon entropy provides the foundational information-theoretic measure of uncertainty in a probability distribution [15]. Contemporary reviews continue to document its utility in data analysis and machine-learning settings where dispersion, uncertainty, or concentration must be quantified without imposing a predictive model [16]. In the present enterprise-transaction workflow, entropy is not itself treated as an AI predictor; instead, it supplies a global, inspectable descriptor of how observed quantity or value is distributed across active products. For a segment s, product-based entropy is defined as:
H(s) = −Σ p(k,s) ln[p(k,s)], k = 1, …, K
where p(k,s) is the share of product k in the total quantity or value observed in segment s, and K is the number of active products in that segment.
H_norm(s) = H(s) / ln(K)
Normalization permits comparisons across segments with different numbers of active products. Within the workflow, entropy is an interpretable descriptor of global demand structure rather than a machine-learning predictor. Higher values indicate a more even allocation of observed quantity or value across active products. Entropy is deliberately not interpreted as a direct measure of preparation difficulty, labor demand, waiting time, resource utilization, or enterprise-process complexity because those constructs are absent from the source data.
Basket-level features provide a second transparent representation of transaction structure. Distinct products, item lines, total quantity, basket value, and the multi-product indicator quantify observable breadth and intensity without latent feature transformations. Their explicit semantics facilitate comparison between machine-learned co-occurrence patterns and adjusted statistical models, supporting explanation at the level of variables that originate directly from the transaction-generating system.
Association-rule mining constitutes the principal unsupervised pattern-learning component. The classical framework expresses recurrent co-occurrence as human-readable conditional rules [17]. Comparative work on e-commerce transactions documents the computational tradeoffs between candidate-generation and pattern-growth strategies [18], while PyAerial targets scalable rule extraction with symbolic interpretability [19]. Numerical association-rule frameworks likewise position rule mining as an interpretable machine-learning paradigm with explicit post-processing and visualization [20], and incremental bespoke extraction addresses evolving or user-constrained rule spaces [21]. Recent longitudinal analytics further demonstrate the use of association-rule mining to extract interpretable patterns from multi-year observational data [8]. Established software and frequent-itemset methods provide additional strategies for transaction spaces, including arules, FP-growth, and broader frequent-itemset mining frameworks [34,35,36]. The present study adopts the classical binary transaction representation because it remains directly auditable and is sufficient for the stated co-occurrence objective.
A → B
where A is the antecedent and B is the consequent. In this study, products are treated as basket items, and each validated rule is evaluated using support, confidence, and lift:
support(A → B) = P(A ∩ B)
confidence(A → B) = P(A ∩ B) / P(A)
lift(A → B) = P(A ∩ B) / [P(A)P(B)]
Support quantifies pair prevalence, confidence measures conditional frequency, and lift compares observed co-occurrence with the expectation under independence. These quantities answer different questions and should not be collapsed into a single notion of rule quality [22]. More generally, association-rule quality is multidimensional and can be assessed through alternative interestingness measures beyond the three metrics emphasized here [37]. Recent work has shown that lift may be unstable or misleading when prevalence is highly skewed [23]. Sensitivity analysis is increasingly recognized as an important extension because association-rule measures can vary under changes in the analytical sample or rule-selection conditions [24]. Accordingly, the present workflow combines classical rule metrics with inferential screening, temporal stability, commercial context, and explicit limitations concerning threshold sensitivity.
The mined rules are interpreted as transparent descriptions of recurrent co-occurrence rather than as causal relationships or automatic recommendations. A high-quality rule may reflect consumption convention, menu architecture, preparation dependencies, modifiers, or employee routines. Explainability therefore resides in the rule’s inspectable structure and in the traceability of its quality metrics, not in a claim that the antecedent causes the consequent. This distinction is consistent with explainable data-driven systems research, which treats human interpretability as a design requirement rather than as a substitute for causal evidence [11].
2.3. From Pattern Discovery to Human-AI Decision Support
Enterprise AI creates value only when algorithmic outputs are connected to a defensible decision process. Management research emphasizes that AI systems vary in autonomy and inscrutability and therefore create different governance demands [4], while organizational decision-making research identifies hybrid human-AI arrangements in which algorithmic analysis and human judgment are combined sequentially rather than delegated completely [5]. The proposed workflow follows this augmentation logic. Association-rule metrics identify recurrent local structure; inferential procedures assess whether observed differences or co-occurrences are compatible with chance variation; effect sizes quantify magnitude; generalized linear models provide adjusted contextual associations; and the prioritization layer determines which screened patterns deserve human attention. This separation reduces the risk of treating algorithmic detectability as synonymous with operational relevance.
Basket value and basket composition are markedly right-skewed and heterogeneous across temporal contexts. Distributional differences are therefore assessed with the Kruskal-Wallis test [25], while categorical differences in multi-product incidence are examined with contingency-table methods. Effect sizes accompany p-values because, in large samples, statistical significance can be obtained for effects that are too small to justify substantive conclusions. For enterprise decision support, the distinction is essential: a statistically detectable pattern is not automatically a material business signal, and analytical ranking should not conceal effect magnitude.
Generalized linear models provide a transparent statistical-explanation layer rather than a second, ambiguously labeled machine-learning stage [26]. The count of distinct products is represented with a Negative Binomial specification, consistent with established use of overdispersed count models [27]. Positive right-skewed basket value is represented with a Gamma GLM and log link, an established specification for positive skewed continuous outcomes [28]. The models estimate adjusted associations between observed temporal context and basket-level outcomes; they are not presented as causal estimators, autonomous AI components, or out-of-sample forecasting systems.
Statistical robustness alone does not establish decision relevance. A rule can be frequent and statistically screened yet commercially negligible, temporally unstable, redundant, or operationally uncontrollable. Multi-criteria decision analysis offers a transparent way to combine heterogeneous evaluation dimensions while retaining explicit weighting assumptions [29]. The empirical four-component Composite Decision Score (CDS₄) is therefore defined as an exploratory decision-evidence ranking layer, not as a machine-learning accuracy metric, optimized objective function, or validated intervention policy. Its function is to reduce rule overload while leaving the final interpretation visible to domain experts.
The resulting architecture deliberately requires expert review at the decision stage. The ranking mechanism organizes evidence but does not infer causal mechanisms, estimate implementation costs, or select interventions. This design is consistent with human-AI decision structures in which algorithmic outputs inform rather than replace organizational judgment [5] and with explainable data-driven systems in which users must be able to audit, contest, and contextualize analytical outputs [11]. The enterprise value of interpretability is therefore not merely explanatory convenience; it is a governance property that supports accountable disagreement and selective adoption of machine-generated evidence.
2.4. Research Gap: Auditable AI-Driven Enterprise Decision Intelligence
The gap addressed by this study lies between transaction-generating enterprise systems and trustworthy AI-enabled decision use. Digital transformation and AI-capability research show that organizations increasingly seek to turn digital data into new decision capabilities [1,2,3], while AI-management research highlights the governance problems created by autonomy and inscrutability [4]. Yet many applied transaction-mining studies focus either on discovering patterns or on predictive performance, leaving the path from source-system veracity to interpretable discovery, statistical qualification, temporal replication, and accountable human review fragmented. The methodological gap is therefore not the absence of entropy, association rules, generalized linear models, or data-quality procedures as individual techniques. It is the limited integration of these components into an auditable enterprise-analytics architecture in which machine-learned co-occurrence, statistical association, and managerial prescription remain explicitly distinguishable. The present contribution connects these stages without obscuring which conclusions are learned from transaction structure, which are estimated statistically, and which still require human judgment. The specific gap addressed here is therefore architectural: how operational transaction records can be transformed into AI-enabled enterprise decision evidence through a reproducible sequence of data-veracity control, interpretable learning, statistical qualification, temporal validation, and accountable human review. The analytical logic is designed to remain applicable across transaction-bearing systems of record, whereas its empirical validation in the present study is restricted to the observed POS environment.
Figure 1 summarizes the implemented analytical workflow. Raw transaction-system records first undergo veracity controls and deterministic reconstruction. The resulting sparse basket-product representation feeds two complementary analytical branches: entropy-based global characterization and unsupervised association-rule learning. Statistical screening and contextual modeling then qualify the extracted evidence before the empirical four-component Composite Decision Score (CDS₄) produces a human-review order. Reproducibility, quality assurance, and publication-safe data governance operate across the full pipeline. Conceptually, the workflow can be interpreted as an analytical layer positioned between a transaction-generating system of record and a human decision process; production integration into ERP, cloud, or real-time enterprise architectures is outside the empirical scope.
3. Materials and Methods
3.1. Research Design, Enterprise Transactional Setting, and Analytical Scope
A longitudinal single-case design with internal temporal replication was adopted. The primary unit of analysis is the completed transaction basket, observed across 762 active sales days in one independently operated SME restaurant. The POS environment is treated as an operational transaction-generating information subsystem that produces structured records suitable for evaluating an enterprise analytics layer. It is not characterized as a full enterprise resource planning platform. The design enables repeated evaluation of data-quality, pattern-mining, interpretability, and decision-evidence procedures on a real-world transaction stream. It does not support population-level statistical generalization to restaurants or other industries; transferability is therefore argued at the level of transaction structure and analytical architecture rather than empirical effect sizes.
The observed data boundary contains two linked tables extracted from the POS environment. The header table records transaction identifier, date, time, total value, payment-related fields, table information, operator information, and status. The item-line table records product, quantity, unit price, line value, tax information, and operational identifiers. Baskets were reconstructed through the transaction identifier, which consistently linked transaction-level records with their item composition; an internal counter was excluded because it did not provide a stable one-to-one key across the full observation period. In enterprise-systems terms, these tables provide the system-of-record inputs to the analytical workflow; no production API, ERP connector, cloud service, or real-time integration was implemented.
The analysis is restricted to realized commercial transactions. Latent demand, refused or unavailable products, preparation and waiting times, staffing, inventory states, weather, local events, promotions, and managerial interventions are not observed. These exclusions define the inferential boundary: the workflow can discover recurrent structures and estimate associations within recorded transactions, but it cannot identify all mechanisms that generated those structures, demonstrate the effect of an intervention, or evaluate organization-wide digital transformation outcomes.
3.2. Sparse Machine-Learning Representation and Analytical Scale
The machine-learning task is defined on a binary basket-product incidence matrix X ∈ {0,1}N×P, where Xnp = 1 when product p is present in basket n and Xnp = 0 otherwise. This representation is appropriate for association-rule learning because the learning objective is recurrent co-occurrence rather than quantity prediction. In enterprise-analytics terms, the matrix converts validated transaction-system records into an AI-ready representation while preserving direct semantic links to observable products and baskets. The analysis explicitly evaluates dimensional variety, sparsity, combinatorial search, and data veracity; real-time velocity, distributed storage, and production inference are outside scope.
For N = 31,157 baskets and P = 710 products, X contains NP = 22,121,470 potential binary positions. The 139,396 retained item-level lines correspond to 139,394 unique basket-product presences after within-basket deduplication of two repeated product occurrences; thus ||X||₀ = 139,394 and density δ = ||X||₀/(NP) = 0.00630 (0.630%). The theoretical unordered pair universe is C(P,2) = P(P−1)/2 = 251,695. The implemen-tation does not enumerate a dense P×P matrix; instead, each basket contributes C(kₙ,2) observed pair combinations, where kₙ is its number of distinct products. Pair-count generation therefore scales with Σₙ C(kₙ,2), after which a minimum empirical fre-quency threshold prunes the candidate space before directional rule construction. This is a sparsity-aware implementation strategy, not a distributed-computing benchmark.
The analytical scale is consequently described in explicitly bounded terms: longitudinal volume is represented by 762 active days and 139,396 validated item-level observations; variety by 710 products and multiple temporal contexts; veracity by deterministic validation, linkage, duplicate control, and arithmetic reconciliation; sparsity by the 0.630% incidence density; and analytical value by interpretable pattern qualification and prioritization. The study does not claim streaming throughput, cluster-level scalability, or performance on web-scale data. Its contribution is the disciplined integration of representation, sparse pattern search, quality control, interpretability, statistical qualification, and reproducibility in a transaction-analytics workflow that could complement enterprise systems of record.
3.3. Enterprise Data Quality, Preprocessing, and Feature Engineering
Data preparation transformed administrative POS records into a coherent longi-tudinal dataset suitable for machine-learning pattern discovery and statistical model-ing. The procedure comprised DBF deletion filtering, transaction-level validation, item-line filtering, relational linkage, duplicate detection, basket reconstruction, arithmetic-consistency checks, anonymization, and derivation of analytical variables. Each operation was deterministic and documented so that the transformation from source records to publication-safe analytical files could be audited and reproduced.
First, records marked as deleted within the database structure were excluded from both source tables. Although such records remain physically present in the DBF files, they no longer represent active operational observations. Their removal prevents logi-cally deleted events from entering subsequent frequency estimates or learned co-occurrence structures.
Second, transaction-level validation retained only completed commercial transac-tions with positive transaction value. This rule removed open, incomplete, canceled, zero-value, or otherwise non-analytical transactions and defined the universe eligible for basket reconstruction.
Third, item-line validation retained only product lines with positive quantity, positive unit price, and positive line value. Returns, voided lines, zero-price entries, technical adjustments, and non-commercial records were therefore excluded before the binary transaction representation was constructed.
Validated item lines were linked to transaction headers through the stable trans-action identifier. Each unique valid transaction was then treated as one reconstructed basket. Exact core duplicates were identified using transaction identifier, product name, quantity, unit price, line value, product identifier, operator identifier, tax rate, and internal transaction information. Seven duplicate item-level records were re-moved. This step improved uniqueness and ensured arithmetic consistency between basket-level totals and retained item-level values.
The preprocessing workflow produced two linked analytical representations: an item-level file with one row per retained product line and a basket-level file with one row per reconstructed transaction. Item lines and distinct product counts are nearly identical at basket level, but two baskets contain the same product on two retained lines with different prices. Association-rule analysis therefore converts each basket to a set of unique product presences before pair enumeration. This yields 139,394 binary basket-product presences from 139,396 retained item-level lines without discarding the two legitimate item-level records from value analysis.
| Analytical variable | Meaning |
| transaction_id | Unique identifier of the reconstructed transaction basket |
| basket_value | Total value of the transaction basket |
| item_lines | Number of product lines in the basket |
| distinct_products | Number of unique products in the basket |
| total_quantity | Total quantity of products within the basket |
| multi_product_basket | Binary indicator showing whether the basket contains at least two distinct products |
| date | Transaction date |
| year | Transaction year |
| month | Transaction month |
| weekday | Day of the week |
| hour | Hour of transaction |
| service_interval | Operational time band of the transaction |
| table_number | Table identifier |
| operator_id | Anonymized operator identifier |
The service_interval feature was defined a priori using five operational time bands: early service (00:00-11:59), lunch (12:00-15:59), afternoon (16:00-18:59), dinner (19:00-21:59), and late evening (22:00-23:59). These intervals provide transparent temporal features for comparative analysis and are specific to the empirical imple-mentation rather than universal restaurant-period definitions.
3.4. Entropy-Based Demand Characterization
Demand dispersion was quantified using Shannon entropy across products within a segment s [16]. For quantity-based entropy, product shares were computed from sold quantities; for value-based entropy, shares were computed from item-line values:
H(s) = −Σ p(k,s) ln[p(k,s)], k = 1, …, K
where p(k,s) is the share of product k in the total quantity or value observed in segment s, and K is the number of active products in that segment.
Because the number of active products differed across months, weekdays, hours, and service intervals, normalized entropy was also calculated:
H_norm(s) = H(s) / ln(K)
Normalized entropy ranges from 0 to 1 and permits comparison across segments with different active-product counts. It is used as a scale-adjusted descriptor of global demand dispersion and complements basket-level composition variables. The inter-pretation is intentionally restricted to observed quantity or value distributions; entro-py is not treated as a direct estimator of operational workload, process complexity, or capacity utilization.
3.5. Interpretable Association-Rule Learning and Multiplicity Control
Association-rule mining was applied to reconstructed baskets as the principal unsupervised, interpretable machine-learning/data-mining procedure. This character-ization is consistent with recent BDCC work that uses association-rule mining to ex-tract interpretable patterns from longitudinal data [8]. Each basket was represented as a set of unique product presences, so quantities greater than one did not increase bi-nary item presence within that basket. Candidate directional rules took the form:
A → B
where A is the antecedent product or product set and B is the consequent. Reverse directions generated from the same unordered pair share support, lift, leverage, phi, and the same 2 × 2 co-occurrence table; only directional quantities such as confidence differ. Reverse directions are therefore not interpreted as independent pair-level dis-coveries.
Rules were evaluated using support, confidence, and lift:
support(A → B) = P(A ∩ B)
confidence(A → B) = P(A ∩ B) / P(A)
lift(A → B) = P(A ∩ B) / [P(A)P(B)]
Support, confidence, and lift provide complementary descriptions of prevalence, conditional frequency, and departure from independence. Rule selection did not rely on these metrics alone. A minimum pair-frequency criterion reduced the combinatorial search space before directional expansion, statistical screening controlled the multiplicity of tested co-occurrences, and the later CDS₄ incorporated commercial and temporal information absent from classical rule metrics. Contemporary adaptive rule-mining research similarly emphasizes the need to reduce redundant output when datasets are large or sparse [31].
Candidate unordered pairs were required to occur in at least 100 baskets, corre-sponding to minimum support of 0.00321 in the 31,157-basket dataset. Each retained pair generated two directional rules. Directional retention required confidence ≥ 0.10, lift ≥ 1.05, and Benjamini–Hochberg q ≤ 0.05 [32]. Pearson’s chi-square statistic was computed from each unordered pair’s 2 × 2 co-occurrence table. Because reverse direc-tions share exactly the same contingency table and p-value, multiplicity adjustment was performed at the unordered-pair level before directional expansion. Duplicating each pair-level p-value for the two directions before applying Benjamini–Hochberg produces the same adjusted q-values and ordering in this setting, while pair-level ad-justment represents the inferential family more clearly. Rule tests remain dependent because products and baskets recur across multiple pairs, so adjusted q-values are used as a pragmatic screening device rather than as a guarantee of exact false-discovery-rate control under arbitrary dependence.
Robustness was assessed in two complementary ways. First, threshold sensitivity recomputed the selected rule family over minimum pair counts of 50, 100, 150, and 200; minimum confidence values of 0.05, 0.10, 0.15, and 0.20; and minimum lift values of 1.00, 1.05, 1.10, and 1.20, while retaining q ≤ 0.05. Second, temporal validation used May 2024–December 2025 as a discovery period and January–June 2026 as a strictly subsequent validation period. Rules were discovered only in the earlier period and then re-evaluated in the later period using the full-sample minimum-support criterion (100/31,157 ≈ 0.00321), which scales the corresponding pair-count requirement to each period’s basket count, together with the same confidence, lift, and multiplicity criteria. Rank stability was summarized with Spearman correlations for support, confidence, and lift.
3.6. Statistical Modeling of Transaction Outcomes
Descriptive analysis characterized basket value, transaction composition, and temporal activity before formal modeling. Means, medians, upper percentiles, and dis-tributional visualizations were retained because model coefficients and rule metrics are otherwise difficult to interpret in the presence of strong skewness and extreme transactions.
Kruskal-Wallis tests compared basket-value and distinct-product distributions across temporal groups [25]. Multi-product-basket incidence was assessed with chi-square contingency-table tests. Epsilon-squared and Cramer’s V were reported as omnibus effect-size measures so that statistical detectability could be separated from practical magnitude.
The count of distinct products was modeled with a log-linked Negative Binomial specification, while positive basket value was modeled with a Gamma GLM and log link. Weekday, service interval, calendar month, and year were categorical predictors; Monday and early service were reference categories. The baseline analysis used the statsmodels NegativeBinomial GLM family with alpha fixed at 1.0. Robustness analysis compared this baseline with Poisson and an estimated-dispersion NB2 model, using day-clustered standard errors to account for shared within-day conditions. For basket value, the Gamma GLM was likewise re-estimated with day-clustered uncertainty on the full sample, after excluding the top 1% of basket values, and after additionally ex-cluding values below 1 RON. Exponentiated coefficients are reported with 95% confi-dence intervals as incidence-rate ratios or multiplicative effects. All coefficients are in-terpreted as adjusted associations, not causal effects.
The generalized linear models serve as statistical contextualization rather than as supervised machine-learning benchmarks. No train-test forecasting target or predic-tive performance metric is claimed. Model comparison is used to evaluate distribu-tional adequacy and robustness of adjusted associations, while cluster-robust uncer-tainty reduces sensitivity to unmodeled conditions shared by transactions from the same day.
3.7. Transparent Decision-Evidence Prioritization
The empirically active prioritization model is the four-component Composite Decision Score (CDS₄), constructed as an exploratory weighted aggregation for retained directional rules. Its purpose is to prioritize interpretable machine-learned patterns for human review rather than to automate an operational decision, estimate predictive accuracy, or function as an autonomous recommendation engine. The empirical formula is:
CDS₄ᵢ = 100 × [(2/7)ARᵢ + (2/7)DVSᵢ + (2/7)CIᵢ + (1/7)TSᵢ]
where AR is analytical relevance, DVS is context-based demand-variety significance, CI is commercial importance, and TS is temporal stability. AR is the arithmetic mean of min-max-normalized support, confidence, lift, and phi; DVS is normalized service-context entropy; CI averages normalized pair-revenue share and basket-value uplift; and TS is normalized temporal stability. These four components are empirically active and were min-max scaled within the retained-rule sample.
Operational controllability (OC) and implementation feasibility (IF) remain conceptually relevant for a future expert-informed decision model, but rule-specific assessments were unavailable in the present study. Setting both dimensions to a neutral value of 0.50 yields the conceptual six-component representation CDS₆ = 100 × [0.20AR + 0.20DVS + 0.20CI + 0.15OC + 0.15IF + 0.10TS]. Because OC and IF are constant, CDS₆ = 15 + 0.70 × CDS₄. This is an affine transformation of CDS₄ and therefore produces exactly the same rule ordering. All empirical ranking interpretations in this study are consequently based on CDS₄; CDS₆ is retained only to illustrate how future expert-assessed operational dimensions could be incorporated.
The CDS₄ weights are transparent analytical choices rather than empirically calibrated constants, and min-max scaling makes scores sample-dependent. Weight sensitivity was therefore evaluated using equal weights and alternative schemes emphasizing analytical relevance, commercial importance, or temporal stability. Stability was summarized with full-ranking Spearman correlation and Top-20 Jaccard overlap relative to the empirical CDS₄ baseline weighting. Table 2 summarizes the measurement logic and empirical status of all six conceptual dimensions.
3.8. Implementation, Reproducibility, Data Governance, and Deployment Boundary
The workflow was implemented in Python 3.12 within a versioned software environment recording pandas 3.0.5, NumPy 2.5.1, SciPy 1.18.0, statsmodels 0.14.6, matplotlib 3.11.1, scikit-learn 1.9.0, mlxtend 0.25.0, and associated dependencies. The executable pipeline covers DBF extraction, source validation, relational linkage, duplicate control, basket reconstruction, entropy estimation, inferential testing, generalized linear modeling, association-rule learning, CDS₄/CDS₆ calculation, figure generation, and quality-assurance checks. Environment capture reduces computational ambiguity and allows software-specific implementation choices to be inspected.
The reproducibility package, version 1.0.0, is publicly available at https://github.com/petreaioana/enterprise-transaction-systems-ml. It contains the inte-grated analytical code, software environment specification, publication-safe basket- and item-level datasets, product dictionary, rule-level outputs, statistical results, fig-ures, execution documentation, and quality-assurance reports. The code is released under the MIT License. Reuse of the derived transactional data remains subject to da-ta-owner authorization because the source records originate from a third-party com-mercial system.
A separate anonymization and privacy-validation workflow removed original transaction, operator, waiter, and table identifiers and excluded private product-name mappings. Stable public identifiers and publication-safe English labels were retained. The original FoxPro files remain restricted because they are third-party commercial records. This separation reduces unnecessary operational exposure while retaining the relational structure required to reproduce the reported analysis.
The workflow produces traceable artifacts from source import through cleaned analytical files, engineered basket features, entropy indicators, screened association rules, inferential statistics, regression estimates, composite rankings, and publication figures. Such provenance is not merely a reproducibility convenience: empirical evidence demonstrates that data-quality defects can materially alter machine-learning outcomes [9]. The present design therefore treats preprocessing and validation as components of the analytical architecture rather than as undocumented data preparation. From an enterprise-systems perspective, this traceability is also a deployment requirement: analytical evidence should remain auditable back to source records even when the workflow is later connected to broader business-intelligence or decision-support infrastructure.
The authors were solely responsible for the scientific design, data-processing rules, method selection, analytical implementation, verification, statistical analysis, interpretation of empirical results, and conclusions. During manuscript preparation, OpenAI ChatGPT (GPT-5.6 Sol, accessed 25 August 2026) was used to assist with language editing and structural reframing of the manuscript around the enterprise-systems context. The tool was not used to generate or modify source data, analytical results, figures, tables, statistical models, validation procedures, or reported numerical findings. All AI-assisted text was reviewed and edited by the authors, who take full responsibility for the final content.
3.9. Robustness, Temporal Validation, and Computational Stress Testing
The robustness protocol was executed on the publication-safe basket- and item-level data so that the robustness analyses remain independently reproducible without private identifiers. The protocol included: (i) out-of-period validation of association rules; (ii) threshold sensitivity across frequency, confidence, and lift; (iii) Poisson, fixed-alpha Negative Binomial, and estimated-dispersion NB2 model comparison with day-clustered uncertainty; (iv) Gamma sensitivity to extreme basket values; (v) exact CDS₆-to-CDS₄ reparameterization and alternative-weight sensitivity; and (vi) synthetic computational stress tests of sparse pair enumeration.
Computational scaling was assessed in two controlled synthetic scenarios. A fixed-catalog volume test repeated the observed transaction workload while preserv-ing the 710-product universe and observed pair-key set. A second disjoint-catalog rep-lication duplicated the transaction structure with non-overlapping product identifiers, causing the number of baskets, products, and observed pair keys to increase together. These tests measure in-memory enumeration behavior on the implemented Python pipeline; they are not distributed-computing or streaming benchmarks.
4. Results
4.1. Data Scale, Sparsity, and Quality Profile
The final analytical dataset covered 20 May 2024 to 28 June 2026, corresponding to 762 active sales days. After source validation, transaction filtering, item-line filter-ing, basket reconstruction, and duplicate control, 31,157 transaction baskets and 139,396 valid item-level sales lines remained. The analytical product universe con-tained 710 distinct product names, and total retained item-level value was 4,557,981.61 RON. These quantities define the empirical volume of the longitudinal transaction stream; the high-dimensional and sparse structure of the machine-learning representation is quantified below. Figure 2 provides a compact visual summary of the final analytical dataset.
The machine-learning incidence representation is markedly sparse. The 31,157 × 710 basket-product matrix contains 22,121,470 potential binary positions, of which 139,394 are occupied after collapsing repeated within-basket occurrences of the same product, corresponding to a density of 0.630%. The item-level file retains 139,396 valid lines because two baskets contain a repeated product line with a different price. At the product-pair level, the unconstrained combinatorial space contains 251,695 possible unordered pairs. The minimum pair-count threshold of 100 baskets therefore functions as both a reliability criterion and an explicit reduction of the candidate pattern space before directional rule generation.
Monthly activity varied substantially across the observation window (Figure 3). The highest monthly transaction volume occurred in June 2025 (2,469 baskets), whereas December 2024 produced the highest average basket value (266.6 RON) de-spite comparatively low volume. May 2024 and June 2026 represent partial calendar months and are interpreted accordingly.
The average basket value was 146.29 RON and the median was 74.70 RON, indi-cating pronounced right skew. The mean basket contained 4.47 distinct products, and 74.54% of baskets contained at least two products. Header totals and aggregated re-tained item values matched for all reconstructed baskets, supporting arithmetic and linkage consistency. The data therefore provide a verified representation of realized basket structure, while latent demand and operational states outside the POS bounda-ry remain unobserved. Table 3 reports the detailed final analytical and sparsity profile.
4.2. Descriptive and Temporal Demand Profile
Basket value ranged from 0.01 RON to 10,220.00 RON, with a mean of 146.29 RON, standard deviation of 350.55 RON, median of 74.70 RON, and 75th percentile of 153.90 RON. Figure 4 displays the distribution trimmed at the 99th percentile for legi-bility; all reported analyses used the untrimmed values. The extreme range is retained as part of the observed commercial record and is treated as a limitation when inter-preting mean-based results.
The median basket contained three distinct products and the mean was 4.47. The 95th and 99th percentiles were 12 and 20 products, respectively. Item-line and dis-tinct-product distributions are nearly identical, differing only in two baskets that con-tain a repeated product on two retained lines; distinct_products is therefore the pri-mary basket-composition outcome in subsequent modeling. Table 4 summarizes the basket-level descriptive statistics.
Descriptive temporal summaries showed higher average basket values on Satur-day (198.14 RON), Friday (171.09 RON), and Sunday (165.23 RON). Sunday had the highest median (99.40 RON), followed by Saturday (91.45 RON). Figure 5 shows the weekday distributions, while these unadjusted differences are evaluated with effect sizes and adjusted models below.
By service interval, the late evening interval generated the highest average basket value (246.47 RON) and the highest median basket value (112.70 RON). Dinner also showed greater basket breadth, with an average of 5.00 distinct products per basket, while late evening reached 5.26 distinct products per basket. Early service had the lowest basket breadth, with only 1.79 distinct products per basket and a multi-product basket share of 35.76%. Figure 6 contrasts transaction volume and average basket val-ue across the five service intervals, and Table 5 reports selected weekday and ser-vice-interval summaries.
4.3. Product-Level Concentration
Product-level sales value was concentrated around a recurring set of main dishes, side dishes, beverages, and desserts. The leading item was the grilled minced-meat product served with mustard, followed by two draught-beer products. Figure 7 reports the 12 highest-value products using publication-safe English labels linked to anony-mous public identifiers in the reproducibility repository. This descriptive concentration profile provides commercial context for later rule prioritization but does not itself es-tablish association strength.
4.4. Entropy-Based Global Demand Structure
Entropy results demonstrate that transaction volume and global demand disper-sion encode distinct properties of the observed transaction stream. Global normalized quantity entropy was 0.7083, whereas normalized value entropy was 0.7977, indicat-ing that value contributions were more evenly distributed across active products than sold quantities. Within the workflow, entropy therefore provides a transparent global representation of distributional structure that complements the local co-occurrence information learned by association rules.
Monthly normalized quantity entropy ranged from 0.7580 to 0.8829. The lowest monthly normalized entropy was observed in June 2025 (0.7580), a month with the highest number of baskets (2,469), suggesting that high-volume periods can still be rel-atively concentrated in product structure. The highest monthly normalized entropy was observed in December 2024 (0.8829), indicating a more dispersed demand profile despite a comparatively small number of baskets. The joint monthly evolution of nor-malized entropy and average distinct products per basket is presented in Figure 8.
Service-interval entropy also revealed an important distinction between demand volume and demand dispersion. Early service had the highest normalized quantity en-tropy (0.8315) but the lowest transaction volume and basket breadth. This suggests that although early service involved fewer transactions, the products sold were rela-tively dispersed across the active product set. By contrast, dinner and late evening generated higher transaction values and broader baskets, but their normalized entropy values were lower, at 0.7307 and 0.7268, respectively. These intervals therefore com-bined higher transaction values and broader baskets with more recurrent product structures.
Entropy adds a global information-theoretic view that is not recoverable from transaction volume alone. High-volume periods may be comparatively concentrated, while lower-volume periods may distribute demand more evenly across the active product set. This distinction is relevant to big-data analytics because global distribu-tional structure and local machine-learned co-occurrence patterns capture non-equivalent properties of the same sparse transaction matrix.
4.5. Interpretable Association-Rule Mining Results
Association-rule learning retained 1,174 directional rules under the prespecified screening criteria. Support ranged from 0.32% to 10.24% (median 0.62%), confidence from 10.00% to 79.61% (median 18.58%), and lift from 1.10 to 37.53 (median 2.01). Figure 9 shows the joint support-confidence distribution with lift and the conceptual CDS₆ encoded visually. Because CDS₆ is an affine transformation of CDS₄, the displayed score preserves exactly the empirical CDS₄ ranking. These rules represent statistically screened recurrent co-occurrences in the observed baskets; high lift at low support is not interpreted as evidence of broad operational importance.
The highest-ranked empirical CDS₄ direction linked French fries, 180 g, to grilled minced-meat rolls with mustard, 40/20/30 g. It appeared in 10.24% of baskets, with confidence 57.19%, lift 3.02, and phi 0.456. The reverse direction shares support, lift, phi, and the same co-occurrence table but has confidence 54.10%; it is therefore a different conditional statement rather than an independent pair-level discovery.
The retained rule set demonstrates the central role of pattern-space reduction. High-support associations describe recurrent structures with potential relevance for routine coordination, whereas high-lift associations identify stronger departures from independence that may nevertheless be rare. Statistical screening, temporal stability, commercial measures, and CDS₄ therefore operate as successive interpretability and prioritization layers rather than as claims that every mined rule is actionable. Table 6 reports selected validated directions ranked by the empirically active CDS₄.
The retained rules provide transparent evidence of recurrent within-basket co-occurrence. High-support pairs are more relevant to routine coordination because they occur frequently, whereas high-lift pairs indicate stronger departures from the expectation under independence. Neither statistical significance nor rule strength identifies the mechanism that generated an association. Consequently, any application to stock management, preparation, bundling, or menu design requires contextual evaluation by a domain expert.
4.6. Statistical Validation of Temporal Heterogeneity
All reported omnibus tests rejected equality across the examined temporal groups at p < 0.001. Because the sample contains 31,157 baskets, effect sizes are used to dis-tinguish statistical detectability from practical magnitude.
For basket value, epsilon-squared was 0.017 across weekdays, 0.057 across service intervals, and 0.035 across months. For distinct products, the corresponding values were 0.018, 0.039, and 0.049. The estimated omnibus magnitudes were therefore small to moderate, with service interval most prominent for basket value and month most prominent for basket composition.
Multi-product-basket incidence differed across weekdays (χ² = 263.76, df = 6, p < 0.001; Cramér’s V = 0.092) and service intervals (χ² = 908.39, df = 4, p < 0.001; Cramér’s V = 0.171). The service-interval association was stronger, although neither result sup-ports causal interpretation. Table 7 summarizes the omnibus tests and effect sizes.
The inferential tests indicate systematic temporal heterogeneity in the observed transaction stream, but the estimated effect magnitudes are not uniformly large. This distinction is essential in high-volume analytics because a large number of observa-tions increases statistical power without guaranteeing operational significance.
4.7. Interpretable Statistical Models
The estimated-dispersion NB2 model provides the preferred robustness specifica-tion for distinct products per basket. The outcome had mean 4.47 and variance 17.35, giving a variance-to-mean ratio of 3.88. AIC declined from 182,640.6 for Poisson and 160,519.1 for the fixed-alpha=1 Negative Binomial baseline to 154,216.3 for NB2, with estimated alpha = 0.4039. Using day-clustered standard errors, the incidence-rate ratio was 1.30 on Saturday (95% CI 1.23–1.36) and 1.39 on Sunday (95% CI 1.32–1.47), con-trolling for service interval, calendar month, and year.
Service-interval associations remained larger. Relative to early service, the day-clustered NB2 incidence-rate ratios were 1.97 for lunch (95% CI 1.82–2.13), 2.32 for afternoon (95% CI 2.14–2.52), 2.59 for dinner (95% CI 2.39–2.80), and 2.67 for late evening (95% CI 2.46–2.90). These estimates are close to the fixed-alpha baseline, indi-cating that the substantive count-model result is robust to dispersion estimation and within-day clustering.
The Gamma model with day-clustered uncertainty retained higher basket-value associations for Friday, Saturday, Sunday, dinner, and late evening. Multiplicative effects were 1.34 on Friday (95% CI 1.18–1.51), 1.47 on Saturday (95% CI 1.30–1.65), and 1.41 on Sunday (95% CI 1.24–1.61). Dinner had an effect of 1.59 (95% CI 1.08–2.34) and late evening 2.48 (95% CI 1.68–3.68) relative to early service. Excluding the top 1% of basket values increased the late-evening estimate to 2.94 (95% CI 2.41–3.58); ex-cluding values below 1 RON in addition produced 2.88 (95% CI 2.37–3.51). Thus, the direction of the service-interval relationship is robust, while its magnitude is sensitive to extreme transactions. Figure 10 summarizes selected exponentiated effects and their day-clustered 95% confidence intervals.
The robustness models provide adjusted contextual associations rather than pre-dictive or causal effects. Estimating Negative Binomial dispersion and clustering un-certainty by day preserved the main basket-breadth pattern. For basket value, clus-ter-robust confidence intervals are wider than conventional model-based intervals, and extreme-value exclusions materially change some service-interval magnitudes. The interpretation therefore emphasizes direction, uncertainty, and sensitivity rather than a single unqualified effect size. Table 8 reports selected adjusted robustness-model effects.
4.8. Composite Decision Prioritization
The empirically active four-component CDS₄ ranged from 15.89 to 65.15, with a median of 40.38. The conceptual six-component representation CDS₆ ranged from 26.12 to 60.61, with a median of 43.27. Because operational controllability and implementation feasibility were fixed at neutral values, CDS₆ is exactly related to CDS₄ through CDS₆ = 15 + 0.70 × CDS₄ and therefore produces an identical rule ordering (Spearman ρ = 1.000). All subsequent ranking and sensitivity interpretations refer to the empirically active CDS₄.
The highest empirical CDS₄ score (65.15) was assigned to the French-fries direction toward the grilled minced-meat item because it combined high support, confidence, lift, revenue share, and temporal stability. The reverse direction ranked second. Their proximity should not be read as two independent discoveries; it reflects two conditional directions for the same underlying pair. Figure 11 displays the highest-ranked rules using publication-safe English labels; the figure retains the conceptual CDS₆ scale from the original reproducibility output, but its ordering is identical to CDS₄.
CDS₄ compresses the screened rule family into an explicit review order. Alternative weights preserved the broad ranking comparatively well: full-ranking Spearman correlations with the empirical CDS₄ baseline weighting ranged from 0.847 to 0.950. The Top-20 set was more sensitive, with Jaccard overlap from 0.538 to 0.818, indicating that a very short managerial review queue depends meaningfully on weighting choices even when the overall ordering remains similar. The score does not establish that the highest-ranked rule is the optimal intervention or that acting on it improves performance. Table 9 summarizes the highest empirical CDS₄ results.
CDS₄ compresses a large validated rule set into an explicit and auditable review order. It does not establish that the highest-ranked rule corresponds to the most effective intervention, nor does it demonstrate that acting on a ranked pattern improves operational outcomes. The output is therefore best characterized as a decision-support artifact requiring expert review, in which algorithmically generated evidence is prioritized while causal interpretation, feasibility assessment, and action selection remain with the decision maker.
4.9. Robustness, Out-of-Period Validation, and Computational Stress Tests
Out-of-period validation separated the longitudinal sample into a discovery pe-riod (May 2024–December 2025; 24,467 baskets) and a subsequent validation period (January–June 2026; 6,690 baskets). The discovery period yielded 1,269 directional rules under the full-sample support-equivalent pair-frequency criterion and the same confidence, lift, and multiplicity criteria. In validation, 625 rules (49.3%) again satisfied all baseline thresholds. However, 1,188 rules (93.6%) retained lift above one, and dis-covery-versus-validation rank correlations remained high for support (Spearman ρ = 0.846), confidence (ρ = 0.849), and lift (ρ = 0.803). The rule structure therefore shows substantial persistence in relative association strength alongside temporal drift in prevalence and hard-threshold retention. Figure 12 visualizes discov-ery-versus-validation lift.
Threshold sensitivity showed that the baseline set of 1,174 directional rules was highly insensitive to modest lift changes. A minimum lift of 1.00 produced the same selected set, while lift thresholds of 1.10 and 1.20 retained 99.9% and 98.1% of baseline rules. Frequency and confidence were more consequential: minimum pair counts of 150 and 200 retained 65.8% and 48.1% of baseline rules, while confidence thresholds of 0.15 and 0.20 retained 66.7% and 45.1%, respectively. These results identify threshold dimensions that materially control rule-set size without implying that any single threshold is universally optimal.
The CDS₄ sensitivity analysis reinforced the distinction between broad ranking stability and short-list sensitivity. Equal, analytical-heavy, commercial-heavy, and stability-heavy weighting schemes produced Spearman correlations of 0.950, 0.932, 0.939, and 0.847 with the empirical CDS₄ baseline weighting, respectively. Corresponding Top-20 Jaccard overlaps were 0.818, 0.538, 0.600, and 0.600. Thus, overall prioritization is relatively stable, but the composition of the highest-priority review subset remains weight-dependent. Table 10 consolidates the principal robustness and validation checks.
Synthetic computational stress tests evaluated the sparse pair-enumeration stage. With a fixed 710-product catalog, increasing effective basket volume from 31,157 to 311,570 raised pair-enumeration time from approximately 0.24 s to 3.79 s while the observed pair-key set remained fixed. In a disjoint-catalog replication that simultane-ously increased baskets, products, and observed pair keys tenfold, runtime reached approximately 4.23 s and peak Python-traced memory 35.7 MB. Runtime increased approximately linearly over the tested range. These controlled results support compu-tational tractability of the implemented sparse enumeration step but do not establish distributed or streaming scalability. Figure 13 summarizes both synthetic scaling sce-narios.
Taken together, the robustness analyses narrow the interpretation of the workflow in a useful way. The principal co-occurrence and temporal findings are not artifacts of a single dispersion assumption, a single conventional standard-error calculation, or small changes in lift. At the same time, rule prevalence drifts in 2026, strict rule retention is incomplete, Gamma effect magnitudes respond to extreme values, and short-list CDS₄ membership changes under alternative weights. These qualifications strengthen rather than weaken the decision-support framing because they identify which analytical conclusions are structurally persistent and which remain threshold- or context-dependent.
5. Discussion
5.1. Interpretable Machine Learning and Statistical Qualification for Enterprise Transactions
The empirical case illustrates why enterprise transaction analytics should not be reduced to a single algorithm or a single measure of scale. The binary basket-product representation contains more than 22 million potential positions but only 139,394 unique observed product presences, while the product universe generates more than a quarter-million possible unordered pairs before frequency screening. This sparse high-dimensional structure creates a knowledge-discovery problem in which data quality, explicit representation, rule-space reduction, robustness analysis, and interpretability are first-class methodological concerns. For AI-enabled enterprise systems, the implication is that the quality of decision intelligence depends as much on the path from source records to analytical evidence as on the learning algorithm itself.
Entropy and association-rule learning answer different questions. Entropy characterizes global dispersion across the active product set, whereas association rules identify local recurrent structures within individual baskets. A high-volume interval can be relatively concentrated, and a lower-volume interval can be more dispersed; similarly, broad dispersion can coexist with stable item combinations. The two methods are therefore complementary rather than interchangeable components of transaction representation. Their combined use is useful in an enterprise context because global portfolio structure and local cross-item relationships may require different managerial responses.
Association rules provide the study’s principal machine-learning output because they transform repeated co-occurrence into explicit, inspectable propositions. Their interpretability is structural: antecedents, consequents, support, confidence, lift, and stability can be traced directly to observed transactions. This property reduces algorithmic inscrutability, one of the central governance challenges identified in the management of AI [4], and is particularly relevant when machine-generated evidence must be examined before managerial action. Explainable data-driven systems research similarly emphasizes that analytical value depends on the capacity of users to understand and interrogate outputs [11].
The inferential and generalized-linear-model layers serve a different epistemic function. They contextualize learned patterns by quantifying distributional differences, effect magnitudes, and adjusted associations. Temporal differences were readily detectable, but omnibus effect sizes were predominantly small to moderate. This finding is important for enterprise decision support because statistical detectability does not establish business materiality. The workflow therefore requires p-values, effect sizes, rule metrics, temporal robustness, and domain context to be interpreted jointly rather than allowing a single statistical or machine-learning indicator to dominate the decision process.
5.2. From Transaction Systems of Record to Auditable Decision Intelligence
The enterprise-systems contribution is best understood as a transition from systems of record to an auditable analytical layer, not as a claim that the source POS has been transformed into an ERP or autonomous AI platform. Digital transformation research stresses that organizational value arises when digital technologies alter decision and value-creation processes [1], while AI-capability and readiness research emphasizes the importance of suitable data, technical resources, skills, and organizational conditions [2,3]. The present study addresses one narrow but important part of that transition: how existing transaction records can be validated, represented, mined, statistically qualified, and prioritized in a form that remains inspectable by human decision makers.
The machine-learning claim is intentionally bounded. Association-rule mining is the unsupervised, interpretable pattern-learning component; entropy is an information-theoretic descriptor; and the Negative Binomial and Gamma models are explanatory statistical models. The study does not report supervised predictive accuracy, deep-learning performance, generative AI, autonomous agents, or real-time inference. This separation is a strength for the stated objective because enterprise decision intelligence does not necessarily require opaque prediction: in many operational settings, the immediate requirement is to discover recurrent structures, qualify their stability, and make the evidential basis of a proposed review transparent.
Scalability is addressed analytically through search-space reduction rather than through infrastructure benchmarking. The unconstrained product universe defines 251,695 unordered pairs, after which the minimum pair-count criterion removes infrequent structures before directional rule construction. Contemporary association-rule research similarly targets rule explosion and computational burden in large or sparse datasets [19], and adaptive methods show that dynamic filtering can reduce redundant rule output [31]. The implementation therefore demonstrates a transparent sparsity-aware baseline, but it does not establish optimal computational complexity or distributed enterprise-scale performance.
Rule robustness remains distinct from computational reduction. Conventional lift can be sensitive to prevalence [23], and sensitivity analysis has been proposed for association-rule measures under resampling and changing analytical conditions [24]. The present workflow addresses robustness through minimum frequency, multiplicity screening, temporal presence, support variability, threshold sensitivity, and out-of-period validation; formal resampling-based rule sensitivity was not conducted. For enterprise use, this distinction matters because computationally available patterns are not automatically stable enough to enter a decision process.
The methodological contribution is therefore the auditable sequencing of enterprise-data veracity controls, sparse representation, interpretable pattern discovery, rule-space reduction, statistical qualification, temporal validation, and transparent prioritization for expert review while keeping their epistemic roles separate. Although the empirical application is a restaurant, the architecture is defined in terms of transaction and basket representations and is transferable in principle to retail, service, order-management, event-log, and other transaction-bearing systems. Such transferability is architectural rather than empirical: cross-domain performance remains to be validated.
5.3. Implications for AI-Driven Enterprise Systems, Business Intelligence, and Decision Support
The workflow supports a staged form of AI-assisted operational review. Data validity is established first; global distributional structure and basket breadth are then distinguished from local machine-learned co-occurrence; statistically screened rules are contextualized by temporal and commercial information; and only then is the empirical CDS₄ used to focus managerial attention. This sequencing reduces analytical complexity without concealing why a pattern was retained or prioritized. In enterprise decision-support terms, the architecture therefore favors augmentation over delegation: the analytical system narrows and structures the evidence space, while the decision authority remains human [5].
This architecture also clarifies the relationship between business intelligence and AI-enabled decision support. Conventional reporting summarizes what happened in a transaction system; the present workflow adds interpretable pattern discovery, statistical qualification, temporal replication, and evidence prioritization. The result is not an autonomous decision engine but a decision-intelligence layer that can extend existing systems of record with analytically qualified signals. Such a layer is consistent with the broader digital-transformation objective of using digital resources to alter how organizations create and use information for decision making [1], while remaining compatible with the readiness requirement that AI use cases be aligned with available data and organizational capabilities [2,3]. Accordingly, the contribution to AI-driven enterprise systems lies primarily in the analytical handoff between systems of record and decision environments. The proposed architecture specifies what must remain auditable across that handoff—source-data validity, stable identifiers, explicit feature semantics, interpretable machine-learned patterns, statistical qualification, temporal robustness, provenance, and human decision authority. ERP, CRM, POS, order-management, cloud, or business-intelligence platforms may provide implementation contexts for this architecture, but the present evidence concerns the analytical layer rather than platform-specific interoperability.
The enterprise-architecture implication is deliberately modular. A future implementation could read validated transaction data from POS, ERP, CRM, or order-management environments and expose screened patterns through an existing business-intelligence or decision-support interface. The present study does not test those connectors, interoperability standards, cloud services, or production deployment choices. Instead, it provides the analytical logic that such an integration would need to preserve: stable identifiers, auditable reconstruction, explicit feature semantics, interpretable pattern metrics, statistical qualification, provenance, and human review. This modularity follows the work-system principle that analytical outputs should be interpreted in relation to the operational processes that generate them [13].
The empirical CDS₄ mitigates rule overload rather than estimating decision quality. Weight sensitivity demonstrates that the broad ranking is comparatively stable but that the Top-20 review list is moderately sensitive to alternative priorities. Operational controllability and implementation feasibility remain conceptually important but require rule-specific expert assessments before they can become active score dimensions. A prospective human-in-the-loop implementation could record review outcomes, accepted or rejected actions, and post-action performance, thereby providing supervision data for future calibration. This path is consistent with hybrid human-AI decision structures in which algorithmic output is followed by human evaluation rather than automatic execution [5].
For resource-constrained organizations, the practical advantage of the workflow is that it relies primarily on transaction data already generated by operational systems and on analytical components whose outputs remain inspectable. The appropriate response to a high-ranked rule is therefore not automatic implementation but structured validation of its mechanism, expected benefit, feasibility, cost, and measurable outcome. Recent operational research has combined association-rule signals with machine-learning forecasting to support time-sensitive decisions [33], while e-commerce work has integrated association-rule mining with supervised machine learning while retaining transactional interpretability [30]. The present study deliberately stops one step earlier: it produces qualified decision evidence without claiming predictive or intervention performance.
5.4. Explainability, Human Oversight, and Enterprise Data Governance
Interpretability is achieved through explicit feature definitions, human-readable association rules, conventional generalized linear models, and a fully specified empirical CDS₄. The architecture is therefore structurally interpretable rather than dependent on post hoc explanation of an opaque predictor. Support, confidence, lift, entropy, regression effects, and CDS₄ components are directly observed or mathematically defined, permitting the analytical pathway from transaction records to prioritization to be audited and contested. This design directly addresses the governance challenge of inscrutability in enterprise AI [4] and aligns with calls for valuable and explainable data-driven systems [11].
Human oversight remains indispensable because the dataset omits variables required to identify causal mechanisms and implementation feasibility. The workflow separates algorithmic discovery from domain interpretation: a manager can inspect why a rule is retained, determine whether it reflects trivial structure or a potentially informative relationship, and reject conclusions that conflict with operational knowledge. Explainability therefore enables informed disagreement; it does not eliminate judgment. This position is consistent with organizational decision-making frameworks in which human and AI capabilities are combined according to the interpretability and structure of the decision problem [5].
Data governance is addressed through publication-safe identifiers, removal of direct operational identifiers, restricted access to original commercial files, deterministic preprocessing, and reproducible publication-safe outputs. No customer identity is used and no sensitive personal attribute is inferred. These measures reduce privacy exposure while preserving the relational and transactional structure required for independent methodological inspection. In a production enterprise environment, the same principle would require governance across source-system access, analytical transformations, model outputs, and the downstream decision interface rather than treating privacy and provenance as post hoc documentation.
A prospective closed-loop implementation could record which machine-learned patterns were reviewed, which actions were selected, and which outcomes followed. Such feedback would permit the fixed exploratory ranking to evolve toward an empirically calibrated human-in-the-loop decision model. Candidate outcomes include stockouts, preparation time, waiting time, waste, contribution margin, and service reliability. Prospective evaluation is necessary to distinguish interpretable analytics from demonstrably effective decision support and to determine whether the analytical layer creates measurable enterprise value rather than merely additional information.
5.5. Limitations and Deployment Boundaries
First, the empirical evidence is derived from a single SME restaurant. The extended observation period provides substantial internal temporal replication but does not establish external validity across industries, restaurant formats, geographic settings, price levels, or transaction-system architectures. Multi-site and cross-domain evaluation is necessary before empirical generalizability can be claimed. The enterprise-systems argument is therefore limited to architectural transferability of the workflow, not transferability of the reported effect sizes or specific product rules.
Second, the dataset represents completed sales rather than total demand. Cus-tomer motivations, refused orders, stockouts, preparation and waiting times, staffing, weather, local events, promotions, and managerial interventions are unobserved. As-sociation-rule learning and statistical modeling can identify regularities in recorded transactions but cannot determine all mechanisms responsible for those regularities.
Third, product names constitute the analytical items. Renaming, spelling varia-tion, changing portion sizes, menu redesign, modifiers, and functionally equivalent products can alter entropy and co-occurrence estimates. The association-rule repre-sentation is binary within a basket and therefore does not model within-basket quan-tity except through separate entropy calculations.
Fourth, association rules are descriptive and non-causal, and some may reproduce obvious domain structure. Reverse directional rules from the same unordered pair are not independent discoveries and share the same contingency-table significance. Threshold sensitivity and out-of-period validation reduce reliance on a single rule-selection configuration, but the tests remain dependent because products and baskets recur across multiple pairs. The Benjamini–Hochberg adjustment is therefore treated as a pragmatic screening layer rather than a guarantee of exact false-discovery control under unrestricted dependence. Resampling-based rule stability, permutation procedures, and dependence-robust multiplicity methods remain important exten-sions.
Fifth, the robustness models use day-clustered standard errors and an estimat-ed-dispersion NB2 specification, addressing two limitations of the fixed-alpha baseline. Nevertheless, clustering by day does not fully model all possible serial, seasonal, staff, inventory, or event dependencies, and the models still omit several operational varia-bles. Generalized-estimating-equation, multilevel, residual-diagnostic, and influ-ence-analysis extensions should therefore be evaluated before stronger inferential claims are made.
Sixth, basket value is expressed in nominal RON over an observation window ex-ceeding two years. Extreme-value sensitivity analysis shows that the direction of key service-interval associations persists, but their magnitude changes when the top 1% of basket values is excluded. Price revisions, menu changes, inflation, partial months, and changing product composition can also affect temporal comparisons. Constant-price analyses and explicit price-regime controls remain warranted.
Seventh, the rule-prioritization score has not been externally validated against expert judgments or post-intervention outcomes. The exact four-component reparam-eterization removes the two constant baseline dimensions, and alternative-weight sen-sitivity quantifies ranking dependence, but min-max scaling remains sam-ple-dependent and the weights remain judgment based. The score is consequently a transparent prioritization demonstration rather than a trained or validated decision model.
Finally, the enterprise-systems positioning is architectural rather than a claim of production integration. The empirical source is a POS subsystem, and no ERP interoperability, cloud deployment, real-time MLOps pipeline, generative-AI component, autonomous workflow, or organization-wide digital-transformation outcome was implemented or evaluated. The study includes controlled synthetic scalability tests, but it does not establish distributed or streaming scalability. The observed near-linear runtime behavior applies to the implemented in-memory sparse pair-enumeration step under synthetic replication up to 311,570 effective baskets and should not be generalized to millions or billions of heterogeneous records, multi-node infrastructure, real-time inputs, or substantially wider baskets. Future work should therefore evaluate ERP and business-intelligence integration, benchmark distributed frequent-itemset implementations and stream processing, and test the workflow under changing-catalog and multi-organization conditions while preserving the veracity, interpretability, and human-governance controls demonstrated here.
6. Conclusions
This study develops and evaluates an interpretable machine-learning architecture for transforming enterprise transaction records into statistically qualified and auditable decision evidence. The workflow integrates deterministic data-veracity controls, sparse basket reconstruction, entropy-based global characterization, unsupervised association-rule learning, multiplicity screening, nonparametric inference, generalized linear modeling, temporal validation, and explicit prioritization for expert review. Its central design principle is epistemic separation: machine-learned co-occurrence, statistical association, and managerial prescription are treated as distinct forms of evidence rather than collapsed into a single claim of algorithmic intelligence. In that sense, the proposed architecture positions AI as a transparent analytical layer that augments a transaction-generating system of record rather than as an autonomous replacement for organizational decision making.
The empirical application reconstructs 31,157 baskets from 139,396 valid item lines observed across 762 active sales days and 710 products, corresponding to 139,394 unique binary basket-product presences. This produces a 22,121,470-position basket-product incidence space with 0.630% observed density and an unconstrained pairwise search space of 251,695 unordered product pairs. Quantity- and value-based entropy provide distinct views of global dispersion, and 1,174 directional association rules satisfy the prespecified full-sample screening criteria. Out-of-period analysis shows high rank stability and 93.6% preservation of lift above one, while 49.3% of discovery rules again satisfy all prespecified thresholds in validation. Estimated-dispersion and day-clustered specifications preserve the central associations between later-service/weekend contexts and broader or higher-value baskets, while extreme-value sensitivity qualifies the magnitude of Gamma effects.
The principal contribution is methodological and architectural rather than sector specific. Enterprise decision relevance is constructed through sequential evidence: data quality establishes veracity; explicit representation defines the machine-learning substrate; association rules discover interpretable local structure; multiplicity screening, threshold sensitivity, and out-of-period validation qualify that structure; cluster-robust contextual models estimate adjusted associations; temporal and commercial measures assess persistence and importance; and transparent weight-sensitive prioritization organizes human review. The resulting contribution to AI-driven enterprise systems is therefore an auditable analytical architecture positioned between transaction-generating systems of record and human-centered business-intelligence or decision-support environments. The study demonstrates the analytical logic and reproducibility requirements of this layer rather than production ERP integration, cloud deployment, or autonomous enterprise control.
Future research should evaluate the workflow across multiple organizations and transaction-system architectures; test production integration with ERP, CRM, POS, cloud, and business-intelligence environments; examine real-time and distributed frequent-itemset implementations; apply resampling, permutation, and dependence-robust multiplicity procedures; develop constant-price and price-regime adjustments; compare clustered, generalized-estimating-equation, and multilevel specifications; elicit rule-specific controllability and feasibility assessments; and evaluate prospective interventions against operational outcomes. Closed-loop deployment should also record human review decisions and post-action results so that future decision-support models can be calibrated on actual organizational feedback. These extensions are required to determine whether the proposed architecture retains its interpretability, reproducibility, auditability, and decision-support value across enterprise contexts.
Supplementary Materials
Publication-safe supporting materials are available in the associated GitHub repository, version 1.0.0: https://github.com/petreaioana/enterprise-transaction-systems-ml. They include the analytical code, software environment, anonymized derived basket- and item-level files, public product dictionary, rule-level and CDS outputs, figures, and quality-assurance reports. The original FoxPro files and private identifier mappings are excluded; reuse of derived transactional datasets is subject to da-ta-owner authorization.
Author Contributions
Conceptualization, M.P.C. and I.P.; methodology, M.P.C. and I.P.; software, M.P.C. and I.P.; validation, M.P.C. and I.P.; formal analysis, M.P.C. and I.P.; investigation, M.P.C. and I.P.; resources, M.P.C. and I.P.; data curation, M.P.C. and I.P.; writing—original draft prepa-ration, M.P.C. and I.P.; writing—review and editing, M.P.C. and I.P.; visualization, M.P.C. and I.P.; supervision, M.P.C. and I.P.; project administration, M.P.C. and I.P. Both authors contributed to the scientific interpretation of the findings and approved the final version of the manuscript. All authors have read and agreed to the published version of the manuscript.
Funding
This research was funded by Lucian Blaga University of Sibiu, grant no. 6106/06.12.2024, through the LBUS-IRG-2024 research grant. The article processing charge was funded by Lucian Blaga University of Sibiu.
Institutional Review Board Statement
Institutional review board approval was not required because the study used retrospective com-mercial transaction records, involved no intervention or direct interaction with human participants, and analyzed publication-safe files from which personal and operational identifiers had been re-moved.
Informed Consent Statement
Not applicable.
Data Availability Statement
The analytical code, software environment, publication-safe result tables, figures, quality-assurance reports, and anonymized derived datasets are available in the GitHub repository https://github.com/petreaioana/enterprise-transaction-systems-ml (version 1.0.0). The code is re-leased under the MIT License. Restrictions apply to reuse, redistribution, or modification of the de-rived transactional datasets because the underlying records are third-party commercial data and require authorization from the data owner. Original FoxPro DBF files, private product-name mappings, and internal operational identifiers are not publicly available. Subject to permission from the data owner, restricted materials may be considered for confidential editorial or reviewer in-spection through the corresponding author.
Acknowledgments
This research was funded by Lucian Blaga University of Sibiu, grant no. 6106/06.12.2024, through the LBUS-IRG-2024 research grant. The article processing charge was funded by Lucian Blaga University of Sibiu.
Conflicts of Interest
The authors declare no conflicts of interest.
References
- Vial, G. Understanding digital transformation: A review and a research agenda. J. Strateg. Inf. Syst. 2019, 28, 118–144. [Google Scholar] [CrossRef]
- Mikalef, P.; Gupta, M. Artificial intelligence capability: Conceptualization, measurement calibration, and empirical study on its impact on organizational creativity and firm performance. Inf. Manag. 2021, 58, 103434. [Google Scholar] [CrossRef]
- Jöhnk, J.; Weißert, M.; Wyrtki, K. Ready or Not, AI Comes—An Interview Study of Organizational AI Readiness Factors. Bus. Inf. Syst. Eng. 2021, 63, 5–20. [Google Scholar] [CrossRef]
- Berente, N.; Gu, B.; Recker, J.; Santhanam, R. Managing Artificial Intelligence. MIS Q. 2021, 45, 1433–1450. [Google Scholar] [CrossRef]
- Shrestha, Y.R.; Ben-Menahem, S.M.; von Krogh, G. Organizational Decision-Making Structures in the Age of Artificial Intelligence. Calif. Manag. Rev. 2019, 61, 66–83. [Google Scholar] [CrossRef]
- Surur, F.M.; Mamo, A.A.; Gebresilassie, B.G.; Mekonen, K.A.; Golda, A.; Behera, R.K.; Kumar, K. Unlocking the power of machine learning in big data: A scoping survey. Data Sci. Manag. 2025, 8, 519–535. [Google Scholar] [CrossRef]
- Roy, D.; Spiliotopoulou, E.; de Vries, J. Restaurant analytics: Emerging practice and research opportunities. Prod. Oper. Manag. 2022, 31, 3687–3709. [Google Scholar] [CrossRef]
- Iatropoulos, D.; Sarlis, V.; Tjortjis, C. A Data Mining Approach to Identify NBA Player Quarter-by-Quarter Per-formance Patterns. Big Data Cogn. Comput. 2025, 9, 74. [Google Scholar] [CrossRef]
- Mohammed, S.; Budach, L.; Feuerpfeil, M.; Ihde, N.; Nathansen, A.; Noack, N.; Patzlaff, H.; Naumann, F.; Har-mouch, H. The effects of data quality on machine learning performance on tabular data. Inf. Syst. 2025, 132, 102549. [Google Scholar] [CrossRef]
- Massaoudi, M.; Ez Eddin, M. DataAiPrep: A comprehensive machine learning data quality assessment tool for training dataset optimization. SoftwareX 2026, 34, 102662. [Google Scholar] [CrossRef]
- Abelló, A.; Bellatreche, L.; Romero, O.; Vassiliadis, P.; Wrembel, R. Towards Designing Valuable and Explainable Data-Driven Systems. Inf. Syst. Front. 2026, 28, 861–875. [Google Scholar] [CrossRef]
- Spohrer, J.; Vargo, S.L.; Caswell, N.; Maglio, P.P. The service system is the basic abstraction of service science. Inf. Syst. E-Bus. Manag. 2009, 7, 395–406. [Google Scholar] [CrossRef]
- Alter, S. Work system theory: Overview of core concepts, extensions, and challenges for the future. J. Assoc. Inf. Syst. 2013, 14, 72–121. [Google Scholar] [CrossRef]
- Sterman, J.D. Business Dynamics: Systems Thinking and Modeling for a Complex World; Irwin/McGraw-Hill: Boston, MA, USA, 2000. [Google Scholar]
- Shannon, C.E. A mathematical theory of communication. Bell Syst. Tech. J. 1948, 27, 379–423. [Google Scholar] [CrossRef]
- Sepúlveda-Fontaine, S.A.; Amigó, J.M. Applications of entropy in data analysis and machine learning: A review. Entropy 2024, 26, 1126. [Google Scholar] [CrossRef] [PubMed]
- Agrawal, R.; Imieliński, T.; Swami, A. Mining association rules between sets of items in large databases. ACM SIGMOD Rec. 1993, 22, 207–216. [Google Scholar] [CrossRef]
- Hunyadi, I.D.; Constantinescu, N.; Țicleanu, O.-A. Efficient discovery of association rules in e-commerce: Com-paring candidate generation and pattern growth techniques. Appl. Sci. 2025, 15, 5498. [Google Scholar] [CrossRef]
- Karabulut, E.; Groth, P.; Degeler, V. PyAerial: Scalable association rule mining from tabular data. SoftwareX 2025, 31, 102341. [Google Scholar] [CrossRef]
- Fister, I., Jr.; Emsenhuber, G.; Plümer, J.H.; Fister, I.; Holzinger, A. niarules: Advancing interpretable machine learning through numerical association rule mining and 3D coral plot visualization. SoftwareX 2026, 33, 102470. [Google Scholar] [CrossRef]
- Kim, E.H.; Kim, H.G.; Hwang, S.H. Incremental extraction of bespoke association rules. Knowl.-Based Syst. 2026, 336, 115127. [Google Scholar] [CrossRef]
- Bao, F.; Mao, L.; Zhu, Y.; Xiao, C.; Xu, C. An improved evaluation methodology for mining association rules. Axioms 2022, 11, 17. [Google Scholar] [CrossRef]
- Sowan, B.; Zhang, L.; Matar, N.; Zraqou, J.; Omar, F.; Alnatsheh, A. A novel lift adjustment methodology for improving association rule interpretation. Decis. Anal. J. 2025, 15, 100582. [Google Scholar] [CrossRef]
- Kenett, R.S.; Gotwalt, C. The Analysis of Association Rules: Sensitivity Analysis. Appl. Stoch. Model. Bus. Ind. 2025, 41, e70022. [Google Scholar] [CrossRef]
- Kruskal, W.H.; Wallis, W.A. Use of ranks in one-criterion variance analysis. J. Am. Stat. Assoc. 1952, 47, 583–621. [Google Scholar] [CrossRef]
- Nelder, J.A.; Wedderburn, R.W.M. Generalized linear models. J. R. Stat. Soc. Ser. A 1972, 135, 370–384. [Google Scholar] [CrossRef]
- Stoklosa, J.; Blakey, R.V.; Hui, F.K.C. An overview of modern applications of Negative Binomial modeling in ecology and biodiversity. Diversity 2022, 14, 320. [Google Scholar] [CrossRef]
- Akram, M.; Cerin, E.; Lamb, K.E.; White, S.R. Modelling count, bounded and skewed continuous outcomes in physical activity research: Beyond linear regression models. Int. J. Behav. Nutr. Phys. Act. 2023, 20, 57. [Google Scholar] [CrossRef] [PubMed]
- Więckowski, J.; Sałabun, W.; Kizielewicz, B.; Bączkiewicz, A.; Shekhovtsov, A.; Paradowski, B.; Wątróbski, J. Recent advances in multi-criteria decision analysis: A comprehensive review of applications and trends. Int. J. Knowl.-Based Intell. Eng. Syst. 2023, 27, 367–393. [Google Scholar] [CrossRef]
- Pai, P.-Y.; Lin, S.-W.; Lu, W.-M. Integration of association rule mining and RFM analysis with machine learning for e-commerce customer value segmentation: A sustainable retail perspective. Qual. Quant. 2026, 60, 87–125. [Google Scholar] [CrossRef]
- Essalmi, H.; El Affar, A. Dynamic Algorithm for Mining Relevant Association Rules via Meta-Patterns and Re-finement-Based Measures. Information 2025, 16, 438. [Google Scholar] [CrossRef]
- Benjamini, Y.; Hochberg, Y. Controlling the false discovery rate: A practical and powerful approach to multiple testing. J. R. Stat. Soc. Ser. B 1995, 57, 289–300. [Google Scholar] [CrossRef]
- An, M.J.; Jung, S.H.; Lee, D.H. Demand forecasting in micro-fulfillment centers using association rule-based ma-chine learning. Int. J. Prod. Econ. 2025, 290, 109789. [Google Scholar] [CrossRef]
- Hahsler, M.; Grün, B.; Hornik, K. arules—A Computational Environment for Mining Association Rules and Fre-quent Item Sets. J. Stat. Softw. 2005, 14, 1–25. [Google Scholar] [CrossRef]
- Han, J.; Pei, J.; Yin, Y. Mining frequent patterns without candidate generation. ACM SIGMOD Rec. 2000, 29, 1–12. [Google Scholar] [CrossRef]
- Borgelt, C. Frequent item set mining. WIREs Data Min. Knowl. Discov. 2012, 2, 437–456. [Google Scholar] [CrossRef]
- Geng, L.; Hamilton, H.J. Interestingness measures for data mining: A survey. ACM Comput. Surv. 2006, 38, 9. [Google Scholar] [CrossRef]
Figure 1.
Big-data-oriented, reproducible workflow for sparse transactional analytics. The archi-tecture separates data-veracity controls, sparse representation, entropy-based characterization, interpretable association-rule learning, statistical contextualization, transparent prioritization, and decision support subject to expert review. Velocity and distributed-computing performance are outside the empirical scope of the present retrospective analysis.
Figure 1.
Big-data-oriented, reproducible workflow for sparse transactional analytics. The archi-tecture separates data-veracity controls, sparse representation, entropy-based characterization, interpretable association-rule learning, statistical contextualization, transparent prioritization, and decision support subject to expert review. Velocity and distributed-computing performance are outside the empirical scope of the present retrospective analysis.

Figure 2.
Final analytical dataset profile after deletion filtering, transaction validation, basket re-construction, and duplicate control.
Figure 2.
Final analytical dataset profile after deletion filtering, transaction validation, basket re-construction, and duplicate control.
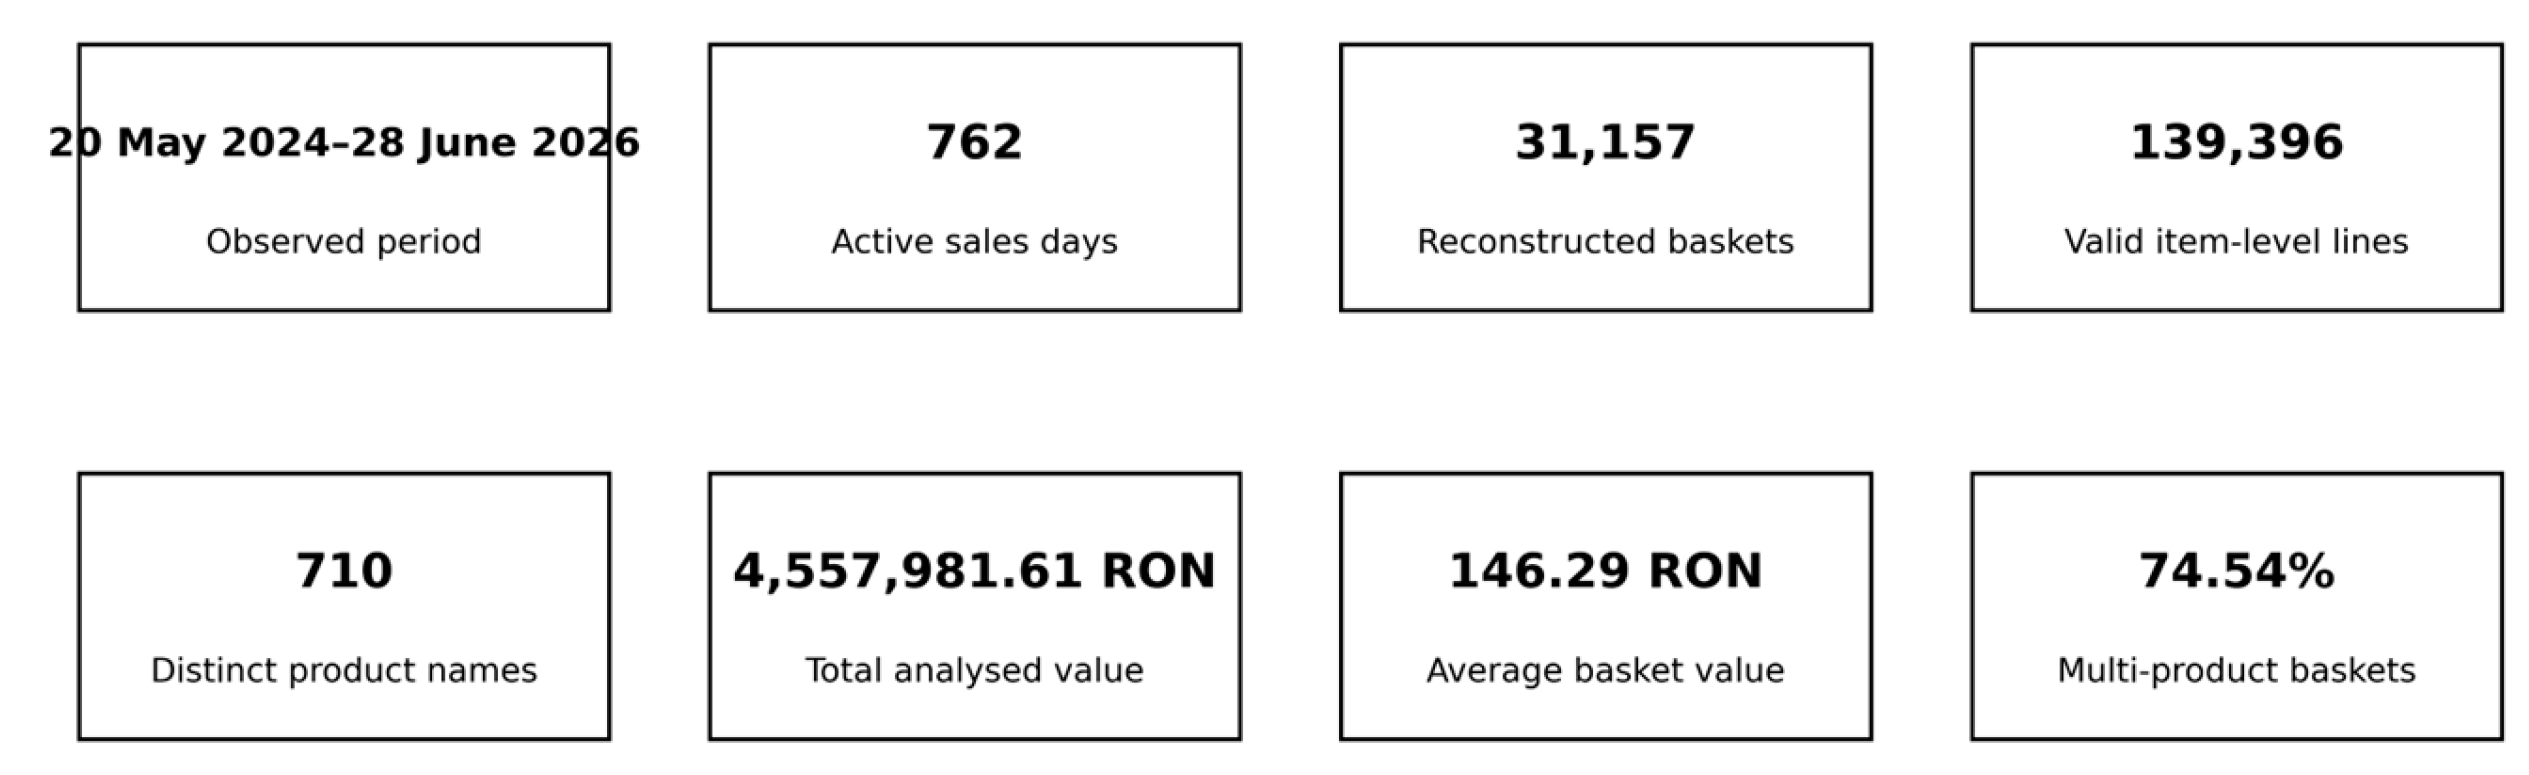
Figure 3.
Monthly transaction volume and average basket value. May 2024 begins on 20 May, and June 2026 ends on 28 June; both are partial months.
Figure 3.
Monthly transaction volume and average basket value. May 2024 begins on 20 May, and June 2026 ends on 28 June; both are partial months.
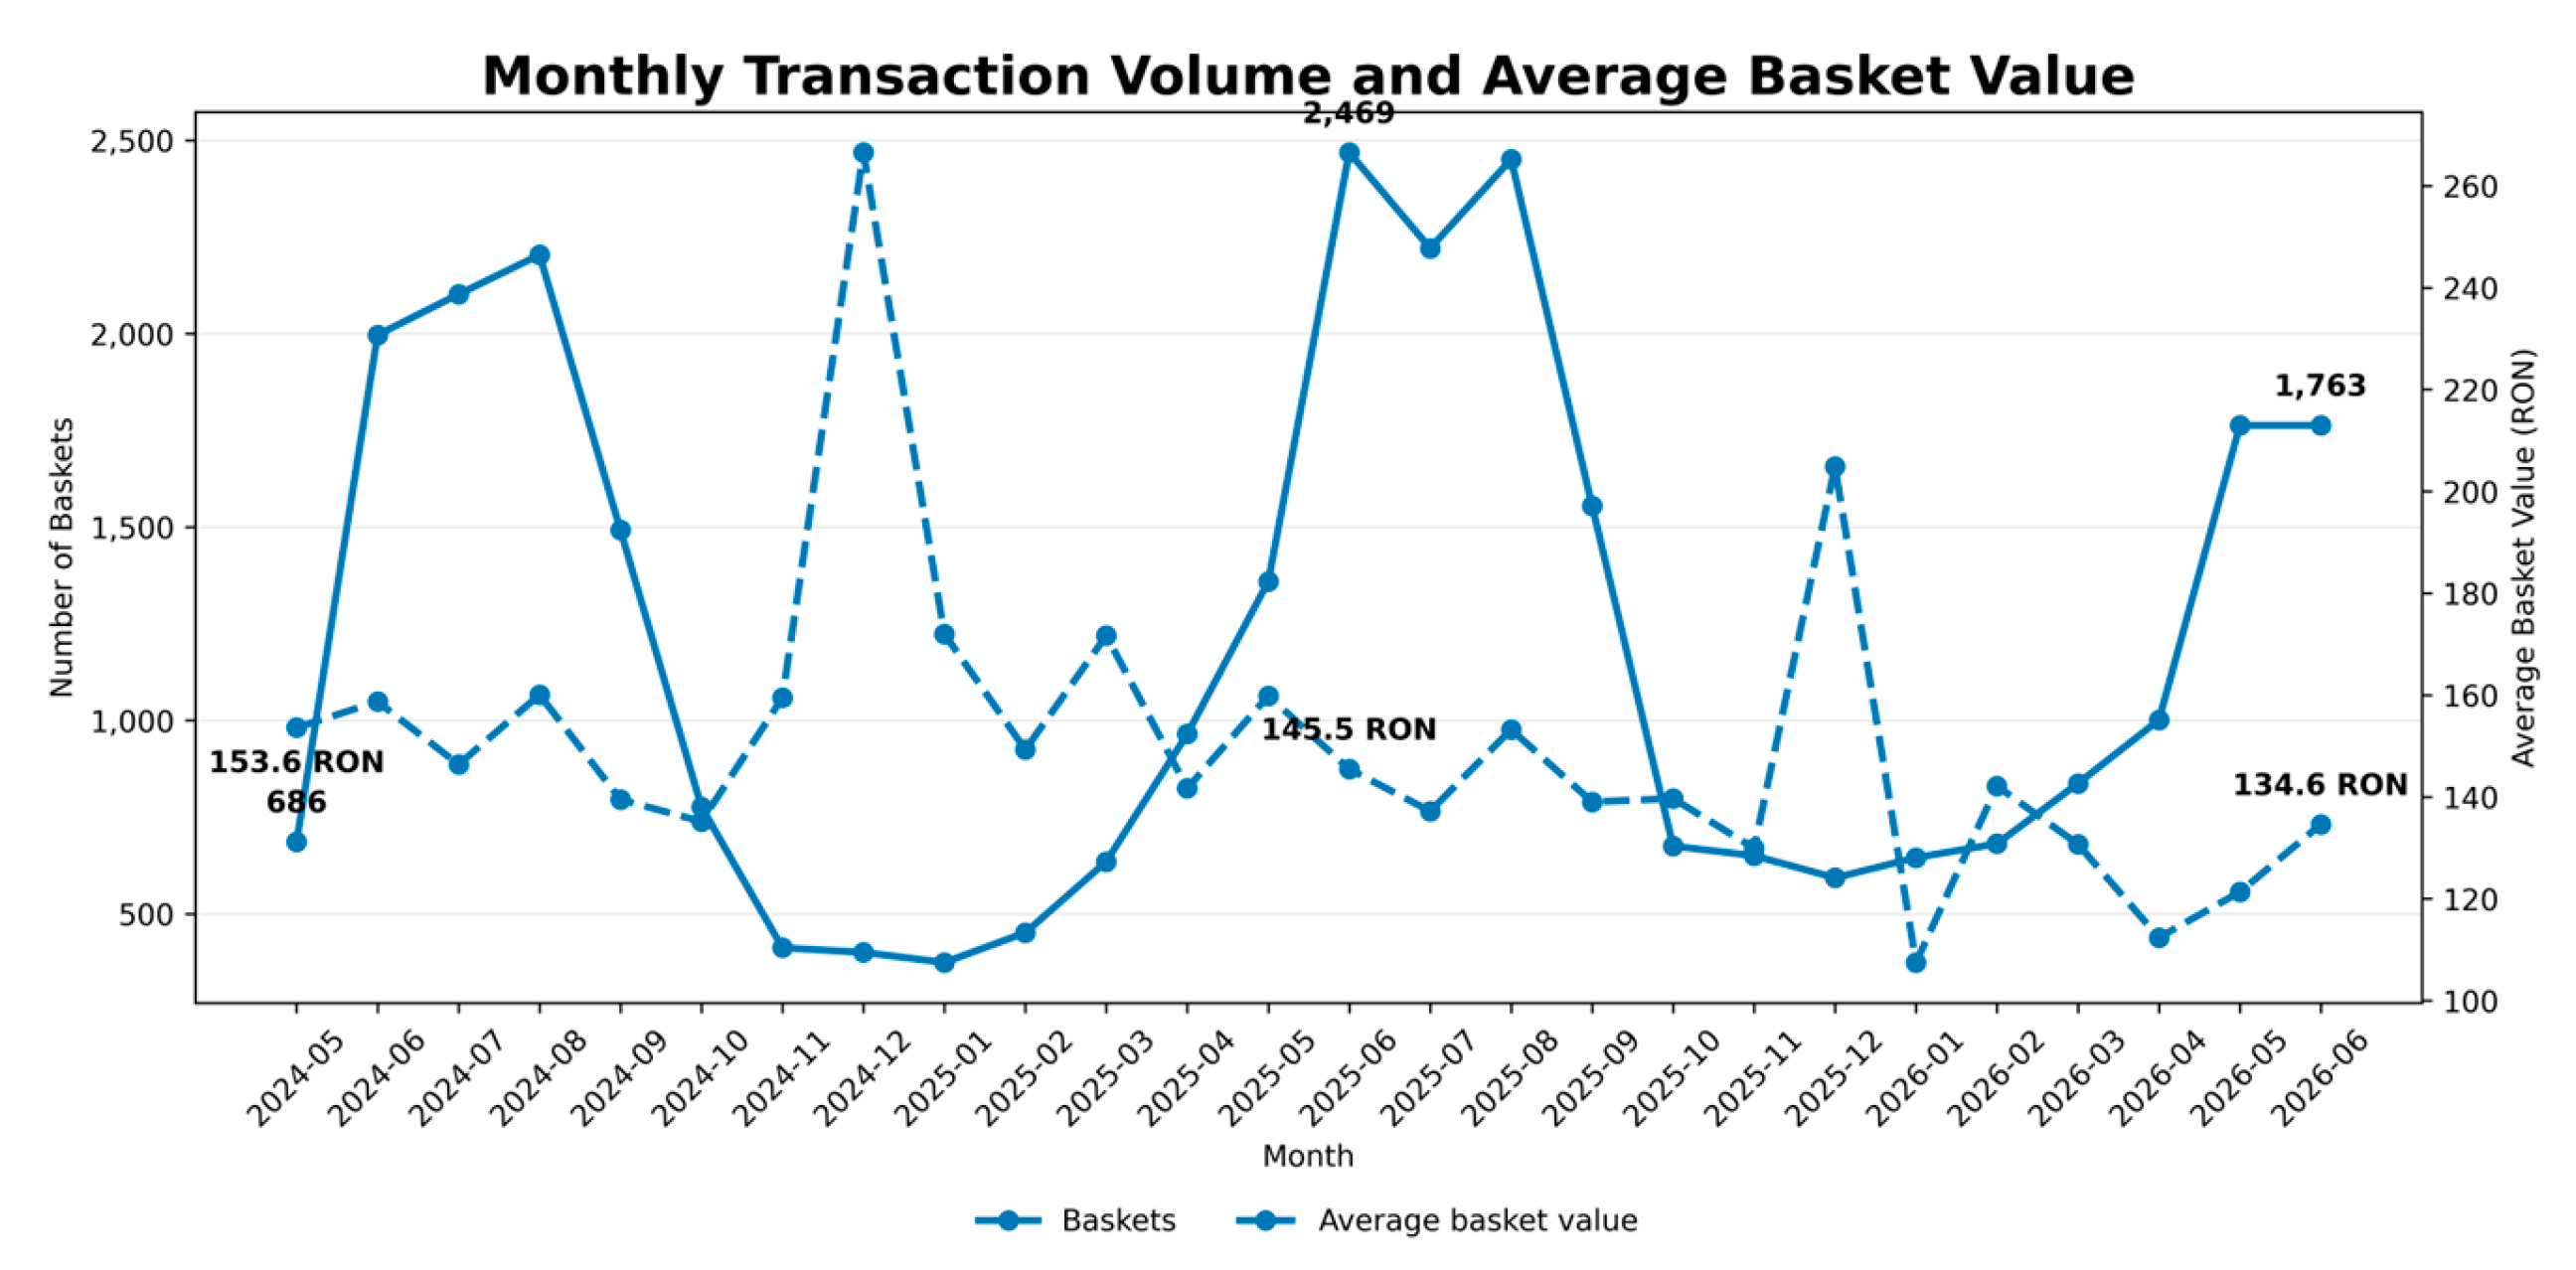
Figure 4.
Distribution of basket values trimmed at the 99th percentile for visualization. Vertical lines mark the median (P50), P90, and P95; the underlying statistical analysis used the full untrimmed dataset.
Figure 4.
Distribution of basket values trimmed at the 99th percentile for visualization. Vertical lines mark the median (P50), P90, and P95; the underlying statistical analysis used the full untrimmed dataset.
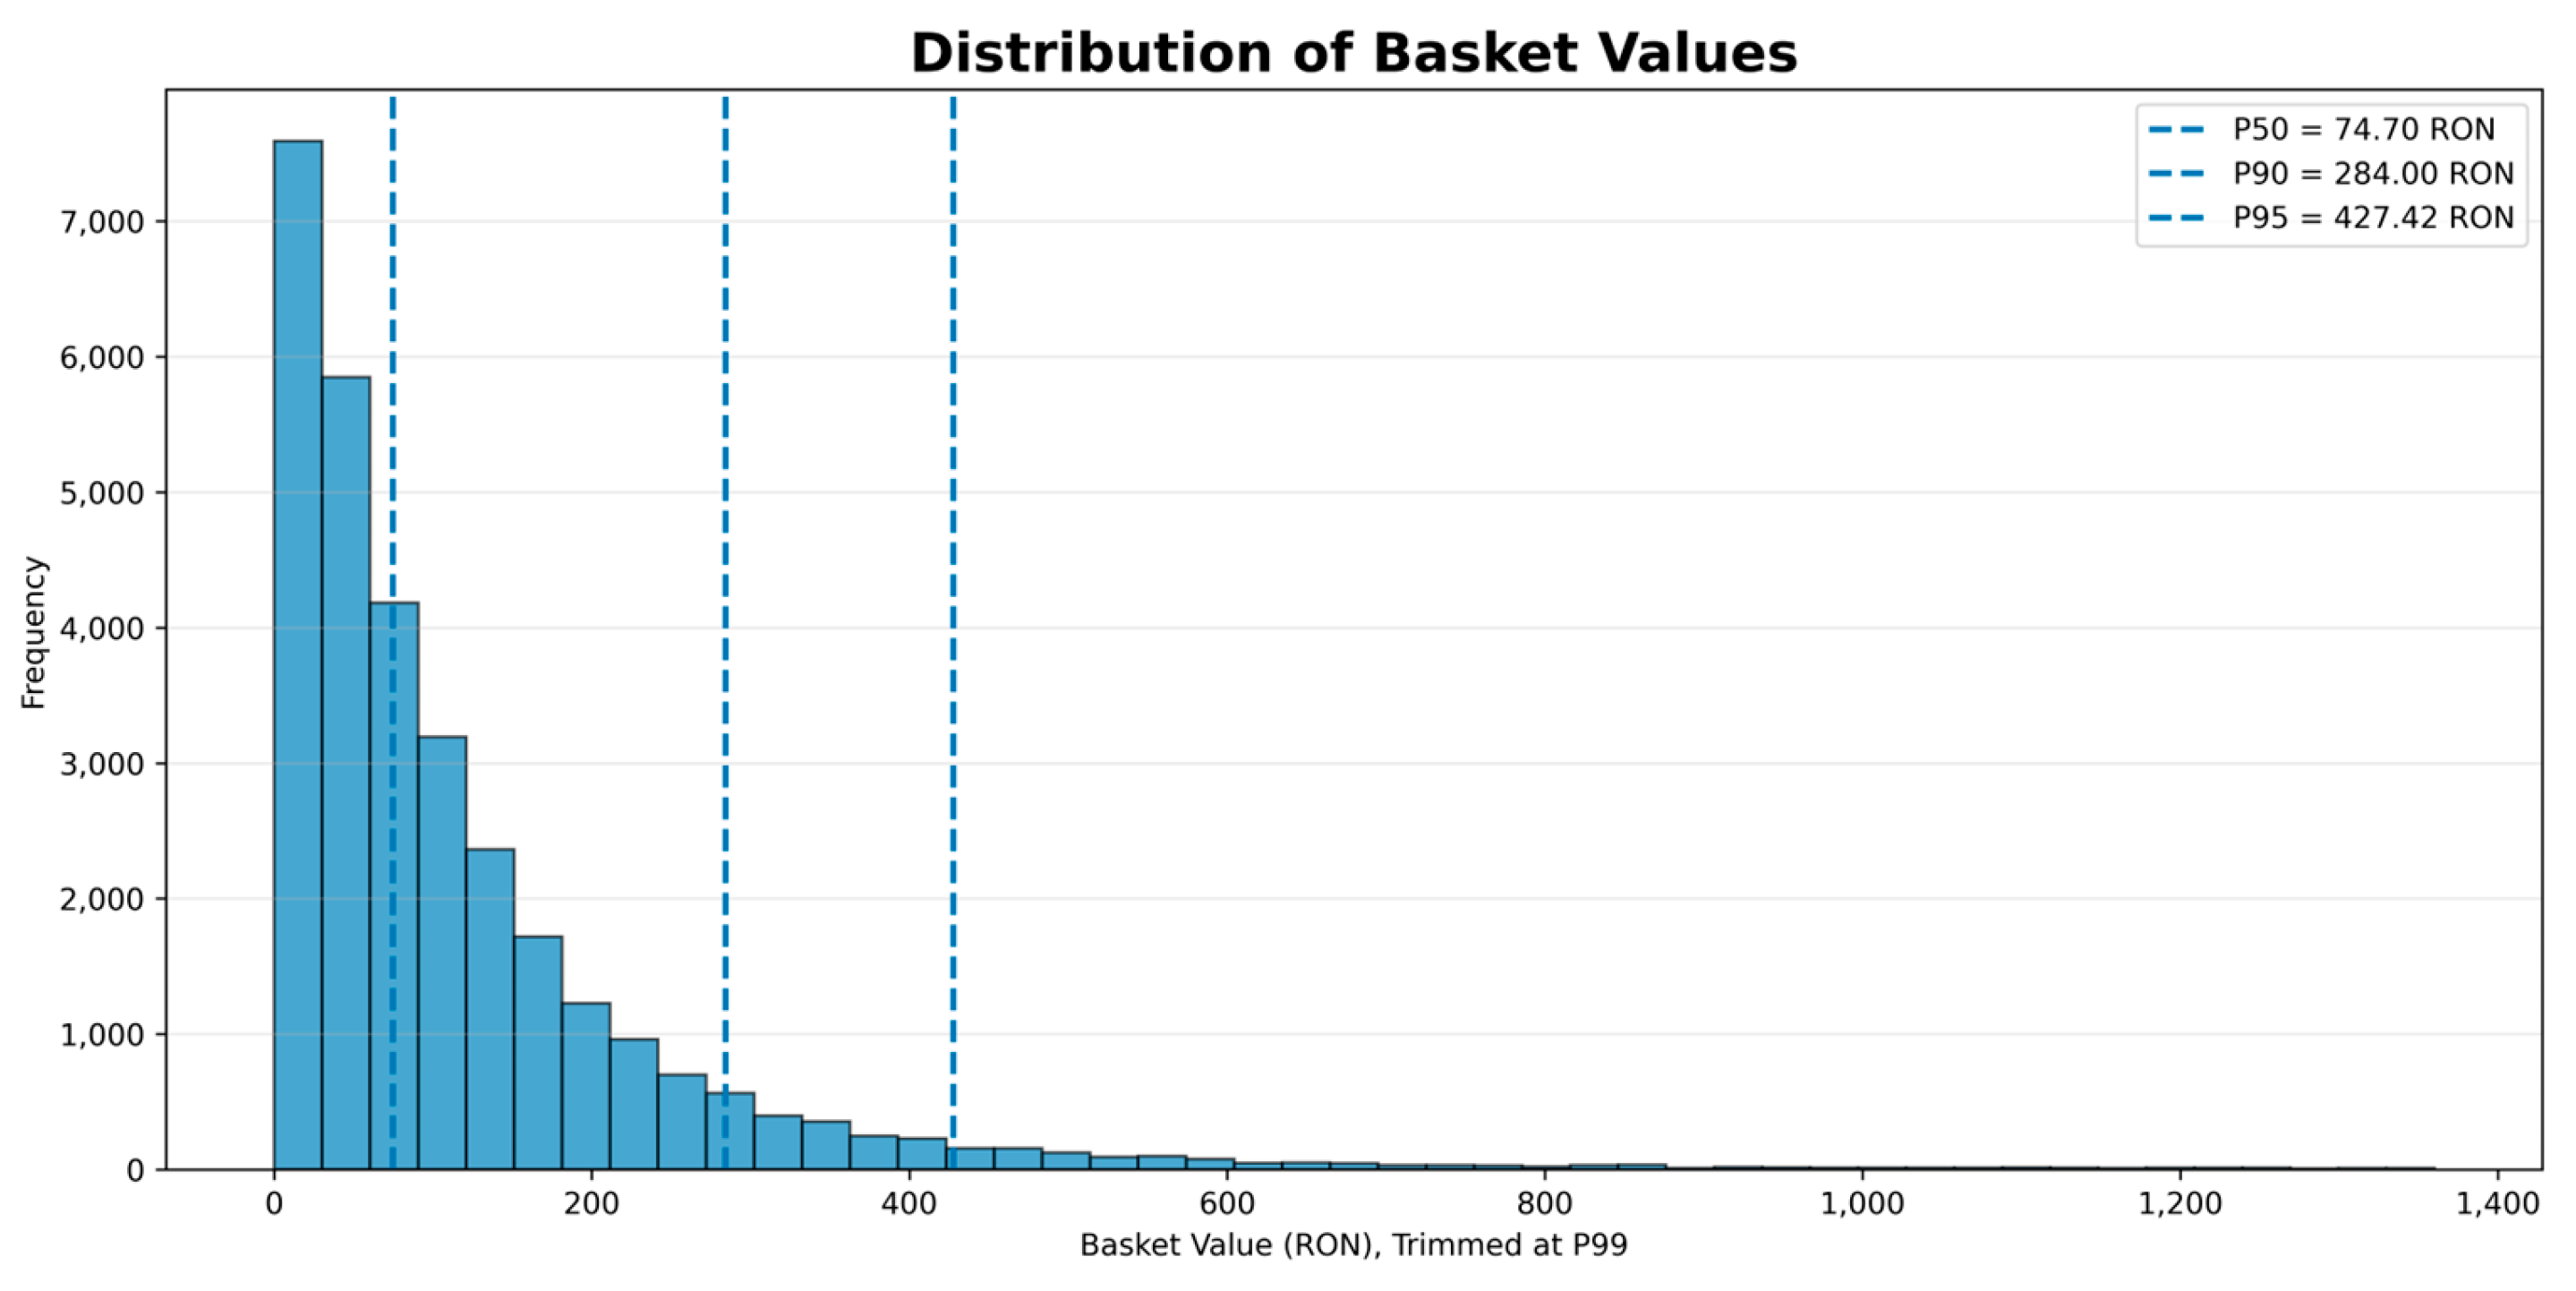
Figure 5.
Distribution of basket values by weekday. Boxes show the interquartile range and the horizontal line within each box shows the median; extreme outliers are omitted from the display but retained in all analyses.
Figure 5.
Distribution of basket values by weekday. Boxes show the interquartile range and the horizontal line within each box shows the median; extreme outliers are omitted from the display but retained in all analyses.
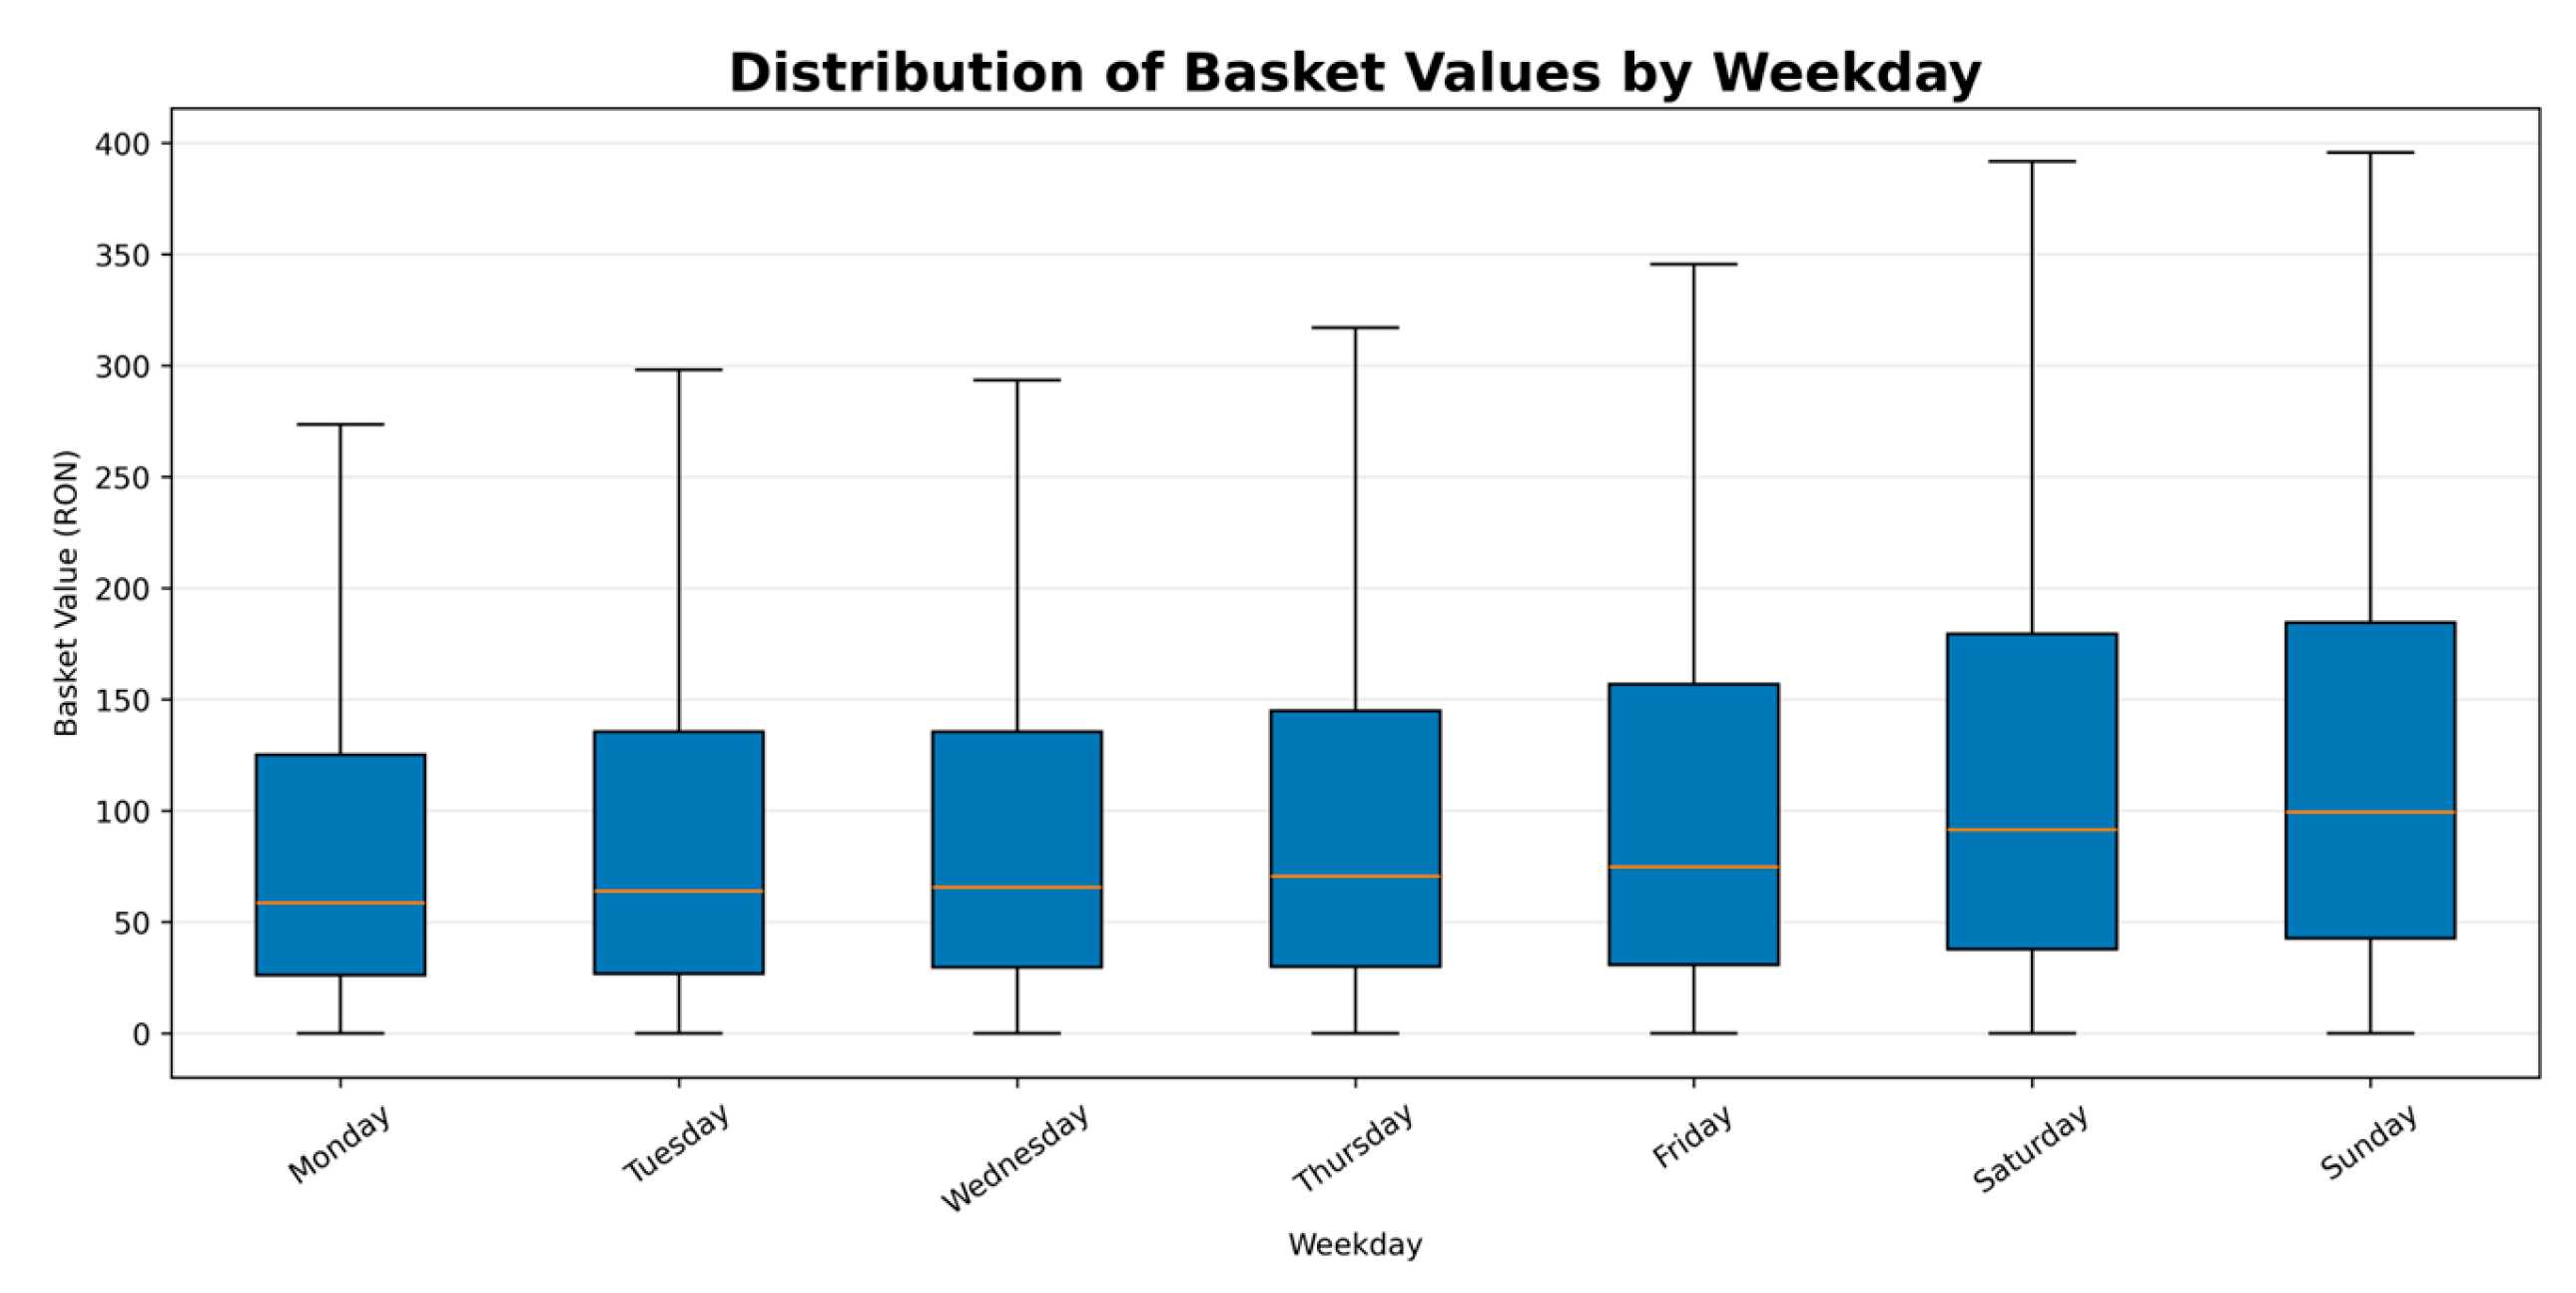
Figure 6.
Service-interval demand profile: (a) number of reconstructed baskets and (b) average basket value.
Figure 6.
Service-interval demand profile: (a) number of reconstructed baskets and (b) average basket value.
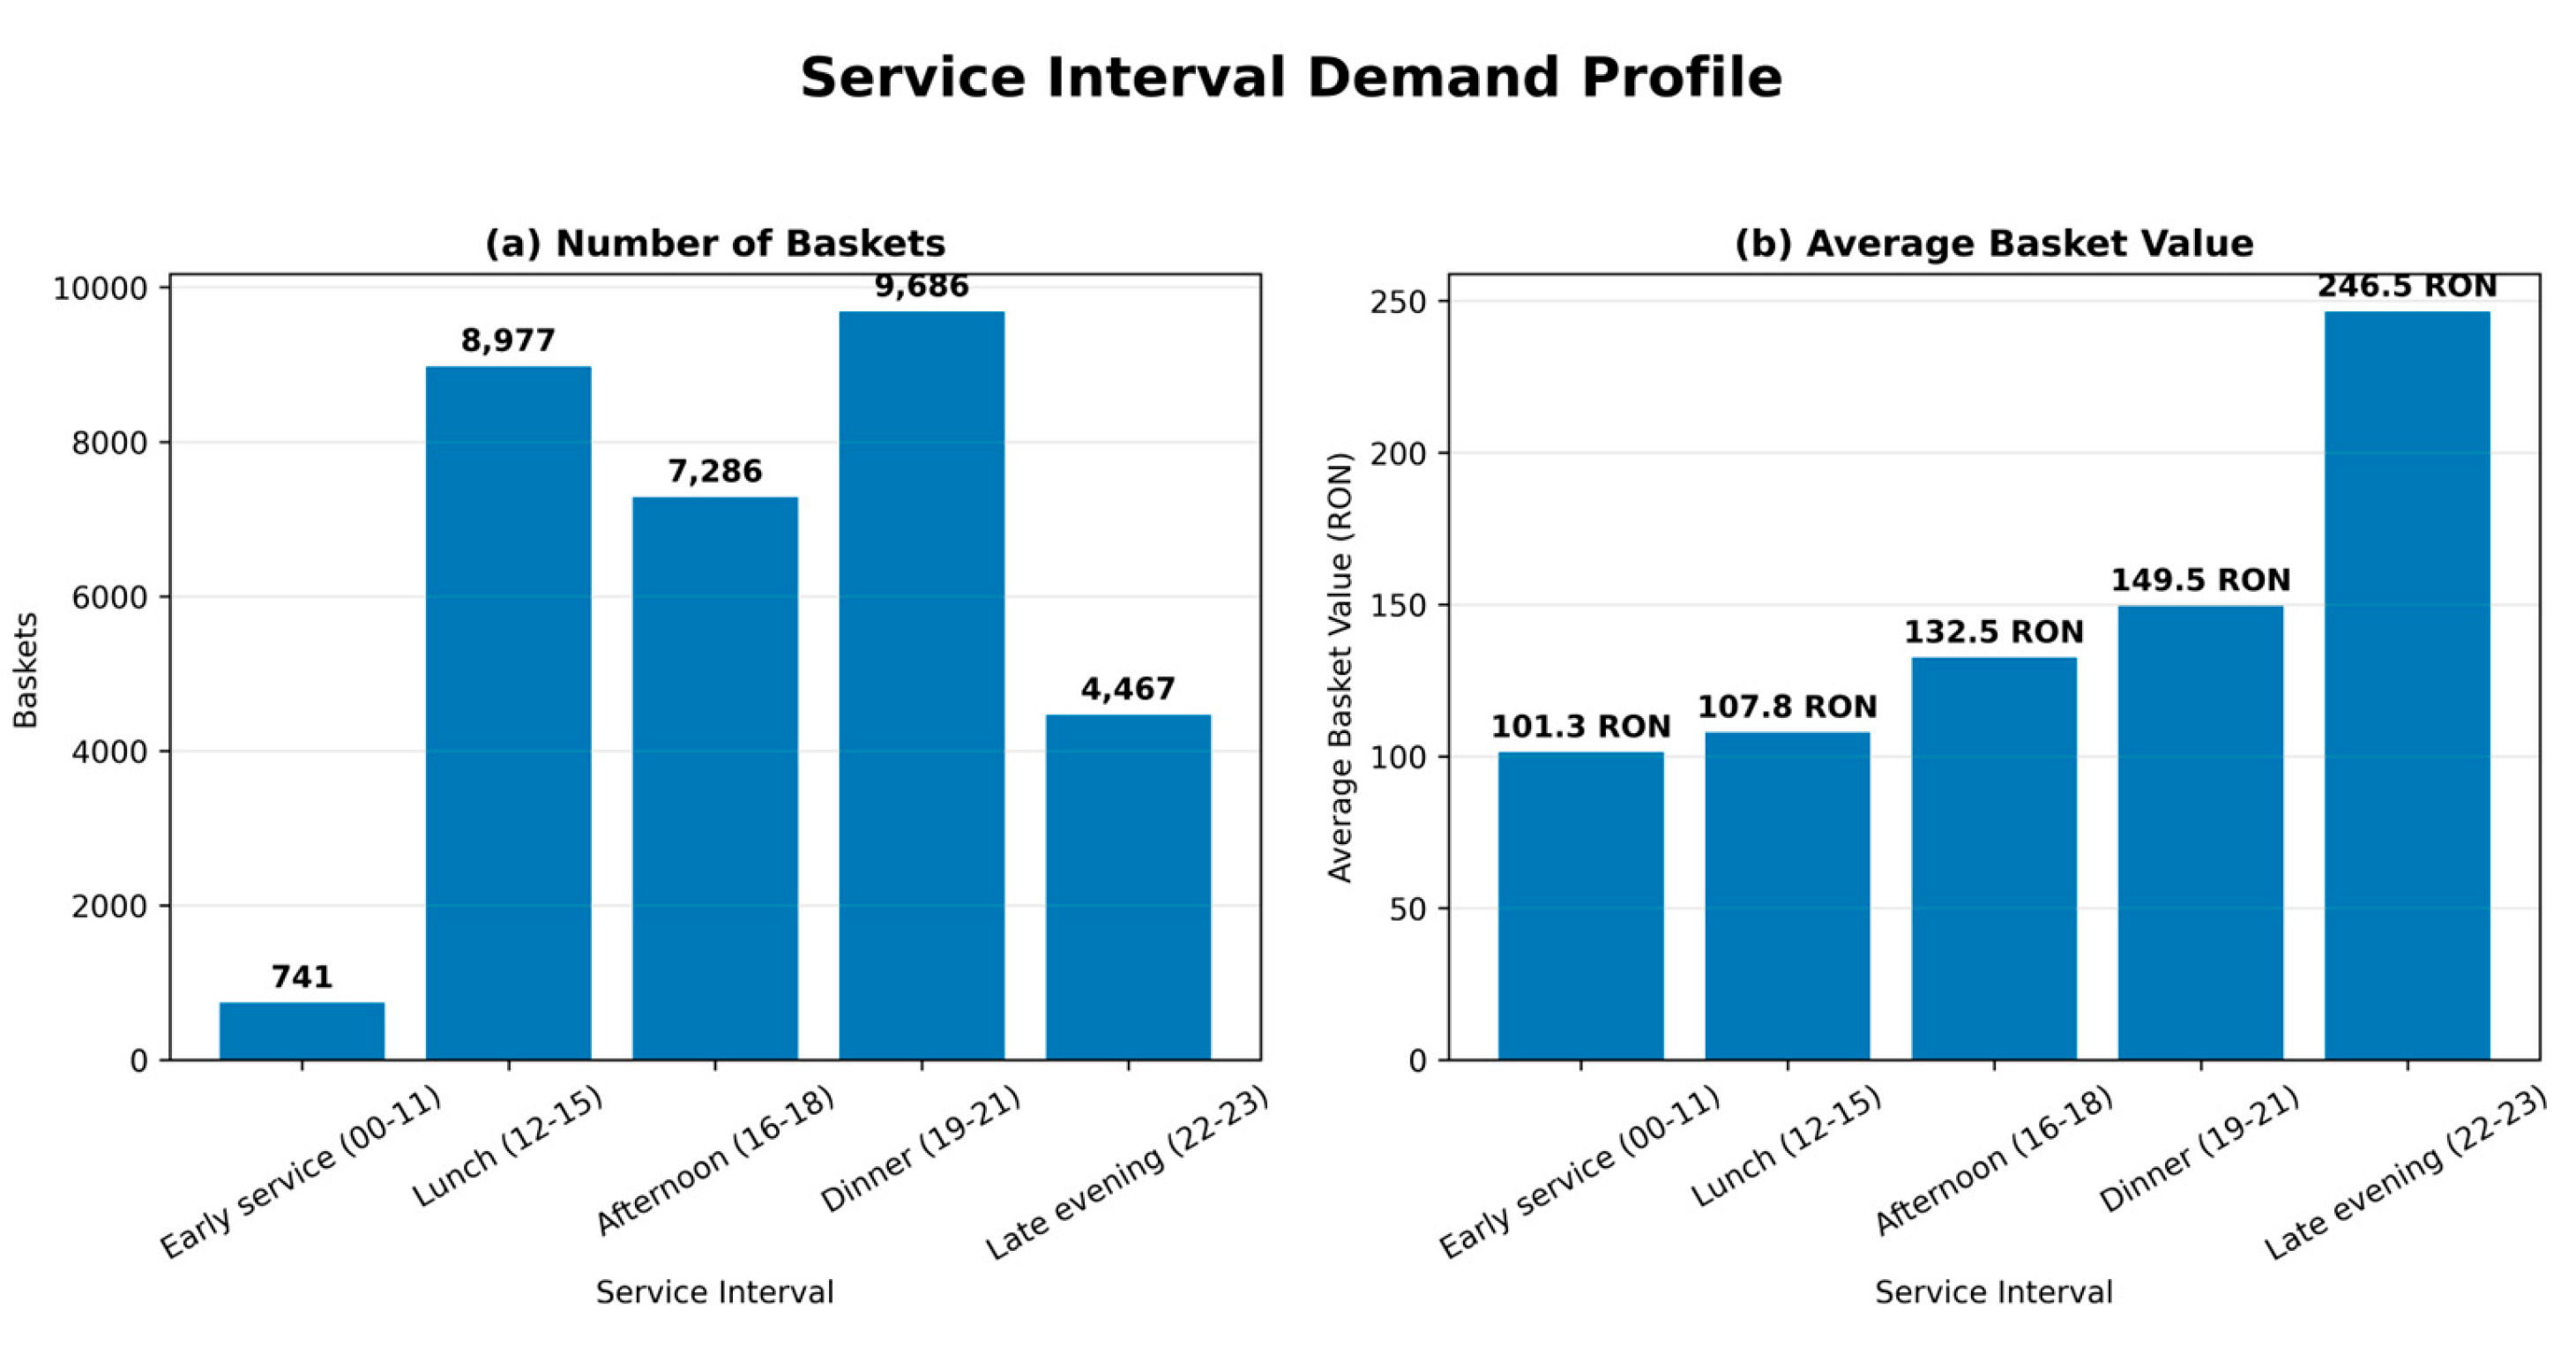
Figure 7.
Top 12 products by total sales value using publication-safe English product labels.
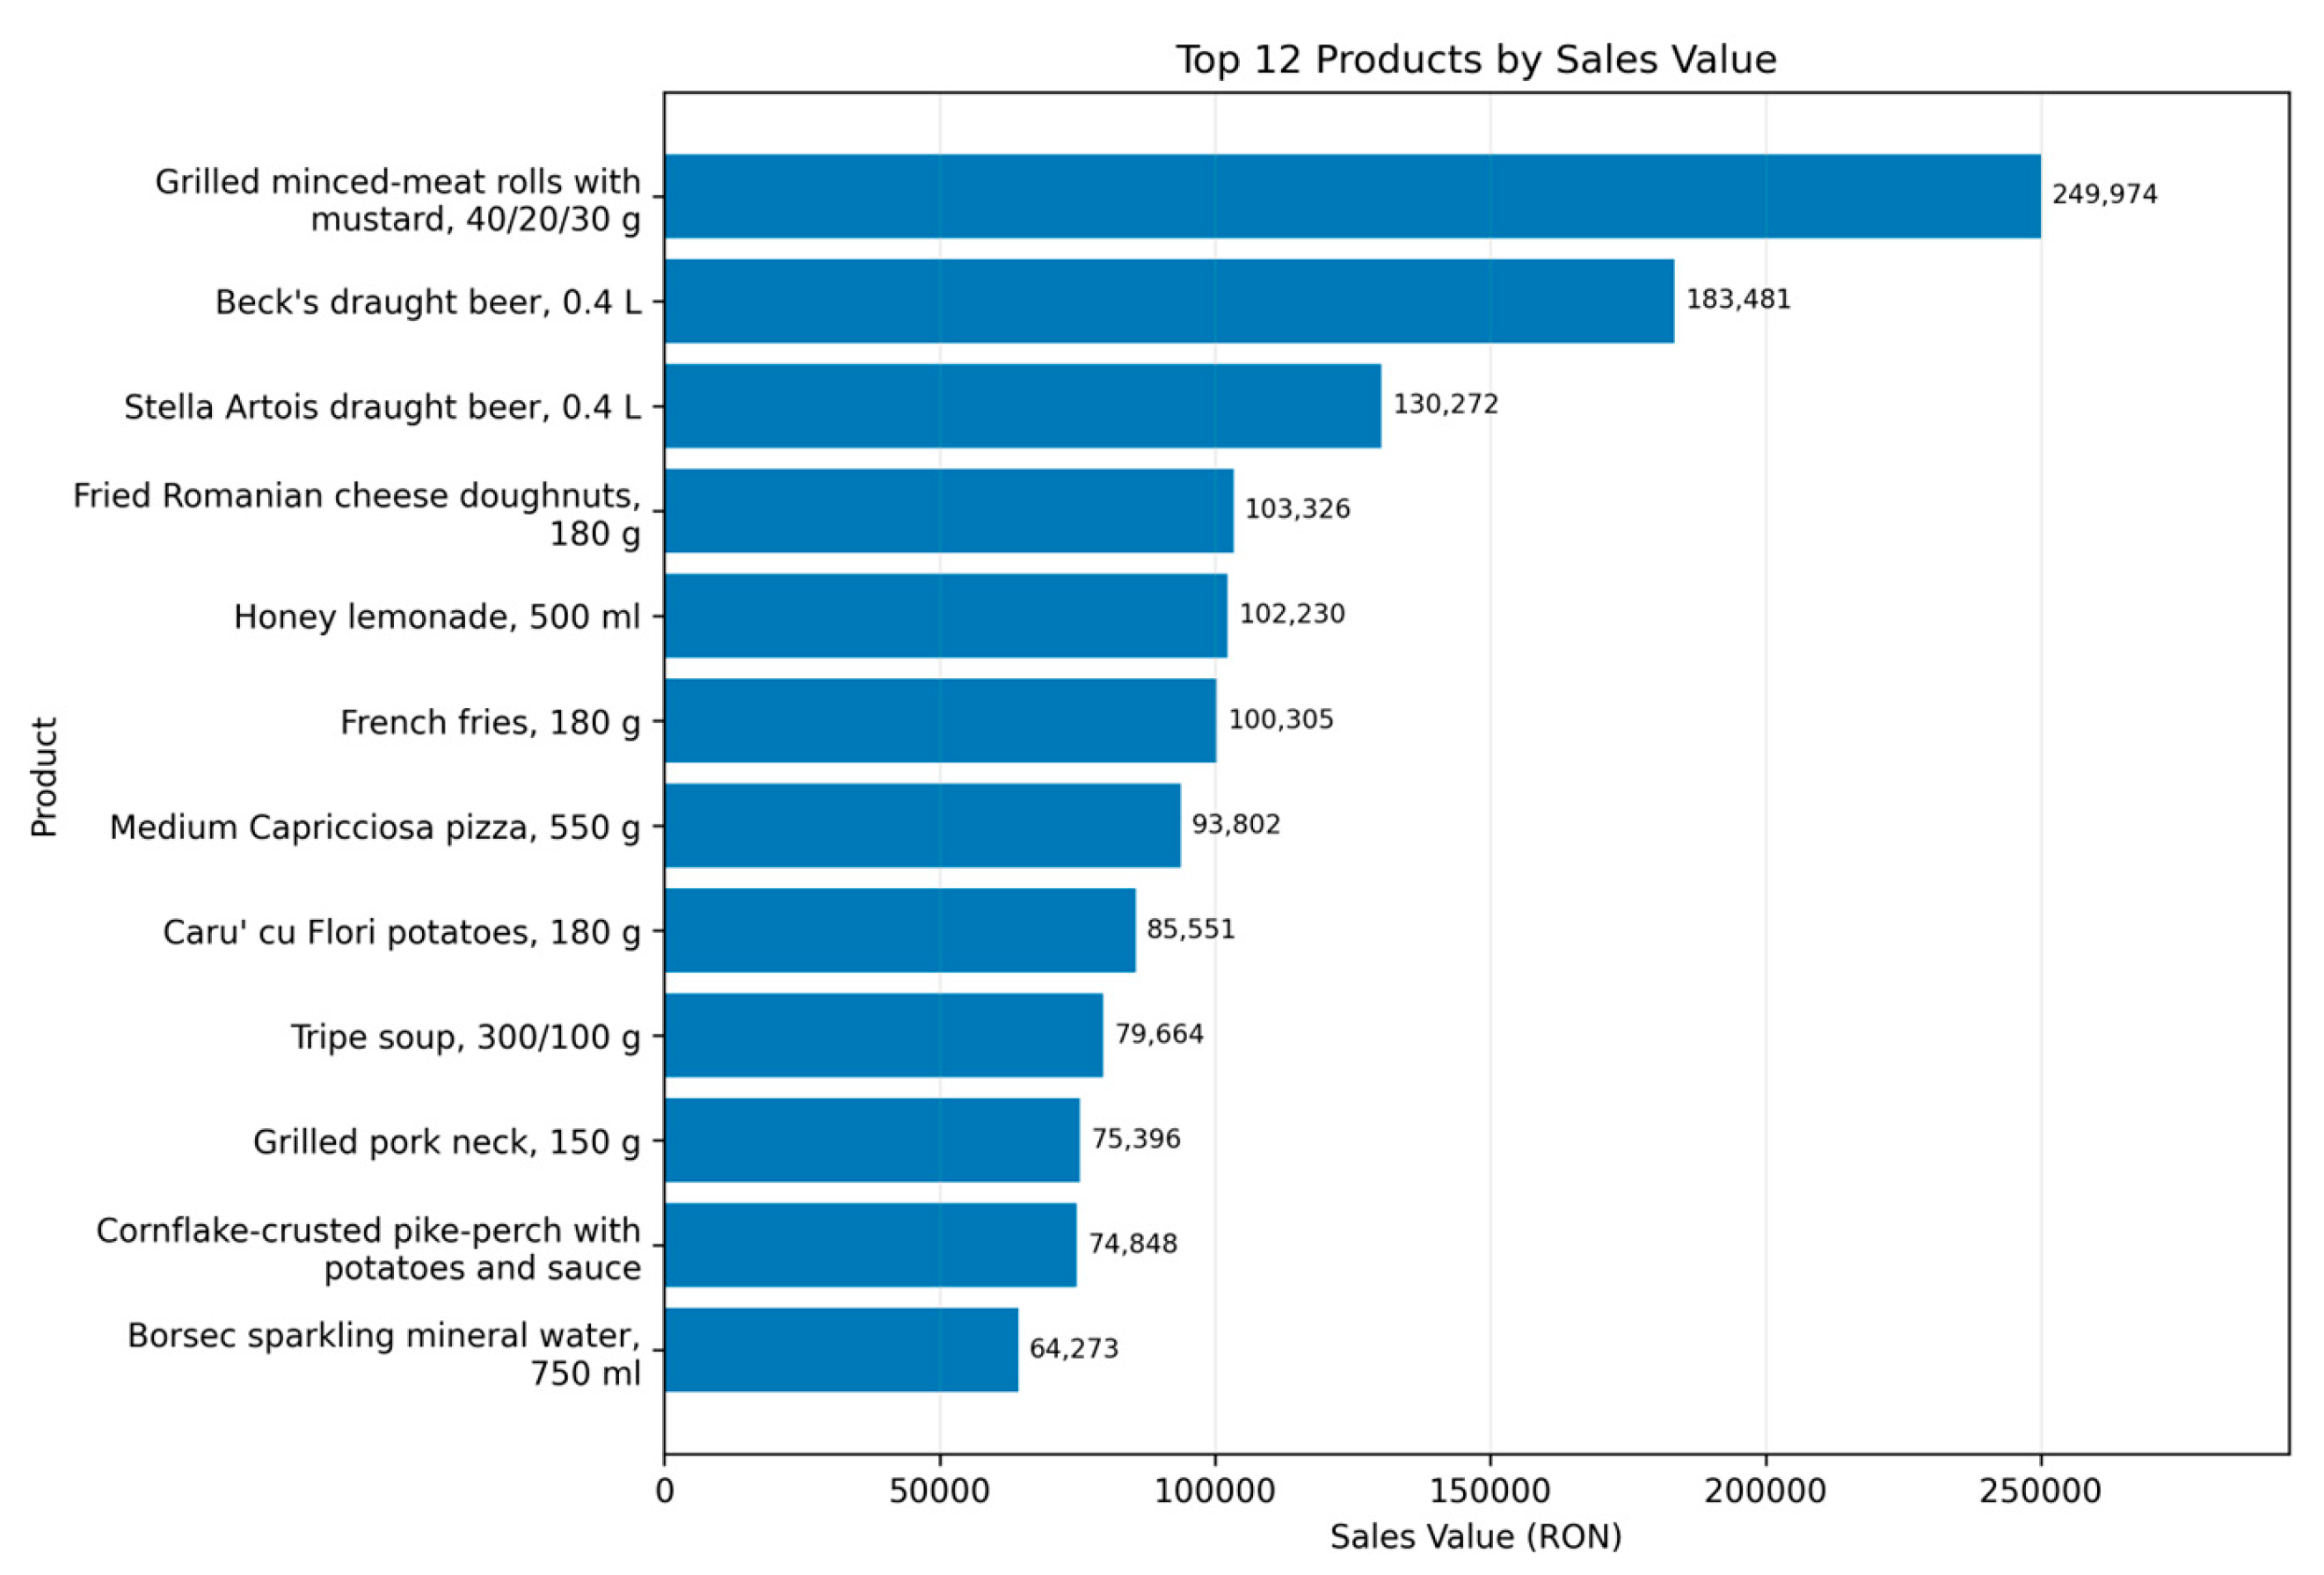
Figure 8.
Monthly normalized quantity-based Shannon entropy and average number of distinct products per basket. Partial months are retained and should be interpreted with their shorter ob-servation windows in mind.
Figure 8.
Monthly normalized quantity-based Shannon entropy and average number of distinct products per basket. Partial months are retained and should be interpreted with their shorter ob-servation windows in mind.
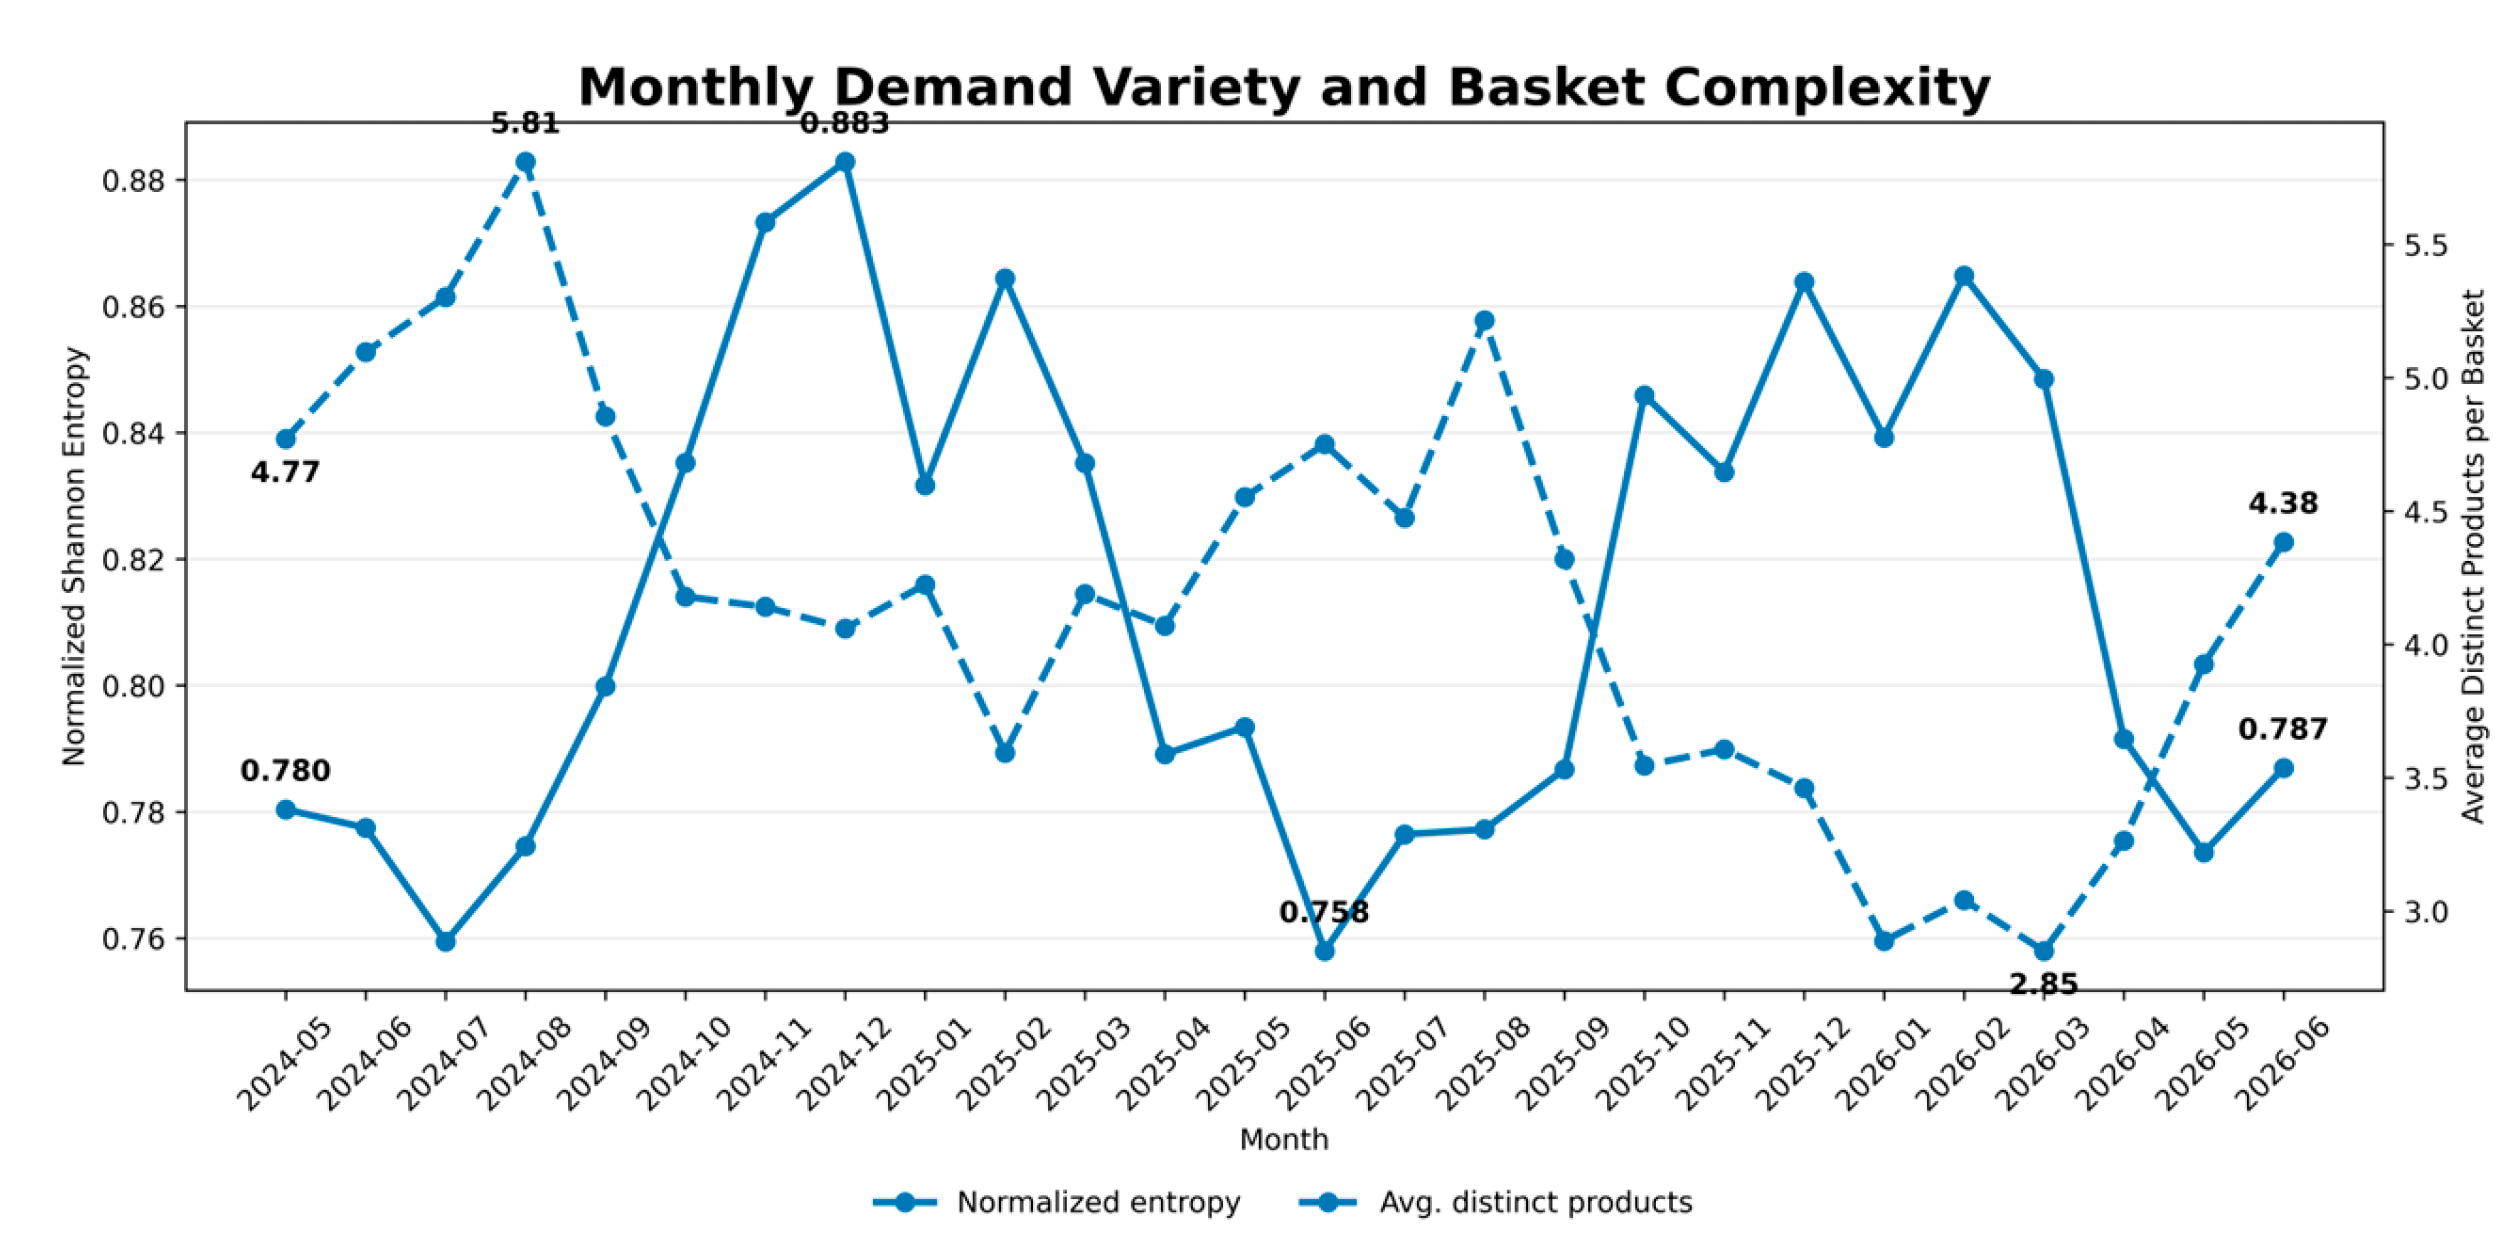
Figure 9.
Validated directional association rules by support and confidence. Color represents lift, and marker size represents the conceptual six-component score CDS₆; CDS₆ is rank-equivalent to the empirically active CDS₄.
Figure 9.
Validated directional association rules by support and confidence. Color represents lift, and marker size represents the conceptual six-component score CDS₆; CDS₆ is rank-equivalent to the empirically active CDS₄.
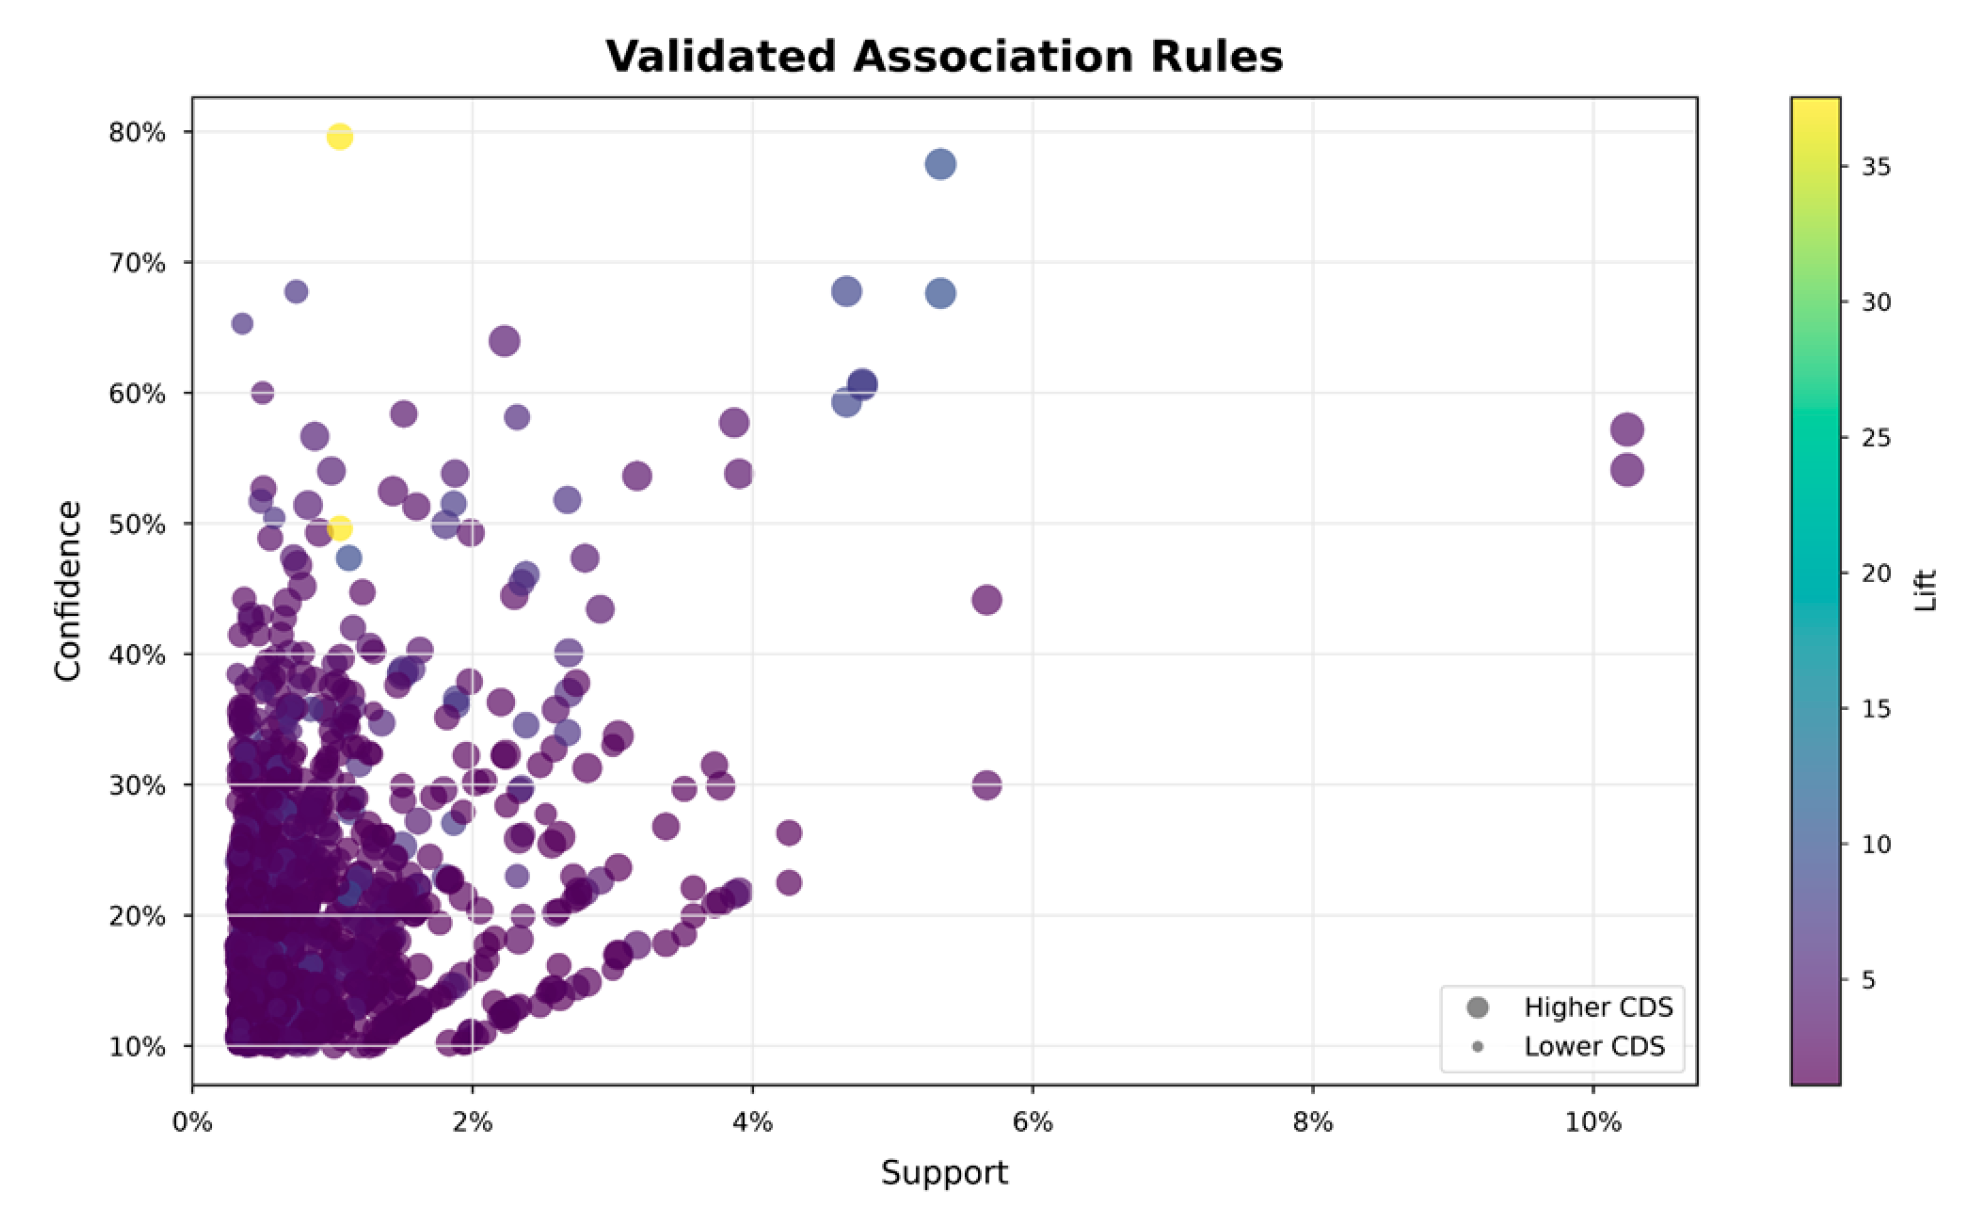
Figure 10.
Selected exponentiated effects and 95% confidence intervals from the estimat-ed-dispersion NB2 model and full-sample Gamma GLM. Standard errors are clustered by public day identifier; the dashed line at 1 indicates no multiplicative effect.
Figure 10.
Selected exponentiated effects and 95% confidence intervals from the estimat-ed-dispersion NB2 model and full-sample Gamma GLM. Standard errors are clustered by public day identifier; the dashed line at 1 indicates no multiplicative effect.
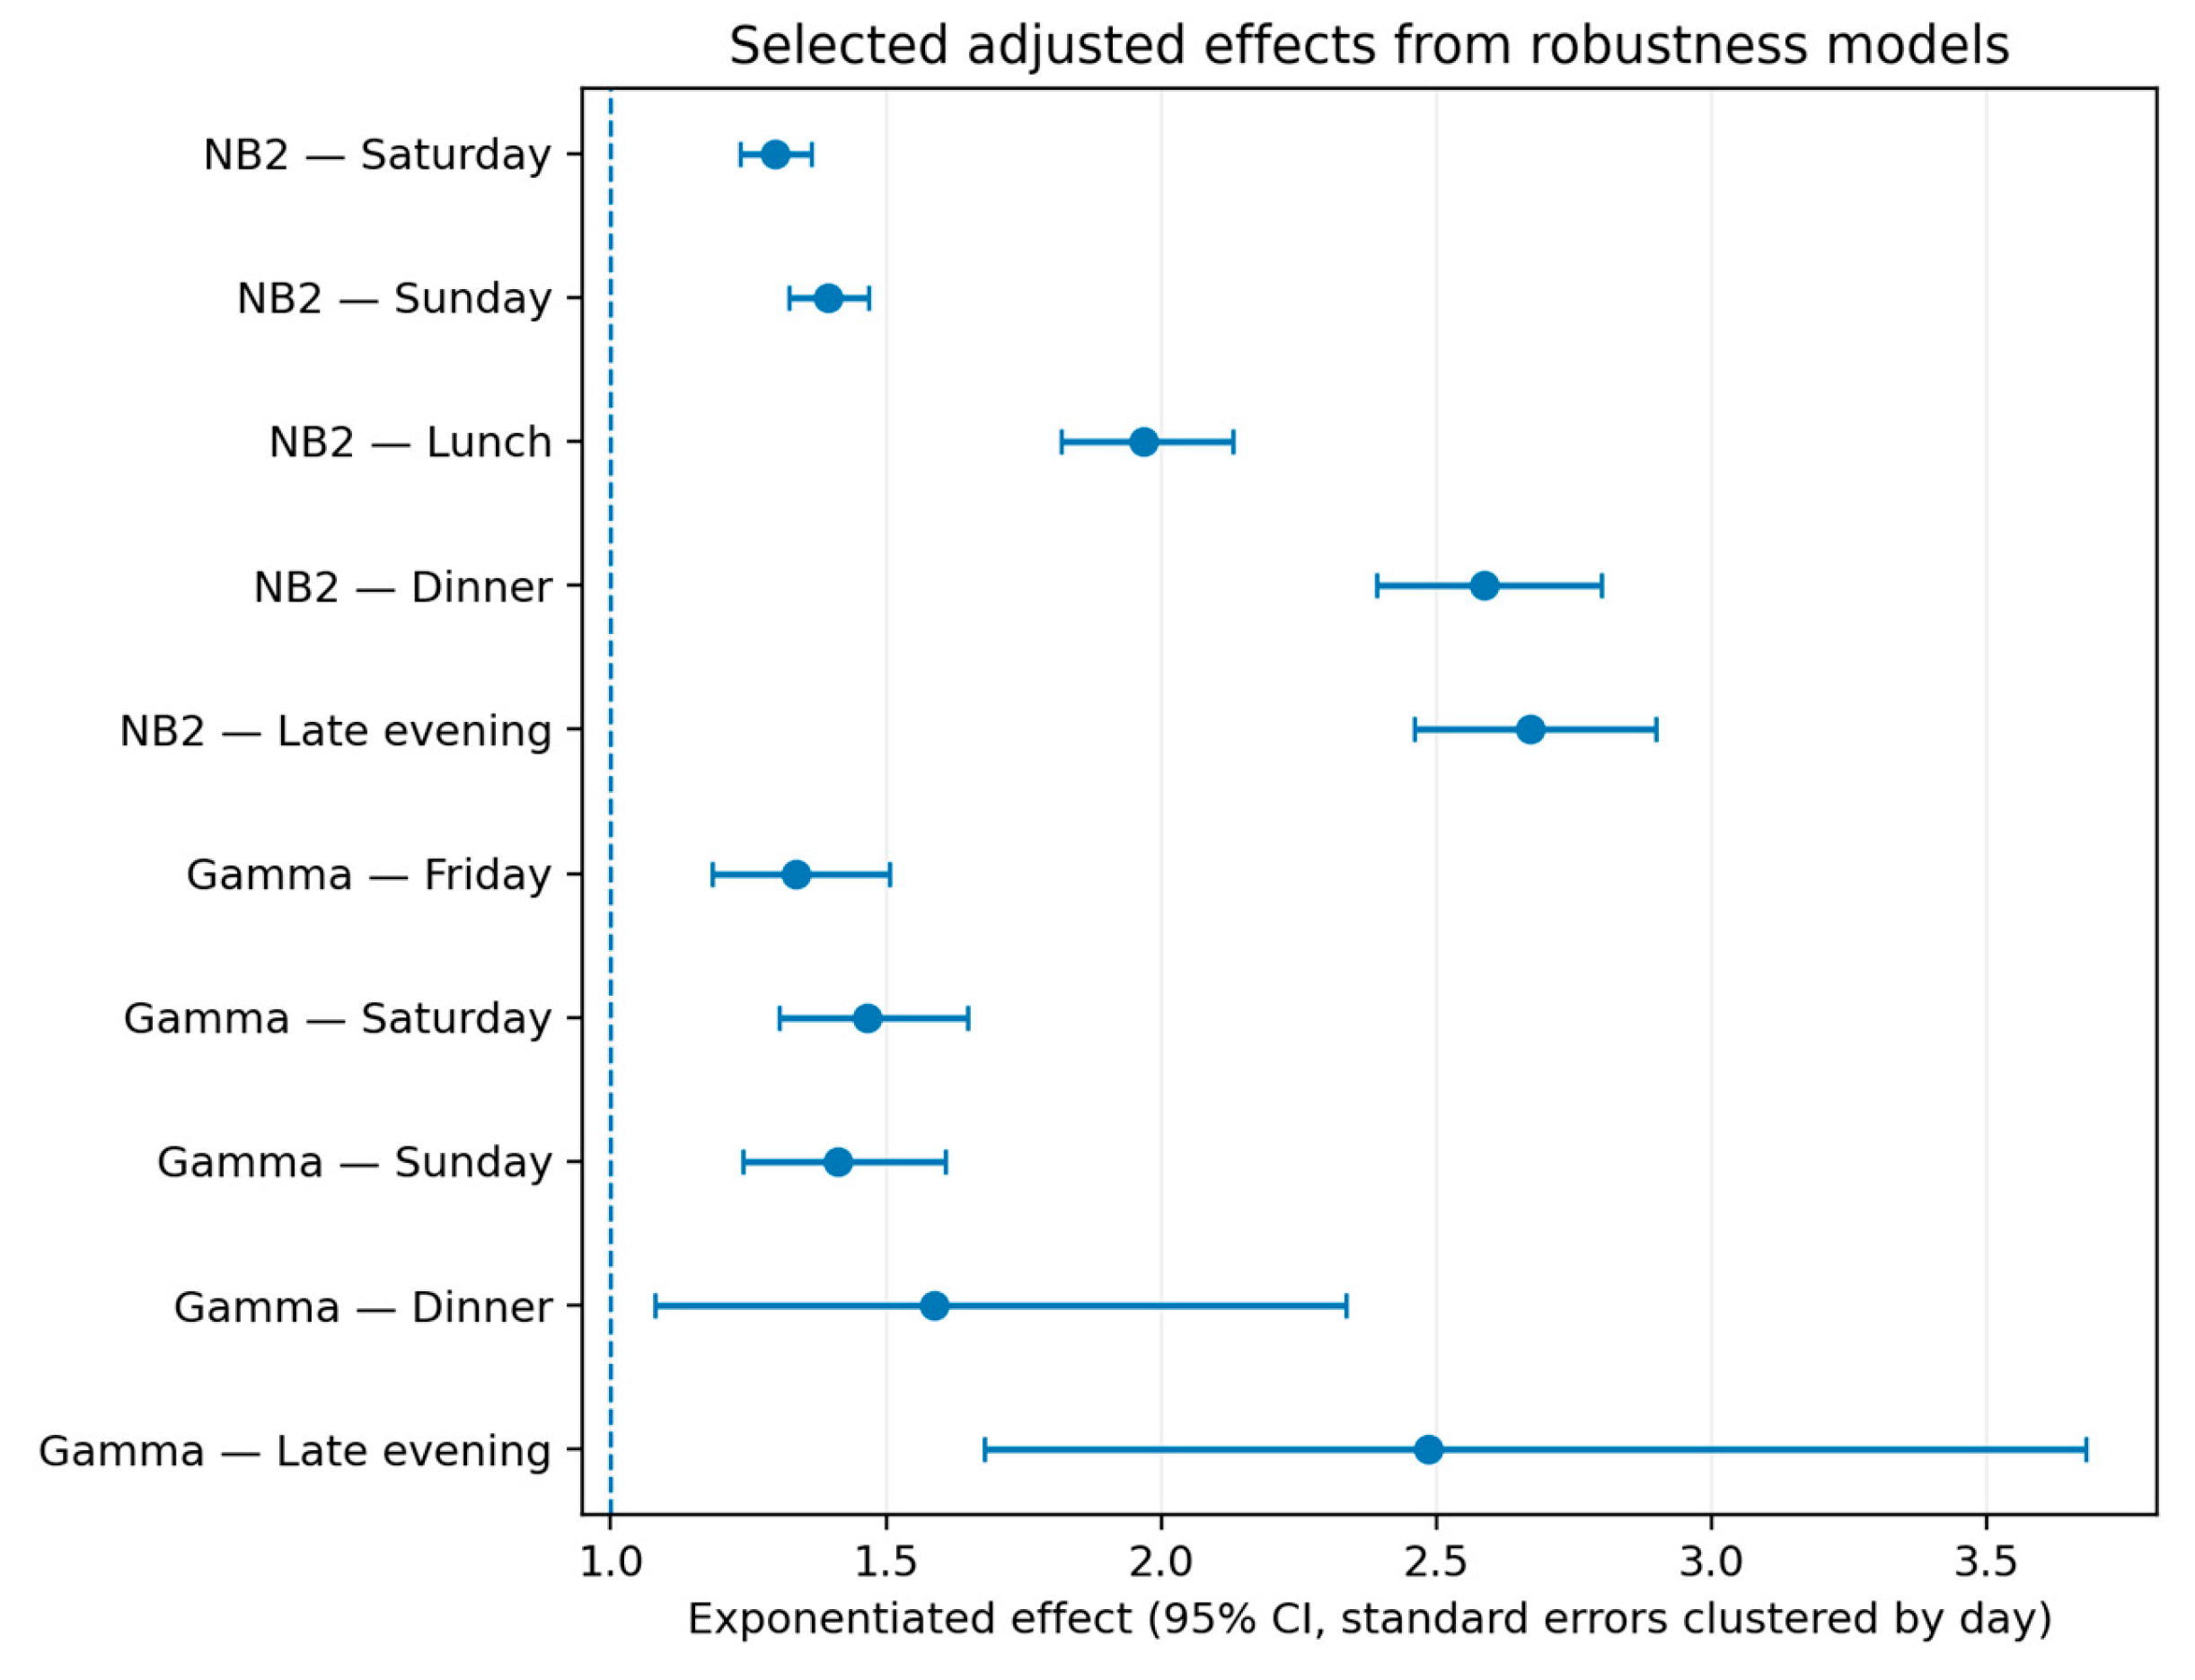
Figure 11.
Top 12 validated directional association rules ordered identically under the empirical CDS₄ and conceptual CDS₆. The displayed score values use the conceptual CDS₆ scale retained from the reproducibility output; CDS₆ = 15 + 0.70 × CDS₄.
Figure 11.
Top 12 validated directional association rules ordered identically under the empirical CDS₄ and conceptual CDS₆. The displayed score values use the conceptual CDS₆ scale retained from the reproducibility output; CDS₆ = 15 + 0.70 × CDS₄.
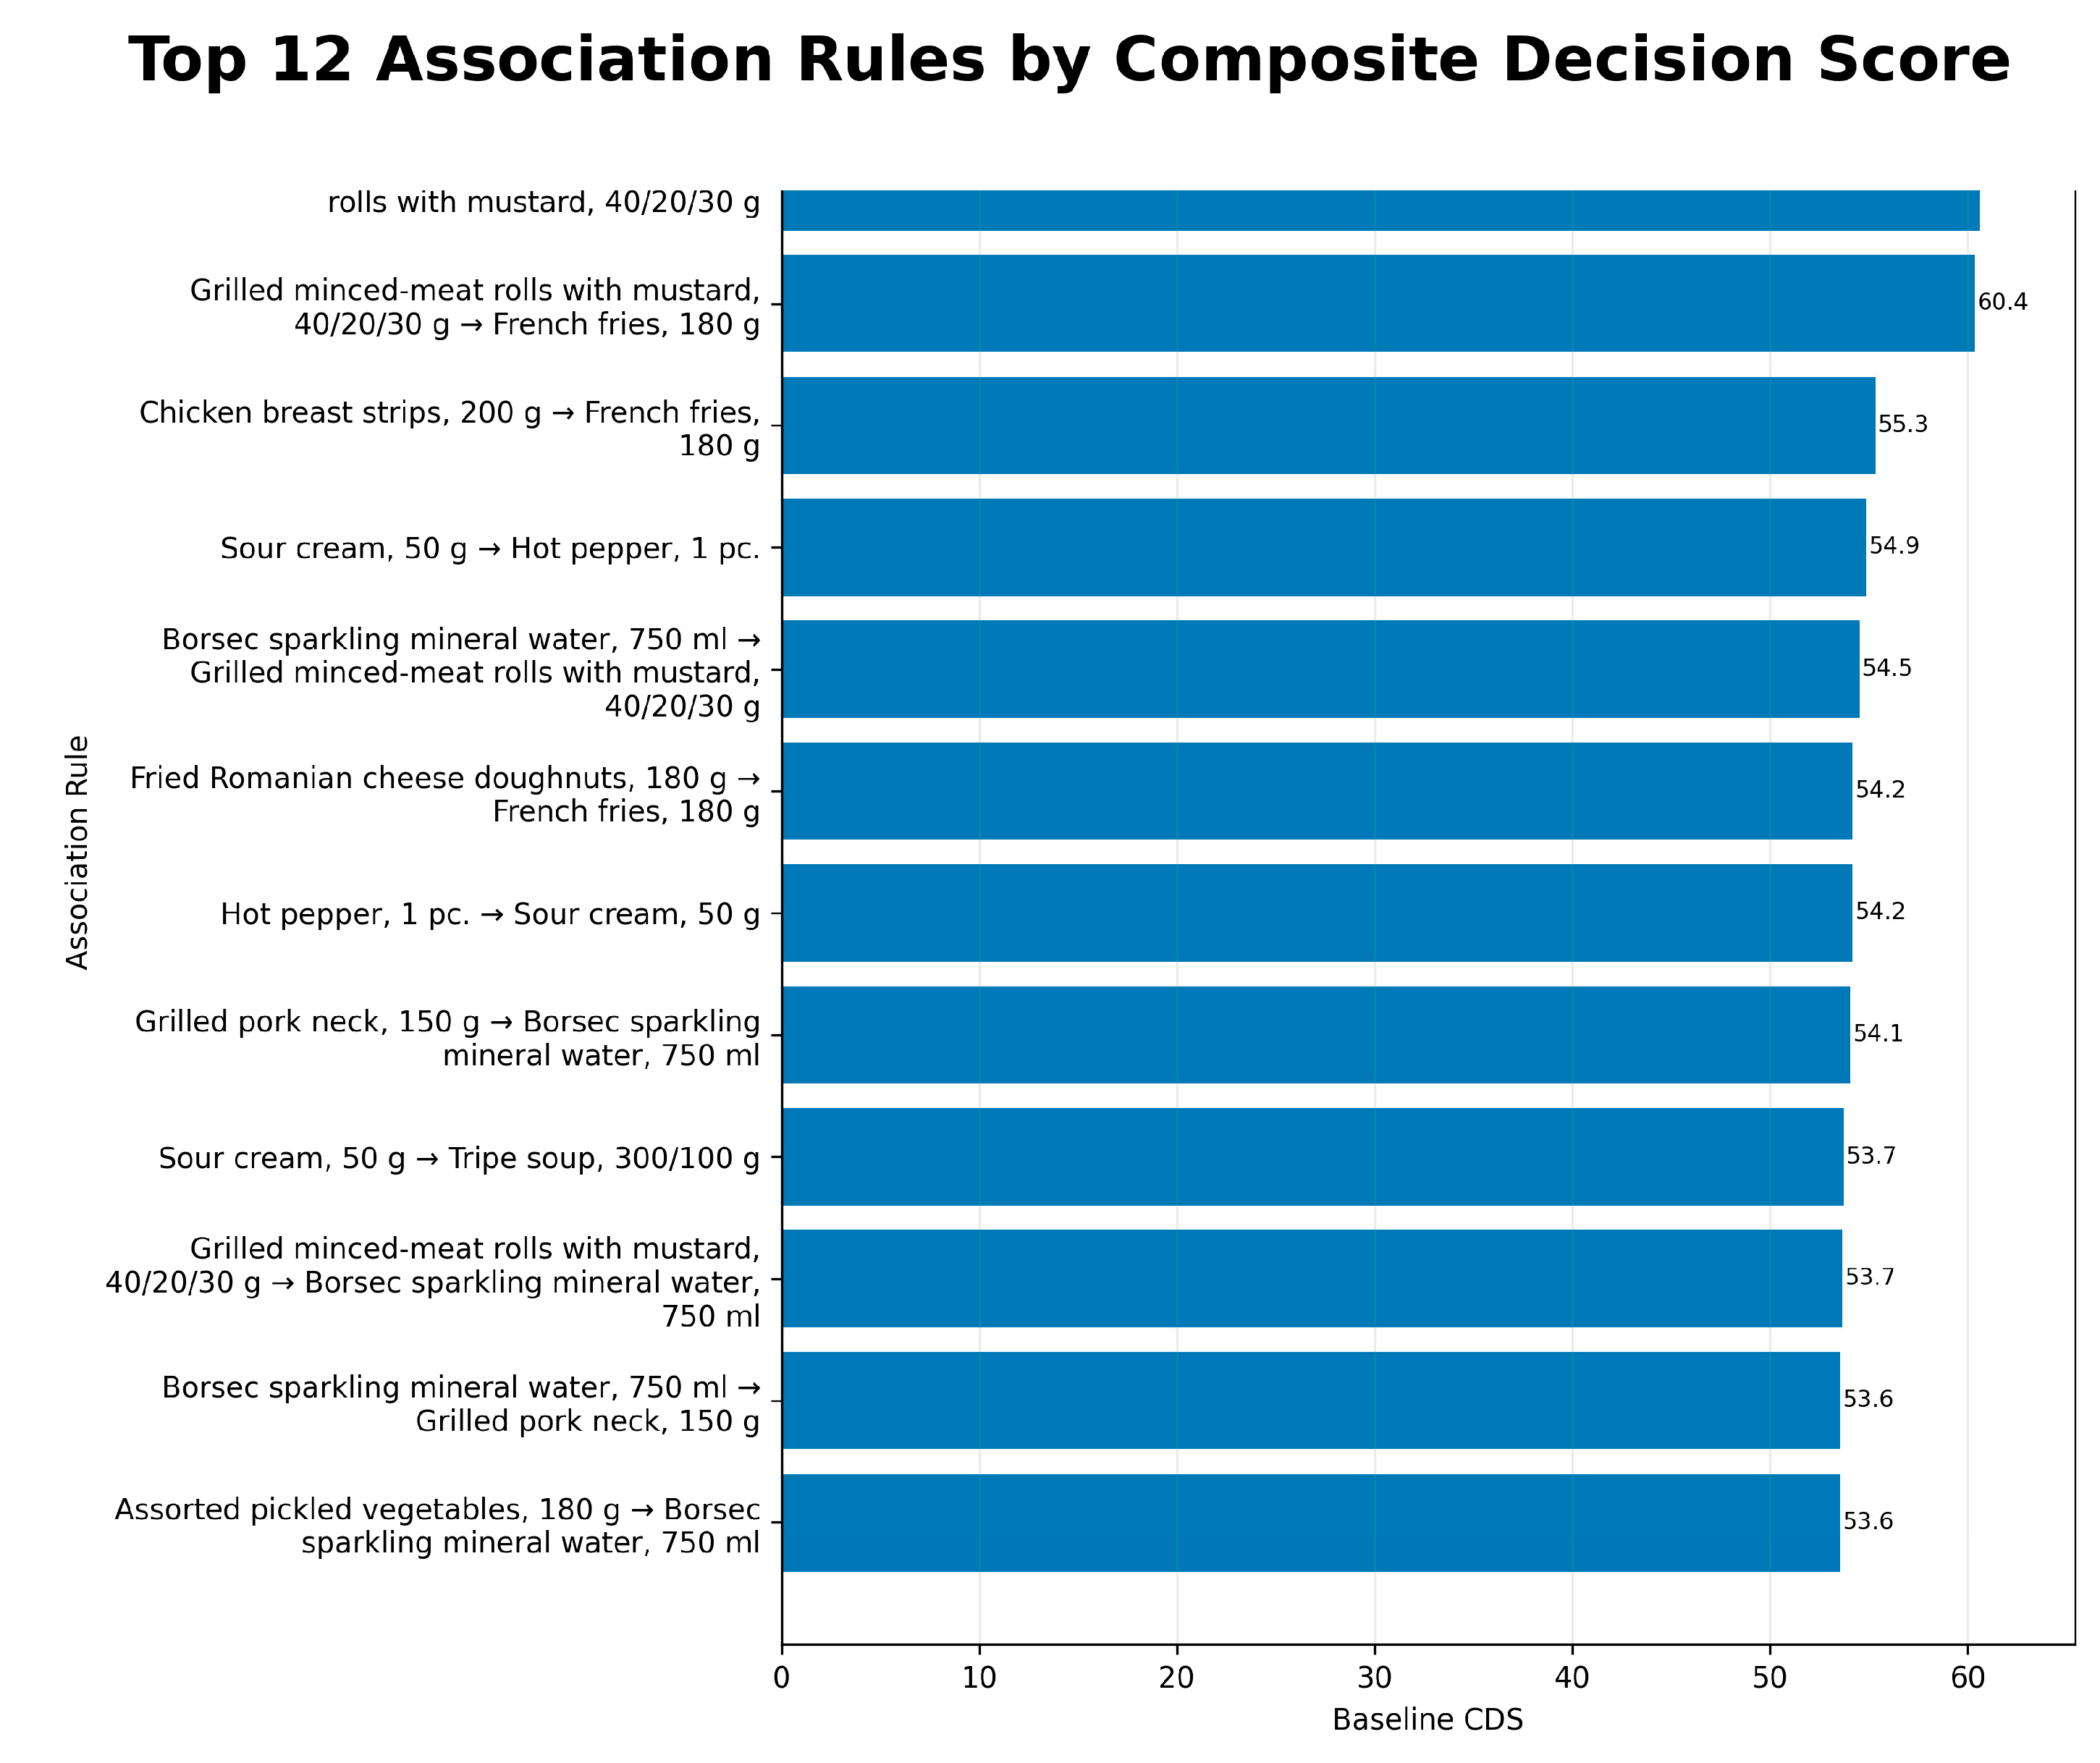
Figure 12.
Out-of-period stability of association-rule lift for rules discovered through December 2025 and re-evaluated in January–June 2026. Both axes are logarithmic; the dashed line represents equality between periods.
Figure 12.
Out-of-period stability of association-rule lift for rules discovered through December 2025 and re-evaluated in January–June 2026. Both axes are logarithmic; the dashed line represents equality between periods.
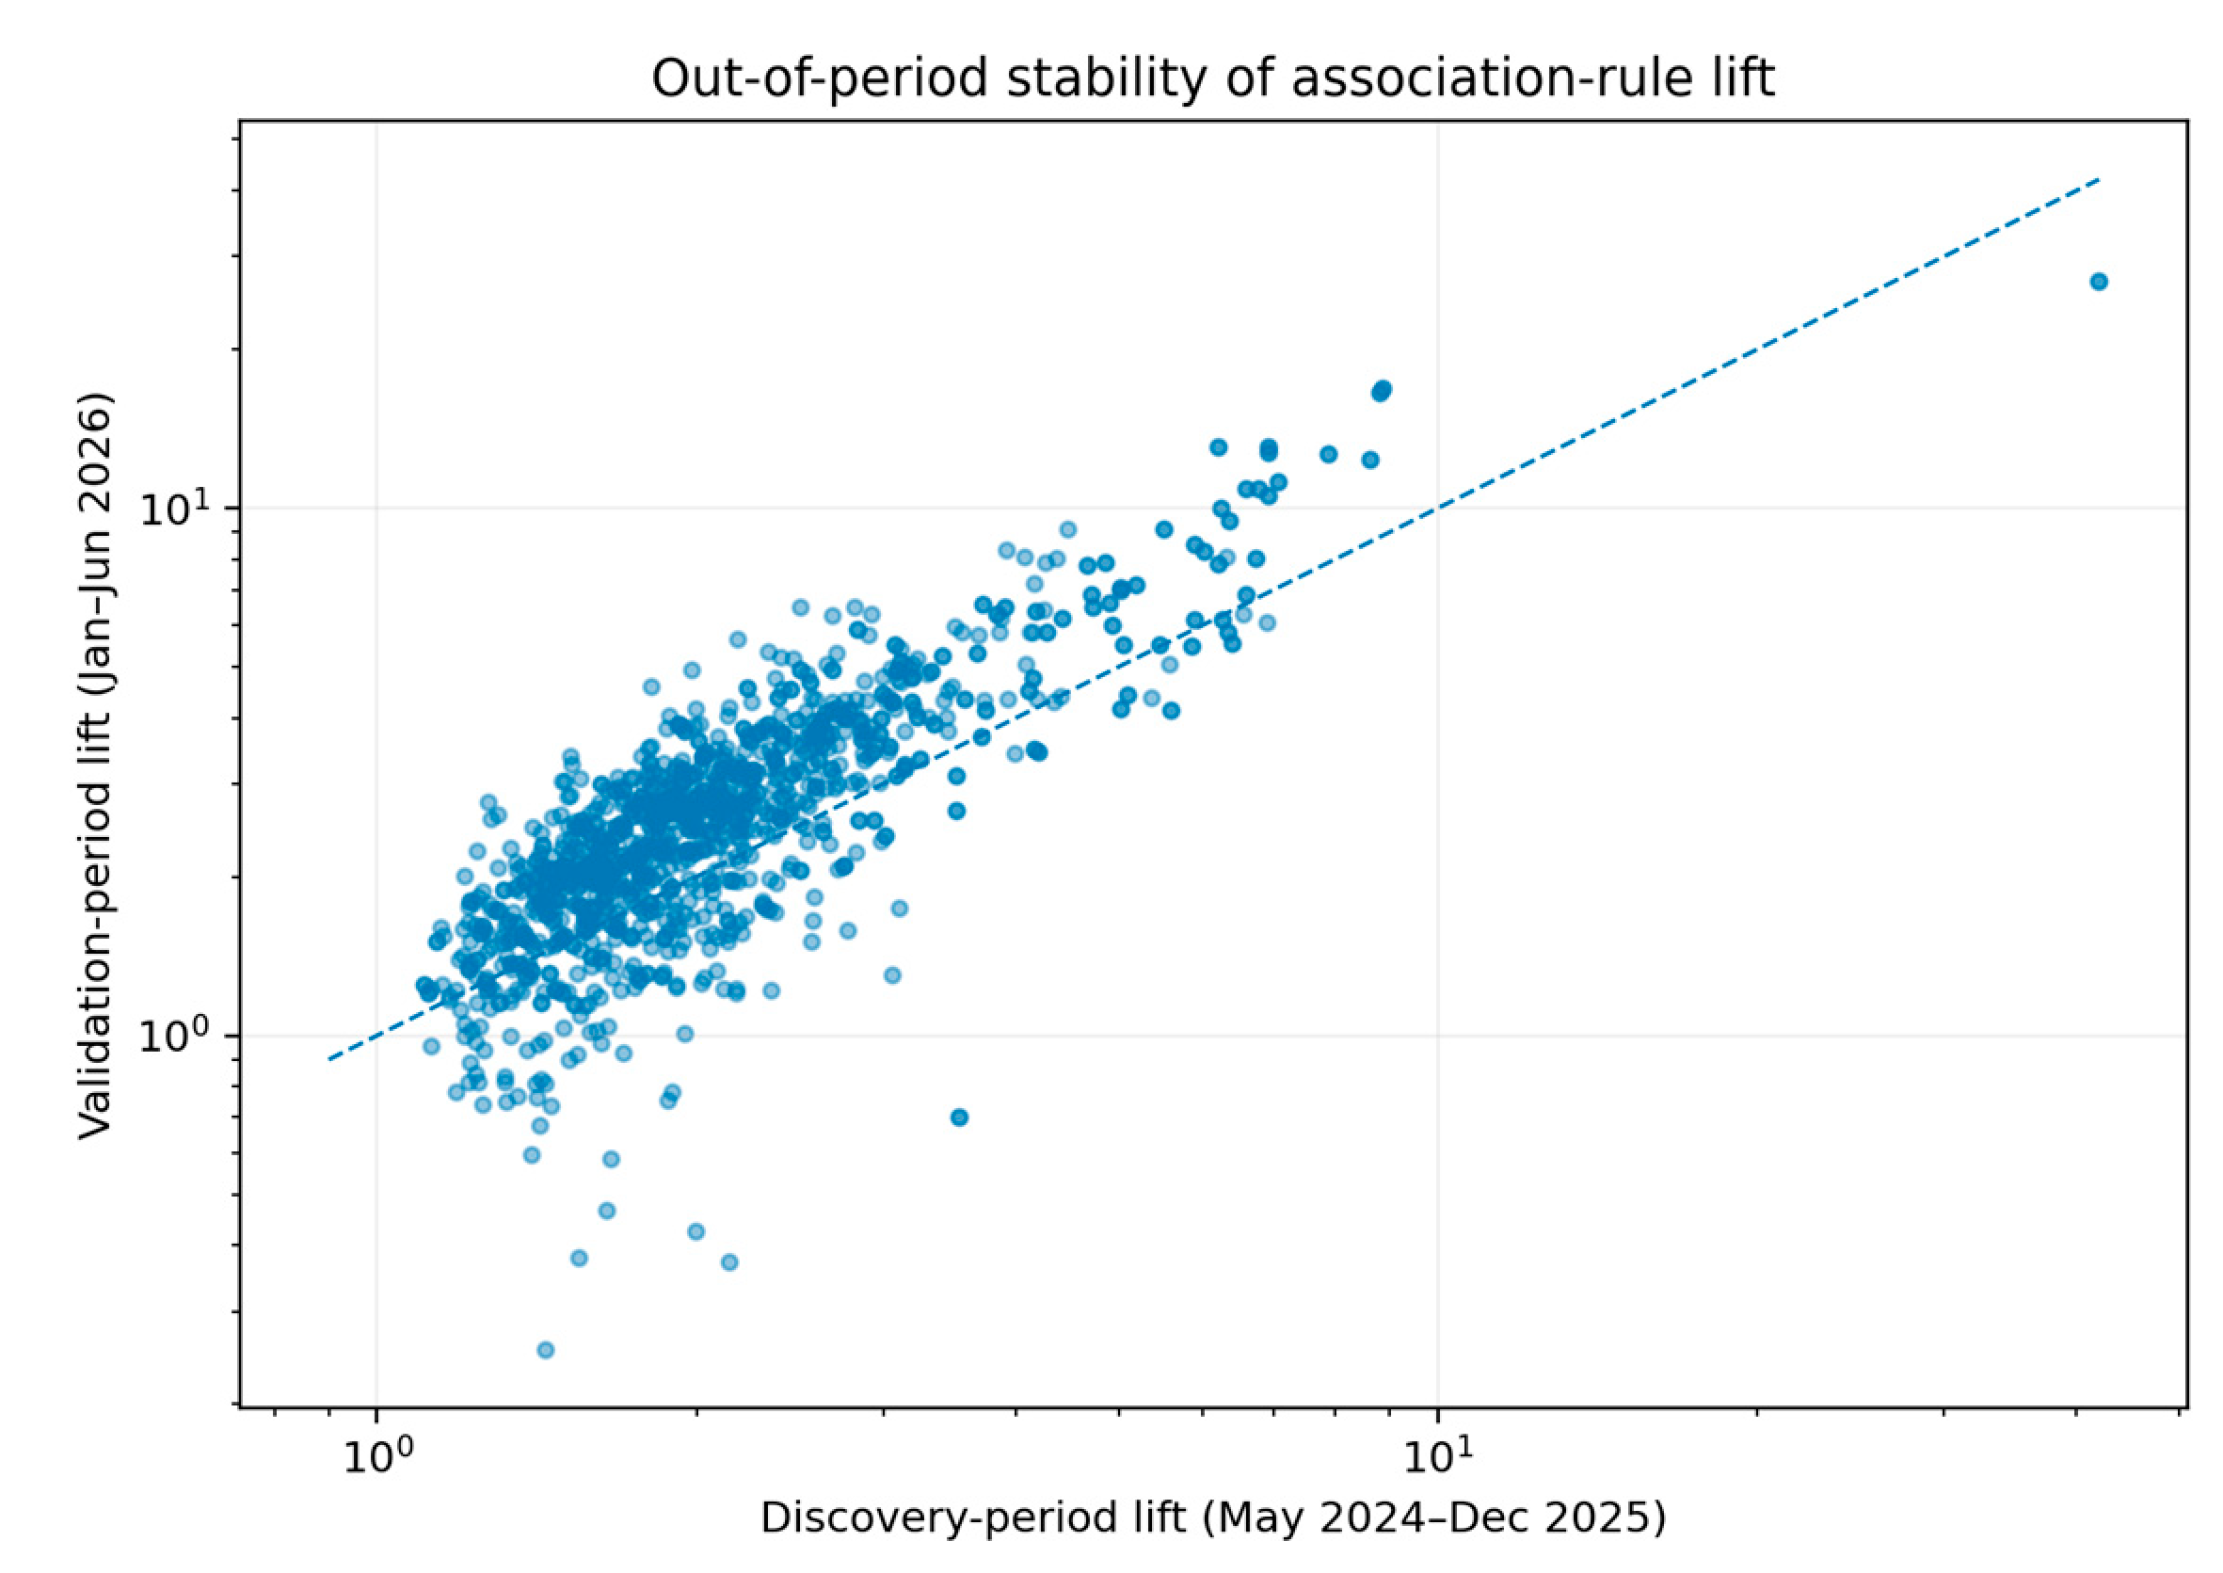
Figure 13.
Synthetic computational stress test for sparse pair enumeration under fixed-catalog volume replication and disjoint-catalog replication.
Figure 13.
Synthetic computational stress test for sparse pair enumeration under fixed-catalog volume replication and disjoint-catalog replication.
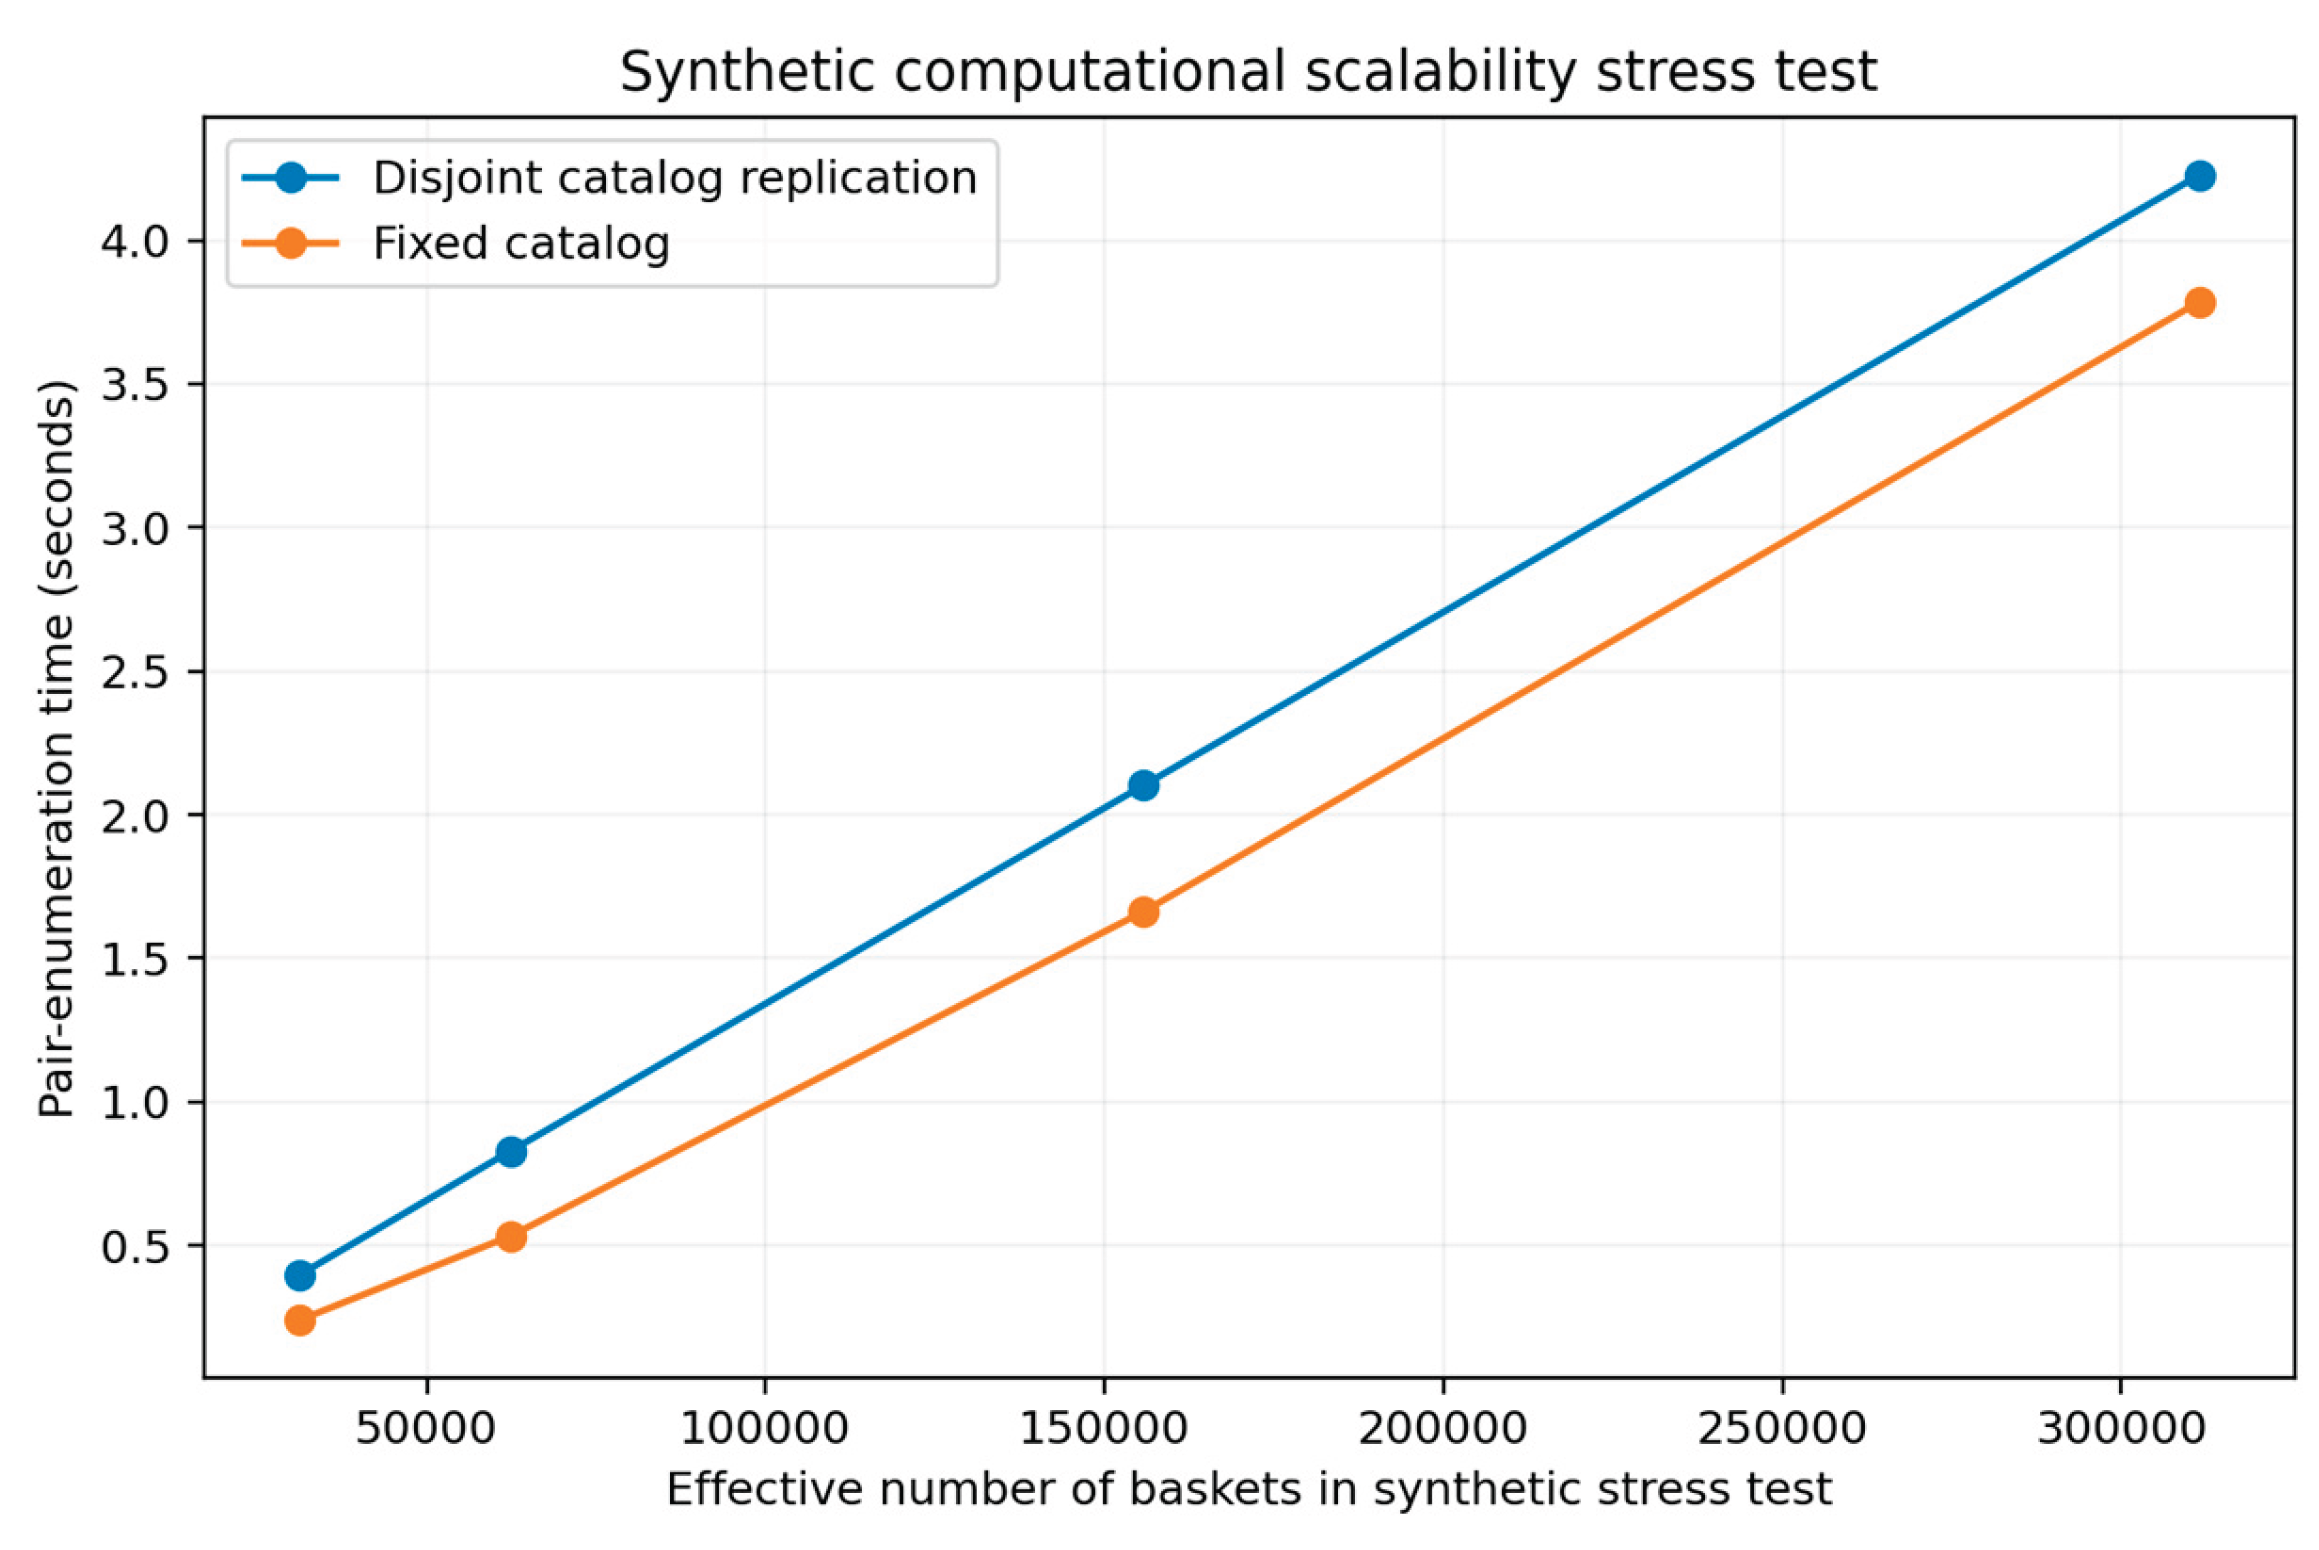

Table 1.
Analytical dataset construction profile.
| Indicator | Final value |
| Observed valid period | 20 May 2024–28 June 2026 |
| Active sales days | 762 |
| Transaction-header records after deletion removal | 31,684 |
| Item-line records after deletion removal | 142,046 |
| Valid completed transaction records | 31,158 |
| Reconstructible transaction baskets | 31,157 |
| Valid item-level sales lines after filtering and duplicate control | 139,396 |
| Distinct product names | 710 |
| Total analyzed item-level value | 4,557,981.61 RON |
| Average basket value | 146.29 RON |
| Average distinct products per basket | 4.47 |
| Share of baskets with at least two distinct products | 74.54% |
The service_interval feature was defined a priori using five operational time bands: early service (00:00-11:59), lunch (12:00-15:59), afternoon (16:00-18:59), dinner (19:00-21:59), and late evening (22:00-23:59). These intervals provide transparent temporal features for comparative analysis and are specific to the empirical imple-mentation rather than universal restaurant-period definitions.
Table 2.
Empirical and Conceptual Components of the Transparent Decision-Evidence Prioritization Framework.
Table 2.
Empirical and Conceptual Components of the Transparent Decision-Evidence Prioritization Framework.
| Component | Meaning | Measurement logic and empirical status |
| AR | Analytical relevance | Arithmetic mean of min-max-normalized support, confidence, lift, and phi; empirically active. |
| DVS | Demand-variety signifi-cance | Min-max-normalized service-context entropy of the product pair; empirically active. |
| CI | Commercial importance | Arithmetic mean of min-max-normalized pair-revenue share and basket-value uplift; empirically active. |
| OC | Operational controllability | Conceptual only in the present study; fixed neutral value 0.50 because no rule-specific expert assessment was available. |
| IF | Implementation feasibility | Conceptual only in the present study; fixed neutral value 0.50 because no rule-specific expert assessment was available. |
| TS | Temporal stability | Min-max-normalized temporal-stability score based on monthly presence and support variability; empirically active. |
Table 3.
Final analytical dataset and sparsity profile.
| Indicator | Value |
| Observed valid period | 20 May 2024–28 June 2026 |
| Active sales days | 762 |
| Reconstructed transaction baskets | 31,157 |
| Valid item-level sales lines | 139,396 |
| Distinct product names | 710 |
| Total analyzed value | 4,557,981.61 RON |
| Average basket value | 146.29 RON |
| Median basket value | 74.70 RON |
| Average distinct products per basket | 4.47 |
| Baskets with at least two distinct products | 74.54% |
| Global quantity entropy | 4.6504 |
| Global normalized quantity entropy | 0.7083 |
| Global value entropy | 5.2372 |
| Global normalized value entropy | 0.7977 |
| Potential basket-product positions | 22,121,470 |
| Observed binary incidence density | 0.630% |
| Possible unordered product pairs | 251,695 |
Table 4.
Basket-level descriptive statistics.
| Variable | Mean | Median | 75th percentile | 95th percentile | 99th percentile | Maximum |
| Basket value (RON) | 146.29 | 74.70 | 153.90 | 427.42 | 1,361.92 | 10,220.00 |
| Item lines per basket | 4.47 | 3.00 | 6.00 | 12.00 | 20.00 | 50.00 |
| Total quantity per basket | 8.95 | 5.00 | 11.00 | 29.00 | 66.00 | 265.00 |
| Distinct products per basket | 4.47 | 3.00 | 6.00 | 12.00 | 20.00 | 50.00 |
Table 5.
Selected temporal and operational summaries.
| Segment | Baskets | Total value (RON) | Average basket value (RON) | Median basket value (RON) | Average distinct products | Multi-product baskets |
| Monday | 4,172 | 532,581.09 | 127.66 | 58.70 | 3.88 | 70.23% |
| Friday | 4,930 | 843,452.82 | 171.09 | 74.75 | 4.35 | 73.39% |
| Saturday | 4,428 | 877,343.86 | 198.14 | 91.45 | 5.11 | 78.23% |
| Sunday | 4,956 | 818,866.37 | 165.23 | 99.40 | 5.36 | 81.86% |
| Lunch | 8,977 | 968,130.08 | 107.85 | 55.00 | 3.74 | 69.05% |
| Dinner | 9,686 | 1,448,263.51 | 149.52 | 90.95 | 5.00 | 79.59% |
| Late evening | 4,467 | 1,100,964.14 | 246.47 | 112.70 | 5.26 | 78.73% |
Table 6.
Selected validated directional association rules ranked by the empirically active four-component Composite Decision Score (CDS₄).
Table 6.
Selected validated directional association rules ranked by the empirically active four-component Composite Decision Score (CDS₄).
| Rule interpretation | Support | Confidence | Lift | Phi | Revenue share | Basket-value uplift | CDS₄ |
| French fries, 180 g → Grilled minced-meat rolls with mustard, 40/20/30 g | 10.24% | 57.19% | 3.02 | 0.456 | 18.06% | 76.30% | 65.15 |
| Grilled minced-meat rolls with mustard, 40/20/30 g → French fries, 180 g | 10.24% | 54.10% | 3.02 | 0.456 | 18.06% | 76.30% | 64.83 |
| Chicken breast strips, 200 g → French fries, 180 g | 2.23% | 63.96% | 3.57 | 0.228 | 5.43% | 143.75% | 57.64 |
| Sour cream, 50 g → Hot pepper, 1 pc. | 5.34% | 77.50% | 9.81 | 0.702 | 8.80% | 64.82% | 56.99 |
| Borsec sparkling mineral water, 750 ml → Grilled minced-meat rolls with mustard, 40/20/30 g | 2.62% | 26.03% | 1.37 | 0.061 | 7.71% | 194.16% | 56.47 |
Table 7.
Inferential tests with approximate omnibus effect sizes.
| Outcome | Grouping variable | Test statistic | p-value | Effect size |
| Basket value | Weekday | Kruskal–Wallis (H = 537.47) | <0.001 | ε² = 0.017 |
| Basket value | Service interval | Kruskal–Wallis (H = 1793.82) | <0.001 | ε² = 0.057 |
| Basket value | Month | Kruskal–Wallis (H = 1128.18) | <0.001 | ε² = 0.035 |
| Distinct products | Weekday | Kruskal–Wallis (H = 578.91) | <0.001 | ε² = 0.018 |
| Distinct products | Service interval | Kruskal–Wallis (H = 1208.10) | <0.001 | ε² = 0.039 |
| Distinct products | Month | Kruskal–Wallis (H = 1553.69) | <0.001 | ε² = 0.049 |
| Multi-product basket incidence | Weekday | (χ² = 263.76), (df = 6) | <0.001 | Cramér’s V = 0.092 |
| Multi-product basket incidence | Service interval | (χ² = 908.39), (df = 4) | <0.001 | Cramér’s V = 0.171 |
Table 8.
Selected adjusted robustness-model effects with day-clustered 95% confidence intervals.
| Model | Predictor | Effect measure | Effect (95% CI) | p-value |
| NB2 estimated alpha; day-clustered | Saturday | IRR | 1.30 (1.23–1.36) | <0.001 |
| NB2 estimated alpha; day-clustered | Sunday | IRR | 1.39 (1.32–1.47) | <0.001 |
| NB2 estimated alpha; day-clustered | Lunch | IRR | 1.97 (1.82–2.13) | <0.001 |
| NB2 estimated alpha; day-clustered | Dinner | IRR | 2.59 (2.39–2.80) | <0.001 |
| NB2 estimated alpha; day-clustered | Late evening | IRR | 2.67 (2.46–2.90) | <0.001 |
| Gamma GLM; day-clustered | Friday | Multiplicative effect | 1.34 (1.18–1.51) | <0.001 |
| Gamma GLM; day-clustered | Saturday | Multiplicative effect | 1.47 (1.30–1.65) | <0.001 |
| Gamma GLM; day-clustered | Sunday | Multiplicative effect | 1.41 (1.24–1.61) | <0.001 |
| Gamma GLM; day-clustered | Dinner | Multiplicative effect | 1.59 (1.08–2.34) | 0.019 |
| Gamma GLM; day-clustered | Late evening | Multiplicative effect | 2.48 (1.68–3.68) | <0.001 |
Table 9.
Highest empirical four-component Composite Decision Score (CDS₄) results.
| Rank | Rule interpretation | Support | Confidence | Lift | Temporal stability | CDS₄ |
| 1 | French fries, 180 g → Grilled minced-meat rolls with mustard, 40/20/30 g | 10.24% | 57.19% | 3.02 | 0.695 | 65.15 |
| 2 | Grilled minced-meat rolls with mustard, 40/20/30 g → French fries, 180 g | 10.24% | 54.10% | 3.02 | 0.695 | 64.83 |
| 3 | Chicken breast strips, 200 g → French fries, 180 g | 2.23% | 63.96% | 3.57 | 0.737 | 57.64 |
| 4 | Sour cream, 50 g → Hot pepper, 1 pc. | 5.34% | 77.50% | 9.81 | 0.728 | 56.99 |
| 5 | Borsec sparkling mineral water, 750 ml → Grilled minced-meat rolls with mustard, 40/20/30 g | 2.62% | 26.03% | 1.37 | 0.704 | 56.47 |
Table 10.
Summary of robustness and validation checks.
| Check | Main result | Interpretation |
| Out-of-period rules | 1,269 discovery rules; 625 retained all thresholds | 49.3% hard-threshold retention |
| Association direction | 1,188/1,269 validation rules with lift > 1 | 93.6% preserve positive association |
| Rank stability | ρsupport=0.846; ρconfidence=0.849; ρlift=0.803 | High relative stability |
| Threshold sensitivity | Lift 1.20 retains 98.1%; count 200 retains 48.1% | Frequency/confidence more influential than lift |
| NB2 dispersion | alpha=0.4039; AIC=154,216.3 | Improves on fixed-alpha AIC=160,519.1 |
| Gamma extreme-value check | Late evening 2.48× full; 2.94× after top-1% exclusion | Direction robust; magnitude sensitive |
| CDS weight sensitivity | Spearman 0.847–0.950; Top-20 Jaccard 0.538–0.818 | Broad ranking stable; shortlist weight-sensitive |
| Synthetic scalability | 10×: 311,570 baskets; 4.23 s and 35.7 MB in disjoint test | Near-linear controlled scaling; not distributed |
Disclaimer/Publisher’s Note: The statements, opinions and data contained in all publications are solely those of the individual author(s) and contributor(s) and not of MDPI and/or the editor(s). MDPI and/or the editor(s) disclaim responsibility for any injury to people or property resulting from any ideas, methods, instructions or products referred to in the content. |
© 2026 by the authors. Licensee MDPI, Basel, Switzerland. This article is an open access article distributed under the terms and conditions of the Creative Commons Attribution (CC BY) license.
Copyright: This open access article is published under a Creative Commons CC BY 4.0 license, which permit the free download, distribution, and reuse, provided that the author and preprint are cited in any reuse.