

Submitted:
25 August 2026
Posted:
25 August 2026
You are already at the latest version
Abstract
Sixth-generation (6G) wireless systems target ubiquitous connectivity by integrating terrestrial (TNs) and non-terrestrial networks (NTN) cooperation, including low-Earth orbit (LEO) satellites, high-altitude platform stations (HAPS), and unmanned aerial vehicles (UAVs). In such a vertically stratified architecture characterized by massive multi connectivity, the selection of the most suitable tier or tier-combination for each mobile user is a complicated task, as the decision depends jointly on the propagation environment, user requirements, and the instantaneous characteristics of the topology. This paper proposes an altitude-aware Deep Learning (DL) framework that casts multi-tier network selection as a seven-class classification problem spanning standalone TN, LEO, HAPS, and UAV access as well as their TN-assisted multi-connectivity combinations. A fourteen-feature physics-based dataset is generated through extensive simulations based on standardized channel and geometry models, including 3GPP TR 38.901 terrestrial pathloss and line-of-sight probability, satellite-constellation elevation angles, and air-to-ground link geometry for HAPS and UAV. A deep neural network (DNN) is trained on the aforementioned dataset and assessed using stratified five-fold cross-validation. The proposed model achieves an overall classification accuracy of 88.1% with a macro-averaged F1-score of 0.88 and a single-sample inference latency of approximately 2 ms, well within typical 6G handover budgets. The results demonstrate that requirement- and geometry-aware tier selection can be performed accurately, enabling real-time decision-making in ambiguous multi-connectivity configurations for 6G networks.
Keywords:
6G
; non-terrestrial networks
; multi-tier network selection
; machine learning
; deep learning
; LEO satellites
; HAPS
; UAV
; multi-connectivity
1. Introduction
Recent research activity and standardization of sixth-generation (6G) wireless systems redefine the way wireless connectivity is conceived, extending the design space well beyond the application pillars introduced within fifth-generation (5G) networks [1,2]. In the upcoming International Mobile Telecommunications-2030 (IMT-2030) framework [3], the International Telecommunication Union (ITU) replaces these scenarios with broader capabilities and introduces three new usage scenarios compared to previous generations [4]. These are: a) artificial intelligence (AI) and communication, b) integrated sensing and communication, and c) multi-connectivity. The latter term refers to the provision of service in areas that are initially uncovered or only marginally served by terrestrial infrastructure [5], reframing coverage not as a single-layer problem but as one that must be addressed jointly across terrestrial and non-terrestrial domains, motivating a fundamental architectural redesign of how users are associated with network resources.
Non-terrestrial networks (NTNs) are expected to become integral components of the emerging 6G architecture, which is envisioned not as a single homogeneous access layer but as a vertically stratified, multi-tier fabric in which space, air, and ground segments coexist and are jointly coordinated [6]. Each tier occupies a distinct altitude regime with characteristic trade-offs. Low-Earth-orbit (LEO) satellite constellations provide wide-area coverage and resilience in remote regions at the cost of dynamic geometry and elevation-dependent link quality [7]. High-altitude platform stations (HAPS) deliver quasi-stationary, regional coverage from the stratosphere although their service area and capacity remain constrained and are affected by atmospheric conditions [8]. Similarly, unmanned aerial vehicles (UAVs) offer flexible, on-demand capacity that can be positioned close to localized hotspots or disaster sites, but their operation is limited by limited onboard energy [9]. The terrestrial network (TN) remains the backbone for dense, high-throughput service where infrastructure is available [10]. These tiers differ markedly in propagation, geometry, latency, and mobility behavior. Hence, their effective exploitation necessitates coordinated per-user orchestration.
Considering the aforementioned multi-tier and multi-connectivity TN-NTN architecture, the network selection problem for each user in the coverage area becomes significantly important, as the system must decide which tier or which combination of tiers optimally satisfies the user’s requirements under the prevailing environmental and geometric conditions [11]. The decision is inherently multi-factorial. It depends on the propagation environment, the user’s service requirements (throughput, latency, energy budget), and the instantaneous geometry of each candidate tier (distance and line-of-sight to the serving terrestrial point, satellite elevation, platform availability). Moreover, multi-connectivity introduces additional options that can complement coverage and capacity but further expand the decision space. Conventional rule-based or threshold-driven association schemes struggle to capture the joint, nonlinear interactions among these heterogeneous factors and witness poor generalization across the diverse conditions that 6G deployments must handle [12].
AI and Machine Learning (ML), especially Deep Learning (DL), are able to learn high-order associations directly from data, being essential for the sensing-rich nature of envisioned 6G smart environments. In the TN-NT cooperation domain, environmental, channel, and topology information from interconnected User Terminals (UTs) and sensing systems can be fused to inform network decisions without relying solely on channel state estimation (CSI) [13]. A key consideration, however, is the scarcity of existing large-scale datasets that include parallel multi-tier measurement campaigns [14]. Existing works are based on synthetic approaches, which typically describe scenarios through qualitative values that cannot fully reproduce real deployment orientations [15]. These considerations motivate a physically grounded formulation in which the features are continuous quantities derived from standardized channel and geometry models, and in which the prediction target resolves the individual non-terrestrial tiers rather than collapsing them into a single aggregate class.
1.1. Related Works
The integration of TN and NTN networks has been examined extensively from coverage, capacity, and standardization perspectives, with several recent works indicating the necessity for TN and NTN co-integration for improved service provisioning in future network topologies. Recent work investigates how ML, DL and distributed intelligence can support TN-NTN integration along standard 3GPP architectures, categorizing suitable learning styles and computational architectures for different scenarios [12]. A comprehensive overview of these studies is presented in Table 1 indicating that prior efforts either manage connectivity or optimize a single control decision (handover, access, or spectrum) within multi-tier networks, or perform tier selection but only at the coarse TN/NTN/TN+NTN level. To the best of the authors’ knowledge, the present work is the first to combine altitude-aware tier discrimination (LEO, HAPS, and UAV treated as distinct classes), TN-assisted multi-connectivity, physically grounded continuous features derived from standardized channel and geometry models, and a DL classifier within a single multi-tier network-selection framework, while retaining inference latency compatible with real-time handover operation.
Several surveys highlight how LEO satellites, HAPS, and UAV platforms extend coverage, capacity, and resilience toward integrated 5G/6G networks [20,21,22,23]. Building upon these foundations, ML is increasingly positioned as an enabler of TN-NTN interworking, both concerning physical layer (PHY) integration, 3GPP-related multilayer architectures scenarios [13] and dedicated schemes that manage NTN connectivity and service performance across heterogeneous non-terrestrial elements [16]. Despite the fact that these contributions establish the case for co-integration and for data-driven decision making, they remain mainly architectural, lacking a concrete mechanism for deciding, on a per-user basis, which tier combination achieves improved connectivity.
A complementary line of work targets specific control decisions within multi-tier settings. Handover management under satellite mobility has been addressed through reduction in clustering-based signaling in [17], while deep reinforcement learning has been applied to selection of network and radio-access technology with adaptive resource allocation in satellite-integrated 5G [18] and hierarchical spectrum allocation between satellite, HAPS, and UAV/terrestrial layers [19]. Multi- and dual-connectivity has been similarly studied as a reliability enabler, from overviews of its benefits [24] to ML-based RAT selection [25,26] and learning-based link scheduling [27]. Each of these efforts, however, optimizes a single control objective and typically treats the NTN segment as an undifferentiated whole, rather than jointly associating a user with the most suitable tier or tier combination while distinguishing among the LEO, HAPS, and UAV options, whose geometry and link behavior differ substantially.
The user-to-tier association decision is directly addressed in [14], where multi-connectivity scenarios are examined and the network type to serve each user is selected among terrestrial, non-terrestrial, and combined TN+NTN connectivity from a synthetic, sensing-driven dataset augmented with a conditional tabular generative adversarial network (CTGAN) and classified by conventional learners. While this approach demonstrates the value of data-driven association, it aggregates all non-terrestrial options into a single NTN class. All the aforementioned recent works indicate that an altitude-aware, physically grounded, and deep-learning-based treatment of multi-tier selection remains an open issue for online and data-driven decision-making in next-generation network topologies.
1.2. Contributions and Paper’s Structure
In this paper, an altitude-aware ML framework is proposed for multi-tier network selection in integrated LEO–HAPS–UAV–terrestrial 6G networks. The problem is cast as a seven-class classification task spanning standalone TN, LEO, HAPS, and UAV access together with their TN-assisted multi-connectivity combinations (TN+LEO, TN+HAPS, TN+UAV). To train and evaluate the proposed framework, a physics-based synthetic dataset is generated in which continuous, quantitative features are derived from standardized models—3GPP TR 38.901 terrestrial pathloss and line-of-sight probability, satellite-constellation elevation geometry, and air-to-ground link geometry for HAPS and UAV—and geographically anchored to a representative service region. A deep neural network (DNN) is then trained on the resulting dataset and assessed under stratified five-fold cross-validation, with attention to both predictive accuracy and inference-time feasibility for real-time handover decisions. The main contributions of this paper are summarized below:
- Formulation of multi-tier network selection as an altitude-aware seven-class problem that distinguishes standalone TN, LEO, HAPS, and UAV access as well as their TN-assisted multi-connectivity combinations (TN+LEO, TN+HAPS, TN+UAV), thereby generalizing the coarse TN/NTN/TN+NTN view adopted in relevant works on the field and enabling tier-specific association decisions.
- Design and implementation of a model-based synthetic dataset, generated through extensive Monte Carlo simulations, in which fourteen continuous features are derived from standardized channel and geometry models and anchored to a representative service region, replacing abstract ordinal scores with physically reproducible quantities.
- Development and evaluation of a DNN classifier for tier selection, assessed under stratified five-fold cross-validation in terms of overall accuracy and macro- and weighted-averaged F1-score, together with a per-class analysis of the decision behavior.
- Demonstration of real-time feasibility, quantifying the single-sample inference latency and showing that it remains well within typical 6G/NTN handover-preparation budgets, thereby confirming the practicality of the proposed approach for online operation.
- Provision of an interpretable error analysis, showing that residual misclassifications concentrate in physically ambiguous multi-connectivity configurations (notably TN+LEO versus TN+HAPS) rather than reflecting a model deficiency This offers insight into where multi-tier selection is intrinsically hard and guiding feature design for future deployments.
The remainder of this paper is organized as follows. Section 2 reviews the channel models and presents the geometry characteristics of the different connectivity tiers that constitute the problem under investigation. Moreover, in the same section, the network/access tier selection problem is mathematically formulated. Section 3 presents the proposed framework, including the dataset generation procedure, the feature set extraction and the proposed DNN architecture. Section 4 describes the experimental setup and reports the performance evaluation outcomes. Finally, Section 5 summarizes the manuscript and outlines directions for future work.
2. System Model and Problem Formulation
In this section, the system model of the integrated multi-tier 6G TN/NTN topology under investigation is presented. Section 2.1 describes the multi-tier network architecture, the sets and links that compose it, and the per-user tier-selection mathematical problem formulation. Section 2.2 then details the standardized channel and geometry models associated with each tier, which constitute the baseline for the environment-aware dataset generation introduced in Section 3. The overall topology is depicted in Figure 1.
2.1. Multi-Tier Network Topology
The downlink of an integrated TN/NTN 6G network architecture is examined over a service region anchored at a reference geographic location. The network consists of four access tiers that differ in altitude regime, propagation environment characteristics and mobility patterns. Set presents the aforementioned potential access tiers.
where, the TN tier operates at the ground-level using B5G/6G base stations (BSs), the LEO tier refers to access by satellites at altitude , the HAPS tier refers to access by quasi-stationary stratospheric platforms at altitude , and the UAV tier refers to access by low-altitude aerial nodes at altitude , with . The set of users requesting service is denoted as:
where, N denotes the total number of users sequentially reaching the topology. For a user , four candidate links may be available, namely , , , and , each associated with the corresponding tier in .
Beyond standalone access, the TN tier may be combined with a single NTN tier to provide multi-connectivity, complementing coverage and capacity. Based on this, the decision space for each user is the set of seven mutually exclusive classes:
where the aforementioned four standalone options are complemented with three TN-assisted multi-connectivity combinations.
Each user is characterized by a feature vector:
whose entries are continuous, physically grounded quantities that jointly summarize the propagation environment, the user’s service requirements, and the instantaneous geometry of each candidate tier. The multi-tier selection task is then cast as a supervised classification problem, as follows:
parameterized by , that assigns to each user the class best matching its conditions. The parameters are obtained by minimizing the categorical cross-entropy over a labeled dataset ,
where is the model’s predicted probability of class c for sample i and is the indicator function.
2.2. Channel Modeling and Formulation
The behavior of each tier is governed by the characteristics of its link, which are highly dependent on the propagation environment and the geometry of the link. To generate the set of characteristics in reproducible physical quantities, standardized channel and geometry models are adopted for the TN, LEO, and air-to-ground (HAPS/UAV) links, as detailed below. Throughout this subsection, denotes the carrier frequency, c the speed of light, and the radius of the Earth.
2.2.1. Terrestrial Link
The terrestrial link follows the 3GPP TR 38.901 channel model [28], which specifies both the line-of-sight (LoS) probability and the pathloss as functions of the two-dimensional user–BS distance and the selected scenario (urban macro, urban micro, or rural macro). The three-dimensional separation is computed as follows:
where and are the BS and user heights. For the selected urban-macro scenario, the LoS probability is computed as:
with the corresponding urban-micro and rural-macro expressions given in [28]. The LoS and non-LoS (NLoS) path-loss components (in dB, with in GHz and distances in meters) are computed as follows:
and the effective TN pathloss which follows the LoS state is derived from and ,
2.2.2. LEO Satellite Link
For the LEO level, the dominant descriptor for the pathloss calculation is the elevation angle of the satellite observed from the location of the user, which determines the availability of the link and the slant range. For a circular orbit at altitude , the slant range is computed as follows:
and, consistent with ITU-R P.681 [29], the free-space pathloss of the LEO link is denoted as follows:
2.2.3. HAPS and UAV Air-to-Ground Links
The HAPS and UAV tiers are modeled through the air-to-ground (A2G) formulation of [30]. For a platform at altitude h and elevation angle relative to the user, the link distance is computed as:
and the probability of a LoS condition follows the sigmoidal dependence on elevation:
where a and b are environment-dependent constants. The resulting pathloss combines free-space propagation with the excess losses of the LoS and NLoS states, as follows:
with and denoting the mean additional losses (in dB) for the LoS and NLoS conditions, respectively. Because the HAPS and UAV tiers differ only in altitude h, their proximity and availability are the primary features distinguishing the HAPS, UAV, TN+HAPS, and TN+UAV classes.
3. Proposed Multi-Tier Access Network Selection Framework
This section presents the proposed framework for multi-tier access network selection. Section 3.1 outlines the overall workflow. Section 3.2 details the dataset generation procedure using the standardized channel and geometry models that were presented in Section 2.2. Section 3.3 depicts the proposed DNN architecture.
3.1. Framework Overview
The framework operates in two stages, as depicted in Figure 2. The first stage is an offline one, where a labeled dataset is generated. Each sample contains the instantaneous geometry and propagation conditions of the four candidate tiers for each user, and each label is the corresponding class from the seven-way decision space defined in Section 2.1. The physical quantities that populate are computed using models presented in Section 2.2. A DNN classifier is then trained on to approximate the mapping . In the online stage, the trained model receives the feature vector of an incoming user and generates the predicted tier or tier-combination for the user’s network access, enabling requirement- and geometry-aware association within the handover-preparation budget of 6G/NTN systems.
3.2. Dataset Generation
The development of ML/DL-based decision mechanisms presupposes datasets of sufficient volume and fidelity. However, in the domain of the multi-tier TN–NTN cooperation, real measurement campaigns providing parallel observations across the TN and NTN tiers are not publicly available [15], as they would require the simultaneous instrumentation of ground, aerial, and space segments over a common service region. Consequently, and in line with established practice in the radio resource management domain, a synthetic dataset is constructed through extensive Monte Carlo (MC) simulation rounds in MATLAB, where each round instantiates a distinct realization of the scenario parameters and of the corresponding link conditions.
In the proposed framework, the target class is drawn using the feature vector computed from the models presented in Section 2.2. The complete procedure is summarized in Algorithm 1. Each realization begins with the selection of a propagation environment, which fixes the TR 38.901 [28] scenario together with the associated path-loss exponent and building-density statistics. The next step includes the sampling of the UT service requirements and of the regional demand and mobility conditions. The TN geometry is then instantiated and the corresponding LoS probability and pathloss are evaluated through the TR 38.901 model [28]. As for the NTN geometry, this is obtained by propagating a Walker-Delta constellation over the reference location for the LEO tier, and by sampling the A2G geometry for the HAPS and UAV tiers [30]. Afterwards, physically motivated couplings among features are enforced, so dense urban environments reduce usable LEO elevation through sky blockage. In addition, elevated user mobility increases the effective UAV serving distance. Finally, each feature is clipped to its admissible physical range and, after assigning the target label, a label-noise rate is injected to emulate the annotation ambiguity encountered in operational systems. In this way, unrealistically high accuracy is eliminated on the seven-class problem.
| Algorithm 1 Stratified model-based dataset generation. |
|
The above procedure yields a class-balanced dataset of samples. Since all features are derived from standardized models, the resulting dataset is both reproducible and physically consistent.
Each user is described by continuous features that jointly capture the propagation environment, the user’s service requirements, and the instantaneous geometry of the candidate tiers. The complete feature set is summarized in Table 2. Environmental and requirement features (F1–F7) characterize the scenario and the user demand, whereas geometry and propagation features (F8–F12) encode the tier-specific link conditions that most strongly discriminate among the classes, whereas the derived propagation features (F13–F14) provide the corresponding path-loss metrics evaluated directly from the standardized models of Section 2.2.
Prior to training, all features are standardized to zero mean and unit variance.
3.3. Deep Neural Network Architecture and Training
The proposed classifier is a fully connected DNN that maps the fourteen-dimensional feature vector to a probability distribution over the seven classes. The overall DNN’s architecture is included in Table 3 and comprises an input layer with in-network z-score normalization, followed by three hidden blocks, each consisting of a fully connected layer, batch normalization, a rectified linear unit (ReLU) activation, and a dropout layer, and a final fully connected layer with a softmax output. Batch normalization stabilizes and accelerates training, while dropout mitigates overfitting.
The network is trained by minimizing the categorical cross-entropy of Equation (6) using the Adam optimizer with an initial learning rate of and an regularization coefficient of . Training uses a mini-batch size of 256 for up to 120 epochs, with validation-based early stopping (patience of 15 epochs) applied on a stratified inner validation split carved from the training data of each fold, so that the returned model corresponds to the best validation performance.
Model performance is assessed using stratified five-fold cross-validation on the generated dataset. During each fold, the network is trained on four folds and evaluated on the held-out fold, and the out-of-fold predictions are aggregated to report the overall accuracy, the macro- and weighted-averaged F1-scores, and the confusion matrix. Because the entire dataset is model-generated, this stratified k-fold protocol constitutes a leakage-free evaluation. The framework is implemented using the MATLAB Deep Learning Toolbox, and the single-sample inference latency of the trained model is additionally measured to assess real-time applicability.
4. Performance Evaluation
This section presents the performance evaluation outcomes of the proposed DL-based multi-tier access network selection framework. Section 4.1 describes the simulation setup and the corresponding parameters. Section 4.2 reports the classification performance using ML/DL metrics, and Section 4.3 provides a per-class analysis of the decision behavior. Section 4.4 then evaluates the network-level KPIs delivered by the model’s decisions, and Section 4.5 assesses the inference latency against the real-time requirements of 6G/NTN handover operation. Finally, Section 4.6 positions the proposed framework against representative prior works.
4.1. Simulation Setup and Parameters
The dataset is generated through extensive MC simulation rounds in MATLAB (R2026a), employing the 5G Toolbox for the TR 38.901 terrestrial channel model [28], the Satellite Communications Toolbox for the Walker-Delta LEO constellation geometry, and the A2G model of [30] for the HAPS and UAV tiers. The service region is anchored at Athens, Greece, which serves as the reference ground location for the evaluation of the LEO elevation statistics. The DNN is implemented and trained with the MATLAB Deep Learning Toolbox. The complete set of simulation, dataset, and training parameters is summarized in Table 3.
4.2. Classification Performance
As stated before, the classification performance of the proposed DNN is evaluated under stratified five-fold cross-validation over the complete dataset. Table 4 reports the per-fold overall accuracy.
The proposed model attains an overall out-of-fold accuracy of , with a macro-averaged F1-score of and a weighted-averaged F1-score of . The deviation across folds is limited to , which confirms the stability of the model with respect to the data partitioning. Moreover, the close agreement between the macro- and weighted-averaged F1-scores reflects the balanced class representation ensured by the stratified generation procedure, indicating that the reported accuracy is not driven by a dominant class. It is also noted that the achieved accuracy exceeds the level attained by classical learners on the coarser three-class formulation of [14], despite the substantially higher difficulty of the seven-class, altitude-aware problem addressed herein.
The per-class F1-scores are reported in Table 5. The four standalone classes, together with the TN+UAV class, are classified with F1-scores between and , whereas the TN+LEO and TN+HAPS classes exhibit lower scores of and , respectively.
4.3. Per-Class Analysis and Error Characterization
The out-of-fold confusion matrix of the proposed DNN is depicted in Figure 3, where the row-normalized and column-normalized summaries correspond to the per-class recall and precision, respectively.
As observed in Figure 3, the standalone classes are recovered with recall values between (HAPS) and (TN), while the TN+UAV class attains . The residual misclassifications are not uniformly distributed across the decision space, but instead concentrate in a small number of physically interpretable confusions.
The dominant error mode is the bidirectional confusion between the TN+LEO and TN+HAPS classes, with 2194 TN+LEO samples assigned to TN+HAPS and 2537 TN+HAPS samples assigned to TN+LEO. These two classes jointly account for approximately of the total error budget and exhibit the lowest recall values, namely and . This behavior is a direct consequence of the underlying geometry rather than a deficiency of the classifier. Both classes share an identical terrestrial component and comparable environmental and requirement features, so that their discrimination relies almost exclusively on the contrast between the LEO elevation angle (F10) and the HAPS elevation angle (F11). Whenever the inter-feature couplings of Algorithm 1 attenuate this contrast, as occurs in dense urban environments where sky blockage reduces the usable LEO elevation, the two configurations become genuinely ambiguous and the decision boundary is intrinsically ill-defined.
A second, weaker error mode is observed between each non-terrestrial tier and its TN-assisted counterpart, most notably between HAPS and TN+HAPS (754 and 767 samples in the two directions) and between UAV and TN+UAV (433 and 537 samples). This confusion reflects the marginal utility of the terrestrial component when the non-terrestrial link alone is sufficient to satisfy the user requirements, a regime in which the standalone and multi-connectivity configurations are nearly equivalent from the perspective of the observable features. In contrast, confusions among distinct standalone tiers, such as between LEO and UAV, remain below of the corresponding class, which confirms that the altitude-aware formulation is well posed and that the geometry features discriminate effectively among the tiers.
These observations indicate that the proposed framework resolves the tier-selection decision reliably in the operationally clear-cut regimes, while the residual uncertainty is confined to configurations in which the candidate multi-connectivity options are physically comparable. From a deployment perspective, such confusions are of limited consequence, since both candidate classes retain the terrestrial link and differ only in the complementary non-terrestrial tier.
4.4. Network-Level Performance
Classification accuracy quantifies the correct prediction of the service provision tier. However, it does not by itself reveal the communication impact of that decision, which differs sharply between a delay-tolerant and a latency-critical user. Thus, each out-of-fold decision is mapped to the physical key performance indicators (KPIs) it delivers under the link budget of Table 3. For a user assigned class c with active tier set , the per-tier SNR is with . The delivered rate aggregates the active links, , and the one-way propagation latency is taken over the best control link, . Tier path losses reuse the standardized models of Section 2.2, so the KPI analysis is physically consistent with the feature generation. As reference we use the best achievable value among the seven class options for each user, rather than the assigned label, since the label reflects a multi-criteria trade-off and is not KPI-optimal in any single dimension.
Table 6 reports the latency-side KPIs, which are independent of the satellite terminal. The mean delivered one-way propagation latency is ms, dominated by the small subset of LEO-served users. Restricting attention to the latency-critical users (requirement ms), the proposed decisions incur a URLLC violation rate of , which means that no strict user is routed to a tier that breaches its own latency requirement.
Because the deliverable LEO rate is governed by the user-terminal antenna gain, the throughput KPIs are reported as a sensitivity over three representative terminals in Table 7. Rate efficiency is the mean delivered rate normalized by the mean rate of the throughput-optimal class option. The mean delivered rate rises from 290 to 432 Mbit/s as the terminal has more capabilities, and the TN+LEO composite exceeds 700 Mbit/s with a VSAT dish. Rate efficiency is non-monotonic: it peaks at the 25 dBi terminal () and falls to at 35 dBi, because once the LEO terminal is highly directional the LEO tier becomes throughput-optimal for many users, raising the achievable ceiling faster than the delivered rate while the classifier still, correctly, trades throughput for latency and energy on constrained users.
The of misclassified users is not an indicator of degraded service. Across all three terminals the predicted tier yields a throughput gain over the label tier for these users ( to Mbit/s) and introduces zero URLLC violations. The residual confusions identified in Section 4.3, chiefly TN+LEO versus TN+HAPS, therefore occur between options that both retain a terrestrial control link and deliver comparable service, so the network-level penalty of the classifier’s errors is negligible even though the raw error rate is non-zero. Figure 4 shows the delivered rate and latency distributions.
4.5. Inference Latency
Since the proposed framework is intended to operate online, the inference delay of the trained DNN must be compatible with the handover-preparation budget of 5G/NTN systems, which typically ranges between 20 and 50 ms [14]. The single-sample inference latency of the trained model is measured at ms, that is, approximately one order of magnitude below the lower bound of the aforementioned budget. Consequently, the inference latency does not constitute a bottleneck for the proposed approach, and the framework can support per-user tier-selection decisions in real-time. It is further noted that this latency is attained by a deep model that resolves a seven-class decision space, and remains comparable to the values reported for classical learners on the coarser three-class formulation of [14], which confirms that the altitude-aware granularity introduced in this work does not compromise the real-time applicability of the selection mechanism.
4.6. Comparison with Prior Works
Despite the fact that a direct numerical comparison against prior art is inherently limited, Table 8 compares the proposed work along methodological and capability axes. The authors in [14] address a three-class TN/NTN/TN+NTN decision problem, while the present work extends this to a seven-class problem driven by standardized, altitude-aware physical features, considering, also, network-level KPI evaluation that prior selection studies do not report.
The closest prior work in tier coverage is [19], which addresses the same four-tier TN–LEO–HAPS–UAV topology but formulates it as a hierarchical RL spectrum-allocation problem rather than an altitude-aware acces-type selection classifier, reporting spectral efficiency (SE) optimality rather than a per-user decision accuracy. Similarly, the authors in [18] pose TN/satellite selection as a deep-Q-network control task evaluated on acceptance and load balancing. Both works are RL radio resource-management schemes (RRM) and neither yields a supervised, physically-grounded per-user tier decision with reported classification quality. Relative to the three-class supervised baseline, the proposed model sustains a competitive accuracy on a substantially harder decision space while grounding every feature in a reproducible channel model and demonstrating that its residual errors are benign at the network level.
5. Conclusions
In this paper, an altitude-aware DL framework for multi-tier network selection in integrated TN-NTN 6G orientations has been proposed and evaluated via extensive simulations. The overall goal was to resolve the per-user access decision at the granularity of the individual NTN tiers, instead of collapsing them into a single NTN class. In particular, a DNN was trained on a class-balanced dataset of samples, whose fourteen continuous features are derived from standardized models and anchored to the service region of Athens, Greece, in order to predict the best-performing tier or TN-assisted tier-combination for each user. The key novelty of the proposed approach is that both classification quality and the network-level KPIs delivered by the decisions were considered, so that selection accuracy is assessed jointly with its communication consequences. According to the presented results, the model attains an overall accuracy with a macro-averaged F1-score of and a single-sample inference latency of ms, well within typical 6G handover budgets. Moreover, the residual errors concentrate in the physically ambiguous TN+LEO/TN+HAPS configurations. They are shown to be benign at the network level, as no latency-critical user is routed to a tier that violates its requirement. The delivered decisions retain the majority of the throughput-optimal assignment.
As far as future work is concerned, a potential technique that could further improve the proposed scheme is is the implementation ofDRL methods for tier selection, which promise additional accuracy gains as they learn to interoperate with the wireless environment over time. Moreover, validating the framework against measured or ray-traced campaigns and augmenting under-represented configurations with conditional tabular generative models particular, as the design of additional discriminative features may resolve the TN+LEO/TN+HAPS ambiguity. Finally, broadening the decision objective from per-user geometry toward load, interference, and energy-aware association will be incorporated into our multi-tier network simulators.
Author Contributions
Conceptualization, I.A.B., and M.-L.A.B.; methodology, I.A.B., P.K.G., G.V., and A.K.P.; software, I.A.B.; validation, I.A.B., M.-L.A.B., P.K.G., G.V., and A.K.P.; formal analysis, I.A.B., P.K.G., G.V., and A.K.P.; investigation, I.A.B. and M.-L.A.B.; resources, I.A.B., M.-L.A.B., P.K.G., G.V., and A.K.P.; data curation, I.A.B., and M.-L.A.B.; writing—original draft preparation, I.A.B.; writing—review and editing, M.-L.A.B., P.K.G., G.V., and A.K.P.; visualization, I.A.B., and M.-L.A.B.; supervision, P.K.G., G.V., and A.K.P.; project administration, I.A.B. All authors have read and agreed to the published version of the manuscript.
Funding
This research received no external funding.
Data Availability Statement
Data are available upon request from the authors.
Conflicts of Interest
The authors declare no conflicts of interest.
Abbreviations
The following abbreviations are used in this manuscript:
| 3GPP | 3rd Generation Partnership Project |
| 5G | Fifth Generation |
| 6G | Sixth Generation |
| A2G | Air-to-Ground |
| AI | Artificial Intelligence |
| B5G | Beyond Fifth Generation |
| BN | Batch Normalization |
| BS | Base Station |
| CSI | Channel State Information |
| CTGAN | Conditional Tabular Generative Adversarial Network |
| DL | Deep Learning |
| DNN | Deep Neural Network |
| DQN | Deep Q-Network |
| DRL | Deep Reinforcement Learning |
| eMBB | enhanced Mobile Broadband |
| EIRP | Equivalent Isotropically Radiated Power |
| FC | Fully Connected |
| FSPL | Free-Space Path Loss |
| GB | Gradient Boosting |
| HAPS | High-Altitude Platform Station |
| IMT | International Mobile Telecommunications |
| ITU | International Telecommunication Union |
| KPI | Key Performance Indicator |
| kNN | k-Nearest Neighbors |
| LEO | Low-Earth Orbit |
| LoS | Line-of-Sight |
| MC | Monte Carlo |
| MDP | Markov Decision Process |
| ML | Machine Learning |
| NF | Noise Figure |
| NLoS | Non-Line-of-Sight |
| NN | Neural Network |
| NR | New Radio |
| NTN | Non-Terrestrial Network |
| PHY | Physical Layer |
| RAT | Radio Access Technology |
| ReLU | Rectified Linear Unit |
| RF | Random Forest |
| RL | Reinforcement Learning |
| RMa | Rural Macro |
| RRM | Radio Resource Management |
| SE | Spectral Efficiency |
| SNR | Signal-to-Noise Ratio |
| TN | Terrestrial Network |
| UAV | Unmanned Aerial Vehicle |
| UE | User Equipment |
| UMa | Urban Macro |
| UMi | Urban Micro |
| URLLC | Ultra-Reliable Low-Latency Communications |
| UT | User Terminal |
| VSAT | Very-Small-Aperture Terminal |
References
- Chen, W.; Lin, X.; Lee, J.; Toskala, A.; Sun, S.; Chiasserini, C.F.; Liu, L. 5G-Advanced Toward 6G: Past, Present, and Future. IEEE J. Sel. Areas Commun. 2023, 41, 1592–1619. [Google Scholar] [CrossRef]
- Kaushik, A.; Singh, R.; Dayarathna, S.; Senanayake, R.; Di Renzo, M.; Dajer, M.; Ji, H.; Kim, Y.; Sciancalepore, V.; Zappone, A.; et al. Toward Integrated Sensing and Communications for 6G: Key Enabling Technologies, Standardization, and Challenges. IEEE Commun. Stand. Mag. 2024, 8, 52–59. [Google Scholar] [CrossRef]
- Alliance, N.; Düsseldorf, G. ITU-R framework for IMT-2030: Review and Future Direction; Technical report, Tech. Report; 2024. [Google Scholar]
- Bartsiokas, I.A.; Gkonis, P.K.; Papazafeiropoulos, A.K.; Kaklamani, D.I.; Venieris, I.S. Federated Learning for 6G HetNets’ Physical Layer Optimization: Perspectives, Trends, and Challenges. Encycl. Inf. Sci. Technol. Sixth Ed. 2025, 1–28. [Google Scholar]
- Saleh, S.; Zheng, P.; Liu, X.; Chen, H.; Keskin, M.F.; Priyanto, B.; Beale, M.; Ettefagh, Y.; Seco-Granados, G.; Al-Naffouri, T.Y.; et al. Integrated 6G TN and NTN Localization: Challenges, Opportunities, and Advancements. IEEE Commun. Stand. Mag. 2025, 9, 63–71. [Google Scholar] [CrossRef]
- Harounabadi, M.; Heyn, T. Toward Integration of 6G-NTN to Terrestrial Mobile Networks: Research and Standardization Aspects. IEEE Wirel. Commun. 2023, 30, 20–26. [Google Scholar] [CrossRef]
- Lv, X.; Liu, R.; Hou, R.; Liu, Q.; Zhu, Q.; Zang, Y.; Thompson, J.S. Enhanced Sensing in 6G NTN: Imaging With LEO Satellite and UAV Communication Network. IEEE Sens. J. 2025, 25, 33005–33021. [Google Scholar] [CrossRef]
- Kirik, M.; Alkana’Neh, A.; Afeef, L.; Arslan, H. Efficient Interference Management Design for NTN/TN Co-Existence in HAP-Based 6G Networks. IEEE Open J. Commun. Soc. 2025, 6, 5434–5449. [Google Scholar] [CrossRef]
- Ayub, M.S.; Saadi, M.; Koo, I. Optimization of RIS-Assisted 6G NTN Architectures for High-Mobility UAV Communication Scenarios. Drones 2025, 9. [Google Scholar] [CrossRef]
- Bartsioka, M.L.; Bartsiokas, I.A.; Panagopoulos, A.D.; Kaklamani, D.I.; Venieris, I.S. Federated Learning-driven Beam Management in LEO 6G Non-Terrestrial Networks, 2026. arXiv arXiv:cs.LG/2603.10983.
- Khennoufa, F.; Abdellatif, K.; Yanikomeroglu, H.; Ozturk, M.; Elganimi, T.; Kara, F.; Rabie, K. A Multi-Layer Non-Terrestrial Networks Architecture for 6G and Beyond Under Realistic Conditions and With Practical Limitations. IEEE Internet Things Mag. 2025, 8, 136–143. [Google Scholar] [CrossRef]
- Shah, A.F.M.S.; Karabulut, M.A.; Rabie, K. Multiple Access Schemes for 6G Enabled NTN-Assisted IoT Technologies: Recent Developments, Prospects and Challenges. IEEE Internet Things Mag. 2024, 7, 48–54. [Google Scholar] [CrossRef]
- Aygul, M.A.; Turkmen, H.; Cirpan, H.A.; Arslan, H. Machine learning-driven integration of terrestrial and non-terrestrial networks for enhanced 6G connectivity. Comput. Netw. 2024, 255, 110875. [Google Scholar] [CrossRef]
- Yazar, A. Machine-Learning-Based Adaptive Wireless Network Selection for Terrestrial and Non-Terrestrial Networks in 5G and Beyond. Telecom 2025, 6. [Google Scholar] [CrossRef]
- Bartsiokas, I.A.; Gkonis, P.K.; Kaklamani, D.I.; Venieris, I.S. ML-Based Radio Resource Management in 5G and Beyond Networks: A Survey. IEEE Access 2022, 10, 83507–83528. [Google Scholar] [CrossRef]
- Giuliano, R.; Innocenti, E. Machine Learning Techniques for Non-Terrestrial Networks. Electronics 2023, 12. [Google Scholar] [CrossRef]
- Dahouda, M.K.; Jin, S.; Joe, I. Machine Learning-Based Solutions for Handover Decisions in Non-Terrestrial Networks. Electronics 2023, 12. [Google Scholar] [CrossRef]
- De Santis, E.; Giuseppi, A.; Pietrabissa, A.; Capponi, M.; Delli Priscoli, F. Satellite integration into 5G: Deep reinforcement learning for network selection. Mach. Intell. Res. 2022, 19, 127–137. [Google Scholar] [CrossRef]
- Mohsin, M.A.; Rizwan, H.; Umer, M.; Bhattacharya, S.; Bilal, A.; Cioffi, J.M. Hierarchical deep reinforcement learning for adaptive resource management in integrated terrestrial and non-terrestrial networks. arXiv 2025, arXiv:2501.09212. [Google Scholar]
- Bor-Yaliniz, I.; Salem, M.; Senerath, G.; Yanikomeroglu, H. Is 5G Ready for Drones: A Look into Contemporary and Prospective Wireless Networks from a Standardization Perspective. IEEE Wirel. Commun. 2019, 26, 18–27. [Google Scholar] [CrossRef]
- Rinaldi, F.; Maattanen, H.L.; Torsner, J.; Pizzi, S.; Andreev, S.; Iera, A.; Koucheryavy, Y.; Araniti, G. Non-Terrestrial Networks in 5G & Beyond: A Survey. IEEE Access 2020, 8, 165178–165200. [Google Scholar] [CrossRef]
- Giordani, M.; Zorzi, M. Non-Terrestrial Networks in the 6G Era: Challenges and Opportunities. IEEE Netw. 2021, 35, 244–251. [Google Scholar] [CrossRef]
- Azari, M.M.; Solanki, S.; Chatzinotas, S.; Kodheli, O.; Sallouha, H.; Colpaert, A.; Mendoza Montoya, J.F.; Pollin, S.; Haqiqatnejad, A.; Mostaani, A.; et al. Evolution of Non-Terrestrial Networks From 5G to 6G: A Survey. IEEE Commun. Surv. Tutor. 2022, 24, 2633–2672. [Google Scholar] [CrossRef]
- Suer, M.T.; Thein, C.; Tchouankem, H.; Wolf, L. Multi-Connectivity as an Enabler for Reliable Low Latency Communications—An Overview. IEEE Commun. Surv. Tutor. 2020, 22, 156–169. [Google Scholar] [CrossRef]
- Yang, Y.; Deng, X.; He, D.; You, Y.; Song, R. Machine Learning Inspired Codeword Selection For Dual Connectivity in 5G User-Centric Ultra-Dense Networks. IEEE Trans. Veh. Technol. 2019, 68, 8284–8288. [Google Scholar] [CrossRef]
- Lee, H.; Vahid, S.; Moessner, K. Machine learning based RATs selection supporting multi-connectivity for reliability. In Proceedings of the International Conference on Cognitive Radio Oriented Wireless Networks; Springer, 2019; pp. 31–41. [Google Scholar]
- Tatino, C.; Pappas, N.; Malanchini, I.; Ewe, L.; Yuan, D. Learning-Based Link Scheduling in Millimeter-wave Multi-connectivity Scenarios. In Proceedings of the ICC 2020 - 2020 IEEE International Conference on Communications (ICC); 2020; pp. 1–6. [Google Scholar] [CrossRef]
- GPP. Study on channel model for frequencies from 0.5 to 100 GHz; Technical Report 38.901, 3rd Generation Partnership Project (3GPP); 2026. [Google Scholar]
- Propagation data required for the design systems in the land mobile-satellite service; Recommendation ITU-R P.681-11; International Telecommunication Union (ITU): Geneva, Switzerland, 2019.
- Al-Hourani, A.; Guvenc, I. On Modeling Satellite-to-Ground Path-Loss in Urban Environments. IEEE Commun. Lett. 2021, 25, 696–700. [Google Scholar] [CrossRef]
Figure 1.
Overall architecture of the integrated multi-tier 6G network.
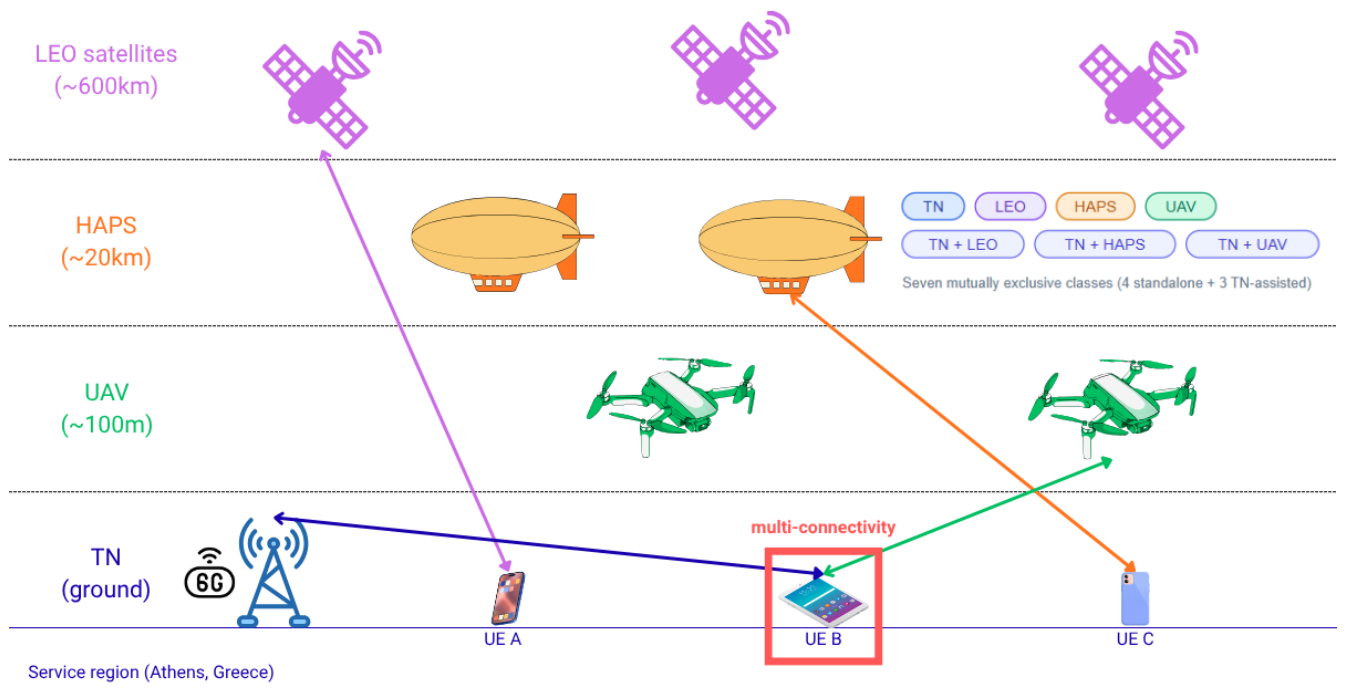
Figure 2.
Overview of the proposed multi-tier selection framework.
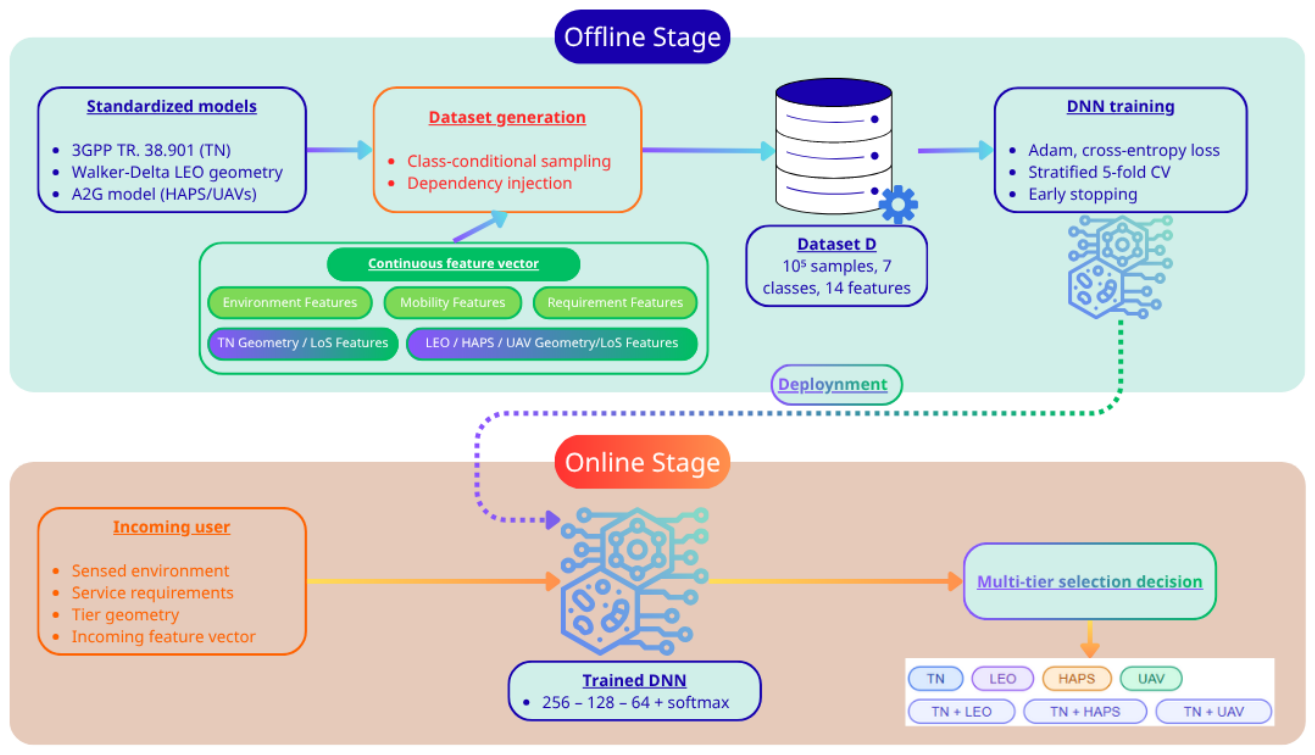
Figure 3.
Out-of-fold confusion matrix of the proposed DNN under stratified five-fold cross-validation. Row- and column-normalized summaries denote the per-class recall and precision, respectively.
Figure 3.
Out-of-fold confusion matrix of the proposed DNN under stratified five-fold cross-validation. Row- and column-normalized summaries denote the per-class recall and precision, respectively.
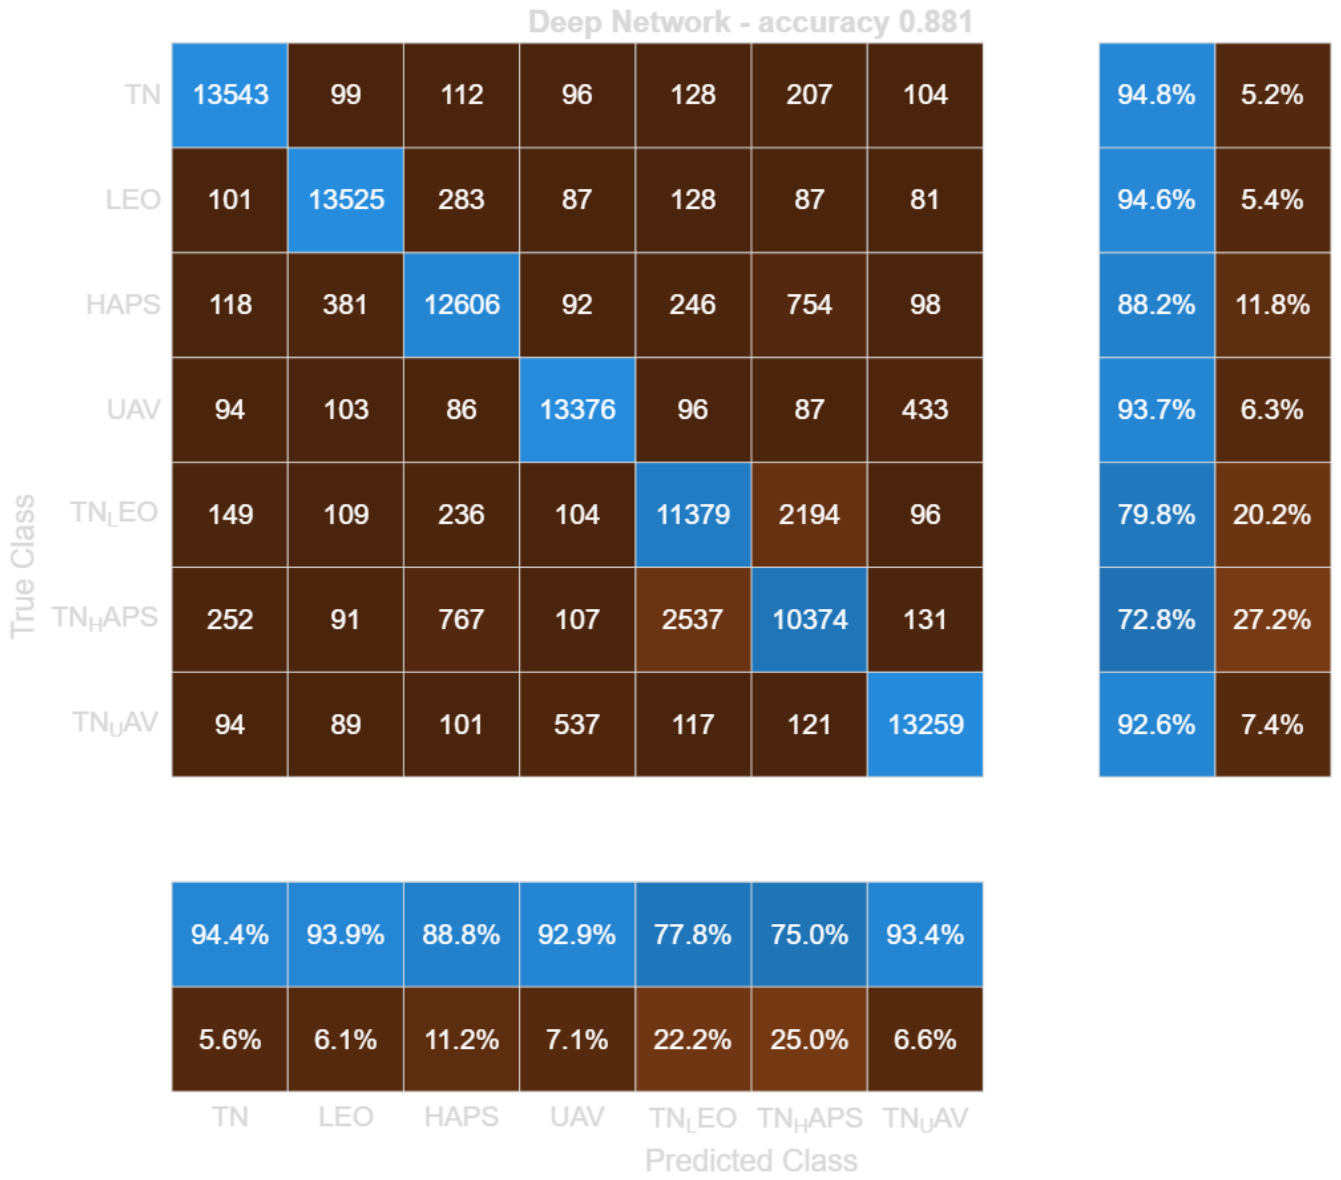
Figure 4.
Network-level KPIs of the multi-tier selection: (a) delivered throughput distribution (25 dBi LEO terminal); (b) one-way latency distribution (terminal-independent, log scale); (c) mean rate and rate efficiency versus LEO terminal gain; (d) mean delivered throughput per selected tier.
Figure 4.
Network-level KPIs of the multi-tier selection: (a) delivered throughput distribution (25 dBi LEO terminal); (b) one-way latency distribution (terminal-independent, log scale); (c) mean rate and rate efficiency versus LEO terminal gain; (d) mean delivered throughput per selected tier.
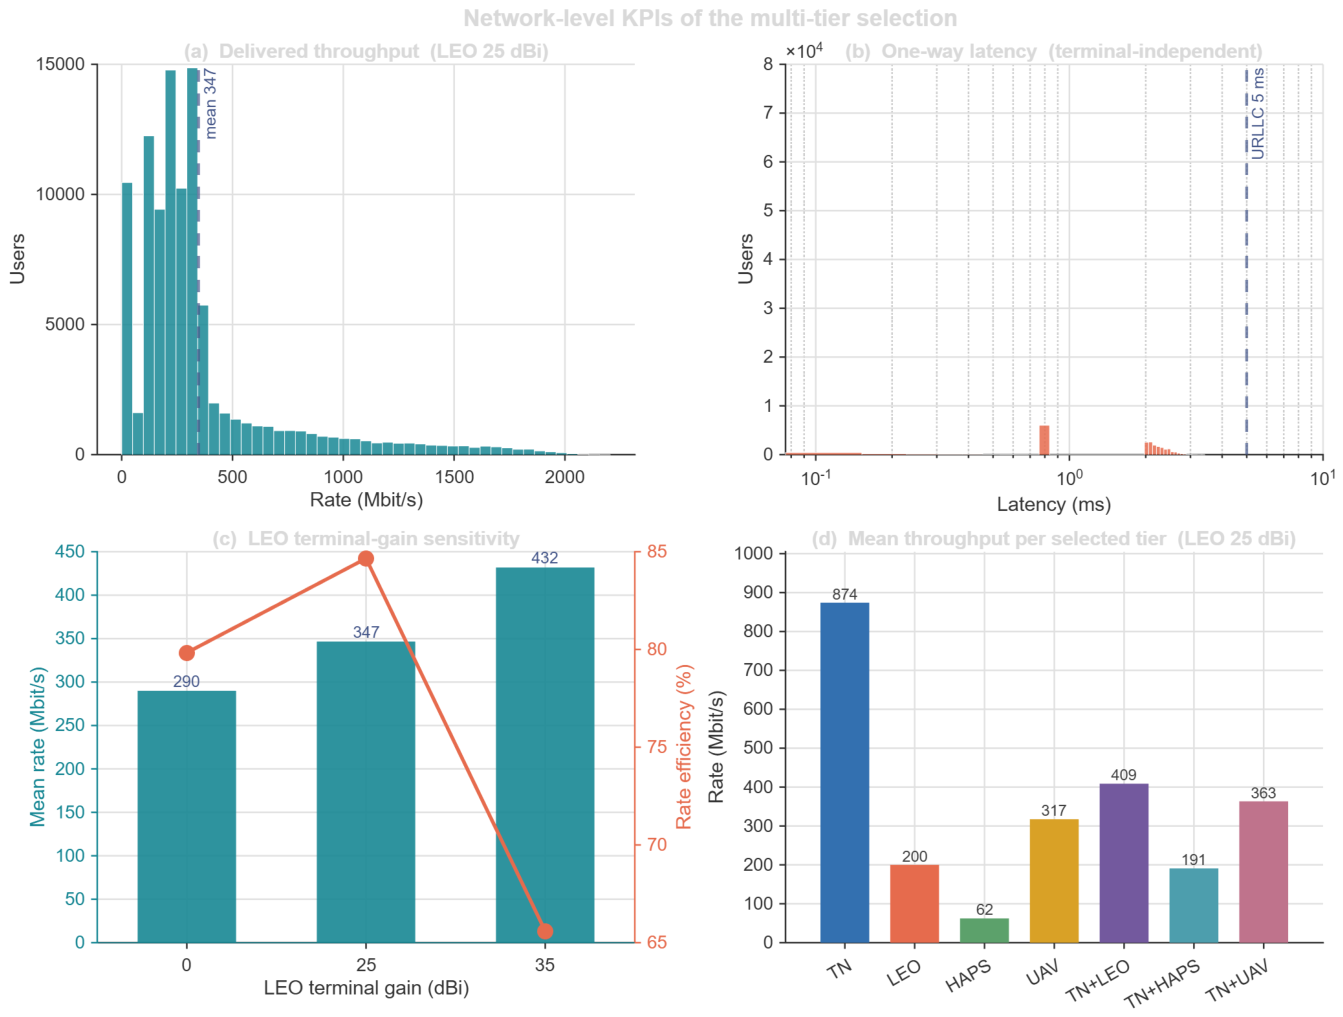

Table 1.
Comparison of representative ML-based works on TN/NTN network selection, handover, and resource management. (✓: supported/addressed; ×: not addressed; ∼: partially addressed; N.R: not reported; N/A: not applicable to the work’s objective.)
Table 1.
Comparison of representative ML-based works on TN/NTN network selection, handover, and resource management. (✓: supported/addressed; ×: not addressed; ∼: partially addressed; N.R: not reported; N/A: not applicable to the work’s objective.)
| Work | Tier Granularity | Multi-Connectivity | Decision Target | Feature Representation | Std. Models | Learning Model | Latency |
|---|---|---|---|---|---|---|---|
| [16] | LEO, HAPS, UAVs (NTN elements) | × | NTN connectivity management | NTN-element state metrics | ∼ | ML (various) | N.R. |
| [17] | NTN (LEO); TN↔NTN handover | × | Handover decision | Mobility / handover metrics | × | ML (clustering) | N.R. |
| [18] | TN + satellite (RATs) | ✓ | RAT / network selection | Path-loss & interference metrics | ∼ | DRL (DQN) | N.R. |
| [19] | Satellite, HAPS, UAV + TN | ✓ | Spectrum allocation | Regional spectrum/demand state | ∼ | Hierarchical DRL | N/A |
| [14] | TN, NTN (aggregated) | ✓ | 3-class selection (TN / NTN / TN+NTN) | Abstract ordinal (1–10 scale) | ∼ | Classical ML (GB, NN, RF, kNN) | ∼1–7 ms |
| This paper | TN, LEO, HAPS, UAV (distinct) | ✓ | 7-class selection | Model-based continuous (14 features) | ✓ | Deep neural network | ∼2 ms |
DQN: Deep Q-Network; DRL: Deep Reinforcement Learning; GB: gradient boosting; RF: random forest; kNN: k-nearest neighbors; RAT: radio access technology.
Table 2.
Continuous feature set used for multi-tier network selection ().
| # | Feature | Unit | Category | Description |
|---|---|---|---|---|
| F1 | Geographic path-loss exponent | – | Environment | Propagation-harshness indicator set by the TR 38.901 scenario. |
| F2 | Building density | /km2 | Environment | Density of buildings in the user’s region. |
| F3 | User density | /km2 | Environment | Number of active users per unit area (demand proxy). |
| F4 | User mobility | km/h | Mobility | User speed; governs Doppler and tier stability. |
| F5 | eMBB throughput requirement | Mbps | Requirement | Requested downlink data rate. |
| F6 | URLLC latency budget | ms | Requirement | Tolerated end-to-end latency (lower is stricter). |
| F7 | Device power budget | mW | Requirement | Available transmit-power budget of the device. |
| F8 | TN distance | m | TN geometry | Distance to the serving terrestrial base station. |
| F9 | TN LoS probability | – | TN channel | TR 38.901 line-of-sight probability of the TN link. |
| F10 | LEO elevation angle | deg | LEO geometry | Satellite elevation from the constellation geometry. |
| F11 | HAPS elevation angle | deg | HAPS geometry | Elevation to the HAPS platform (availability proxy). |
| F12 | UAV distance | m | UAV geometry | Distance to the nearest serving UAV. |
| F13 | TN pathloss | dB | TN channel | TR 38.901 pathloss of the TN link, Equation (11). |
| F14 | LEO free-space pathloss | dB | LEO channel | Free-space pathloss of the LEO link, Equation (13). |
Table 3.
Simulation, dataset, training, and link-budget parameters.
| Parameter | Value | Notes |
|---|---|---|
| Topology and service region | ||
| Service region reference | Athens, Greece (N, E) | LEO elevation reference point |
| Access tiers | TN, LEO, HAPS, UAV | |
| Decision classes | 7 | 4 standalone + 3 TN-assisted |
| Terrestrial tier | ||
| Carrier frequency | 3.5 GHz | 5G NR FR1 (n78) |
| TR 38.901 scenarios | UMa, UMi, RMa | Class-conditional selection |
| BS height (UMa/UMi/RMa) | 25 / 10 / 35 m | |
| UE height | 1.5 m | |
| TN distance range | 30 m – 35 km | |
| Non-terrestrial tiers | ||
| LEO altitude | 600 km | Starlink-like |
| LEO constellation | Walker-Delta, 528 satellites, 24 planes | inclination |
| LEO carrier frequency | 20 GHz | Ka-band downlink |
| HAPS altitude | 20 km | Stratospheric platform |
| HAPS carrier frequency | 2 GHz | S-band |
| UAV altitude | 100 m | Low-altitude platform |
| UAV carrier frequency | 2 GHz | S-band |
| Elevation angle range | – | LEO and HAPS |
| UAV distance range | 5 m – 8 km | |
| Earth radius | 6371 km | |
| Link budget and KPI evaluation | ||
| TN EIRP | 53 dBm | 46 dBm Tx + 7 dBi array |
| LEO EIRP | 62 dBm | Ka-band beam, TR 38.821 |
| HAPS EIRP | 47 dBm | |
| UAV EIRP | 30 dBm | |
| UE/terminal antenna gain | 0 dBi | Omnidirectional handheld |
| Noise figure (TN/LEO/HAPS/UAV) | 7 / 1.2 / 5 / 6 dB | Per-tier receiver front-end |
| Occupied bandwidth (TN/LEO/HAPS/UAV) | 100 / 100 / 20 / 20 MHz | |
| Thermal noise density | dBm/Hz | |
| Propagation speed c | m/s | Free-space latency |
| URLLC strict-subset threshold | 5 ms | Latency-critical user requirement (F6) |
| Dataset | ||
| Total samples | 99,995 | Class-balanced |
| Samples per class | 14,285 | |
| Number of features D | 14 | 12 base + 2 derived (TN PL, LEO FSPL) |
| Label-noise rate | 4% | Annotation-ambiguity emulation |
| Random seed | 42 | Reproducibility |
| Deep neural network | ||
| Hidden layers | 256 – 128 – 64 | FC + BN + ReLU + Dropout |
| Dropout rate | 0.3 | |
| Optimizer | Adam | |
| Initial learning rate | ||
| regularization | ||
| Mini-batch size | 256 | |
| Maximum epochs | 120 | |
| Early-stopping patience | 15 epochs | On inner validation split |
| Input normalization | z-score | Learned per training fold |
| Evaluation | ||
| Protocol | Stratified 5-fold cross-validation | Out-of-fold aggregation |
| Metrics | Accuracy, macro-/weighted-F1, confusion matrix | Classification |
| Network KPIs | Rate, latency, rate efficiency, URLLC compliance | Delivered vs. best-achievable class |
| Software | MATLAB R2026a | 5G, Satellite Comm., Deep Learning Toolboxes |
Table 4.
Per-fold classification accuracy of the proposed DNN under stratified five-fold cross-validation.
Table 4.
Per-fold classification accuracy of the proposed DNN under stratified five-fold cross-validation.
| Metric | Fold 1 | Fold 2 | Fold 3 | Fold 4 | Fold 5 | Mean | Std. |
|---|---|---|---|---|---|---|---|
| Accuracy | 0.8803 | 0.8784 | 0.8849 | 0.8811 | 0.8785 | 0.8807 | 0.0027 |
Table 5.
Per-class F1-scores of the proposed DNN (out-of-fold predictions).
| Class | TN | LEO | HAPS | UAV | TN+LEO | TN+HAPS | TN+UAV |
|---|---|---|---|---|---|---|---|
| F1-score | 0.9457 | 0.9429 | 0.8851 | 0.9330 | 0.7875 | 0.7388 | 0.9298 |
Table 6.
Latency-side network KPIs (terminal-gain independent).
| Metric | Value |
|---|---|
| Mean one-way propagation latency (ms) | 0.381 |
| Latency-critical users ( ms requirement) | 2,983 |
| URLLC latency-violation rate (%) | 0.00 |
Table 7.
Throughput KPIs versus LEO user-terminal antenna gain.
| LEO terminal | Mean rate (Mbit/s) | Rate eff. (%) | LEO (Mbit/s) | TN+LEO (Mbit/s) |
|---|---|---|---|---|
| 0 dBi (direct-to-cell) | 289.9 | 79.8 | 1.4 | 217.0 |
| 25 dBi (flat-panel) | 346.6 | 84.7 | 200.1 | 408.6 |
| 35 dBi (VSAT dish) | 431.9 | 65.6 | 495.1 | 701.1 |
Terrestrial-side KPIs are unaffected by the LEO terminal: TN , UAV , and HAPS Mbit/s throughout.
Table 8.
Comparison with representative prior works on learning-based TN/NTN selection.
| Work | Tiers | Classes | Features | Net. KPIs | Reported acc. |
|---|---|---|---|---|---|
| [14] | TN, NTN | 3 | Ordinal (1–10) | No | 82.1% (GB) |
| [18] | TN, SAT | RL* | MDP state (PL, interf.) | Yes | n/a (RL) |
| [19] | TN, LEO, HAPS, UAV | RL* | RL state (regional demand) | Yes | n/a (RL) |
| This work | TN, LEO, HAPS, UAV | 7 | Std. physical, altitude-aware | Yes | 88.1% (DNN) |
*RL-based RRM, not a classification formulation, so class count and classification accuracy do not apply.
Disclaimer/Publisher’s Note: The statements, opinions and data contained in all publications are solely those of the individual author(s) and contributor(s) and not of MDPI and/or the editor(s). MDPI and/or the editor(s) disclaim responsibility for any injury to people or property resulting from any ideas, methods, instructions or products referred to in the content. |
© 2026 by the authors. Licensee MDPI, Basel, Switzerland. This article is an open access article distributed under the terms and conditions of the Creative Commons Attribution (CC BY) license (http://creativecommons.org/licenses/by/4.0/).
Copyright: This open access article is published under a Creative Commons CC BY 4.0 license, which permit the free download, distribution, and reuse, provided that the author and preprint are cited in any reuse.