

Submitted:
29 September 2026
Posted:
30 September 2026
You are already at the latest version
Abstract
Background and Objectives: Diabetes mellitus (Type 2 diabetes) is a significant and rapidly growing global healthcare challenge and a leading cause of severe complications, including cardiovascular disease (CVD), chronic kidney disease and other conditions. In Latvia more than 103 000 individuals have been registered in the Latvian Diabetes Patient Register, of whom 90% had type 2 diabetes. Since early diagnosis can reduce complication risk, considerable effort has been devoted to the development of numerous CVD risk prediction tools using traditional statistics as well as data science-based methods. This article augments these efforts with predictive models built specifically for Latvia’s diabetes patient population. Materials and Methods: Models used anonymized diabetes patient data stored at Latvia’s Center for Disease Prevention and Control containing routinely collected information on patients’ utilization of publicly funded healthcare services. No clinical data were included. In keeping with best practices in model development, 96 302 available patient records were randomly partitioned into a 70% training data portion and 30% for out-of-sample validation. We tested three modeling methodologies – logistic regression, Random Forests, and XGBoost. Results: The binary dependent variable was defined as the occurrence of an ischemic heart disease hospitalization during 2023 or 2024. The predictor variables were limited to data from the prior two year period, 2021-2022. The three model types all produced similar fit to the data – area under the Receiver Operating Curve (ROC) of 0.70-0.71 in the validation data, which is comparable to results obtained in other studies, including SCORE2. Prediction reliability, as measured by the Brier Score, was 0.08. Conclusions: We find ischemic heart disease hospitalization risk prediction models based on routinely collected Latvian health care utilization data to be feasible. Our model identified in the anonymized data set of 103 000 individuals a group of 8 000 – 10 000 diabetes patients with an elevated (40%-45%) risk of experiencing an ischemic heart disease-related hospitalization over the next two years. We suggest future prospective studies to evaluate whether integrating the model into primary care leads to earlier interventions and a reduction in preventable ischemic heart disease hospitalizations.
Keywords:
type 2 diabetes
; diabetes mellitus
; cardiovascular disease
; ischemic heart disease hospitalizations
; diabetes complications
; machine learning
; predictive models
; preventive care
; logistic regression
1. Introduction
Diabetes mellitus represents one of the most significant and rapidly growing public health challenges worldwide, contributing substantially to morbidity, mortality, and healthcare system burden. According to the International Diabetes Federation, in 2025 11.1% – or 1 in 9 – of the adult population (20-79 years) is living with diabetes, with over 4 in 10 unaware that they have the condition. The Federation forecasts an increase in diabetes prevalence of 46% by 2050, resulting in approximately 853 million people living with diabetes [1]. Over 90% of people with diabetes have type 2 diabetes, which is driven by socio-economic, demographic, environmental, and genetic factors. Despite available effective medication for control of diabetes, more than half (59%) of adults aged 30 years and over living with diabetes were not taking medication for their diabetes in 2022. Diabetes is a leading cause of severe complications, including cardiovascular disease (CVD), chronic kidney disease, blindness, lower-limb amputations, and pregnancy-related complications [2]. Both microvascular and macrovascular complications significantly contribute to morbidity and mortality [3]. These complications significantly reduce quality of life and increase healthcare costs, making diabetes management a priority for healthcare systems. Evidence indicates that effective prevention, early diagnosis, and continuous disease management can reduce complications and improve long-term outcomes. Primary care is the cornerstone of diabetes management, encompassing prevention, early detection, ongoing treatment, patient education, lifestyle intervention, and coordination of multidisciplinary care. Effective primary care management is essential for improving outcomes and reducing the burden of diabetes and its complications [4].
In Latvia, as in many other European countries, diabetes poses a considerable public health concern, with rising incidence rates and a growing number of patients requiring long-term management within primary care settings. In total, more than 103 000 individuals were registered in the Latvian Diabetes Patient Register in 2024, of whom more than 90% had type 2 diabetes; this number increases annually by around 2,000 patients [5].
As noted above, type 2 diabetes mellitus substantially increases the risk of various complications. Reducing the risk of these outcomes depends not only on glycaemic control, but also on timely recognition of cardiovascular risk, adequate management of blood pressure and lipids, appropriate pharmacotherapy, and structured follow-up. As the number of people living with diabetes grows, it becomes increasingly difficult to identify, within regular primary-care workflows, those individuals most likely to experience a serious adverse event. This has motivated growing interest in using routinely collected health data to support more proactive risk stratification.
CVD risk prediction is one of the most extensively studied applications of AI in diabetes. A systematic review by Kee et al. (2023), restricted specifically to machine learning (ML) based CVD prediction models in people with type 2 diabetes, reported that a neural-network model achieved the highest reported performance among included studies - Area Under the Curve (AUC) of 0.91, but also found that overall adherence to the Transparent Reporting of a multivariate prediction model for Individual Prognosis or Diagnosis (TRIPOD) standard was only 53.75%, and recommended use of the Prediction model Risk of Bias Assessment Tool (PROBAST) to reduce bias and improve clinical applicability of future models [6].
A broader review of machine learning (ML) models developed for diabetes complications generally (not limited to CVD) similarly found that only about one-third of models demonstrated clearly useful discrimination and concluded that current ML prediction models for diabetes complications remain largely exploratory, requiring external validation before clinical implementation [7].
These two reviews illustrate an important tension in the field. On the one hand, some individual studies report very high discrimination, particularly when neural networks are applied to rich, well-curated datasets. On the other hand, systematic appraisals consistently highlight incomplete reporting, limited external validation, and heterogeneous outcome definitions across the literature as a whole. Consequently, the performance figures reported by individual studies should not be interpreted as representative of what any newly developed model can be expected to achieve [6,7].
A further point of ongoing discussion concerns whether more complex algorithms reliably outperform conventional regression if the same structured predictor set is used. ML methods such as Random Forests (RF) and Gradient Boosting Machines (GBM) can capture non-linear relationships and variable interactions, and can tolerate missing data more readily than logistic regression. These properties are valuable in large, heterogeneous datasets. However, when multiple models are trained on the same limited set of structured variables, logistic regression and ML approaches frequently achieve similar discrimination; in such cases, the informativeness and completeness of the available predictors, together with a precise and clinically valid outcome definition, may matter more than the choice of algorithm.
An important population-level example is the work of Ravaut et al. (2021), who used administratively linked health data from more than 1.5 million people with diabetes in the Canadian province of Ontario to predict several adverse diabetes-related outcomes, including cardiovascular events, using a broad set of demographic, healthcare-utilization, laboratory, prescription, and area-level socioeconomic variables. This study demonstrated that large-scale administrative data from a single-payer health care system can support not only retrospective description, but also prospective identification of patients who may benefit from preventive attention, and that model performance benefits from access to richer and more diverse predictor data sets [8].
Some administrative-data models, however, carry an inherent limitation that should be recognized: their data records reimbursed contacts with the healthcare system rather than the complete clinical or biological state of a patient. They often lack directly measured variables such as glycated hemoglobin, blood pressure, lipid profile, renal function, body-mass index, and smoking status, and they may not adequately represent individuals who receive care outside the publicly reimbursed system. As a result, an administrative-data model may partly reflect patterns of healthcare-seeking behavior and system contact rather than physical measurements of disease symptoms, and this has negative implications for model interpretability [8].
A further caveat pertains to the use of discrimination metrics. The area under the Receiver Operating Characteristic curve quantifies how well a model ranks patients who later experience an event above those who do not; it does not indicate whether predicted probabilities are numerically accurate (calibration), whether the model performs consistently across demographic or socioeconomic subgroups, or whether using the model in practice changes clinical decisions or outcomes. A meta-analysis of ML models for heart-failure detection in people with diabetes reported a high pooled AUC of 0.90 but also noted considerable heterogeneity across studies and limited external validation, reinforcing that headline discrimination statistics should be interpreted cautiously and always alongside calibration and validation evidence [9].
In our study we measured the AUC on a randomly selected test data set and supplemented the AUC metric with a reliability plot and associated plot diagnostics which map predicted incidence against observed incidence.
Alongside predictive modeling, digital technologies have also been evaluated for diabetes education. A systematic review and meta-analysis of 39 randomized controlled trials (6,861 participants) found that digitally delivered diabetes self-management education and support (DSMES) improved glycated hemoglobin and diabetes knowledge, particularly among people with type 2 diabetes, with pooled HbA1c reductions of approximately 0.48 percentage points at six months and 0.46 percentage points at twelve months; effects were more pronounced when delivered via mobile applications or patient portals. However, statistical heterogeneity across included trials was substantial (I² often exceeding 70%), and no significant improvement in health-related quality of life was observed [10].
It is important to note that this evidence base concerns structured self-management education interventions, not the communication of AI-derived risk scores. The benefit of linking a predictive risk estimate to educational content – for example, within a national e-health portal – has not itself been evaluated in randomized trials and should be regarded as a plausible but in scientific literature a currently unproven implementation hypothesis [10].
Taken together, the literature supports two preliminary conclusions relevant to this study. First, administrative and electronic health-record data can meaningfully contribute to diabetes-complication risk prediction, but reported performance varies widely across studies and is affected by data richness, outcome definition, and methodological rigor, with systematic reviews consistently calling for greater transparency and external validation [6,7]. Second, digital tools can support diabetes self-management education with demonstrable, if heterogeneous, effects on glycaemic control and knowledge, while the integration of predictive risk scores with educational delivery remains an emerging and largely untested application [10].
The aim of our present study was to develop and evaluate prototype models estimating the two-year ahead probability of ischemic heart disease-related hospitalization among Latvian patients with type 2 diabetes, using patient-level data from Latvia’s Healthcare Quality and Efficiency Monitoring System (LHQEMS) that integrates records from the Centre for Disease Prevention and Control (CDPC), the National Health Service, the Latvian Digital Health Centre, the State Emergency Medical Service and the Health Inspectorate, where data were linked at the person level by CDPC and provided to the researchers in anonymized form.
Logistic regression, Random Forests, and XGBoost models were trained using demographic characteristics, duration of diabetes-registry enrollment, prior hospitalizations, outpatient and specialist visits, ambulance calls, and prescription fills recorded during the two years preceding the outcome period.
While predictive models of diabetic CVD complications have been researched since 2001, our work is the first dedicated to the Latvian diabetes patient population [11]. It is also unique in that predictor data includes only routinely collected administrative data about health care services utilization, and does not utilize clinical or patient survey data that may not be systematically available at the point in time when predictions are generated.
In other words, such tools may offer significant opportunities for the early prediction of adverse events and the identification of high-risk individuals prior to the manifestation of clinical risk. These innovations could enable a shift from reactive to proactive care by facilitating timely interventions.
Our principal finding was that all three modeling approaches achieved similar, moderate discrimination in out-of-sample validation (OOS), with AUC values of 0.71 for logistic regression and XGBoost and 0.70 for Random Forest. A history of prior ischemic heart disease-related hospitalization was among the strongest predictors of a subsequent event, while age, diabetes registry duration, and healthcare-utilization variables contributed additional, model-dependent predictive information.
We also developed an analogous model focused on a 12 month forecast window with similar results. In this article, we describe the two-year ahead prediction model.
Our results indicate the feasibility of using predictive models based on routinely collected administrative paid health care services data for population-level ischemic heart disease risk stratification among type 2 diabetes patients in Latvia.
The models do not, however, establish causal determinants of ischemic heart disease events, demonstrate a decisive advantage of machine learning over conventional regression, or provide evidence that model-based alerts improve patient outcomes when deployed in practice.
Because discrimination alone does not establish calibration or clinical utility, and because the underlying data do not comprehensively represent patients of privately paid health care services or capture key clinical variables, further work should prioritize field testing of model-based communications in Latvia’s patient portal system and extending the model development data to include private healthcare provider data. Inclusion of key clinical data may be a longer-term goal. Refinements to outcome-code definitions, calibration assessment, ongoing external and temporal validation, subgroup analysis, and prospective evaluation of any proposed clinical or educational implementation pathway should be considered before wider adoption [6].
2. Materials and Methods
The most frequent type of complication occurring among Latvia’s type 2 diabetes patients is that of an ischemic heart disease hospitalization. Our analysis of 2023-2024 data indicates that approximately 7-8% of Latvia’s type 2 diabetes patients are hospitalized in a given year with this diagnosis.
Our goal was to create a prototype predictive model that uses routinely collected data on health care services utilization to forecast a patient’s near-future (24 months) probability of CVD-related hospitalization.
Data Sources
In 2017 Latvia’s Center for Disease Prevention and Control - Slimību Profilakses un Kontroles Centrs (SPKC) launched a data project to enable a unified, patient-centric view of government-funded health care services – the Latvia Healthcare Quality and Efficiency Monitoring System (LHQEMS). This included merging health care utilization data with basic demographic information such as age, gender, and mortality. Special data subsets were built addressing oncological and diabetes patient populations. The SPKC, in collaboration with the University of Latvia, also constructed a data anonymization process that enables the creation of separate, subsidiary research data sets for use by approved research entities and researchers. Such data sets are accessible upon receiving approval from the data governance committee [12]. We requested and received such approval for the purposes of this study.
Thus our study utilized a research database consisting of fully anonymized person-level data from LHQEMS, integrating records from the Centre for Disease Prevention and Control (SPKC), the National Health Service, the Latvian Digital Health Centre, the State Emergency Medical Service and the Health Inspectorate. These were linked at the person level by SPKC and provided to the researchers in anonymized form.
Access to these data was granted in accordance with the established data access protocol. The data owner, the Latvian Centre for Disease Prevention and Control (SPKC), reviewed the proposed research protocol and confirmed its compliance with applicable Latvian legislation governing the use of anonymized health data for research purposes.
Because the study relied exclusively on fully anonymized administrative data and did not involve direct contact with individuals or access to personally identifiable information, approval from a Research Ethics Committee was not required under the relevant national regulations.
Upon receiving approved access, we obtained data for model development from the following LHQEMS tables merged with the diabetes patient registry:
- Demographics – year of birth, gender
- In-patient hospital stays
- Out-patient visits with family doctor
- Out-patient visits with a specialist
- Ambulance calls
- Prescriptions and lab orders
In-patient and out-patient visit data contained dates as well as primary and secondary diagnosis codes. The diabetes patient registry also records the year when the patient was initially entered into the registry, which was used to calculate a proxy measurement for the duration of a patient’s diabetic condition. Because diagnosis may precede registration and registration practices may vary over time, this variable should not be interpreted as a direct measure of diabetes duration, hence we regard it as a proxy.
It should be noted that the LHQEMS data does not contain clinical information such as doctor’s notes, specific lab results, or patient monitoring data obtained during hospitalizations.
Data Representativeness
The major LHQEMS data tables are built from source feeds originating at Latvia’s National Health Service – Nacionālais Veselības Dienests (NVD) which reimburses physicians, hospitals, and pharmacies for eligible treatment charges, and also finances emergency ambulance calls. Cases when patients select to pay for medical services out-of-pocket in cash or through a private insurance plan are not included in the LHQEMS data. Hence it would not be representative of patients who primarily utilize private health clinics and treatment facilities. There is little hard data on the size of this group within the overall type 2 diabetes population in Latvia. According to OECD estimation, the extent of privately paid health care services is approximately 39% [13].
Modeling Methodologies
In traditional statistics the logistic regression framework is chosen when the goal is to explain and predict a binary event. In this methodology the algorithm selects coefficients on a set of independent variables that minimize prediction error in the log-odds ratio of the modeled event [14]. In this article, the traditional logistic regression model was used to establish a baseline for model fit.
The logistic regression model has limitations. One is that it requires a fully populated data matrix with no gaps in the data. Should there be missing values in any of the independent variables the algorithm fails. As a practical matter, this means that the modeler must either remove the variable from the equation, remove observations with missing values from the data matrix, or alternatively replace the missing values with estimated values using some imputation method. In either case the full information content of the original data will have been compromised to some greater or lesser degree.
Another drawback is that the underlying mathematics of the model require the independent variables to be mutually uncorrelated for their coefficients to be completely credible. Depending on the degree to which this condition is not satisfied, coefficient interpretability can become problematic and the straightforward logistic model may be unreliable for the purpose of quantifying and comparing the magnitude of specific causal effects of individual independent variables. However, when model purpose is prediction rather than explanation, coefficient magnitude becomes less relevant.
Machine learning algorithms developed over the past three decades offer alternatives to the traditional logistic regression method that are not sensitive to missing values in the data matrix or the variable independence requirement [14]. However, the cost is reduced explainability, because the models do not offer a set of coefficients to describe the derivation of the predicted probability for a given observation. Nevertheless, researchers and data science practitioners use these tools when the primary goal is prediction rather than explanation. There have been a number of studies about diabetes complication prediction that employ machine learning methods. [6,7,8,9,11,15].
When comparing model performance in the diabetes prediction realm two algorithms tend to outperform – Random Forests (RF) and Gradient Boosting Machines (GBM) [15]. In this study both were tested, where the more advanced XGBoost was implemented instead of the original GBM.
RF and GBM algorithms both work by randomly partitioning the data into many subsets, then within each subset the algorithm finds a further set of data splitting rules that produce groups of observations with divergent incidences of the modeled event. Upon conclusion, the many iterations of splitting rules are applied to each data observation, placing it into multiple end points of the splitting process. The average incidence of the target event across these end nodes is taken as the predicted probability of the outcome for that data row. This model architecture is frequently referred to as the decision tree ensemble.
The GBM algorithm further refines the splitting process by augmenting each initial subgroup’s result with a subsequent round or rounds of splits that focus on the errors produced by the first one. The intent is for the final predicted probability to reflect a combination of initial predictions corrected for expected errors. To guard against overfitting the data, the algorithm down-weights the error-correcting elements of the process.
XGBoost is a GBM implementation that incorporates parallelization and other technical improvements to the algorithm [16].
For this study, the free open-source KNIME visual analytics platform, version 5.12.0 LTS, was used to perform the modeling work [17]. The KNIME workflow file is available from the authors upon request. Shared workflow files will not contain the study’s original data, since their use was limited to this specific study and not for general access. In our RF and XGBoost specifications we used the platform’s default settings with no hyperparameter tuning. The RF procedure was set to 100 models and XGBoost used 100 boosting rounds with a learning rate of 0.3 and maximum tree depth of 6.
Dependent Variable and Predictor Variable Definitions
In predictive models the dependent variable defines the future outcome to be predicted and the independent, or predictor variables contain information about the pre-outcome state. Should a model be deemed valid, it could provide outcome probability predictions in cases where patient data contains pre-outcome information but the actual future outcome has not been observed.
In our study the modeled outcome was at least one hospitalization during 2023–2024 with a primary ICD diagnosis code of I20–I25, corresponding to ischemic heart diseases [18]. Accordingly, the model predicts hospitalization for this defined subset of cardiovascular disease rather than all cardiovascular events. Secondary diagnoses and other types of cardiovascular conditions were not included in the outcome definition.
Predictor variables were obtained from patient demographics data merged with the previously described administrative data for the 24 month interval preceding the period containing the target variable – 2021-2022:
- Gender
- Age in 2022
- Number of years in diabetes registry as of 2022
- Number of in-patient hospital stays in 2021-2022 without a CVD-related diagnosis
- Number of in-patient hospital stays in 2021-2022 with a CVD-related diagnosis
- Number of out-patient visits in 2021 with family doctor
- Number of out-patient visits in 2022 with family doctor
- Number of out-patient visits with a specialist in 2022
- Number of ambulance calls in 2022
- Number of ambulance calls in 2021
- Number of prescribed and dispensed reimbursed medicines in 2021
- Number of prescribed and dispensed reimbursed medicines in 2022
Model Evaluation Process
In data analytics it often happens that a single data set and analytic objective can be handled by different modeling approaches. For this reason it is helpful to compare alternatives using an objective, empirical method to choose the most suitable option.
In traditional statistics a model is usually evaluated using measures of coefficient significance and analysis of variance (ANOVA). However, these are based on the linearity assumption – that the underlying data has stochastic straight-line relationships between the target variable and its predictors. In real-world data this is frequently not so.
To evaluate predictive models not based on the linearity assumption, data science practitioners rely on other methods. A fundamental concept is that models must be tested on data that the algorithm has not been exposed to. This requires a randomized partitioning of the original data into two subsets – one for the algorithm, often referred to as the “training data”, the other for testing. The second – also known as the Out of Sample (OOS) or “hold-out” data – is used to evaluate model validity – how well the model performs when given new data. If OOS model performance resembles that from the training data the model is deemed valid.
If the overall sample size is too small to support this type of OOS validation the modeler uses internal cross-validation, whereby the model is trained on data subsets excluding a pre-specified proportion of observations, then tested on the excluded data rows [19]. In our case the data set was sufficiently large to permit hold-out OOS validation. It should be noted that our data did not extend beyond 2024, so an “out of time” validation based on subsequent year data was not possible at the time of the study, though it will be feasible once the SPKC incorporates later year data into the existing database structure.
RF and GBM model fit is frequently visualized and measured using the Receiver Operating Characteristics (ROC) curve that depicts the cumulative incidence of correctly predicted target events across sample percentiles arranged in descending order by predicted outcome probability (highest to lowest). A model with good fit will produce a ROC curve that ascends steeply near the origin and flattens afterwards. ROC curves also enable calculation of the Area Under the Curve (AUC), a number representing the proportion of the graph’s area that is found between the ROC curve and the X axis. If the AUC is 0.50 then the model’s predictions are no better than simple guessing. For a model to be considered potentially useful, data science practitioners look for AUC of 0.60 or greater in the hold-out data set. ROC curves and AUC measures are not limited to RF and GBM models and will be used in this article to compare model performance against the baseline logistic regression model.
3. Results
Characteristics of the Input Data
For this study we used data about Latvia’s type 2 diabetes patients who were living and in the diabetes patient register as of January 2023. We excluded persons who died prior to January 2023. We also excluded persons who were added to the register after January 2023. Of the more than 103 000 patients in the SPKC diabetes patients this resulted in a data set describing 96 302 Latvian type 2 diabetes patients.
This data was partitioned into a 70% training data portion, with the remaining 30% reserved for the OOS validation. 14% of the patients were hospitalized in 2023 or 2024 with a primary diagnosis of ischemic heart disease (ICD 10 codes I20-I25). Variable names, shown below with variable summary statistics, are in English, followed by a Latvian language equivalent, separated by the underline symbol.
Variable definitions:
- Age2022_Vecums - Age in 2022
- 2022YrsInDiabRegistry_GadiCD2Reģ - Number of years in diabetes registry as of 2022
- 2021_2022CVDInPatient_StacSAS - Number of in-patient hospital stays in 2021-2022 with an ischemic heart disease-related primary diagnosis
- 2021_2022InPatientNonCVD_StacCiti - Number of in-patient hospital stays in 2021-2022 without an ischemic heart disease primary diagnosis
- 2021OutPatient_Ambul - Number of out-patient visits with family doctor in 2021
- 2022OutPatient_Ambul - Number of out-patient visits with family doctor in 2022
- 2022OutPatientSpec_AmbulSpec - Number of out-patient visits with a specialist in 2022
- 2022PrescrFilled_KompMed - Number of prescribed and dispensed reimbursed medicines in 2022
- 2021PrescrFilled_KompMed - Number of prescribed and dispensed reimbursed medicines in 2021
- 2021OutPatientSpec_AmbulSpec - Number of out-patient visits with a specialist in 2021
- 2021AmbulCalls_NMPD - Number of ambulance calls in 2021
- 2022 AmbulCalls_NMPD - Number of ambulance calls in 2022
Of all the patients in the data 62% were women, 38% men. The remaining predictor variables had the characteristics shown in Table 1 above.
Model Fit
Three methodologies were investigated for this article: logistic regression, Random Forests, and XGBoost.
Logistic regression was designated as a baseline, however due to missing values in one of the predictor variables, the logistic model was estimated on a slightly different training data set than the other models. Eleven data rows had no data on the number of years since a patient was entered into the diabetes patient registry and because of this the model failed. Two alternative fixes were tested: deleting this entire variable from the predictor list and deleting only the data rows with missing values. The logistic regression model produced an AUC result in OOS validation of 0.71 in both cases.
The RF and XGBoost methodologies were applied to the full training data set, including rows with missing values for the number of years since a patient was entered into the diabetes patient registry. In OOS validation the RF algorithm returned an AUC of 0.70 and XGBoost AUC was 0.71. When applying the Hanley & McNeil method for parametric estimation of AUC Standard Error given the data in our validation data set we obtained 0.0097 and a 95% Confidence Interval of AUC +/- 0.019.
Thus the three methodologies produced statistically indistinguishable model fit, when measured by model AUC. The AUC we obtained is also clearly greater than the 0.50 and 0.60 benchmarks.
Figure 1 below shows the ROC curve and AUC result for the XGBoost model.
Predictor Variable Importance
Because of differences in model architecture the three methodologies have different ways of showing variable importance. In logistic regression the modeler can use coefficient magnitude to rank variable importance where the coefficient represents the effect of a unit change in the independent variable on the log odds ratio of the predicted outcome. This becomes problematic if the independent variables have very different scales – a predictor with a small range of values can produce a larger coefficient than another with wider range, even if they have similar predictive power. To avoid this scaling problem we applied mean standardization to our predictors in the logistic model, whereby the data were recalculated as the number of standard deviations from the mean for each variable.
The RF model, however, has no coefficients, but the algorithm records how often each variable is chosen to create a subgroup’s split and this can be used as a ranking mechanism. The XGBoost model also does not produce coefficients, however its implementation in KNIME offers a variable importance ranking that is based on each variable’s individual contribution to overall model accuracy: “Total gain”, the total magnitude of improvement in model error after the variable is included.
To compare the predictive power of each independent variable across model types they were ranked according to the criteria explained above, beginning with logistic. Rankings were obtained from the training data set. See Table 2 below:
It should be noted that the logistic model had a large negative intercept term that reflects a low sample-wide base incidence of the modeled outcome. All the predictor variable coefficients had positive signs, indicating an increase in ischemic heart disease hospitalization risk relative to the base. For the Gender variable males were identified by the logistic model as being higher risk.
In the logistic model Gender had the second largest contribution to prediction probability, but this variable was at the bottom of the list for the other two models.
All three models were in agreement that among the top three predictors of future ischemic heart disease hospitalization risk, using administrative healthcare data, is the number of these events in the previous 24 months – first for RF and XGBoost, third for logistic. However, the algorithms produced differing variable rankings for the remaining top predictors. For example, XGBoost and logistic also found age to be among the top three while RF did not.
Overall, there was little similarity in the importance rankings: the Spearman rank correlation was 0.15 between XGBoost and RF. The logistic ranking is not directly comparable to the other two, since three of its 13 prediction coefficients were statistically not significant at the 95% level, i.e., indistinguishable from zero, yet these variables remained useful for XGBoost and RF.
Visualization of Partial Dependence
As previously noted, RF and GBM machine learning algorithms are not sensitive to some of the limitations of the traditional logistic model – they accept missing values in the data matrix, do not assume a linear correlation between independent and dependent variables, and can handle multicollinear independent variables. These properties make them attractive to data science practitioners where the purpose is to predict rather than to explain. Nevertheless, there are instances where the model user community asks for an understanding of how individual predictors affect the model’s outcome. To address this need the modeler can use Partial Dependence Plots (PDP) to show the relationships between predictor variables and model predictions.
In a traditional regression model the coefficient represents the estimated numerical effect of a single variable, with all other variables held constant, and the effect is considered to be the same across the full range of the independent variable. The PDP replicates this logic, but without the assumption of constant impact across predictor values and without creation of a coefficient value.
The technical construction of a PDP is computationally intensive. For each variable of interest the method creates synthetic data observations containing permutations of the chosen variable over its observed range without changing any other elements of the data row. This is repeated for all data rows in the original data matrix. So, for example, if the original data matrix contains 1000 rows and the PDP specification calls for 100 permutations of a chosen variable the process will end up with a data set containing 100 000 rows.
Upon conclusion the process enables graphing the model’s predictions against a plausible range of values in the variable of interest, assuming that nothing else in the data changes. This is a purely computational exercise and assumes no prior mathematical shape for the exhibited relationship. In some cases there is an observable trend, in others there is not, which can indicate a subordinate role in the prediction calculation.
To illustrate, Figure 2, Figure 3, Figure 4 and Figure 5 show the PDP graphs for the top four predictor variables in the XGBoost model:
- Number of in-patient hospital stays in 2021-2022 with an ischemic heart disease diagnosis
- Age in 2022
- Number of years the patient was in the diabetes registry as of 2022
- Number of prescribed and dispensed reimbursed medicines in 2022
In Figure 2 the reader’s eye is naturally drawn to the thick blue line that rises from left to right with irregular slope changes. This shows the mean predicted outcome probability for the value of the variable on the X axis, assuming that all other factors are unchanged. The black points mark the specific predictions for data rows at each level of the predictor variable, depicting their range and dispersion. In this instance we observe that the model would, on average, show a future ischemic heart disease hospitalization probability of about 0.12 for patients with no prior ischemic heart disease hospitalizations in 2021-2022. However, the range of possibilities reaches to 0.50 and above, which indicates the influence of other predictors. For patients having one past ischemic heart disease hospitalization, the average prediction rises about two-fold - to 0.24, and the range of possibilities shifts upward to reach 0.70. There is a smaller incremental change in the average predicted probability for two and three prior ischemic heart disease hospitalizations, but this is followed by a substantially greater increase at the prior event count of four, where predictions concentrate around 0.47.
The general conclusion from this PDP would be that the range of risk rises dramatically for patients with one prior ischemic heart disease hospitalization, even more with four, but risk prognosis is also affected by other factors which can increase or decrease its magnitude away from the prediction mean. Unlike the traditional logistic regression model, the XGBoost model captures a variable rate of risk increase for this predictor variable.
As we see in Figure 3, patient age is also positively associated with ischemic heart disease complication risk in the XGBoost model, other factors held constant. The rate of increase is less jagged than in the previous instance, but there is a perceptible upward tendency starting around 50 years of age.
The data set contained the year in which a patient was added to the Diabetes Registry and this was used to calculate a proxy for the duration of the patient’s condition. This was the third most important variable for the XGBoost algorithm. The PDP visualization shown in Figure 4 illustrates that this variable, on its own, is a weak predictor. Prediction variability is broad for values less than 25, ranging from zero to 0.70 and above. The mean ischemic heart disease hospitalization risk prediction shows a marked increase at an estimated duration of about 23 years.
An indication of a patient’s overall health condition is the quantity of medications they are prescribed and subsequently dispensed. As such it was included as a predictor in each of the models. The logistic regression model found it to be statistically insignificant and the RF model placed it near the bottom of the list for variable importance. In contrast, the XGBoost algorithm found it to be fourth most important. Nevertheless, the specific influence of the variable is not observable from the PDP, as seen in Figure 5. Mean ischemic heart disease complication risk does not differ by the quantity of medications received by the patient, when other factors are held constant.
Judging from these examples PDP graph utility in our case seems limited. Dominant variable influence is readily visible, while that of supporting variables is not, but these can still be meaningful contributors to a model’s overall predictive power.
4. Discussion
This article is the first published description of data science techniques used to predict future ischemic heart disease hospitalization risk among Latvian type 2 diabetes patients. The work is also unique in that it does not rely on clinical data obtained during a doctor’s visit or a hospitalization. Instead it utilizes administrative data routinely collected and stored in the LHQEMS as Latvia’s National Health Service (NVD) reimburses health care providers for eligible medical expenses [12].
Comparison with Previous Studies
It would be informative to compare this work with previous research on related topics. A recent 2022 scoping study conducted by Ndjaboue et al. identified 116 models discussed in 42 studies published between 2000 and 2020 that were devoted to predicting CVD complications among diabetes patients. [11]. These models used as predictors basic demographics – age, gender, ethnicity, and were often supplemented by life-style information (smoker, non-smoker), and actual clinical data, e.g., body mass index, blood pressure level as well as utilization of specific medications. This suggests that in many cases the data is sourced from hospital systems or caregiver networks, not from a third party like Latvia’s NVD. The scoping study did not provide detailed information on model fit.
Another study, also posted in 2022, focused on the diabetes patient population over a 24 year span in a Wisconsin, USA, hospital system [20]. Here the authors tested predictive models of “fast” versus “slow” complication development, using six different modeling methodologies. The best-fitting models contained a combination of data spanning demographics, lab results, vital signs, and other data. For CVD complication risk assessment their results were nearly identical for each of the tested methodologies: AUC of 0.70. This is about the same result as we obtained in our research. The difference is that the LHQEMS data did not have lab results or vital signs information. This indicates that such routinely collected data, in combination with data science algorithms like XGBoost, may contain informational content about future event risk similar to data obtained from traditional clinical methods.
As previously mentioned, research based on extensive diabetes patient records from the Canadian province of Ontario was published in 2021 by Ravaut et al. [8]. In their study the authors assembled a diverse data set containing 700 data features on more than 1,5 million Canadian diabetes patients spanning an eleven year time frame from 2006 to 2016. Their goal was to “demonstrate the potential of machine learning and administrative health data to inform health planning and healthcare resource allocation for diabetes management”. Due to the nature of the single-payer Canadian health care system, the researchers were able to merge demographic data with data from outpatient doctor visits, hospitalizations, laboratory tests, prescriptions dispensed, emergency room visits, area-level socio-economic characteristics, etc. Their implementation of the XGBoost algorithm on the future 3-year risk of CVD complications produced a variable importance ranking similar to that offered here. The top predictors were age, history of diabetes complications, gender, history of prior CVD events, number and quantity of prescriptions filled in the last two years, and the number of prior emergency room visits. They reported AUC of 0.79-0.80 for their CVD risk model. The reason for a comparably better AUC is likely related to the size of their data set and the greater diversity of predictor variables.
A separate study from 2024 also created complications risk prediction models for Ontario diabetes patients [21]. The authors used a variant of the more traditional proportional hazards methodology to estimate the risk of complication development over a five year time window. In the case of acute myocardial infarction they reported AUC of 0.71 in the validation cohort, for heart failure – a specific subset of CVD events – they achieved AUC of 0.80. As with the previously mentioned research, the authors also had access to demographic, as well as laboratory results data and a variety of clinical and administrative health records variables. The authors mention that “age and diabetes duration are both crucial predictors of diabetes complications”.
In Europe, the SCORE2 risk prediction methodology for CVD events has recently been expanded with adjustments for diabetes patients [22]. The authors report OOS C index accuracy, equivalent to the AUC, of 0.67. However, the SCORE2 method is not directly comparable to ours since the target variable is first-time CVD occurrence over a 10 year horizon, and it also relies on clinical and lab measurements of physiological and biochemical markers. Another difference is that the SCORE2 system is based on data from UK patient records, supplemented with numerical adjustments for broad European geographical regions. Our models, by contrast, are built from Latvia’s area-specific data.
Model Ability to Identify Future Ischemic Heart Disease Hospitalization Risk
At the end of the day, it is a model’s general predictiveness, i.e., its credibility that matters most. To illustrate, in Figure 6 we ranked data rows from the XGBoost model in ascending order by predicted risk probability and plotted the predicted future risk against the actual observed incidence of ischemic heart disease hospitalization, organizing the data into risk deciles. Two conclusions follow – actual realized frequency closely tracks average predicted incidence (risk) and there is a substantial - more than 40x - difference in actual frequency between the top and bottom risk deciles. Within the highest risk decile the observed ischemic heart disease hospitalization rate exceeded 45%, compared to approximately 1% in the lowest risk decile. This indicates that the model can capably discriminate between risk levels that translate into real and differentiated future adverse event incidences.
The Brier score for this model computes to 0.08. This is a model evaluation method applied to binary prediction solutions with scores ranging from zero to one, with the best scores closer to zero. The score depends on the average magnitude of the squared difference between predicted outcome probability, a number ranging from zero to one, and the actual outcome which is binary (0,1). By comparison, the Brier score for a model without predictive power where predictions are replaced with random numbers calculates as 0.33.
Model Limitations
It is important to note that our prototype models are not meant to explain or quantify the causal biomedical factors underlying ischemic heart disease hospitalization events among type 2 diabetes patients in Latvia. Our models demonstrate the feasibility of generating useful risk predictions from administrative LHQEMS data that could potentially be incorporated into a medical practitioner’s work flow as an advisory tool. Predictive models are not designed to be explanatory or diagnostic, their primary function is to capture numerical relationships among variables that in some configuration reliably predict a future event [23]. They should not be treated as a substitute for the findings of fundamental biomedical research. Nevertheless, we believe that predictive models of this type are viable candidates for augmenting the doctor’s or patient’s understanding of one’s risk level.
Potential Model Utilization
In the context of Latvia’s health care system two potential and complementary model deployment paths suggest themselves: a patient-oriented one and a physician-oriented one. Both could be based on similar data sets and algorithms, but the form of information delivery might differ.
Latvia’s Health Ministry currently offers an E-Health portal to residents, which stores and presents to an authorized user information about a patient’s chosen doctor, prescribed medications, and lab test results [24]. This channel could also be used to post notifications and reminders to patients with elevated risk to schedule a doctor’s visit, for example, and to observe their health care regimen.
E-Health is also accessible to medical personnel and a more detailed description of a patient’s risk profile could be offered them here. It would also be technically possible to offer family doctors a periodic batch feed with a list of all their NVD-registered diabetes patients indicating an elevated ischemic heart disease hospitalization risk. This could promote utilization of proactive, preventive health care strategies. To receive this information, physicians would not be burdened with additional data gathering responsibilities.
It should also be noted that the risk scoring results are applicable to the population contained in the model development data. Our prototype models would be inapplicable to clients of Latvia’s private clinics and voluntary private health insurance plans since their health care utilization data is generally not included in the LHQEMS dataset. This would also be the case for patients who elect to pay for medical services using out-of-pocket cash.
In the future, however, private health care providers could benefit from a model like this, if they contributed their patient data to the base LHQEMS model development data set.
At a governmental and ministerial level, this and similar predictive models for other conditions could assist in the budget planning process and the allocation of government-funded health care resources by specialty and, to some extent, by geography. Rather than relying primarily on past history, planners could also take into account expected future frequency of costly medical events and adjust accordingly.
A technical implementation plan is beyond the scope of this article, but we can envision some of its elements. First would be the creation of a secure modeling data hub with inputs from the existing NVD data sources and outputs feeding into the E-Health system. This data hub would be accessed by authorized data scientists for predictive model development, maintenance, and updates. Existing data pipelines would need to be augmented or new ones built to connect the modeling data hub with source and destination systems. There would also need to be a defined, but modifiable process for model scheduling and a data delivery calendar. Supplementing the technical processes would be informational material for patients and practitioners about the use and meaning of predictive models.
5. Conclusions
This article set out to test the proposition that the data stored in LHQEMS data sets contains sufficient information to support models predictive of near-term ischemic heart disease hospitalization risk among Latvia’s type 2 diabetes patients. We conclude that the proposition holds. Three different modeling methodologies were tested on an anonymized population of Latvian type 2 diabetes patients who utilize publicly funded healthcare services, with models achieving an OOS AUC of 0.70-0.71. Such model fit is similar to that achieved in comparable studies available in the scientific literature.
Our models differ in some respects. The forecast window is narrower than in other studies – two years, optionally one year, whereas other studies have forecast windows of three, five, and ten years. A model such as our prototype model could thus enable the identification of patients with the greatest near-term risk and could assist physicians as they prioritize their current patient treatment strategies. Another difference is that our predictor variables are drawn from a two year time frame, reflecting the patient’s most recent history and do not require additional lab tests or a doctor’s visit. Other studies report using predictor variables derived from eleven or even as much as 24 years of data. For model deployment, a narrower observation window can be easier to implement from an IT perspective and may alleviate user concerns about possible changes or disruptions in data labeling practices that occurred in the past, such as, for example, during the COVID-19 pandemic.
Our analysis of anonymized data suggests that there are approximately 8 000 – 10 000 Latvian type 2 diabetes patients in the top risk decile of the patient population with an elevated (40%-45%) probability of ischemic heart disease-related hospitalization over the next two years. We think that subsequent research could verify the persistence of this risk decile in more recent 2025 data and, when possible, 2026 data.
Additional research might also investigate the characteristics of this top risk group and the feasibility and potential benefits of targeting them for additional monitoring and proactive, preventative care. This could take the form of a pilot project to identify them in the original NVD data with the goal of field-testing alternative patient communication and physician intervention strategies for pro-active risk mitigation. Using experimental design techniques such as a controlled roll-out, for example, their results could be compared with current, ongoing healthcare practices.
Potential Model Improvements
There is the possibility of improving our model fit. Further research could test the predictive utility of comorbidity variables from the patient’s healthcare history, as well as geolocation data referencing the patient’s declared place of residence. This would involve non-trivial data engineering work. The NVD data stores do not contain a pre-built structured representation of comorbidity classes such as the Charlson index, so this would need to be replicated in some form [25]. Geolocation data in Latvia follows more than one schema, which would need to be reconciled, summarized, and categorized to reduce hyper-dimensionality. Another geography-related issue in the LHQEMS data is that it references a patient’s declared place of residence which may be different than their actual place of residence.
On balance, though, we believe that the method and results presented here are sufficiently robust for consideration in systems development work and potential implementation in Latvia’s healthcare system. Other countries with access to similar data sets might also benefit from this approach, reducing their dependence on commercial solutions while improving the overall accuracy of their predictive model portfolio.
Author Contributions
Conceptualization, U.S. and A.D.; methodology, U.S. and A.D.; software, U.S.; validation, U.S.; formal analysis, U.S.; investigation, U.S., A.D. and J.P.; data curation, U.S. and A.D.; writing—original draft preparation, U.S., A.D. and J.P.; writing—review and editing, U.S., A.D., O.R.; visualization, U.S.; project administration, U.S., A.D. All authors have read and agreed to the published version of the manuscript.
Funding
This research received no external funding.
Data Availability Statement
Restrictions apply to the availability of these data. Data were obtained from the Health Care Monitoring Datalink (HCMD) which is sponsored by the Centre for Disease Prevention and Control (CDPC) of Latvia’s Ministry of Health under five-party agreement between CDPC, the National Health Service, the State Emergency Medical Service and Health Inspectorate. Access to this research data can be requested from the data governance committee. For instructions please visit https://med.oranzais.lumii.lv/in_english.html.
Acknowledgments
The authors gratefully acknowledge the Latvia’s Centre for Disease Prevention and Control, particularly Jolanta Skrule, for data preparation; the Riga Stradiņš University Methodological Centre for Family Medicine for developing the methodology for the analysis of routinely collected healthcare data; and Professor Anda Ķīvīte-Urtāne, Director of the Riga Stradiņš University Institute of Public Health, for her support and guidance in scientific writing and manuscript preparation.
Conflicts of Interest
The authors declare no conflicts of interest.
Abbreviations
The following abbreviations are used in this manuscript:
| CVD | Cardiovascular disease |
| ML | Machine learning |
| ROC | Receiver operating characteristics |
| AUC | Area under the curve |
| RF | Random forests |
| GBM | Gradient boosting machines |
| OOS | Out of sample |
| NVD | National Health Service (Nacionālais Veselības Dienests) |
| LHQEMS | Latvia Health Quality and Efficiency Monitoring System |
| SPKC | Centre for Disease Prevention and Control (Slimību Profilakses un Kontroles Centrs) |
| EHR | Electronic health records |
| PDP | Partial dependence plot |
References
- International Diabetes Federation. Diabetes facts & figures. Available online: https://idf.org/about-diabetes/diabetes-facts-figures/ (accessed on 14 July 2026).
- Bourey, R.E.; Kaw, M.K.; Lester, S.G.; Najjar, S.M. Diet, Exercise, and Chronic Disease: The Biological Basis of Prevention. Diabetes 2014. [CrossRef]
- Dal Canto, E.; Ceriello, A.; Rydén, L.; Ferrini, M.; Hansen, T.B.; Schnell, O.; Standl, E.; Beulens, J.W.J. Diabetes as a cardiovascular risk factor: An overview of global trends of macro and micro vascular complications. European Journal of Preventive Cardiology 2019, 26, 25–32. [CrossRef]
- Farooqi, A. Primary care: The custodian of diabetes care? Practical Diabetes 2012, 29, 286–291. [CrossRef]
- Latvian Centre for Disease Prevention and Control. Diabetes patient register by type and region. Available online: https://statistika.spkc.gov.lv/pxweb/lv/Health/Health__Saslimstiba_Slimibu_Izplatiba__Cukura_diabets/CDG010_tips_regions.px/table/tableViewLayout2/ (accessed on 14 July 2026).
- Kee OT, Harun H, Mustafa N, Murad NAA, Chin SF, Jaafar R, Abdullah N. Cardiovascular complications in a diabetes prediction model using machine learning: a systematic review. Cardiovasc Diabetol. 2023;22:13. [CrossRef]
- Silva K, Lee WK, Forbes A, Demmer RT, Barton C, Enticott J. Evaluation of machine learning methods developed for prediction of diabetes complications: a systematic review. J Diabetes Sci Technol. 2021;15(3):1-16. OSF registration: 10.17605/OSF.IO/UP49X.
- Ravaut M, Sadeghi H, Leung KK, Volkovs M, Kornas K, Harish V, Watson T, Lewis GF, Weisman A, Poutanen T, Rosella L. Predicting adverse outcomes due to diabetes complications with machine learning using administrative health data. NPJ Digit Med. 2021 Feb 12;4(1):24. [CrossRef] [PubMed] [PubMed Central]
- Eini, P., Eini, P., Serpoush, H., & Rezayee, M. (2025). Diagnostic Performance of Machine Learning Algorithms for Predicting Heart Failure in Diabetic Patients: A Systematic Review and Meta-Analysis. Endocrinology, diabetes & metabolism, 8(5), e70111. [CrossRef]
- Nkhoma DE, Soko CJ, Bowrin P, Manga YB, Greenfield D, Househ M, Li YC, Iqbal U. Digital interventions self-management education for type 1 and type 2 diabetes: : a systematic review and meta-analysis. Comput Methods Programs Biomed. 2021;210:106370. [CrossRef]
- Ndjaboue, R, et al. J Epidemiol Community Health 2022;76:896–904. [CrossRef]
- Latvijas Universitātes un Slimību Profilakses un kontroles centra sadarbības projekts „Veselības aprūpes kvalitātes un efektivitātes publiskās monitorēšanas sistēmas izveide”. https://med.oranzais.lumii.lv/index.html.
- OECD State of Health in the EU LATVIA Country Health Profile 2025 https://eurohealthobservatory.who.int/publications/m/latvia-country-health-profile-2025.
- Efron, B.; Hastie, T. (2016) Computer Age Statistical Inference, Cambridge University Press.
- Fregoso Aparicio et al. Diabetology & Metabolic Syndrome (2021). 13:148. [CrossRef]
- Chen, T.; Guestrin, C. (2016) XGBoost: A Scalable Tree Boosting System. KDD’16: Proceedings of the 22nd ACM SIGKDD International Conference on Knowledge Discovery and Data Mining, August, 2016, 785–794. [CrossRef]
- https://www.knime.com/.
- https://www.icd10data.com/ICD10CM/Codes/I00-I99.
- Kristin L. Sainani, Explanatory Versus Predictive Modeling, PM&R, Volume 6, Issue 9, 2014. [CrossRef]
- Amanda Momenzadeh, Ali Shamsa, Jesse G. Meyer. Clinical interpretation of machine learning models for prediction of diabetic complications using electronic health records. [CrossRef]
- Shah BR, Austin PC, Ivers NM, Katz A, Singer A, Sirski M, Thiruchelvam D, Tu K. Risk Prediction Scores for Type 2 Diabetes Microvascular and Cardiovascular Complications Derived and Validated With Real-world Data From 2 Provinces: The DIabeteS COmplications (DISCO) Risk Scores. Can J Diabetes. 2024 Apr;48(3):188-194.e5. Epub 2023 Dec 29. [CrossRef] [PubMed]
- SCORE2-Diabetes Working Group and the ESC Cardiovascular Risk Collaboration. SCORE2-Diabetes: 10-year cardiovascular risk estimation in type 2 diabetes in Europe. Eur Heart J. 2023 Jul 21;44(28):2544-2556. [CrossRef] [PubMed] [PubMed Central]
- Kristin L. Sainani, Explanatory Versus Predictive Modeling, PM&R, Volume 6, Issue 9, 2014. [CrossRef]
- https://eveseliba.gov.lv/sakums.
- Mary E. Charlson, Danilo Carrozzino, Jenny Guidi, Chiara Patierno; Charlson Comorbidity Index: A Critical Review of Clinimetric Properties. Psychother Psychosom 18 January 2022; 91 (1): 8–35. [CrossRef]
Figure 1.
XGBoost ROC Curve, out-of-sample validation data set.
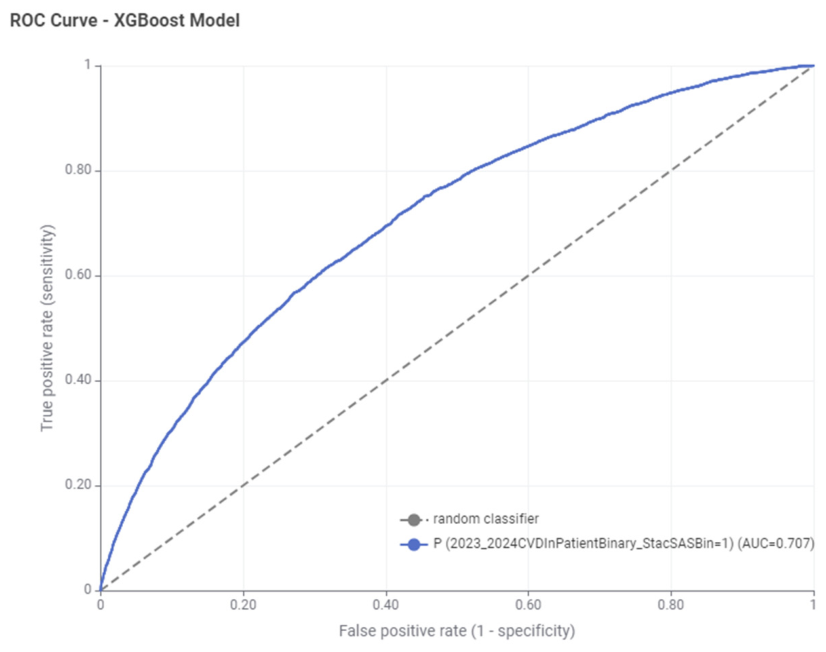
Figure 2.
XGBoost PDP plot for the number of in-patient hospital stays in 2021-2022 with an ischemic heart disease-related diagnosis.
Figure 2.
XGBoost PDP plot for the number of in-patient hospital stays in 2021-2022 with an ischemic heart disease-related diagnosis.
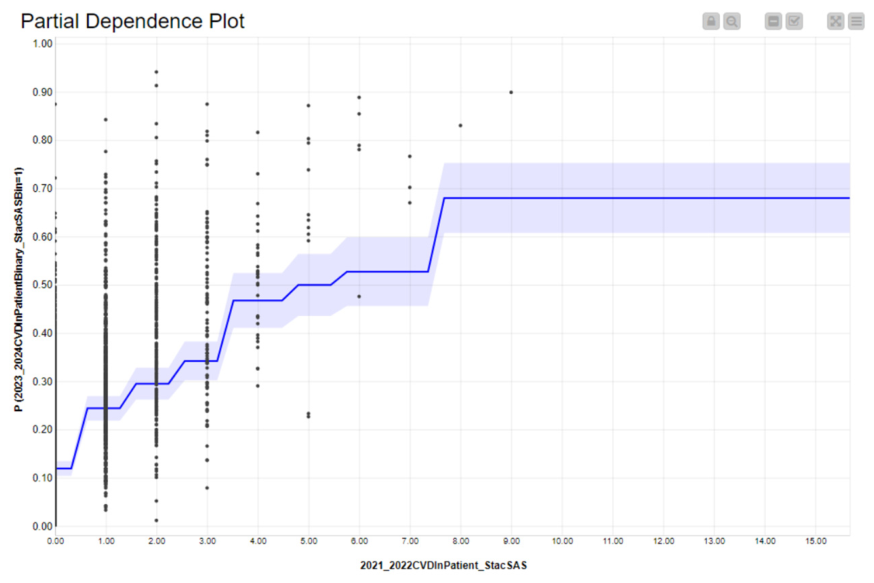
Figure 3.
XGBoost PDP plot for patient age in 2022.
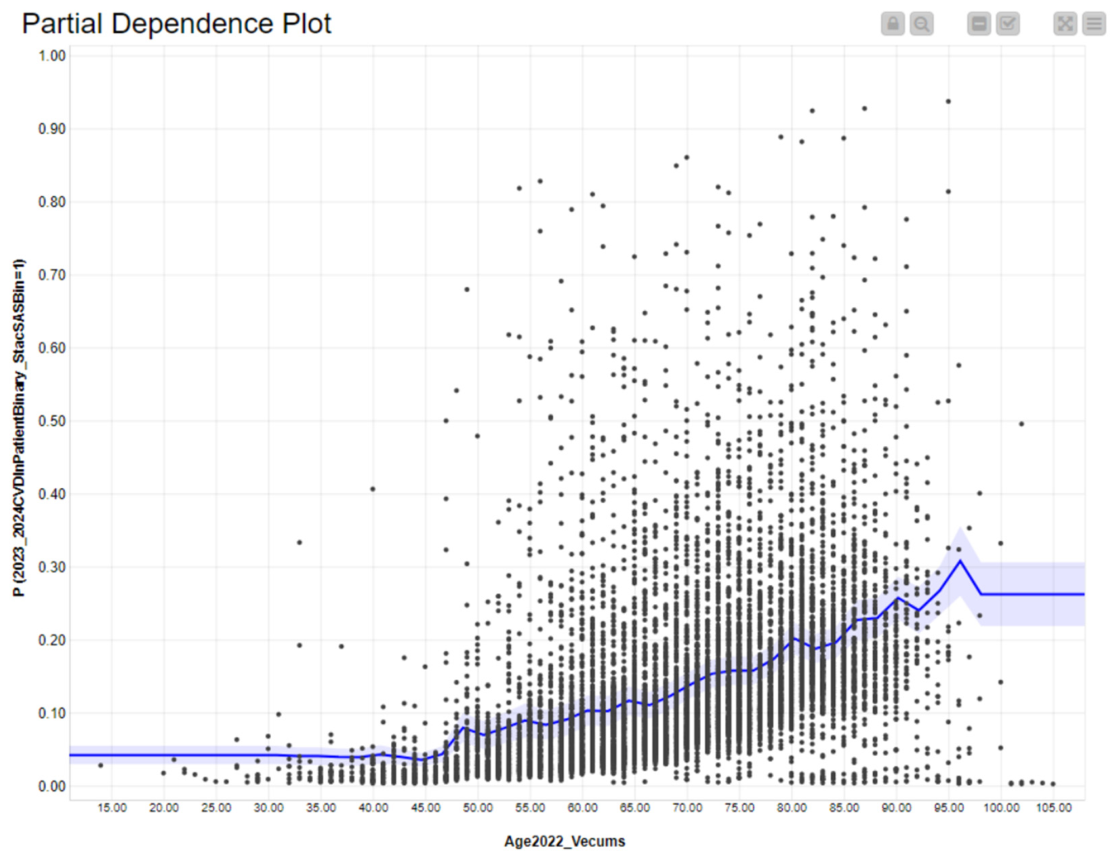
Figure 4.
XGBoost PDP plot for the number of years the patient was in the diabetes registry as of 2022.
Figure 4.
XGBoost PDP plot for the number of years the patient was in the diabetes registry as of 2022.
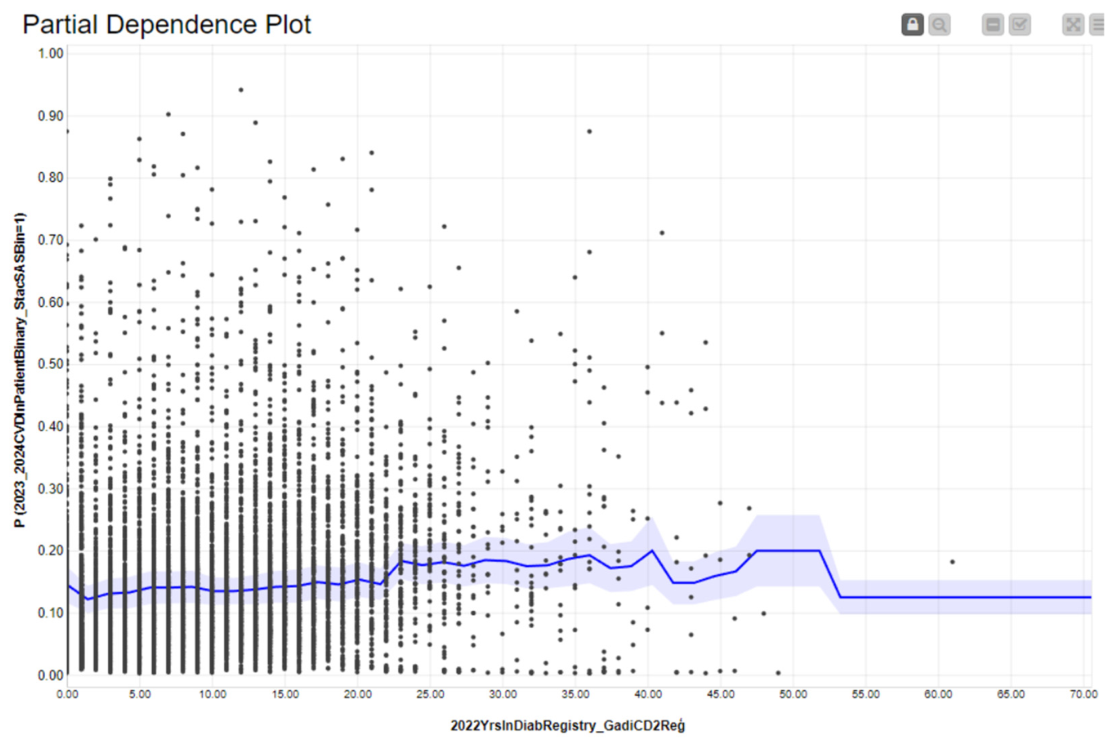
Figure 5.
XGBoost PDP plot for the number of prescribed and dispensed reimbursed medicines in 2022.
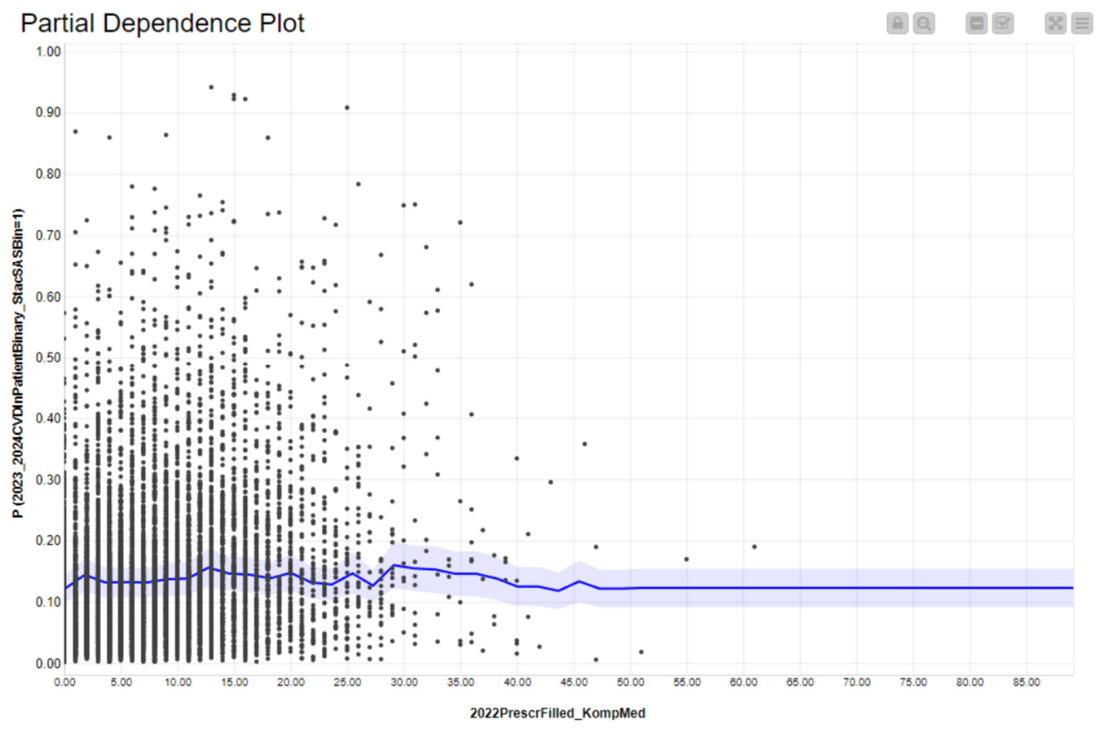
Figure 6.
XGBoost predicted average ischemic heart disease hospitalization in 2022 versus actual incidence in 2023-2024, by risk decile in ascending order.
Figure 6.
XGBoost predicted average ischemic heart disease hospitalization in 2022 versus actual incidence in 2023-2024, by risk decile in ascending order.
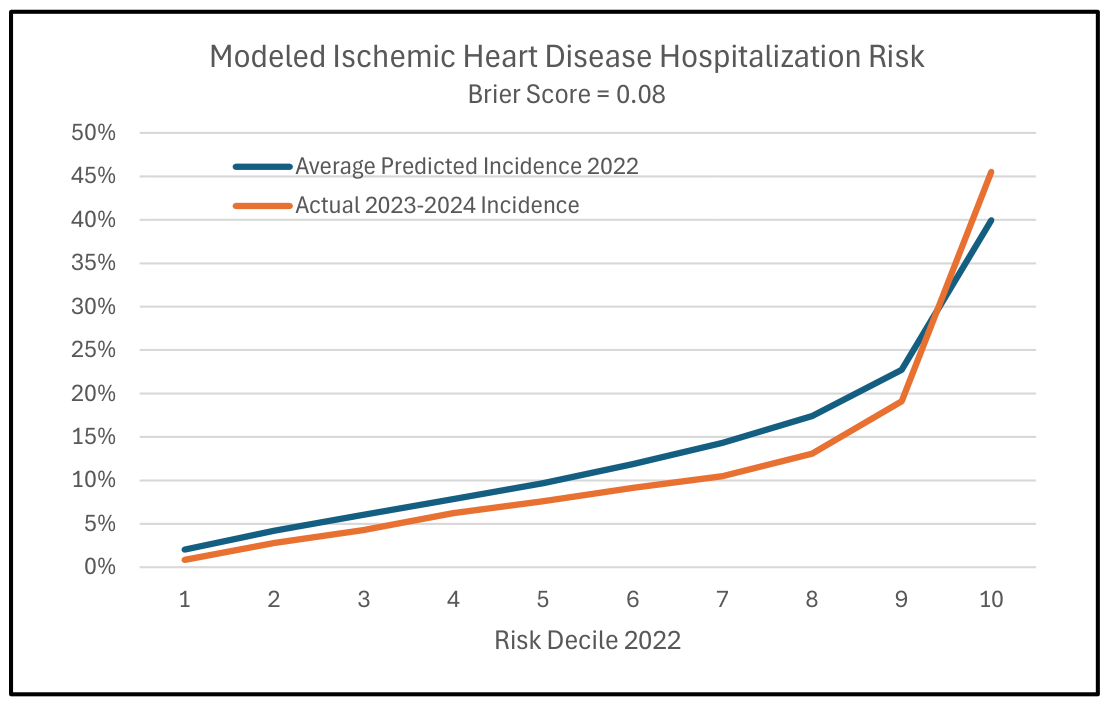

Table 1.
Predictor variable characteristics.
| Variable | Mean | Median | Std. deviation |
| Age2022_Vecums | 69 | 70 | 11.64 |
| 2022YrsInDiabRegistry_GadiCD2Reģ | 10 | 9 | 7.34 |
| 2021_2022CVDInPatient_StacSAS | 0.2 | 0 | 0.60 |
| 2021_2022InPatientNonCVD_StacCiti | 0.1 | 0 | 0.29 |
| 2021OutPatient_Ambul | 5 | 4 | 4.02 |
| 2022OutPatient_Ambul | 5 | 4 | 4.06 |
| 2022OutPatientSpec_AmbulSpec | 1 | 1 | 2.26 |
| 2022PrescrFilled_KompMed | 7 | 6 | 6.64 |
| 2021PrescrFilled_KompMed | 7 | 6 | 6.40 |
| 2022AmbulCalls_NMPD | 0.3 | 0 | 2.2 |
| 2021AmbulCalls_NMPD | 0.3 | 0 | 2.19 |
Table 2.
Predictor variable importance rankings by model methodology.
| Logistic Normalized | XGBoost | Random Forests | |
| Variable | Coefficient Magnitude Rank | Total Gain Rank | Root Level Splits Rank |
| Age2022_Vecums | 1 | 2 | 4 |
| Gender_Dzimums | 2 | 11 | 12 |
| 2021_2022CVDInPatient_StacSAS | 3 | 1 | 1 |
| 2022AmbulCalls_NMPD | 4 | 8 | 3 |
| 2022OutPatient_Ambul | 5 | 7 | 9 |
| 2021PrescrFilled_KompMed | 6 | 5 | 10 |
| 2021_2022InPatientNonCVD_StacCiti | 7 | 13 | 5 |
| 2022YrsInDiabRegistry_GadiCD2Reģ | 8 | 3 | 6 |
| 2022OutPatientSpec_AmbulSpec | 9 | 9 | 13 |
| 2021AmbulCalls_NMPD | 10 | 12 | 2 |
| 2022PrescrFilled_KompMed | Not significant | 4 | 11 |
| 2021OutPatient_Ambul | Not significant | 6 | 8 |
| 2021OutPatientSpec_AmbulSpec | Not significant | 10 | 7 |
Disclaimer/Publisher’s Note: The statements, opinions and data contained in all publications are solely those of the individual author(s) and contributor(s) and not of MDPI and/or the editor(s). MDPI and/or the editor(s) disclaim responsibility for any injury to people or property resulting from any ideas, methods, instructions or products referred to in the content. |
© 2026 by the authors. Licensee MDPI, Basel, Switzerland. This article is an open access article distributed under the terms and conditions of the Creative Commons Attribution (CC BY) license (http://creativecommons.org/licenses/by/4.0/).
Copyright: This open access article is published under a Creative Commons CC BY 4.0 license, which permit the free download, distribution, and reuse, provided that the author and preprint are cited in any reuse.