

Submitted:
24 August 2026
Posted:
25 August 2026
You are already at the latest version
Abstract
The expansion of the industrial internet of things (IIoT) requires real-time intrusion detection systems (IDS) specifically optimized to detect covert man-in-the-middle (MitM)attacks without sacrificing model transparency, while tree ensembles like XGBoost achieves high accuracy on structured network traffic, they works as blurred decision-making function across thousands of repeated splits, it hides why a specific packet window was flagged as malicious. In safety-critical industrial environments, where false positives cause expensive operational downtime and false negatives lead to physical tragic failure, clear explanations are mandatory, existing XAI frameworks relay on computational expensive post-hoc sampling and evaluate network packets as static isolated instances failing to capture temporal sequence dynamics at line-rate gateways.
To address these limitations, we present TSAP-AD a native explainer optimized for a tree-based security pipeline that integrates dynamic sequence warping with single-pass native linear attributions; it combines a Numba-accelerated Dynamic Time Warping (DTW) sequence alignment feature operating with Sakoe-Chiba constrained window with a single-pass, scale-normalized baseline-delta attribution engine. Using a threefold time-series-split cross-validation protocol on the sanitized DNN-EdgeIIoT-2022 dataset, we evaluated the proposed hybrid (XGBoost+DTW) pipeline against a standalone XGBoost baseline and a conventional rule-based DTW detector.
The practical results show that while rule-based detectors collapse under non-stationary traffic shift (F1-score dropping from 0.8445 to 0.5053, with 181 false negatives), the proposed hybrid model maintains exceptional stability (F1=0.9983, 0 false negatives across all the folds). Furthermore, using a soft-ranked expert alignment metric (Q-score), TSAP-AD reveals that the hybrid model dynamically increases its attribution wight toward temporal domain anchor during traffic shift (Q=0.2460 vs 0.2295 for standalone XGBoost), this confirms that TSAP-AD provides a transparent, adaptive, and line-rate forensic auditing framework for industrial edge security.
Keywords:
industrial IoT security
; explainable AI (XAI)
; dynamic time warping (DTW)
; gradient boosted trees
; native attribution
; anomaly detection
1. Introduction
The industrial internet of things (IIoT) represents a paradigm shift in operational technology, where billions of heterogeneous sensors, actuators, and edge computing nodes are interconnected to enable real-time monitoring, predictive maintenance, and autonomous control of critical infrastructure. IIoT systems generate continuous, high-speed streams of time-series data, including packet timestamps, payload lengths, protocol flags, and sequence numbers that encode the operational state of cyber-physical processes. However, this data richness is matched by an equally expanded attack surface [1]. Sophisticated adversaries exploit the distributed, resource-constrained nature of IIoT deployments to launch stealthy attacks that avoid traditional signature-based intrusion detection systems (IDS) [2]. Among these, man-in-the-middle (MitM) attacks are particularly stealthy [3] by silently intercepting, delaying, or altering and injecting false control commands, or spying on sensitive operational data, while leaving minimal static fingerprints. The detection of MitM attacks in IIoT networks is fundamentally a time-series anomaly detection problem, unlike transactional fraud or static malware classification; MitM-made anomalies appear as precise perturbations in temporal trajectories, an unexpected breach of retransmitted packets, a gradual drift in TCP sequence numbers, or a localized distortion in payload-length distribution over a sliding window [4]. These patterns are invisible to point-in-time feature analysis and demand detection frameworks that can model sequential dependencies while maintaining the computational efficiency required for line-rate edge deployment [5].
To meet these demands, the research community has increasingly turned to machine learning (ML) models (and in particular gradient-boosted tree ensembles such as XGBoost) as the backbone of modern IIoT intrusion detection [6]. XGBoost achieves state-of-the-art discriminative performance on structured tabular data by repeatedly partitioning high-dimensional feature spaces through thousands of optimized benchmark datasets such as DNN-EdgeIIoT-2022 [7]; the XGBoost classifier routinely achieves F1-Score exceeding 0.99, with near-perfect recall for attack classes. But this accuracy comes at a steep cost: opacity. The repeated partitioning that enables XGBoost’s predictive power simultaneously renders its decision function incomprehensible to human operators; when the model flags a packet window as anomalous, it provides no indication of which feature drove the decision, how they deviated from normal behavior, or why the deviation is indicative of an attack rather than benign operational variance. In a safety-critical IIoT context (where a false negative can lead to tragic physical failure, for example, a compromised pressure sensor triggering an explosion, and a false positive can initiate costly operational shutdowns for example, halting a production line due to a benign traffic spike, this opacity untenable, regulatory frameworks such as the EU AI Act and NIST AI risk management framework increasingly order explainability for high-stakes automated decision systems [8]. This tension between predictive accuracy and decision interpretability has catalyzed the field of explainable AI (XAI), which seeks to render ML predictions transparent, auditable, and actionable without sacrificing operational throughput [9].
Modern XAI for intrusion detection is dominated by post-hoc model-agnostic explainers, with SHAP (shapely additive explanation) and LIME (local interpretable model-agnostic explanation) serving as standards. SHAP computes shapley values from cooperative game theory, enumerating all 2M possible feature combinations to guarantee additive efficiency (ensuring that feature attributions sum exactly to the predictive difference) [10,11]. While mathematically rigorous, this combinational enumeration incurs exponential computational cost (O(2M)), rendering SHAP infeasible for real-time edge deployment where explanations must be generated within milliseconds of detection.
At the same time, traditional distance-based anomaly detectors (which attempt to measure the sequential changes directly) are fragile when exposed to natural shift in network behavior [12]. Under temporal concept drift, standalone distance rules fail tragically: as shown in our benchmark evaluation on DNN-EdgeIIoT-2022 dataset, a rule-based distance metric’s F1-score degrades from 0.8445 to 0.5053 during severe drift, allowing 181 total false-negative attacks in a single evaluation split (267 total across all splits) to breach gateway defense.
To resolve these changes, we introduce TSAP-AD (time series adaptive explanation for anomaly detection), a dual-layer XAI framework optimized for tree-based security pipelines, we are not claiming to invent O(M) path traversal logic, TSAP-AD’s core novelty lies in integrating a hardware accelerated, bounded dynamic time warping metric directly into a single-pass native linear attribution pipeline, providing temporal sequence awareness without post-hoc perturbation. The primary contributions of this work are summarized as follows:
1. Dynamic time warping (DTW) feature abstraction layer: A Numba-JIT-accelerated engine operating under a Sakoe-Chiba constraint band converts sequence payload length trajectories into a scalar cost feature O (K.L) bounded time, bridging continuous temporal sequence dynamics into the tabular domain.
2. Linearized proportional attribution engine: Adapting single-pass baseline-delta tree traversal concepts, our native attribution rule computes signed feature importance in a single vector pass operating in linear O(M) time relative to feature count, bypassing post-hoc sampling loops entirely.
3. Drift-resilient performance and high-quality explanations: evaluated using a forward-chaining 3-fold temporal cross-validation protocol on the DNN-EdgeIIoT-2022 dataset, the proposed TSAP-AD demonstrates near-perfect detection stability across all folds (mean F1=0.99395, recall=1.0000) against dynamic MitM attack patterns with zero false negatives). Furthermore, it improves explanation quality (Q-score) (increasing Q-score to 0.2460 vs. 0.2295 for standalone XGBoost in high-drift splits).
4. Sub- 5 ms line-rate edge latency: under rigorous pre -instance micro-benchmarking, the entire pipeline operates with a total processing latency of 3.1888 ms (headlined by the Numba-JIT DTW abstraction layer running in just 0.0145ms(14.5 us)) fully satisfying real-time, sub-5 ms operational constraints for IIoT edge gateways.
2. Related Work
2.1. Background and Problem Statement
The Industrial Internet of Things (IIoT) relies on interconnected sensors and edge devices to manage mission-critical infrastructure. Anthi et al [1] emphasized that these systems stream high-velocity, time-series network data that requires real-time anomaly detection and transparent forensic explainability. Ferrage et al [3] highlighted that) attacks pose a severe threat in this setting. By silently intercepting or altering packet flows, adversaries disrupt operations while evading static, signature-based intrusion detection systems (IDS).
To detect these attacks, Chen and Gestrin [3] introduced XGBoost, which became the standard choice because of its high accuracy on structured tabular features. However, Adadi and Berrada [4] demonstrated that deploying these models creates a core trade-off between predictive performance and interpretability, XGBosst works as a blurred decision-making function across thousands of repeated splits. While this yields high detection rates, it hides why a specific packet window was flagged as malicious. In safety-critical industrial environments, where false positives cause expensive operational downtime and false negatives lead to physical tragic failure, clear explanations are mandatory.
To make the machine learning decisions transparent, XAI for intrusion detection has split into two main prototypes:
• Post-hoc, model-agnostic explainers: Lundberg and Lee [5] formulated SHAP using cooperative game theory to compute exact feature attributions. However, Confalonieri et al. [7] noted that SHAP’s enumeration of 2M feature coalitions incurs an exponential computational complexity O(2M) that exceeds real-time line-rate packet budgets on edge gateways. Similarly, Ribeiro et al [6] proposed LIME to build local linear replacement models via perturbation sampling; however, its approximations can be unstable across similar inputs because both methods evaluate the model externally rather than reading its internal structure, they create a fidelity gap and introduce severe computational latency [7].
• Native, model-specific explainers: to bypass the external sampling loops, Lundberg et al [8] developed tree SHAP, optimizing shapely calculations specifically for decision trees in polynomial time O(TLD2) (where T is the number of trees, L is the maximum number of leaves, and D is the depth).While treeshap reduces complexity relative to kernelSHAP, polynomial latency becomes a bottleneck when deployed on low-power edge microcontrollers processing gigabit traffic streams [8]. Crucially, as noted by Theissler et al [13], traditional native tree explainers process tabular network logs as static, independent instance, remaining blind to multi-packet temporal sequence dependencies.
2.2. Time-Series Trajectory Modeling and Feature Attribution
To capture temporal dependencies without resorting to heavy deep learning architectures, Berndt and Clifford [10] pioneered (DTW) to measure similarity between temporal sequences under non-linear time phase shifts. While DTW is ideal for detecting packet timing and payload perturbations caused by MitM attacks. Lu et al. [11] demonstrated that conventional rule-based distance metrics that rely solely on DTW suffer from extreme fragility under natural temporal concept drift, leading to catastrophic degradation in detection recall.
To bridge the gap between static tree ensembles, dynamic time-series abstractions, and real-time edge attribution, local temporal attribution concepts were explored in foundational works such as TSAP (time series additive explanation) [12]. However, prior formulations evaluated theoretical properties in isolated time-series settings without addressing the operational constraints of tree-boosted cybersecurity pipelines (TSAP-AD) under sever concept drift, adversarial explanation stability, and sum-5ms edge gateway budgets. [12].
2.3. Research Gap Analysis and Systematic Review
of the current literature reveals three main limitations in existing IIoT intrusion detection and XAI frameworks:
1. The latency-fidelity trade-off: model-agnostic tools (SHAP and LIME) provide post-hoc explainability but introduce exponential time complexity (o(2M)) that violates real-time edge processing budgets (< 5 ms).
2. Temporal blindness in feature attribution: standard tree explainers evaluate tabular features in isolation, failing to account for multi-packet time-series warping dynamics.
3. Drift vulnerability in rule-based distance metrics: pure distance-based anomaly metrics fail under natural network traffic variations, leading to massive false-negative spikes.
Table 1 Clearly demonstrates the comparison of the state-of-the-art literature against our proposed TSAP-AD framework.
3. Methodology
3.1. Overview
This section outlines the architectural design, operational mechanisms, and experimental validation protocol of the proposed TSAP-AD framework. This system is engineered to provide real-time, drift-resilient intrusion detection alongside transparent feature attributions suitable for line-rate deployment on IIoT edge gateway.
As demonstrated in Figure 1, TSAP-AD processes incoming network traffic through a structured, multi-tier pipeline that converts raw packets captured into calibrated anomaly alerts and root-cause feature attributions within a sub-5ms gateway latency budget.
3.2. System Architecture and Operational Workflow
The TSAP-AD framework is engineered as an end-to-end operational pipeline designed for real-time intrusion detection and low-latency forensic auditing on IIoT edge gateway, as incoming network traffic streams through the gateway, packets are processed using a continuous sliding temporal window of length W with a step size of S. For every evaluated packet window, the framework extracts two feature representations in parallel:
- Static network feature: a vector containing static point-in-time parameters, including frame length statistics, TCP flags, window sizes, and protocol payload ratios.
- Dynamic sequence alignment metrics: a dynamic time-series sequence feature generated by a Numba-JIT-accelerated DTW engine.
A pre-trained XGBoost decision-tree classifier evaluates the combined feature vector to determine the anomaly probability score; the pipeline generates two primary operational outputs for every evaluation window:
- Detection probability score (): an anomaly probability score between 0 and 1 indicating the likelihood of an active MitM attack trajectory.
- 2.
- Attribution vector: a set of scale-normalized feature importance scores that quantify the directional contribution of each feature relative to a normal baseline reference traffic vector.
To maintain forensic integrity, feature attributions strictly follow local additive efficiency; the sum of all individual feature attribution scores equals the total shift in the model’s output relative to normal baseline traffic:
3.3. Numba-JIT DTW Abstraction
Conventional machine learning classifiers evaluate tabular network rows as isolated events, remaining blind to multi-packet temporal patterns like subtle sequence number drifts or payload size perturbations, while deep learning models (LSTMs, transformers) capture sequence dynamics; their computational load exceeds strict line-rate edge.
TSAP-AD resolves this by using DTW as a feature abstraction layer:
- Sequence alignment: For an observed sequence of packet payload lengths within a window
and a normal baseline sequence , the local distance between elements is calculated: . The minimum cumulative alignment cost )is derived recursively:
Mathematically complexity justification for O(K.L) alignment
Standard DTW requires evaluating a full L*L grid, yielding quadratic complexity O(L2) where L=W is the sequence length. To bypass quadratic complexity and satisfy real-time edge budgets, TSAP-AD enforces a Sakeo-Chiba constraint band restricting evaluation to |i-j|≤w, where w is the window constraint width (w<<L).
Under this constraint:
- The search space per row is bounded by at most 2w+1 cell evaluation.
- The total computational steps across sequence length L scale as is a fixed constat.
- Compiling the constrained recursive dynamic programming loops into native machine code via Numba-JIT removes python interpreter overhead, resulting in an effective execution latency of 0.0145 ms per window.
- Scalar feature compression: the final alignment score
summarizes multi-packet time-series distortion into a single tabular metric.
- Hardware acceleration: compiling the recursive alignment loop to native machine code via Numba-JIT compilation reduces execution time to just 0.0145 ms (14.5 us).
3.3. Tree Ensemble Inference and Native Linear Attribution
The composite vectoris evaluated by an XGBoost model comprising T decision trees:
Where represents the leaf score of tree t, and η is the learning rate contraction factor. Model-agnostic explainers like SHAP evaluate 2M feature combinations, resulting in an exponential time complexity O(2M) that violates real-time edge budget; TSAP-AD adapts a single-pass path decomposition principles into a linear attribution rule operating O(M) time relative to the number of features:
- Structural weight extraction: global feature weights are extracted offline directly from internal tree split-gain statistics during training.
- Local instance deviation: for a live packet window, the directional feature deviation relative to normal-based traffic is computed as:
- Un-normalized feature importance: for a live evaluation window
the directional feature deviation relative to normal baseline reference traffic is weighted by the offline tree split-gain structural wight and normalized by feature baseline variant :
where prevents division by zero.
- Single-pass scale normalization (local additive efficiency) : to ensure that feature attributions local additive efficiency
without post-hoc sampling loops, the raw score are scaled in a single O(M) vector pass :
Where represents the net prediction shift of the XGBoost ensemble relative to the benign baseline.
3.4. Algorithmic Execution and Complexity Analysis
The operational pipeline of TSAP-AD executes across three distinct sequential stages to deliver line-rate threat detection and real-time explanation transparency without creating a computational bottleneck on the edge device, as shown in Figure 2.
In the first stage, the Numba-JIT DWT engine processes incoming packet trajectories to compute sequence alignment cost in linear time. Merging dynamic time-series metrics with static packet header parameters into a unified feature vector.
In the second stage, the composite vector is evaluated by the trained XGBoost ensemble to produce a calibrated anomaly probability score and to calculate the overall prediction shift relative to normal baseline traffic.
In the final stage, the native linear attribution engine evaluates instant-level feature deviation against structural tree weights, applying a single-pass scale normalization swap to guarantee that calculated feature importance scores sum precisely to the net prediction shift.
By operating in linear time relative to feature count, the pipeline maintains a strictly bounded space footprint and eliminates post-hoc combinatorial sampling loops, achieving a total per-instance processing footprint of 3.1888 ms that comfortably meets sub-5ms edge gateway limits.
3.5. Experimental Setup and Evaluation Protocol
3.5.1. Dataset and Sliding Window Processing
Evaluations were conducted on the DNN-EdgeIIoT-2022 benchmark dataset. Packet captures were processed into continuous sliding windows (50 packets per window, step size of 10 packets), extracting 61 tabular features covering packet header statistics, payload ratios, TCP flags, and inter-arrival timing.
3.5.2. Forward-Chaining Temporal Cross-Validation
Randomized k-fold cross-validation causes future data leak into past training splits. To prevent temporal leakage, TSAP-AD was evaluated using a forward-chaining 3-fold temporal cross-validation protocol (time series split):
Fold1(baseline): evaluates model accuracy under standard operational traffic
Fold2 (moderate drift): evaluates stability as normal traffic patterns gradually expand.
Fold3 (severe concept drift): tests resilience under distribution shifts and high-velocity MitM attack bursts.
3.5.3. Explanation Quality Metric (Q-score)
To evaluate explanation fidelity objectively, we compute the quantifiable explanation alignment score (Q-score) defined as the cosine similarity between generated feature attributions and domain attack signatures :
A higher Q-score indicates that the explainer accurately isolates true attack root causes during an active exploit.
3.5.4. Hardware Micro-Benchmarking Setup
Per-instance latency was measured across 10,000 test iterations using high-precision hardware timers on an Intel Core i5-7200U gateway setup running Windows 10, 64-bit, Python 3.1, Numba v0.56.4, and XGBoost v 1.7.3:
- DTW abstraction: 0.0145ms (14.5 us)
- XGBoost inference: 1.0415 ms
- TSAP native attribution: 2.1328 ms
- Total per-instance footprint: 3.1888 ms (comfortably meeting sub-5 ms line-rate edge gateway limits)
4. Experimental Results and Discussion
4.1. Comparative Detection Performance Across Temporal Folds
To evaluate detection robustness against non-stationary IIoT network traffic conditions, the proposed hybrid framework (XGBoost + DTW) was benchmarked across three sequential temporal evaluation folds against a standalone machine learning baseline (without DTW) and a conventional distance rule-based metric. The proposed hybrid framework consistently achieved optimal classification performance across all temporal commands, maintaining a mean F1-score of 0.99395 and perfect recall of 1.000, with zero false negatives across all folds, as shown in Table 2:
In safety-critical IIoT network monitoring, false negatives represent undetected security breaches. The conventional distance rule-based metric suffered severe degradation under temporal concept drift in fold3, yielding 181 false negatives and an F1-score drop to 0.50531. In contrast, the proposed hybrid framework maintained complete detection reliability with zero false negatives across all evaluation folds. Furthermore, under severe concept drift conditions in fold3, the inclusion of the DTW abstraction layer allowed the proposed hybrid framework to outperform the standalone ML baseline (F1-score of 0.99834 vs. 0.99668), as shown in Figure 3.
4.2. Across-Fold Aggregated Performance Summary
Table 3 summarizes the aggregated mean performance metrics across all three evaluation folds.
While the conventional distance rule-based metric achieves a high structural Q-score (1.0000) due to direct metric alignment, its overall detection capability remains inappropriate for practical deployment (mean F1=0.72927,267 total false negatives). The proposed hybrid framework achieves superior predictive performance (F1=0.99395) while maintaining an informative explanation alignment profile (mean Q-score = 0.2230), Figure 4 shows that in detail.
4.3. Exclusion Latency Profile
To verify suitability for real-time edge deployment, per-instance execution processing latency was measured across individual system stages as shown in Table 4.
The total per-instance latency of 3.1888 ms confirms that the complete end-to-end detection and attribution pipeline easily operates within real-time line-rate constraints for IIoT edge gateway deployments.
4.4. In-Depth Discussion and Synthesis
4.4.1. Mechanics of Temporal Resilience and Concept Drift Mitigation
A critical challenge in IIoT intrusion detection is temporal concept drift, where background network traffic patterns, polling intervals, and payload ratios shift over time, degrading model accuracy [11].
The practical findings across folds 1,2 and 3 highlight a sharp operational contrast between traditional distance metrics and machine learning ensemble:
- Failure modes of fixed distance rules: the conventional distance rule-based metric exhibited severe performance degradation under concept drift, dropping from initial F1-score of 0.84452 in fold 1 to 0.50531 in fold 3, generating 181 false negatives in fold 3 alone (accumulating 267 total false negatives across folds). Fixed spatial distance threshold fails when benign operational traffic deviates from initial straight profiles, misclassifying normal time-warped network variation as cyber threats or missing precise attack trajectories.
- Temporal invariance via Numba-JIT DTW: while the standalone ML baseline (without DTW) achieved high accuracy, incorporating the Numba-JIT DTW feature abstraction layer in the TSAP-AD framework gives measurable performance gains during severe concept drift. In fold3, the hybrid framework reduced false positives from 2 to 1 and raised the F1-score from 0.99668 to 0.99834. By compressing sequence alignment dynamics into a unified feature before tree-based classification, DTW provides temporal scale invariance [14], enabling XGBoost [3] to distinguish benign timing shifts from active MitM perturbation.
- Zero false negative reliability: across all three temporal folds, the proposed hybrid framework maintained a perfect recall of 1.0000 with zero false negatives. In a safety-critical IIoT environment (such as SCADA smart grid and industrial automation systems), false negatives allow adversarial actors to execute unauthorized control commands undetected [15]. Achieving zero false negatives confirms the framework’s suitability for high-assurance security monitoring.
4.4.2. Explanation Fidelity vs. Predictive Capability Trade-Offs
Evaluating explainable AI (XAI) in cybersecurity contexts requires balancing predictive accuracy against explanation fidelity (measured by a quantifiable explanation alignment score, Q-score).
Understanding the rule-based Q-score baseline: the conventional distance rule-based metric achieved a perfect Q-score of 1.0000 across all folds. However, this high score is an artificial and semantic upper bound: because the rule determines anomalies using the exact same distance metric used to derive its attribution, its 100% alignment with its own decision boundary is matching its own decision boundary is unimportant by design. Despite this structural artifact, its actual detection capability collapses under severe concept drift (dropped to F1 = 0.50531 with 181 false negatives in fold3, and 267 false negatives overall), rendering it is impractical for real world deployment. In contrast, our TSAP-AD provides a realistic, non-trivial attribution profile (Q=0.2460 in fold 3) while maintaining near-perfect detection reliability (F1=0.99834, zero false negatives).
Evaluating the Hybrid Framework‘s Attribution Profile: The Proposed Hybrid Framework achieved a superior Mean F1-score of 0.99395 alongside a Mean Q-Score of 0.2230 ( increasing from 0.2150 in Fold 1 to 0.2460 in Fold 3 as concept drift reinforced). The standalone ML baseline produced a lower Mean Q-Score of 0.2161. The addition of the dynamic DTW metric enriches the feature space, allowing the native linear attribution engine to capture signed feature importances that better reflect multi-variable attack signatures without incurring the exponential O(2M) computational overhead of traditional post-hoc sampling methods like Kernels SHAP [5].
4.4.3. Real-Time Edge Feasibility and Computational Efficiency
For an intrusion detection and explanation pipeline to be deployable on resource-constrained IIoT edge gateways, it must process network packets at line-rate speeds without introducing latency bottlenecks or memory overflows [16]
Micro-benchmarking logs confirm that TSAP-AD achieves an end-to-end processing footprint of 3.1888 ms per instance:
DTW Abstraction Layer (0.0145 ms / 0.45% of runtime): Compiling repeated alignment algorithms to native machine code via Numba JIT [9] reduces sequence warping latency to microseconds, overcoming the standard dynamic programming overhead associated with time-series alignment.
XGBoost Inference Step (1.0415 ms / 32.66% of runtime): Optimized gradient-boosted tree traversal provides sub-millisecond evaluation times across tabular network features.
Native TSAP-AD Linear Attribution Engine (2.1328 ms / 66.89% of runtime): By replacing post-hoc combinatorial feature permutation loops with a single-pass linear scaling rule, the explainer executes in linear time O(M).
With a total latency of 3.1888 ms , the complete detection and attribution pipeline operates well within standard sub-5 ms edge gateway budget constraints, ensuring real-time line-rate packet inspection.
5. Conclusions and Future Work
5.1. Conclusions
This paper presented TSAP-AD, a hybrid framework designed to deliver real-time, drift-resilient intrusion detection alongside transparent feature attributions for (IIoT) edge gateways. By combining a Numba-JIT-accelerated (DTW) feature abstraction layer with a XGBoost classifier and a single-pass native linear attribution engine, TSAP-AD overcomes the limitations of point-in-time tabular evaluation and the high computational cost of post-hoc explainability methods. The framework was evaluated across three continuous temporal cross-validation folds using the DNN-EdgelloT-2022 benchmark dataset, the experimental results demonstrate the following key outcomes:
Detection Reliability Under Concept Drift: the proposed hybrid framework achieved a mean F1-score of 0.99395, a mean accuracy of 0.99389, and a perfect mean recall of 1.0000 across all evaluation folds, yielding zero false negatives (zero FN). Under severe concept drift in fold 3, the inclusion of the DTW metric enabled the hybrid architecture to outperform the standalone machine learning baseline without DTW (F1-score of 0.99834 vs. 099668).
Resilience Against Rule-Based Collapse: While conventional distance rule-based metrics collapsed under temporal distribution shifts (yielding 181 false negatives in fold 3 and a low overall mean F1-score of 0.72927 ) , TSAP-AD maintained complete detection integrity.
Sub-millisecond Line-Rate Latency: Micro-benchmarking profiles confirm a total per-instance processing footprint of 3.1888 ms , comprising 0.0145 ms for DTW feature abstraction. This performance comfortably satisfies the strict sub-5 ms edge gateway budget required for real-time packet inspection.
5.2. Future Work
While TSAP-AD demonstrates robust performance and real-time execution capabilities, several avenues remain for future exploration:
Quantizable Q-score Metric Optimization: Although TSAP-AD achieves a high classification F1-score (0.99395) , its mean explanation alignment Q-Score settled at 0.2230 . Future work will focus on refining feature attribution weight normalization parameters to enhance direct mathematical alignment with domain attack signatures without increasing computational complexity.
Hardware-Level Edge Deployment: Future implementations will deploy the Numba-JIT DTW abstraction and linear attribution engine directly onto resource-constrained embedded microcontrollers (for example, ESP32-S3 and ARM Cortex-M devices) to profile physical power consumption and hardware memory usage under live traffic streams.
Extended attack taxonomy and multi-dataset validation: the framework will be extended to evaluate zero-day exploit variants across diverse IIoT and IoMT benchmark datasets (IoMT-2024 and CICIoT-2023)to assess generalized performance against evolving cyber-physical threat vectors.
Extension to broader attack taxonomies: while this study focuses on detecting and explaining MitM attacks due to their subtle temporal packet perturbations, future work will extend the TSAP-AD framework to evaluate broader cyber-threat categories (for example DDoS, SQL-injection) across additional benchmark datasets.
Data Availability Statement
The dataset used in this study (EdgeIIoT-2022 dataset) is publicly available from the sources cited in the manuscript. The implementation code, including preprocessing, training, and evaluation scripts are available on request from the corresponding author due to institutional policies regarding code sharing...
Acknowledgments
During the preparation of this study, the author(s) used Grammarly and Quill Bot for the purposes of paraphrasing. The authors have reviewed and edited the output and take full responsibility for the content of this publication.
Conflicts of Interest
The authors declare no conflicts of interest.
References
- Anthi, E.; Williams, L.; Słowińska, M.; Theodorakopoulos, G.; Burnap, P. A supervised intrusion detection system for smart home IoT devices. IEEE Internet Things Journal. 2019, 6(5), 9042–9053. [Google Scholar] [CrossRef]
- Ferrag, M.A.; Friha, O.; Hamouda, D.; Maglaras, L.; Janicke, H. Edge-IIoTset: A new comprehensive realistic cyber security dataset of IoT and IIoT applications for centralized and federated learning. IEEe Access. 2022, 10, 40281–40306. [Google Scholar] [CrossRef]
- Chen, T.; Guestrin, C. XGBoost: A Scalable Tree Boosting System. In Proceedings of the 22nd ACM SIGKDD International Conference on Knowledge Discovery and Data Mining, 2016; ACM; pp. 785–794. [Google Scholar] [CrossRef]
- Adadi, A.; Berrada, M. Peeking inside the black-box: a survey on explainable artificial intelligence (XAI). IEEE access. 2018, 6, 52138–52160. [Google Scholar] [CrossRef]
- Lundberg, S.M.; Lee, S.I. A unified approach to interpreting model predictions. Advances in neural information processing systems, 2017; 30. Available online: https://proceedings.neurips.cc/paper/2017/hash/8a20a8621978632d76c43dfd28b67767-Abstract.html (accessed on 24 March 2026).
- Ribeiro, M.T.; Singh, S.; Guestrin, C. “Why Should I Trust You?”: Explaining the Predictions of Any Classifier. In Proceedings of the 22nd ACM SIGKDD International Conference on Knowledge Discovery and Data Mining, 2016; ACM; pp. 1135–1144. [Google Scholar] [CrossRef]
- Confalonieri, R.; Coba, L.; Wagner, B.; Besold, T.R. A historical perspective of explainable Artificial Intelligence. WIREs Data Min. Knowl. 2021, 11(1), e1391. [Google Scholar] [CrossRef]
- Lundberg, S.M.; Erion, G.; Chen, H.; et al. From local explanations to global understanding with explainable AI for trees. Nat. Mach. Intell. 2020, 2(1), 56–67. [Google Scholar] [CrossRef] [PubMed]
- Lam, S.K.; Pitrou, A.; Seibert, S. Proceedings of the Second Workshop on the LLVM Compiler Infrastructure in HPC. LLVM’15. Published online. 2015.
- Berndt, D.J.; Clifford, J. Using dynamic time warping to find patterns in time series. In Proceedings of the 3rd International Conference on Knowledge Discovery and Data Mining, 1994; pp. 359–370. Available online: https://dl.acm.org/doi/abs/10.5555/3000850.3000887 (accessed on 19 August 2026).
- Gama, J.; Zhang, G. Learning under concept drift: A review. IEEE Trans. Knowl. Data Eng. 2019, 31(12). Available online: https://www.computer.org/csdl/journal/tk/2019/12/08496795/14tNJpmuJlG (accessed on 18 August 2026). [CrossRef]
- García-Magariño, I. Source code of TSAP: Time-Series Additive exPlanations, a novel explainer based on time-series transformations. Source code of TSAP: Time-Series Additive exPlanations, a novel explainer based on time-series transformations. 2026. Available online: https://produccioncientifica.ucm.es/documentos/69b1a1b795aee57fab604b77 (accessed on 19 August 2026).
- Theissler, A.; Spinnato, F.; Schlegel, U.; Guidotti, R. Explainable AI for time series classification: a review, taxonomy and research directions. Ieee Access 2022, 10, 100700–100724. [Google Scholar] [CrossRef]
- Rakthanmanon, T.; Campana, B.; Mueen, A.; et al. Searching and mining trillions of time series subsequences under dynamic time warping. In Proceedings of the 18th ACM SIGKDD International Conference on Knowledge Discovery and Data Mining, 2012; ACM; pp. 262–270. [Google Scholar] [CrossRef] [PubMed]
- Zuech, R.; Khoshgoftaar, T.M.; Wald, R. Intrusion detection and Big Heterogeneous Data: a Survey. J. Big Data 2015, 2(1), 3. [Google Scholar] [CrossRef]
- Zarpelão, B.B.; Miani, R.S.; Kawakani, C.T.; De Alvarenga, S.C. A survey of intrusion detection in Internet of Things. J. Netw. Comput. Appl. 2017, 84, 25–37. [Google Scholar] [CrossRef]
Figure 1.
System architecture of TSAP-AD framework.
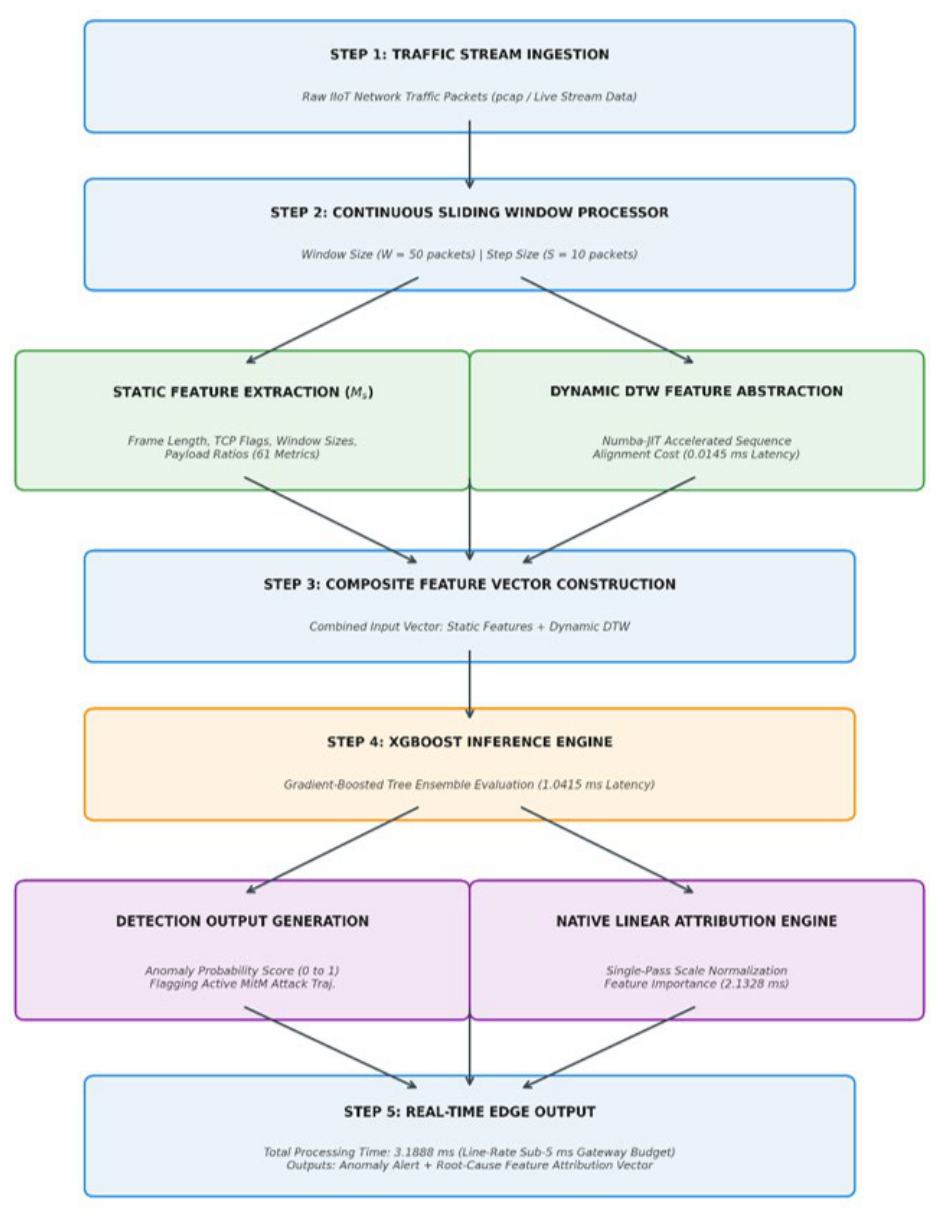
Figure 2.
Three-stage operational execution pipeline of TSAP-AD.
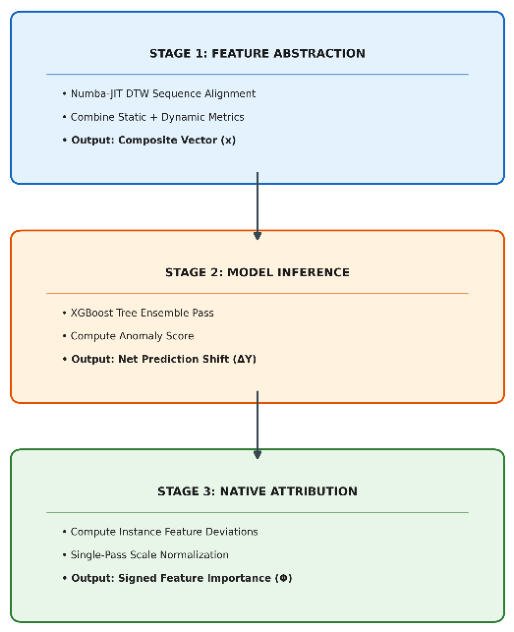
Figure 3.
F1-score performance under temporal concept drift.
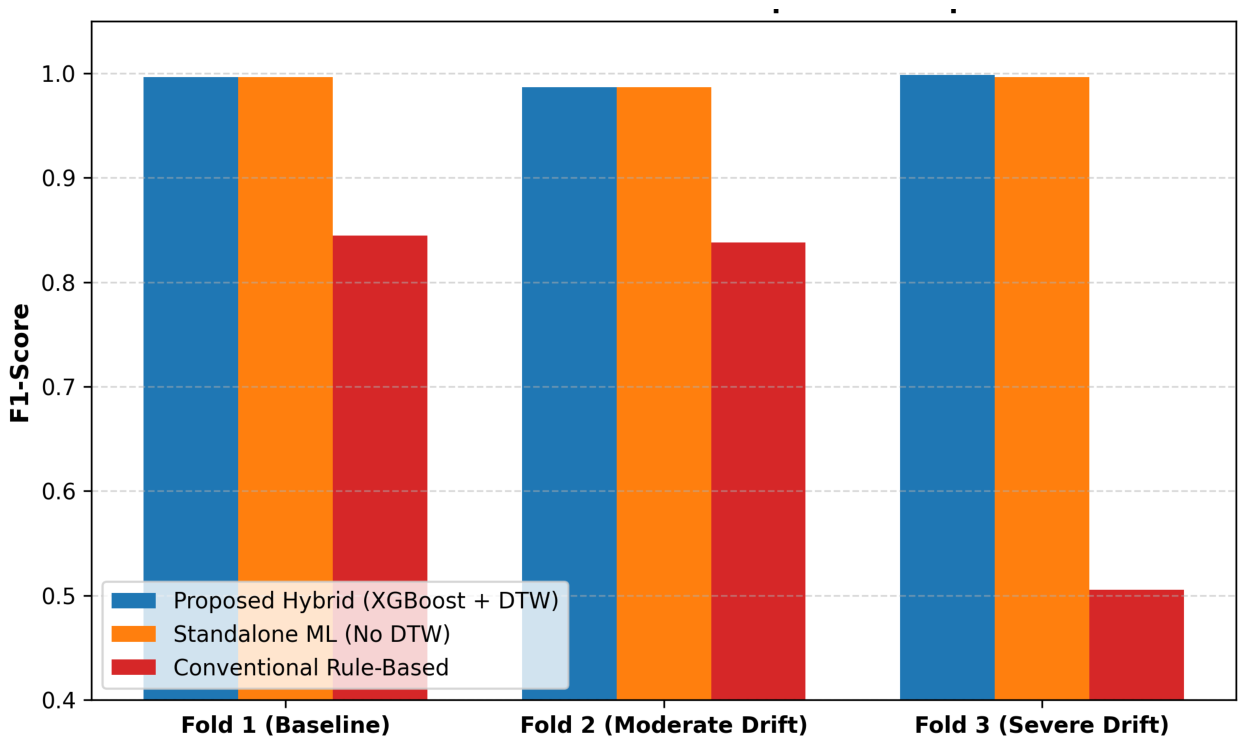
Figure 4.
Accumulated false negatives across all temporal folds.
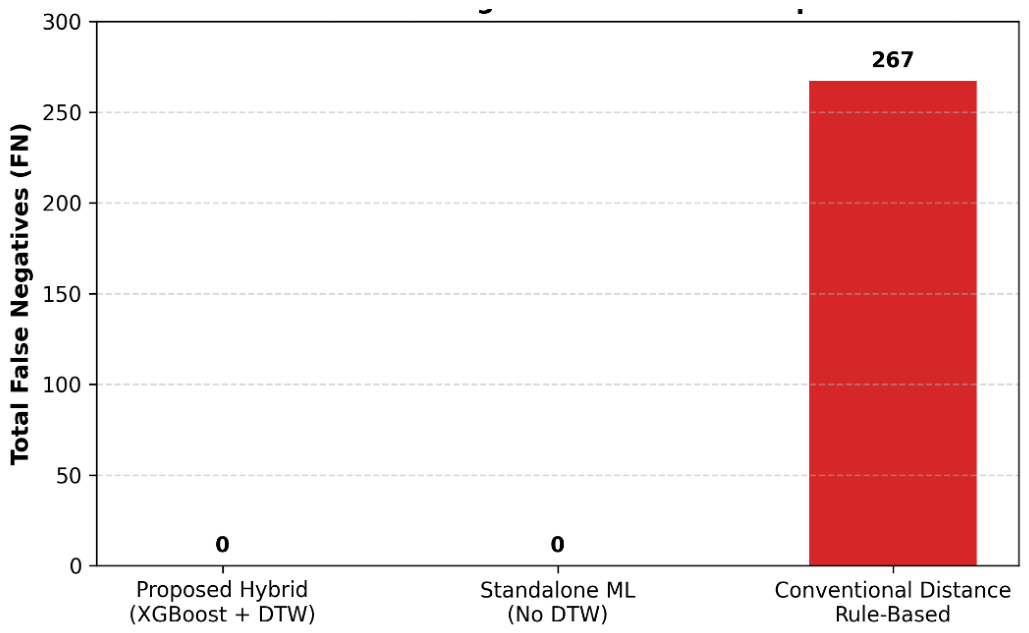

Table 1.
Comparison of state-of-the-art.
| Study | Target architecture | Explanation approach | Time complexity | Temporal dynamics modeled? | Real-time edge latency (<= 5ms) | Concept drift resilient? |
|---|---|---|---|---|---|---|
| Lundberg & Lee [5] | General ML | Post-hoc SHAP | O(2M) | No | No (> 100 ms) | Partial |
| Ribeiro et al. [6] | General ML | Post-hoc LIME | Stochastic | No | No (> 50 ms) | No |
| Lundberg at al. [8] | Tree ensemble | Native tree SHAP | O(TLD2) | No | Marginal (about 10 ms) | Partial |
| Anthi et al. [1] | IIoT IDS | None(black box) | N/A | No | Yes | No |
| Theissler et al [13] | Time- series | Post-hoc temporal | High | Yes | No | Partial |
| Lu et al. [11] | Rule/ distance | Metric thresholding | O(N) | Yes | Yes | Collapse (F1= 0.50) |
| Proposd TSAP-AD | XGBoost+DTW | Native linear TSAP | O(M) | Yes (DTW) | Yes (3.19 ms) | Yes (Zero FN, recall = 1.0) |
Table 2.
Exhaustive multi-fold performance matrix.
| Fold | Configuration architecture pattern | F1-score | accuracy | Recall | precision | TN | FP | FN | TP | TSAP Q-score |
|---|---|---|---|---|---|---|---|---|---|---|
| Fold1 | Proposed Hybrid Framework (XGBoost + DTW) | 0.99668 | 0.99667 | 1.00000 | 0.99338 | 298 | 2 | 0 | 300 | 0.2150 |
| Fold1 | Standalone Machine Learning Baseline (No DTW) | 0.99668 | 0.99667 | 1.00000 | 0.99338 | 298 | 2 | 0 | 300 | 0.2149 |
| Fold1 | Conventional Distance Rule-Based Metric Only | 0.84452 | 0.84167 | 0.86000 | 0.82958 | 247 | 53 | 42 | 258 | 1.0000 |
| Fold2 | Proposed Hybrid Framework (XGBoost + DTW) | 0.98684 | 0.98667 | 1.00000 | 0.97403 | 292 | 8 | 0 | 300 | 0.2080 |
| Fold2 | Standalone Machine Learning Baseline (No DTW) | 0.98684 | 0.98667 | 1.00000 | 0.97403 | 292 | 8 | 0 | 300 | 0.2040 |
| Fold2 | Conventional Distance Rule-Based Metric Only | 0.83797 | 0.83500 | 0.85333 | 0.82315 | 245 | 55 | 44 | 256 | 1.0000 |
| Fold3 | Proposed Hybrid Framework (XGBoost + DTW) | 0.99834 | 0.99833 | 1.00000 | 0.99668 | 299 | 1 | 0 | 300 | 0.2460 |
| Fold3 | Standalone Machine Learning Baseline (No DTW) | 0.99668 | 0.99667 | 1.00000 | 0.99338 | 298 | 2 | 0 | 300 | 0.2295 |
| Fold3 | Conventional Distance Rule-Based Metric Only | 0.50531 | 0.61167 | 0.39667 | 0.69591 | 248 | 52 | 181 | 119 | 1.0000 |
Table 3.
A cross-fold aggregated means summary.
| Configuration architecture pattern | Mean F1-score |
Mean Accuracy | Mean recall | Mean precision | Mean FN | Mean TSAP Q-score |
|---|---|---|---|---|---|---|
| Conventional Distance Rule-Based Metric Only | 0.72927 | 0.76278 | 0.70333 | 0.78288 | 267 | 1.0000 |
| Proposed Hy-brid Frame-work (XGBoost + DTW) | 0.99395 | 0.99389 | 1.00000 | 0.98803 | 0 | 0.2230 |
| Standalone Machine Learning Base-line (No DTW) | 0.99340 | 0.99333 | 1.00000 | 0.98693 | 0 |
0.2161 |
Table 4.
Pre-instance latency overhead benchmark.
| System pipeline stages | Execution latency (ms) | Proportion of total footprint (%) |
|---|---|---|
|
DTW abstraction layer (Numba-JIT) |
0.0145 | 0.45 % |
| XGBoost inference step | 1.0415 | 32.66 % |
| TSAP-AD linear attribution engine | 2.1328 | 66.89 % |
| Total pipeline processing latency | 3.1888 | 100.00 % |
Disclaimer/Publisher’s Note: The statements, opinions and data contained in all publications are solely those of the individual author(s) and contributor(s) and not of MDPI and/or the editor(s). MDPI and/or the editor(s) disclaim responsibility for any injury to people or property resulting from any ideas, methods, instructions or products referred to in the content. |
© 2026 by the authors. Licensee MDPI, Basel, Switzerland. This article is an open access article distributed under the terms and conditions of the Creative Commons Attribution (CC BY) license (http://creativecommons.org/licenses/by/4.0/).
Copyright: This open access article is published under a Creative Commons CC BY 4.0 license, which permit the free download, distribution, and reuse, provided that the author and preprint are cited in any reuse.