

Submitted:
21 August 2026
Posted:
24 August 2026
You are already at the latest version
Abstract
Smart-building structural health monitoring (SHM) requires a unified digital representation capable of integrating heterogeneous sensing devices, continuous structural states, and burst-oriented post-event assessment without embedding device-specific logic throughout the software stack. This study proposes a semantic digital twin architecture in which SensorType, DeviceProfile, and site metadata form a semantic single source of truth and generate W3C Web of Things Thing Descriptions at runtime. The resulting WoT-driven contract governs field mapping, schema-on-write persistence, generic API access, state visualization, and engineering-threshold evaluation. To accommodate heterogeneous temporal behavior, event-driven seismic assessment and state-driven construction tilt monitoring are orchestrated as distinct workflows that share persistence, notification, and observability services while retaining separate timing contracts. Controlled extension experiments required no manual data-layer, backend, ingestion, or frontend modification, with a runtime source-hash difference of zero. Under a ten-building seismic-event burst, continuous write-lag p95 changed by −20 ms from a 969 ms baseline while all event jobs completed without restart or out-of-memory conditions. The ingestion path further sustained 71,040 points/s at 300 sensors with no dropped points. These results demonstrate that WoT-driven semantic interoperability and event–state workflow orchestration can provide an extensible integration foundation for smart-building SHM within a clearly defined configuration boundary.
Keywords:
smart building
; structural health monitoring
; semantic digital twin
; Web of Things
; semantic interoperability
; event–state workflow orchestration
1. Introduction
Smart buildings increasingly depend on continuous structural awareness to support lifecycle safety, maintenance prioritization, and rapid interpretation after disruptive events. Structural health monitoring (SHM) provides this awareness through distributed sensing modalities such as accelerometers and tiltmeters, but the engineering value of these measurements depends on their integration into a persistent representation of building state. Digital-twin (DT) approaches have therefore gained importance in civil infrastructure because they couple physical assets with virtual representations through continuously updated data connections [1,2]. In contrast to a static digital model or a one-way digital shadow, a digital twin requires automated synchronization and a service layer capable of supporting analysis, notification, and feedback [3].
Semantic technologies provide a mechanism for preserving this synchronization as the number of devices, data models, and operational scenarios increases. Boje et al. identify semantic integration as a central requirement for construction digital twins and formulate the broader direction of the semantic construction digital twin [4]. Building on that premise, this work adopts an operational definition in which a semantic digital twin is not merely accompanied by machine-readable metadata; rather, its semantic representation actively governs runtime behavior. Specifically, the same description must determine data mapping, API querying, state presentation, and alert evaluation. This runtime criterion distinguishes semantic integration that is architecturally consequential from semantic annotation that remains disconnected from execution.
Digital-twin systems have demonstrated substantial potential for real-time assessment of floating offshore wind turbines [5], risk prognosis during foundation-pit excavation [6], and vibration-based bridge monitoring [7]. Nevertheless, many SHM implementations remain architected around a specific structure, sensing modality, or analytical objective [8,9]. Such specialization tends to distribute device-dependent assumptions across payload parsers, database schemas, threshold logic, service endpoints, and presentation components. The resulting coupling is manageable for a single deployment but becomes a structural impediment when smart-building platforms must accommodate additional sensor types, sites, or monitoring scenarios without reconstructing the data and application layers.
A second integration difficulty arises from temporal heterogeneity. Seismic assessment is intrinsically event-driven: an external trigger initiates high-frequency data retrieval, segmented archival, and staged analysis over a finite event window. Construction tilt monitoring is state-driven: low-frequency observations are ingested continuously and evaluated against engineering thresholds over extended periods. These workflows therefore impose different requirements on scheduling, retention, latency, and resource allocation. Implementing them as isolated applications sacrifices reusable infrastructure, whereas collapsing them into a single synchronous execution path allows burst-oriented seismic processing to compete directly with continuous state updates. Although continuous monitoring and event-triggered earthquake response have been integrated for an individual structure [10], architectural coexistence across distinct monitoring scenarios remains comparatively underexplored.
The resulting integration problem is further amplified in service-oriented deployments, where ingestion, persistence, analysis, notification, and feedback are distributed across containers and independently scheduled components [11,12]. In such systems, successful sensor persistence alone is insufficient evidence of operational correctness. Queueing delay, callback completion, database responsiveness, notification dispatch, and resource state must be observable so that contention can be distinguished from failure and performance measurements can be attributed to specific architectural mechanisms.
Accordingly, this study formulates two architectural conditions that must be satisfied before a semantic digital twin can remain coherent across multiple smart-building SHM scenarios.
- A single semantic representation across scenarios. Device capabilities, spatial context, measurement fields, and engineering thresholds must be expressed through a common runtime model. Otherwise, each extension propagates through persistence, backend, and presentation layers and the virtual environment degenerates into a collection of device-specific representations rather than a unified twin;
- Sustained synchronization under event load. Event-driven seismic assessment and state-driven tilt monitoring must preserve their respective timing requirements while sharing platform services. If burst processing compromises continuous state updates, the digital representation loses fidelity precisely when structural conditions may be changing most rapidly.
These conditions address complementary digital-twin dimensions. The first concerns the internal coherence of the virtual entity, whereas the second concerns the continuity of the connection and data dimensions under heterogeneous workload. The automation-oriented classification in [3] distinguishes digital models, digital shadows, and digital twins according to physical–digital dataflow; however, automated data exchange does not by itself guarantee that the virtual entity is semantically unified. A platform may synchronize bidirectionally while still maintaining independently defined representations for different devices or scenarios.
To satisfy these conditions, the proposed architecture establishes a semantic single source of truth (SSOT) from SensorType, DeviceProfile, and site configuration and generates W3C Web of Things Thing Descriptions (WoT TDs) at runtime [13,14]. The resulting WoT-driven contract captures device capability, measurement semantics, spatial context, and engineering thresholds and is consumed consistently by ingestion, persistence, generic APIs, visualization, and alert evaluation. Within a declared extension boundary, new sensor types, fields, and site semantics are introduced through configuration rather than database-schema reconstruction or device-specific service logic. Temporal heterogeneity is addressed through dual workflow orchestration: seismic events are processed through asynchronous queueing and segmented waveform archival, whereas construction tilt is maintained through continuous ingestion and semantic threshold evaluation. Both workflows reuse persistence, notification, and observability services while preserving distinct timing contracts.
The central research question is whether these two conditions can be realized concurrently without destabilizing persistence or compromising the generic service interfaces; Section 4 evaluates the architecture against this criterion. The contribution is therefore situated at the level of semantic interoperability, workflow orchestration, and system integration rather than structural-analysis algorithms, sensor firmware, or cloud–edge optimization. The implemented downlink path supports operator-triggered configuration through TD actions and MQTT commands, but the architecture does not claim validated safety-critical closed-loop control, which would additionally require physical-execution guarantees, authorization, and fail-safe mechanisms.
Within this scope, the article makes two principal contributions:
- WoT-driven semantic decoupling. Device capability, spatial context, measurement fields, and engineering thresholds are consolidated into reusable runtime descriptions that propagate across data mapping, persistence, generic APIs, visualization, and alert logic, thereby reducing cross-layer coupling;
- Event–state workflow coexistence. Event-driven seismic assessment and state-driven construction tilt monitoring are orchestrated over shared persistence, notification, and observability infrastructure while retaining independent timing contracts and backpressure behavior.
Observability is incorporated as an evidential layer rather than presented as an independent research contribution; its role is to expose the runtime measurements required to interpret coexistence, contention, and failure. The remainder of the article is organized as follows. Section 2 reviews digital twins, semantic interoperability, and heterogeneous workflow models. Section 3 details the architecture, semantic contract, orchestration mechanisms, implementation, and experimental design. Section 4 presents the controlled evaluations, Section 5 interprets their implications and limitations, and Section 6 summarizes the findings.
2. Related Work
The related work is organized around the two architectural problems addressed by this study: semantic decoupling across heterogeneous devices and sites, and coexistence of event-driven and state-driven digital-twin updates. Consistent with the system-integration focus of the contribution, the review emphasizes semantic models, dataflow architecture, interoperability mechanisms, and workflow coordination rather than structural-analysis accuracy or sensing-hardware performance.
2.1. Digital Twins for Structural Health Monitoring
Digital twins are commonly characterized by the integration of a physical entity, a virtual representation, and a data connection through which sensing, state management, analysis, and feedback are coordinated [1]. Kritzinger et al. distinguish a digital model, digital shadow, and digital twin according to the degree of automated data exchange between physical and virtual entities [3]. This distinction is particularly relevant to SHM, where many systems achieve automated physical-to-digital synchronization while leaving digital-to-physical action outside the validated control loop.
Civil-engineering applications have extended digital twins to construction and infrastructure management [2,8]. Boje et al. further argue that scalable construction twins require semantic-web mechanisms capable of linking heterogeneous data sources with domain knowledge, motivating the concept of the semantic construction digital twin [4]. The present work translates this conceptual direction into an executable architectural requirement: semantic descriptions are treated as runtime contracts that govern mapping, querying, presentation, and alerting. Existing implementations include real-time assessment of floating wind turbines [5], excavation-risk monitoring [6], event-triggered bridge vibration assessment [7], and cloud-based SHM twinning [15]. Collectively, these studies establish the feasibility of digitally coupled sensing and analysis, but their data models and execution flows are generally organized around a particular structure or monitoring objective.
Interoperability is therefore a recurring prerequisite for deployable digital twins [1,16]. Most interoperability mechanisms address the interface between heterogeneous devices and the digital platform. The architectural question considered here extends beyond device connectivity to representation coherence: whether a common semantic model can simultaneously encode devices, spatial hierarchy, measurement fields, and engineering thresholds so that multiple SHM scenarios remain part of one virtual entity rather than being represented by parallel, independently maintained models.
2.2. Semantic Interoperability and WoT Modeling
Machine-readable asset descriptions are fundamental to heterogeneous-device integration. Digital Twins Definition Language, Asset Administration Shell, Eclipse Ditto, and W3C WoT TD provide complementary abstractions for cloud models, industrial assets, twin-state management, and web-accessible interactions [17,18,19,20]. WoT TD is adopted in this work because its JSON-LD representation is lightweight, web-native, and directly compatible with property/action abstractions and HTTP/MQTT-oriented integration.
Prior studies have demonstrated that WoT TD can serve as more than a device-discovery document. González-Gerpe et al. extended TDs to encode semantic relationships among digital-twin entities [13], while WoTwins used modeled device-state spaces to automate twin generation [21]. WoT-based semantic interoperability has also been investigated in smart-building environments [14], providing direct motivation for using TDs as the semantic interface of building-oriented sensing assets. MAC4PRO [11] is particularly relevant because it applies WoT TD to SHM and reduces the effort required to integrate new sensing devices. Its persistence workflow, however, still requires an acquisition-specific mapping function so that incoming observations conform to a predefined database structure. The distinction is architectural rather than functional: device interoperability is achieved, but the semantic abstraction is not propagated through persistence and query. The present study consequently evaluates a stronger form of semantic continuity in which the same runtime contract determines storage fields, generic APIs, visualization metadata, and threshold-based alert rules.
2.3. Event-Driven and State-Driven Monitoring
Microservice decomposition and asynchronous message queues provide established mechanisms for isolating device integration and absorbing burst-oriented workloads [5,22,23,24]. Event-driven monitoring reacts to discrete triggers such as earthquakes or train passages and commonly relies on brokers to buffer transient load; MQTT-based cloud architectures illustrate this pattern for real-time wireless-sensor streams [24]. State-driven monitoring instead evaluates a continuously arriving stream against persistent state and engineering thresholds. Lambda architecture demonstrates the coexistence of processing paths [25], although its batch and speed layers typically operate over the same underlying data stream. The present architecture addresses a different coordination problem: two monitoring scenarios with distinct sources, triggers, sampling characteristics, and temporal contracts.
Karanikoloudis et al. combined continuous SHM with real-time earthquake-response assessment for a retrofitted adobe church [10], demonstrating the practical value of integrating monitoring modes within a single structural deployment. That work focuses on the acquisition and assessment workflow of one structure. The present study extends the integration question to multi-scenario runtime semantics and to the behavior of distinct event- and state-driven workflows when they reuse common persistence and service infrastructure.
Table 1 therefore compares representative systems along five dimensions directly associated with semantic decoupling and workflow coexistence, rather than attempting an exhaustive feature-level survey.
Three gaps emerge from this comparison. First, multi-scenario SHM lacks strong evidence that device, site, measurement, and threshold semantics can remain consistent through a single runtime representation. Second, WoT TD is commonly positioned at the description or interoperability layer rather than evaluated as a contract spanning persistence and generic APIs. Third, event-driven and state-driven monitoring are typically considered separately, leaving limited evidence regarding their coexistence under burst load on shared infrastructure. Section 3 addresses these gaps through a semantic SSOT, runtime TD generation, and dual-workflow orchestration; Section 4 evaluates each proposition experimentally.
3. Materials and Methods
3.1. Platform Architecture and Functional Planes
The implementation is containerized and organized as interacting functional planes rather than as a strictly layered stack. The backend constitutes the semantic and orchestration nucleus: it resolves the runtime semantic model, coordinates ingestion and persistence, dispatches modular analysis services, and exposes state, notification, and TD-action interfaces. Observability is implemented as a cross-cutting plane so that the behavior of each data path can be examined under controlled load. Table 2 summarizes the functional responsibilities and principal components, and Figure 1 presents the corresponding architecture.
For the evaluated deployment, ingestion, persistence, the semantic core, and observability execute on one host in containerized or host mode, whereas the modular analysis service is placed on a separate host and interacts exclusively through HTTP webhooks and callbacks. This deployment choice defines the experimental boundary used in Section 4: the mock analysis service preserves the production interface, asynchronous coupling, and timing contract so that workflow coordination can be measured independently of model-specific computation. The compute and memory envelope of the production analysis model is therefore intentionally treated as a separate deployment concern.
3.2. Dual Dataflows and Digital-Twin Positioning
Figure 2 illustrates the two coordinated dataflows. The event-driven path begins with a Central Weather Administration (CWA) strong-motion report, resolves the affected buildings, expands the external event into building-specific event records, archives the P1, P2, and P3 temporal segments, and schedules Stage 1 and Stage 2 analysis through an asynchronous queue. In parallel, the state-driven path continuously receives MQTT observations, resolves fields through the semantic mapping, performs batched time-series persistence, evaluates effective engineering thresholds, and exposes the resulting state, trend, and alert information.
Although the two workflows reuse persistence, notification, and observability services, their temporal semantics remain intentionally distinct. Continuous state monitoring targets sub-second visibility of newly ingested observations. Event analysis tolerates controlled queueing because post-event assessment cannot be completed until the physical P3 acquisition interval has elapsed. The coexistence mechanism in Section 3.5 therefore preserves separate timing contracts instead of forcing the two workflows into a single latency objective.
The architecture provides automated physical-to-digital synchronization from sensing assets to their virtual representations and exposes a digital-to-physical command path through TD actions and MQTT. This downlink is restricted to operator-triggered configuration and maintenance functions. Because physical execution, fail-safe behavior, and authorization are not validated as part of the present study, the implementation lies between a digital shadow and a fully closed-loop digital twin under the classification of [3]. The two propositions evaluated here thus concern the integrity of the virtual representation and the continuity of synchronization across heterogeneous workloads; validated closed-loop actuation constitutes a subsequent capability. Table 3 maps the implementation to the five-dimensional digital-twin model [26] and indicates the dimensions directly established by semantic decoupling and workflow coexistence.
3.3. Semantic SSOT, Runtime TD Generation, and the Decoupling Boundary
The semantic SSOT comprises three complementary metadata classes. SensorType defines reusable sensing semantics, including measurement names, payload-field mappings, virtual properties, units, and default thresholds. DeviceProfile instantiates a SensorType for a deployed asset and may override sampling or threshold metadata. Site, building, and zone records encode spatial context. These documents are resolved dynamically during ingestion, query, visualization, and threshold evaluation, after which the backend generates WoT TD representations that expose consistent property and action interfaces for each digital asset. Consequently, device-specific API endpoints are unnecessary whenever the generic property/action abstraction is sufficient. Figure 3 depicts the resulting multi-level TD topology.
Sensor observations enter through MQTT and related IoT integration services. The ingestion worker resolves the corresponding DeviceProfile, applies SensorType field mappings, normalizes values, attaches temporal and spatial context, and persists measurements in batches, while identity, deployment category, and site hierarchy remain represented as separate metadata. Because SHM combines high-frequency waveforms with low-frequency continuous measurements, the persistence layer must support sustained write throughput and efficient time-range access. Time-series systems such as Apache IoTDB demonstrate this design pattern at IoT scale [27], and prior comparisons identify batching as an important strategy for write efficiency [28]. The implementation therefore stores measurements in InfluxDB and semantic configuration, spatial metadata, device records, and events in MongoDB.
At runtime, the semantic contract maps each JSON key path to a time-series measurement and field, associates the value with its engineering unit and physical interpretation, and resolves the effective threshold consumed by state evaluation, dashboard rendering, and notification logic. The same configuration therefore drives multiple software layers without introducing dedicated parsers or query endpoints. InfluxDB’s schema-on-write behavior complements this design: the first valid observation can instantiate a previously absent measurement and field without an explicit schema-migration operation.
Semantic decoupling is deliberately bounded by two conditions. First, an incoming device payload must be representable as a JSON-path-to-time-series-field mapping within the existing ingestion mechanism. Second, the deployment must conform to one of the modeled spatial categories: building-structure monitoring, which uses building/floor hierarchy, or construction-site monitoring, which uses site/zone hierarchy and its associated validation rules. Extensions satisfying both conditions are configuration-level changes. By contrast, a new transport protocol, binary decoder, or a third deployment category with a distinct spatial ontology requires code-level extension. Declaring this boundary makes extensibility measurable rather than open-ended and defines the interpretation domain of the change-footprint experiment in Section 4.
3.4. Event- and State-Driven Workflow Orchestration
The event-driven orchestration in Figure 4 first normalizes a CWA strong-motion report into an internal platform event and then materializes one event document for each affected building. This fan-out preserves independent archival, scheduling, and callback state for every building associated with the same earthquake. Two jobs are generated per building. Job A archives the P1 pre-event microtremor and P2 main-shock intervals before invoking Stage 1 real-time physical alerting; Job B archives the P3 post-event microtremor interval before invoking Stage 2 in-depth assessment. Analysis is decoupled through an HTTP webhook/callback contract, allowing the present evaluation to isolate orchestration and timing behavior from the internal structural-analysis algorithm.
All event jobs are admitted to an asynchronous queue, converting transient fan-out into bounded and observable queueing instead of synchronous request blocking. Job B contains an additional fixed 15 s wait that reflects measurement availability rather than computational overhead: Stage 2 cannot begin until the required P3 observation interval has physically elapsed. The evaluation therefore separates this designed acquisition wait from queueing and processing latency so that system delay is not conflated with the temporal requirements of the sensing process.
The state-driven workflow continuously ingests tiltmeter observations and resolves, through the semantic model, the destination time-series fields, spatial assignment, and effective engineering threshold. Thresholds may be inherited from SensorType or specialized by DeviceProfile, after which the backend exposes current state, historical trends, and threshold status through generic interfaces. For stress testing, the same ingestion path accepts high-frequency accelerometer data in Section 4. A sampling-rate metadata override is used to verify propagation through the runtime contract; it does not imply modification of the physical sensor’s firmware-controlled sampling process.
3.5. Coexistence, Feedback, and Observability
Workflow coexistence is achieved by separating temporal contracts rather than duplicating the entire infrastructure. Event processing is subject to fixed worker concurrency and asynchronous queue backpressure, whereas continuous state ingestion follows the batched write path; computational analysis is additionally placed on a separate host. These mechanisms constrain burst propagation while allowing both workflows to reuse common persistence and platform services, thereby protecting the latency budget of continuous monitoring without introducing independent application silos.
The architecture exposes three feedback mechanisms spanning users, operators, and devices. LINE Messaging delivers alerts and event information to users, while dispatch status and latency are exported as observable metrics. WoT TD actions are translated into MQTT downlink commands for operator-triggered configuration and maintenance; safety-critical autonomous actuation is excluded because it would require additional authorization, auditability, fail-safe design, and risk analysis. Prometheus and Grafana provide cross-service visibility into event queues, database paths, MQTT traffic, notification behavior, and ingestion-worker state.
The observability layer records job lag, processing duration, queue completion, ingestion throughput, write lag, errors, restart counts, and out-of-memory conditions. These metrics are defined as part of the architecture so that ordinary backpressure can be distinguished from service degradation or failure. Observability therefore provides the measurement substrate through which semantic extension and workflow coexistence are evaluated rather than functioning as a post hoc monitoring add-on.
3.6. Implementation Outcome
The implemented interface demonstrates that seismic assets associated with buildings and tilt-monitoring assets associated with construction zones can be navigated through a unified information model (Figure 5). Although the underlying workflows remain temporally distinct, site hierarchy, device identity, trends, thresholds, and event records are exposed through common semantic concepts.
Figure 6 illustrates the transformation from SensorType and DeviceProfile configuration to runtime TD properties and actions. Field identifiers, engineering units, threshold context, and device capability are derived from the same semantic model, enabling the frontend to consume generic interfaces without introducing device-specific API definitions for the supported extension classes.
The seismic-event interface in Figure 7 exposes building-specific archival state, staged analysis, and callback results, whereas Figure 8 presents continuous tilt state, historical evolution, and threshold status. Their coexistence in the same platform demonstrates the implementation-level separation of discrete event assessment from persistent state monitoring while retaining a shared semantic and service foundation.
3.7. Experimental Design
The experimental program is designed to evaluate system-integration properties rather than the accuracy of structural-analysis algorithms. The primary propositions are semantic decoupling and event–state workflow coexistence, with ingestion capacity and observability providing supporting evidence. Accordingly, the measurements target extension footprint, workflow timing, coexistence under burst load, and sustained ingestion. Structural-model accuracy, sensor metrology, and the production analysis service’s computational envelope remain outside the experimental boundary because they belong to independently evaluable subsystems.
All evaluations were conducted in a self-contained local environment to ensure repeatable control over workload and resource boundaries. MongoDB, InfluxDB, Mosquitto, Redis, the backend, ingestion worker, Prometheus, and Grafana executed on a single host in Docker or host mode, with all test data confined to locally bound services. Container CPU and memory limits, disabled automatic restarts, bounded sender load, execution-time caps, an independent host-memory watchdog, finite InfluxDB retention, and free-disk checks were applied to prevent uncontrolled resource escalation. Host-mode Windows processes are not governed by Docker/WSL2 memory limits, so the watchdog provides the residual protection for that execution path. Table 5 specifies the experimental platform and data sources.
To avoid post hoc interpretation, each proposition is associated with an explicit experiment and decision basis before results are examined, as summarized in Table 6. Latency distributions are reported using p50, p95, and p99 where applicable and are interpreted together with completion, failure, restart, and out-of-memory indicators. Because the formal scenarios are controlled single-run evaluations, the reported statistics characterize within-run behavior rather than long-term service-level reliability.
4. Results
4.1. Semantic Decoupling: Change Footprint
Semantic decoupling was operationalized as a measurable change-footprint proposition. Within the existing MQTT/JSON ingestion path, generic property APIs, and two modeled deployment categories, an extension should be absorbed by runtime semantic configuration without requiring manual data migration, a dedicated backend endpoint, a new ingestion adapter, or a specialized frontend component. The experiment therefore records manual data-layer and source-code changes, semantic configuration modifications, service redeployment, and end-to-end behavior. Before-and-after artifacts include database-schema snapshots, runtime code hashes, container and worker identities, and API responses. Schema-on-write creation is distinguished from manual migration because a valid first write may legitimately instantiate new logical measurements and fields.
Table 7 defines four extension tasks that exercise progressively different configuration paths. T2 and T3 are the principal cases because they represent two common smart-building SHM extensions: introducing a previously unknown sensor type and expanding monitoring to a new site within an existing deployment category.
The structured extension sequence was executed in the isolated environment over approximately three minutes. Repository HEAD remained unchanged throughout the experiment, the runtime source-code hash difference was zero, and seven core outputs were independently verified by byte size and SHA-256 digest. The resulting cross-layer change footprint is reported in Table 8.
Across T1–T4, no manual modification was required in the data layer, backend, ingestion path, or frontend. In T2, the first valid observations instantiated one dual-channel strain measurement and two fields within the existing time-series bucket, demonstrating the schema-on-write mechanism without altering bucket configuration. In T4, observations crossing two configured thresholds produced severe and warning states at the dashboard, establishing that the semantic override propagated through alert evaluation in addition to persistence and presentation. Component identities for the backend, frontend, database, broker, queue, ingestion worker, and analysis service remained invariant, with zero restarts. Observed activation intervals of 30.975–59.986 s are attributable to the 60 s configuration-cache refresh period rather than extension-processing latency.
Figure 9 provides presentation-level evidence that the existing dashboard rendered the T2 sensor type and the T4 alert state without frontend modification. The screenshots corroborate the end-to-end behavior, while the structured responses, configuration snapshots, hashes, and measured traces constitute the primary experimental record.
T1–T3 consequently satisfy the predefined decoupling decision basis: manual data-layer, backend, and ingestion changes were zero, no service redeployment occurred, and each end-to-end path passed. The T2 schema creation does not contradict this result because the measurement and fields were materialized automatically on first write rather than introduced through an explicit migration. Semantic decoupling is therefore supported within the declared extension boundary.
Three qualifications constrain this interpretation. First, zero frontend modification is corroborative rather than normative; specialized future visualizations may reasonably require frontend changes. Second, the result is limited to the extension boundary defined in Section 3 and does not cover new transport protocols, binary decoders, or an additional deployment category. Third, a pretest identified an existing device-configuration query endpoint that returned HTTP 500 when dependent model data were absent. T4 therefore used the available update response and dashboard query without modifying runtime code; the endpoint defect is retained as an independent implementation issue rather than corrected during the experiment.
4.2. Event-Driven Workflow Performance
The event-workflow evaluation quantifies whether asynchronous orchestration can absorb seismic fan-out while preserving segmented archival, analysis dispatch, and callback persistence. The experiment targets system-level coordination; accordingly, the mock analysis service reproduces the production webhook, background-task, and callback coupling with both worker and mock background-work concurrency fixed at two. Each affected building generates the two jobs defined in Section 3: Job A handles pre-event/main-shock archival and Stage 1, whereas Job B handles post-event archival and Stage 2.
The latency decomposition in Figure 10 is defined by timestamps T0–T7, representing event creation, enqueue, worker start, archival completion/webhook dispatch, webhook acceptance, callback receipt, event-state persistence, and interface update. Job lag (E1), worker processing (E2), callback time (E5), and end-to-end completion (E6) are derived from these timestamps as T2–T1, T3–T2, T5–T4, and T6–T0, respectively. The fixed P3 acquisition wait is represented independently so that physical data-availability time is not attributed to queue or worker latency.
Three controlled fan-out cases reused the same microtremor waveform set according to floor role, thereby modeling one local earthquake expanded across multiple buildings rather than a sequence of independent events. F1 represents 1 building, 3 devices, and 2 jobs; F5 represents 5 buildings, 15 devices, and 10 jobs; and F10 represents 10 buildings, 30 devices, and 20 jobs. Table 9 summarizes the measured latency distributions.
The unadjusted Job B lag p95 values were 15.085, 50.425, and 91.859 s for F1, F5, and F10. Table 9 removes the fixed 15 s acquisition wait to isolate queueing. Increasing fan-out from one to ten buildings raised Job A lag p95 from 0.008 to 54.423 s and Stage 1 end-to-end p95 from 9.318 to 69.675 s; Job B queueing p95 reached 76.859 s and Stage 2 end-to-end p95 reached 121.954 s. The non-monotonic Job A processing duration between F5 and F10 should not be interpreted as a scaling inversion because it combines per-building query and archival work over a small number of work items rather than representing queue depth alone.
The predefined decision criterion concerns completion and service integrity rather than a fixed latency ceiling. All dispatched jobs and event documents completed in every scenario, both stages returned callbacks that were persisted and remained queryable, and no job failure, callback failure, container restart, or out-of-memory condition was observed. In F10, all 20 jobs and all 10 building event documents completed successfully. The asynchronous design therefore converted increased fan-out into measurable queueing and longer completion time rather than service failure or resource exhaustion; the reported latencies quantify the cost of this absorption.
Callback completion is defined at the persistence boundary: returned results were stored and remained queryable. It does not include frontend polling or external notification delivery. Moreover, each fan-out scenario was executed once, so the reported percentiles characterize within-run task distributions across the 1-, 5-, and 10-building workloads rather than cross-run variability or an absolute capacity limit. Queue-depth and analysis-service peak-memory time series were not retained and therefore cannot be inferred from these measurements.
4.3. State-Flow Stability Under Event Bursts
The coexistence evaluation examines whether event fan-out perturbs continuous state ingestion on the shared MQTT, semantic parsing, and batched persistence path. Ten triaxial accelerometers replay observations at 250 Hz in batches of 40 for ten minutes, deliberately imposing a continuous load substantially above that of construction tilt sensing. This stress source is appropriate because the relevant platform mechanisms are governed by message rate, batch size, parsing load, and write volume rather than by the physical variable represented by each observation.
Three conditions isolate the influence of event activity and analysis-side concurrency. S0 establishes the continuous-ingestion baseline without an event burst. S1 injects a ten-event burst at 30 s, producing ten Job A/Job B pairs under the configured queue and worker limits with mock analysis background concurrency of two. S2 repeats the burst while reducing mock background concurrency to one; because queue and worker safeguards remain active, S2 is a sensitivity condition rather than an unprotected control. Table 10 reports the resulting comparison.
Relative to S0, write-lag p95 changed by ms in S1 and ms in S2, while p99 changed by and ms. The sender maintained 2400 triaxial sample groups/s under all conditions. Stable-window statistics exclude the first 30 s and the final 30 s of active sending, yielding 271, 272, and 271 observations; the post-sender interval is omitted because the elapsed time since the last timestamp then measures data staleness rather than persistence lag. A supplementary query experiment under the same ingestion load produced approximately 1120 samples without a burst and 1181 with a burst, 100% successful responses, and query-latency p95 values of 30.3 and 31.4 ms. Its corresponding write-lag p95 values of 975 and 972 ms are consistent with the formal runs.
Within the controlled workload, neither the event burst nor the reduced mock-analysis concurrency produced an engineering-significant deterioration in continuous write lag. Both burst conditions completed every event job, returned the queue to idle, and exhibited zero restarts and no out-of-memory condition. Reducing mock background concurrency from two to one changed write-lag p95 by only 1 ms, indicating that the analysis-side concurrency setting was not a binding determinant of state-flow stability at this load. Consequently, the mere presence of a concurrency limit should not be interpreted as evidence of isolation unless the measurement demonstrates that the limit is materially engaged.
The coexistence experiment did not timestamp platform-internal alert evaluation or external notification delivery; those paths require independent instrumentation and should not be inferred from write-lag measurements. Each condition was executed once on a single host under controlled replay.
4.4. Ingestion Capacity
Sustained ingestion is a prerequisite for both semantic synchronization and workflow coexistence; neither property is meaningful if the platform cannot persist the offered sensor load. A separate scaling experiment therefore increased the number of concurrent triaxial accelerometers from 10 to 300 at 250 Hz with 40 samples per message, maintaining each load level for approximately 75 s of steady-state operation. Figure 11 presents the measured scaling behavior.
At 300 sensors, the ingestion path sustained 71,040 points/s against a theoretical 75,000 points/s with zero dropped points and zero write-flush errors; accepted and successfully persisted point counts therefore remained identical. Ingestion-worker resident memory increased gradually from approximately 94 to 121 MiB, while host free memory remained above 24 GiB. The achieved rate, approximately 94.5% of the theoretical sender rate, is attributable to operating-system timer granularity in the synthetic load generator rather than downstream loss, as confirmed by the zero-drop and zero-flush-error counters.
Resource measurements at the maximum load remained well below host saturation. Ingestion-worker CPU use increased from approximately 1% to 1.4%, whereas the time-series database represented the dominant computational consumer at approximately 7% average CPU with batch-write peaks near 14%. Line-protocol traffic scaled to approximately 10.4 MB/s and was persisted as about 4.3 MB/s of disk writes, corresponding to roughly 146 bytes/point. The worker issued approximately 23.5 batches/s of about 3000 points each; host disk-write operations remained below approximately 90/s and the write-queue length remained below one. At this sustained rate, daily data generation would reach hundreds of gigabytes, indicating that long-term retention and storage capacity, rather than instantaneous ingestion or disk throughput, become the dominant deployment constraint.
4.5. Summary of Proposition Verification
Table 11 consolidates the direct evidence for each proposition and explicitly states the conditions under which the corresponding inference is valid.
5. Discussion
The semantic-digital-twin definition adopted in this study requires the runtime description to govern four behaviors rather than merely document them. The change-footprint experiment provides direct evidence for each behavior: T2 instantiated new measurement fields through semantic mapping, generic property queries were reused without backend modification, the existing dashboard rendered an unknown sensor type without frontend specialization, and the T4 threshold override propagated to an alert state readable in 6.263 s. Within the declared extension boundary, these observations support the proposition that one semantic representation spans multiple SHM scenarios. The zero runtime source-hash difference strengthens this conclusion by converting an architectural claim into a reproducible change-footprint measurement.
Evidence for sustained synchronization under event load is strongest at the ingestion and persistence layers. The ten-building burst changed continuous write-lag p95 by ms relative to the 969 ms baseline while every event job completed and the queue returned to idle. This supports data-layer coexistence but should not be generalized to the entire alert path. T4 established that semantic configuration drives alert evaluation under non-burst conditions, whereas the coexistence experiments did not timestamp internal alert evaluation or external notification delivery. The supported conclusion is therefore specific: semantic alert logic is integrated into the runtime contract, while its latency under concurrent event load remains experimentally unresolved.
These findings directly address the architectural gaps identified in Section 2. MAC4PRO [11] demonstrates WoT-based device interoperability but retains acquisition-specific mapping at persistence. In contrast, the T1–T4 results show zero manual data-layer and backend modification when the semantic contract is propagated through schema formation and generic APIs. The contribution is therefore not the use of WoT TD itself, but the measured extension of its semantic role across runtime layers. Similarly, the coexistence experiment complements the single-structure continuous/seismic integration in [10] by evaluating two distinct monitoring scenarios while they reuse the same persistence, notification, and observability infrastructure.
The coexistence result should be interpreted as temporal isolation rather than complete resource isolation. The event and state workflows intentionally share the database, notification service, and observability infrastructure; Section 4.3 does not establish disjoint resource pools. The architectural separation occurs at the time-contract level. Event fan-out is allowed to accumulate bounded queueing over a minutes-scale completion horizon, whereas continuous ingestion retains a sub-second visibility objective on the shared persistence path. Accordingly, the F10 Job A queueing delay of approximately 54 s would be unsuitable for a synchronous interaction but remains compatible with a post-event workflow whose second stage cannot complete before the observation window closes. This distinction also differs from Lambda architecture [25]: Lambda separates processing views of the same data stream, whereas the present architecture coordinates two distinct monitoring scenarios whose sources, triggers, and latency requirements are fundamentally different.
This temporal interpretation justifies reporting the 15 s P3 interval independently. Treating the acquisition wait as system latency would incorrectly imply that it is removable through software optimization, although it arises from the physical requirement to observe post-event behavior. Separating acquisition-dependent waiting from computational delay allows the remaining queueing metrics to quantify the actual architectural cost of burst absorption.
The T2 result also reveals a dependency that is easily obscured by the zero-change count. Configuration-driven extensibility avoided manual migration because the time-series layer supports schema formation on first valid write. A persistence technology requiring predeclared measurements and fields would reintroduce a data-layer modification even if the same semantic configuration were retained. Semantic decoupling is therefore a cross-layer property: runtime metadata can eliminate application-specific mapping only when the underlying persistence mechanism is compatible with dynamic schema materialization. This dependency is an important reproducibility condition for comparable architectures.
The sensitivity control further distinguishes implemented safeguards from empirically load-bearing mechanisms. Reducing mock analysis background concurrency from two to one altered continuous write-lag p95 by only 1 ms, indicating that this limit was not binding under the evaluated workload. This finding does not imply that concurrency protection is unnecessary: the production analysis model may exhibit substantially different CPU and memory behavior. Rather, it establishes a methodological constraint on architectural claims. A concurrency control should be credited with isolation only when measurements demonstrate that it materially limits contention; the presence of the mechanism alone is insufficient evidence.
Finally, the declared decoupling boundary should be interpreted as part of the architectural specification rather than merely as a limitation. A measured change footprint is meaningful only when the classes of extensions that are expected to remain configuration-driven are explicit. This boundary converts extensibility from an unrestricted qualitative claim into a falsifiable property with a defined applicability domain.
5.1. Limitations
Several limitations delimit the generalizability of the results. The controlled experiments used a mock analysis service that reproduces the production interface and timing contract but not the computational characteristics of the production model. This design isolates platform-level queueing and scheduling from model-level variability, enabling clearer attribution of measured latency. The trade-off is that production inference cost, semaphore interaction, peak memory demand, and out-of-memory behavior are not represented and must be characterized separately.
Each formal scenario was executed once on a single host under controlled replay. Consequently, percentile statistics represent within-run task distributions rather than cross-run confidence intervals, and the evaluation does not establish behavior under multi-host deployment, variable network conditions, long-duration operation, or fan-out substantially beyond ten buildings. Application-state query latency is server-side and excludes browser rendering. Likewise, the MQTT downlink was exercised as an operator-triggered command channel and does not demonstrate verified physical execution by field devices.
The present evidence is restricted to integration behavior. Structural-analysis accuracy is attributable to the analysis model and measurement validity to the sensing hardware; neither is inferred from the platform experiments. The observability layer was sufficient to distinguish queueing from failure and persistence lag from post-sender staleness, but remains metric-oriented rather than trace-oriented. End-to-end causal reconstruction of an individual event across backend, queue, analysis, callback, and notification services would require a common distributed trace identifier.
6. Conclusions
This study developed and evaluated a semantic digital twin architecture for smart-building SHM under an operational definition in which machine-readable semantics must govern runtime data mapping, API querying, state presentation, and alert evaluation. Two architectural prerequisites were examined: maintaining a single semantic representation across heterogeneous monitoring scenarios and preserving continuous synchronization while event-driven and state-driven workloads coexist on shared infrastructure.
The semantic-decoupling results demonstrate all four runtime behaviors within the declared extension boundary. A newly introduced sensor type produced its measurement fields through first-write schema formation, the generic property API remained unchanged, the existing dashboard rendered the new state without frontend specialization, and a DeviceProfile threshold override propagated to alert evaluation. Across T1–T4, manual data-layer, backend, ingestion, and frontend changes were zero and the runtime source-hash difference remained zero. This result is explicitly scoped to the existing MQTT/JSON ingestion mechanism, generic property APIs, and the two modeled deployment categories.
The workflow-coexistence experiments establish sustained synchronization at the data layer under the evaluated load. A ten-building seismic burst changed continuous write-lag p95 by ms relative to the 969 ms baseline, while every burst job completed, the queue returned to idle, and no restart or out-of-memory condition occurred. Independent scaling further showed sustained ingestion of 71,040 points/s at 300 sensors with zero dropped points. Semantic control of alert evaluation was verified separately; its latency under concurrent burst load remains an open measurement.
Taken together, the results provide an implementable and measurable integration basis for smart-building SHM. WoT-driven semantic configuration defines which extensions can remain configuration-level and which require code-level changes, while event–state orchestration demonstrates that heterogeneous timing contracts can reuse common platform services without being collapsed into a single synchronous execution path. The contribution is therefore architectural: semantic interoperability is propagated into runtime behavior and verified through change footprint and coexistence measurements.
Future work should first complete the unresolved portions of the present architectural claim. Internal alert evaluation and external notification delivery should be timestamped independently under the same burst conditions; the production analysis services should replace the timing-equivalent mock to quantify computation, concurrency protection, and memory behavior; and physical execution must be validated with authorization, auditability, and fail-safe control before the downlink path can be regarded as closed loop. Broader deployment validation should then address multi-host operation, real network variability, long-duration durability, fan-out well beyond ten buildings, repeated trials for cross-run inference, and distributed tracing capable of reconstructing a single event across all participating services.
Author Contributions
Conceptualization, C.-H.C., Y.-C.C. and E.H.-K.W.; methodology, Y.-C.C.; software, Y.-C.C.; validation, Y.-C.C.; formal analysis, Y.-C.C.; investigation, Y.-C.C.; resources, C.-H.C., W.-L.L., H.-K.W., E.H.-K.W., S.-C.Y. and T.T.; data curation, Y.-C.C.; writing—original draft preparation, Y.-C.C.; writing—review and editing, C.-H.C., Y.-C.C., W.-L.L., H.-K.W., E.H.-K.W., S.-C.Y. and T.T.; supervision, E.H.-K.W. and S.-C.Y. All authors have read and agreed to the published version of the manuscript.
Funding
This research received no external funding.
Institutional Review Board Statement
Not applicable.
Informed Consent Statement
Not applicable.
Data Availability Statement
The data presented in this study are available from the corresponding author upon reasonable request. The archive for the change-footprint experiment comprises repository and container version baselines, before-and-after configuration and schema snapshots, per-task traces and end-to-end responses, and SHA-256 checksums for the core output files.
Acknowledgments
The authors thank the laboratory members for technical support during system development and validation.
Conflicts of Interest
The authors declare no conflicts of interest.
Abbreviations
The following abbreviations are used in this manuscript:
| API | Application Programming Interface |
| CWA | Central Weather Administration |
| DT | Digital Twin |
| IoT | Internet of Things |
| JSON-LD | JavaScript Object Notation for Linked Data |
| MQTT | Message Queuing Telemetry Transport |
| P1, P2, P3 | Pre-event microtremor, main-shock, and post-event microtremor intervals |
| SHM | Structural Health Monitoring |
| SSOT | Single Source of Truth |
| TD | Thing Description |
| WoT | Web of Things |
References
- Fuller, A.; Fan, Z.; Day, C.; Barlow, C. Digital Twin: Enabling Technologies, Challenges and Open Research. IEEE Access 2020, 8, 108952–108971. [Google Scholar] [CrossRef]
- Torzoni, M.; Tezzele, M.; Mariani, S.; Manzoni, A.; Willcox, K.E. A digital twin framework for civil engineering structures. Comput. Methods Appl. Mech. Eng. 2024, 418, 116584. [Google Scholar] [CrossRef]
- Kritzinger, W.; Karner, M.; Traar, G.; Henjes, J.; Sihn, W. Digital Twin in manufacturing: A categorical literature review and classification. IFAC-PapersOnLine 2018, 51, 1016–1022. [Google Scholar] [CrossRef]
- Boje, C.; Guerriero, A.; Kubicki, S.; Rezgui, Y. Towards a semantic Construction Digital Twin: Directions for future research. Autom. Constr. 2020, 114, 103179. [Google Scholar] [CrossRef]
- Pastor-Sanchez, A.; Garcia-Espinosa, J.; Di Capua, D.; Servan-Camas, B.; Berdugo-Parada, I. Real-Time Digital Twin for Structural Health Monitoring of Floating Offshore Wind Turbines. J. Mar. Sci. Eng. 2025, 13, 1953. [Google Scholar] [CrossRef]
- Sun, Z.; Li, H.; Bao, Y.; Meng, X.; Zhang, D. Intelligent Risk Prognosis and Control of Foundation Pit Excavation Based on Digital Twin. Buildings 2023, 13, 247. [Google Scholar] [CrossRef]
- Armijo, A.; Zamora-Sánchez, D. Integration of Railway Bridge Structural Health Monitoring into the Internet of Things with a Digital Twin: A Case Study. Sensors 2024, 24, 2115. [Google Scholar] [CrossRef] [PubMed]
- Opoku, D.G.J.; Perera, S.; Osei-Kyei, R.; Rashidi, M. Digital twin application in the construction industry: A literature review. J. Build. Eng. 2021, 40, 102726. [Google Scholar] [CrossRef]
- Jeong, S.; Law, K. An IoT Platform for Civil Infrastructure Monitoring. In Proceedings of the 2018 IEEE 42nd Annual Computer Software and Applications Conference (COMPSAC); IEEE, July 2018; pp. 746–754. [Google Scholar] [CrossRef]
- Karanikoloudis, G.; Barontini, A.; Mendes, N.; Lourenço, P.B. An Integrated Data Acquisition Approach for the Structural Health Monitoring and Real-Time Earthquake Response Assessment of a Retrofitted Adobe Church in Peru. Sensors 2024, 24, 5327. [Google Scholar] [CrossRef] [PubMed]
- Gigli, L.; Zyrianoff, I.; Zonzini, F.; Bogomolov, D.; Testoni, N.; Di Felice, M.; De Marchi, L.; Augugliaro, G.; Mennuti, C.; Marzani, A. Next Generation Edge-Cloud Continuum Architecture for Structural Health Monitoring. IEEE Trans. Ind. Inform. 2024, 20, 5874–5887. [Google Scholar] [CrossRef]
- Martín, C.; Garrido, D.; Llopis, L.; Rubio, B.; Díaz, M. Facilitating the monitoring and management of structural health in civil infrastructures with an Edge/Fog/Cloud architecture. Comput. Stand. Interfaces 2022, 81, 103600. [Google Scholar] [CrossRef]
- González-Gerpe, S.; Cimmino, A.; Bernardos, S.; García-Castro, R.; Poveda-Villalón, M.; Katsigarakis, K.; Lilis, G.N.; Rovas, D. An extension of Thing Descriptions from the Web of Things for Digital Twins. Open Res. Eur. 2022, 2, 144. [Google Scholar] [CrossRef]
- Laadhar, A.; Dongo, J.; Enevoldsen, S.; Revaz, F.; Gabioud, D.; Pedersen, T.B.; Meyer, M.; Nielsen, B.; Thomsen, C. Web of Things Semantic Interoperability in Smart Buildings. Procedia Comput. Sci. 2022, 207, 997–1006. [Google Scholar] [CrossRef]
- Dang, H.; Tatipamula, M.; Nguyen, H.X. Cloud-Based Digital Twinning for Structural Health Monitoring Using Deep Learning. IEEE Trans. Ind. Inform. 2022, 18, 3820–3830. [Google Scholar] [CrossRef]
- Kabir, M.R.; Halder, D.; Ray, S. Digital Twins for IoT-Driven Energy Systems: A Survey. IEEE Access 2024, 12, 177123–177143. [Google Scholar] [CrossRef]
- Microsoft. Digital Twins Definition Language (DTDL). Specification, GitHub repository Azure/opendigitaltwins-dtdl. Accessed. 2026. (accessed on 6 August 2026). [Google Scholar] [PubMed]
- Zhang, J.; Ellwein, C.; Heithoff, M.; Michael, J.; Wortmann, A. Digital twin and the asset administration shell: An Analysis of the Three Types of AASs and their Feasibility for Digital Twin Engineering. Softw. Syst. Model. 2025, 24, 771–793. [Google Scholar] [CrossRef]
- Eclipse Foundation. Eclipse Ditto — Open Source Framework for Digital Twins in the IoT. Accessed. 2026. (accessed on 6 August 2026). Official documentation.
- Schmidt, C.; Volz, F.; Stojanovic, L.; Sutschet, G. Increasing Interoperability between Digital Twin Standards and Specifications: Transformation of DTDL to AAS. Sensors 2023, 23, 7742. [Google Scholar] [CrossRef] [PubMed]
- Sciullo, L.; Trotta, A.; Montori, F.; Bononi, L.; Di Felice, M. WoTwins: Automatic Digital Twin Generator for the Web of Things. In Proceedings of the 2022 IEEE 23rd International Symposium on a World of Wireless, Mobile and Multimedia Networks (WoWMoM); IEEE, June 2022; pp. 607–612. [Google Scholar] [CrossRef]
- Son, S.C.; Ko, S.K.; Lee, H.O.; Lee, S.; Lee, B.T. SIMA: Scalable IoT Microservice Architecture With Users and Things Joint Load Balancing. IEEE Internet Things J. 2024, 11, 8170–8184. [Google Scholar] [CrossRef]
- Rath, C.K.; Mandal, A.K.; Sarkar, A. Microservice based scalable IoT architecture for device interoperability. Comput. Stand. Interfaces 2023, 84, 103697. [Google Scholar] [CrossRef]
- Khriji, S.; Benbelgacem, Y.; Chéour, R.; El Houssaini, D.; Kanoun, O. Design and implementation of a cloud-based event-driven architecture for real-time data processing in wireless sensor networks. J. Supercomput. 2021, 78, 3374–3401. [Google Scholar] [CrossRef]
- Kiran, M.; Murphy, P.; Monga, I.; Dugan, J.; Baveja, S.S. Lambda architecture for cost-effective batch and speed big data processing. In Proceedings of the 2015 IEEE International Conference on Big Data (Big Data); IEEE, Oct 2015; pp. 2785–2792. [Google Scholar] [CrossRef]
- Tao, F.; Zhang, M.; Nee, A. Five-Dimension Digital Twin Modeling and Its Key Technologies. In Digital Twin Driven Smart Manufacturing; Elsevier, 2019; pp. 63–81. [Google Scholar] [CrossRef]
- Wang, C.; Qiao, J.; Huang, X.; Song, S.; Hou, H.; Jiang, T.; Rui, L.; Wang, J.; Sun, J. Apache IoTDB: A Time Series Database for Large Scale IoT Applications. ACM Trans. Database Syst. 2025, 50, 1–45. [Google Scholar] [CrossRef]
- Grzesik, P.; Mrozek, D. Comparative Analysis of Time Series Databases in the Context of Edge Computing for Low Power Sensor Networks. In Computational Science – ICCS 2020; Springer International Publishing, 2020; pp. 371–383. [Google Scholar] [CrossRef]
Figure 1.
Functional-plane architecture of the proposed platform.
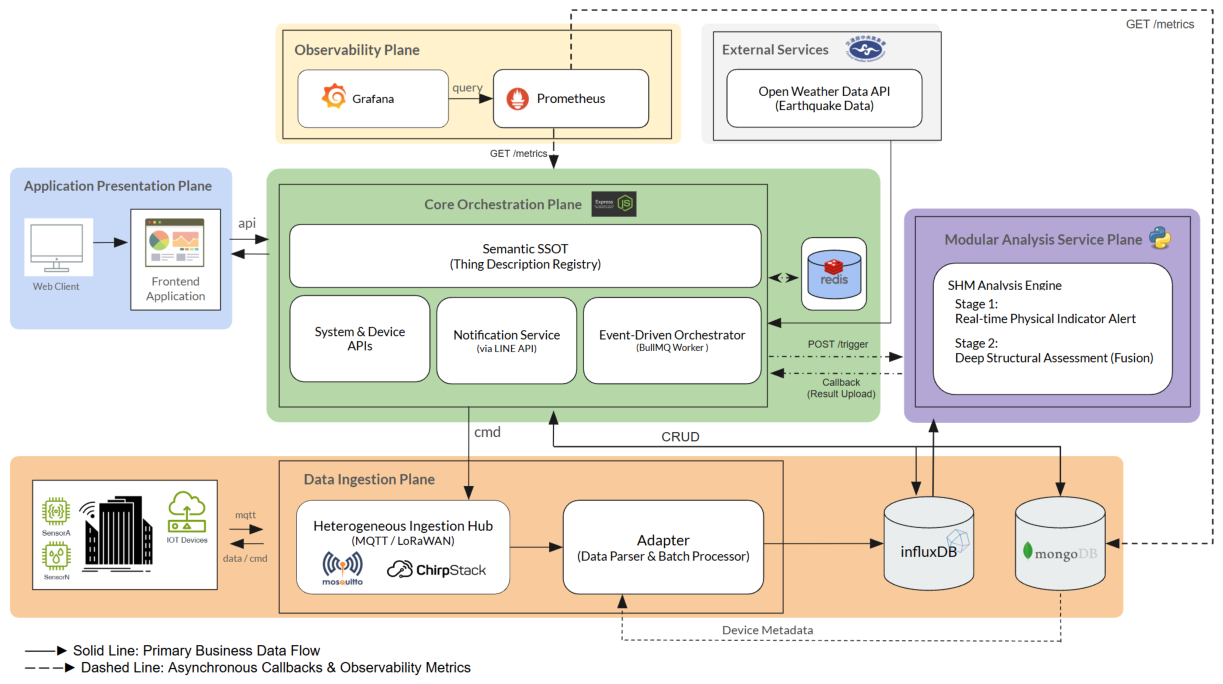
Figure 2.
Event-driven and state-driven dynamic dataflows.
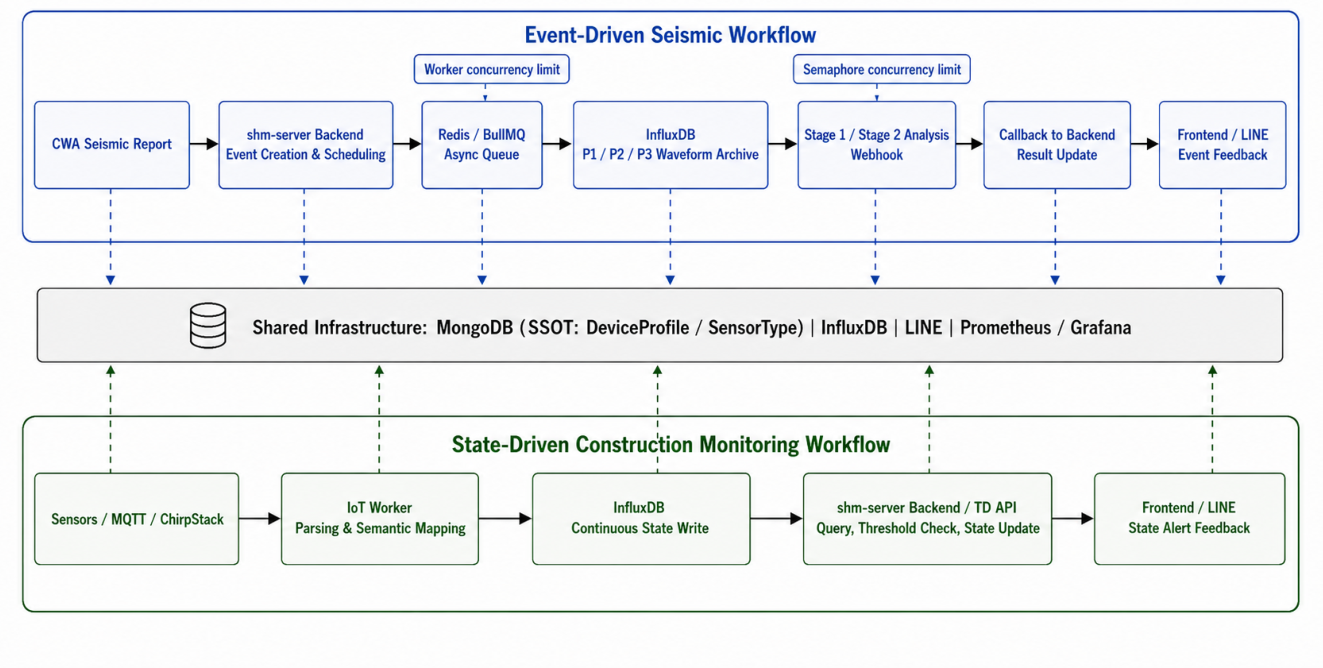
Figure 3.
Multi-level Thing Description topology driven by the semantic SSOT.
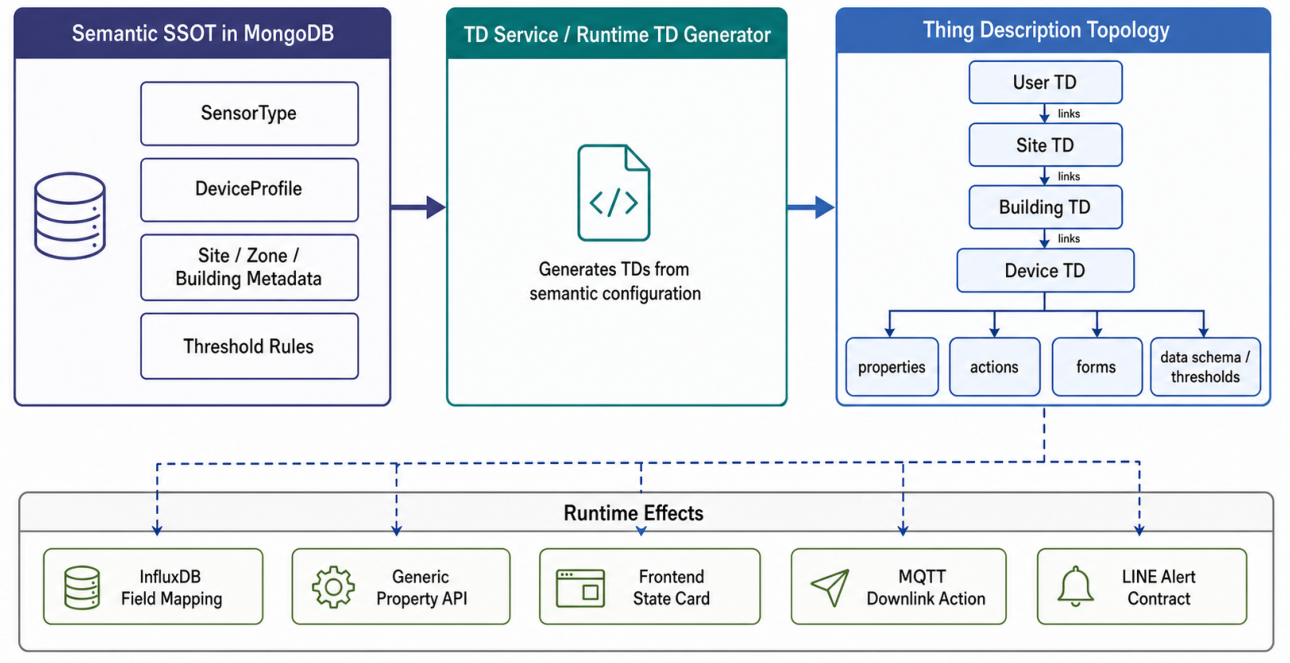
Figure 4.
Implementation of the event-driven seismic workflow.
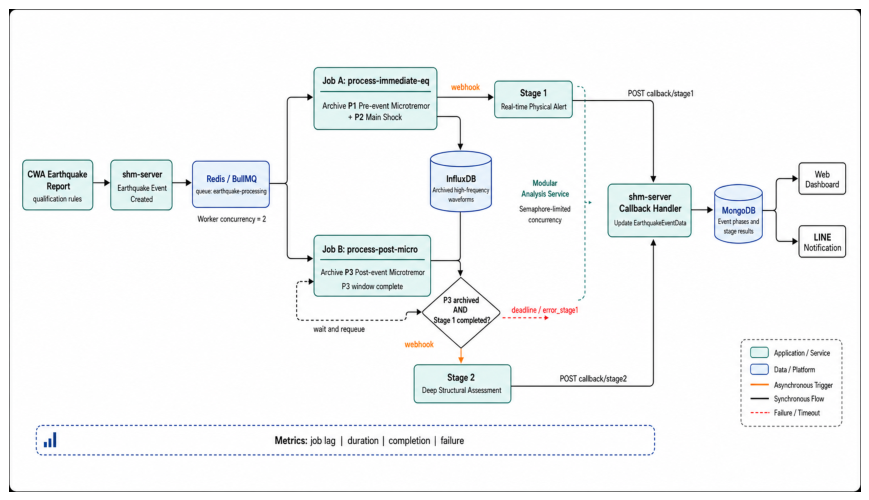
Figure 5.
Platform overview of sites, buildings, and construction zones.
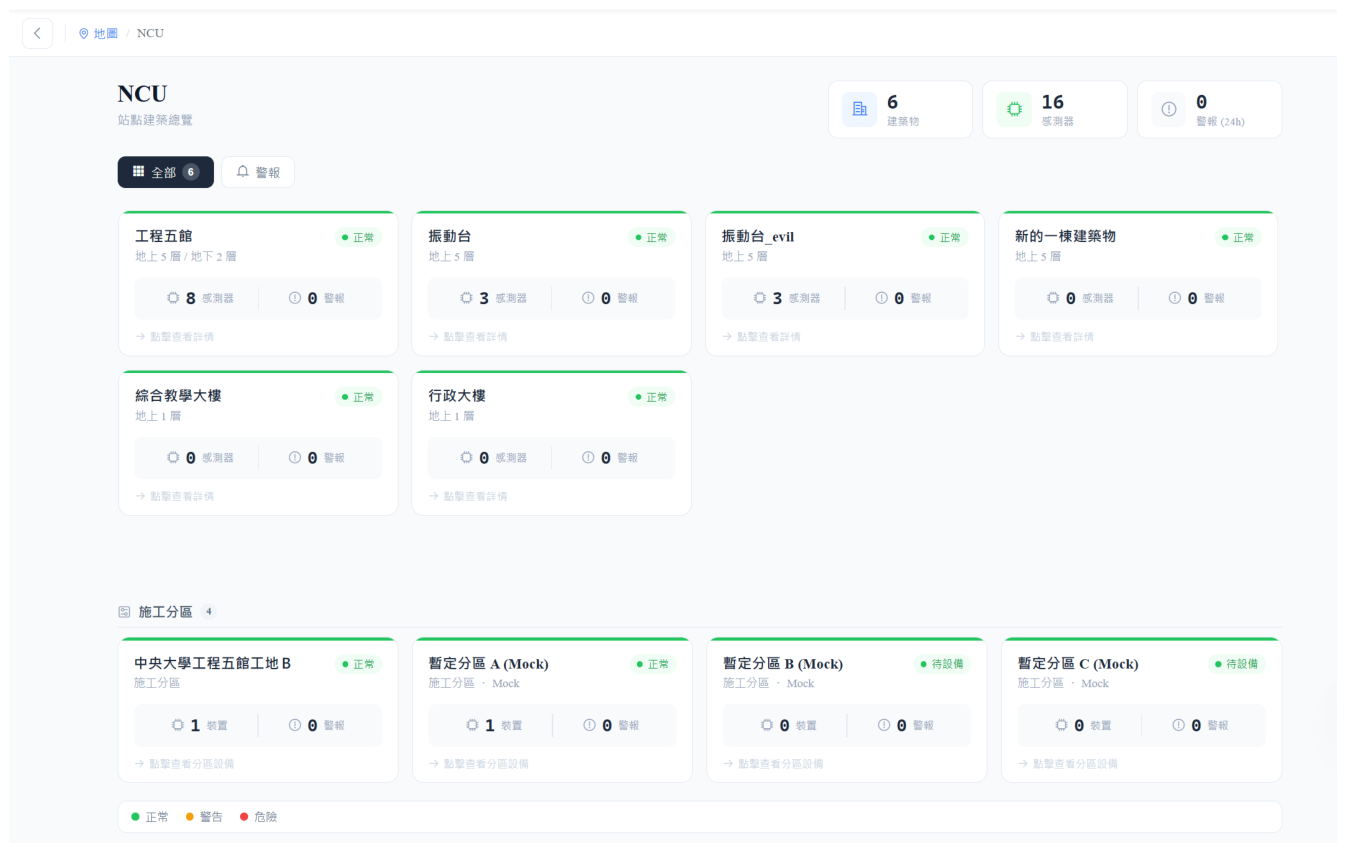
Figure 6.
Correspondence between semantic configuration and the runtime device interface. (a) DeviceProfile configuration. (b) SensorType semantic configuration. (c) Runtime properties and actions for a triaxial accelerometer.
Figure 6.
Correspondence between semantic configuration and the runtime device interface. (a) DeviceProfile configuration. (b) SensorType semantic configuration. (c) Runtime properties and actions for a triaxial accelerometer.
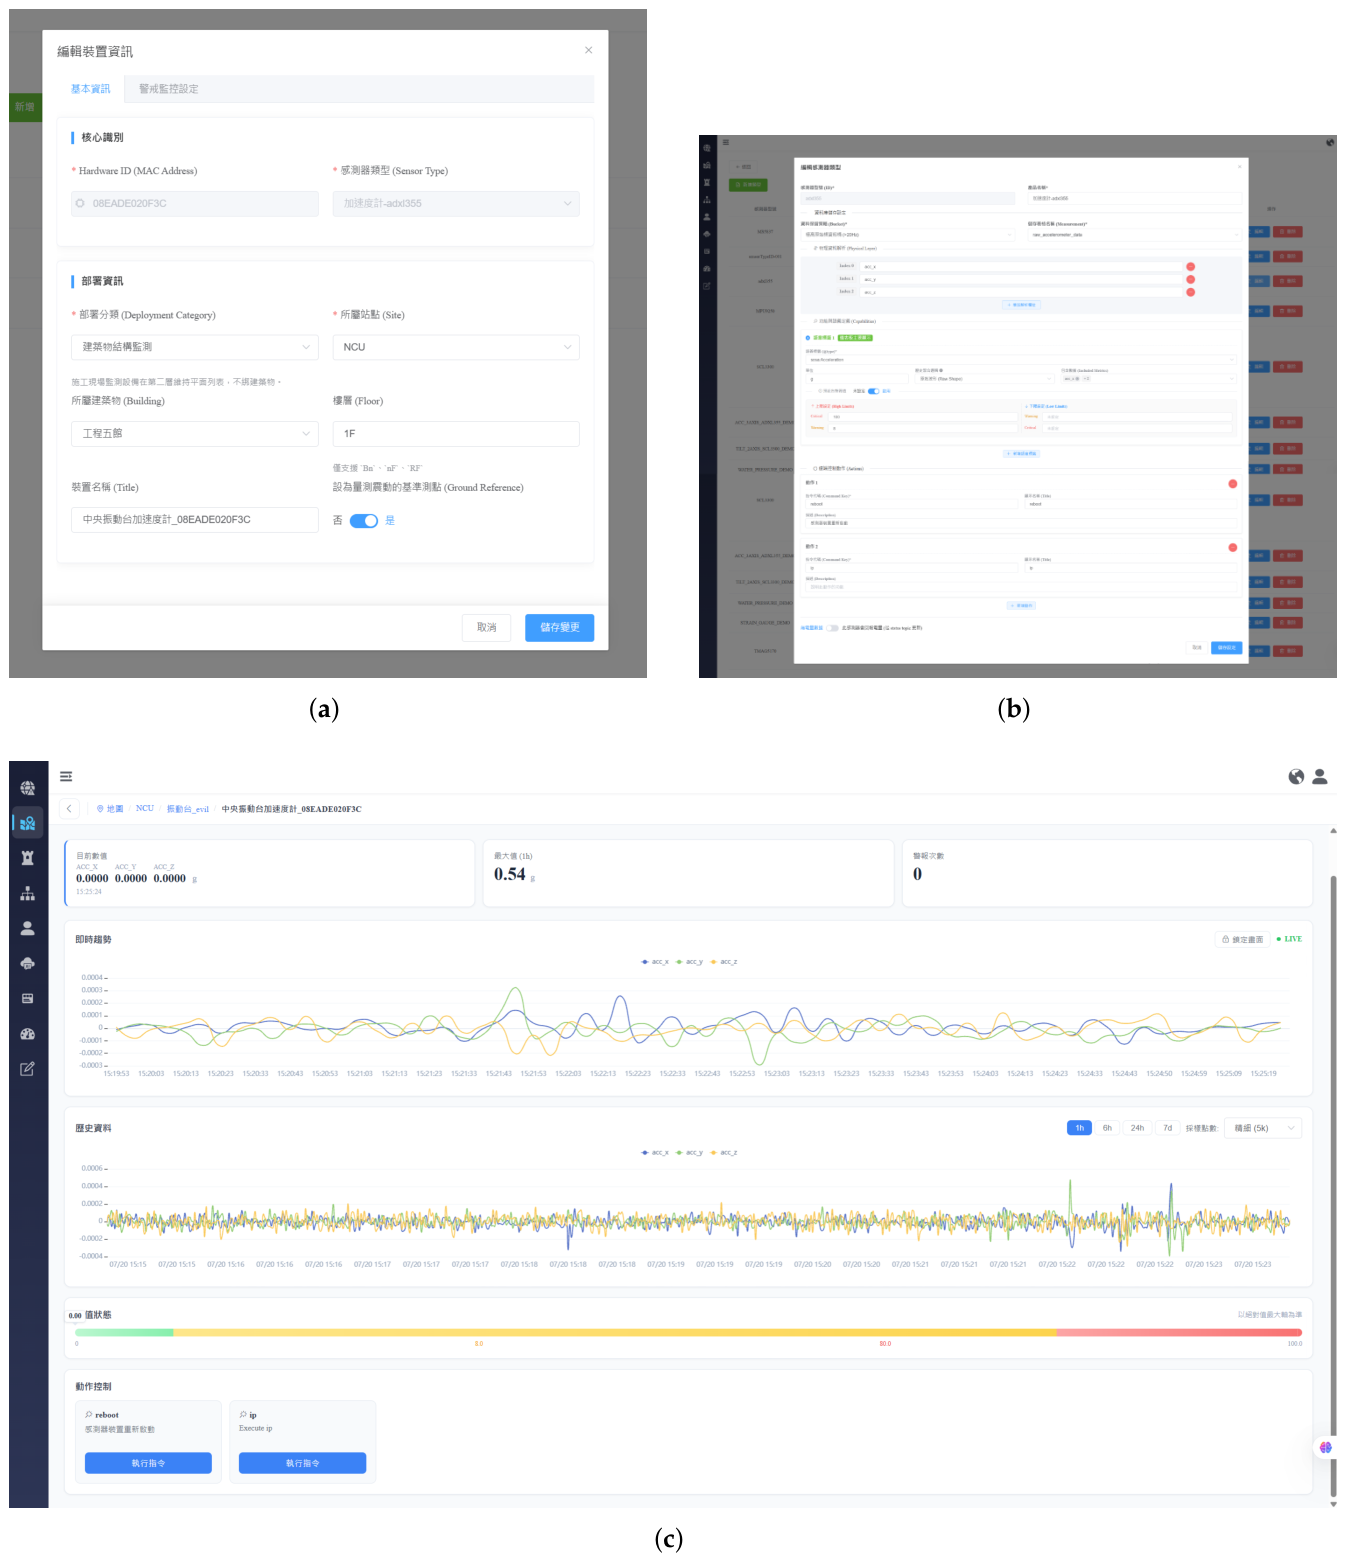
Figure 7.
Integrated summary of a seismic event assessment.
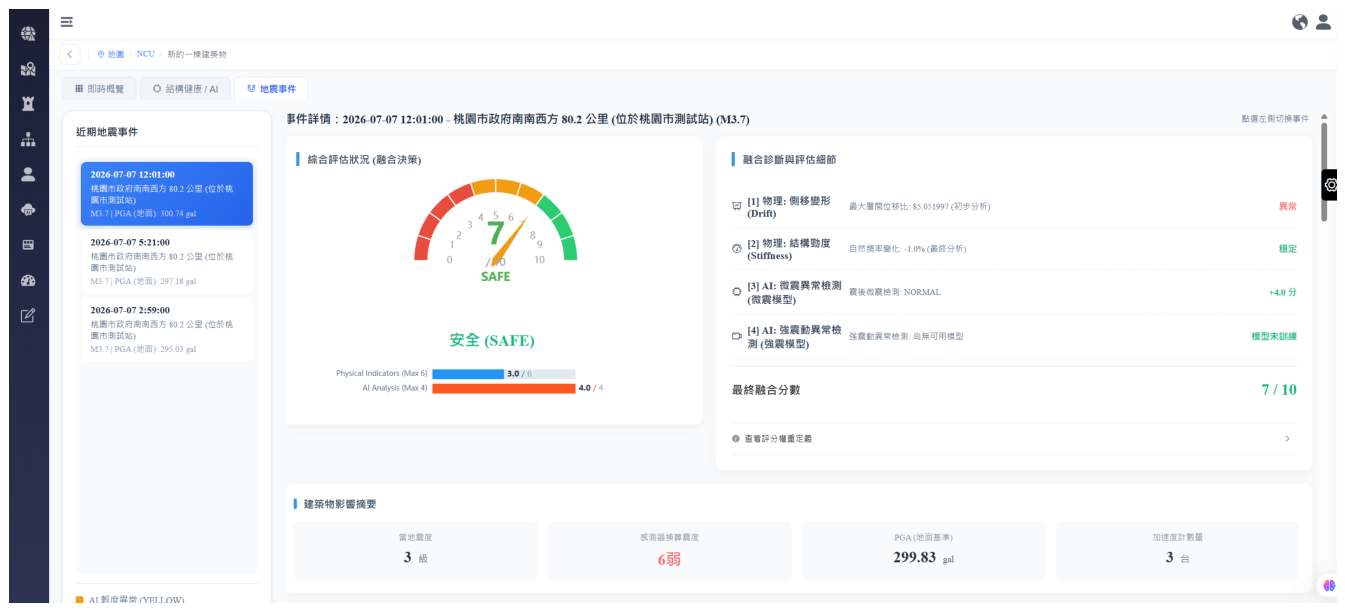
Figure 8.
Real-time and historical construction-tilt trend with threshold state.
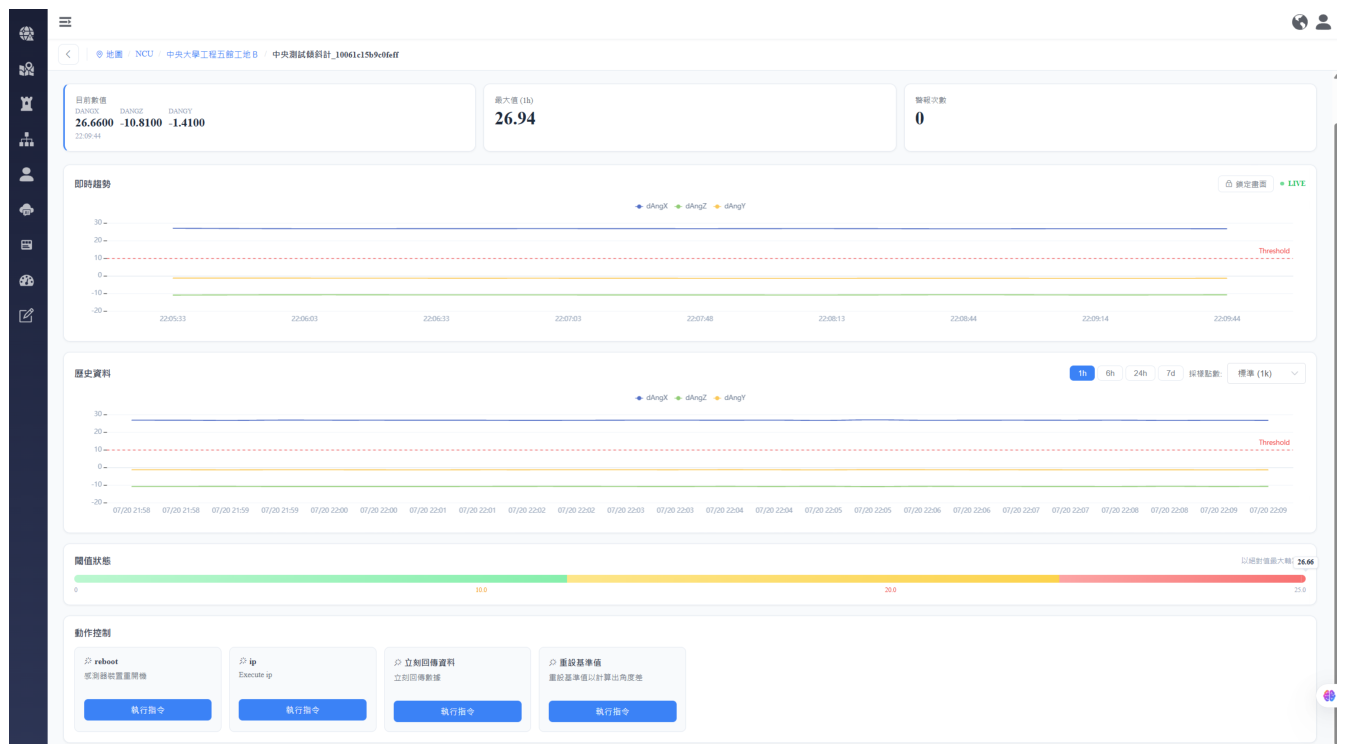
Figure 9.
Existing dashboard presentation after semantic extension. (a) Normal dual-channel strain-gauge state introduced by T2. (b) Alert state after the T4 threshold override.
Figure 9.
Existing dashboard presentation after semantic extension. (a) Normal dual-channel strain-gauge state introduced by T2. (b) Alert state after the T4 threshold override.
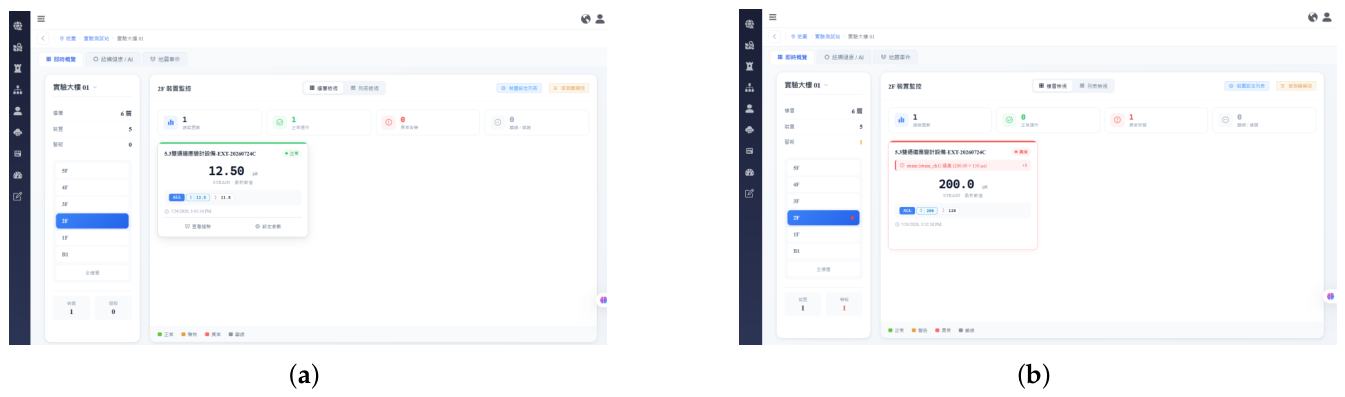
Figure 10.
Measurement boundary and latency decomposition for the event-driven workflow.
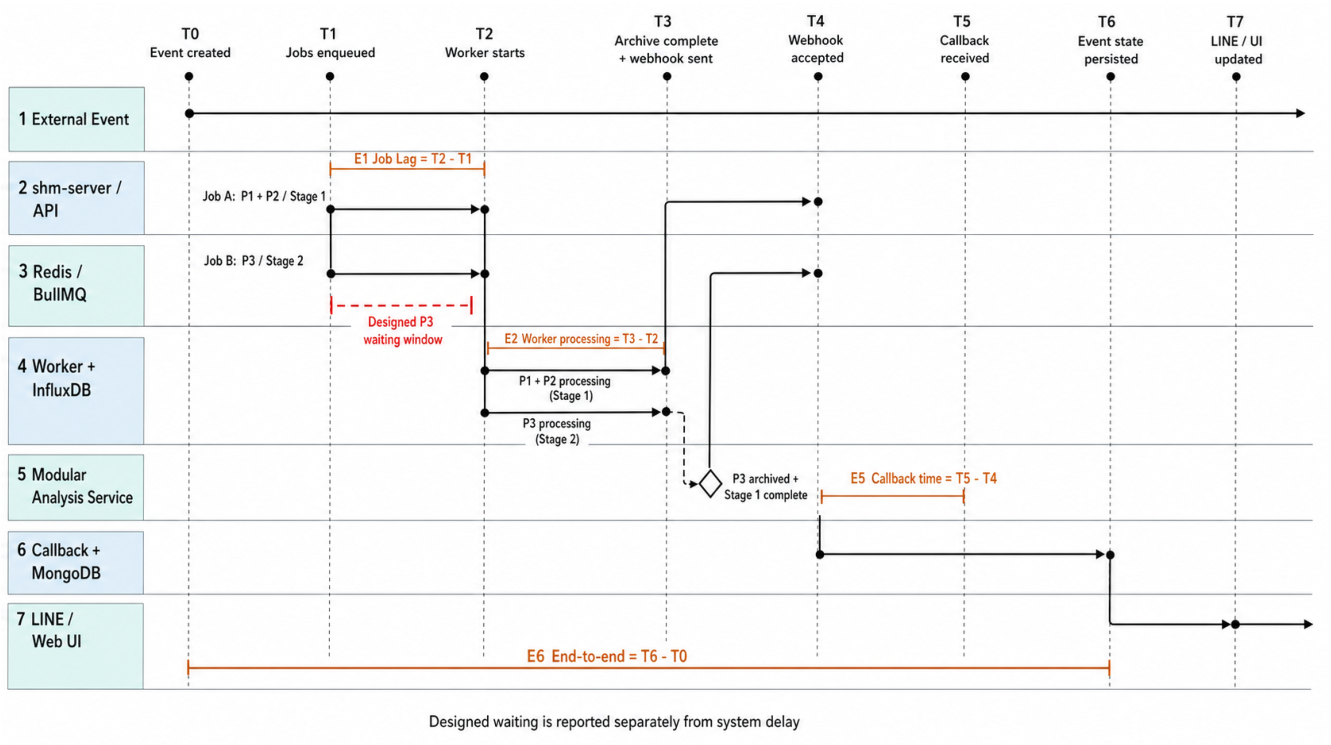
Figure 11.
State-stream ingestion throughput scaling from 10 to 300 sensors.
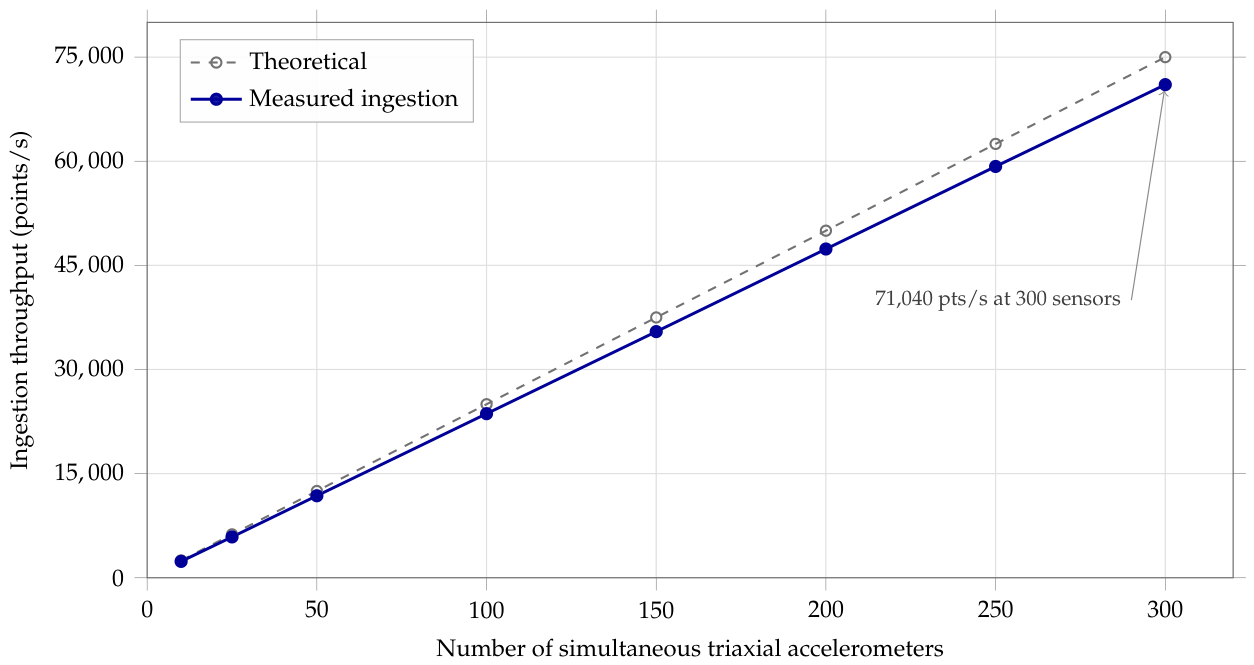

Table 1.
System-integration comparison with representative studies.
| Dimension | [5] Wind-Turbine DT | [6] Excavation DT | [7] Bridge DT | [10] Continuous + Seismic SHM | [11] MAC4PRO | [13,21] WoT TD | This Work |
|---|---|---|---|---|---|---|---|
| Application scope | Single scenario | Single scenario | Single scenario | One structure | Multiple industrial scenarios | General | Multi-scenario SHM |
| WoT TD adoption | No | No | No | No | Yes, device layer | Yes, description layer | Yes, through data and API layers |
| Decoupling from task-specific mapping and schema reconstruction | No | No | No | No | Partial | Partial | Yes, configuration-centered and measured |
| Workflow mode | — | State-driven | Event-driven | Event- and state-driven | Event-driven | — | Event- and state-driven |
| Bidirectional interaction | Partial | Partial | No | No | Partial | Partial, TD actions | LINE notifications and TD/MQTT downlink |
Table 2.
Functional planes, components, and responsibilities.
| Functional Plane | Main Components | Responsibility |
|---|---|---|
| Sensor ingestion and persistence | MQTT, ChirpStack, Gateway Bridge, ingestion service, data-ingestion adapter, InfluxDB, MongoDB | Receive heterogeneous sensor data, parse it from semantic configuration, batch-write time-series data, and maintain site and device metadata |
| Semantic core and workflow orchestration | Backend, TD generator, SensorType and DeviceProfile APIs, BullMQ/Redis, CWA event handling, generic property/action APIs, notification service | Maintain SSOT mapping, serve queries, schedule events, trigger analysis, receive callbacks, and coordinate alerts |
| Modular analysis service | Stage 1 and Stage 2 modular analysis services | Receive HTTP webhooks from the core, perform replaceable analysis, and return results by callback |
| Application interaction and feedback | Vue frontend, LINE Messaging, TD actions, MQTT commands | Present twin state, trends, reports, and alerts; expose operator-triggered feedback and command entry points |
| Observability | Prometheus, Grafana, backend metrics, ingestion metrics | Observe API, InfluxDB, BullMQ, MQTT, notification, and ingestion-worker state across the platform |
Table 3.
Five-dimensional digital-twin model mapped to platform components, with the dimensions established by this work.
Table 3.
Five-dimensional digital-twin model mapped to platform components, with the dimensions established by this work.
| Digital-Twin Dimension | Platform Realization | What This Work Establishes |
|---|---|---|
| Physical entity | Buildings, construction zones, accelerometers, tiltmeters, gateways, and sensor deployments | — |
| Virtual entity | Site, building, zone, SensorType, DeviceProfile, generated WoT TD, event records, and dashboard state | Semantic decoupling: one TD contract represents devices across both scenarios, so the virtual model stays unified as scenarios are added |
| Connection | MQTT, HTTP webhook and callback, generic property/action APIs, and MQTT downlink commands | Automated physical-to-digital synchronization, with an operator-triggered digital-to-physical channel |
| Data | InfluxDB time-series data; MongoDB metadata, semantic configuration, events, and results | Workflow coexistence: the shared persistence path keeps state current during an event burst |
| Service | Event orchestration, archival, modular analysis, threshold evaluation, notification, visualization, and observability | Both workflows reuse the same orchestration, notification, and observability services |
Table 4.
Mapping from the research gaps identified in Section 2 to design responses and evaluation evidence.
Table 4.
Mapping from the research gaps identified in Section 2 to design responses and evaluation evidence.
| Research Gap | Design Response | Evaluation Evidence |
|---|---|---|
| Multi-scenario platforms rarely maintain device, site, field, and threshold consistency through a common semantic model | Semantic SSOT formed from SensorType, DeviceProfile, and site configuration, with runtime TD generation | Change footprint concentrated in semantic configuration |
| WoT TD is used for device description rather than as a runtime contract spanning persistence and generic APIs | Schema-on-write persistence and generic property/action APIs driven by the same semantic contract | Zero manual data-layer and backend change across the extension tasks |
| Event-driven and state-driven workflows are studied independently, with limited evidence of coexistence on shared infrastructure | Event queue, segmented archiving, fixed worker concurrency, batch ingestion, and a separate analysis host | Controlled event-performance and state-stability experiments |
Table 5.
Experimental environment and data sources.
| Category | Item | Value |
|---|---|---|
| Hardware | Test host | Intel Core i7-9700, 8C/8T at 3.00 GHz; 47.9 GiB RAM; approximately 621.5 GiB free disk; Docker available memory approximately 7.756 GiB |
| Operating system and containers | Platform | Windows 11 Pro 10.0.22621 (64-bit); Docker 29.0.1; Docker Compose v2.40.3 |
| Core services | Versions | MongoDB 6.0.28; InfluxDB 2.7.12; Redis 7.4.8; Mosquitto 2.1.2 |
| Monitoring | Versions and interval | Prometheus 3.11.3; Grafana 13.0.1; 15 s scrape interval |
| Event data | Seismic replay | 10 buildings with three accelerometers each; one local test earthquake expands to 2, 10, or 20 Job A/Job B pairs |
| State-flow data | Continuous replay | 10 accelerometers at 250 Hz with 40 samples per batch; target 2500 triaxial sample groups/s, measured sender median 2400 groups/s |
| Experiment window | State-flow duration | Each state-flow run lasts 10 min; burst injection at 30 s where applicable; stable statistics exclude the first and final 30 s of active sending |
| Repetitions | Formal runs | F1, F5, and F10 were each executed once; their percentiles describe within-run task distributions and should be repeated at least three times before cross-run inference |
Table 6.
Evaluation framework and decision bases.
| Proposition | Experiment | Primary Decision Basis |
|---|---|---|
| Semantic decoupling | Change-footprint extension | Manual data-layer, backend, and ingestion changes are zero or confined to semantic configuration, and the end-to-end link passes |
| Event workflow absorbs burst load | Event-driven workflow performance | All dispatched jobs and event documents complete, callbacks write back and remain queryable, and no job failure, restart, or out-of-memory condition occurs; latency is reported as the cost of absorption |
| Event burst does not collapse the state flow | State-flow stability and resource isolation | Ingestion throughput and write lag show no engineering-significant degradation relative to baseline |
| Ingestion capacity and observability | High-throughput ingestion | High-throughput ingestion produces no dropped points or flush errors, and metrics explain the observed behavior |
Table 7.
Extension-task design.
| Task | Content | Main Changed Layer |
|---|---|---|
| T1 | Add one device of an existing type | One DeviceProfile semantic configuration |
| T2 | Add a new dual-channel strain-gauge sensor type and one device | SensorType field mapping, virtual properties, default thresholds, and DeviceProfile |
| T3 | Add one site and one zone within the existing construction-monitoring deployment category, then deploy a T2 device | Site, zone, and DeviceProfile; no third deployment category |
| T4 | Adjust the threshold and sampling-rate metadata of the T2 device | DeviceProfile threshold and sampling-rate override |
Table 8.
Change footprint for each extension task. M1a: manual data-layer change; M1b: schema formed on write; M2a: backend change; M2b: ingestion change; M3: frontend change; M4: semantic configuration change; M5: redeployment; M6: end-to-end result.
Table 8.
Change footprint for each extension task. M1a: manual data-layer change; M1b: schema formed on write; M2a: backend change; M2b: ingestion change; M3: frontend change; M4: semantic configuration change; M5: redeployment; M6: end-to-end result.
| Task | M1a | M1b | M2a | M2b | M3 | M4 | M5 | M6 |
|---|---|---|---|---|---|---|---|---|
| T1 | 0 | 0 | 0 | 0 | 0 | 1 DeviceProfile; 13 leaf paths | None; effective in 30.975 s | Pass |
| T2 | 0 | +1 measurement; +2 fields | 0 | 0 | 0 | 1 SensorType and 1 DeviceProfile; 34 leaf paths | None; effective in 59.986 s | Pass |
| T3 | 0 | 0 | 0 | 0 | 0 | 1 site, 1 zone, and 1 DeviceProfile; 23 leaf paths | None; effective in 59.904 s | Pass |
| T4 | 0 | 0 | 0 | 0 | 0 | 1 DeviceProfile update; 5 leaf paths | None; alert readback in 6.263 s | Pass |
Table 9.
Event-driven workflow latency. Job lag and end-to-end completion (E6) follow the definitions in Figure 10. Job B queueing excludes the fixed 15 s P3 design wait.
Table 9.
Event-driven workflow latency. Job lag and end-to-end completion (E6) follow the definitions in Figure 10. Job B queueing excludes the fixed 15 s P3 design wait.
| Case | Buildings / Jobs | Job A Lag p50 / p95 | Stage 1 E6 p50 / p95 | Job B Queueing p95 | Stage 2 E6 p50 / p95 | Stage 1 / 2 Success |
|---|---|---|---|---|---|---|
| F1 | 1 / 2 | 0.008 / 0.008 s | 9.318 / 9.318 s | 0.085 s | 33.265 / 33.265 s | 100% / 100% |
| F5 | 5 / 10 | 17.066 / 30.733 s | 34.786 / 47.257 s | 35.425 s | 59.372 / 70.887 s | 100% / 100% |
| F10 | 10 / 20 | 26.580 / 54.423 s | 43.174 / 69.675 s | 76.859 s | 98.194 / 121.954 s | 100% / 100% |
Table 10.
State-flow performance and resource isolation across the baseline, coexistence, and sensitivity-control conditions.
Table 10.
State-flow performance and resource isolation across the baseline, coexistence, and sensitivity-control conditions.
| Metric | S0 Baseline | S1 Coexistence | S2 Sensitivity Control |
|---|---|---|---|
| Continuous write throughput p50 / p95 | 6702.0 / 7026.0 field rows/s | 6716.7 / 7060.5 field rows/s | 6715.8 / 7002.0 field rows/s |
| Write lag p50 / p95 / p99 | 522 / 969 / 1024 ms | 498 / 949 / 1006 ms | 526 / 970 / 1013 ms |
| Event job lag p95 | No event job | Job A 549 ms; Job B 16,341 ms including the 15 s design wait | Job A 271 ms; Job B 16,062 ms including the 15 s design wait |
| Event completion | — | 20 of 20 jobs; 0 failures; queue idle at end | 20 of 20 jobs; 0 failures; queue idle at end |
| Service availability | No out-of-memory condition; 0 restarts | No out-of-memory condition; 0 restarts | No out-of-memory condition; 0 restarts |
Table 11.
Summary of proposition verification.
| Proposition | Direct Evidence | Conditions and Extrapolation Boundary |
|---|---|---|
| Semantic decoupling: extensions concentrate in semantic configuration | Runtime source-hash difference of zero; manual data-layer, backend, ingestion, and frontend change of zero across T1–T4; schema-on-write added one measurement and two fields in T2; end-to-end link passed | Existing MQTT/JSON ingestion, generic property APIs, and the two modeled deployment categories |
| The event workflow absorbs burst load | F10 completed 20 of 20 jobs and 10 of 10 event documents with 100% two-stage callback success and no failure, restart, or out-of-memory condition; Job A lag p95 of 54.423 s characterizes the cost | Mock analysis service; one run per scenario; not model accuracy, inference speed, or production-service memory peak |
| An event burst does not degrade state monitoring | Write lag p95 of 969, 949, and 970 ms for S0, S1, and S2; all 40 burst jobs across S1 and S2 completed with an idle queue; supplementary query latency p95 of 30.3 and 31.4 ms | Shared ingestion and write path only; alert evaluation and external notification latency not measured |
| Ingestion capacity sustains the offered load | 71,040 points per second at 300 sensors with zero dropped points and zero flush errors; resident memory bounded at 94–121 MiB | Controlled replay on one host; storage capacity and retention become the long-term constraint |
Disclaimer/Publisher’s Note: The statements, opinions and data contained in all publications are solely those of the individual author(s) and contributor(s) and not of MDPI and/or the editor(s). MDPI and/or the editor(s) disclaim responsibility for any injury to people or property resulting from any ideas, methods, instructions or products referred to in the content. |
© 2026 by the authors. Licensee MDPI, Basel, Switzerland. This article is an open access article distributed under the terms and conditions of the Creative Commons Attribution (CC BY) license (http://creativecommons.org/licenses/by/4.0/).
Copyright: This open access article is published under a Creative Commons CC BY 4.0 license, which permit the free download, distribution, and reuse, provided that the author and preprint are cited in any reuse.