

Submitted:
19 August 2026
Posted:
21 August 2026
You are already at the latest version
Abstract
Perennial crops are a key component of sustainable agriculture due to their higher carbon storage compared to annual systems. Improving their mapping is essential to support effective public policies. This study proposes an integrated approach combining field observations, waveform LiDAR data from Global Ecosystem Dynamics Investigation (GEDI), and hyperspectral imagery from EnMAP to enhance perennial crop classification.Field data were used to develop an interpretation key for the analyzed classes. GEDI Level 1B waveforms were normalized to extract metrics such as the number of peaks, while structural attributes, including canopy height (RH95), were derived from GEDI Level 2A. From EnMAP imagery, spectral reflectance was obtained and processed using mean values, first- and second-order derivatives, and continuum removal. Differences among classes were evaluated using Tukey’s test and principal component analysis (PCA). Results show that waveform structure and canopy height significantly distinguish secondary vegetation from perennial crops. Additionally, spectral regions in the visible and shortwave infrared present significant differences between these classes. These findings demonstrate that integrating structural and spectral variables improves the discrimination of perennial crops and helps overcome challenges in separating them from secondary vegetation.
Keywords:
agriculture
; remote sensing
; statistic
1. Introduction
Land-use change emissions remain the largest source of uncertainty in the global carbon budget, with Brazil ranking among the world’s largest emitters [1]. In Brazil, most emissions are driven by deforestation associated with the expansion of livestock production [2] and agriculture [3] in the Amazon biome. While the expansion dynamics of large-scale annual crops are relatively well documented (e.g. [4]) the contribution of perennial crops to carbon fluxes remains poorly understood. Perennial systems may contribute to climate change mitigation, as they generally store more carbon than annual crops [5]. However, some perennial crop systems are associated with biodiversity declines [6] and expansion over primary forests [7]. Therefore, accurately mapping perennial crops is essential to support territorial planning and inform the design and implementation of effective public policies.
Perennial crops are those that remain productive for more than three years and allow one or more harvests to be obtained annually, regardless of whether flowering occurs every year [8], play a crucial socioeconomic role in the Amazon, particularly in the state of Pará. This state is Brazil’s leading producer of açaí (Euterpe oleracea), cocoa (Theobroma cacao L.), and oil palm (Elaeis spp.), which support local livelihoods and regional economies. According to the most recent Agricultural Census [9], the harvested areas for these crops were 35,374 ha for açaí, 18,140 ha for cocoa, and 863 ha for oil palm [10], illustrating the expanding footprint of perennial agriculture in the region.
Previous efforts to map perennial crops have relied on optical remote sensing observa-tions [11,12,13,14,15,16,17,18,19,20,21], Synthetic Aperture Radar [22,23,24], and multisource approaches that combine optical and radar imagery [25,26,27,28,29,30,31,32,33,34,35,36,37]. Accurately mapping perennial crops remains challeng-ing because they often resemble forests or secondary vegetation in spectral reflectance [38,39]. This challenge is particularly pronounced in agroforestry systems, which feature multiple canopy layers and thus appear more forest-like. Smallholder plots, typically smaller than 5 ha, further complicate mapping due to variability in crop composition, canopy height, spacing, and management practices such as irrigation and pruning. For these reasons, characterizing the structural attributes of perennial crops is essential: un-derstanding canopy architecture and vertical complexity can help reduce misclassification errors and guide the selection of the most relevant variables for remote sensing analyses. Incorporating structural information into mapping approaches enables not only the classifi-cation of general crop types but also the detection of features that distinguish them from secondary forests.
LiDAR (Light Detection and Ranging) sensors involve an active remote sensing tech-nology that emits laser pulses and measures the time taken for the reflected energy to return to the sensor, enabling the retrieval of the three-dimensional structure of vegetation [40]. Unlike radar sensors, LiDAR can penetrate the tree canopy and record multiple returns from different vegetation layers, providing detailed information on canopy height and vertical structure. This capability is particularly valuable for perennial crops, which often exhibit complex canopy architectures similar to forests, thereby aiding in their dif-ferentiation from forest and secondary vegetation. NASA’s Global Ecosystem Dynamics Investigation (GEDI) is a spaceborne LiDAR instrument specifically designed to measure Earth’s surface structure, including detailed three-dimensional canopy characteristics of terrestrial vegetation [41]. Therefore, LiDAR enables a more detailed characterization of vegetation structure compared to radar imagery.
Hyperspectral data can capture a large number of narrow and contiguous spectral bands across the electromagnetic spectrum [42]. This capability allows hyperspectral data to be used as an additional resource to improve the classification accuracy of perennial crops. Furthermore, unlike multispectral sensors, hyperspectral sensors provide more detailed spectral reflectance information for different species, which enhances the separability of target classes such as forests and perennial crops. These sensors have been widely used in agriculture, including ground-based in situ measurements [43,44], studies using airborne sensors [45], plant disease detection [46], and the assessment of plant nutrient status [47].
Therefore, to the best of our knowledge, no previous studies have integrated hyper-spectral data and GEDI measurements to specifically characterize perennial crops and evaluate their differences relative to secondary vegetation, which has been identified as one of the main challenges in mapping perennial crops in previous studies [38,39]. In this context, the present study aims to integrate ground observations, waveform LiDAR, and hyperspectral imagery (EnMAP) to characterize the structural and spectral properties of perennial crops. Specifically, the objectives are to (1) quantify differences among crop types and between crops and secondary forests, and (2) identify the combinations of observations that are most effective for automated classification.
2. Materials and Methods
2.1. Study Area
The state of Pará covers an area of 1,245,870.7 km², with a population of approximately eight million inhabitants and 144 municipalities [48]. It is the largest producer of perennial crops within the Amazon biome. The municipalities of Brasil Novo, Medicilândia, and Uruará (Figure 1) were selected as the study area because they are located in the region with the highest cocoa production in the state of Pará—the Transamazônica region. The municipality of Tomé-Açu (Figure 1), located in the northeastern region of the state, was included due to its high variability among the analyzed classes, characterized by diverse species compositions and arrangements in agroforestry systems.
Mendes [49] identified cocoa-producing regions in the state of Pará by analyzing the spatial distribution of cocoa production and the region’s edaphoclimatic conditions. The Transamazon region is characterized by a tropical humid climate (Aw), according to the Köppen climate classification, with a mean annual temperature of approximately 24.3 °C, relative humidity ranging from 78% to 84%, and mean annual precipitation of 2,048 mm. The soils in this region generally present medium to high natural fertility. The southeastern area is classified as having an Am climate type according to Köppen, with an average annual temperature around 24 °C, relative humidity from 69% to 88%, and yearly precipitation ranging from 1,400 to 2,300 mm. Cocoa farms in this region are typically located on soils with medium to high natural fertility and in predominantly flat to gently undulating landscapes. Furthermore, these municipalities were selected because hyperspectral data are only available for these locations.
2.2. Data source
2.2.1. Field polygons
Ground observations were collected during a field campaign conducted in 2022. GPS points were recorded at 229 sites, and polygons were digitized for each point based on spa-tial homogeneity using QGIS [50]. These data were used to develop a visual interpretation key (Table 1), which guided sample selection using publicly available high–spatial resolu-tion imagery from Google Satellite accessed via the QuickMapServices plugin. Advanced-stage secondary vegetation is legally defined by CONAMA [51] resolution No. 033/1994 based on field metrics, specifically as arboreal phytophysiognomy with a height exceeding 8 m. Because these sub-canopy structural attributes cannot be directly measured using optical satellite imagery, this successional stage was inferred indirectly. In high-spatial-resolution imagery, such areas were identified by their complex canopy texture, larger apparent crown diameters, and deep shadow patterns indicative of taller and more structurally developed forest canopies.
2.2.2. GEDI
The Global Ecosystem Dynamics Investigation (GEDI) is a full-waveform LiDAR instrument installed on the International Space Station that produces detailed observations of the three-dimensional structure of Earth’s surface [52]. To achieve the objectives of this study, we used GEDI Levels 1B and 2A from 2024 to 2025. Level 1B provides geolocated waveforms [53], while Level 2A supplies ground elevation, canopy top height, and relative height (RH) metrics [54]. Therefore, these data can be used for a wide range of applications, such as estimating aboveground biomass [55], complementing local information on agricul-tural classes [56], and mapping forest vertical stratification [57]. In this study, we use these data to characterize the canopy structure of perennial crops.
2.2.3. ENMAP
The Environmental Mapping and Analysis Program (ENMAP) is a German hyper-spectral satellite launched in 2022. Its data may be used depending on the availability of cloud-free observations and comprises 246 spectral bands. The images capture visible, near-infrared (420-1000nm), and shortwave regions (900-2450nm) of the spectrum and have a spatial resolution of 30 meters [58].These 2024 data will be used to characterize the spectral reflectance of perennial crops and were downloaded from the DLR website (https://planning.enmap.org/ips/apphome).
2.3. Method
GEDI Level 1B geolocation points were used as samples and labeled as either perennial crops or secondary vegetation. Subsequently, the waveforms and relative height data were collected. Then, we normalized and quantified the number of peaks for the waveforms data using a Python code that we created, a modified version (https://doi.org/10.5281/zenodo.18445582). These labeled plots of GEDI Level 1B were then employed to extract spectral reflectance from ENMAP images using the EnMAP-Box extension integrated within QGIS, ensuring that the spectral signatures corresponded to the samples used in the GEDI analysis (Figure 2). GEDI Level-2 data were filtered to retain only observations acquired in full-power beam mode, during nighttime, and with beam sensitivity greater than 0.9 [59]. Thus, the dataset was reduced from 403 to 256 samples.
Python and R programming languages were employed in this study. Python was primarily used to extract GEDI Level-1 and Level-2 datasets, while R was used to generate reflectance spectra, PCA, and box plots. To analyze the spectral reflectance, four methods were applied. First, the mean reflectance values were calculated, followed by the application of a Savitzky–Golay smoothing filter. Continuum removal was then performed, along with the calculation of the first and second order derivatives (Figure 2).
Derivative analysis is based on the finite difference approximation and corresponds to the rate of change of the target’s reflectance with respect to wavelength. This procedure highlights absorption or scattering points across multiple sampling scales. Consequently, derivative analysis allows the identification of subtle differences in reflectance spectra, facilitating the detection of species [60], plant diseases [61,62,63], growth stages [64], and abiotic stress factors [65]. Considering that the n spectral bands and their values in the i-th spectrum at wavelength i are denoted by S(i), the reflectance spectrum can be represented as shown in Equation 1 [60].
where T denotes the transpose. In this way, the first-order derivative can be expressed as follows [66]:
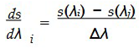 (2)
(2)
s = [s(1), s(2), s(3), . . . , s(n)]T
(2)
where  is the first derivative with respect to wavelength λ, and Δλ = λj − λi (λj > λi)
represents the distance between the centers of two adjacent bands. Based on this
is the first derivative with respect to wavelength λ, and Δλ = λj − λi (λj > λi)
represents the distance between the centers of two adjacent bands. Based on this
is the first derivative with respect to wavelength λ, and Δλ = λj − λi (λj > λi)
represents the distance between the centers of two adjacent bands. Based on thisderivation, the extrema of the spectral reflectance curve can be measured. A subsequent differentiation yields the second derivative, which provides information about the concavity of the reflectance spectrum curve. Equation 3 can be used to calculate the second-order derivative [66].
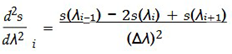 (3)
(3)
(3)
where  is the second-order derivative at wavelength λi, and Δλ is the distance between
the centers of adjacent bands i, j, and k, where λk > λj > λi and Δλ = λj − λi = λk − λj.
is the second-order derivative at wavelength λi, and Δλ is the distance between
the centers of adjacent bands i, j, and k, where λk > λj > λi and Δλ = λj − λi = λk − λj.
is the second-order derivative at wavelength λi, and Δλ is the distance between
the centers of adjacent bands i, j, and k, where λk > λj > λi and Δλ = λj − λi = λk − λj.Continuum removal was applied to identify and extract spectral features present in the reflectance spectra. The spectral continuum is determined based on the local maximum reflectance values of the spectrum [67]. Feature extraction involves measuring the depth, which can be related to the abundance of the analyzed substance; the width, which may indicate the symmetry of absorption bands; and the deepest points of the feature [68]. By removing the continuum, individual absorption characteristics can be compared directly from a common baseline [69]. This approach enables the comparison of reflectance spectra among different perennial crops and targets that are prone to misclassification, helping to identify spectral regions that provide greater separability between classes.
Finally, Principal Component Analysis (PCA), robust Principal Component Analysis (rPCA), and Tukey’s test were performed to assess whether structural or spectral differences exist among the analyzed classes. PCA was also used to extract information from the image by capturing as much variance as possible and representing it in a decorrelated, low-dimensional form [70]. Therefore, it is important to reduce computational requirements, as this feature extraction process reduces the dimensionality of the data. The robust version separates the outliers directly from the matrices and deals better with outliers than the classic one [71]. In this context, the combined use of hyperspectral and LiDAR sensors can provide a more comprehensive biophysical characterization of perennial crops. Such sensors have already been successfully applied in other studies, including the estimation of above-ground biomass [72] and the assessment of forest disturbance [73].
3. Results
3.1. GEDI Waveform Characterization Across Vegetation Classes
GEDI L1B data was employed to analyze the structural characteristics of perennial crops and the canopy of secondary vegetation. It is important to emphasize that the analysis focused on the waveform shape rather than height metrics, as Level-1 data do not include relative-height corrections—such as those available in Level-2 products. Figure 3 presents the Number of peaks observed in the GEDI waveform profiles.
The lower number of peaks on the waveform profiles of the açaí samples corresponds to the canopy and the signal response from the soil (Figure 4A). As shown in Figure 5A,B, açaí plantations exhibit wide spacing, enabling soil visibility in satellite imagery. In contrast, the waveform of an açaí agroforestry system displays a greater number of peaks (Figure 3), indicating different canopy heights (Figure 5C,D), and consequently, a higher number of signal responses (Figure 4B).
Cocoa, a perennial tree crop [74], exhibited behavior similar to the açaí crop, with fewer peaks in cocoa plantations in a monocrop system and more peaks in an agroforestry system (Figure 3, 4C, and 4D). It is possible to observe on Figure 5E, 5F, 5G, and 5H that cocoa in an agroforestry system has more canopies compared to cocoa in a monocrop system. Palm oil has a lower number of peaks, with most of the values between 1 and 2 (Figure 3 and 4E). Then, this lower number of peaks is related to the palm oil cultivation system (Figure 5I, and 5J).
Finally, secondary vegetation exhibits pronounced waveform dispersion with the greatest number of peaks (Figure 3 and 4F), indicating signal returns spread across a wide range of canopy heights. This pattern reflects a structurally heterogeneous canopy (Figure 5K and 5L) with multiple vertical strata.
3.2. Comparison of Relative Height Percentiles for Target Typologies
The values presented in Figure 6 correspond to the GEDI L2B dataset, specifically the relative height (RH) metrics for each analyzed land use and cover class. The results indicate that secondary vegetation presents greater canopy heights than the other perennial crops across the RH50, RH75, and RH95 metrics. Açaí and oil palm exhibited similar height patterns based on RH95 values, which is consistent with field observations (Figure 7). Cocoa and açaí agroforestry systems showed comparable results, while açaí monocrop and agroforestry systems differed across almost all RH metrics. Finally, cocoa grown under full sun exhibited height values similar to all studied perennial crops (Figure 6).
According to Figure 8, monocrop açaí and açaí cultivated in agroforestry systems exhibited the highest RH95/RH75 values and greater variability compared with the other evaluated classes. In contrast, oil palm showed the lowest RH95/RH75 values. Secondary vegetation also exhibited relatively low RH95/RH75 values, likely reflecting its high vegetation density and structural complexity. The presence of multiple vegetation strata with varying canopy heights increases RH75 values, thereby reducing the RH95/RH75 ratio (Figure 8).
3.3. Characterization of Spectral Reflectance Profiles
This section aims to spectrally characterize perennial crops, identify potential differ-ences among them, and examine their distinctions relative to secondary vegetation. In the visible region (0.4–0.7 µm), cocoa cultivated in monocrop exhibited lower reflectance values compared to the other perennial crops.
Monocropped açaí showed higher reflectance in the red band (Figure 9a). In contrast, cocoa and secondary vegetation presented lower reflectance values in this spectral range.
In the near-infrared (NIR; 0.7–1.3 µm) region (Figure 9a), which is strongly influenced by vegetation structural properties, cocoa grown in an agroforestry system exhibited the highest reflectance values. Conversely, monocropped açaí showed the lowest reflectance in the NIR, which could be associated with lower canopy density.
In the shortwave infrared (SWIR) band (1.3 –2.5µm), secondary vegetation and cocoa exhibited the lowest reflectance values. In contrast, açaí showed the highest reflectance in this region, which is consistent with its less dense canopy structure and consequently lower water content. As a result, radiation absorption in this wavelength range is smaller compared to the other perennial crops (Figure 9a).
The first two principal components derived from PCA and rPCA exhibit similar patterns, whereas differences between the classes become evident in PC3 (Figure 9b and Figure 9c). As shown in Figure 10, PC1, PC2, and PC3 together account for more than 95% of the total variance. Therefore, PCA can be effectively used to reduce the data dimensionality, consistent with previous findings reported by Lee et al. [77].
The variables with the highest loadings in each principal component are considered the most influential, assuming that each principal component is representative of these variables [78]. According to Figure 10, PC1 and PC2 together explain more than 95% of the total variance in both PCA and rPCA. Therefore, the subsequent analysis focuses on these two principal components, following the same approach adopted by Han et al. [79]. Notably, cocoa and cocoa agroforestry exhibit the greatest variability among the analyzed classes (Figure 11). Furthermore, secondary vegetation, açaí, and palm oil exhibited higher spectral similarity to one another than to the remaining classes, and demonstrated a balanced contribution from all evaluated spectral ranges to the PCAs(Figure 11).
According to Figure 12, PC1 exhibits the highest loading values across the visible (VL) and shortwave infrared (SWIR) bands. In PC2, only the SWIR and NIR bands exhibit high loading values. Therefore, PC1 can be considered the most suitable component for use in classification tasks aimed at distinguishing secondary vegetation from perennial crops, as it exhibits higher loading values around 1700 nm. This wavelength falls within a spectral region that effectively distinguishes secondary vegetation from perennial crops, as illustrated in Figure 8a and Table 2.
The secondary vegetation is spectrally distinguishable, as shown in Table 2. Within the visible light range, it may allow for greater differentiation from agroforestry cocoa and açaí. In the near-infrared range, it can be used to differentiate it from agroforestry cocoa. Finally, the mid-infrared region can be used to distinguish secondary vegetation from both agroforestry cocoa and açaí.
Analysis of the first- and second-order spectral derivatives (Figure 13) indicates that cocoa exhibits greater variability in the red-edge region. This behavior suggests higher values of vegetation indices, such as the Normalized Difference Vegetation Index (NDVI), compared to the other perennial crops, which is associated with increased chlorophyll content and greater photosynthetic activity. Since NDVI increases with higher reflectance in the NIR band and lower reflectance in the red band, the higher values of the first and second derivatives in the transition between the red and NIR regions suggest greater variation between these two spectral bands and, consequently, higher NDVI values (Figure 13)
Agroforestry cocoa, in contrast, shows lower spectral variability in the blue region of the visible spectrum and the strongest negative variation in the mid-infrared range. These patterns indicate reduced pigment absorption, lower vegetation density, and increased water absorption within the canopy (Figure 13).
Continuum removal analysis indicated that the agroforestry cocoa class exhibits very low absorption in the blue region of the visible spectrum (Figure 14). Açaí showed the lowest absorption in the red region of the visible spectrum. Cocoa, on the other hand, dis-played the greatest variation between near-infrared and visible light. Secondary vegetation exhibited strong absorption in the mid-infrared region, while cocoa and açaí in agroforestry systems showed more similar spectral responses.
4. Discussion
Structural variability is typically associated with increased surface roughness and volumetric backscatter in radar imagery. The LiDAR waveform of açaí plantations, two distinct peaks can be observed in the monocrop system, corresponding to the açaí canopy and the underlying soil (Figure 3). In contrast, the açaí agroforestry system exhibits a greater number of peaks, reflecting the presence of vegetation at different height levels and, consequently, its more complex vertical structure.
In mature monocropped cocoa plantations, the tree crowns typically overlap and form a nearly continuous canopy. This canopy closure limits the penetration of electromagnetic radiation through the vegetation, resulting in the detection of a single dominant canopy peak(Figure 3). In contrast, cocoa grown in agroforestry systems is interspersed with trees of different species, heights, and crown architectures, creating a multilayered canopy that allows the detection of multiple canopy peaks(Figure 3).
The oil palm plantations exhibits characteristics similar to those of açaí monocrops (Figure 3). Two distinct peaks can be observed: the higher peak corresponds to the oil palm canopy, whereas the lower peak represents the ground surface. In contrast, secondary veg-etation exhibits the greatest number of peaks, reflecting its more complex vertical structure and higher biodiversity, which generate multiple layers of vegetation and, consequently, multiple waveform returns.Therefore, cross-polarized bands can be used to distinguish perennial crops from secondary vegetation. According to Meyer [80], cross-polarization is more effective than single polarization for detecting volumetric backscatter.
Therefore, it was possible to identify that one of the main ways to differentiate sec-ondary vegetation from perennial crops is through the analysis of canopy roughness, and potentially through height-based approaches. This information could be used to im-prove the accuracy of perennial crop mapping and may support technical stakeholders in decision-making processes [85].
The spectral reflectance profiles capture the distinct optical properties of each target, facilitating class separability driven by underlying variations in plant biophysics and biochemistry. The reflectance spectrum can be used to distinguish vegetation types [81]. In the visible region of the electromagnetic spectrum, reflectance is mainly controlled by pigment content, particularly chlorophyll and carotenoids [82,83]. Canopies with a higher number of leaf layers exhibit stronger pigment absorption in this wavelength range, resulting in lower reflectance [76].
The near-infrared (NIR) region is primarily associated with the internal cellular struc-ture of vegetation [82,83]. Dense and well-developed canopies, characterized by multiple leaf layers and greater structural complexity, tend to exhibit higher NIR reflectance due to increased scattering within the leaf mesophyll [76].
The shortwave infrared (SWIR) region is strongly influenced by leaf water content [82,83]. As leaf moisture increases, radiance absorption in this spectral region becomes stronger, leading to lower reflectance values [76].
Therefore, Figure 14 indicates that açaí presents higher reflectance values in the red band, which may be associated with lower pigment content or lower vegetation density compared to the other perennial crops and secondary vegetation. In contrast, monocrop cocoa exhibits the lowest reflectance values. Then, it is characteristic of shade-adapted plants, which typically exhibit higher chlorophyll content than sun-exposed plants [75]. Consequently, as shown in Figure 9a, cocoa—an understory species adapted to shaded environments—exhibited greater radiation absorption than the other analyzed classes. In near infrared, cocoa has the highest reflectance values, likely reflecting a more complex vertical structure and a greater number of foliar layers [76].In the mid-infrared region, monocrop cocoa showed the lowest reflectance values, whereas monocrop açaí presented the highest values. This pattern may be related to differences in vegetation water content or canopy structure, suggesting higher water content or vegetation density in cocoa and lower vegetation density in monocrop açaí systems.
According to Figure 6, areas with canopy heights greater than 20 m are likely to corre-spond to secondary vegetation. For areas with canopy heights below 20 m, an RH95/RH75 ratio lower than 1.5 indicates oil palm. When the RH95/RH75 ratio is greater than or equal to 1.5, reflectance at 1700 nm is evaluated, with values above 45% indicating cocoa. If the reflectance at 1700 nm is lower than or equal to 45%, the red-band reflectance is considered. Red-band reflectance values greater than 10% indicate açaí. Finally, when the red-band reflectance is lower than or equal to 10%, the number of canopy peaks is used to distinguish the remaining classes: areas with more than five peaks are classified as cocoa grown in agroforestry systems, whereas areas with more than one peak are classified as açaí grown in agroforestry systems.
The PCA indicated that açaí and cocoa grown in agroforestry systems are spectrally similar (Figure 11). This result is reasonable because, in some cocoa agroforestry systems, açaí is cultivated as a secondary species alongside cocoa, a practice that has been adopted in the state of Pará [84]. Palm oil and açaí in agroforestry systems also showed considerable similarity, which may be related to their leaf architecture, since both species are palms. Finally, the PCA revealed differences between secondary vegetation and cocoa monocrop compared to the other studied classes (Figure 11). These differences are likely associated with the high species diversity found in secondary vegetation, which may contribute to its spectral distinction from the other analyzed classes.
In continuum removal analysis, açaí showed the lowest absorption in the red region of the visible spectrum, suggesting that vegetation indices such as NDVI or NDRE could be used to differentiate it from the other crops (Figure 14). In the other hand, cocoa showed the highest variation (Figure 13). This characteristic may indicate lower photosynthetic activity in açaí and higher photosynthetic activity in cocoa. This result is consistent with the ecological characteristics of cocoa, which is a shade-adapted plant. Shade-adapted species generally have higher chlorophyll content compared to species adapted to full-sun condi-tions. Cocoa, on the other hand, displayed the greatest variation between near-infrared and visible light, indicating that vegetation indices may be effective for distinguishing this crop from others. Secondary vegetation exhibited strong absorption in the mid-infrared region, likely due to the higher moisture content typical of this class, while cocoa and açaí in agroforestry systems showed more similar spectral responses.
Reflectance spectroscopy has been widely used to characterize vegetation species because spectral signatures are influenced by leaf biochemical and structural properties, enabling species discrimination and vegetation classification [86]. Thus, the spectral re-flectance characterization generated in this study may contribute to a better understanding of the specific spectral features of each studied vegetation type. Radar imagery could also plays an important role in distinguishing secondary vegetation from perennial crops, which explains why several studies have reported improved results when using multisensor approaches that integrate optical and radar imagery [30,37].
5. Conclusions
Therefore, this study enabled the characterization of perennial crops and secondary vegetation, as well as the identification of key differences among these land-use and land-cover classes. The results provide a solid foundation for enhancing future mapping efforts by guiding the selection of the most relevant biophysical variables. Moreover, the findings demonstrate that structural and spectral characteristics can effectively distinguish between different crop types and separate perennial crops from secondary vegetation. As a next step, selected variables—such as cross-polarization and visible and shortwave infrared —will be incorporated into classification models to evaluate their potential for improving mapping accuracy, addressing gaps in the literature, and reducing confusion between perennial crops and secondary vegetation.
Author Contributions
For research articles with several authors, a short paragraph specifying their individual contributions must be provided. The following statements should be used “Conceptualiza-tion, T.K.I., N.S.P., H.N.B., and L.N.G.F.; methodology, T.K.I., N.S.P., and H.N.B.; software, T.K.I. and N.S.P.; validation, T.K.I. and N.S.P; formal analysis, T.K.I. and N.S.P.; investigation, T.K.I.; resources, N.S.P.; data curation, T.K.I.; writing—original draft preparation, T.K.I.; writing—review and editing, T.K.I., N.S.P., H.N.B. and L.N.G.F.; visualization, T.K.I., N.S.P., and H.N.B.; supervision, N.S.P., H.N.B. and L.N.G.F.; project administration, T.K.I.; funding acquisition,N.S.P. All authors have read and agreed to the published version of the manuscript.
Funding
This study was financed in part by the Coordenação de Aperfeiçoamento de Pessoal de Nível Superior - Brasil (CAPES) - Finance Code 88887.827656/2023-00.
Data Availability Statement
We encourage all authors of articles published in MDPI journals to share their research data. In this section, please provide details regarding where data supporting reported results can be found, including links to publicly archived datasets analyzed or generated during the study. Where no new data were created, or where data is unavailable due to privacy or ethical restrictions, a statement is still required. Suggested Data Availability Statements are available in section “MDPI Research Data Policies” at https://www.mdpi.com/ethics.
Acknowledgments
The authors thank Adriano Venturieri and Rodrigo Rafael Souza de Oliveira their support during the field campaigns, including field activities and logistical assistance.
Conflicts of Interest
The authors declare no conflicts of interest.
Abbreviations
The following abbreviations are used in this manuscript:
| MDPI | Multidisciplinary·Digital·Publishing·Institute |
| DOAJ | Directory·of·open·access·journals |
| TLA | Three·letter·acronym· |
| LD | Linear·dichroism |
References
- Friedlingstein, P.; O’Sullivan, M.; Jones, M. W.; Andrew, R. M.; Bakker, D. C.; Hauck, J.; et al. Global carbon budget 2025. Earth Syst. Sci. Data Discuss. 2025, 1–139. [Google Scholar] [CrossRef]
- Hernandez Guzman, D.; Zielinski, S.; Hernandez Guzman, A.; Tapias, B. A. H.; Ramírez, O.; Milanés, C. B. Greenhouse gas emissions from livestock-driven deforestation in the Amazon: A bibliometric analysis 2004–2024. Land 2025, 14(8), 1695. [Google Scholar] [CrossRef]
- Peter, R.; Arima, E. High profits from soybean-corn agriculture are associated with increased land prices and deforestation rates in Mato Grosso’s Amazon forests. Communications Earth & Environment, 2026. [Google Scholar]
- Song, X. P.; Hansen, M. C.; Potapov, P.; Adusei, B.; Pickering, J.; Adami, M.; et al. Massive soybean expansion in South America since 2000 and implications for conservation. Nat. Sustain. 2021, 4, 784–792. [Google Scholar] [CrossRef]
- Chen, J.; Lærke, P. E.; Jørgensen, U. Land conversion from annual to perennial crops: A win-win strategy for biomass yield and soil organic carbon and total nitrogen sequestration. Agric. Ecosyst. Environ. 2022, 330, 107907. [Google Scholar] [CrossRef]
- Manhães, A. P.; Rocha, F.; Souza, T.; Marques, K.; Juen, L.; Montag, L.; Coutinho, B. Social and biological impact of oil palm (Elaeis guineensis) plantations in the Eastern Brazilian Amazon. Biodivers. Conserv. 2024, 33(11), 3295–3310. [Google Scholar] [CrossRef]
- Seixas, H. T.; Silveira, H. L. F. D.; Mendes, A. P. D. S. F.; Soares, F. D. S.; da Silva, R. F. B. Conversion from forest to agriculture in the Brazilian Amazon from 1985 to 2021. Land 2025, 14(2), 300. [Google Scholar] [CrossRef]
- Ormond, J. G. P. Glossário de termos usados em atividades agropecuárias, florestais e ciências ambientais 2006. [CrossRef]
- IBGE. Resultados Definitivos. 2017. Available online: https://sidra.ibge.gov.br/pesquisa/censoagropecuario/censo-agropecuario-2017/resultados-definitivos (accessed on 01 May 2026).
- IBGE. Produção Agrícola Municipal. 2022. Available online: https://sidra.ibge.gov.br/pesquisa/pam/tabelas/ (accessed on 08 Dec 2025).
- Cunha, M. A.; da Costa, S. M. F. Mapeamento da palmeira de açaí (Euterpe oleracea Mart.) na floresta Amazônica utilizando imagem de satélite de alta resolução espacial. Rev. Espinhaço 2020. [Google Scholar]
- Ferreira, M. P.; De Almeida, D. R. A.; de Almeida Papa, D.; Minervino, J. B. S.; Veras, H. F. P.; Formighieri, A.; et al. Individual tree detection and species classification of Amazonian palms using UAV images and deep learning. For. Ecol. Manag. 2020, 475, 118397. [Google Scholar] [CrossRef]
- Akinyemi, F. O. An assessment of land-use change in the Cocoa Belt of south-west Nigeria. Int. J. Remote Sens. 2013, 34(8), 2858–2875. [Google Scholar] [CrossRef]
- Soares, D. C. D. B. L.; Lima, H. V. D.; Araújo, S. R.; Ramos, R. J. C.; Rocha, A. J. D. S. Occurrence and spatial distribution of native acai groves in high-production areas of the Amazon region. Rev. Ciência Agronômica 2023, 54, e20218080. [Google Scholar] [CrossRef]
- Donkor, E.; Jnr, E. M. O.; Adu-Bredu, S.; Andam-Akorful, S. A.; Kwarteng, E. V. S.; Yevugah, L. L. Application of parametric and non parametric classifiers for assessing land use/land cover categories in cocoa landscape of Juaboso and Bia West Districts of Ghana. J. Geosci. Environ. Prot. 2022, 10, 265–281. [Google Scholar]
- Moraiti, N.; Mullissa, A.; Rahn, E.; Sassen, M.; Reiche, J. Critical assessment of cocoa classification with limited reference data: A study in Côte d’Ivoire and Ghana using Sentinel-2 and random forest model. Remote Sens. 2024, 16(3), 598. [Google Scholar] [CrossRef]
- Shaharum, N. S. N.; Shafri, H. Z. M.; Ghani, W. A. W. A. K.; Samsatli, S.; Al-Habshi, M. M. A.; Yusuf, B. Oil palm mapping over Peninsular Malaysia using Google Earth Engine and machine learning algorithms. Remote Sens. Appl. Soc. Environ. 2020, 17, 100287. [Google Scholar] [CrossRef]
- Jarayee, A. N.; Shafri, H. Z. M.; Ang, Y.; Lee, Y. P.; Bakar, S. A.; Abidin, H.; et al. Oil palm plantation land cover and age mapping using Sentinel-2 satellite imagery and machine learning algorithms. In IOP Conference Series: Earth and Environmental Science; IOP Publishing, 2022; Vol. 1051, No. 1, p. 012024. [Google Scholar]
- De Petris, S.; Boccardo, P.; Borgogno-Mondino, E. Detection and characterization of oil palm plantations through MODIS EVI time series. Int. J. Remote Sens. 2019, 40(19), 7297–7311. [Google Scholar] [CrossRef]
- Kamiran, N.; Sarker, M. L. R. Exploring the potential of high resolution remote sensing data for mapping vegetation and the age groups of oil palm plantation. IOP Conference Series: Earth and Environmental Science, 2014; Vol. 18, p. 012181. [Google Scholar]
- Puttinaovarat, S.; Horkaew, P. Oil-palm plantation identification from satellite images using Google Earth Engine. Int. J. Adv. Sci. Eng. Inf. Technol. 2018, 8(3), 720–726. [Google Scholar] [CrossRef]
- Numbisi, F. N.; Van Coillie, F. M.; De Wulf, R. Delineation of cocoa agroforests using multiseason Sentinel-1 SAR images: A low grey level range reduces uncertainties in GLCM texture-based mapping. ISPRS Int. J. Geo-Inf. 2019, 8(4), 179. [Google Scholar] [CrossRef]
- Li, L.; Dong, J.; Tenku, S. N.; Xiao, X. Mapping oil palm plantations in Cameroon using PALSAR 50-m orthorectified mosaic images. Remote Sens. 2015, 7(2), 1206–1224. [Google Scholar] [CrossRef]
- Cheng, Y.; Yu, L.; Xu, Y.; Lu, H.; Cracknell, A. P.; Kanniah, K.; Gong, P. Mapping oil palm plantation expansion in Malaysia over the past decade (2007–2016) using ALOS-1/2 PALSAR-1/2 data. Int. J. Remote Sens. 2019, 40(19), 7389–7408. [Google Scholar] [CrossRef]
- Saatchi, S.; Agosti, D.; Alger, K.; Delabie, J.; Musinsky, J. Examining fragmentation and loss of primary forest in the southern Bahian Atlantic forest of Brazil with radar imagery. Conserv. Biol. 2001, 15(4), 867–875. [Google Scholar] [CrossRef]
- Singh, K.; Fuentes, I.; Al-Shammari, D.; Fidelis, C.; Butubu, J.; Yinil, D.; et al. E-Agriculture planning tool for supporting smallholder cocoa intensification using remotely sensed data. Remote Sens. 2023, 15(14), 3492. [Google Scholar] [CrossRef]
- Abu, I. O.; Szantoi, Z.; Brink, A.; Robuchon, M.; Thiel, M. Detecting cocoa plantations in Côte d’Ivoire and Ghana and their implications on protected areas. Ecol. Indic. 2021, 129, 107863. [Google Scholar] [CrossRef]
- Akpoti, K.; Dembélé, M.; Forkuor, G.; Obuobie, E.; Mabhaudhi, T.; Cofie, O. Integrating GIS and remote sensing for land use/land cover mapping and groundwater potential assessment for climate-smart cocoa irrigation in Ghana. Sci. Rep. 2023, 13(1), 16025. [Google Scholar] [CrossRef]
- Brinkhoff, J.; Vardanega, J.; Robson, A. J. Land cover classification of nine perennial crops using Sentinel-1 and Sentinel-2 data. Remote Sens. 2019, 12(1), 96. [Google Scholar] [CrossRef]
- Cheng, Y.; Yu, L.; Cracknell, A. P.; Gong, P. Oil palm mapping using Landsat and PALSAR: A case study in Malaysia. Int. J. Remote Sens. 2016, 37(22), 5431–5442. [Google Scholar] [CrossRef]
- Mohd Najib, N. E.; Kanniah, K. D.; Cracknell, A. P.; Yu, L. Synergy of active and passive remote sensing data for effective mapping of oil palm plantation in Malaysia. Forests 2020, 11(8), 858. [Google Scholar] [CrossRef]
- Torbick, N.; Ledoux, L.; Salas, W.; Zhao, M. Regional mapping of plantation extent using multisensor imagery. Remote Sens. 2016, 8(3), 236. [Google Scholar] [CrossRef]
- Poortinga, A.; Tenneson, K.; Shapiro, A.; Nguyen, Q.; San Aung, K.; Chishtie, F.; Saah, D. Mapping plantations in Myanmar by fusing Landsat-8, Sentinel-2 and Sentinel-1 data along with systematic error quantification. Remote Sens. 2019, 11(7), 831. [Google Scholar] [CrossRef]
- Razali, S. M.; Marin, A.; Nuruddin, A. A.; Shafri, H. Z. M.; Hamid, H. A. Capability of integrated MODIS imagery and ALOS for oil palm, rubber and forest areas mapping in tropical forest regions. Sensors 2014, 14(5), 8259–8282. [Google Scholar] [CrossRef]
- Descals, A.; Wich, S.; Meijaard, E.; Gaveau, D. L.; Peedell, S.; Szantoi, Z. High-resolution global map of smallholder and industrial closed-canopy oil palm plantations. Earth Syst. Sci. Data 2021, 13(3), 1211–1231. [Google Scholar] [CrossRef]
- Abramowitz, J.; Cherrington, E.; Griffin, R.; Muench, R.; Mensah, F. Differentiating oil palm plantations from natural forest to improve land cover mapping in Ghana. Remote Sens. Appl. Soc. Environ. 2023, 30, 100968. [Google Scholar] [CrossRef]
- Zeng, J.; Tan, M. L.; Tew, Y. L.; Zhang, F.; Wang, T.; Samat, N.; et al. Optimization of open-access optical and radar satellite data in Google Earth Engine for oil palm mapping in the Muda River Basin, Malaysia. Agriculture 2022, 12(9), 1435. [Google Scholar] [CrossRef]
- Souza, A. R.; Escada, M. I. S.; Santos, G. V. S. S.; Monteiro, A. M. V. Cartografia do açaí: Representação espacial de áreas potenciais de ocorrência de açaí no baixo Tocantins, nordeste do Pará. Anais do XIX Simpósio Brasileiro de Sensoriamento Remoto, 2019. [Google Scholar]
- Batista, J. E.; Rodrigues, N. M.; Cabral, A. I.; Vasconcelos, M. J.; Venturieri, A.; Silva, L. G.; Silva, S. Optical time series for the separation of land cover types with similar spectral signatures: Cocoa agroforest and forest. Int. J. Remote Sens. 2022, 43(9), 3298–3319. [Google Scholar] [CrossRef]
- Van Leeuwen, M.; Nieuwenhuis, M. Retrieval of forest structural parameters using LiDAR remote sensing. Eur. J. For. Res. 2010, 129(4), 749–770. [Google Scholar] [CrossRef]
- Dubayah, R.; Blair, J. B.; Goetz, S.; Fatoyinbo, L.; Hansen, M.; Healey, S.; et al. The Global Ecosystem Dynamics Investigation: High-resolution laser ranging of the Earth’s forests and topography. Sci. Remote Sens. 2020, 1, 100002. [Google Scholar] [CrossRef]
- Almeida, E. L. D.; Oliveira, M. R. R. D.; Rocha Neto, O. C. D.; Moreira, L. C. J.; Teixeira, A. D. S. Airborne hyperspectral remote sensing applied to determine the texture of a Cambisol in the Chapada do Apodi, Ceará. Rev. Ciência Agronômica 2021, 52, e20207238. [Google Scholar]
- Ochoa, D.; Criollo, R.; Liao, W.; Cevallos-Cevallos, J.; Castro, R.; Bayona, O. Improving the detection of cocoa bean fermentation-related changes using image fusion. In Algorithms and Technologies for Multispectral, Hyperspectral, and Ultraspectral Imagery XXIII; SPIE, 2017; Vol. 10198, pp. 423–428. [Google Scholar]
- Oliveira, M. R. R. D.; Ribeiro, S. G.; Mas, J. F.; Teixeira, A. D. S. Advances in hyperspectral sensing in agriculture: A review. Rev. Ciência Agronômica 2020, 51(spe), e20207739. [Google Scholar]
- Vargas, H.; Camacho, A.; Arguello, H. Spectral unmixing approach in hyperspectral remote sensing: A tool for oil palm mapping. TecnoLógicas 2019, 22(45), 131–145. [Google Scholar] [CrossRef]
- Poblete, T.; Hornero, A.; Gonzalez-Dugo, V.; Landa, B. B.; Navas-Cortés, J. A.; Zarco-Tejada, P. J. Early disease detection with hyperspectral imagery: Dynamics of plant traits as a function of disease severity levels. In IGARSS 2023–2023 IEEE International Geoscience and Remote Sensing Symposium; IEEE, 2023; pp. 2803–2806. [Google Scholar]
- Liu, N.; Townsend, P. A.; Naber, M. R.; Bethke, P. C.; Hills, W. B.; Wang, Y. Hyperspectral imagery to monitor crop nutrient status within and across growing seasons. Remote Sens. Environ. 2021, 255, 112303. [Google Scholar] [CrossRef]
- IBGE. Panorama. 2023. Available online: https://cidades.ibge.gov.br/brasil/pa/panorama (accessed on 27 Oct 2024).
- Mendes, F. A. T. Agronegócio Cacau no Estado do Pará; Clube de Autores, 2018. [Google Scholar]
- QGIS. Open Source Geospatial Foundation. 2026. Available online: http://qgis.org (accessed on 24 Mar 2026).
- CONAMA. Resolução CONAMA 33. 1994. Available online: https://www.mprs.mp.br/media/areas/gapp/arquivos/resol_ (accessed on 24 Mar 2026).
- NASA. GEDI Lidar: Global Ecosystem Dynamics Investigation Lidar. 2025. Available online: https://www.earthdata.nasa.gov/ (accessed on 08 Dec 2025).
- Dubayah, R.; Luthcke, S.; Blair, J.; Hofton, M.; Armston, J.; Tang, H. GEDI L1B geolocated waveform data global footprint level V002. NASA EOSDIS Land Processes Distributed Active Archive Center (DAAC) dataset, GEDI01_B-002. Available online. (accessed on 08 Dec 2025). [CrossRef]
- Dubayah, R.; Hofton, M.; Blair, J.; Armston, J.; Tang, H.; Luthcke, S. GEDI L2A Elevation and Height Metrics Data Global Footprint Level V002. NASA Land Processes Distributed Active Archive Center, GEDI01_B-002. Available online: https://doi.org/10.5067/GEDI/GEDI02_A.002 (accessed on 08 Dec 2025). [CrossRef]
- Drake, J. B.; Dubayah, R. O.; Clark, D. B.; Knox, R. G.; Blair, J. B.; Hofton, M. A.; et al. Estimation of tropical forest structural characteristics using large-footprint lidar. Remote Sens. Environ. 2002, 79(2–3), 305–319. [Google Scholar] [CrossRef]
- Cooley, S. S.; Pinto, N.; Becerra, M.; Alvarado, J. W. V.; Fahlen, J. C.; Rivera, O.; et al. Combining spaceborne lidar from the Global Ecosystem Dynamics Investigation with local knowledge for monitoring fragmented tropical landscapes: A case study in the forest–agriculture interface of Ucayali, Peru. Ecol. Evol. 2024, 14(8), e70116. [Google Scholar] [CrossRef]
- Whitehurst, A. S.; Swatantran, A.; Blair, J. B.; Hofton, M. A.; Dubayah, R. Characterization of canopy layering in forested ecosystems using full waveform lidar. Remote Sens. 2013, 5(4), 2014–2036. [Google Scholar] [CrossRef]
- DLR. Mission. 2024. Available online: https://www.enmap.org/mission/ (accessed on 27 Oct 2024).
- Potapov, P.; Li, X.; Hernandez-Serna, A.; Tyukavina, A.; Hansen, M. C.; Kommareddy, A.; et al. Mapping global forest canopy height through integration of GEDI and Landsat data. Remote Sens. Environ. 2021, 253, 112165. [Google Scholar] [CrossRef]
- Bahrami, M.; Mobasheri, M. R. Plant species determination by coding leaf reflectance spectrum and its derivatives. Eur. J. Remote Sens. 2020, 53(1), 258–273. [Google Scholar] [CrossRef]
- Demetriades-Shah, T. H.; Steven, M. D. High spectral resolution indices for monitoring crop growth and chlorosis. Spectr. Signat. Objects Remote Sens. 1988, Vol. 287, 299. [Google Scholar]
- Malthus, T. J.; Madeira, A. C. High resolution spectroradiometry: spectral reflectance of field bean leaves infected by Botrytis fabae. Remote Sens. Environ. 1993, 45(1), 107–116. [Google Scholar] [CrossRef]
- Meng, R.; Lv, Z.; Yan, J.; Chen, G.; Zhao, F.; Zeng, L.; Xu, B. Development of spectral disease indices for southern corn rust detection and severity classification. Remote Sens. 2020, 12(19), 3233. [Google Scholar] [CrossRef]
- Nkuna, B. L.; Chirima, J. G.; Newete, S. W.; Nyamugama, A.; van der Walt, A. J. Developing models to detect maize diseases using spectral vegetation indices derived from spectral signatures. Egypt. J. Remote Sens. Space Sci. 2024, 27(3), 597–603. [Google Scholar] [CrossRef]
- Goez, M.; Torres-Madronero, M. C.; Rondon, T.; Guzman, M. A.; Casamitjana, M.; Gonzalez, J. M. Characterization of maize, common bean, and avocado crops under abiotic stress factors using spectral signatures on the visible to near-infrared spectrum. Agronomy 2024, 14(10), 2228. [Google Scholar] [CrossRef]
- Tsai, F.; Philpot, W. Derivative analysis of hyperspectral data. Remote Sens. Environ. 1998, 66(1), 41–51. [Google Scholar] [CrossRef]
- Kokaly, R. F. Investigating a physical basis for spectroscopic estimates of leaf nitrogen concentration. Remote Sens. Environ. 2001, 75(2), 153–161. [Google Scholar] [CrossRef]
- Buitrago, M. F.; Skidmore, A. K.; Groen, T. A.; Hecker, C. A. Connecting infrared spectra with plant traits to identify species. ISPRS J. Photogramm. Remote Sens. 2018, 139, 183–200. [Google Scholar] [CrossRef]
- Clark, R. N.; Roush, T. L. Reflectance spectroscopy: Quantitative analysis techniques for remote sensing applications. J. Geophys. Res. Solid Earth 1984, 89(B7), 6329–6340. [Google Scholar] [CrossRef]
- Brabant, C.; Alvarez-Vanhard, E.; Laribi, A.; Morin, G.; Thanh Nguyen, K.; Thomas, A.; Houet, T. Comparison of hyperspectral techniques for urban tree diversity classification. Remote Sens. 2019, 11(11), 1269. [Google Scholar] [CrossRef]
- Candès, E. J.; Li, X.; Ma, Y.; Wright, J. Robust principal component analysis? J. ACM (JACM) 2011, 58(3), 1–37. [Google Scholar] [CrossRef]
- Swatantran, A.; Dubayah, R.; Roberts, D.; Hofton, M.; Blair, J. B. Mapping biomass and stress in the Sierra Nevada using lidar and hyperspectral data fusion. Remote Sens. Environ. 2011, 115(11), 2917–2930. [Google Scholar] [CrossRef]
- Goetz, S. J.; Sun, M.; Baccini, A.; Beck, P. S. Synergistic use of spaceborne lidar and optical imagery for assessing forest disturbance: An Alaska case study. J. Geophys. Res. Biogeosciences 2010, 115, G2. [Google Scholar] [CrossRef]
- Otekunrin, O. A. Mapping cocoa research (Theobroma cacao L.) in Africa: production, trade outlook, and scientometric insights. Discov. Agric. 2025, 3(1), 111. [Google Scholar] [CrossRef]
- Mensah, E. O.; Asare, R.; Vaast, P.; Amoatey, C. A.; Markussen, B.; Owusu, K.; et al. Limited effects of shade on physiological performances of cocoa (Theobroma cacao L.) under elevated temperature. Environ. Exp. Bot. 2022, 201, 104983. [Google Scholar] [CrossRef]
- Ponzoni, F. J.; Shimabukuro, Y. E.; Kuplich, T. M. Sensoriamento remoto da vegetação; Oficina de Textos, 2015. [Google Scholar]
- Lee, J.; Cai, X.; Lellmann, J.; Dalponte, M.; Malhi, Y.; Butt, N.; et al. Individual tree species classification from airborne multisensor imagery using robust PCA. IEEE J. Sel. Top. Appl. Earth Obs. Remote Sens. 2016, 9(6), 2554–2567. [Google Scholar] [CrossRef]
- Ali, A. Analysis of multivariate agricultural data. In International Encyclopedia of Statistical Science; Springer Berlin Heidelberg: Berlin, Heidelberg, 2025; pp. 67–71. [Google Scholar]
- Han, B.; Cui, L.; Jin, M.; Dong, H. Ecological adaptation strategies of desert plants in the farming–pastoral zone of northern Tarim Basin. Sustainability 2025, 17(7), 2899. [Google Scholar] [CrossRef]
- Meyer, F. Spaceborne synthetic aperture radar: Principles, data access, and basic processing techniques. In Synthetic Aperture; Radar (SAR) Handbook: Comprehensive Methodologies for Forest Monitoring and Biomass Estimation, 2019; pp. 21–64. [Google Scholar]
- Zhou, B.; Li, H.; Xu, F. Analysis and discrimination of hyperspectral characteristics of typical vegetation leaves in a rare earth reclamation mining area. Ecol. Eng. 2022, 174, 106465. [Google Scholar] [CrossRef]
- Jensen, J. R. Remote Sensing of the Environment: An Earth Resource Perspective; Pearson Education India, 2009. [Google Scholar]
- de Moraes Novo, E. M. Sensoriamento Remoto: Princípios e Aplicações; Editora Blucher, 2010. [Google Scholar]
- EMBRAPA. Sistemas Agroflorestais do Pará são exemplos de produção sustentável na Amazônia. 2024. Available online: https://www.embrapa.br/busca-de-noticias/-/noticia/87616768/sistemas-agroflorestaisdo- para-sao-exemplos-de-producao-sustentavel-na-amazonia (accessed on 03 April 2026).
- Zhang, C.; Kerner, H.; Wang, S.; Hao, P.; Li, Z.; Hunt, K. A.; et al. Remote sensing for crop mapping: A perspective on current and future crop-specific land cover data products. Remote Sens. Environ. 2025, 330, 114995. [Google Scholar] [CrossRef]
- Li, C.; Czyz˙, E. A.; Halitschke, R.; Baldwin, I. T.; Schaepman, M. E.; Schuman, M. C. Evaluating potential of leaf reflectance spectra to monitor plant genetic variation. Plant Methods 2023, 19(1), 108. [Google Scholar] [CrossRef]
Figure 1.
Study area location and spatial distribution of sampling sites across the municipalities of Brasil Novo, Medicilândia, Uruará, and Tomé-Açu, Pará, Brazil.
Figure 1.
Study area location and spatial distribution of sampling sites across the municipalities of Brasil Novo, Medicilândia, Uruará, and Tomé-Açu, Pará, Brazil.
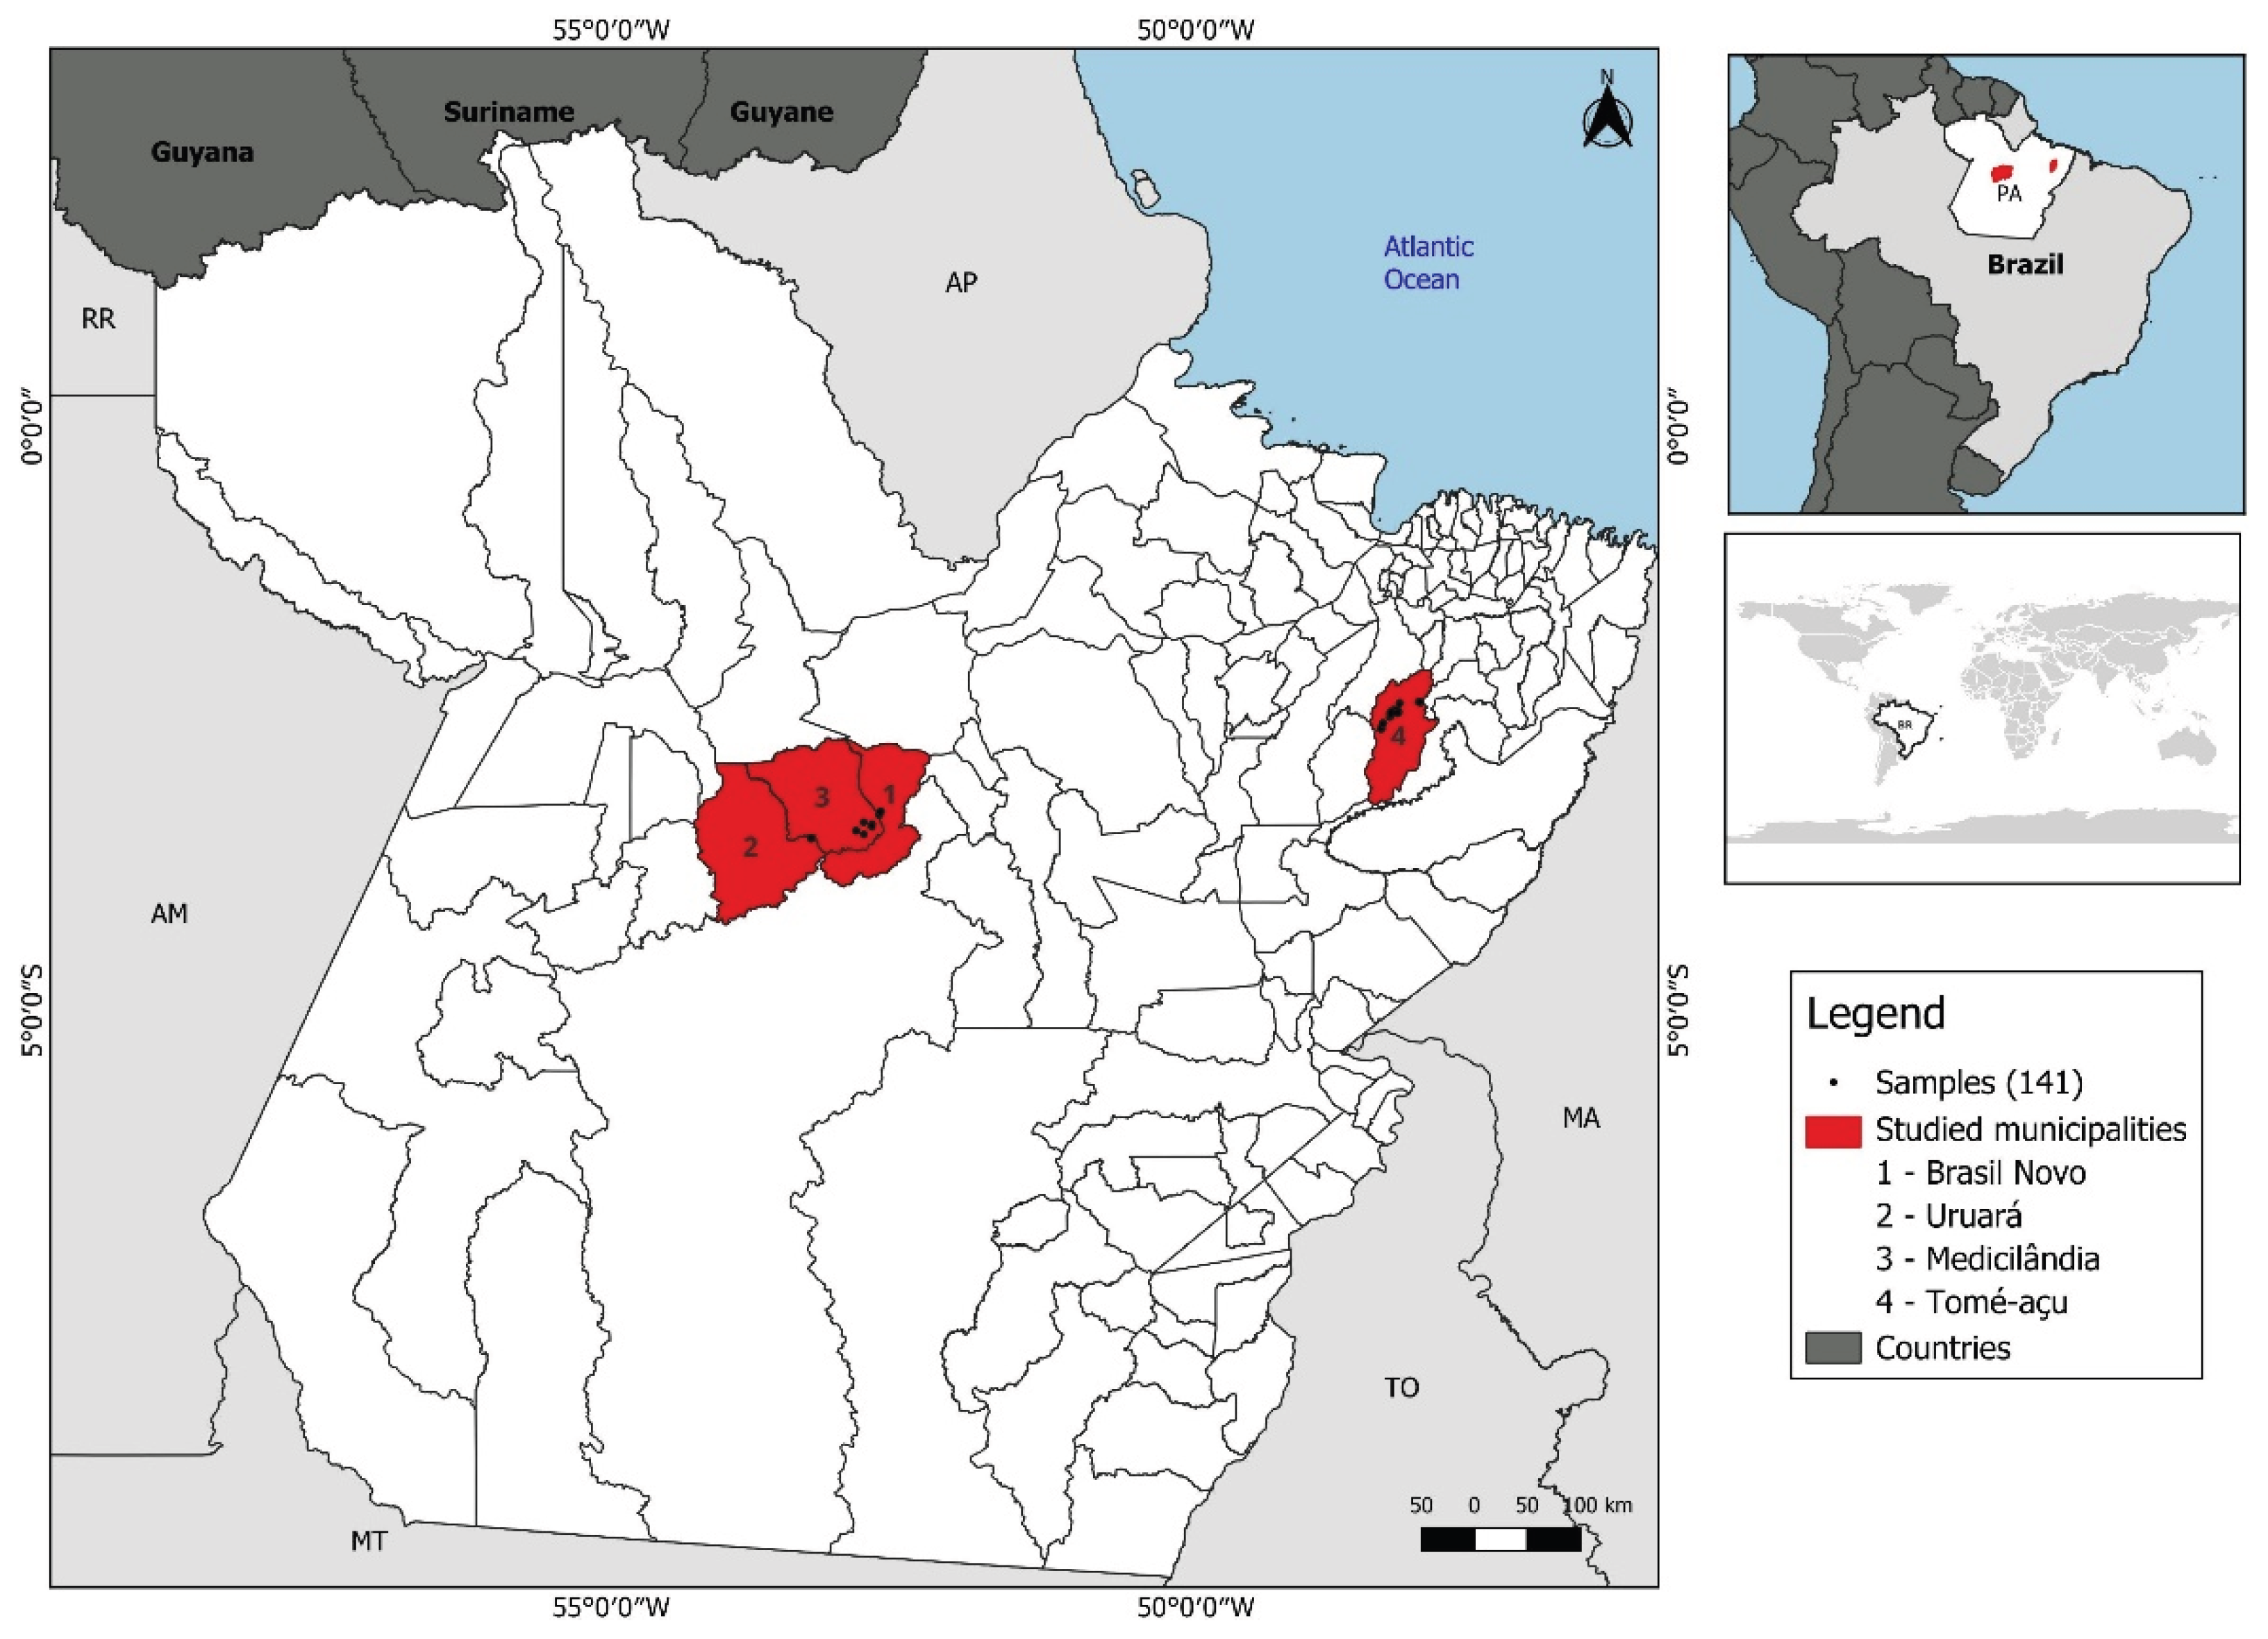
Figure 2.
Methodology flowchart.
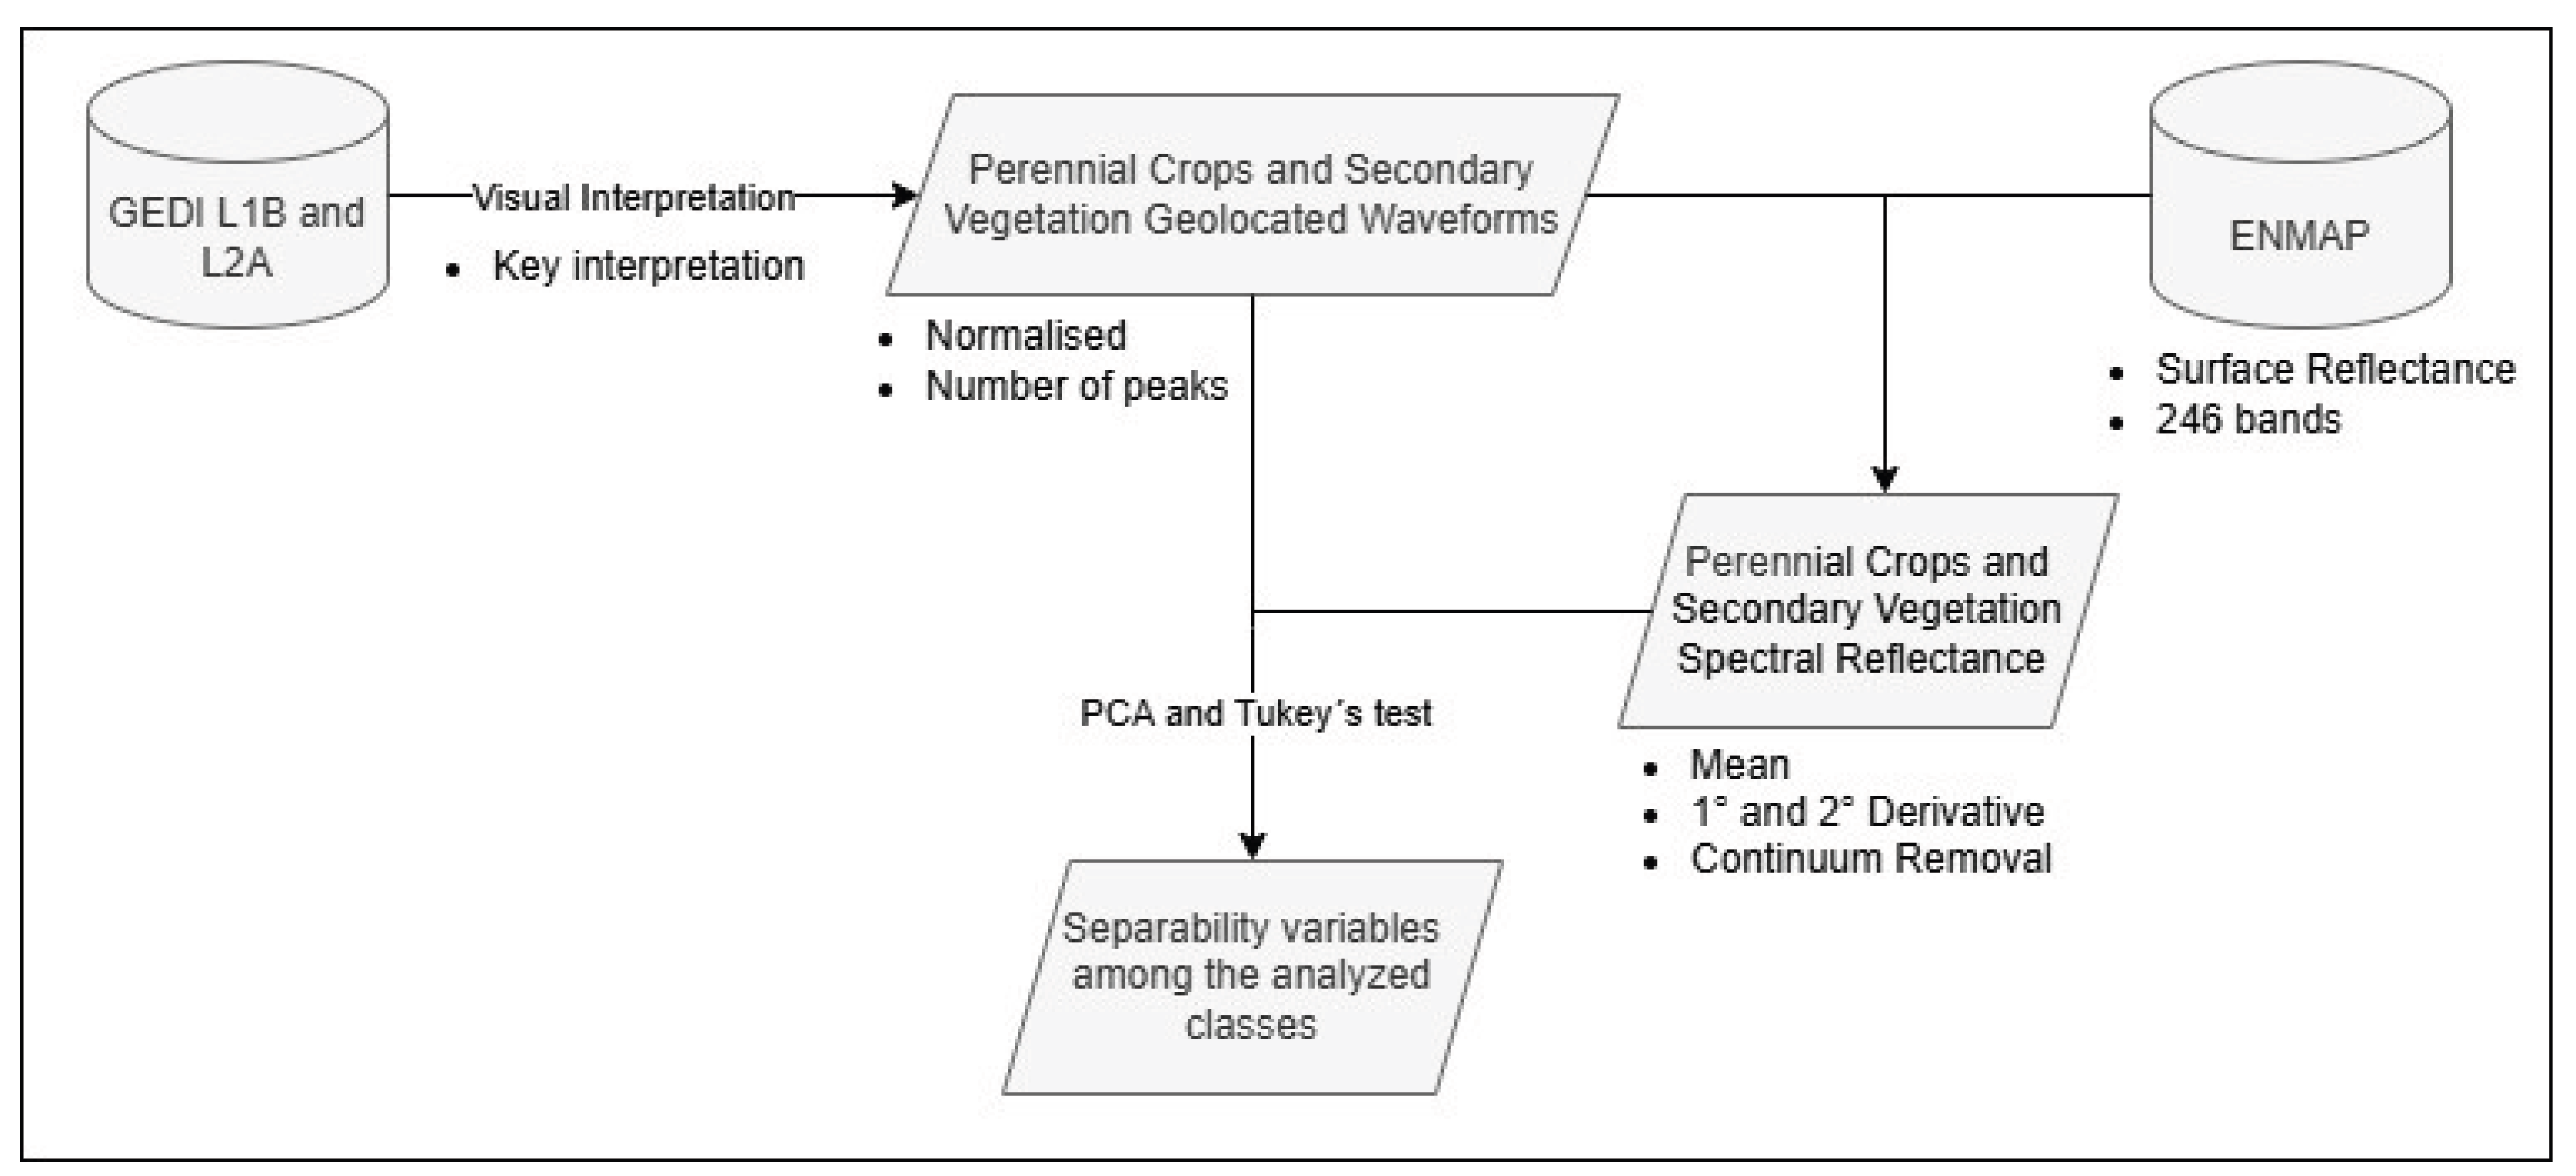
Figure 3.
Number of peaks for each class.
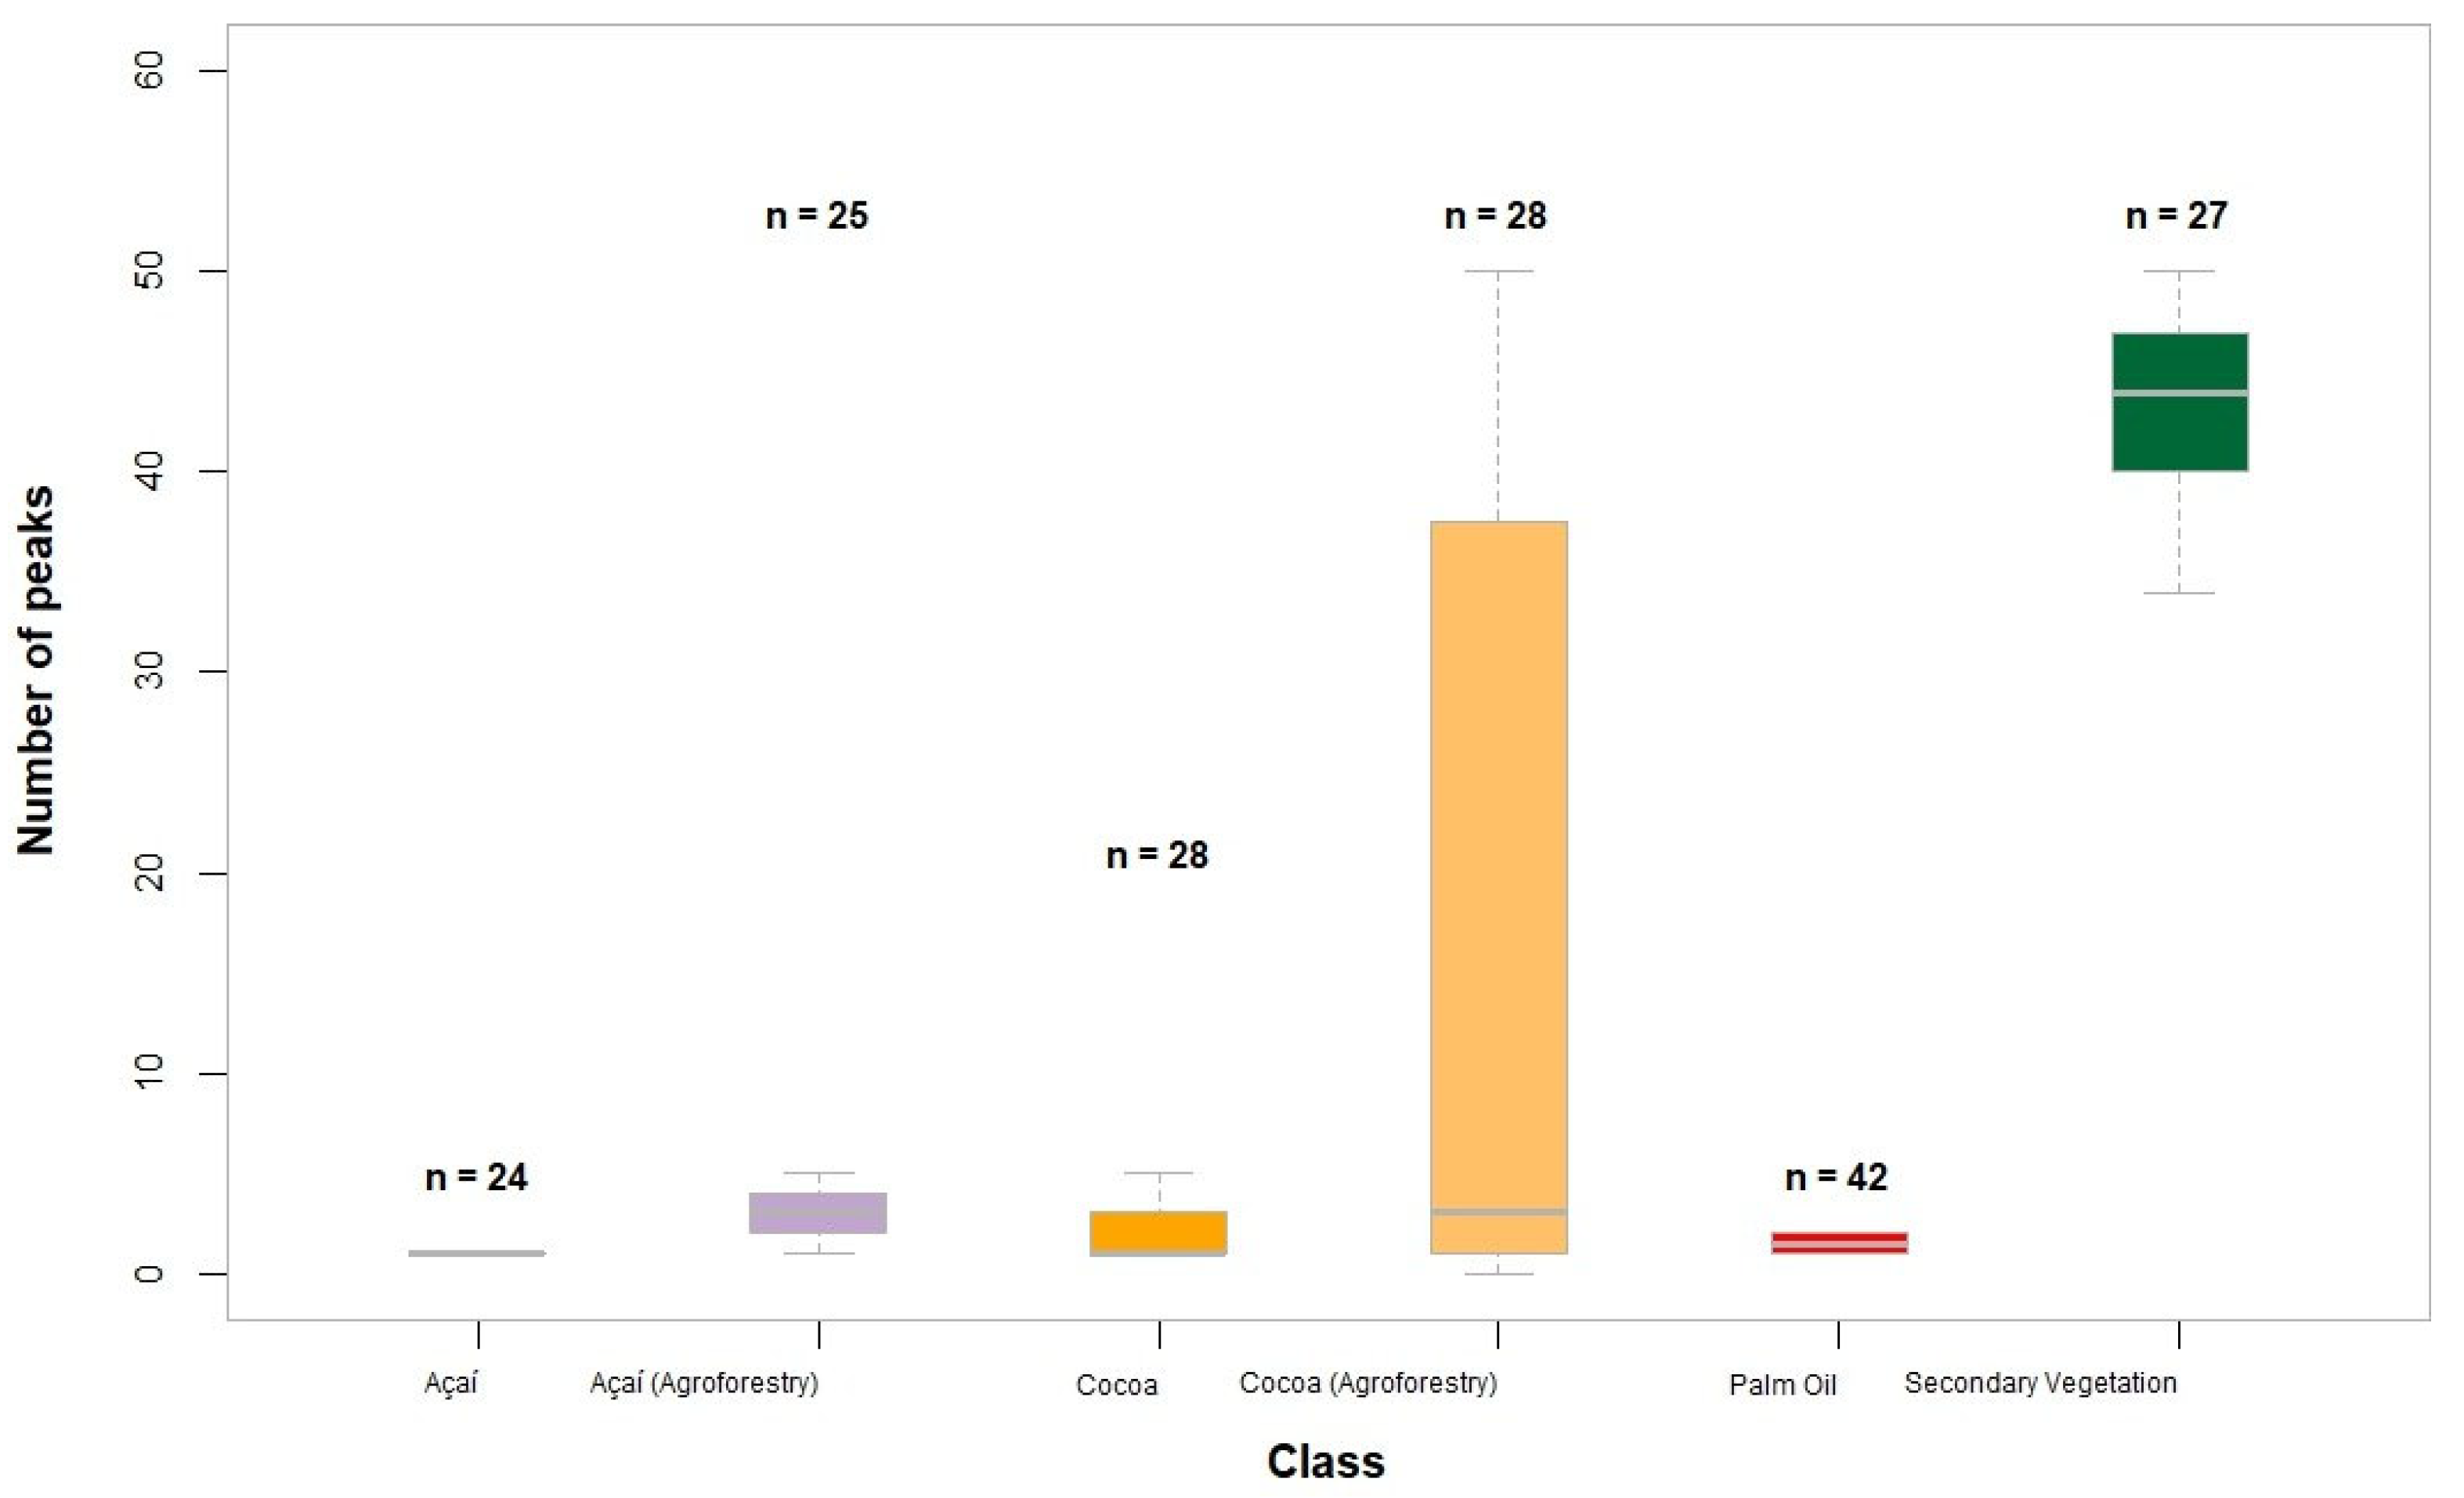
Figure 4.
Example of waveform (GEDI level 1B data) of (A) açaí, (B) açaí (agroforestry), (C) cocoa, (D) cocoa (agroforestry), (E) oil palm, and (F) secondary vegetation, respectively.
Figure 4.
Example of waveform (GEDI level 1B data) of (A) açaí, (B) açaí (agroforestry), (C) cocoa, (D) cocoa (agroforestry), (E) oil palm, and (F) secondary vegetation, respectively.
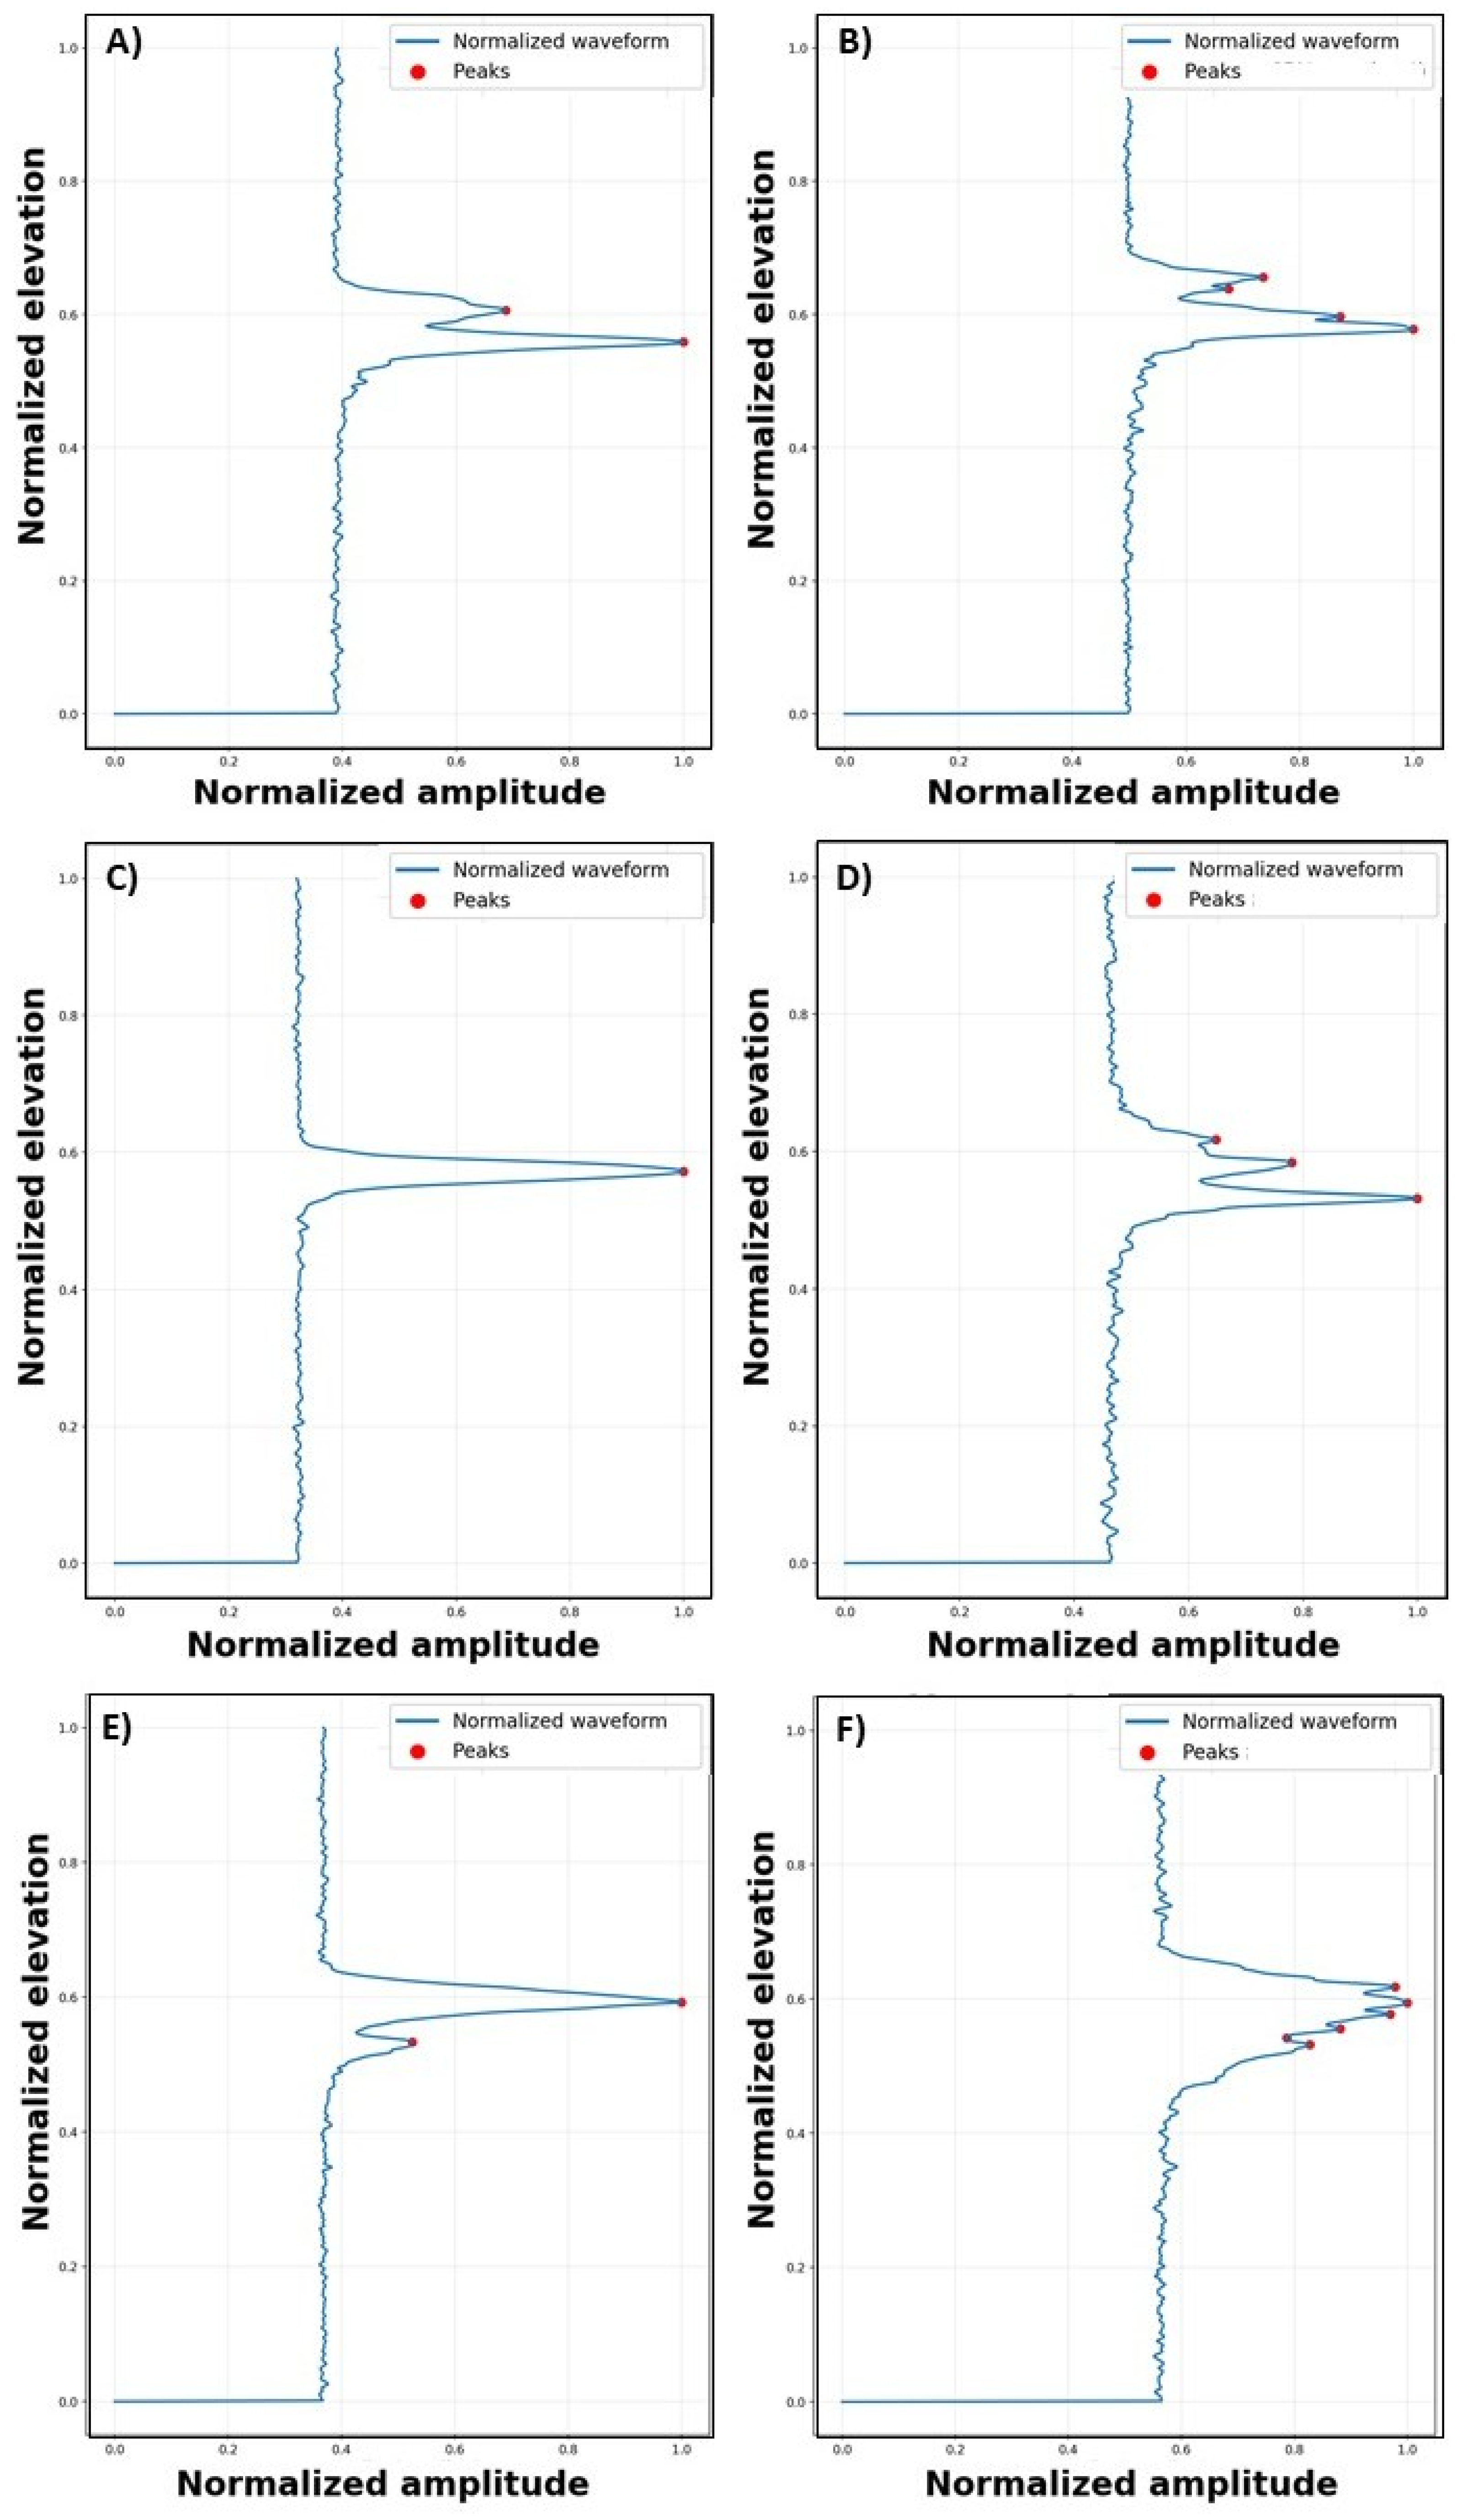
Figure 5.
Field visit pictures and Google Earth images of (A, B) açaí, (C, D) açaí (agroforestry), (E, F) cocoa, (G, H) cocoa (agroforestry), (I, J) oil palm, and (K, L) secondary vegetation, respectively.
Figure 5.
Field visit pictures and Google Earth images of (A, B) açaí, (C, D) açaí (agroforestry), (E, F) cocoa, (G, H) cocoa (agroforestry), (I, J) oil palm, and (K, L) secondary vegetation, respectively.
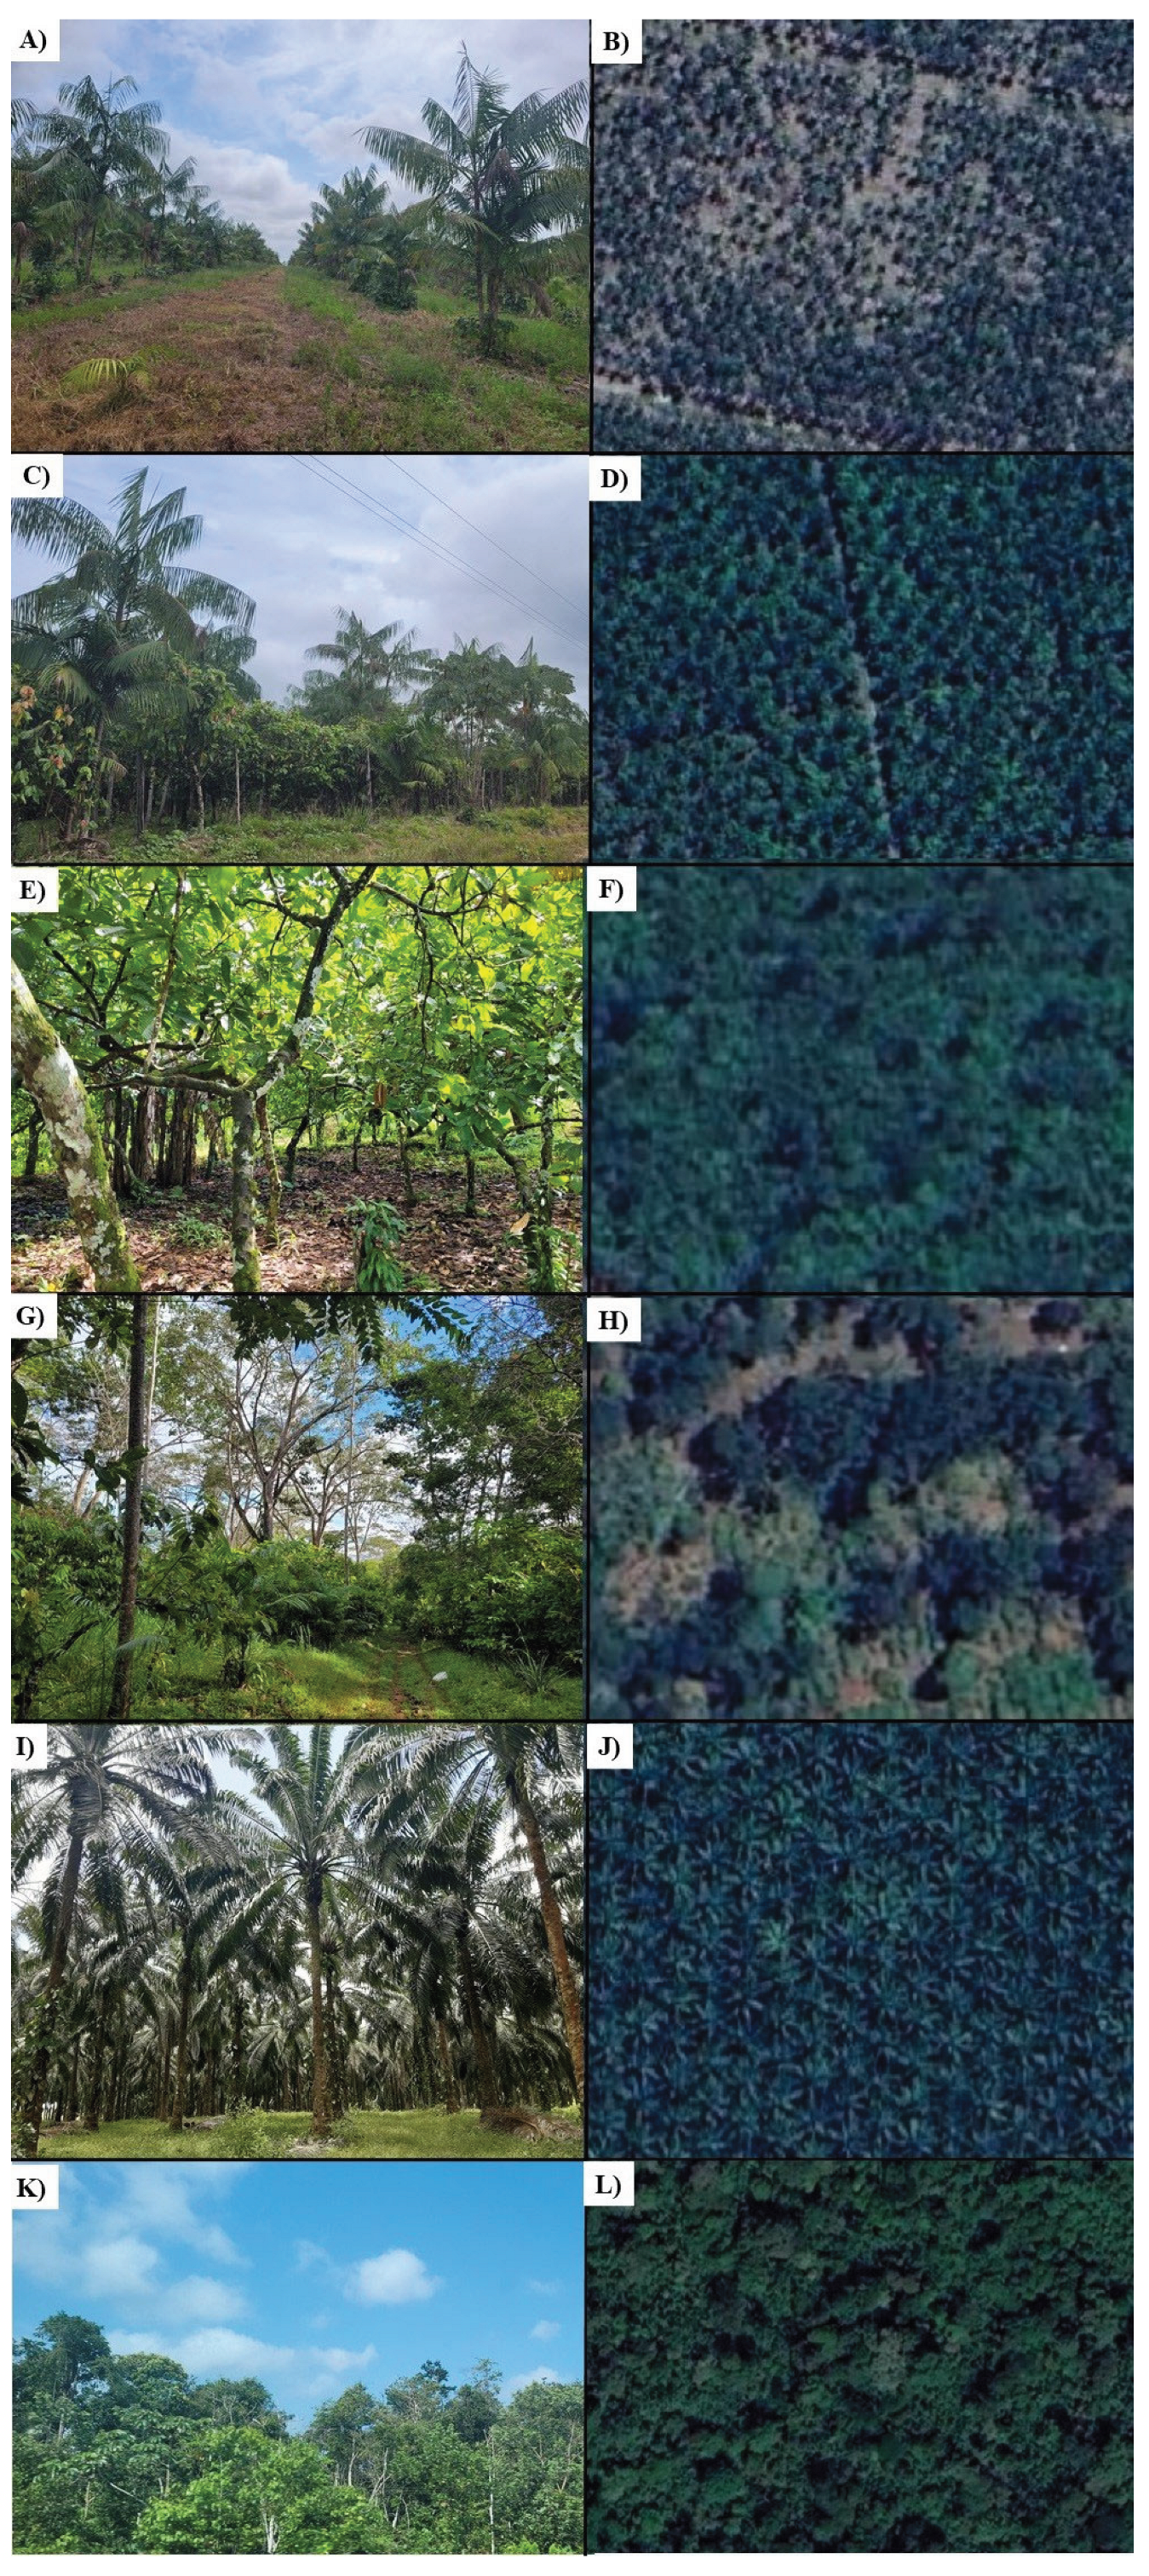
Figure 6.
Boxplots of GEDI L2B data for perennial crops and secondary vegetation. n = number of samples.
Figure 6.
Boxplots of GEDI L2B data for perennial crops and secondary vegetation. n = number of samples.
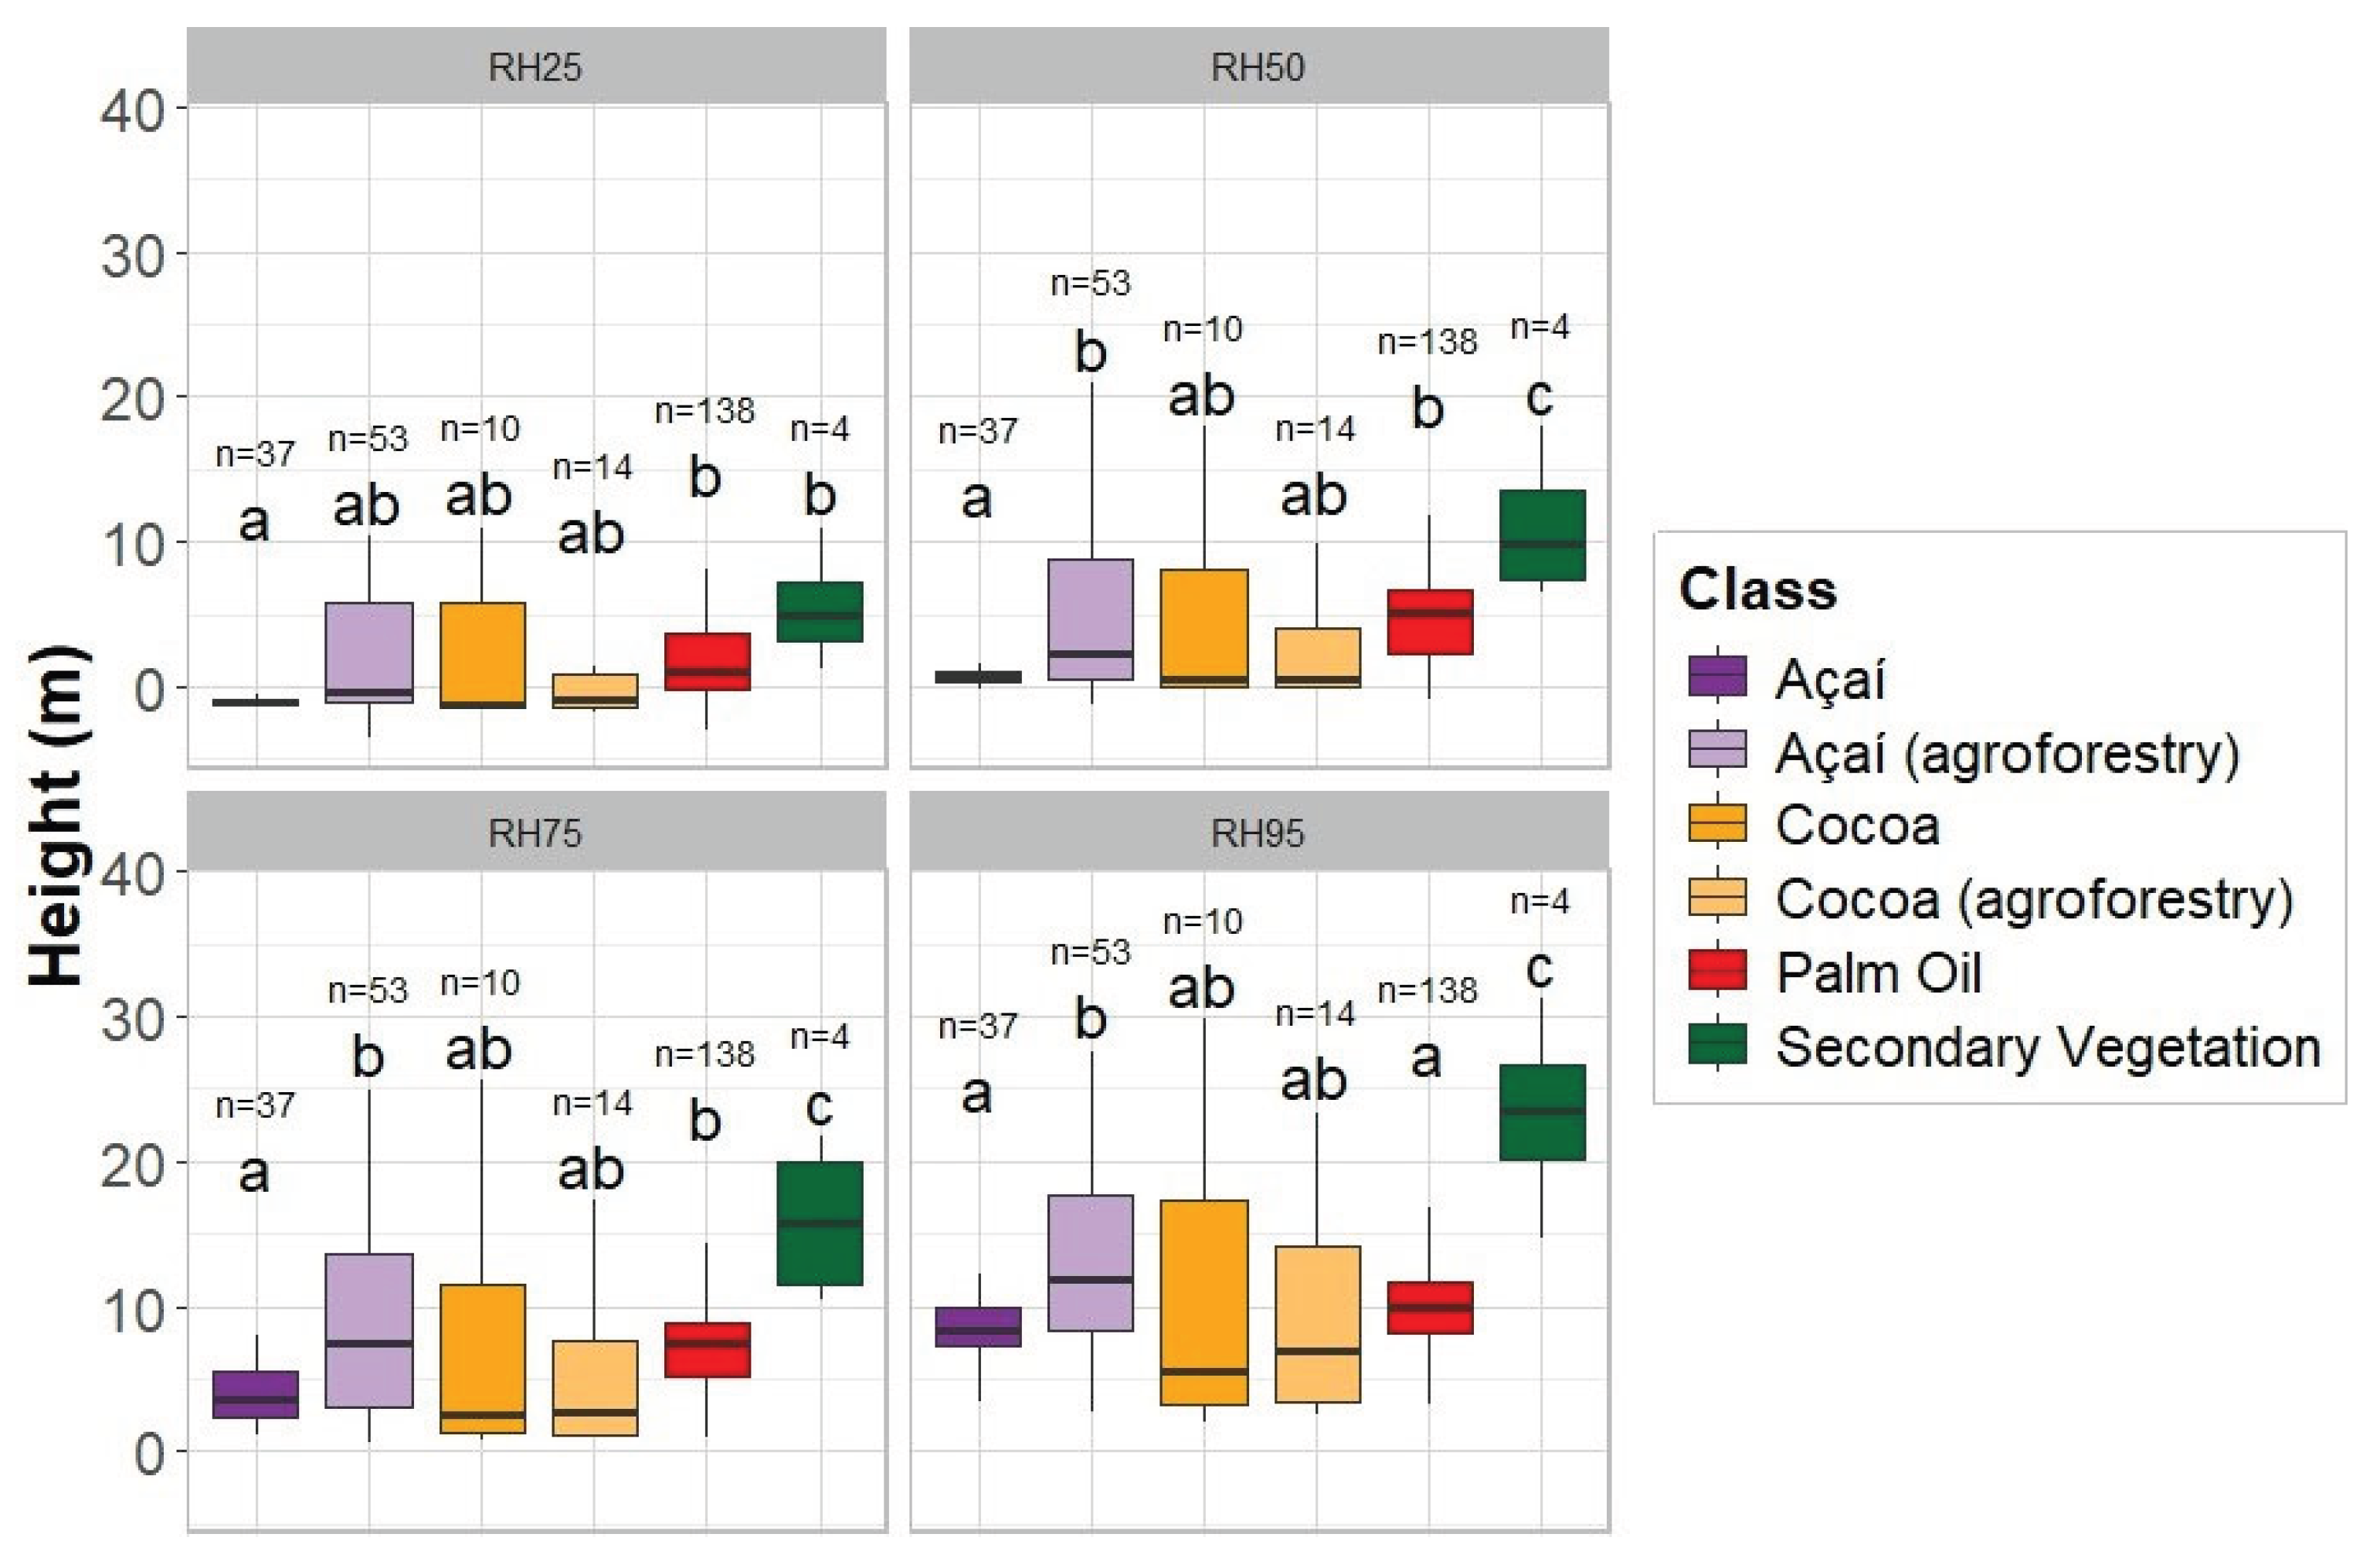
Figure 7.
Field record showing an oil palm plantation on the left and an açaí plantation on the right.
Figure 7.
Field record showing an oil palm plantation on the left and an açaí plantation on the right.
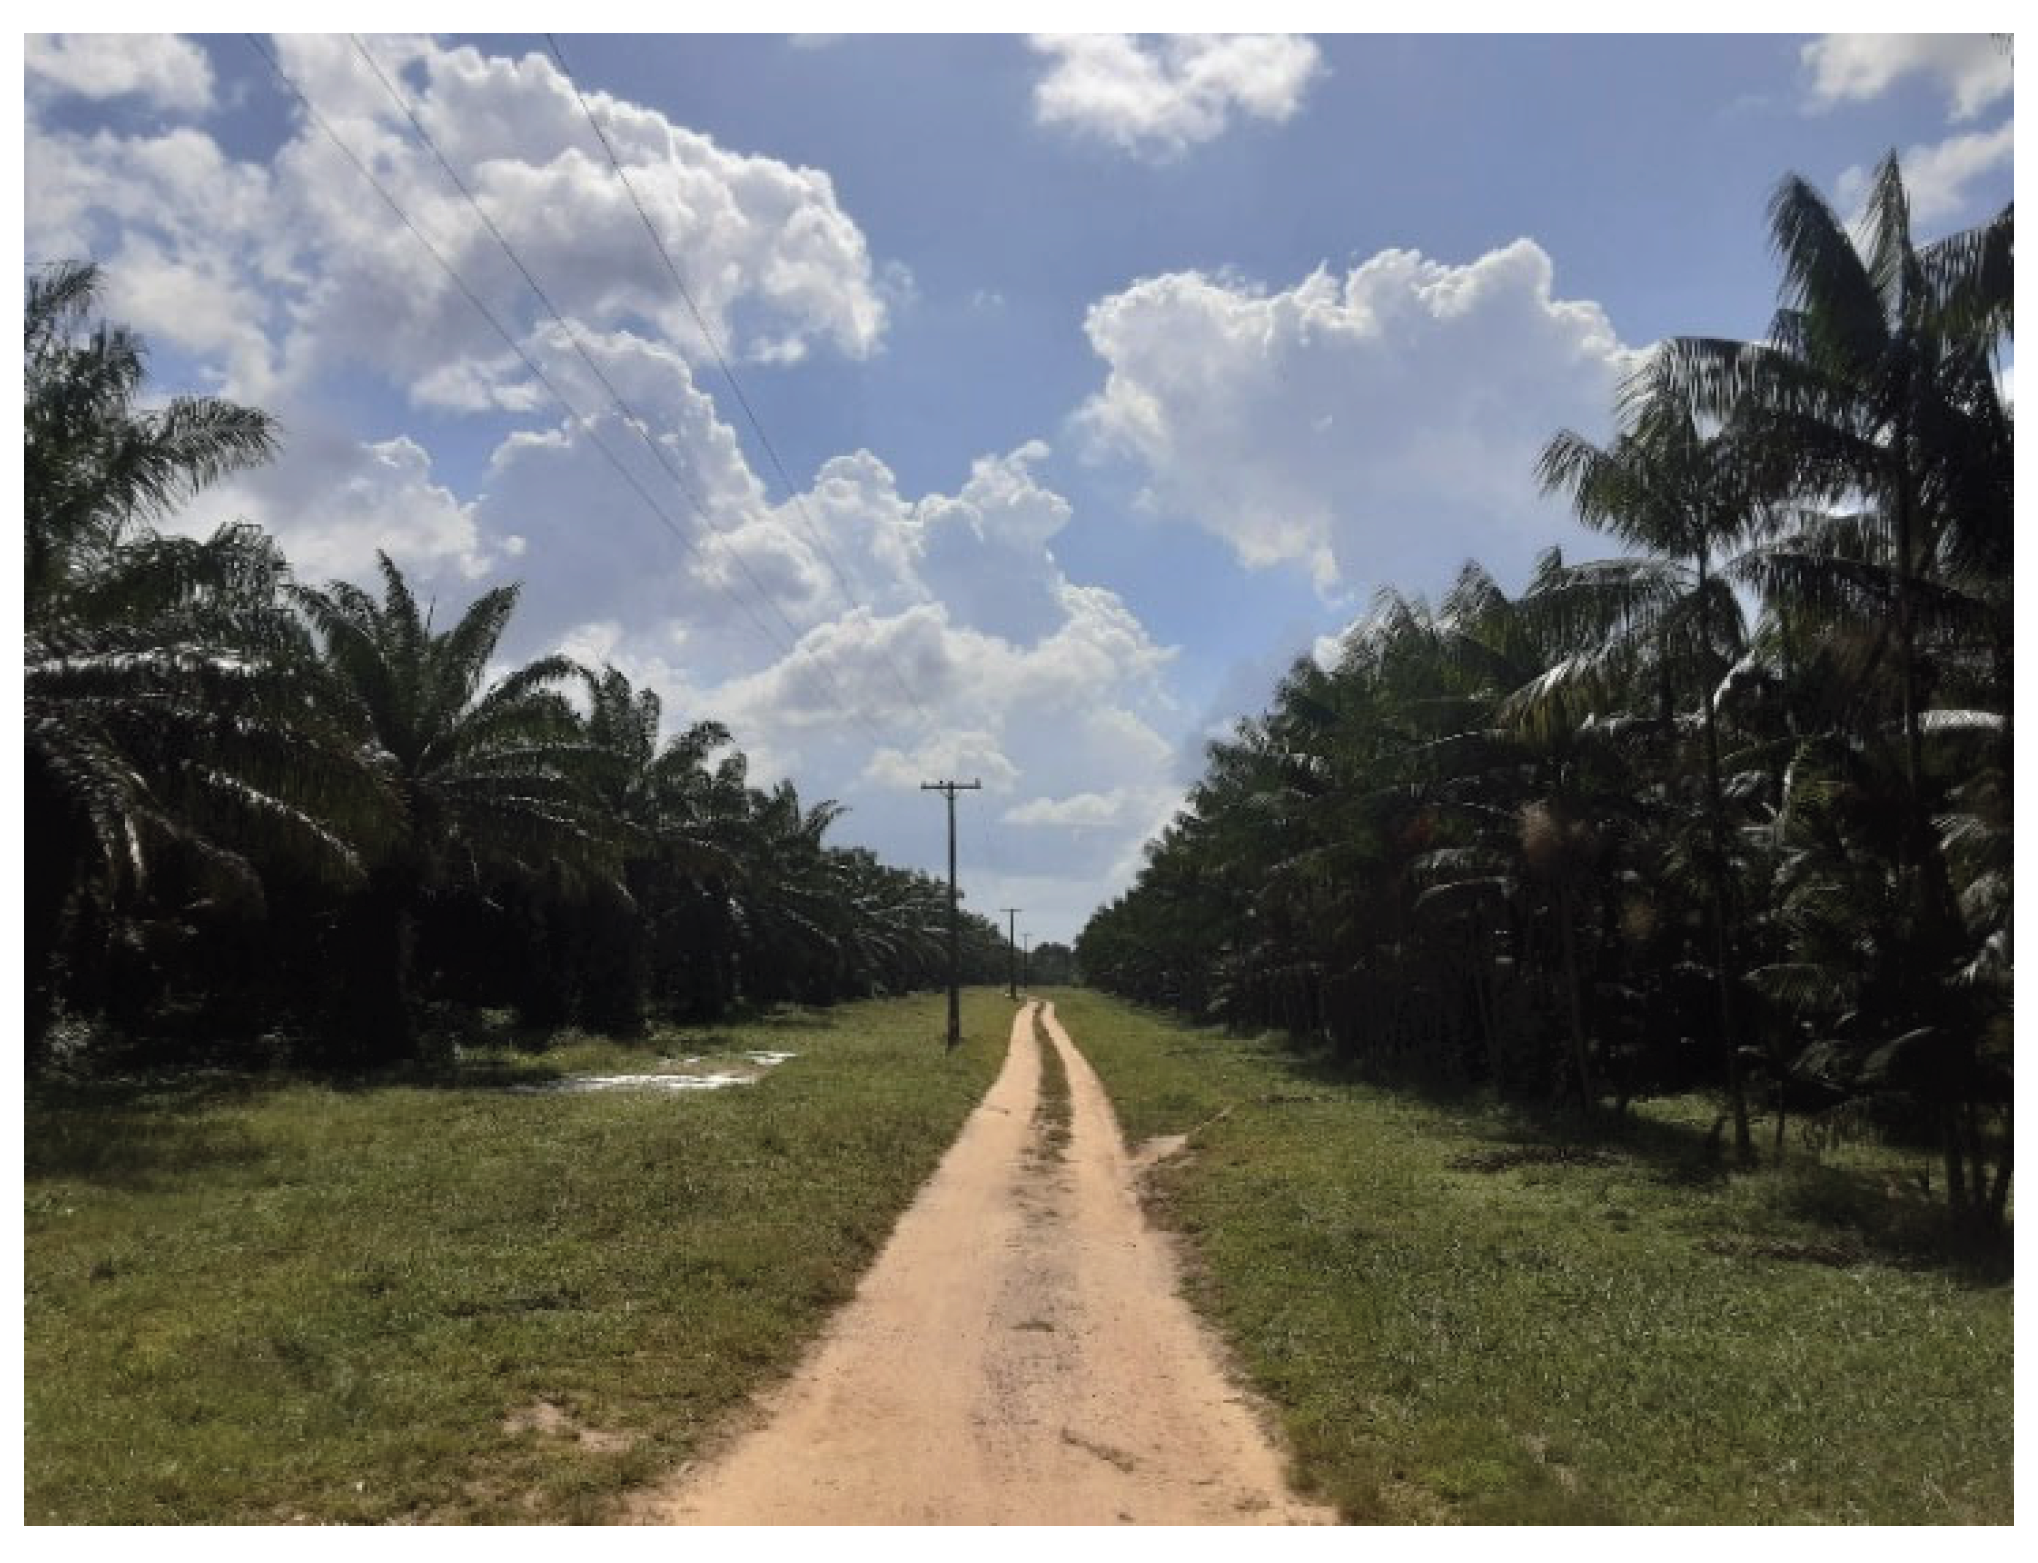
Figure 8.
Boxplot of RH95/RH75 index for each analysed class.
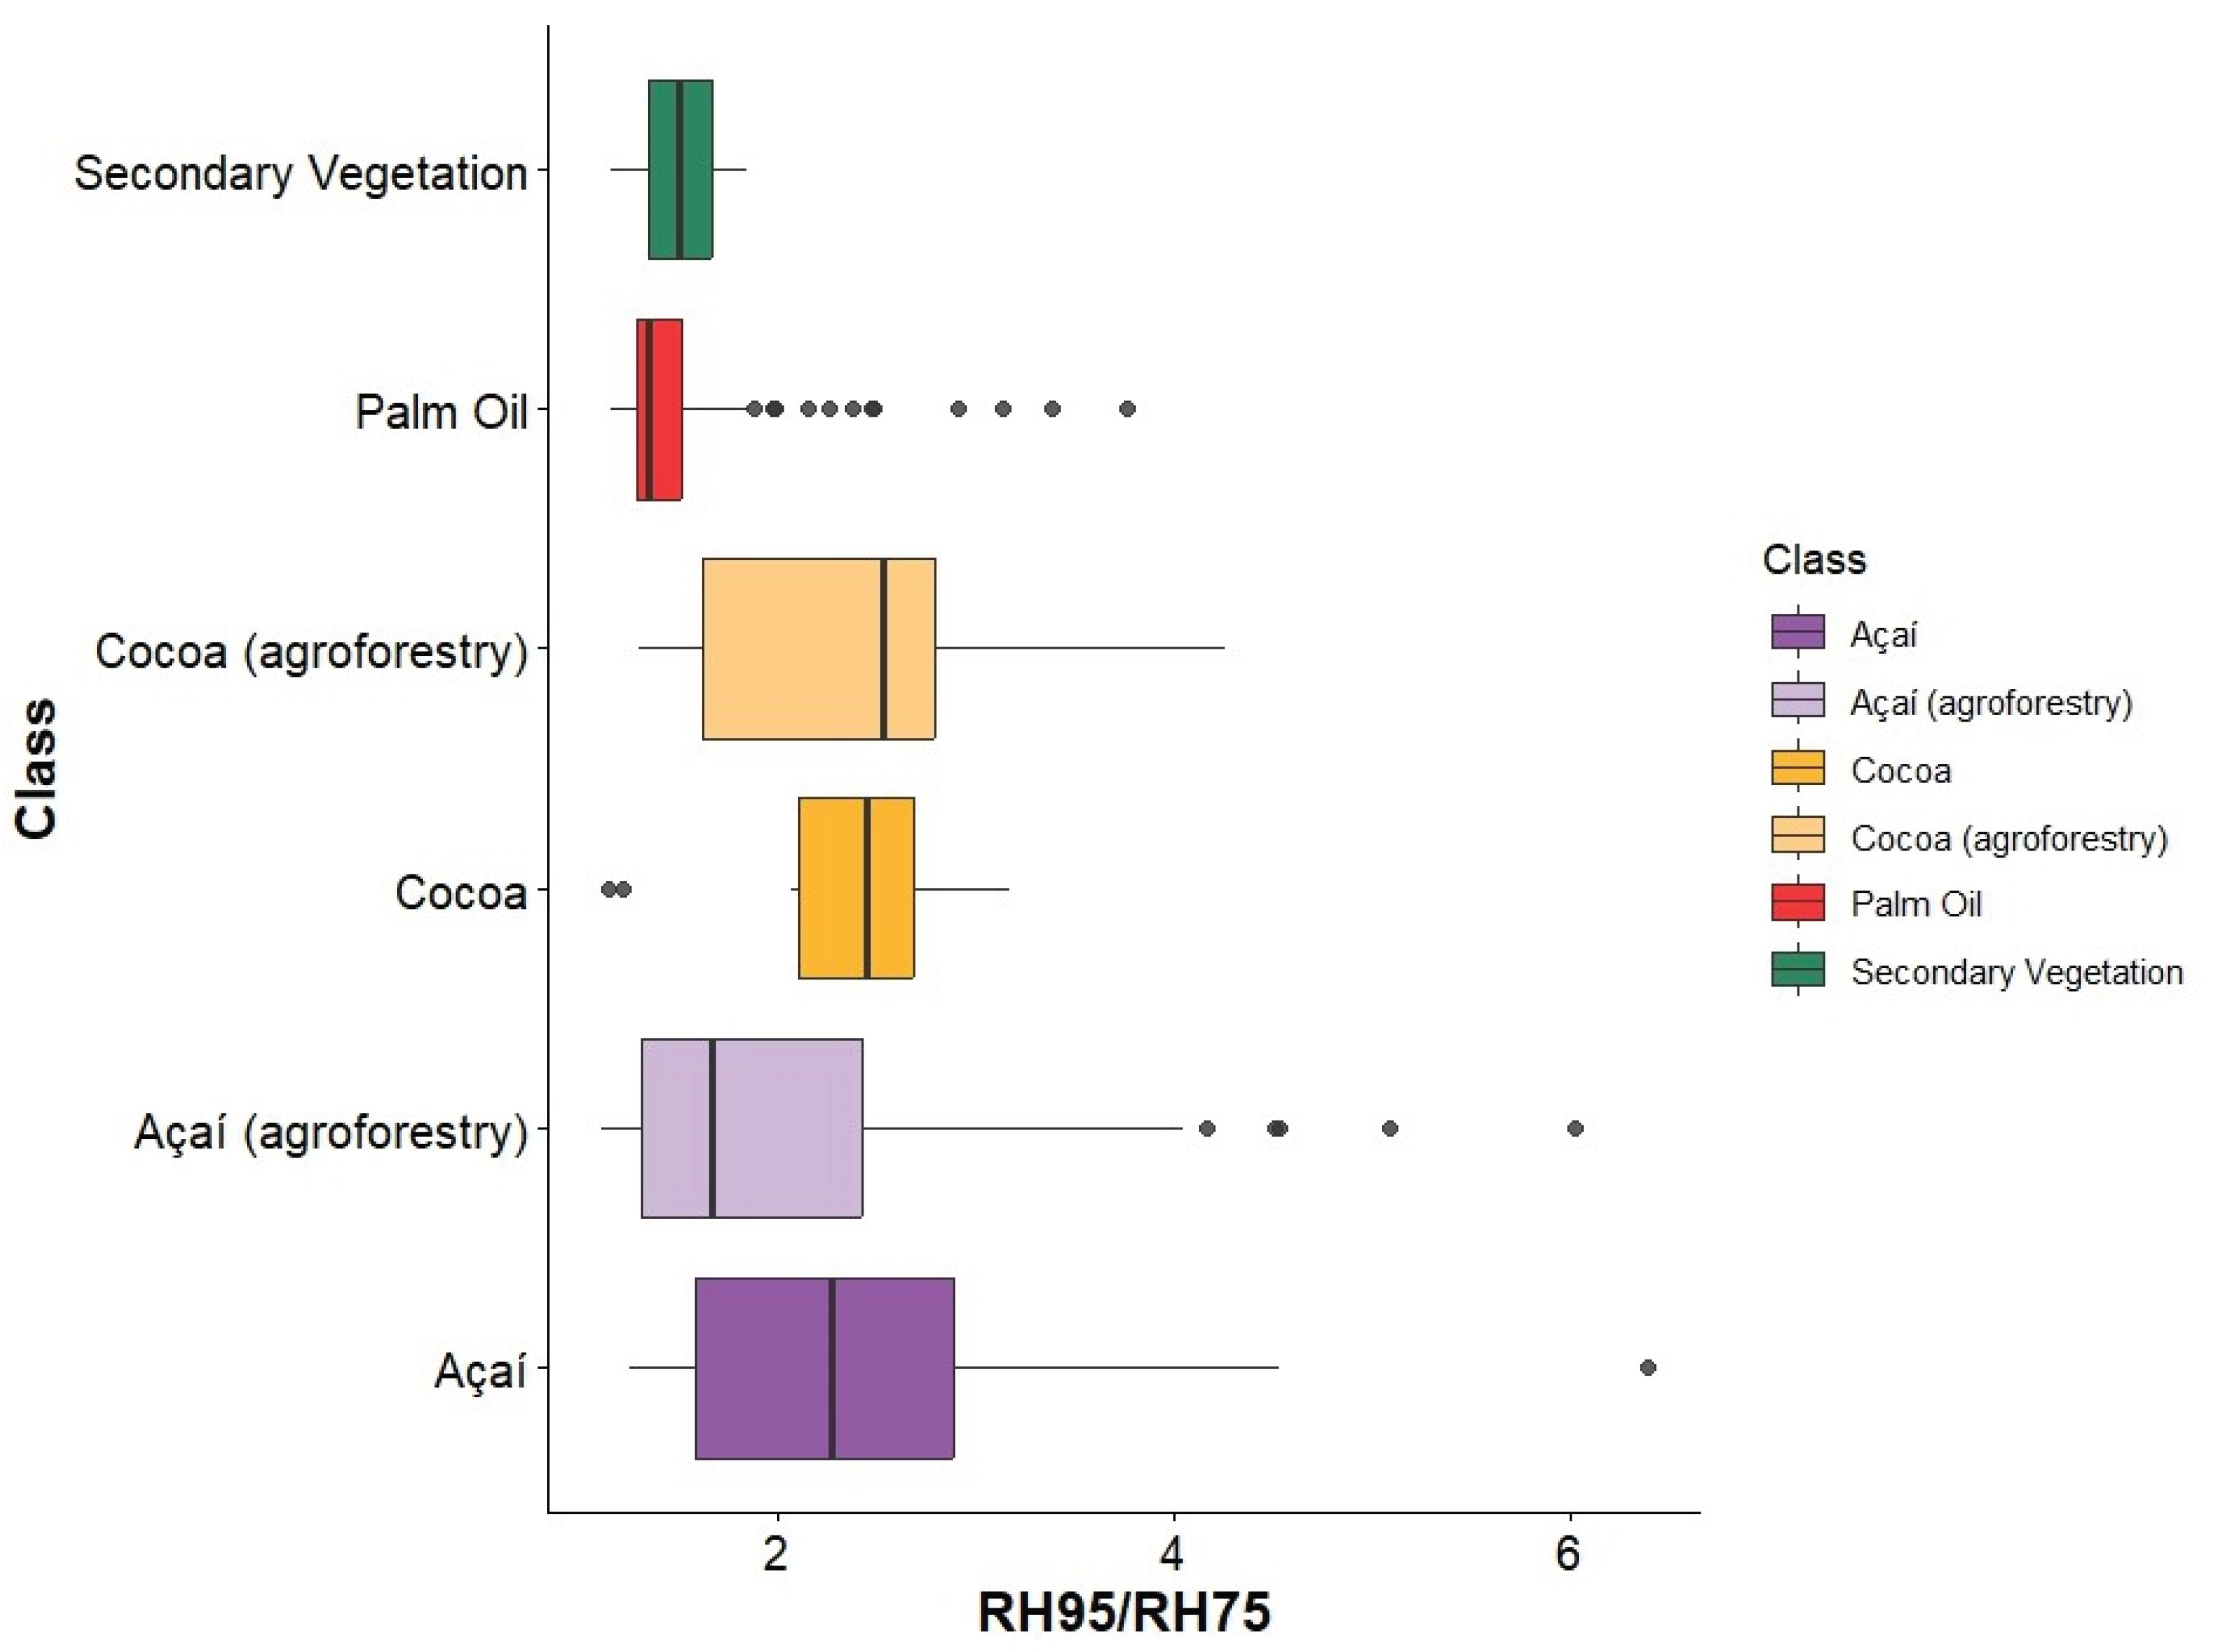
Figure 9.
Mean reflectance spectra, PCA, and rPCA of perennial crops and secondary vegetation.
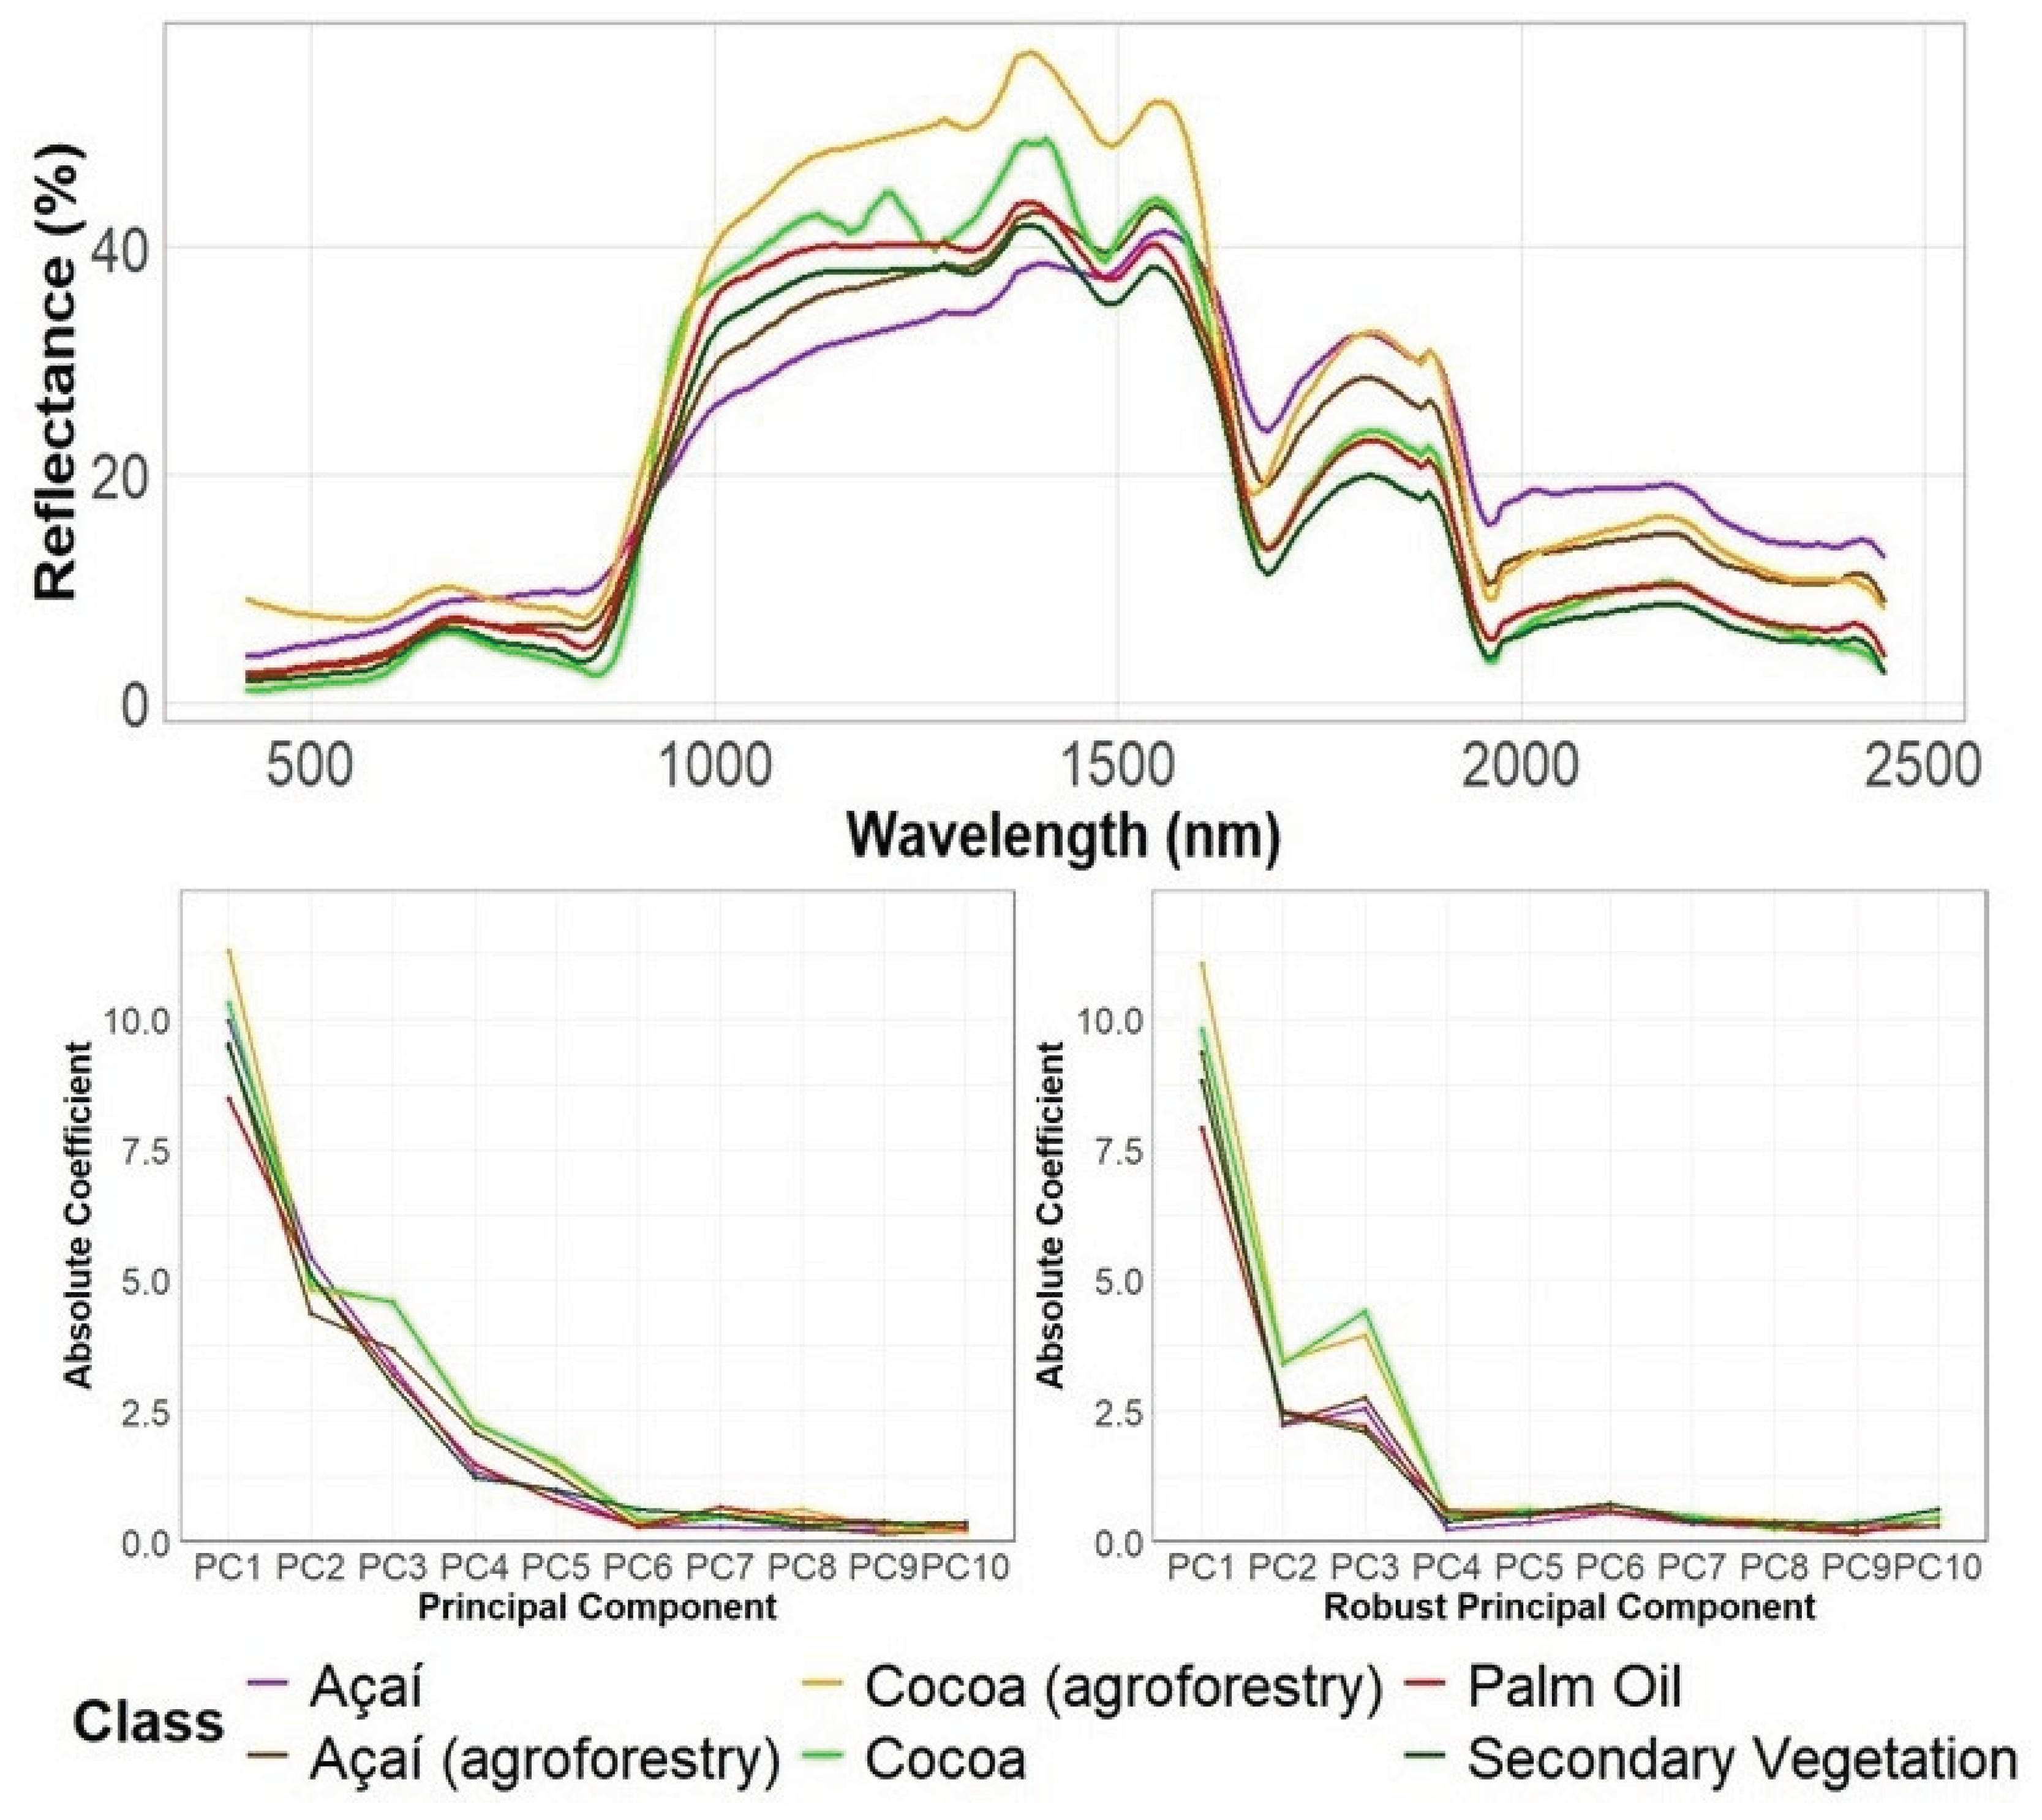
Figure 10.
Cumulative explained variance of the PCA and rPCA.
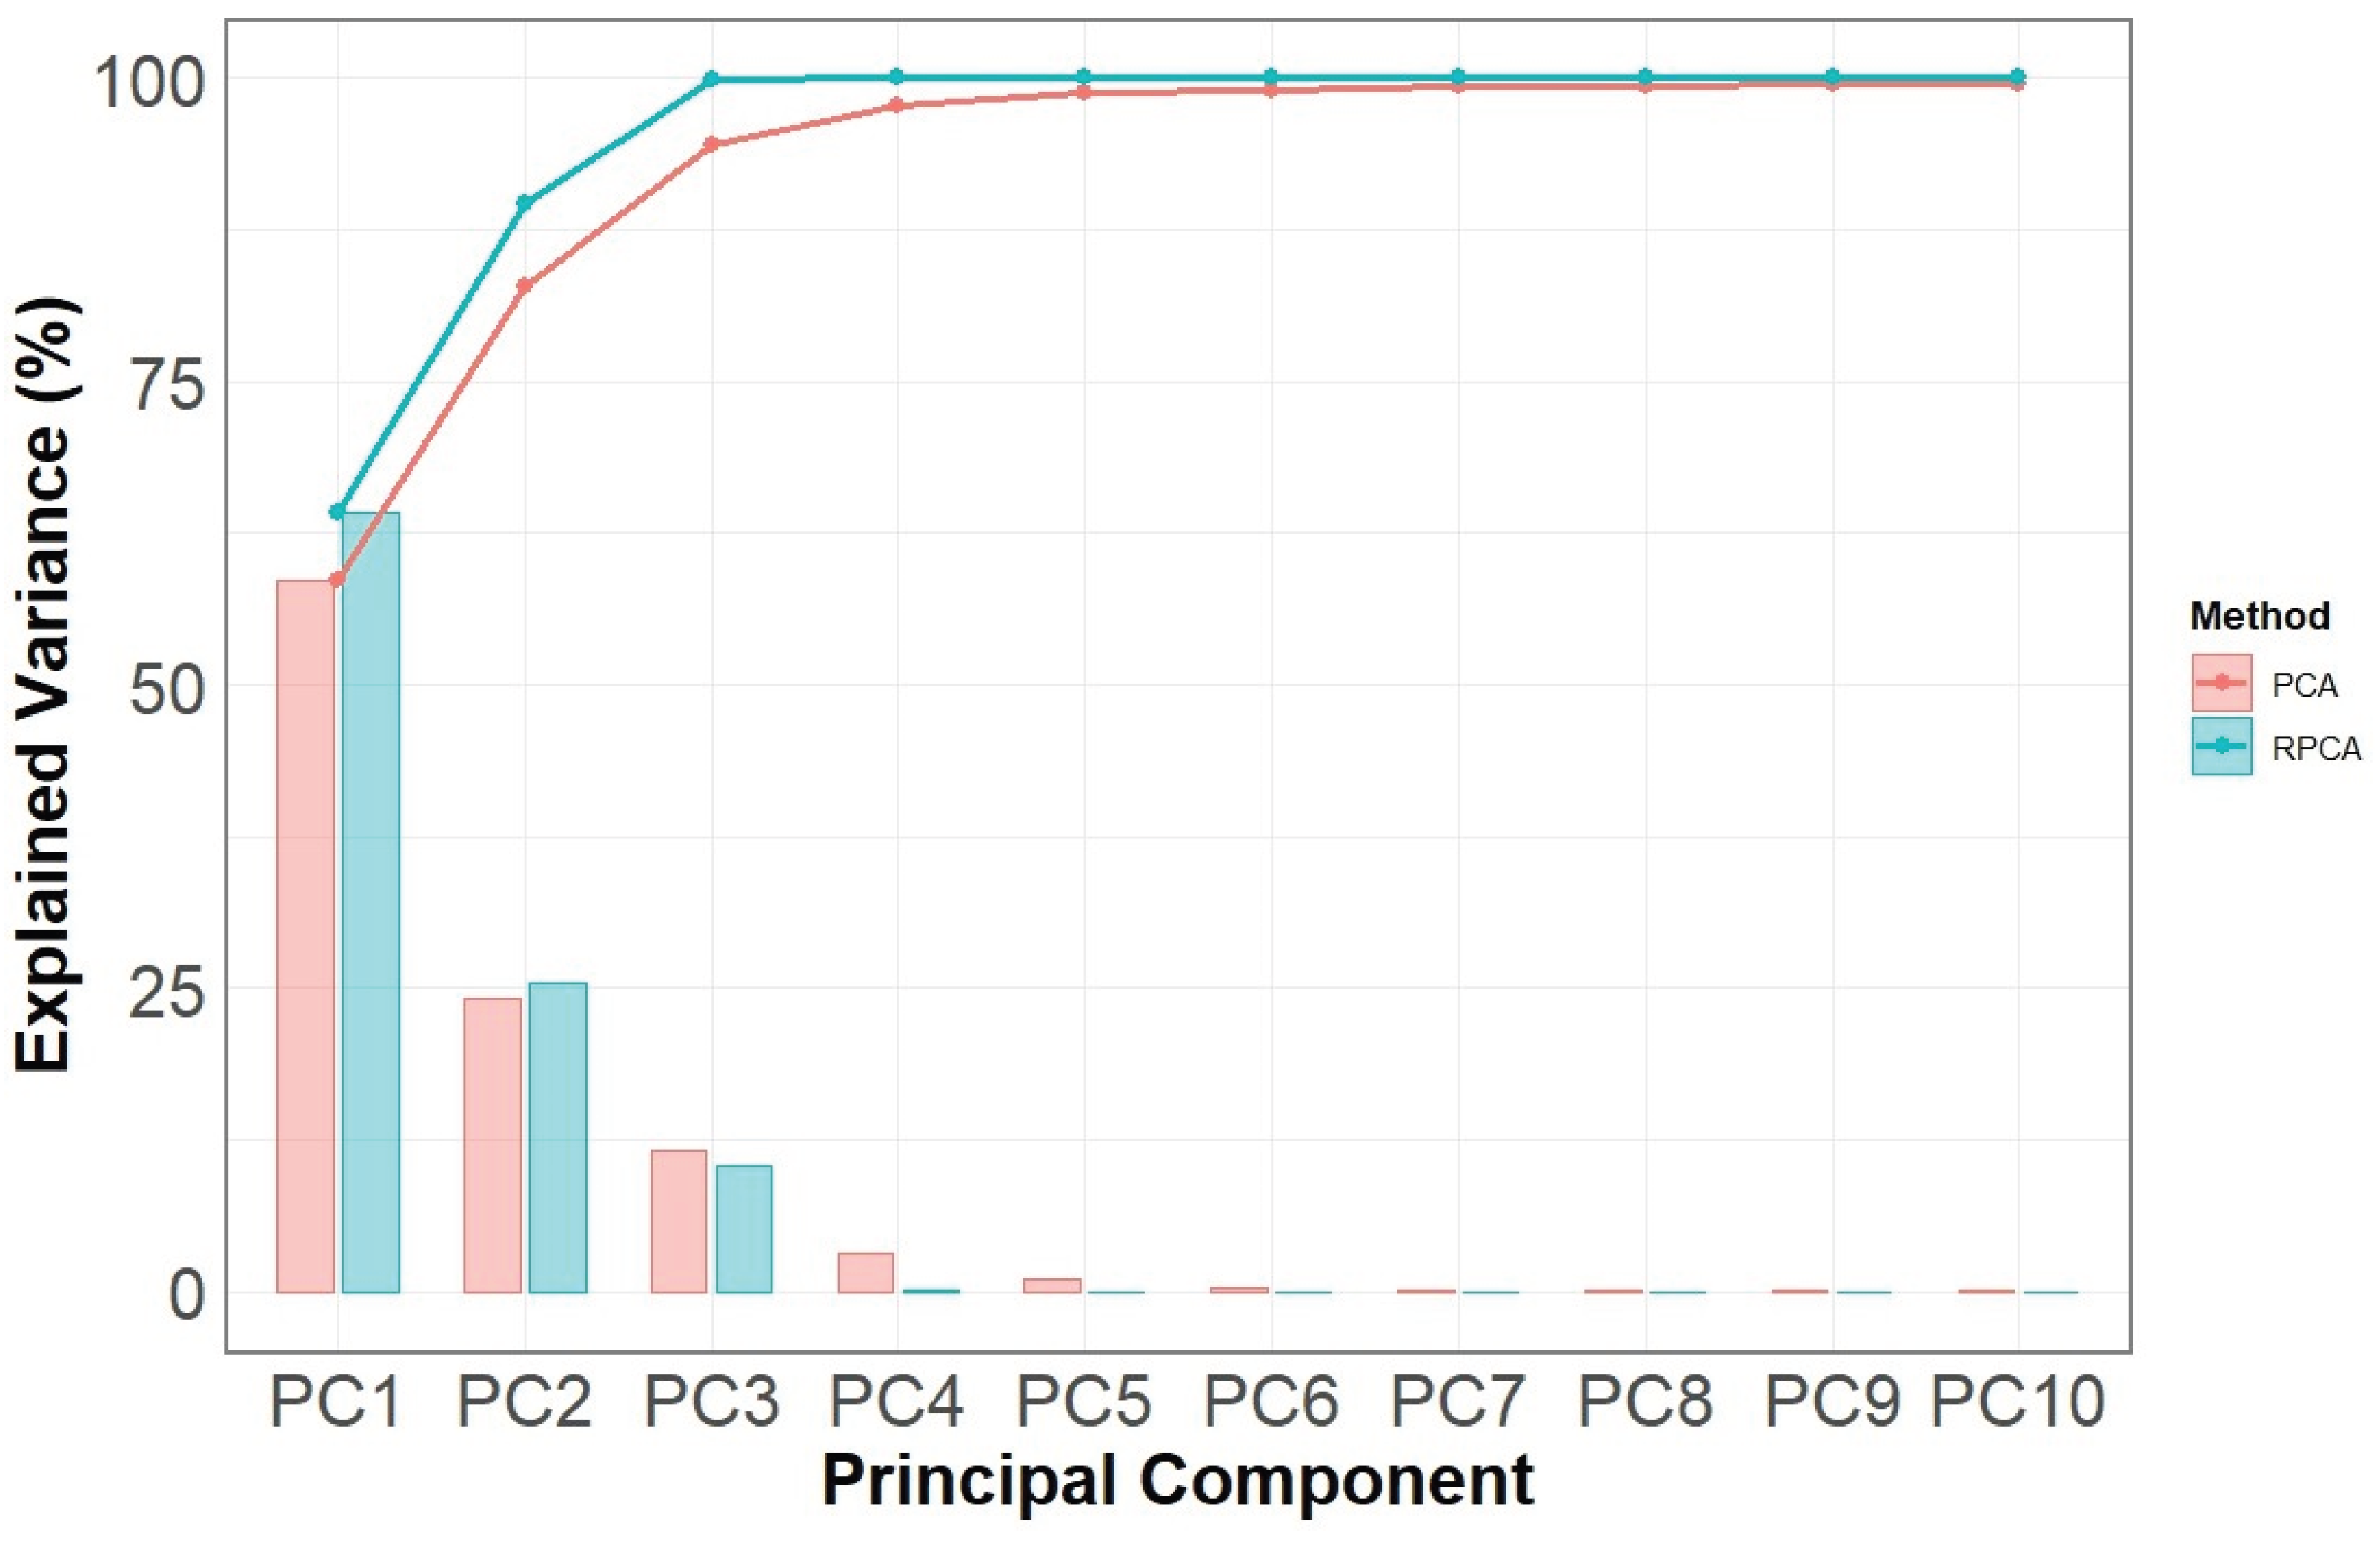
Figure 11.
PCA loading diagram based on mean values of vegetation classes reflectance.
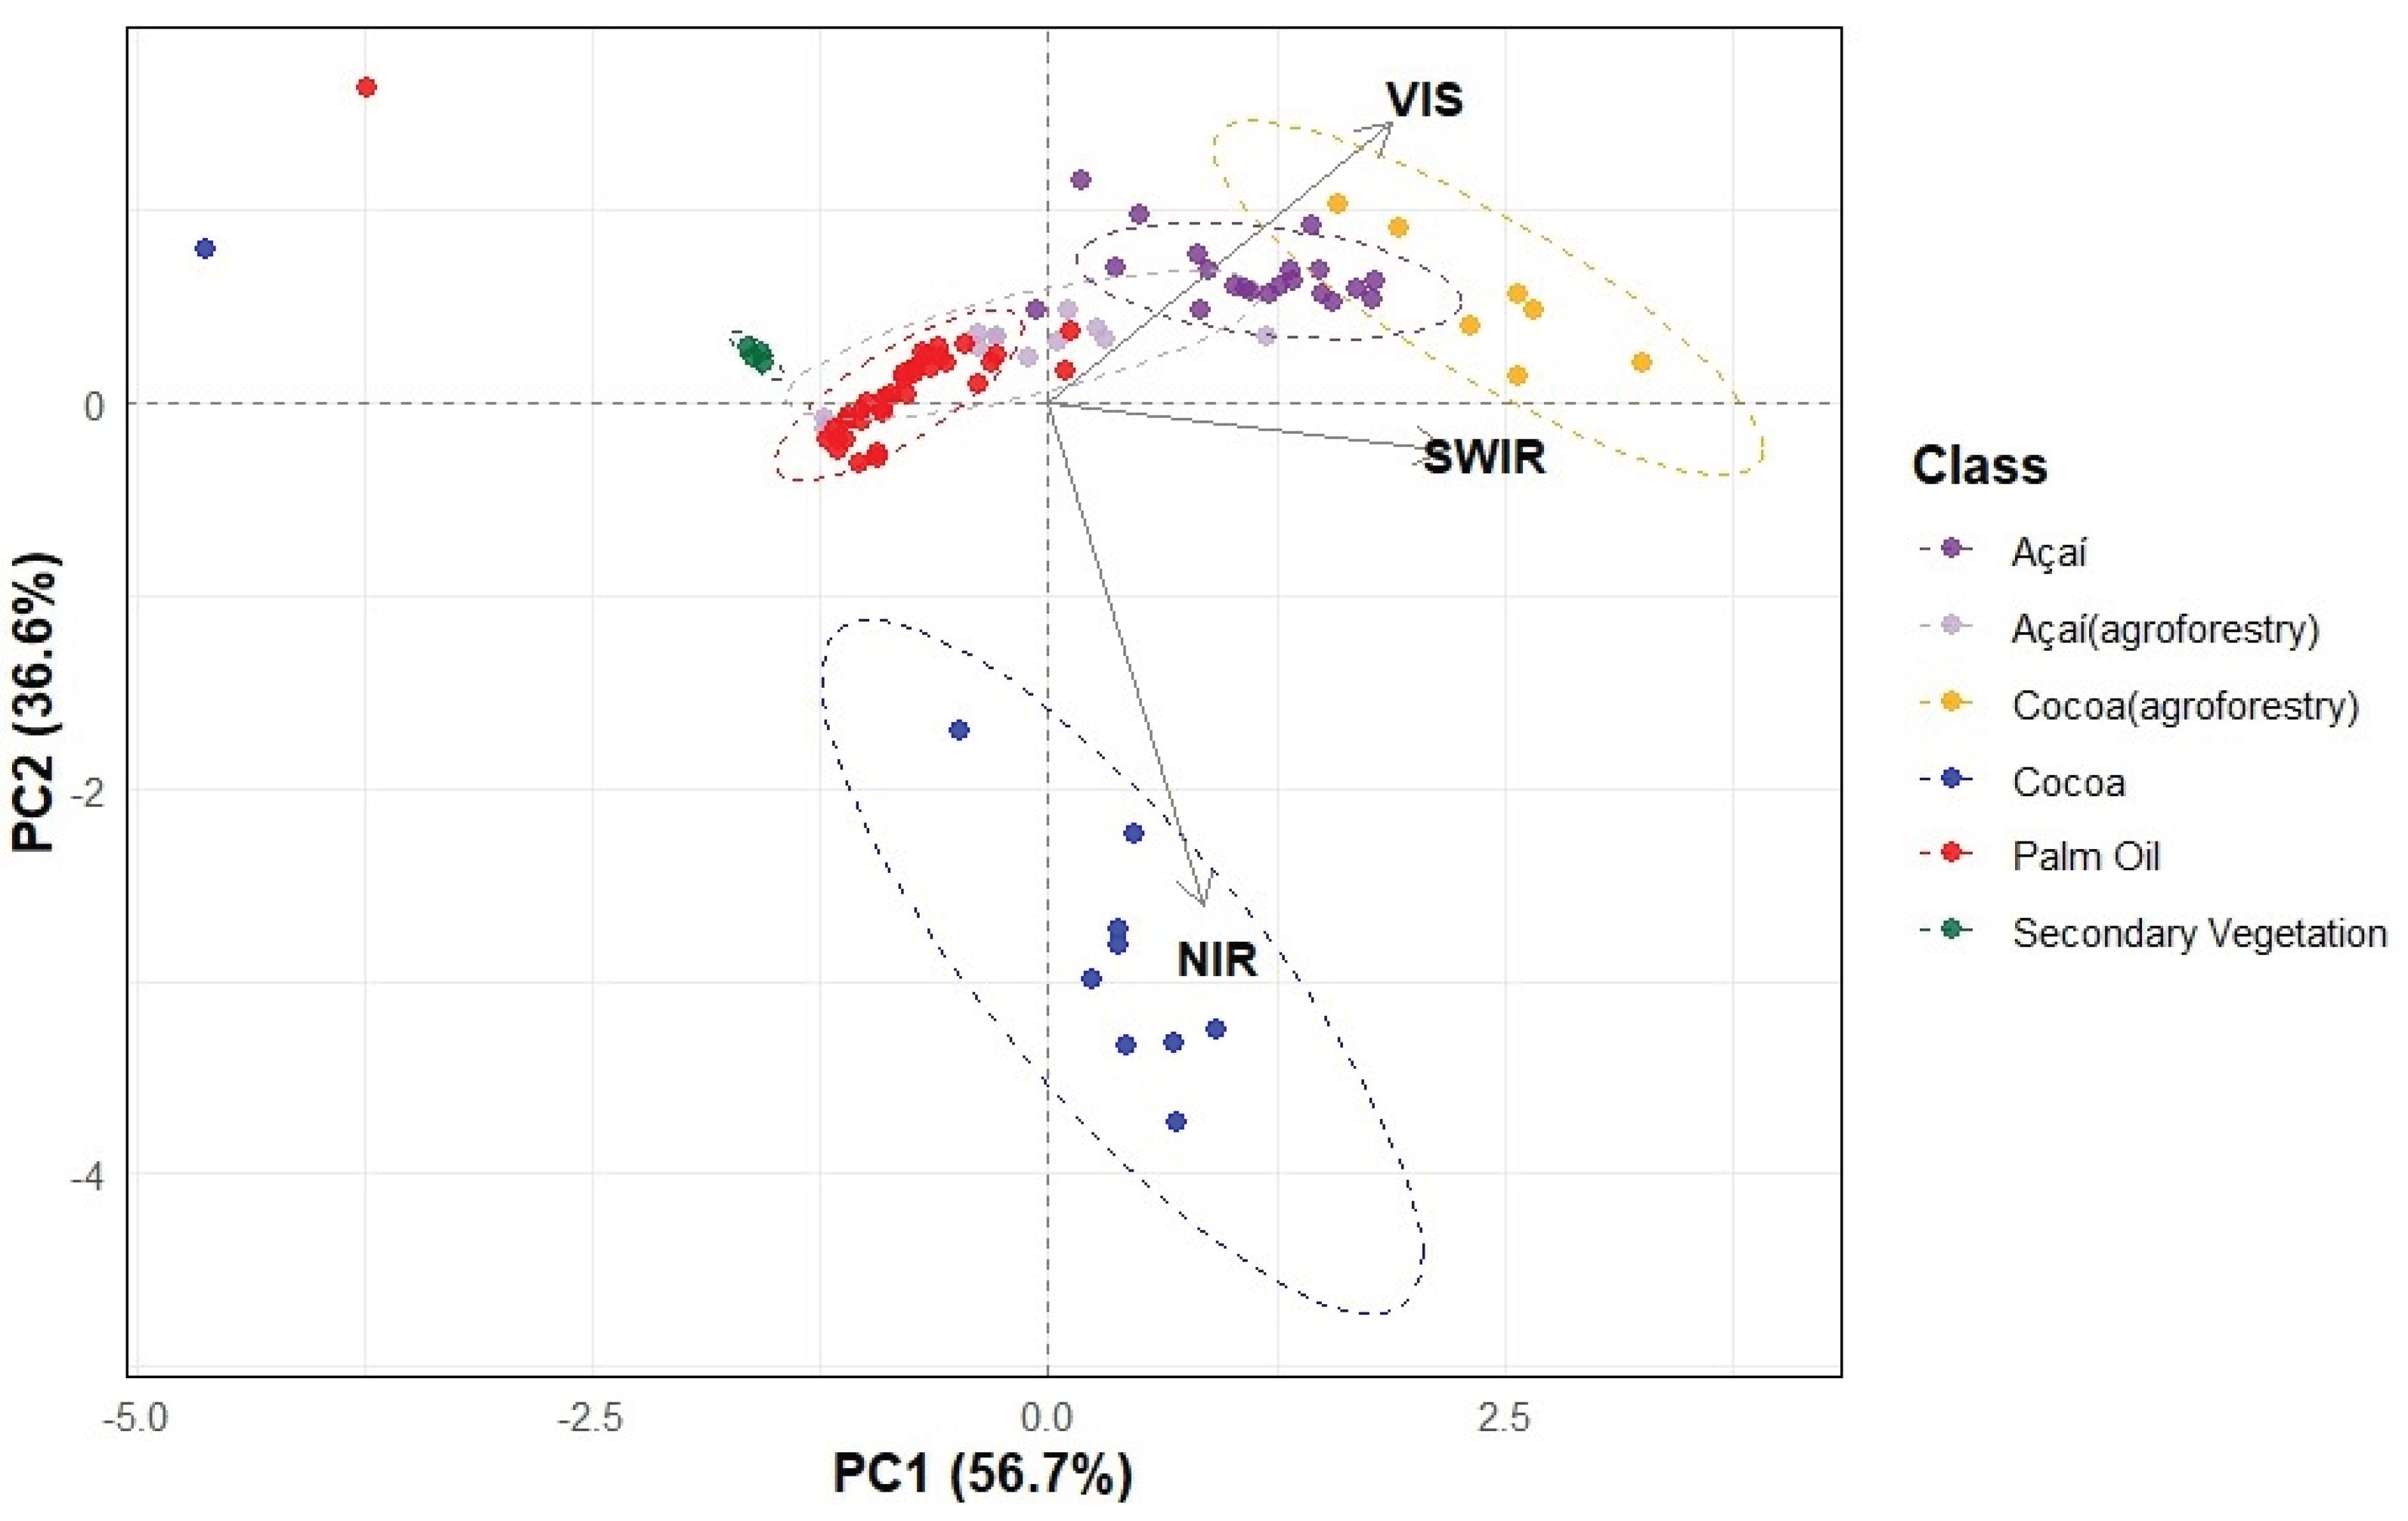
Figure 12.
Loadings per wavelength in each component.
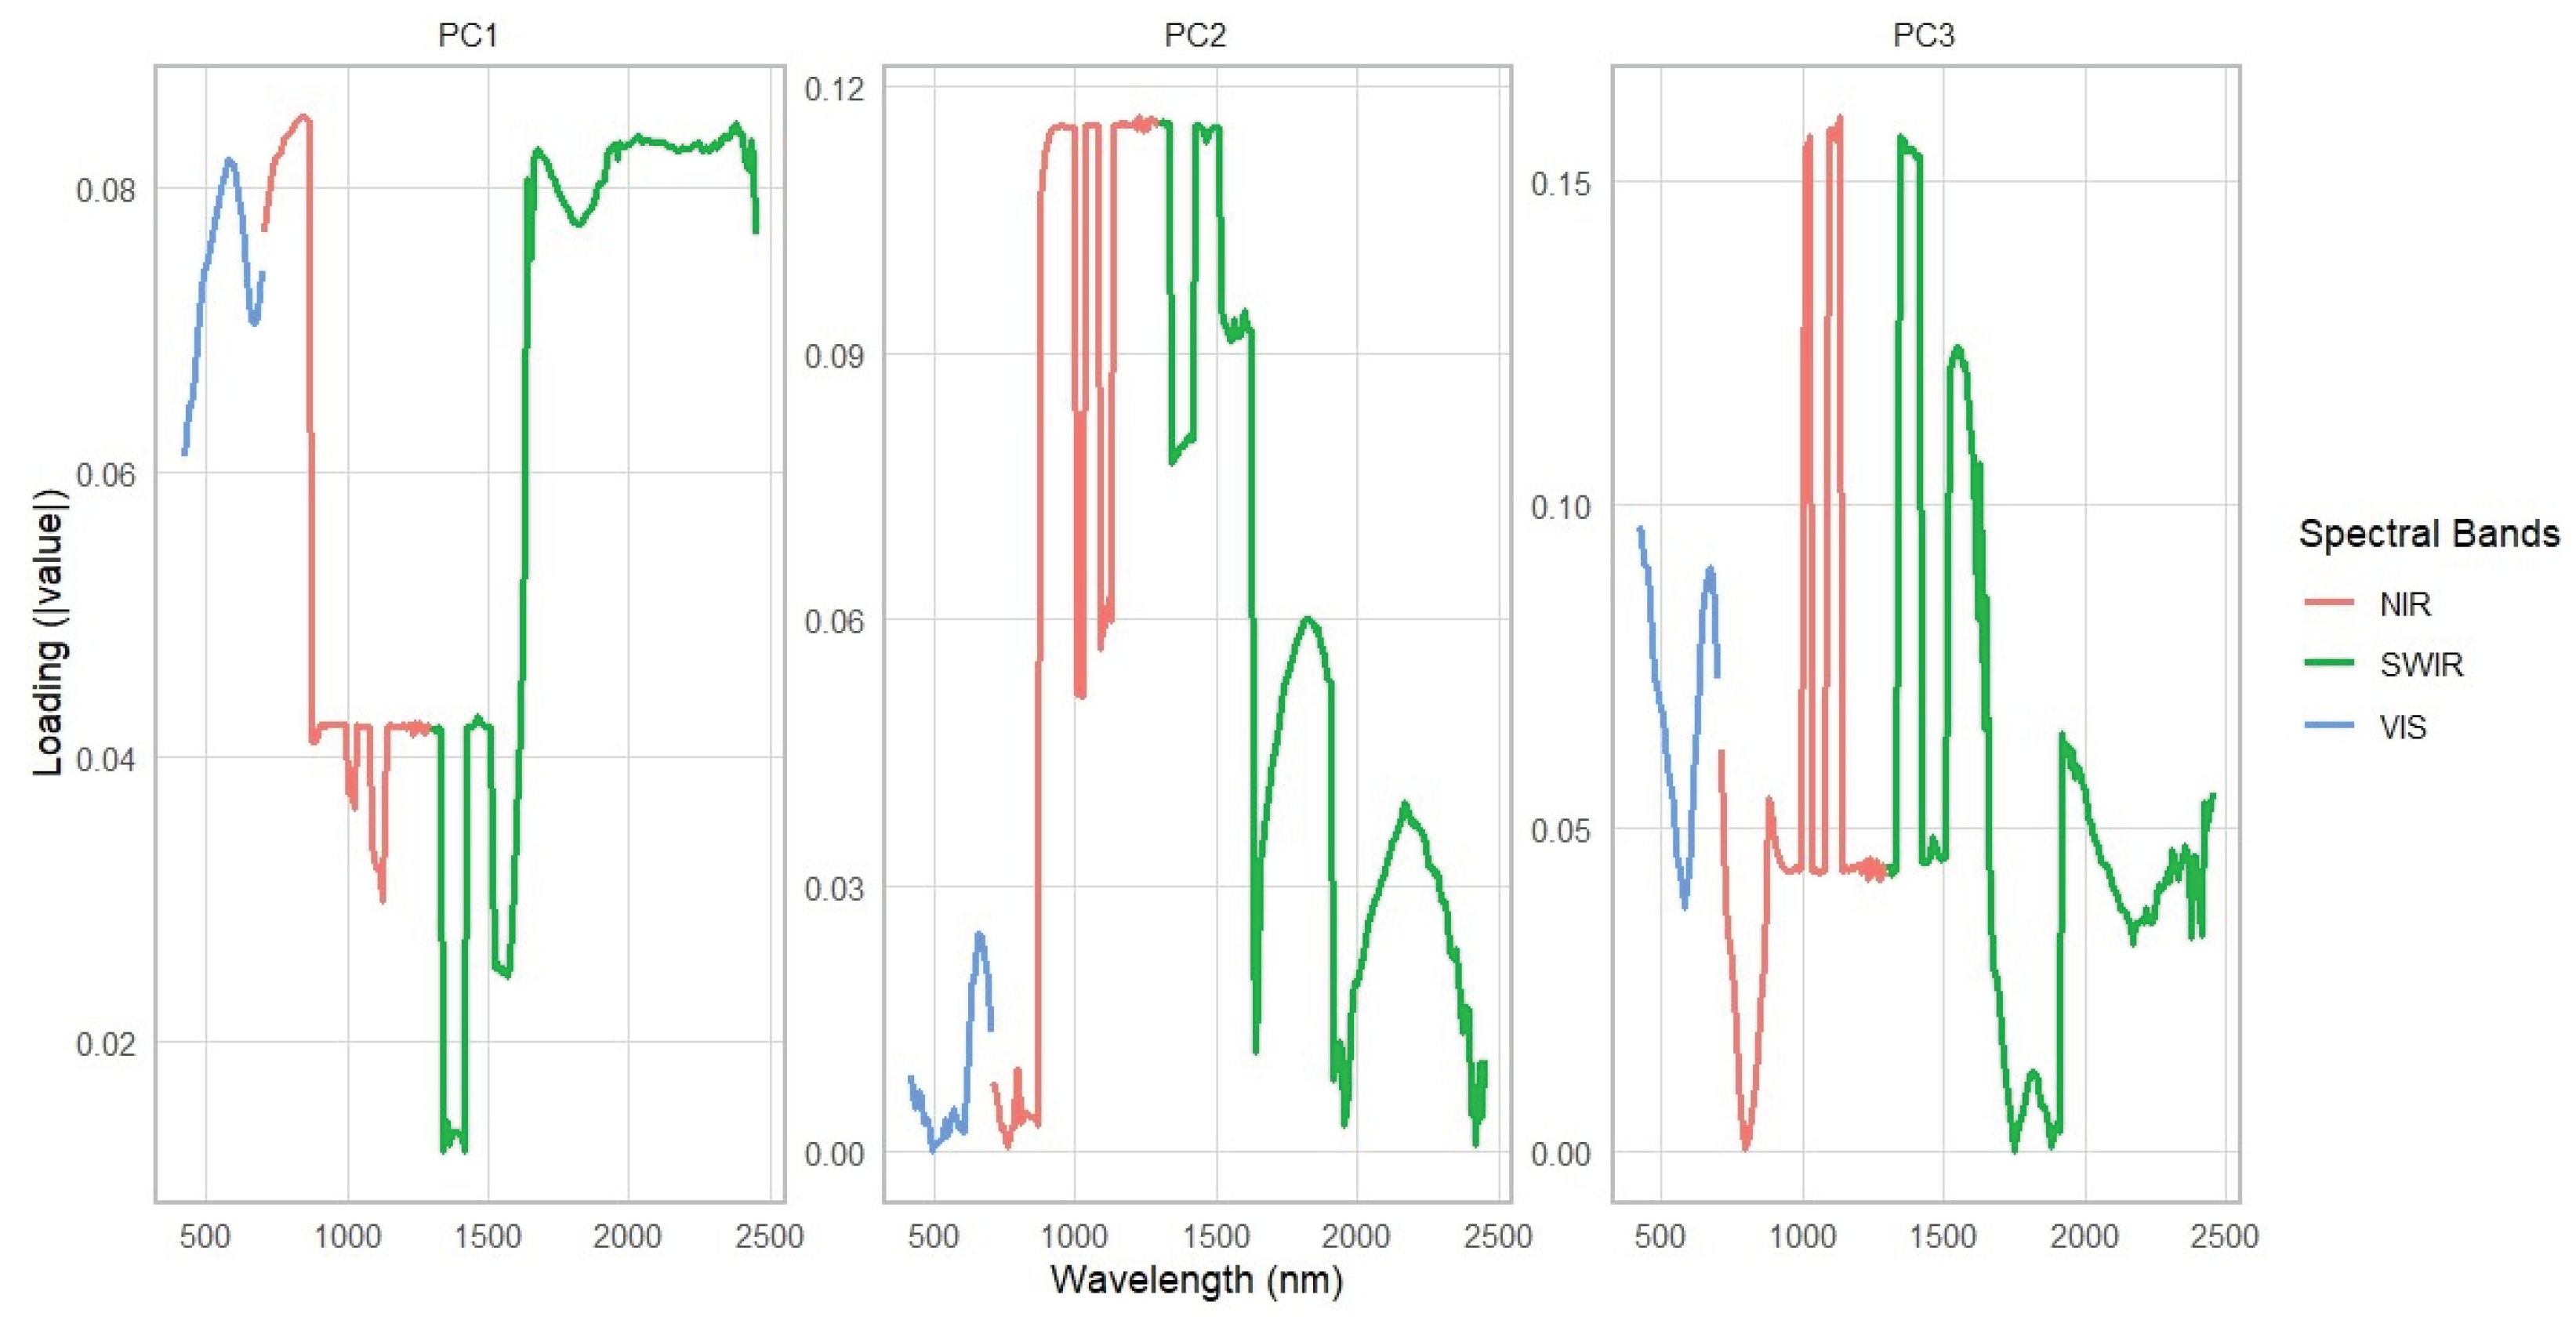
Figure 13.
(a)First and (b) second derivative of perennial crops and secondary vegetation.
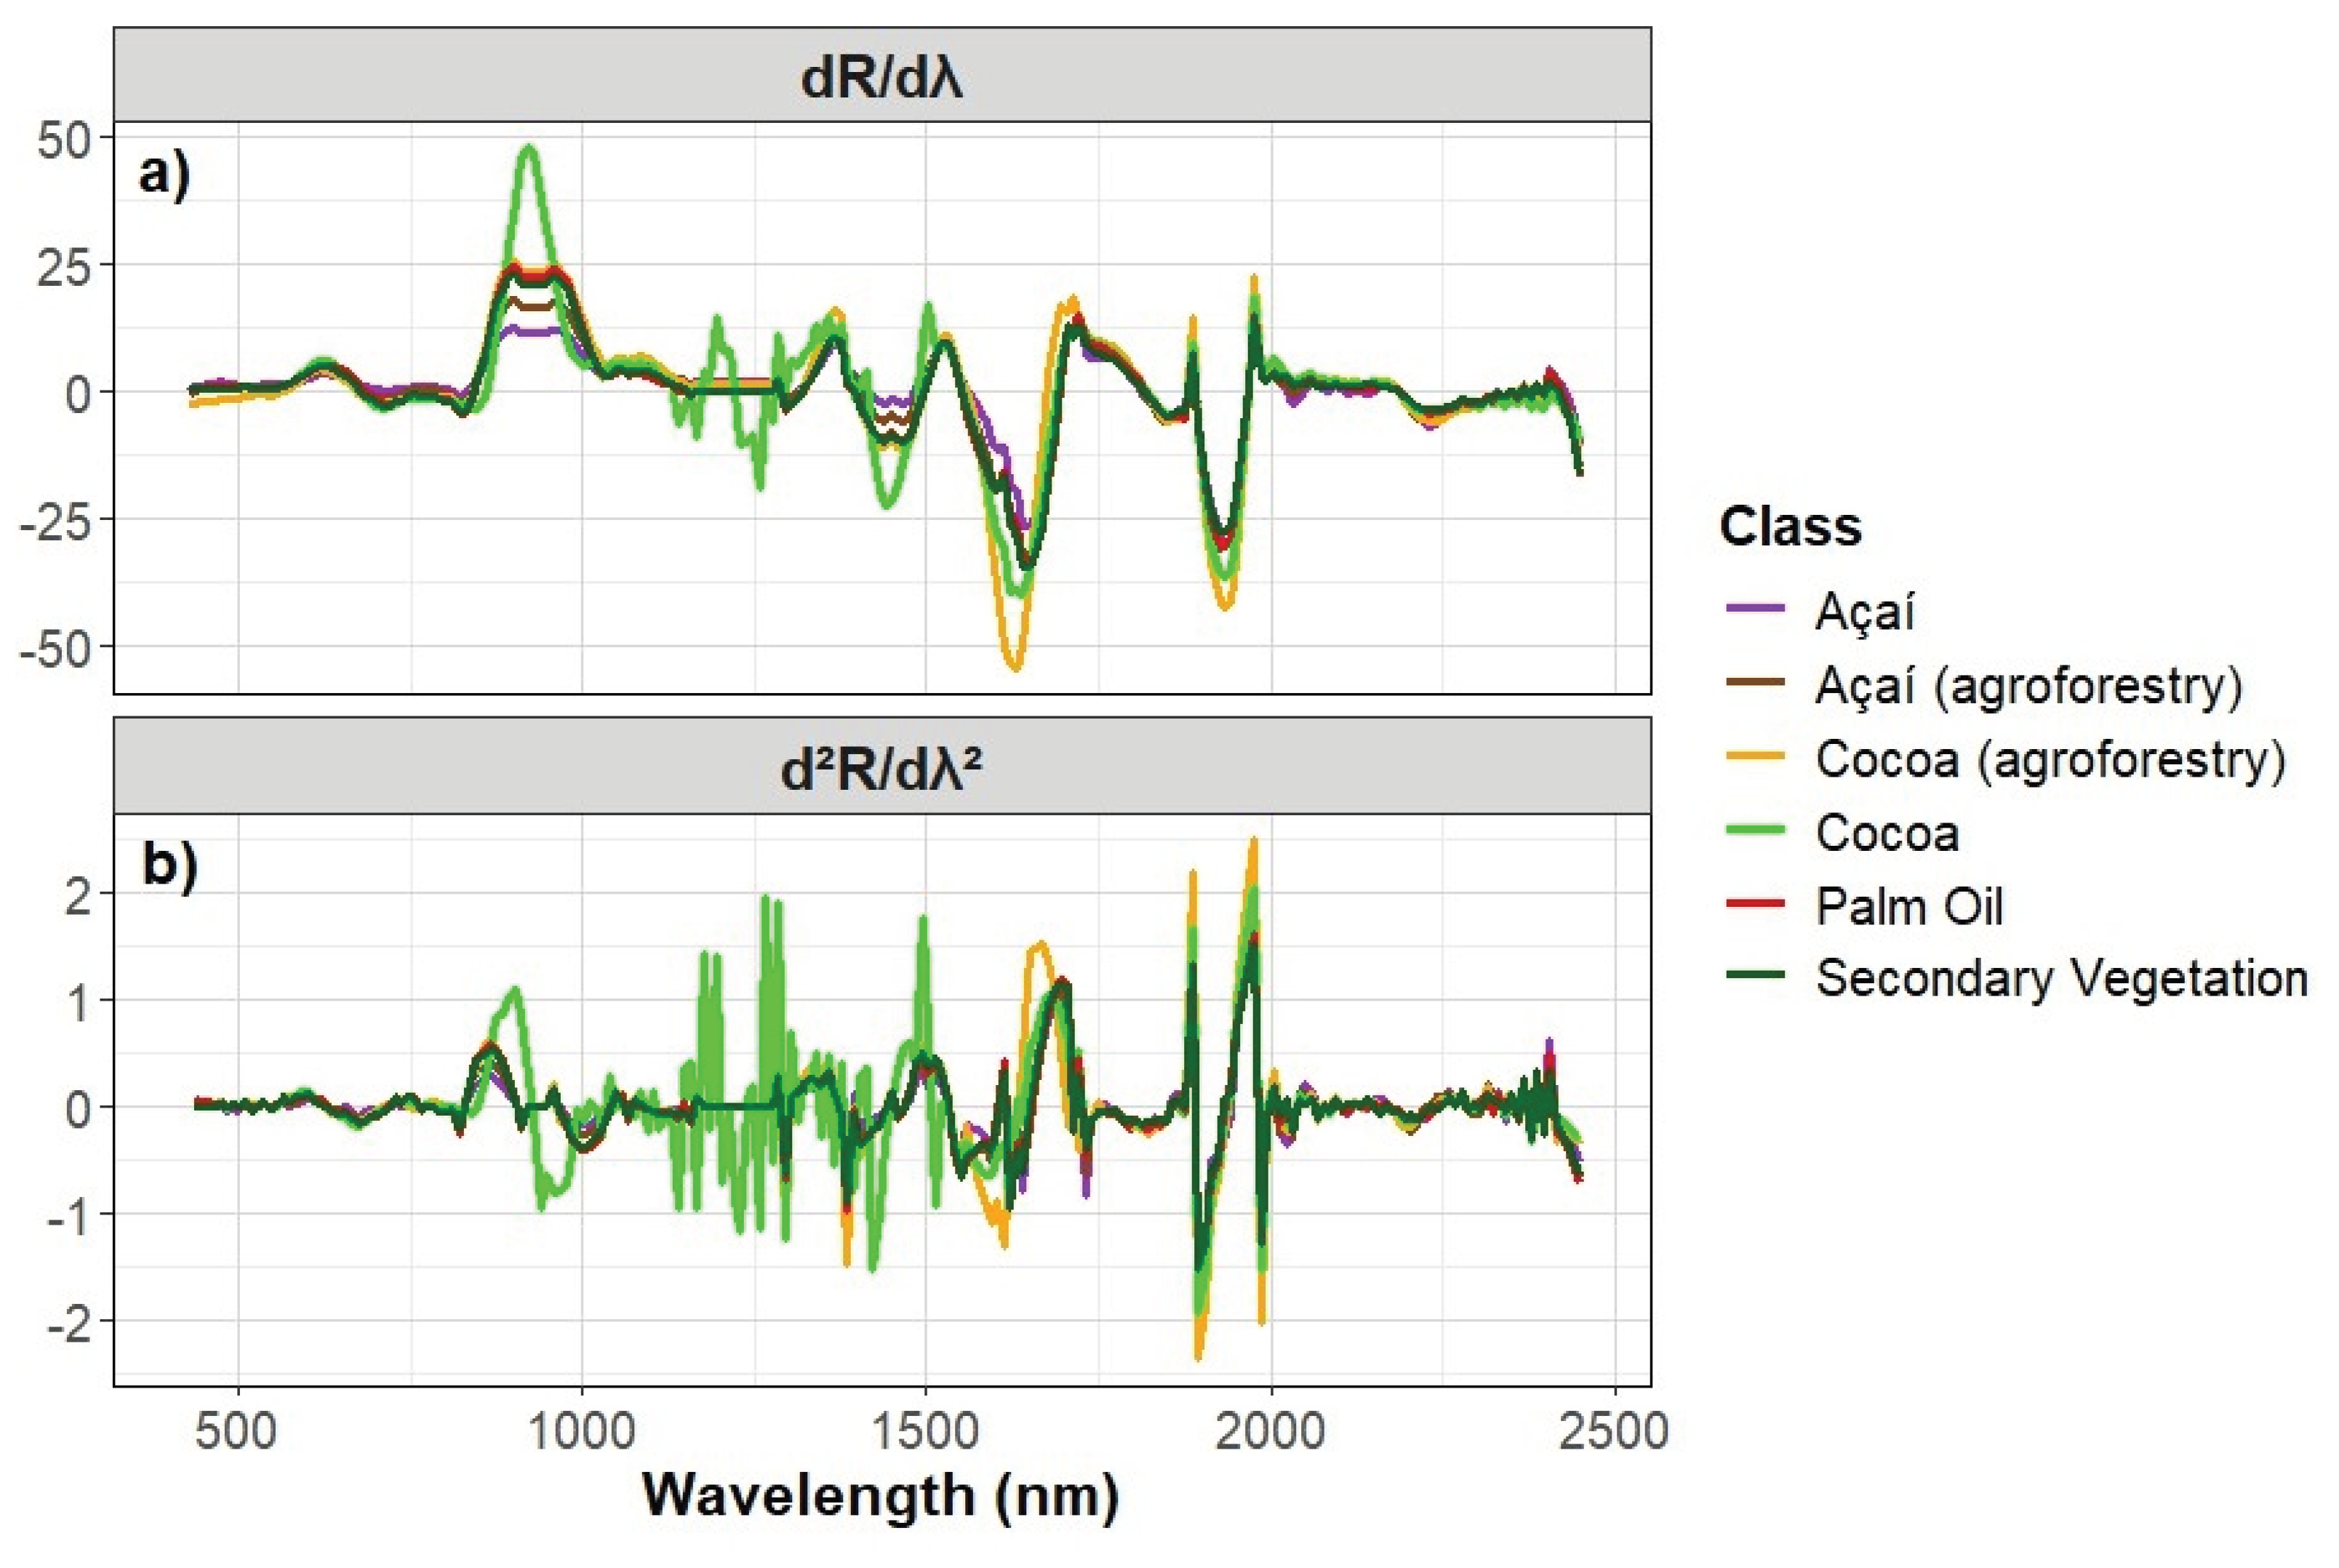
Figure 14.
Continuum removal of perennial crops and secondary vegetation.
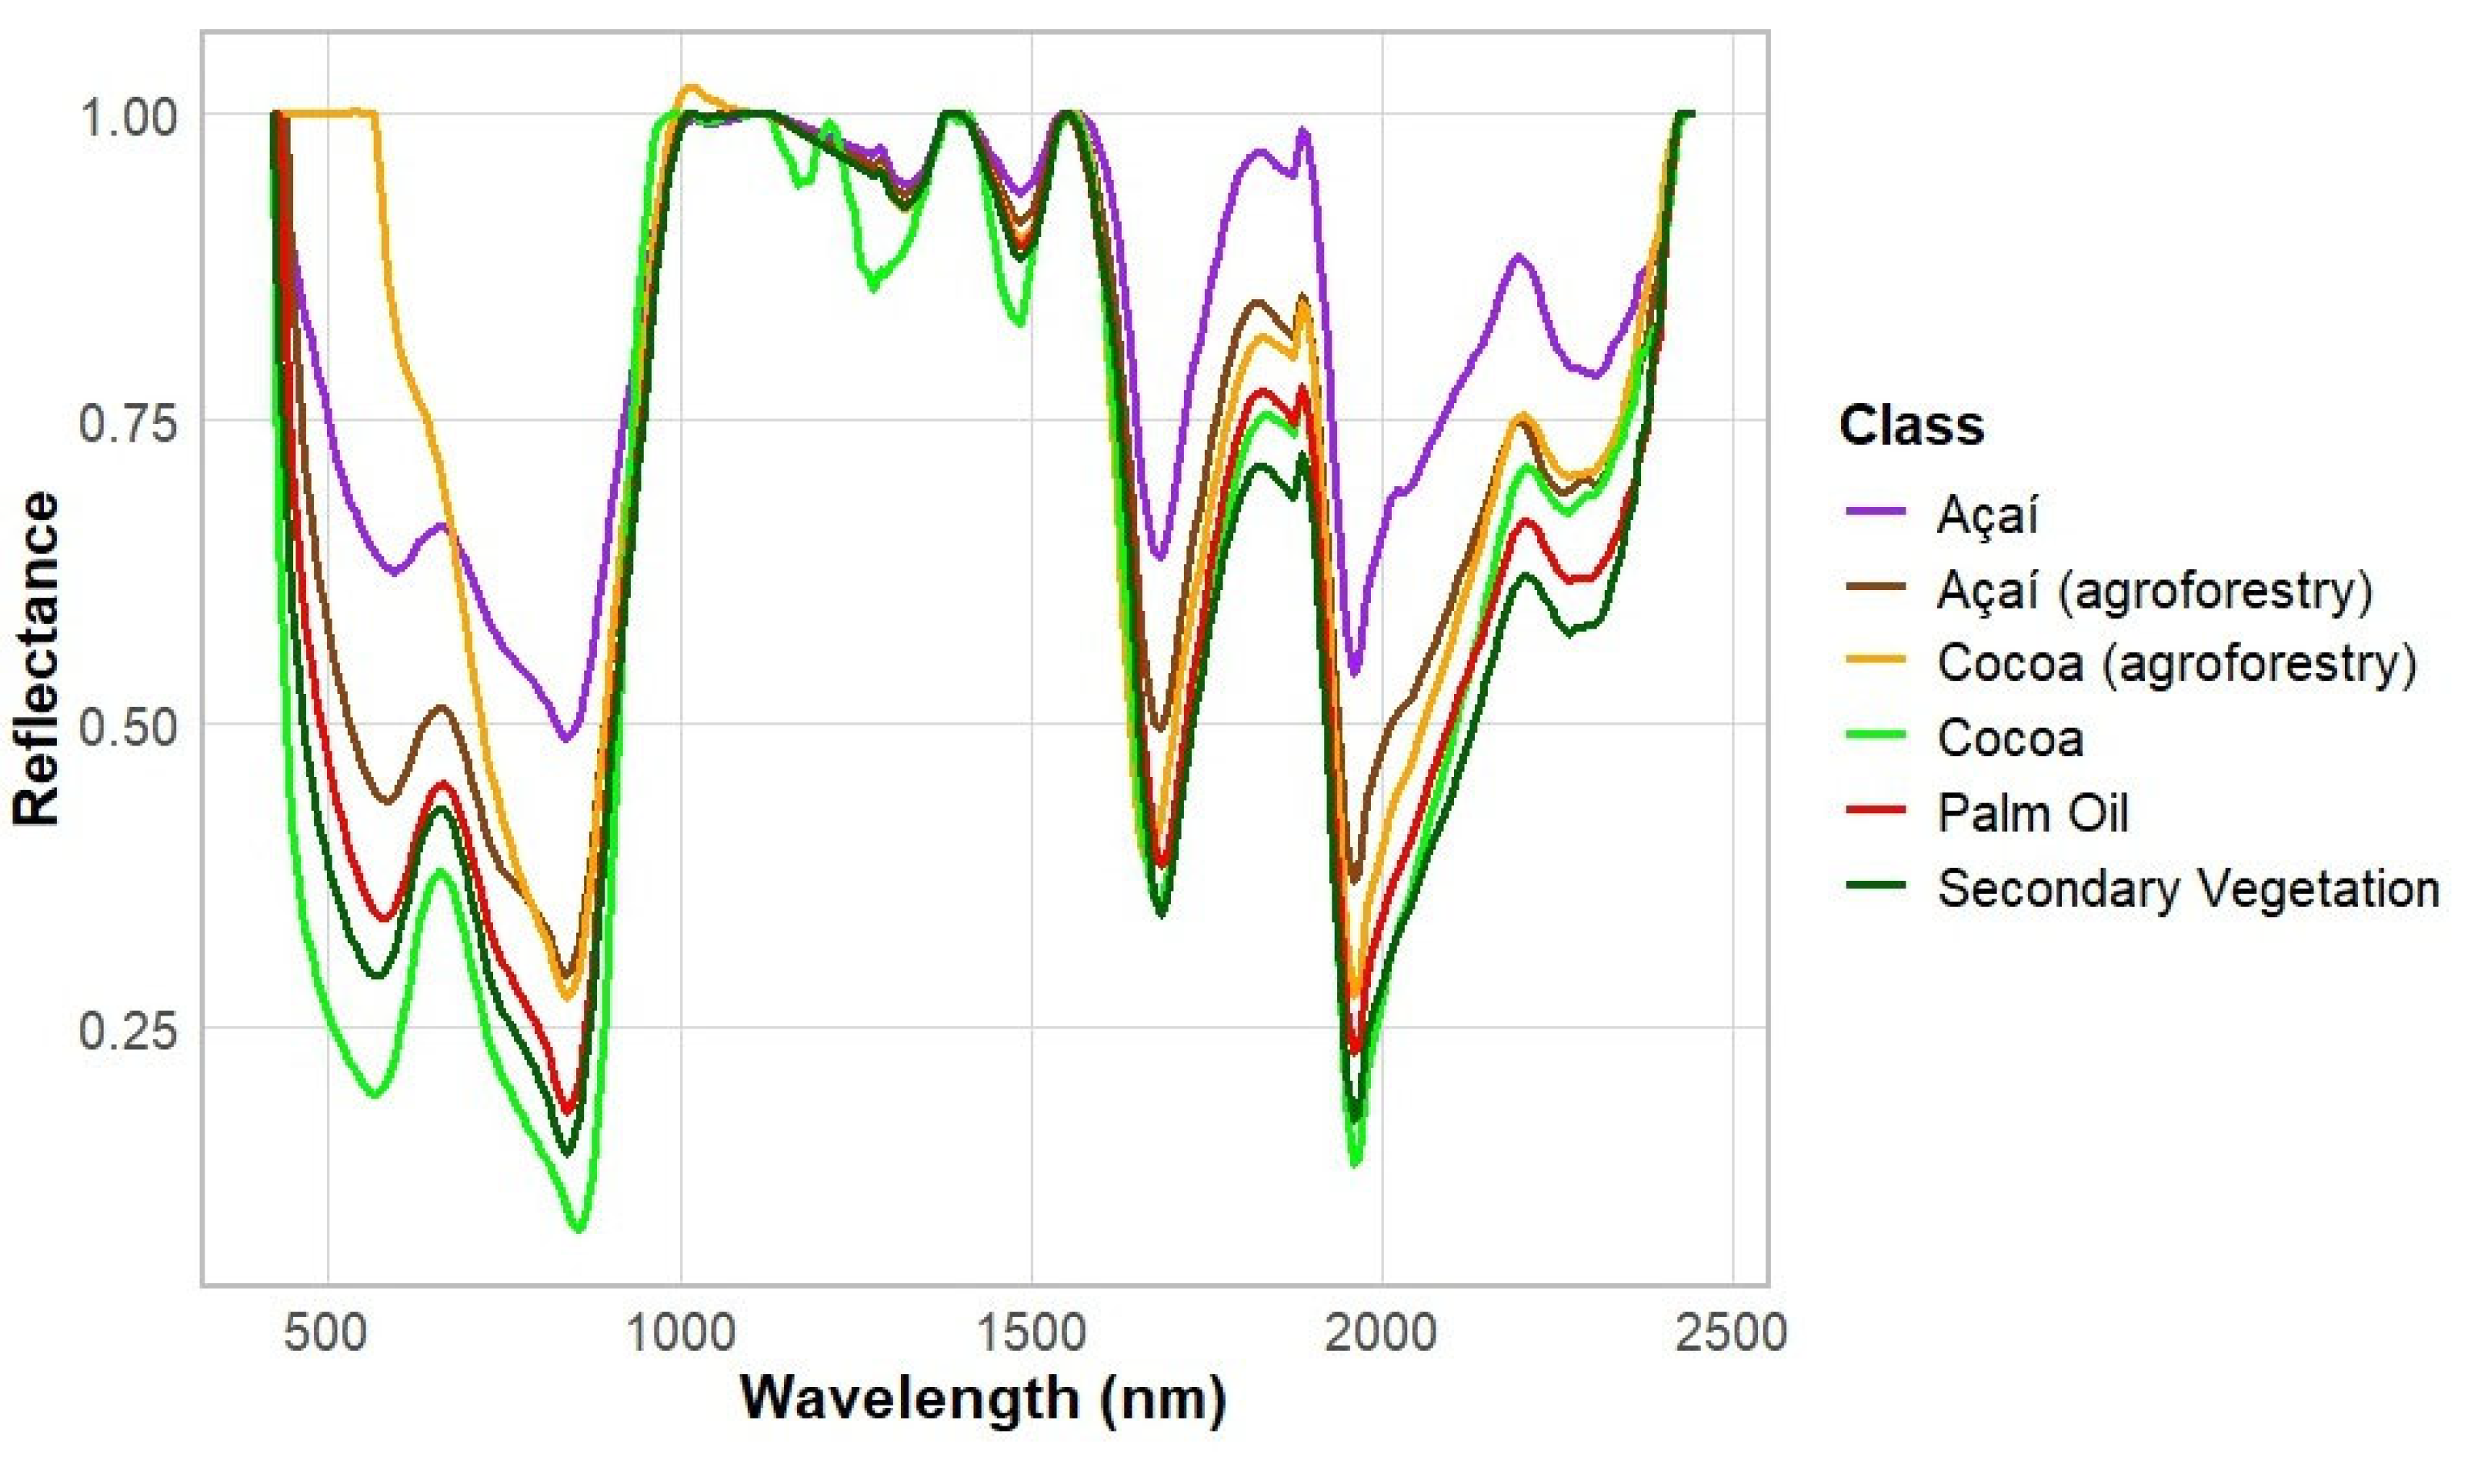

Table 1.
Interpretation key for perennial crops and secondary vegetation. Image source: MAXAR and Airbus (2024).
Table 1.
Interpretation key for perennial crops and secondary vegetation. Image source: MAXAR and Airbus (2024).
| Classes Name | High-resolution optical images | Description |
| Açaí | 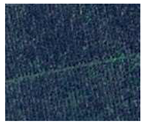 |
Located near the access roads. Regular shape and spacing with individualized tree canopies. Less rough texture and dark green color. |
| Açaí(Agroforestry) | 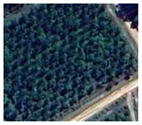 |
Located near the access roads. Regular shape and spacing with individualized tree canopies. Rough texture and dark green color. |
| Cocoa | 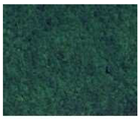 |
Located near the access roads. The shape and spacing are regular, but the tree canopies overlap. Less rough texture and green color |
| Cocoa(Agroforestry) | 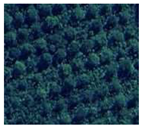 |
Located near the access roads. The shape and spacing are regular, but the tree canopies overlap with individualized forest tree canopies. Rough texture and green color. |
| Palm oil | 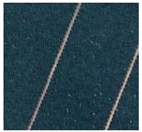 |
It has farming roads that separate the plots. The shape and spacing are regular, with individualized tree canopies. Rough texture and green color |
| Secondary Vegetation | 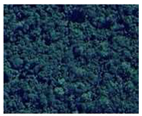 |
These are the Legal Reserve areas or the Perma-nent Preservation Areas of the properties, with tree vegetation. The shape is irregular. Highest rough texture and dark green color, which characterizes the advanced stage of secondary vegetation. |
Table 2.
Grouping results of perennial crop classes for VIS, NIR, and SWIR spectral regions.
| Band | Class | Groups |
| VIS | Cocoa(agroforestry) | a |
| VIS | Açaí | b |
| VIS | Açaí(agroforestry) | c |
| VIS | Palm oil | »c. |
| VIS | SecondaryVegetation | cd. |
| VIS | Cocoa | d. |
| NIR | Cocoa(agroforestry) | »a. |
| NIR | Cocoa | ab |
| NIR | Palm oil | ab. |
| NIR | SecondaryVegetation | »b. |
| NIR | Açaí(agroforestry) | »b |
| NIR | Açaí | »b. |
| SWIR | Cocoa(agroforestry) | »a. |
| SWIR | Açaí | »a. |
| SWIR | Açaí(agroforestry) | ab. |
| SWIR | Cocoa | bc |
| SWIR | Palm oil | bc |
| SWIR | SecondaryVegetation | c |
Disclaimer/Publisher’s Note: The statements, opinions and data contained in all publications are solely those of the individual author(s) and contributor(s) and not of MDPI and/or the editor(s). MDPI and/or the editor(s) disclaim responsibility for any injury to people or property resulting from any ideas, methods, instructions or products referred to in the content. |
© 2026 by the authors. Licensee MDPI, Basel, Switzerland. This article is an open access article distributed under the terms and conditions of the Creative Commons Attribution (CC BY) license (http://creativecommons.org/licenses/by/4.0/).
Copyright: This open access article is published under a Creative Commons CC BY 4.0 license, which permit the free download, distribution, and reuse, provided that the author and preprint are cited in any reuse.