

Submitted:
20 August 2026
Posted:
21 August 2026
You are already at the latest version
Abstract
Frequent droughts have severely undermined agricultural productivity. Using the standardized precipitation evapotranspiration index (SPEI), we identified that drought events predominantly occurred from July to September during 2000–2021 in Jianghan Plain, southern China. Over 50% of the total paddy field area experienced drought conditions in the actual rice growth periods in eight years (2001, 2003, 2006, 2009, 2011, 2018, 2019, and 2021), with the most severe and prolonged event in 2019 lasting nearly 4 months. To assess the ecological impacts, we employed solar-induced chlorophyll fluorescence (SIF) to examine the differential drought responses of three rice cropping systems: common single cropping rice (CSCR), double cropping rice (DCR), and integrated farming of rice and aquaculture animals (IFRA). The main findings are: (1) Under drought years, average SIF reductions were -3.33% for CSCR, -5.09% for DCR, and -2.17% for IFRA, indicating DCR was the most sensitive and the IFRA the least. (2) The sensitivity of rice SIF to water stress declined from the vegetative stage to the ripening stage. (3) Pre-transplanting precipitation anomalies affected the subsequent drought resilience. These findings provide insights into the mechanistic responses of rice photosynthetic capacity to water deficits and offer a framework for evaluating drought impacts on paddy ecosystems.
Keywords:
paddy rice
; drought
; solar-induced chlorophyll fluorescence
; standardized precipitation evapotranspiration index
; integrated farming of rice and aquaculture animals
; Jianghan Plain
1. Introduction
Drought is one of the most consequential climate disasters worldwide, imposing substantial losses on agricultural production [1,2]. With accelerating climate change projected to increase the frequency and severity of drought events, global food security faces mounting threats [3]. Rice serves as one of the world’s most essential food sources, feeding more than half of the global population [4]. Given the considerable water demand throughout the rice growth cycles, drought poses a particularly severe risk to rice production systems. According to Food and Agriculture Organization projections, if current greenhouse gas emission trajectories persist, global rice production could decline by 20–30% by 2100 [3].
Southern China, which contributes approximately 90% of the nation’s rice output, serves as the country’s primary rice-producing region [5]. Since 2000, this region has experienced notably reduced average precipitation compared with pre-2000 levels, accompanied by increased interannual oscillation amplitude [6]. Drought events in southern China frequently occur during July and August—the critical period of vigorous rice growth [7]. Moreover, recent studies have documented that compound drought and hot extreme events have intensified markedly across China’s rice-growing regions [8]. Scientific, accurate, and timely assessment of drought impacts on rice production is therefore critical for formulating effective drought countermeasures and safeguarding food production.
Reliable information on cropping patterns is essential for analyzing the mechanisms and impacts of climate change [9,10,11]. The Jianghan Plain, situated in Hubei Province in southern China, represents a major rice-producing area where common single-cropping rice (CSCR), double-cropping rice (DCR), and integrated farming of rice and aquaculture animals (IFRA) are co-cultivated [12]. CSCR predominantly comprises middle rice, while DCR includes both early and late rice. IFRA represents a rice–aquaculture rotation system achieved through engineering modification of paddy fields, encompassing integrated rice–crayfish (IRC), rice–loach, and rice–Trionyx Sinensis systems [13]. Since 2010, the IRC has proliferated rapidly and has become one of the predominant rice cropping patterns in the Jianghan Plain [14]. In this system, crayfish are introduced to paddy fields in spring and driven to peripheral drainage ditches during rice transplanting; once rice seedlings are established, crayfish return to the field to coexist with the rice crop. IRC has gained considerable traction owing to its superior environmental and economic sustainability compared with CSCR and DCR [15,16]. According to statistical data, the IRC area surpassed that of DCR in 2020, accounting for 98.88% of the total IFRA area and 37.89% of the total rice-sown area in the Jianghan Plain [17]. The rapid expansion of IFRA, particularly IRC, has not only transformed rice cropping systems but also profoundly altered the regional landscape and wetland ecosystem structure [18]. This highlights the need to differentiate the drought responses of IFRA from conventional CSCR and DCR.
Drought indices and vegetation indices (VIs) constitute the foundational tools for quantifying drought severity and evaluating agricultural drought impacts [19,20,21]. Among meteorological drought indices, the Standardized Precipitation Evapotranspiration Index (SPEI) is commonly employed [22,23]. SPEI expresses deviations of the current climatic water balance (precipitation minus potential evapotranspiration) relative to the long-term average and enables more accurate yield loss assessment by accounting for evapotranspiration effects [24]. Vegetation indices such as the Normalized Difference Vegetation Index (NDVI), Enhanced Vegetation Index (EVI), and Leaf Area Index (LAI) reflect vegetation growth status and enable rice yield estimation [25,26]. Remotely sensed reflectance-based VIs have been widely adopted for large-scale agricultural drought monitoring across major rice-producing areas in Asia [27]. However, several limitations warrant further investigation in existing drought–rice studies. First, VIs exhibit appreciable time lags in responding to drought stress [28]. Second, previous research has predominantly focused on drought impacts on the productivity or yield of single-cropping or double-cropping rice [19,29,30]. Given the context of climate change, it is critically important to explore drought impacts on the complex rice ecosystems, including the rapidly evolving paddy field utilization modes—IFRA, particularly as cropping system transformations in central China have enhanced both economic profitability and ecological sustainability.
The solar-induced chlorophyll fluorescence (SIF) is the energy re-excited after vegetation photosynthesis absorbs light, which can directly reflect the dynamic changes of the physiological state of plants [31]. Studies have shown that SIF can provide more unique and direct temporal and spatial information for the early warning and accurate monitoring of drought events than VIs [32,33,34]. With the development of remote sensing technology, SIF data which are continuous in time and space are available at present and have become a new means of monitoring vegetation environmental stress [35]. Satellite-based SIF data have been used to analyze the large-scale response of diverse vegetation ecosystems worldwide [36,37,38,39]. As demonstrated by Nicholls et al., assessing farming system resilience involves estimating vulnerability and response capacity to climatic threats using a set of easily evaluable indicators [40]. Following this principle, our study employs solar-induced chlorophyll fluorescence (SIF) and the standardized precipitation evapotranspiration index (SPEI) as key ecological indicators to assess the differential drought resilience of CSCR, DCR, and IFRA systems.
Based on an analysis of historical meteorological drought conditions in the Jianghan Plain, this study evaluates the responses of multiple paddy rice ecosystems to drought. The specific objectives are to detect: (1) the temporal and spatial evolution characteristics of meteorological drought occurring in the Jianghan Plain during rice cropping seasons from 2000 to 2021; (2) the differential responses of CSCR, DCR, and IFRA to the analyzed drought events based on SIF data; and (4) the stage-dependent differences in rice drought response across phenological phases. The findings of this study contribute to a mechanistic understanding of photosynthetic capacity responses of paddy rice to drought and provide a scientific basis for quantitatively evaluating drought impacts on paddy rice ecosystems in subtropical humid regions.
2. Materials and Methods
2.1. Study Area
Jianghan Plain (29°26’ ~ 31°10’ N, 111°30’ ~ 114°32’ E) is in the southern central region of China, covering a total area of approximately 2.5×10⁴ km2 (Figure 1). The Jianghan Plain is formed by the impact of the Yangtze River and its tributary, the Han River. The region is crisscrossed by rivers and dotted with lakes, with an average elevation of about 30 m. The Jianghan Plain has a subtropical monsoon climate. Based on the dataset collected in Section 2.2.2, the average annual temperature of the Plain was 17.7 ◦C and the annual average precipitation was 1139 mm from 2000 to 2021. About 70% of the annual precipitation was concentrated in April–September. The fertile and flat land in Jianghan Plain is very suitable for farming, and the paddy field is the main type of cultivated land. Rice growth requires sufficient water, but frequent droughts in the rice-growing season bring severe challenges to rice production in Jianghan Plain.
2.2. Data
2.2.1. Datasets for Rice Classification
(1) MODIS data and processing
The Moderate Resolution Imaging Spectroradiometer (MODIS) Vegetation Indices (NDVI/EVI) 16-Day L3 Global 250 m SIN Grid data (MOD13Q1) and Surface Reflectance 8-Day L3 Global 500 m SIN Grid data (MOD09A1) from 2000 to 2021 were obtained through the online Application for Extracting and Exploring Analysis Ready Samples (AρρEEARS, https://lpdaacsvc.cr.usgs.gov/appeears/) provided by the NASA Land Processes Distributed Active Archive Center (LP DAAC). The NDVI, EVI and Land Surface Water Index (LSWI) were used to classify the different rice cropping patterns. Although the 16-day avoided cloud contamination of remote sensing images to a large extent, almost all of the pixels had at least one 16-day period with a bad value, of which the quality assessment was 10 (pixel produced, but most probably cloudy), 11 (pixel not produced due to other reasons than clouds), or the NDVI/EVI was -9999. To further eliminate atmospheric noise and gain standard rice growth curves, the linear interpolation method and Savitzky-Golay (S-G) filtering algorithm were used to reconstruct the NDVI/EVI time series data [41,42].
The calculation method of LSWI was:
where ρnir and ρswir are the surface reflectance for the Near-Infrared (NIR, 841–875 nm) and Shortwave Infrared (SWIR, 1628–1652 nm) bands obtained from the MOD09A1 datasets, respectively. When the two 8-day composite data were combined into 16-day data, the higher LSWI value was taken.
(2) Ancillary Data
Field observation data (points) collected in July–August 2021 were used as ground-truth samples to verify the classification accuracy of three types of paddy fields. The Landsat images and the land-use data (LUD) were used as auxiliary data to select sample pixels and validation regions from 2000 to 2021. Landsat images with a cloud cover of less than 30% from 2000–2021 were obtained from the United States Geological Survey (USGS, https://earthexplorer.usgs.gov/).
The LUD in 2000, 2005, 2010, 2015 and 2020 were provided by the Resources and Environmental Science and Data Center, Chinese Academy of Sciences (http://www.resdc.cn). The LUD was stored in the form of a vector dataset and was constructed through the human-computer interactive interpretation method mainly based on Landsat images [43]. It includes six primary land-use types and 25 subtypes. The overall accuracy of the primary types was above 93% and the paddy field was a subtype with a user accuracy of above 90% [44,45].
The paddy rice areas derived from the LUD and the statistical yearbook were frequently used reference datasets for rice classification accuracy assessment [46]. The sown area of single early rice, middle rice (including single late rice), DCR, and IFRA in each county in Jianghan Plain from 2000 to 2020 were derived from the Hubei Rural Statistical Yearbook [17].
2.2.2. Meteorological Data and Drought Index SPEI
The datasets of monthly precipitation (PRE), potential evapotranspiration (PET) and mean air temperature (AT) at 1 km resolution in China from 1990 to 2020 were obtained from the National Earth System Science Data Center, National Science & Technology Infrastructure of China (http://www.geodata.cn). The PRE and AT datasets were downscaled based on the global 0.5° climate data released by CRU and global high-resolution climate data released by WorldClim through the Delta spatial downscaling scheme [47]. The datasets were verified by 496 independent meteorological observation points, and the verification result was credible. The PET dataset was based on the monthly mean temperature, minimum temperature and maximum temperature datasets of 1 km in China and the Hargreaves potential evapotranspiration calculation formula [48].
The SPEI was taken as the drought index and formulated based on the monthly PRE and PET datasets. The SPEI was calculated using a three-parameter Log-logistic distribution and was a standardized variable (mean zero and unit variance). The calculation method of SEPI was detailed in the study by Vicente-Serrano et al. [49]. When calculating SPEI, the total errors and observation period uncertainty are typically decreasing with the record length [50]. Therefore, the calculation period of SPEI was from 1990 to 2021 based on the available data, which was longer than the research period (2000–2021). The 1-month, 3-month, 6-month and 12-month time scales of SPEI (SPEI-1, SPEI-3, SPEI-6, and SPEI-12) were calculated. Based on the SPEI, the drought was categorized as mild drought, moderate drought, severe drought and extreme drought (Table 1) [51].
2.2.3. GOSIF Dataset
The global ’OCO-2’ SIF data set (GOSIF) (https://globalecology.unh.edu/data/GOSIF. html) used in this study was developed by Li and Xiao using a data-driven approach based on discrete OCO-2 SIF soundings, remote sensing data from the MODIS and meteorological reanalysis data [35]. Compared with the coarse-resolution SIF that was directly aggregated from OCO-2 soundings (1°), this product has a high spatial resolution (0.05°), continuous global coverage, and a relatively long record (2000–2021). The metadata’s temporal resolution includes 8 days, monthly, and annually. The scale factor and units of the metadata were 0.0001 and W m −2 μm −1 sr −1, respectively. The fill values were 32767 (water bodies) and 32766 (lands under snow/ice throughout the year).
2.3. Phenology-Based Paddy Rice Classification Methods
Phenology-based classification methods were used to map the three rice cropping types [12]. The paddy fields were flooded during the transplanting season. The low NDVI/EVI and increased LSWI can distinguish paddy fields from other vegetation cover types such as drylands, woodlands, and grasslands. The paddy fields have a high NDVI/EVI value during the vigorous growth period of rice. According to this feature, paddy fields can be easily distinguished from construction land and water areas. The fields of IFRA stored water before the rice growing season and the high LSWI and low NDVI/EVI were used to distinguish IFRA from CSCR and DCR. The IFRA and CSCR are single-cropping rice. The number of peaks of NDVI/EVI was used to distinguish DCR from CSCR and IFRA.
Multiple parameters of NDVI, EVI and LSWI in different stages of paddy fields in 2020 were screened out for rice classification [12]. The spatial comparison between MODIS-based mapping results and high spatial-resolution data showed that the overall classification accuracy (CA) in 2020 was 91.69%, and the CA of SCR, DCR, and IFRA was 91.25%, 92.00%, and 92.50%, respectively. Sample points for each year from 2000 to 2021 were selected according to the Landsat images and LUD data. The same parameters of NDVI, EVI and LSWI of 2020 were used to classify the different rice cropping types in other years from 2000 to 2021. The thresholds of the parameters of each year were based on the sample points. The correlation coefficient (R2) and Root Mean Squared Error (RMSE) were used to compare the rice area derived from MODIS data with that from reference datasets for each year.
2.4. Indicators
2.4.1. The Mean SIF and Mean SPEI During the Rice Growth Periods
The rice-growing season can be divided into four stages: the transplanting stage, the vegetative stage, the reproductive stage, and the maturity stage [52]. The transplanting stage was taken as the start of the rice-growing season (SOS). Rice grows rapidly in the vegetative stage and the NDVI/EVI of rice will reach the maximum at the reproductive stage [53]. During the ripening stage, the NDVI/EVI declines gradually with the decrease in the number of green leaves and stem moisture content [54]. The period before harvesting was taken as the end of the rice-growing season (EOS) [41]. The SOS and EOS of rice were recognized during the rice classification. More than 99% of the rice’s SOS ranged from DOY-113 to DOY-193 periods and the rice’s EOS ranged from DOY-193 to DOY-305 periods in Jianghan Plain. The mean SIF and mean SPEI during the actual rice growth periods (from SOS to EOS) were mSIF and mSPEI, respectively. The mean SPEI of 1 month, 3 months, 6 months, and 12 months before the SOS of rice was SPEI-b1, SPEI-b3, SPEI-b6, and SPEI-b12, respectively.
The spatial extent of drought is in line with the number of rice pixels with mSPEI <= -0.5 (drought pixels). For example, if less than 25% of the rice pixels are detected as drought pixels, it is a small-scale drought; if 25–50% of the pixels are detected as drought pixels, it is a local drought; if 50–75% of the pixels are detected as drought pixels, it is a big drought; and if more than 75% of the pixels are detected as drought pixels, it is an extreme drought [55].
2.4.2. The Change Rate of SIF
The change rate of SIF was used to compare the drought resistance ability of different rice types. The calculation was as follows:
where, Ri refers to the change rate of rice SIF in the year i, SIFi is the SIF in the year i, and SIFj is the SIF in the comparison year j.
2.4.3. Standardized Anomaly
The standardized PRE, PET, SIF, etc., anomalies were used to reflect the water stress signal. The calculation was as follows:
where, refers to the value of the anomaly in month of year , is the mean value in month during the study period, and is the standard deviation of in month during the study period.
2.5. Methods for Scale Consistency Harmonization and Uncertainty Mitigation
The temporal resolutions and the spatial resolutions of all datasets were resampled by 16 days and nearest to 1 km to ensure consistency. The daily data of PRE and PET were the average values weighted using the number of days in each month. The daily AT data were the same as the current month. The 8-day SIF data and daily AT data were composited to the 16-day scale by averaging, and the daily PRE and PET data were composited to the 16-day scale by summing. GCS_Krasovsky_1940 was used as the geographical coordinate system for all datasets. The DOY-1 period was 16 days from the 1st to the 15th day of the year, and so on.
To correctly analyze the response of rice with different transplanting times to drought, the mSIF and mSPEI during the actual rice growth periods (from SOS to EOS) of each pixel were calculated. To mitigate uncertainties caused by the spatial scale discrepancy between 0.05°resolution SIF datasets and 0.5 km rice field pixels, we conducted statistical analysis on the overall SIF dynamics across three rice planting patterns: CSCR, DCR and IFRA.
3. Results
3.1. The Rice Classification Result from 2000 to 2021
The MODIS-derived area of all rice has a good correlation with the rice area derived from the statistical yearbook and the rice area from LUD (Table 2). The CSCR was the main rice cropping type in Jianghan Plain from 2000 to 2021 (Figure 2). The area of DCR continued to decrease, while the area of IFRA gradually increased. By 2021, the area of DCR was very small, concentrated in the southwest of Jianghan Plain. The MODIS-derived area of IFRA accounted for 36.78% of the total rice area in 2021.
3.2. Detection of Drought During the Rice Cropping Season from 2000 to 2021
3.2.1. The Frequency, Severity and Duration of Drought During the Rice Cropping Season
Based on the multiyear monthly changes in precipitation and SPEI, drought events have occurred frequently in the Jianghan Plain from 2000 to 2021 (Figure 3a, b, Table 3). From July to September, the mean PET was greater than the mean PRE, drought was more likely to occur and the growth of middle rice and late rice may be affected by water stress (Figure 4, Table 3). There was at least one drought month (SPEI ≤ −0.5) during the rice cropping season (from April to October) of each year (Figure 5a). The number of drought months during the rice cropping season in 2005 and 2011 was the largest, both of which were 5 months. Mild drought was dominant in 2005, while moderate drought was dominant in 2011. Extreme droughts occurred during the rice cropping season in 2001, 2011 and 2019. The drought lasted the longest during the rice cropping season in 2009 and 2019, both for 4 months. Nevertheless, the SPEI results indicated that the drought condition in 2019 was substantially more severe compared with 2009.
3.2.2. Drought Stress Conditions Within the Actual Rice Growth Period
Drought frequency differed significantly between April–June and July–September (Figure 4). Accordingly, using the mSPEI over the actual rice phenological stage rather than the whole April–September farming season is essential for accurately characterizing real drought stress on rice. In line with the mSPEI, drought events that occurred within the actual rice growth periods accounted for 63.63% of all years throughout the research duration (Figure 5b). 2004, 2007, 2012, 2013 and 2015 were small-scale drought years, while 2005 was a local drought year, 2003 was a big drought year, and 2001, 2006, 2009, 2011, 2018, 2019 and 2021 were extreme drought years. More than 50% of the total paddy field area experienced drought conditions in the actual rice growth periods in 2001, 2003, 2006, 2009, 2011, 2018, 2019, and 2021. According to the spatial distribution map of the mSPEI, droughts occurred more frequently in the central and south of the Jianghan Plain in the small-scale drought years and local drought years (Figure 6).
3.3. General Analyses of the Responses of Paddy Rice SIF to Drought
The climate conditions during the actual rice growth periods were relatively normal (-0.5 < mSPEI < 0.5) in 2005, 2007, 2008, 2010, 2012, 2013, 2014, 2015, 2016 and 2017 (Figure 7a). To better show the loss of rice SIF caused by drought in recent years, the change rate of the mSIF in drought years was calculated when compared with the average value of mSIF in the normal years after 2004 (Rate-1) and the mSIF in the adjacent normal years (Rate-2) (Table 4). Except for 2006 and 2018, the mSIF in drought years was lower than the average mSIF in normal years.
Compared with the adjacent normal years, the mSIF in all drought years has decreased, with the reduction rate ranging from -9.18% (in 2019) to -0.17% (in 2006). However, the correlations between the conduction Rate-1 and Rate-2 of mSIF and the mSPEI, SPEI-b1, SPEI-b3, SPEI-b6, and SPEI-b12 in the drought years were not significant at the 90% confidence level (P-value > 0.1).
3.4. Responses of Different Rice Cropping Types to Drought
3.4.1. Overall Trend: SIF Losses Showed Significant Differences Among Different Cropping Systems
Table 5 shows the mSIF, mSPEI and the change rate of the mSIF of different rice cropping types in the drought years compared to those in adjacent years with normal precipitation. The average value of the mSIF’s change rate of CSCR, DCR and IFRA in the drought years was -3.33%, -5.09%, and -2.17%, respectively. This indicates that double-cropping rice (DCR) has the highest sensitivity to drought, while integrated rice-fish aquaculture (IFRA) exhibits the lowest sensitivity.
3.4.2. Asymmetric Relationship Between Drought Intensity and SIF Response
From the perspective of individual drought years, the magnitude of SIF loss did not show a simple linear correlation with mSPEI (Table 4). For instance, the mSPEI values ranged from −0.74 to −0.78 in 2006, representing a drought severity comparable to that in other years, yet all three cropping systems experienced relatively slight SIF losses (CSCR: −1.18%, DCR: +0.47%, IFRA: −0.68%). In contrast, the mSPEI values in 2011 were equivalent to those in 2006 (CSCR: −0.75 vs. −0.74; IFRA: −0.80 vs. −0.78), but the corresponding SIF reductions were markedly larger (CSCR: −2.40% vs. −1.18%; DCR: −6.54% vs. +0.47%; IFRA: −2.58% vs. −0.68%).
3.4.3. Outliers in Special Years and Among Different Cropping Systems
The year 2019 witnessed the most severe SIF losses across all drought years, with the changing rates of the three cropping systems reaching −9.23%, −11.28% and −7.61%, respectively, which were significantly lower than the annual average levels in other years (Table 5). This result is consistent with the characteristics of the 2019 drought: the longest duration (approximately two months) and the highest intensity (modified SPEI ranging from −1.28 to −1.48%), reflecting the severe suppression of rice photosynthetic capacity induced by extreme drought events. Notably, the DCR system suffered a SIF reduction of −11.28% in 2019, representing the maximum decline across all years and cropping systems. This phenomenon was closely associated with the high overlap between the phenological period of late rice in the double-cropping rice (DCR) system and the peak drought period.
On the other hand, anomalous positive changing rates were observed in certain individual years. The modified SIF values of the DCR system in drought years of 2006 (+0.47%) and 2009 (+1.93%) were even higher than those in adjacent normal years (Table 5). In addition, the IFRA system exhibited a positive SIF changing rate of +2.74% in 2021, the only positive value for this system throughout the study period. These outliers indicate that spatial heterogeneity (e.g., local precipitation distribution, differences in irrigation infrastructure) and pre-season climatic conditions are non-negligible crucial driving factors when evaluating drought impacts on rice.
3.5. Dynamic Processes of the Impacts of Prolonged Drought Stress on Rice Growth
The drought that occurred in 2019 was taken as an example to explore the response of rice to drought in different growth stages due to its high intensity and long duration. The dynamics and anomalies of the 16-day AT, PET, PRE, SPEI and SIF of the rice with different transplanting times in 2019 were analyzed (Figure 8 and Figure 9). The AT exhibited positive anomalies from the DOY-209 to DOY-305 periods, the PET exhibited positive anomalies from the DOY-161 to DOY-305 periods, and the PRE exhibited negative anomalies from the DOY-177 to DOY-305 periods (Figure 9). Based on SPEI, the degree of drought changed from mild to extreme from DOY-177 to DOY-209 periods and the extreme drought lasted for about two months. After DOY 273, the drought eased but continued for about a month. In the early stage of the drought, the drought in the central and western regions was heavier than that in the east. In the middle stage of the drought, the drought in the northwest regions was heavier than that in the southeast. At the end of the drought, the drought in the eastern regions was heavier than that in the west (Figure 10).
Two-thirds of the rice cropping season was in drought and the early rice, the middle rice and the late rice were all affected by drought (Figure 8e, f). The rice with transplanting time during the DOY-113 period was marked as RICE113, the SIF during the DOY-113 period was marked as SIF113, and so on. The ΔSIF was the difference between the rice SIF in 2019 and the mean rice SIF in the years with normal climate conditions (-0.5 < mSPEI < 0.5) during the rice cropping season from 2005 to 2021 (Figure 8f). The ΔSIF of RICE113 from the DOY-129 to DOY-161 periods was greater than 0, indicating that RICE113 was growing well before the drought. The ΔSIF of all rice dropped sharply in the DOY-177 period and rose briefly in the DOY-193 period. However, with the continuous increase in AT and PET and decrease of PRE, the drought became more serious and the ΔSIF decreased again from the DOY-209 to DOY-225 periods (Figure 8). The AT and PET decreased and the ΔSIF of all rice increased during the DOY-241 period. But during the DOY-257 period, the PRE was still very low, and the ΔSIF of all rice decreased again. With the increase of PRE and the decrease of AT and PET, the SPEI and the ΔSIF of all rice increased during the DOY-273 period. The ΔSIF of rice with transplanting time after the DOY-113 period was close to 0 from the DOY-289 to DOY-305 periods.
4. Discussion
4.1. Effects of Pre-Transplanting Precipitation on Rice Drought Response
Our analysis did not reveal a significant correlation between the annual regional mean mSPEI and the reduction rate of mSIF for rice (Table 4), suggesting that rice growth is modulated by a complex interplay of factors beyond meteorological conditions, including irrigation practices, cultivar characteristics, soil properties, and agronomic management. SIF serves as a direct physiological proxy for plant photosynthetic capacity, while the SPEI is merely a meteorological drought metric. The integrated application of these two indicators focuses on drought early warning instead of establishing linear statistical relationships. Nevertheless, by examining the antecedent SPEI (i.e., the 1-, 3-, 6-, and 12-month SPEI before transplanting) in conjunction with mSIF during drought years, several important patterns emerge:
(1) Normal pre-transplanting precipitation favors drought resilience. In 2006 and 2018, all antecedent SPEI values remained within the normal range (-0.5 to 0.5). Notably, the mSIF in 2006 was higher than in other drought years with moderate water deficit (-1 < mSPEI ≤ -0.5, i.e., 2003, 2009, 2011, and 2021). Similarly, among years with severe drought (-1.5 < mSPEI ≤ -1), the mSIF in 2018 was the highest. These findings imply that adequate soil moisture prior to transplanting may enhance the initial vigor of rice seedlings, thereby mitigating the adverse effects of subsequent in-season drought.
(2) Excessive pre-transplanting precipitation does not confer protective effects. In 2003, 2009, and 2021, all antecedent SPEI values exceeded 1.0 (indicating anomalously wet conditions before transplanting). Paradoxically, the mSIF during the rice growing seasons in these years was lower than that observed in 2006 and 2018. This counter-intuitive result may be attributed to water-logging stress or nutrient leaching during the early vegetative stage, which could weaken rice plants and render them more susceptible to later-season drought.
(3) Insufficient pre-transplanting precipitation exacerbates drought impacts. In 2011, the mSPEI during the growing season was comparable to that in 2006, yet the mSIF was markedly lower. This discrepancy is likely explained by the pronounced precipitation deficits preceding transplanting in 2011 (Figure 3a; Table 4), which may have compromised seedling establishment and root development, thereby reducing the crop’s capacity to tolerate subsequent water stress.
Furthermore, the consecutive drought events in 2018 and 2019 resulted in a greater SIF loss in 2019, underscoring the cumulative and carry-over effects of antecedent water deficits. These observations collectively suggest that proactive water management—either drainage or supplementary irrigation—prior to transplanting, particularly under anomalous precipitation conditions, is crucial for buffering rice against in-season drought stress.
4.2. Stage-Dependent Sensitivity of Rice Photosynthesis to Drought
The temporal evolution of ΔSIF during the 2019 drought generally followed SPEI, except during DOY-193 (Figure 8d, f), where ΔSIF increased despite declining SPEI, likely reflecting irrigation interventions enabled by abundant surface water. As precipitation decreased and water sources depleted, ΔSIF declined again from DOY-209 to DOY-225.
During the early drought phase (DOY-177), SIF had not yet peaked (Figure 8e), indicating that most rice was at the vegetative stage. Under comparable SPEI, ΔSIF ranked as RICE113 > RICE129 > RICE145 > RICE161 (Figure 8f), suggesting higher water sensitivity in early-planted rice. This is attributed to smaller plant stature and lower canopy shading, leading to higher evaporative demand under high summer temperatures (Ji et al., 2007).
From DOY-209 to DOY-289, ΔSIF differences among transplanting cohorts narrowed as rice progressed from the reproductive to the maturity stages (Figure 8f). This reflects senescing green leaves, declining transpiration, and stomatal damage under prolonged stress, which reduces daily water demand and drought sensitivity (Ji et al., 2007). Overall, rice SIF sensitivity to drought declines from the vegetative to the ripening stage, identifying a critical phenological window for targeted irrigation.
4.3. Differential Drought Sensitivity Across Rice Cropping Systems
In most drought years, negative precipitation anomalies were concentrated from July to September (Figure 4; Table 3), a period that coincides with the reproductive-to-maturity stage for middle rice and the entire growing cycle for late rice. Given that SIF is more sensitive to drought at the vegetative stage, the SIF of middle rice—which had already passed its most sensitive phase by the time drought peaked—was less affected than that of late rice, which experienced drought during its early and mid-growth stages (Figure 8f). Consequently, the DCR system, which includes both early and late rice, exhibited a greater average SIF reduction rate than CSCR (dominated by middle rice) across drought years. In 2003 and 2021, despite mSPEI values above -0.5 (indicating only mild drought), DCR still showed substantial SIF reductions compared with adjacent normal years. This can be attributed to the specific precipitation anomalies in those years: excessive rainfall from April to June (pre-transplanting) followed by deficits from July to September likely amplified the vulnerability of the double-cropping system.
Interestingly, the IFRA system consistently showed lower average SIF reduction rates than CSCR across drought years (Table 5). Two complementary explanations can be advanced. First, IFRA is predominantly distributed in the central and southern parts of the Jianghan Plain (Figure 1 and Figure 2), where surface water resources are comparatively more abundant, facilitating access to irrigation. Second, the rice–crayfish symbiosis requires that paddy fields maintain a minimum water level to ensure crayfish survival, effectively enforcing a “baseline” irrigation regime that coincidentally provides buffering capacity against drought for the rice crop. This water management constraint may confer an unintended but tangible drought resistance benefit. Nevertheless, the mechanistic links between specific water management practices (e.g., flood depth, drainage frequency) and the differential SIF sensitivity across systems warrant further investigation through controlled field experiments.
4.4. Applicability and Limitations
This study integrates remote sensing-based rice classification, phenological identification, SPEI-based drought characterization, and SIF-based photosynthetic assessment. This framework is spatially and temporally continuous and transferable to other rice-growing regions in southern China with available MODIS and climate datasets.
However, several limitations should be acknowledged. First, the 0.05° SIF product is suitable for the large, contiguous paddy fields of the Jianghan Plain, but may be inadequate for fragmented or smallholder-dominated landscapes. Second, our analysis relied solely on SPEI, which does not directly reflect soil moisture dynamics. Under extreme or prolonged drought, incorporating soil moisture indices would improve assessment accuracy (Ji et al., 2007). Third, we did not account for groundwater depth, irrigation infrastructure, or farmer decision-making, all of which may influence drought responses.
4.5. Implications for Drought Risk Management in the Jianghan Plain
Given the increasing frequency of drought during the rice cropping season (Figure 5a), coupled with the ongoing expansion of water diversion projects (e.g., the Middle Route of the South-to-North Water Transfer, the Han-to-Wei River Diversion, and the Northern Hubei Water Allocation Project), the amount of water available from the Han River to the downstream Jianghan Plain is projected to decline (Zhen et al., 2019). This reduction is particularly concerning because the irrigation quota for IRC is approximately three times that of CSCR, and the IRC area has expanded dramatically in recent years (Lu et al., 2019). Therefore, water scarcity is likely to become a binding constraint for both rice production and regional economic development under future climate scenarios.
To mitigate these risks, we recommend a multi-pronged strategy:
Enhance monitoring and early warning systems for drought, integrating satellite-based SIF and SPEI into real-time decision support tools.
Promote the adoption of drought-resistant rice varieties and, where feasible, consider dryland crop alternatives to diversify and stabilize agricultural production.
Implement spatially targeted regulations on IRC expansion, restricting it to areas with assured water supply while discouraging development in water-scarce zones.
These measures, tailored to the region’s hydrometeorological and agroecological conditions, will be essential to sustain rice production and safeguard food security in the Jianghan Plain.
5. Conclusions
This study assessed the responses of diverse rice cropping systems to meteorological drought in the Jianghan Plain from 2000 to 2021 using SPEI and satellite-derived SIF. The main findings are:
Meteorological droughts occurred frequently during the rice growing seasons. The years with drought occurring during the rice growing season accounted for 63.63% of the entire study period. More than 50% of the total paddy field area experienced drought conditions in actual rice growth periods in 2001, 2003, 2006, 2009, 2011, 2018, 2019, and 2021. The frequent occurrence of drought, especially extreme drought, poses great threats to the photosynthetic activity of rice across different cropping systems.
(2) Pre-transplanting precipitation anomalies substantially modulate subsequent drought resilience. Normal antecedent moisture supports vigorous crop establishment, whereas both excessive and deficient precipitation can exacerbate SIF losses during drought. No significant correlation was found between the annual regional mean SPEI and the SIF reduction rate (P > 0.1), indicating that rice growth is influenced by both climatic and non-climatic factors.
(3) In the analysis based on SIF loss, DCR was the most sensitive to drought stress, followed by CSCR, with IFRA ranking the least sensitive among the three systems. Furthermore, Rice SIF sensitivity to drought declines from the vegetative stage to maturity.
From a policy perspective, these findings contribute to the monitoring and achievement of SDG 6 (Clean Water and Sanitation), SDG 12 (Responsible Consumption and Production), and SDG 13 (Climate Action). Specifically, the stage-dependent sensitivity of rice SIF to drought provides quantitative evidence for designing adaptive irrigation strategies, while the differential drought resilience across cropping systems informs spatially targeted regulations on water-intensive practices such as IFRA expansion in water-scarce areas.
Author Contributions
Conceptualization, Qihui Shao and Hong Chi; methodology, Qihui Shao and Hong Chi; validation, Qihui Shao, Rui Chen and Mengting Chen; formal analysis, Qihui Shao and Hong Chi; investigation, Qihui Shao, Weiting Li and Yujing Yang; data curation, Qihui Shao, Weiting Li and Yujing Yang; writing—original draft preparation, Qihui Shao and Hong Chi; writing—review and editing, Qihui Shao, Rui Chen, Mengting Chen, Yulian Pan and Lingjie Xu; supervision, Qihui Shao and Hong Chi; project administration, Qihui Shao and Hong Chi. All authors have read and agreed to the published version of the manuscript..
Funding
This research was funded by the 2023 Young Talents Project of the Scientific Research Program of the Department of Education of Hubei Province, grant number Q20232706 and the 2023 Open Project of the Hubei Research Center for Small Town Development, grant number 2023A005.
Data Availability Statement
The data of this work can be shared with the readers depending on the request.
Acknowledgments
We thank the climate data support from the “National Earth System Science Data Center, National Science & Technology Infrastructure of China” (http://www.geodata.cn), the MODIS data support from “National Aeronautics and Space Administration of the United States” and the SIF data support from Drs. Jingfeng Xiao and Xing Li.
Conflicts of Interest
The authors declare no conflict of interest.
Abbreviations
The following abbreviations are used in this manuscript:
| CDHEE | Compound drought and hot extreme events |
| MODIS | Moderate Resolution Imaging Spectroradiometer |
| CSCR | Common single-cropping rice |
| IFRA | Integrated farming of rice and aquaculture animals |
| LSWI | Land Surface Water Index |
| NDVI | Normalized Difference Vegetation Index |
| RMSE | Root Mean Squared Error |
| SPEI | Standardized precipitation evapotranspiration index |
| DCR | Double-cropping rice |
| DOY | Day of year |
| EOS | The end of the rice-growing season |
| EVI | Enhanced Vegetation Index |
| IRC | Integrated rice–crayfish |
| LAI | Leaf Area Index |
| LUD | Landsat images and land-use data |
| PET | potential evapotranspiration |
| PRE | precipitation |
| SIF | Solar-induced chlorophyll fluorescence |
| SOS | The start of the rice-growing season |
| SPI | Standardized Precipitation Index |
| AT | air temperature |
| CA | classification accuracy |
| VI | vegetation index |
References
- Pokhrel, Y., Felfelani, F., Satoh, Y., Boulange, J., Burek, P., G¨adeke, A., Gerten, D., Gosling, S.N., Grillakis, M., Gudmundsson, L., Hanasaki, N., Kim, H., Koutroulis, A., Liu, J., Papadimitriou, L., Schewe, J., Müller Schmied, H., Stacke, T., Telteu, C.-E., Thiery, W., Veldkamp, T., Zhao, F., Wada, Y. Global terrestrial water storage and drought severity under climate change. Nat. Clim. Change 2021, 11, 226–233https:// doi.org/. [CrossRef]
- Wen, Q.Z.; Tu, X.J.; Lin, K. Mutual-information of meteorological-soil and spatial propagation: Agricultural drought assessment based on network science. Ecological Indicators 2025, 170, 113004. [CrossRef]
- Jeena, A.S.; Chaudhary, D.; Soe, W.; Rohit, R. Millets for food and nutritional security in global climate change scenario; 2021.
- IPPC. Half of the world eats rice. Are you one of them? Available online: https://www.ippc.int/en/resources/top-crops-why-protecting-them-from-plant-pests-matter/rice-oryza-sativa/ (accessed on 07/13).
- Wang, Y.; Zhang, J.P.; Li, G.C. Rice drought damage assessment using AMSR-E data inversion of surface temperature. Computational Intelligence and Neuroscience 2022, 2022. [CrossRef]
- Zhang, Q.; Yao, Y.B.; Wang, Y.; Wang, S.P.; Wang, J.S.; Yang, J.H.; Wang, J.; Li, Y.P.; Shang, J.L.; Li, W.J. Risk characteristics and control technology measures of drought disaster in Southern China. Acta Ecologica Sinica 2017, 37, 7206-7218. [CrossRef]
- Zhang, X.P.; Li, R.F.; Lei, S.; Fu, Q.; Wang, X.X. The study of dynamic monitor of rice drought in Jiangxi Province with remote sensing. In Proceedings of the 3rd International Conference on Environmental Science and Information Application Technology (ESIAT), Xian, China, 2011/08/20, 2011.
- Yu, R.; Dong, S.; Han, Z.; Li, W. Increased exposure of rice to compound drought and hot extreme events during its growing seasons in China. Ecological Indicators 2024, 167, 112735. [CrossRef]
- Li, S.C.; Liu, Y.T.; Li, J.R.; Zhang, X.Z. Mapping cropping patterns in the North China Plain over the past 300 years and an analysis of the drivers of change. Journal of Geographical Sciences 2024, 34, 2074-2088. [CrossRef]
- Wei, J.; Zhang, Z.L.; Liu, B.; Cui, Y.L.; Luo, Y.F.; She, Y.J. Spatiotemporal dynamics and environmental drivers of paddy rice cropping patterns in China: Essential indicators for agricultural sustainability. Ecological Indicators 2025, 178, 114068. [CrossRef]
- Li, D.; Duo, L.; Bao, C.; Zhang, X.; Zou, Z. Spatiotemporal Distribution and Fragmentation Driving Mechanism in Paddy Fields and Dryland of Urban Agglomeration in the Middle Reaches of the Yangtze River. Land 2024, 13, 58. [CrossRef]
- Shao, Q.; Li, R.; Qiu, J.; Han, Y.; Han, D.; Chen, M.; Chi, H. Large-Scale Mapping of New Mixed Rice Cropping Patterns in Southern China with Phenology-Based Algorithm and MODIS Dataset. Paddy Water Environ 2023, 21, 243-261. [CrossRef]
- Mara. Technical specification for integrated farming of rice and aquaculture animal: General rules (SC/T 1135.1-2017). China Fisheries 2018, 81-83.
- Xia, T.; Ji, W.; Li, W.; Zhang, C.; Wu, W. Phenology-based decision tree classification of rice-crayfish fields from Sentinel-2 imagery in Qianjiang, China. International Journal of Remote Sensing 2021, 42, 8124-8144. [CrossRef]
- Yuan, P.L.; Wang, J.P.; Guo, C.; Guo, Z.Y.; Guo, Y.; Cao, C.G. Sustainability of the rice-crayfish farming model in waterlogged land: A case study in Qianjiang County, Hubei Province, China. Journal of Integrative Agriculture 2022, 21, 1203-1214. [CrossRef]
- Zhou, Y.; Yan, X.Y.; Gong, S.L.; Li, C.W.; Zhu, R.; Zhu, B.; Liu, Z.Y.; Wang, X.L.; Cao, P. Changes in paddy cropping system enhanced economic profit and ecological sustainability in central China. Journal of Integrative Agriculture 2022, 21, 566-577. [CrossRef]
- Hrsy. Hubei Rural Statistical Yearbook; China Statistics Press: Beijing, 2000-2021.
- Han, Y.; Chi, H.; Huang, J.; Shi, X.; Qiu, J.; Shao, Q.; Li, Y.; Cheng, C.; Ling, F. Long-term wetland mapping at 10 m resolution using super-resolution and hierarchical classification – a case study in Jianghan Plain, China. International Journal of Digital Earth 2025, 18. [CrossRef]
- Fu, X.; Zhao, G.N.; Wu, W.C.; Xu, B.; Li, J.; Zhou, X.T.; Ke, X.X.; Li, Y.; Li, W.J.; Zhou, C.M.; et al. Assessing the impacts of natural disasters on rice production in Jiangxi, China. International Journal of Remote Sensing 2022, 43, 1919-1941. [CrossRef]
- Hussain, A.; Jadoon, K.Z.; Rahman, K.U.; Shang, S.H.; Shahid, M.; Ejaz, N.; Khan, H. Analyzing the impact of drought on agriculture: evidence from Pakistan using standardized precipitation evapotranspiration index. Natural Hazards 2022. [CrossRef]
- Stamou, A.; Bakousi, A.; Dosiou, A.; Tsifodimou, Z.-E.; Karachaliou, E.; Tavantzis, I.; Stylianidis, E. Mapping Drought Incidents in the Mediterranean Region with Remote Sensing: A Step Toward Climate Adaptation. Land 2025, 14, 1564. [CrossRef]
- Prabnakorn, S.; Maskey, S.; Suryadi, F.X.; de Fraiture, C. Rice yield in response to climate trends and drought index in the Mun River Basin, Thailand. Science of the Total Environment 2018, 621, 108-119. [CrossRef]
- Nie, T.; Liu, X.; Chen, P.; Jiang, L.; Sun, Z.; Yin, S.; Wang, T.; Li, T.; Du, C. Characterizing Droughts During the Rice Growth Period in Northeast China Based on Daily SPEI Under Climate Change. Plants 2025, 14, 30. [CrossRef]
- Chen, T.; Xia, G.; Liu, T.; Chen, W.; Chi, D. Assessment of Drought Impact on Main Cereal Crops Using a Standardized Precipitation Evapotranspiration Index in Liaoning Province, China. Sustainability 2016, 8. [CrossRef]
- Xiao, X.; Boles, S.; Liu, J.; Zhuang, D.; Frolking, S.; Li, C.; Salas, W.; Moore, B. Mapping paddy rice agriculture in southern China using multi-temporal MODIS images. Remote Sensing of Environment 2005, 95, 480-492. [CrossRef]
- Son, N.T.; Chen, C.F.; Chen, C.R.; Minh, V.Q.; Trung, N.H. A comparative analysis of multitemporal MODIS EVI and NDVI data for large-scale rice yield estimation. Agricultural and Forest Meteorology 2014, 197, 52-64. [CrossRef]
- Raksapatcharawong, M.; Veerakachen, W.; Homma, K.; Maki, M.; Oki, K. Satellite-Based Drought Impact Assessment on Rice Yield in Thailand with SIMRIW-RS. Remote Sens. 2020, 12. [CrossRef]
- Sun, Y.; Frankenberg, C.; Wood, J.D.; Schimel, D.S.; Jung, M.; Guanter, L.; Drewry, D.T.; Verma, M.; Porcar-Castell, A.; Griffis, T.J.; et al. OCO-2 advances photosynthesis observation from space via solar-induced chlorophyll fluorescence. Science 2017, 358. [CrossRef]
- Kumar, S.; Sarthi, P.P.; Barat, A.; Sinha, A.K. Variability in meteorological droughts as pivotal mechanism for rice production over the middle gangetic plains. Paddy and Water Environment 2022, 20, 499-516. [CrossRef]
- Mokhtar, A.; He, H.M.; Alsafadi, K.; Mohammed, S.; Ayantobo, O.O.; Elbeltagi, A.; Abdelwahab, O.M.M.; Zhao, H.F.; Quan, Y.; Abdo, H.G.; et al. Assessment of the effects of spatiotemporal characteristics of drought on crop yields in southwest China. International Journal of Climatology 2022, 42, 3056-3075. [CrossRef]
- Jonard, F.; De Canniere, S.; Brüggemann, N.; Gentine, P.; Short Gianotti, D.; Lobet, G.; Miralles, D.; Montzka, C.; Pagán, B.; Rascher, U.; et al. Value of sun-induced chlorophyll fluorescence for quantifying hydrological states and fluxes: Current status and challenges. Agricultural and Forest Meteorology 2020, 291, 108088. [CrossRef]
- Hao, D.; Asrar, G.; Zeng, Y.; Yang, X.; Li, X.; Xiao, J.; Guan, K.; Wen, J.; Xiao, Q.; Berry, J.; et al. Potential of hotspot solar-induced chlorophyll fluorescence for better tracking terrestrial photosynthesis. Global Change Biology 2021, 27. [CrossRef]
- Helm, L.; Shi, H.; Lerdau, M.; Yang, X. Solar-induced chlorophyll fluorescence and short-term photosynthetic response to drought. Ecological Applications 2020, 30. [CrossRef]
- Liu, Q.; Zhang, F.; Zhao, X. The superiority of solar-induced chlorophyll fluorescence sensitivity over other vegetation indices to drought. Journal of Arid Environments 2022, 204, 104787. [CrossRef]
- Li, X.; Xiao, J. A global, 0.05-degree product of solar-induced chlorophyll fluorescence derived from OCO-2, MODIS, and reanalysis data. Remote Sens. 2019, 11, 517. [CrossRef]
- Castro, A.O.; Chen, J.; Zang, C.S.; Shekhar, A.; Jimenez, J.C.; Bhattacharjee, S.; Kindu, M.; Morales, V.H.; Rammig, A. OCO-2 solar-Induced chlorophyll fluorescence variability across ecoregions of the Amazon Basin and the extreme drought effects of El Nino (2015-2016). Remote Sens. 2020, 12. [CrossRef]
- Tian, F.; Wu, J.J.; Liu, L.Z.; Leng, S.; Yang, J.H.; Zhao, W.H.; Shen, Q. Exceptional drought across southeastern Australia caused by extreme lack of precipitation and its impacts on NDVI and SIF in 2018. Remote Sens. 2020, 12. [CrossRef]
- Wang, X.Y.; Pan, S.F.; Pan, N.Q.; Pan, P.P. Grassland productivity response to droughts in northern China monitored by satellite-based solar-induced chlorophyll fluorescence. Science of the Total Environment 2022, 830. [CrossRef]
- Bontempo, E.; Dalagnol, R.; Ponzoni, F.; Valeriano, D. Adjustments to SIF aid the interpretation of drought responses at the Caatinga of northeast Brazil. Remote Sens. 2020, 12. [CrossRef]
- Nicholls, C.I.; Salazar-Rojas, Á.; Vázquez, L.; Montalba, R.; Machado, M.; Gazzano, I.; Henao, A.; Altieri, M.A. Methodological Approaches to Assess the Resilience of Farming Systems to Climate Change: Examples from Latin America. Land 2026, 15, 172. [CrossRef]
- Zhang, G.; Xiao, X.; Dong, J.; Kou, W.; Jin, C.; Qin, Y.; Zhou, Y.; Wang, J.; Menarguez, M.A.; Biradar, C. Mapping paddy rice planting areas through time series analysis of MODIS land surface temperature and vegetation index data. ISPRS-J. Photogramm. Remote Sens. 2015, 106, 157-171. [CrossRef]
- Chen, J.; Jönsson, P.; Tamura, M.; Gu, Z.; Matsushita, B.; Eklundh, L. A simple method for reconstructing a high-quality NDVI time-series data set based on the Savitzky–Golay filter. Remote Sensing of Environment 2004, 91, 332-344. [CrossRef]
- Kuang, W.H.; Zhang, S.W.; Du, G.M.; Yan, C.Z.; Wu, S.X.; Li, R.D.; Lu, D.S.; Pan, T.; Ning, J.; Guo, C.Q.; et al. Remotely sensed mapping and analysis of spatio-temporal patterns of land use change across China in 2015-2020. Acta Geographica Sinica 2022, 1056-1071.
- Liu, J.Y.; Kuang, W.H.; Zhang, Z.X.; Xu, X.L.; Qin, Y.W.; Ning, J.; Zhou, W.C.; Zhang, S.W.; Li, R.D.; Yan, C.Z.; et al. Spatiotemporal characteristics, patterns, and causes of land-use changes in China since the late 1980s. Journal of Geographical Sciences 2014, 24, 195-210. [CrossRef]
- LIU, J.; NING, J.; KUANG, W.; XU, X.; ZHANG, S.; YAN, C.; LI, R.; WU, S.; HU, Y.; DU, G.; et al. Spatiotemporal patterns and characteristics of land-use change in China during 2010–2015. Journal of Geographical Sciences 2018, 28, 547-562. [CrossRef]
- Zhang, G.; Xiao, X.; Biradar, C.M.; Dong, J.; Qin, Y.; Menarguez, M.A.; Zhou, Y.; Zhang, Y.; Jin, C.; Wang, J.; et al. Spatiotemporal patterns of paddy rice croplands in China and India from 2000 to 2015. Science of The Total Environment 2017, 579, 82-92. [CrossRef]
- Peng, S.Z.; Ding, Y.X.; Liu, W.Z.; Li, Z. 1 km monthly temperature and precipitation dataset for China from 1901 to 2017. Earth System Science Data 2019, 11, 1931-1946. [CrossRef]
- Peng, S.Z.; Ding, Y.X.; Wen, Z.M.; Chen, Y.M.; Cao, Y.; Ren, J.Y. Spatiotemporal change and trend analysis of potential evapotranspiration over the Loess Plateau of China during 2011-2100. Agricultural and Forest Meteorology 2017, 233, 183-194. [CrossRef]
- Vicente Serrano, S.M.; López-Moreno, J.I. A multi-scalar drought index sensitive to global warming: the standardized precipitation evapotranspiration index. Journal of Climate 2010, 23, 1696-1718. [CrossRef]
- Laimighofer, J.; Laaha, G. How standard are standardized drought indices? Uncertainty components for the SPI & SPEI case. Journal of Hydrology 2022, 613. [CrossRef]
- GAQSIQ. Grades of meteorological drought (GB/T 20481-2017). 2018.
- Li, R.Y.; Xu, M.Q.; Chen, Z.Y.; Gao, B.B.; Cai, J.; Shen, F.X.; He, X.L.; Zhuang, Y.; Chen, D.L. Phenology-based classification of crop species and rotation types using fused MODIS and Landsat data: The comparison of a random-forest-based model and a decision-rule-based model. Soil Tillage Res. 2021, 206, 12. [CrossRef]
- Peng, D.; Huete, A.R.; Huang, J.; Wang, F.; Sun, H. Detection and estimation of mixed paddy rice cropping patterns with MODIS data. International Journal of Applied Earth Observation & Geoinformation 2011, 13, 13-23.
- Bridhikitti, A.; Overcamp, T.J. Estimation of Southeast Asian rice paddy areas with different ecosystems from moderate-resolution satellite imagery. Agriculture, Ecosystems & Environment 2012, 146, 113-120. [CrossRef]
- Fu, X.; Zhao, G.N.; Wu, W.C.; Xu, B.; Li, J.; Zhou, X.T.; Ke, X.X.; Li, Y.; Li, W.J.; Zhou, C.M.; et al. Assessing the impacts of natural disasters on rice production in Jiangxi, China. International Journal of Remote Sensing 2022, 43, 1919-1941. [CrossRef]
Figure 1.
The location and distribution of land use types (LUD) of the Jianghan Plain in 2020. (The LUD were provided by the Resources and Environmental Science and Data Center, Chinese Academy of Sciences, http://www.resdc.cn).
Figure 1.
The location and distribution of land use types (LUD) of the Jianghan Plain in 2020. (The LUD were provided by the Resources and Environmental Science and Data Center, Chinese Academy of Sciences, http://www.resdc.cn).
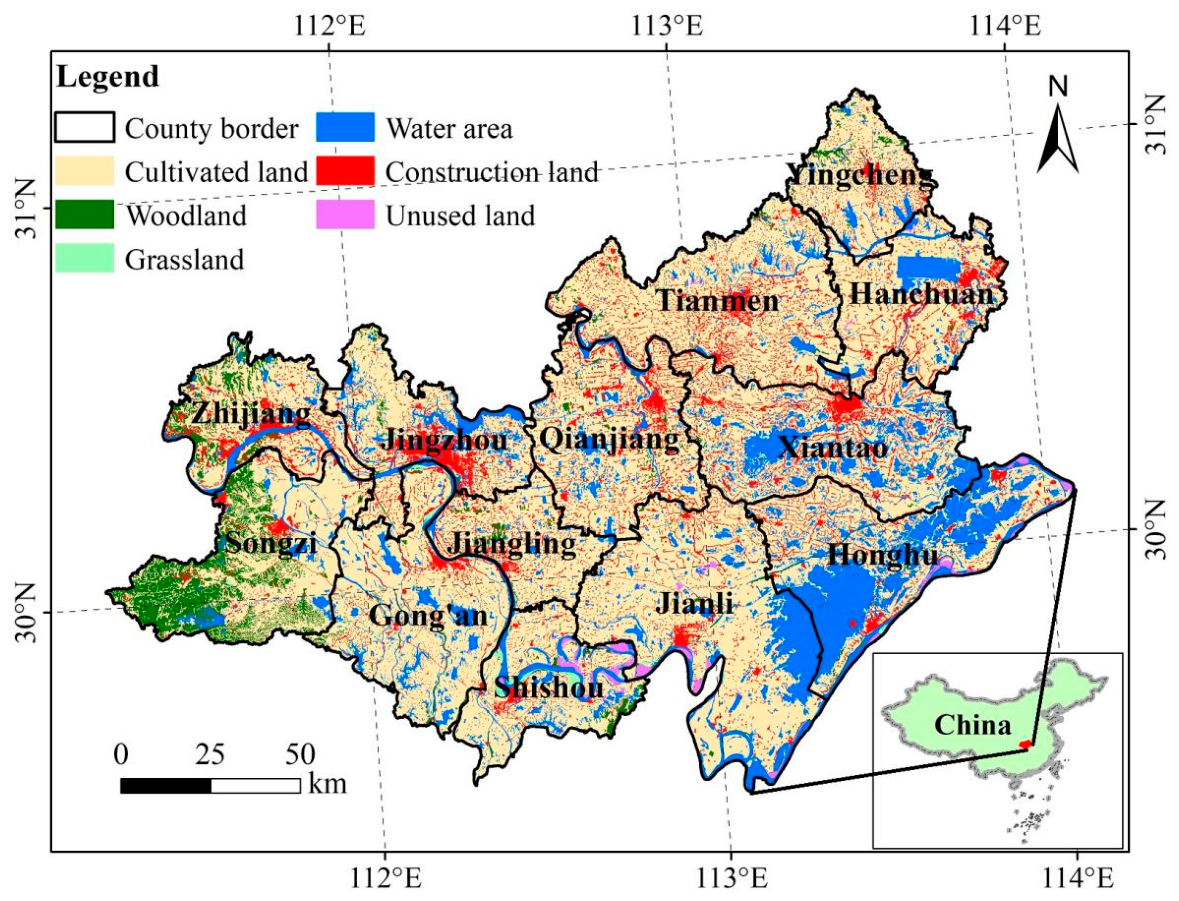
Figure 2.
The rice classification map of Jianghan Plain from 2000 to 2021.
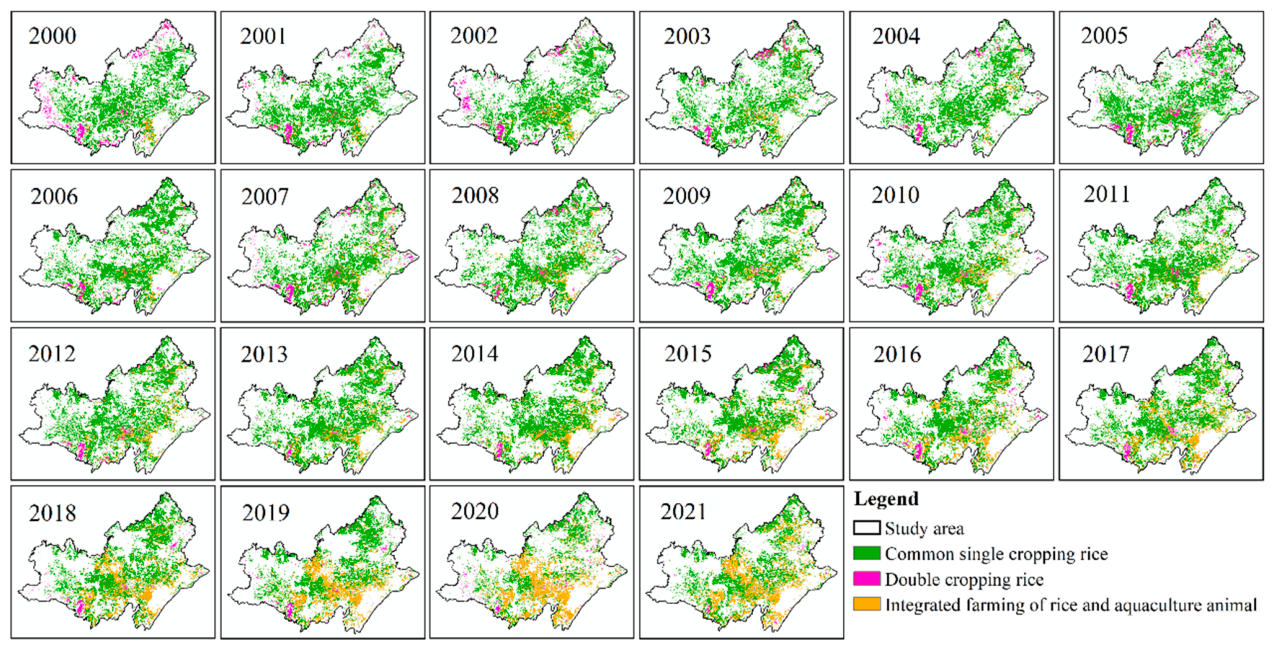
Figure 3.
Climate changes in Jianghan Plain from 2000 to 2021. (a) The monthly changes in air temperature (AT), potential evapotranspiration (PET) and precipitation (PRE). (b) The 1-month, 3-month, 6-month and 12-month time scales of the standardized precipitation evapotranspiration index (SPEI-1, SPEI-3, SPEI-6, and SPEI-12). (c) The monthly changes in solar-induced chlorophyll fluorescence (SIF) of the paddy fields in Jianghan Plain.
Figure 3.
Climate changes in Jianghan Plain from 2000 to 2021. (a) The monthly changes in air temperature (AT), potential evapotranspiration (PET) and precipitation (PRE). (b) The 1-month, 3-month, 6-month and 12-month time scales of the standardized precipitation evapotranspiration index (SPEI-1, SPEI-3, SPEI-6, and SPEI-12). (c) The monthly changes in solar-induced chlorophyll fluorescence (SIF) of the paddy fields in Jianghan Plain.
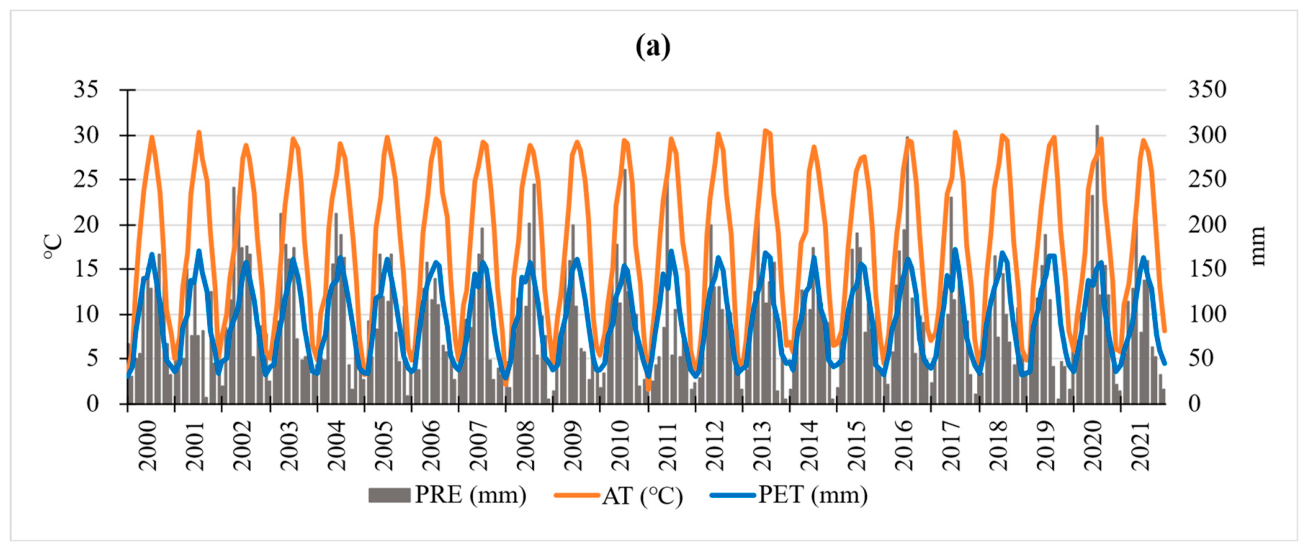
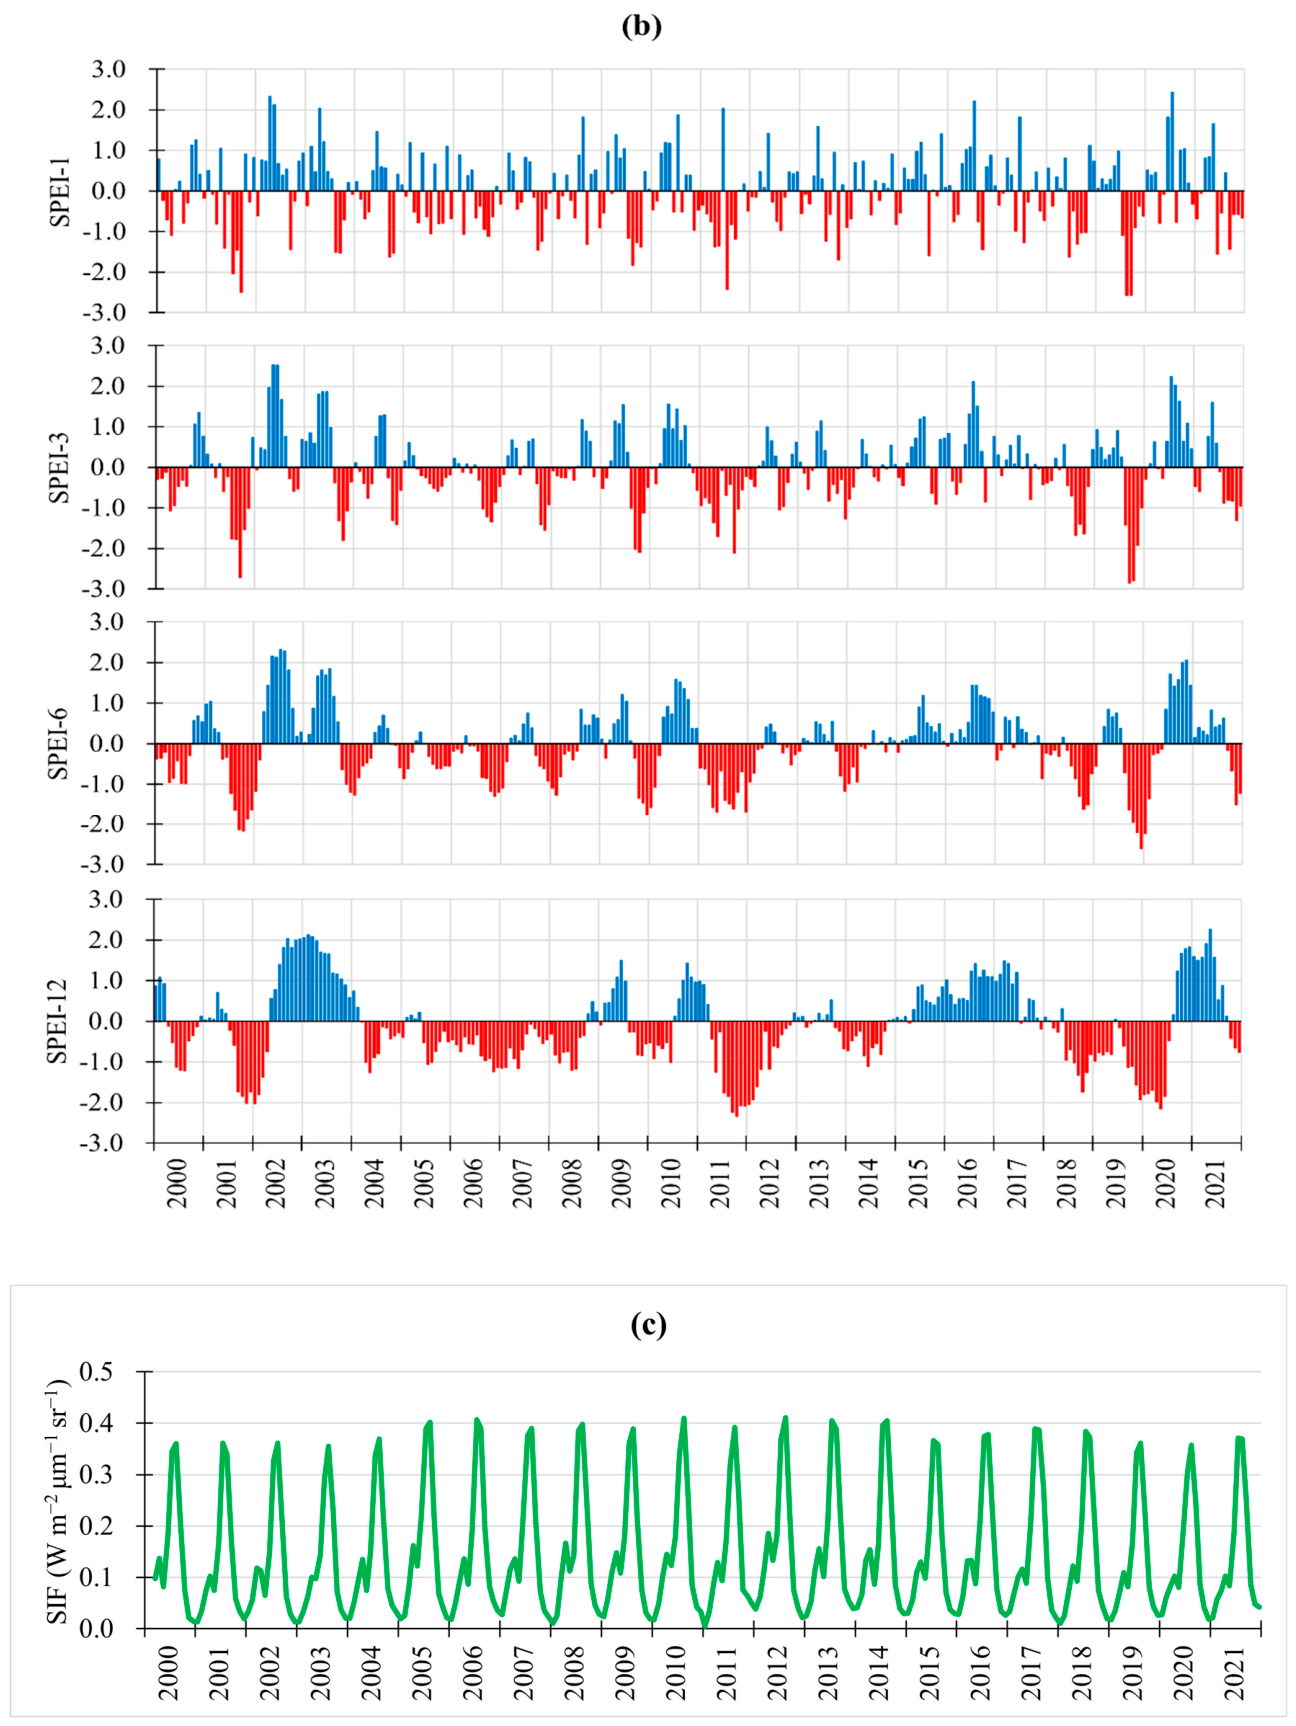
Figure 4.
Spatial distribution map of climate conditions during the main rice cropping season. SPEI-3: the standardized precipitation evapotranspiration index with a 3-month time scale from 2000 to 2021. On the left side of each image is the SPEI-3 data for April–June, and on the right side is the SPEI-3 data for July–September.
Figure 4.
Spatial distribution map of climate conditions during the main rice cropping season. SPEI-3: the standardized precipitation evapotranspiration index with a 3-month time scale from 2000 to 2021. On the left side of each image is the SPEI-3 data for April–June, and on the right side is the SPEI-3 data for July–September.
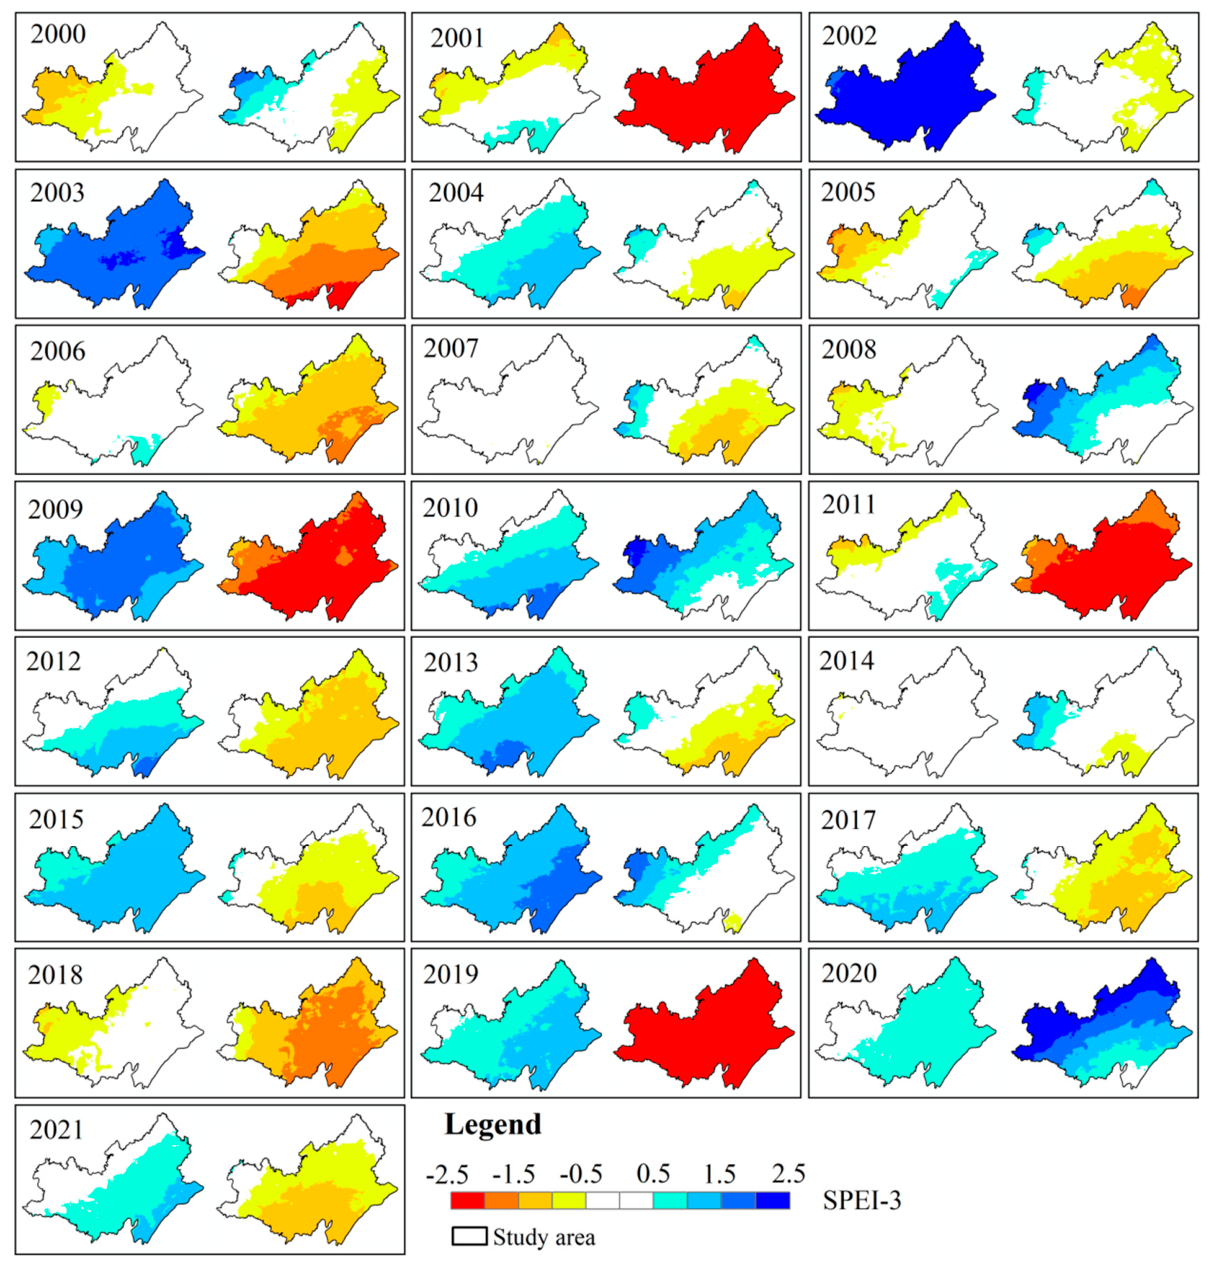
Figure 5.
Drought conditions during the rice cropping season in Jianghan Plain from 2000 to 2021 (a) The number of drought months from April to October of each year in Jinghan Plain; (b) The percentage of the area of paddy fields with different drought categories to the total area of the paddy fields based on the mean standardized precipitation evapotranspiration index (SPEI) of each pixel in the actual rice growth periods.
Figure 5.
Drought conditions during the rice cropping season in Jianghan Plain from 2000 to 2021 (a) The number of drought months from April to October of each year in Jinghan Plain; (b) The percentage of the area of paddy fields with different drought categories to the total area of the paddy fields based on the mean standardized precipitation evapotranspiration index (SPEI) of each pixel in the actual rice growth periods.
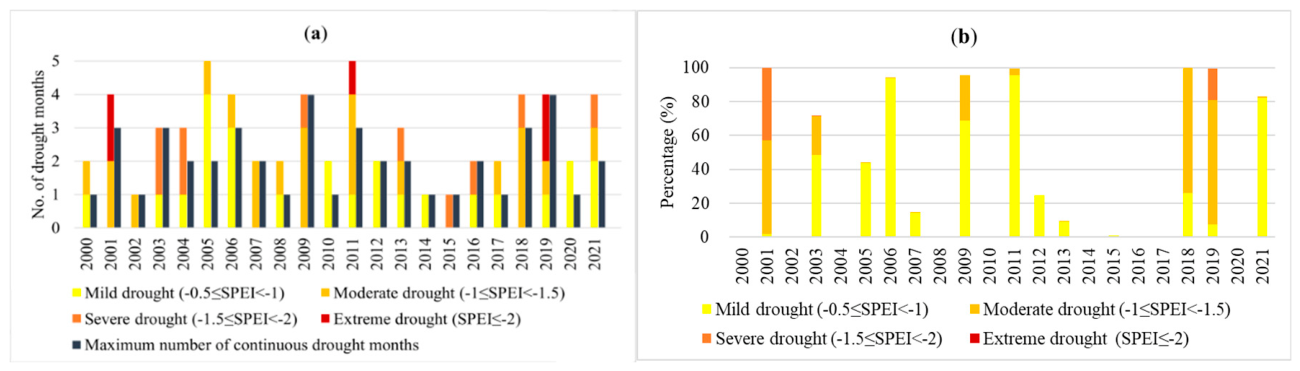
Figure 6.
Spatial distribution map of the mean standardized precipitation evapotranspiration index (mSPEI) during the actual rice growth periods of each pixel from 2000 to 2021.
Figure 6.
Spatial distribution map of the mean standardized precipitation evapotranspiration index (mSPEI) during the actual rice growth periods of each pixel from 2000 to 2021.
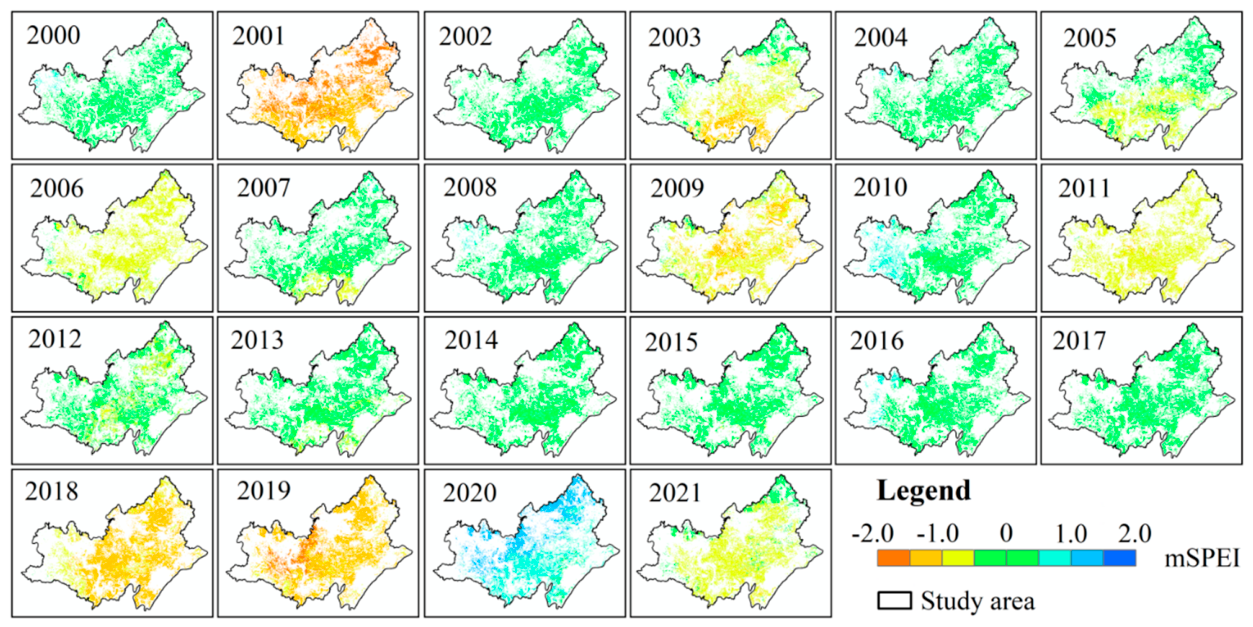
Figure 7.
The mean solar-induced chlorophyll fluorescence (mSIF) and mean standardized precipitation evapotranspiration index (mSPEI) of (a) all rice, (b) common single cropping rice (CSCR), (c) double cropping rice (DCR), and (d) integrated farming of rice and aquaculture animals (IFRA) during the actual rice growing periods from 2000 to 2021 in Jianghan Plain.
Figure 7.
The mean solar-induced chlorophyll fluorescence (mSIF) and mean standardized precipitation evapotranspiration index (mSPEI) of (a) all rice, (b) common single cropping rice (CSCR), (c) double cropping rice (DCR), and (d) integrated farming of rice and aquaculture animals (IFRA) during the actual rice growing periods from 2000 to 2021 in Jianghan Plain.
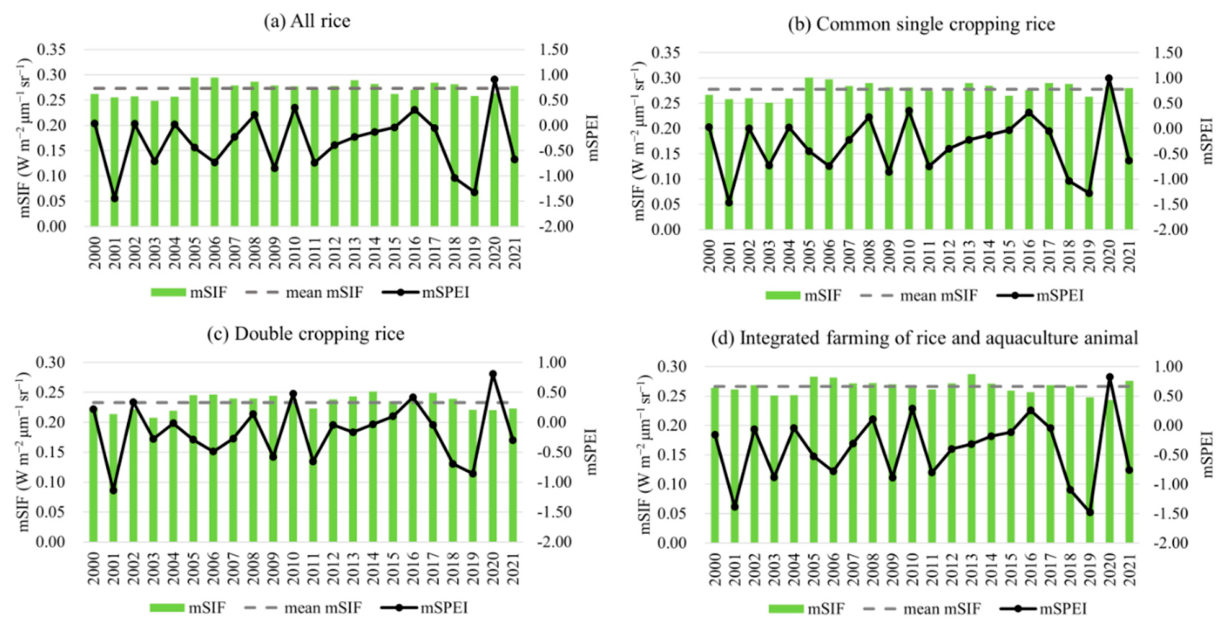
Figure 8.
Climate and photosynthesis conditions in the paddy fields with different transplanting times in 2019. (a)–(e) show the precipitation (PRE), air temperature (AT), potential evapotranspiration (PET), standardized precipitation evapotranspiration index (SPEI), and solar-induced chlorophyll fluorescence (SIF) of the paddy fields in 2019. (f) ΔSIF was the difference between the SIF in 2019 and the mean SIF in the years with normal precipitation during the rice cropping season from 2005 to 2021. RICE113 refers to rice whose transplanting time was during the DOY 113-128 period, and so on.
Figure 8.
Climate and photosynthesis conditions in the paddy fields with different transplanting times in 2019. (a)–(e) show the precipitation (PRE), air temperature (AT), potential evapotranspiration (PET), standardized precipitation evapotranspiration index (SPEI), and solar-induced chlorophyll fluorescence (SIF) of the paddy fields in 2019. (f) ΔSIF was the difference between the SIF in 2019 and the mean SIF in the years with normal precipitation during the rice cropping season from 2005 to 2021. RICE113 refers to rice whose transplanting time was during the DOY 113-128 period, and so on.
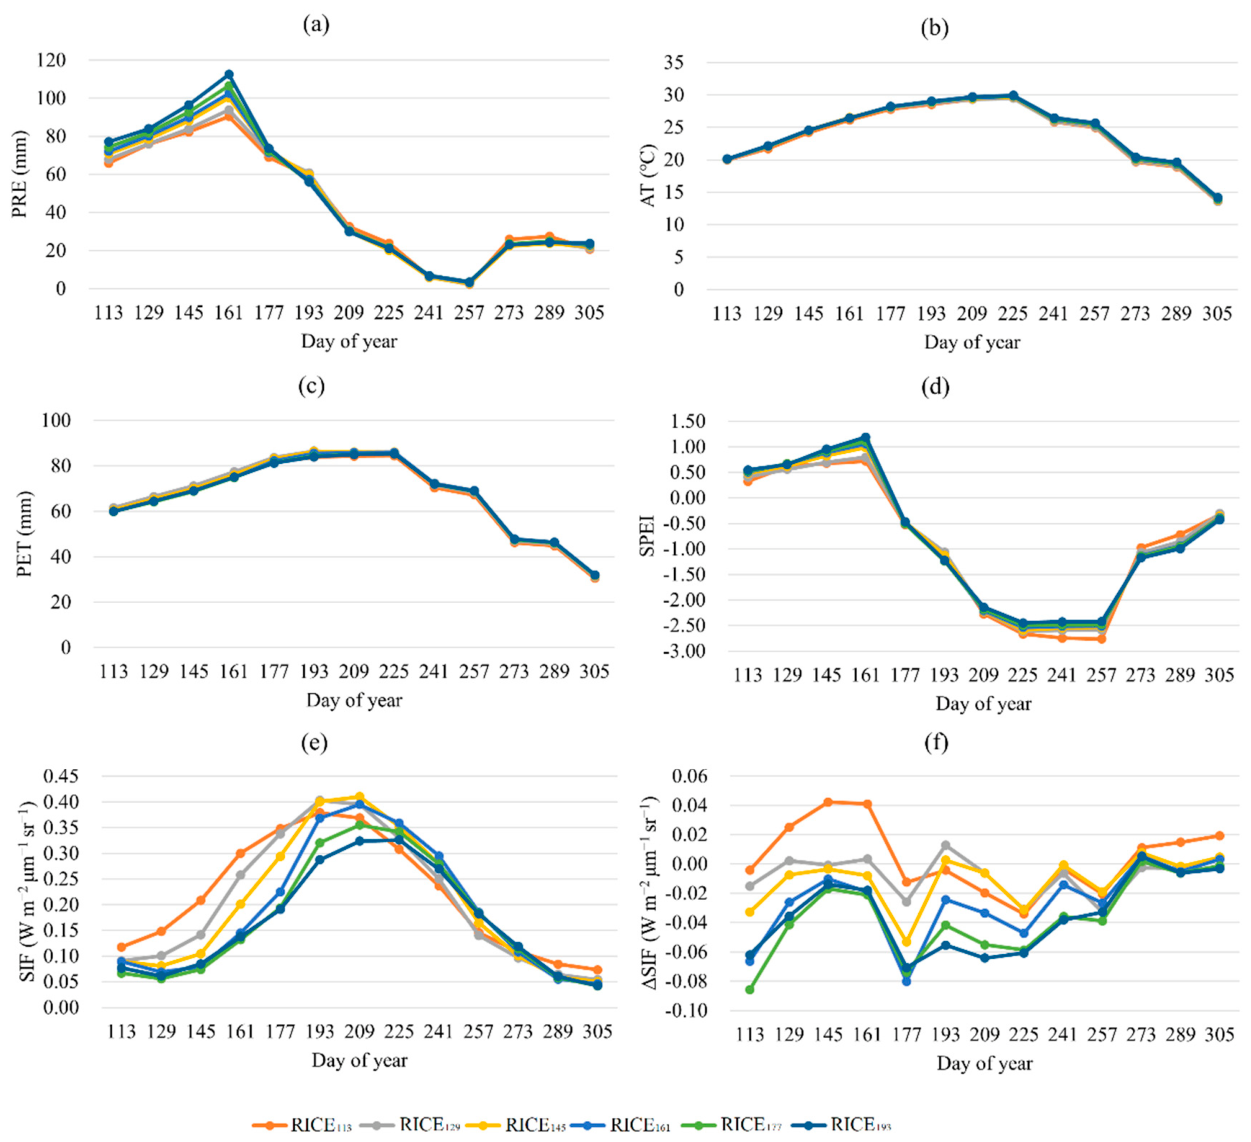
Figure 9.
The anomalies of the climate conditions and photosynthesis conditions in the paddy fields with different transplanting times during the rice growing season in 2019. SPEI: standardized precipitation evapotranspiration index, SIF: solar-induced chlorophyll fluorescence, PRE: precipitation, AT: air temperature, PET: potential evapotranspiration.
Figure 9.
The anomalies of the climate conditions and photosynthesis conditions in the paddy fields with different transplanting times during the rice growing season in 2019. SPEI: standardized precipitation evapotranspiration index, SIF: solar-induced chlorophyll fluorescence, PRE: precipitation, AT: air temperature, PET: potential evapotranspiration.
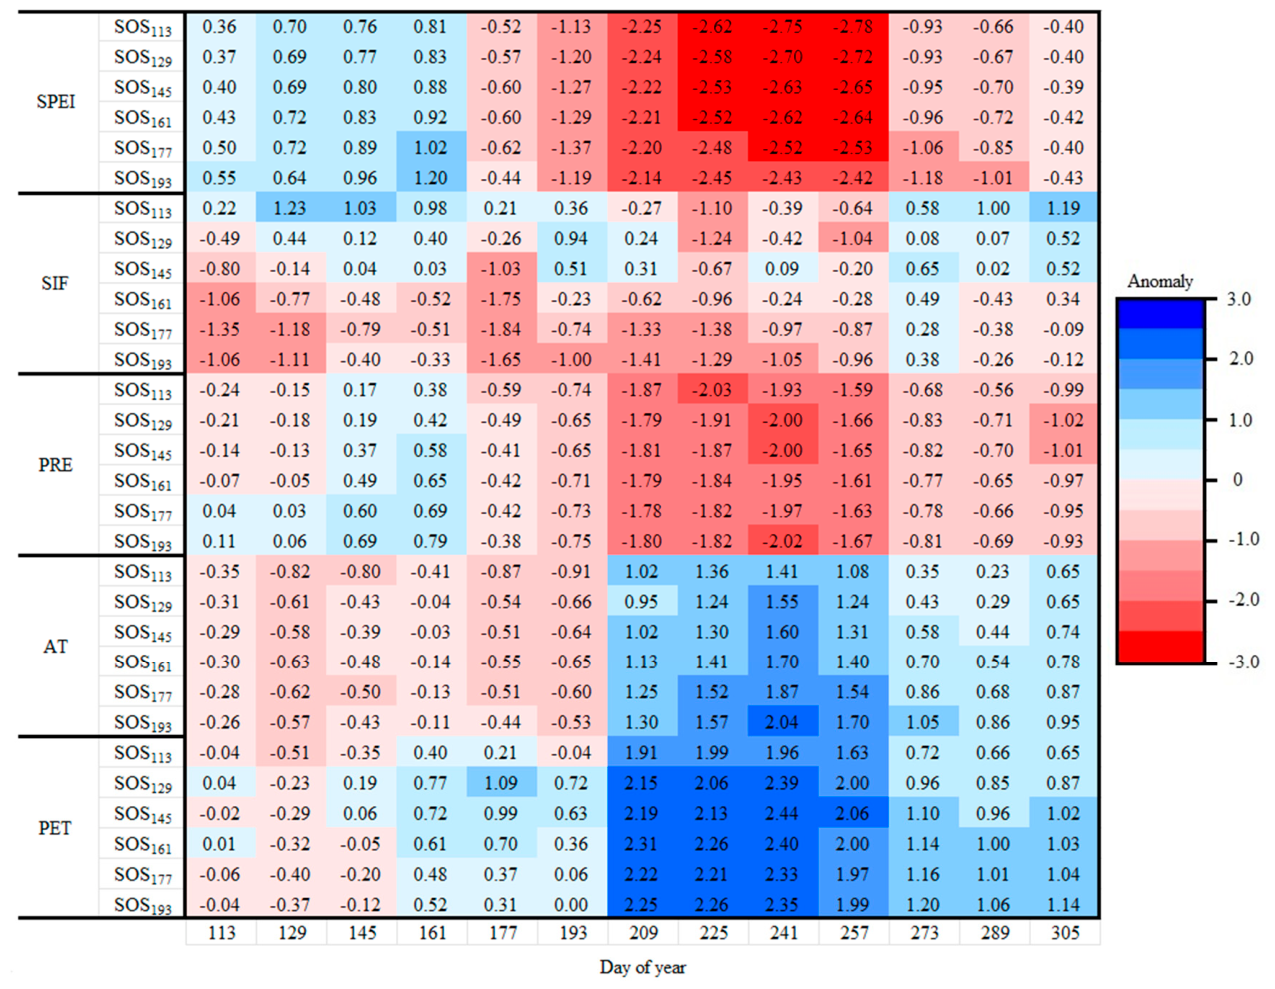
Figure 10.
The dynamic of SPEI, SIF and ΔSIF of the paddy fields from DOY-113 to DOY-289 periods in 2019. SPEI: standardized precipitation evapotranspiration index, SIF: solar-induced chlorophyll fluorescence, ΔSIF: the difference between the SIF in 2019 and the mean SIF in the years with normal precipitation during rice cropping season from 2005 to 2021, DOY: day of the year.
Figure 10.
The dynamic of SPEI, SIF and ΔSIF of the paddy fields from DOY-113 to DOY-289 periods in 2019. SPEI: standardized precipitation evapotranspiration index, SIF: solar-induced chlorophyll fluorescence, ΔSIF: the difference between the SIF in 2019 and the mean SIF in the years with normal precipitation during rice cropping season from 2005 to 2021, DOY: day of the year.
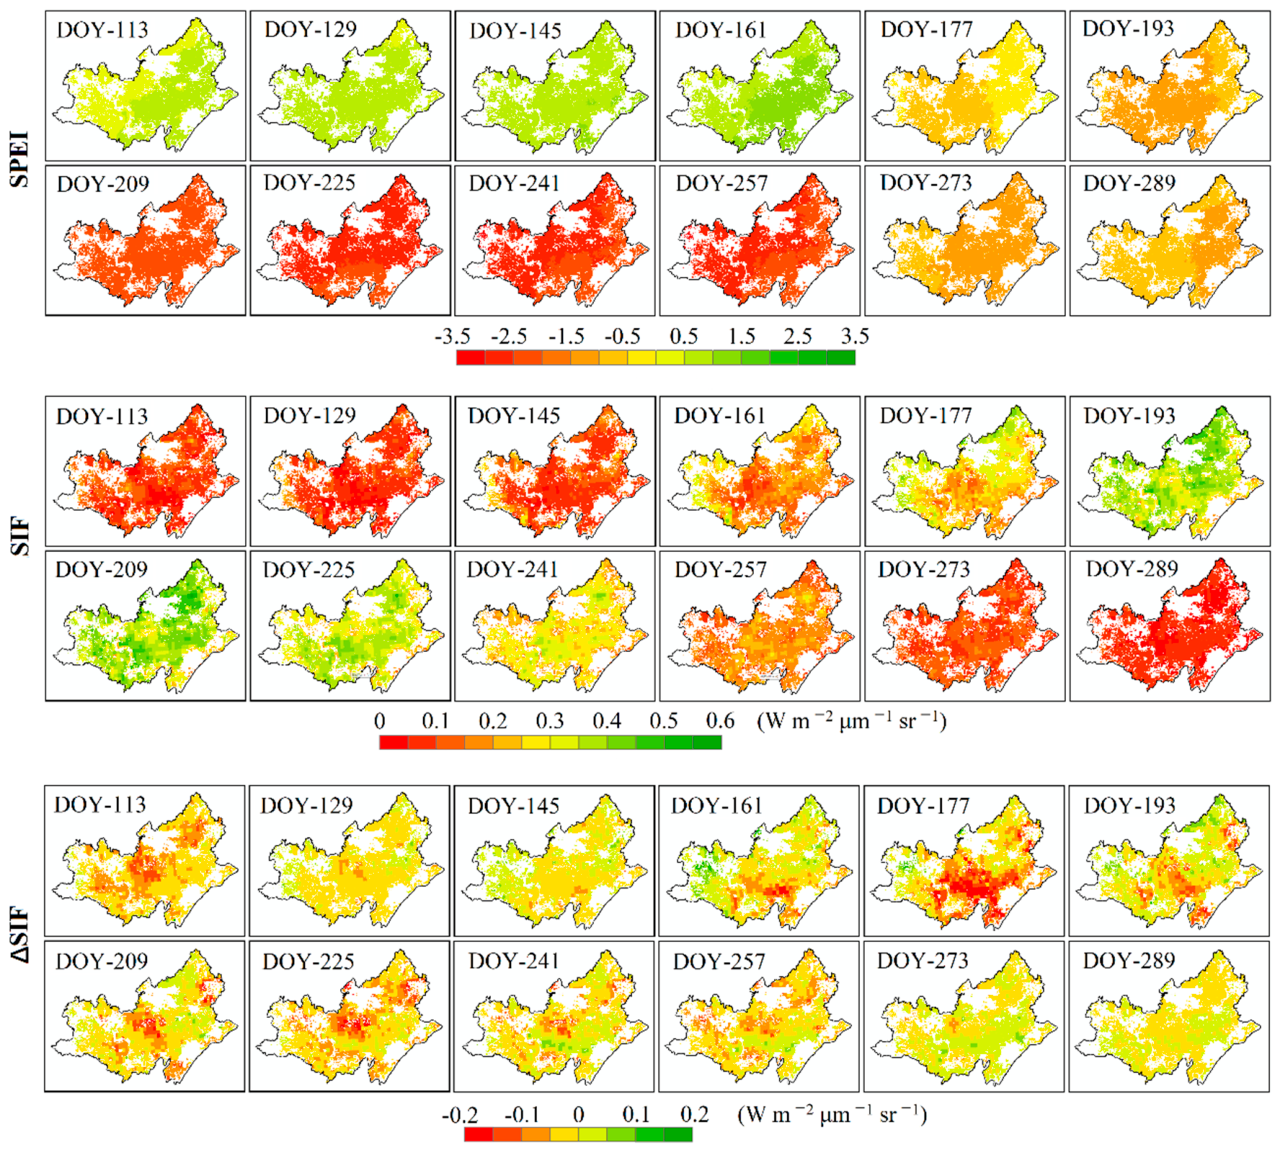

Table 1.
Grades of meteorological drought.
| SPEI | Drought categories |
| ≥ 0.5 | Flood |
| 0.49 – -0.49 | Normal |
| -0.99 – -0.50 | Mild drought |
| -1.49 – -1.00 | Moderate drought |
| -1.99 – -1.50 | Severe drought |
| ≤ -2.00 | Extreme drought |
Table 2.
The correlation coefficient (R2) and the root mean square error (RMSE) of the MODIS-derived rice area and reference datasets.
Table 2.
The correlation coefficient (R2) and the root mean square error (RMSE) of the MODIS-derived rice area and reference datasets.
| Year | Modis-derived rice area (km2) | No. of counties | Statistical data | LUD data | |||||||
| CSCR | DCR | IFRA | Total | Rice area (km2) | RMSE (km2) | R2 | Rice area (km2) | RMSE (km2) | R2 | ||
| 2000 | 7359.54 | 880.90 | 240.92 | 8481.37 | 13 | 6073.00 | 285.56 | 0.63 | 10599.17 | 243.18 | 0.74 |
| 2001 | 7576.83 | 471.33 | 314.66 | 8362.82 | 13 | 5921.40 | 390.75 | 0.65 | |||
| 2002 | 7131.01 | 659.33 | 495.01 | 8285.35 | 13 | 5299.00 | 353.51 | 0.66 | |||
| 2003 | 7115.25 | 594.21 | 517.46 | 8226.92 | 13 | 5044.60 | 311.19 | 0.68 | |||
| 2004 | 7507.65 | 514.41 | 435.21 | 8457.28 | 13 | 5776.40 | 284.29 | 0.71 | |||
| 2005 | 7669.88 | 849.66 | 296.31 | 8815.84 | 13 | 6058.90 | 327.08 | 0.78 | 10272.99 | 478.36 | 0.77 |
| 2006 | 8155.78 | 387.67 | 516.78 | 9060.23 | 13 | 6098.90 | 295.87 | 0.83 | |||
| 2007 | 7233.98 | 854.44 | 699.87 | 8788.29 | 13 | 5325.50 | 355.79 | 0.84 | |||
| 2008 | 7645.38 | 429.29 | 804.80 | 8879.47 | 13 | 5968.90 | 299.86 | 0.81 | |||
| 2009 | 7733.96 | 450.15 | 811.27 | 8995.37 | 13 | 6488.40 | 235.22 | 0.80 | |||
| 2010 | 8139.02 | 494.37 | 867.83 | 9501.22 | 13 | 6543.70 | 285.87 | 0.82 | 10147.68 | 447.63 | 0.79 |
| 2011 | 8040.19 | 386.71 | 949.76 | 9376.66 | 13 | 6525.80 | 272.57 | 0.84 | |||
| 2012 | 7841.35 | 391.81 | 1046.68 | 9279.84 | 13 | 6813.30 | 267.51 | 0.72 | |||
| 2013 | 8235.07 | 159.86 | 1120.19 | 9515.11 | 13 | 6975.40 | 262.59 | 0.78 | |||
| 2014 | 7874.64 | 256.41 | 1372.63 | 9503.68 | 13 | 7170.50 | 225.45 | 0.88 | |||
| 2015 | 7101.45 | 439.40 | 1682.92 | 9223.77 | 13 | 7103.20 | 234.30 | 0.77 | 9956.14 | 195.97 | 0.73 |
| 2016 | 6714.65 | 438.90 | 1768.31 | 8921.87 | 13 | 6753.30 | 267.25 | 0.66 | |||
| 2017 | 7276.02 | 341.76 | 2072.04 | 9689.82 | 13 | 7961.30 | 190.03 | 0.86 | |||
| 2018 | 6907.89 | 321.08 | 2323.58 | 9552.55 | 13 | 7989.80 | 190.73 | 0.88 | |||
| 2019 | 6042.70 | 333.06 | 2735.98 | 9111.74 | 13 | 7594.50 | 164.35 | 0.89 | |||
| 2020 | 4098.59 | 336.38 | 3378.96 | 7813.93 | 13 | 7530.90 | 171.61 | 0.86 | 9872.42 | 289.65 | 0.63 |
| 2021 | 5694.57 | 126.93 | 3387.47 | 9208.97 | 13 | ||||||
* The P-values of all the R2 were less than 0.01. CSCR: Common single-cropping rice; DCR: Double-cropping rice; IFRA: integrated farming of rice and aquaculture animals; RMSE: Root Mean Squared Error.
Table 3.
The corresponding rice growth stage, mean climate conditions and drought frequency of each month from 2000 to 2021 in Jianghan Plain.
Table 3.
The corresponding rice growth stage, mean climate conditions and drought frequency of each month from 2000 to 2021 in Jianghan Plain.
| Month | Jan. | Feb. | Mar. | Apr. | May. | Jun. | Jul. | Aug. | Sept. | Oct. | Nov. | Dec. | |
| Early rice | T | V | V-R | R-M | |||||||||
| Middle rice | T | T-V | V-R | R-M | M | ||||||||
| Late rice | T | V | V-R | R-M | |||||||||
| Mean climate conditions | AT | -0.10 | 0.20 | 0.02 | 0.34 | 0.50 | 0.33 | -0.14 | -0.57 | -0.78 | -0.24 | 0.28 | -0.18 |
| PET | 4.81 | 7.57 | 12.43 | 17.97 | 22.77 | 26.46 | 29.32 | 28.41 | 24.24 | 18.79 | 12.84 | 6.85 | |
| PRE | 36.87 | 46.39 | 79.49 | 103.59 | 129.89 | 138.57 | 162.17 | 148.21 | 115.16 | 82.82 | 54.12 | 39.58 | |
| SPEI | 32.12 | 55.71 | 80.69 | 122.98 | 156.45 | 158.46 | 160.56 | 122.40 | 79.20 | 71.90 | 66.81 | 31.62 | |
| Drought frequency (%) | Mild drought | 27.27 | 13.64 | 27.27 | 13.64 | 4.55 | 22.73 | 13.64 | 36.36 | 9.09 | 22.73 | 13.64 | 36.36 |
| Moderate drought | 4.55 | 9.09 | 9.09 | 4.55 | 22.73 | 9.09 | 40.91 | 13.64 | |||||
| Severe drought | 4.55 | 13.64 | 9.09 | 9.09 | |||||||||
| Extreme drought | 9.09 | 4.55 | 9.09 | ||||||||||
| Total | 27.27 | 13.64 | 31.82 | 22.73 | 13.64 | 31.82 | 45.45 | 63.64 | 68.18 | 45.45 | 13.64 | 36.36 | |
* The T, V, R and M represent the transplanting stage, vegetative stage, reproductive stage and maturity stage of rice, respectively. AT: air temperature; PET: potential evapotranspiration; PRE: precipitation; SPEI: standardized precipitation evapotranspiration index.
Table 4.
The climate conditions and the change rate of the mean SIF of all rice in the drought years.
Table 4.
The climate conditions and the change rate of the mean SIF of all rice in the drought years.
| Year | mSIF | Rate-1 (%) | Comparison year | Rate-2 (%) | mSPEI | SPEI-b1 | SPEI-b3 | SPEI-b6 | SPEI-b12 |
| 2001 | 0.2558 | -8.82 | 2000 | -2.44 | -1.44 | -0.68 | -0.25 | -0.00 | 0.43 |
| 2003 | 0.2483 | -11.49 | 2002 | -3.65 | -0.71 | 1.04 | 1.69 | 1.72 | 1.77 |
| 2006 | 0.2946 | 5.01 | 2005 | -0.17 | -0.73 | 0.33 | 0.07 | 0.15 | -0.41 |
| 2009 | 0.2790 | -0.55 | 2008 | -2.65 | -0.85 | 0.98 | 1.09 | 0.61 | 0.90 |
| 2011 | 0.2711 | -3.36 | 2010 | -2.31 | -0.74 | -0.84 | -1.23 | -1.41 | -0.71 |
| 2018 | 0.2817 | 0.41 | 2017 | -0.95 | -1.04 | 0.14 | 0.26 | 0.01 | 0.02 |
| 2019 | 0.2583 | -7.93 | 2017 | -9.18 | -1.32 | 0.65 | 0.51 | 0.78 | -0.73 |
| 2021 | 0.2779 | -0.94 | 2017 | -2.29 | -0.67 | 1.03 | 1.13 | 0.58 | 1.99 |
| Correlation with mSIF | R2 | 0.18 | 0.00 | 0.04 | 0.14 | 0.05 | |||
| P-value | 0.30 | 0.93 | 0.64 | 0.36 | 0.60 | ||||
| Correlation with Rate-1 | R2 | 0.18 | 0.00 | 0.04 | 0.14 | 0.05 | |||
| P-value | 0.30 | 0.93 | 0.64 | 0.36 | 0.60 | ||||
| Correlation with Rate-2 | R2 | 0.22 | 0.06 | 0.04 | 0.12 | 0.03 | |||
| P-value | 0.24 | 0.56 | 0.64 | 0.40 | 0.68 | ||||
* The mSIF and mSPEI were the mean solar-induced chlorophyll fluorescence and mean standardized precipitation evapotranspiration index of all rice during the actual rice growth periods, respectively. The Rate-1 was the change rate of the mSIF in the drought years compared with the average value of the mSIF in the years with relatively normal climate conditions (-0.5 < mSPEI < 0.5) during the actual rice growth periods after 2004. The Rate-2 was the change rate of the mSIF in drought years compared with that in the adjacent years with relatively normal climate conditions during the actual rice growth periods. SPEI-b1, SPEI-b3, SPEI-b6, and SPEI-b12 were the mean SPEI of 1 month, 3 months, 6 months, and 12 months before the transplanting time of rice, respectively.
Table 5.
The mean SIF, mean SPEI and the change rate of the mean SIF of different rice cropping types in the drought years.
Table 5.
The mean SIF, mean SPEI and the change rate of the mean SIF of different rice cropping types in the drought years.
| Drought year | Adjacent years with normal precipitation | The change rate of mSIF (%) | |||||
| Year | Rice type | mSIF | mSPEI | Year | mSIF | mSPEI | |
| 2001 | CSCR | 0.2583 | -1.46 | 2000 | 0.2666 | 0.03 | -3.14 |
| DCR | 0.2140 | -1.14 | 0.2247 | 0.22 | -4.79 | ||
| IFRA | 0.2612 | -1.38 | 0.2638 | -0.16 | -0.99 | ||
| 2003 | CSCR | 0.2511 | -0.73 | 2002 | 0.2603 | 0.00 | -3.54 |
| DCR | 0.2076 | -0.28 | 0.2214 | 0.34 | -6.22 | ||
| IFRA | 0.2513 | -0.88 | 0.2689 | -0.07 | -6.53 | ||
| 2006 | CSCR | 0.2974 | -0.74 | 2005 | 0.3009 | -0.45 | -1.18 |
| DCR | 0.2465 | -0.49 | 0.2453 | -0.29 | 0.47 | ||
| IFRA | 0.2814 | -0.78 | 0.2833 | -0.52 | -0.68 | ||
| 2009 | CSCR | 0.2816 | -0.86 | 2008 | 0.2905 | 0.23 | -3.04 |
| DCR | 0.2445 | -0.58 | 0.2399 | 0.14 | 1.93 | ||
| IFRA | 0.2700 | -0.89 | 0.2725 | 0.11 | -0.91 | ||
| 2011 | CSCR | 0.2743 | -0.75 | 2010 | 0.2810 | 0.35 | -2.40 |
| DCR | 0.2232 | -0.65 | 0.2388 | 0.48 | -6.54 | ||
| IFRA | 0.2614 | -0.80 | 0.2683 | 0.29 | -2.58 | ||
| 2018 | CSCR | 0.2884 | -1.04 | 2017 | 0.2902 | -0.05 | -0.62 |
| DCR | 0.2392 | -0.70 | 0.2490 | -0.05 | -3.92 | ||
| IFRA | 0.2664 | -1.09 | 0.2685 | -0.05 | -0.78 | ||
| 2019 | CSCR | 0.2634 | -1.28 | 2017 | 0.2902 | -0.05 | -9.23 |
| DCR | 0.2209 | -0.82 | 0.2490 | -0.05 | -11.28 | ||
| IFRA | 0.2481 | -1.48 | 0.2685 | -0.05 | -7.61 | ||
| 2021 | CSCR | 0.2802 | -0.63 | 2017 | 0.2902 | -0.05 | -3.45 |
| DCR | 0.2231 | -0.30 | 0.2490 | -0.05 | -10.39 | ||
| IFRA | 0.2759 | -0.76 | 0.2685 | -0.05 | 2.74 | ||
| Average | CSCR | 0.2743 | -0.94 | -3.33 | |||
| DCR | 0.2274 | -0.62 | -5.09 | ||||
| IFRA | 0.2645 | -1.01 | -2.17 | ||||
* The mSIF and mSPEI were the mean solar-induced chlorophyll fluorescence and mean standardized precipitation evapotranspiration index of all rice during the actual rice growth periods, respectively. The CSCR, DCR and IFRA were the common single-cropping rice, the double-cropping rice and the integrated farming of rice and aquaculture animals, respectively.
Disclaimer/Publisher’s Note: The statements, opinions and data contained in all publications are solely those of the individual author(s) and contributor(s) and not of MDPI and/or the editor(s). MDPI and/or the editor(s) disclaim responsibility for any injury to people or property resulting from any ideas, methods, instructions or products referred to in the content. |
© 2026 by the authors. Licensee MDPI, Basel, Switzerland. This article is an open access article distributed under the terms and conditions of the Creative Commons Attribution (CC BY) license (http://creativecommons.org/licenses/by/4.0/).
Copyright: This open access article is published under a Creative Commons CC BY 4.0 license, which permit the free download, distribution, and reuse, provided that the author and preprint are cited in any reuse.