

Submitted:
20 August 2026
Posted:
20 August 2026
You are already at the latest version
Abstract
Security operations centres (SOCs) face two simultaneous mandates: keep the network traffic they analyse private, and make their AI-based detectors explainable. These goals are usually assumed to be in tension, because in image and language models differential privacy (DP) is reported to degrade post-hoc explanations. We present the first systematic audit of explanation faithfulness under formally-accounted (ε,δ)-DP in federated, tabular deep intrusion detection (IDS), and we add a previously-unstudied axis: the interaction between Byzantine-robust aggregation and explanation quality. Across two datasets (ToN_IoT, CICIDS2017), two architectures (an MLP and a compact tabular transformer), three attribution methods (Integrated Gradients, GradientSHAP, attention rollout), privacy budgets ε ∈ {8, 4, 1} (ε ∈ {4, 1} for the transformer), and heterogeneity levels, and using paired Wilcoxon tests with Cliff’s δ effect sizes, we find — contrary to our own anchor hypothesis and to the image/NLP literature — that client-side DP-SGD does not degrade explanation faithfulness. Measured by comprehensiveness and the AOPC MoRF−LeRF separation it significantly increases self-faithfulness (large δ, all seeds), an effect that attenuates at the strongest budget and survives a confidence-ceiling (f0) normalization. A pre-registered capacity-matched control attributes this faithfulness gain largely to DP’s utility cost — non-DP models throttled to the same accuracy by three independent mechanisms reproduce it — leaving only a small, clipping-driven residual in the centralized setting. DP’s real cost falls on utility and, most sharply, on rare-attack detection (mitm F1 0.65→0.05). Per-class utility and faithfulness decouple: well-supported classes hold their F1 while their attribution gap widens. A strong model-poisoning attack collapses FedAvg in both utility (0.83→0.20) and faithfulness (gap 0.58→0.21), whereas median, trimmed-mean and multi-Krum preserve both — though median/Krum cost some faithfulness when no attack is present, making trimmed-mean the best all-round trade-off. Among attribution methods, attention rollout is the most fragile. Practically: for explainable federated IDS, gradient/Shapley attributions remain trustworthy under DP, and trimmed-mean aggregation buys robustness at little explanation cost.
Keywords:
federated learning
; differential privacy
; explainable AI
; faithfulness
; intrusion detection
; Byzantine-robust aggregation
; feature attribution
1. Introduction
Modern network defence is being pulled in two directions at once. On one side, data-protection regulation and commercial confidentiality make it increasingly untenable to pool raw traffic from many organisations into a single training corpus; federated learning (FL) [1,2,3] answers this by training a shared detector from decentralised data, and differential privacy (DP) [4,5] hardens it with a formal, quantifiable bound on what any single record contributes to the released model. On the other side, the same operational and regulatory pressure that demands privacy also demands accountability: an analyst who acts on an alert must be able to see why the model raised it, both to triage efficiently and to satisfy audit. These two mandates — privacy and explainability — are widely assumed to conflict, and there is empirical support for that intuition in perceptual domains: adding DP-SGD noise has been shown to make saliency and attribution maps more discontinuous and less stable on images and time series [6].
Whether that conflict actually materialises for the data that SOCs run on has not been measured. Intrusion detection operates on tabular network-flow records — counts of bytes and packets, connection states, protocol flags — not on images or free text, and it is increasingly deployed federated across sites with heterogeneous traffic. The behaviour of explanations under DP in this specific regime is unknown, and the stakes are asymmetric: in security an unfaithful explanation — one that looks plausible but does not reflect the model’s actual computation — is arguably worse than no explanation, because it manufactures misplaced trust. We therefore study faithfulness specifically (does the explanation reflect what the model computes?) rather than plausibility (does it look reasonable to a human?) [7].
We frame the problem as an empirical audit and commit in advance to reporting the outcome honestly, including where it contradicts our own expectations. Our anchor hypothesis, drawn from the image/NLP literature, was that decreasing ε would decrease comprehensiveness and top-k stability, amplified under non-IID splits. As we show, the data contradict it — and the contradiction, rigorously established, is itself the contribution. We organise the study around four research questions:
RQ1. How much does DP-SGD noise, at formally accounted ε budgets, degrade the faithfulness of post-hoc explanations in federated deep IDS?
RQ2. Does data heterogeneity (non-IID) amplify or mask that effect?
RQ3. (novel) Do Byzantine-robust aggregation rules alter explanation faithfulness relative to FedAvg, with and without attackers present?
RQ4. Are attribution methods differentially fragile (SHAP vs Integrated Gradients vs attention)?
Contributions. (i) We conduct the first faithfulness audit under formally accounted DP in federated, tabular IDS, spanning two datasets and two architectures, with paired non-parametric statistics and effect sizes. (ii) We introduce and study a previously-unexplored axis — robust-aggregation × explanation quality — under both a weak (data-poisoning) and a strong (model-poisoning) attack. (iii) We report a nuanced null: DP does not degrade explanation faithfulness in this setting — it slightly sharpens it — while degrading utility and, most sharply, rare-attack detection; utility and faithfulness decouple at the per-class level, and a pre-registered capacity-matched control plus a clipping-vs-noise ablation attribute the sharpening largely to reduced utility with a clipping-driven remainder. (iv) We deliver a reusable, fully-reproducible audit protocol (seeded configs, per-run artifacts, a deviation log) as an open benchmark.
The remainder of the paper positions the work against prior art (§2), specifies the threat and privacy model (§3), details the audit protocol (§4), presents results per research question (§5), discusses mechanisms and practical guidance (§6), states limitations (§7) and concludes (§8).
2. Related Work
Our work sits at an intersection that, to our knowledge, no prior study occupies in full. Table 1 names the two closest lines and what each leaves open.
Privacy and explanations. Saifullah et al. [6] is our anchor: they explicitly quantify how DP and FL affect attribution faithfulness with AOPC MoRF/LeRF and ground-truth concordance — but on images, time series, documents and medical data, where they observe that DP makes attributions more discontinuous and that gradient-based methods suffer more than perturbation-based ones [11]. Contemporaneous work extends the privacy–explainability question to NLP, again finding a visible separation. That our tabular-IDS result runs the opposite way makes it a domain-specific finding worth reporting rather than a re-derivation; §6 offers a mechanism. Crucially, none of these works studies the federated tabular IDS regime, and none uses formal (ε,δ) accounting as the primary lens.
Explainable federated IDS. FedXAI [8] brings faithfulness, complexity and monotonicity metrics to federated IoT intrusion detection with LIME/IG/SHAP over deep networks for IoT botnet detection, and even addresses the privacy of the explanations themselves — but it contains no differential privacy in training, so the question of how a formal privacy budget interacts with faithfulness is untouched. A broader wave of federated-XAI-for-IDS work (causal-reasoning explanations, botnet-detection explanations) [12] confirms the topic’s momentum while sharing the same gap. Federated SHAP [9] tackles the background-dataset problem for SHAP under FL on tabular data and does compare local-DP perturbation strategies at ε ∈ {1, 10}, but it is not IDS-specific, does not use formally accounted (ε,δ)-DP training, and reports attribution agreement with a centralised reference rather than faithfulness. Lazzarini et al. [10] compare FedAvg-family aggregation for IoT IDS on exactly our two datasets (ToN_IoT, CICIDS2017) with a shallow ANN and no XAI, providing a natural experimental bridge.
Faithfulness metrics. We adopt the erasure-based family: comprehensiveness and sufficiency from the ERASER benchmark [13], and the AOPC region-perturbation curves of Samek et al. [14], which we summarise by the Most-Relevant-First minus Least-Relevant-First (MoRF−LeRF) separation. These are model-relative, faithfulness-oriented metrics — they ask whether the features an attribution ranks as important are the ones the model actually relies on — which is precisely the property a SOC needs. Prior sanity checks show that attribution maps are not automatically faithful, which motivates auditing faithfulness rather than assuming it [15].
Robust aggregation. Byzantine-robust FL replaces the FedAvg mean with an estimator that tolerates a minority of adversarial updates: coordinate-wise median and trimmed-mean [16], and (multi-)Krum [17]. This literature evaluates such rules almost exclusively by their effect on accuracy under poisoning [18,19,20]. Their effect on explanation quality — whether a robust rule that protects accuracy also protects, or instead perturbs, the resulting attributions — is, to our knowledge, unstudied, and is the subject of RQ3.
3. Threat and Privacy Model
We consider K = 10 organisations (“clients”) jointly training one detector by synchronous FedAvg-style rounds, coordinated by an honest-but-curious server that follows the protocol but may inspect anything it receives. Because raw data never leaves a client, the primary privacy surface is the sequence of model updates a client emits.
Privacy semantics. Privacy is enforced by client-side, example-level DP-SGD [4]: each client clips per-example gradients to an ℓ₂ norm C and adds Gaussian noise during its local training; server aggregation is left unmodified. We are deliberately precise about what this does and does not guarantee. It is not Local DP in the randomized-response sense (we do not randomise individual reports), and it is not central-DP over the union of all data, because without secure aggregation the server observes each client’s individual (noised) update. The guarantee we account and report is therefore per-client, example-level (ε,δ)-DP over that client’s participation [21,22]. We compose the privacy loss over all rounds × local steps a client takes (not a single round) using the Rényi-DP (RDP) accountant [23] as implemented in Opacus [24], selecting the noise multiplier σ by binary search on a wide range of RDP orders for the client’s exact step count. Throughout we report achieved ε from the accountant, never the target; across every DP cell in the study the achieved ε equals the target to three decimals. We fix δ = 10⁻⁵.
Adversary. For RQ3 up to f of the K clients are Byzantine and may submit poisoned updates. We consider two adversary strengths: a data-poisoning label-flip (an attacker relabels a fraction of its attack samples as benign) and a model-poisoning scaling attack (an attacker returns an update boosted far beyond the honest scale, an outlier designed to dominate the mean). The server does not know which clients are honest.
4. Materials and Methods
The protocol is designed to be a reusable benchmark: every cell is a seeded JSON config, every run emits its metrics and attribution tensors, and every deviation from the pre-registered plan is logged (D1–D17, including the pre-registered control and ablation rules D15–D17). We summarise the design here; exact hyperparameters are in Table 2.
4.1. Datasets and Preprocessing
Primary — ToN_IoT network flows [25], the widely-used UNSW IoT/IIoT telemetry corpus. The full processed capture (~22.3M flows) is heavily attack-dominated (only ~3.6% benign), which would make binary detection degenerate and macro-F1 hostage to two ultra-rare classes. We therefore construct a frozen, seeded, class-balanced study set — benign capped at 150k, each attack class at 45k, rare classes kept in full — of 512,170 rows over 10 classes (benign + backdoor, ddos, dos, injection, mitm, password, ransomware, scanning, xss). This is undersampling, not oversampling, and is documented; it aligns the setup with the balanced ToN_IoT “Train/Test” subset used by our bridge work [10]. We drop identifiers (IPs, ports, timestamps) and high-cardinality free-text (URIs, SSL subjects, DNS queries); 11 numeric flow features are median-imputed, log1p-transformed and standardised (statistics fit on train only), and 17 low-cardinality categoricals are one-hot encoded with a per-column cap of 32, giving D = 101 features.
Replication — CICIDS2017 [26]. We use the original release (noting the WTMC-2021 corrected version [27], which we recommend for a camera-ready), consolidate the 15 labels to 7 classes (merging the four DoS sub-types, the two Patators into BruteForce, and the three web attacks into WebAttack; dropping the ultra-rare Heartbleed and Infiltration), drop the destination-port identifier and coerce infinities, and apply signed-log1p (sign(x)·log1p|x|, which tolerates the negative flow features CICIDS contains) followed by standardisation to 77 numeric features — 237,981 rows.
For both datasets a global stratified test set is held out before any client splitting (test is never federated), preprocessing statistics are fit on train only, and explanations are computed on a fixed set of 2,000 stratified test samples whose indices are saved once. Federated splits use K = 10 clients under three regimes: IID (uniform random) and Dirichlet-over-labels with α ∈ {0.5, 0.1}, the latter giving strong non-IID skew.
4.2. Models
Two architectures let us test whether findings are model-specific. M1 is a DP-friendly MLP [D→256→128→64→out] with ReLU, dropout 0.2 and GroupNorm — deliberately not BatchNorm, whose cross-sample statistics are incompatible with per-sample-gradient DP-SGD; using GroupNorm keeps the architecture byte-identical across DP and non-DP regimes (68,810 parameters). M2 is a compact tabular transformer in the FT-Transformer family [28] (cf. attentive tabular models such as TabNet [29]): a per-feature tokenizer implemented as a grouped 1×1 convolution (each scalar feature → a d=64 token), two pre-norm encoder blocks (4 heads, LayerNorm, GELU MLP) [30], mean-pooling over feature tokens and a linear head (113,674 parameters). We implement self-attention from Linear layers rather than the fused nn.MultiheadAttention so that (a) every parameter-bearing layer is Opacus-supported and M2 is DP-trainable, and (b) the per-block attention maps are exposed for rollout.
4.3. Training Regimes, Privacy Accounting, and Aggregation
Regimes are central (pooled training, the non-federated reference) and federated (K=10, one local epoch E=1, R=100 rounds for M1 / 150 for M2, 100% participation). The optimiser is SGD with momentum 0.9 throughout — we exclude Adam so that the DP and non-DP cells differ only in the DP mechanism — with batch size 256. The learning rate is frozen after a dedicated tuning phase: M1 = 0.1 for federated cells, but 0.05 for central (pooled full-batch-style SGD is unstable at 0.1, collapsing one class), and M2 = 0.01 (the transformer diverges to NaN at 0.1 under SGD). DP-SGD uses per-sample clipping C = 1.0, frozen after a calibration run. Aggregation rules for RQ3 are FedAvg (sample-weighted mean), coordinate-wise median, trimmed-mean (20% trimmed each tail), and multi-Krum (select the m = K−f−2 clients whose updates are mutually closest, then average; f = 2). Attacks are the weak label-flip (attack→benign on 50% of an attacker’s attack samples) and the strong scaling attack (global + 10×(honest update)), each with f ∈ {0, 2} attackers occupying fixed client slots.
4.4. Attributions and Faithfulness Metrics
We compute three attributions on the server-side global model over the 2,000 fixed test samples, attributing to each sample’s predicted class: Integrated Gradients (IG) [31] (50 steps, feature-median baseline), GradientSHAP [32] (a fixed 100-sample stratified background), and attention rollout [33] (M2 only; per block we average heads, add the identity for the residual, row-normalise, and multiply across blocks, then read the mean attention received by each feature). All attributions are computed in batches with IG’s internal_batch_size bounded, so the step/sample expansion never exhausts memory on the transformer.
Let f(x) be the model’s predicted-class probability and x∖S the input with feature set S masked to its per-feature train median (the tabular analogue of token deletion). We report, for k ∈ {5, 10, 20%}:
Comprehensiveness: comp_k(x) = f(x) − f(x ∖ top-k) — masking the k most important features should drop the prediction; higher is better.
Sufficiency: suff_k(x) = f(x) − f(keep only top-k) — the top-k alone should suffice; lower is better.
AOPC MoRF/LeRF: over L = 20 removal steps, the mean probability drop when features are removed Most- or Least-Relevant-First [14]; we summarise a run by the gap = AOPC_MoRF − AOPC_LeRF, which is large exactly when the attribution’s ranking is discriminative (important features matter more than unimportant ones), i.e. when the explanation is faithful.
Top-k stability: the mean pairwise Jaccard of the top-10 feature sets across the three seeds of a cell — an explanation should not swing wildly with training randomness.
Rank drift: the per-sample Spearman ρ between a model’s attribution ranking and that of the central no-DP reference, averaged; we treat divergence from central as drift, complementary to (not the same as) unfaithfulness.
4.5. Statistical Protocol
For each comparison we pair the 2,000 fixed samples between the two conditions of the same seed and compute a paired Wilcoxon signed-rank [34] p-value and Cliff’s δ [35] dominance (δ = mean sign of the paired difference; |δ| < 0.147 negligible, < 0.33 small, < 0.474 medium, else large). Because the three seeds — not the 2,000 non-independent samples — are the true experimental units, we report δ as mean ± std over seeds and the number of seeds whose paired test survives Holm [36] correction across the metric family {comprehensiveness, sufficiency, gap}; we make no powered frequentist claim from n = 3 and let effect sizes carry the argument. All code, seeds, configs and per-run artifacts are released for exact reproduction.
5. Results
5.1. RQ1 — DP Degrades Utility, not Faithfulness (Figure 1)
Utility falls monotonically with the privacy budget across every regime (Table 3): FL-IID macro-F1 drops from 0.909 (no-DP) to 0.776 (ε=1), and the central reference from 0.898 to 0.808. Faithfulness moves in the opposite direction. The AOPC gap rises under DP (Table 4) — for the central model from 0.417 (no-DP) to 0.58–0.67 (DP) — and the paired tests make this precise: comprehensiveness shows a large, significant increase under DP (Cliff’s δ = −0.65…−0.79, significant in 3/3 seeds; recall δ < 0 means the no-DP condition is dominated, i.e. DP raises the metric), an effect that attenuates toward the strongest budget (Table 5). This is not a subtle null-of-no-effect: it is a significant effect in the direction opposite to the anchor hypothesis.
Figure 2.
AOPC MoRF/LeRF curves (FL-Dir(0.1), M1, IG). Solid = Most-Relevant-First, dashed = Least-Relevant-First. The MoRF−LeRF separation widens under ε=1, driven by a lower LeRF floor rather than a higher MoRF ceiling.
Figure 2.
AOPC MoRF/LeRF curves (FL-Dir(0.1), M1, IG). Solid = Most-Relevant-First, dashed = Least-Relevant-First. The MoRF−LeRF separation widens under ε=1, driven by a lower LeRF floor rather than a higher MoRF ceiling.
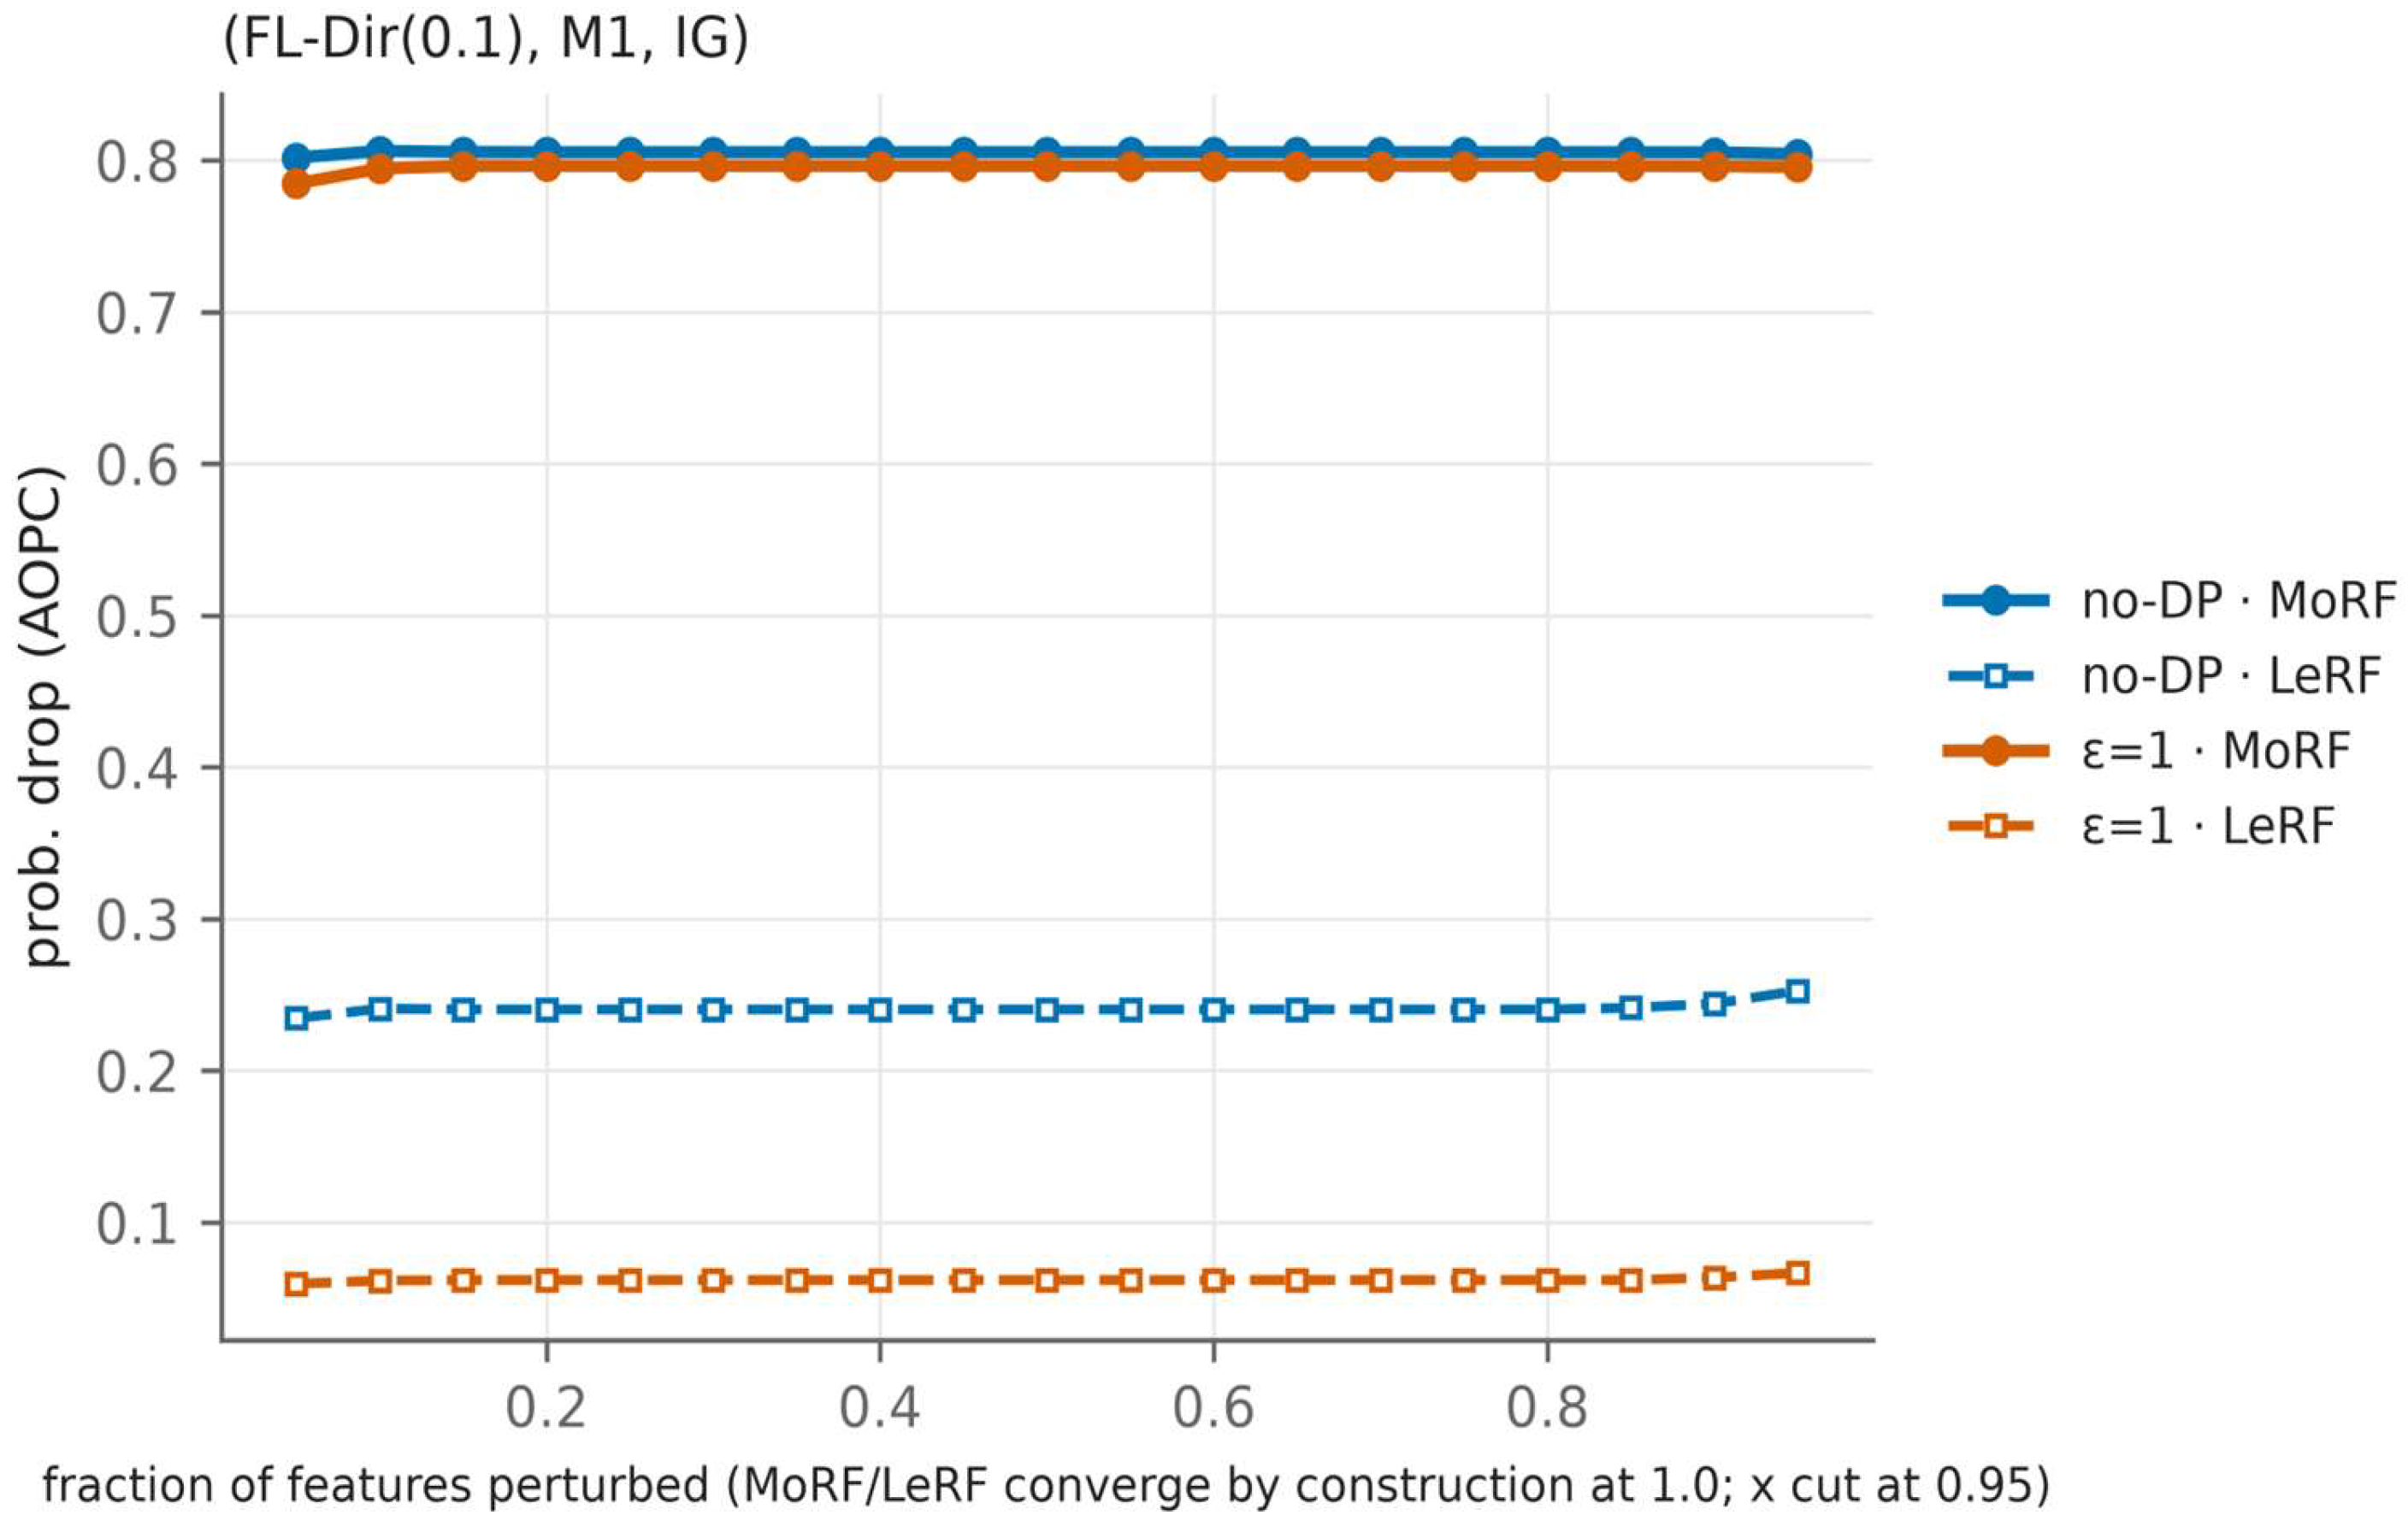
Ruling out a confidence artifact. One might worry that comprehensiveness rises simply because DP models are more confident, giving f(x) a higher ceiling to fall from. They are indeed more confident on the explanation set (mean predicted probability rises from 0.933 to 0.99 for central). We therefore re-ran the tests on f0-normalised metrics, dividing each per-sample drop by that sample’s f(x). Normalisation shrinks the comprehensiveness effect by ~30–40% but leaves it clearly negative, and the AOPC gap survives almost intact (central ε=8: −0.577 → −0.427). The conclusion is robust to the confound: DP does not merely inflate a probability ceiling, it yields explanations that remain genuinely faithful — indeed slightly more discriminative — with respect to the model. Mechanistically (§5.7, §6), the gain is largely a reduced-utility effect — reproduced by non-DP models matched to the same accuracy — whose DP-specific remainder an ablation isolates to per-sample gradient clipping (not the privacy noise) acting as a regulariser, producing a simpler, more feature-concentrated model that its post-hoc explanations track well.
5.2. RQ2 — Heterogeneity Amplifies the Utility Cost and Dominates Attribution Drift (Figure 3)
Non-IID data lowers the utility baseline and inflates its variance — FL-Dir(0.1) reaches only 0.684 macro-F1 with no DP, versus 0.909 for FL-IID (Table 3) — and DP compounds the loss. For explanations, however, the dominant source of change is federation and heterogeneity, not DP. Measured as Spearman rank drift from the central reference, DP adds only ~0.03–0.05 beyond what federation already introduces, and cross-seed top-10 Jaccard stability is essentially flat across ε (≈0.75 for FL-IID at every budget; Figure 3). There is, however, a genuine boundary condition: under extreme non-IID (Dirichlet α = 0.1) combined with strong DP, a few metrics turn mildly against faithfulness — Cliff’s δ flips positive for attention rollout on M2 FL-Dir(0.1) (+0.15/+0.18) and for IG on CICIDS FL-Dir(0.1) at ε=1 (+0.275). This is the one corner of the design where the null weakens, and we flag it as such rather than smoothing it over. Figure 4 makes the composition of the ranking concrete: the Central no-DP model concentrates its attribution mass on a handful of volumetric flow features, and only two of the top-10 (duration, conn_state_SF) leave the top-10 under ε=1.
5.3. The Real Cost — Rare-Attack Detection, Decoupled from Faithfulness (Figure 5)
The sharpest harm DP inflicts is on rare attacks. The mitm class — only ~1,000 instances in the entire corpus, of which 210 fall in the held-out test set — sees its F1 collapse from 0.65 (no-DP) to 0.05 (central) and to 0.00 in federated cells, because DP-SGD’s noise floor swamps the tiny gradient signal a rare class contributes. This utility result is measured on all 210 test flows and is solid.
Utility and faithfulness nonetheless decouple at the per-class level (Table 6, Figure 5), and it is worth being precise about which classes carry that claim. The clearest evidence comes from classes with ample support: dos (n = 525 in the explanation set) holds its utility almost exactly (F1 0.97 → 0.95) while its explanation gap rises from 0.01 to 0.62, and ddos, injection and xss behave the same way. The decoupling is therefore not a story about one collapsing class; it is the general pattern that the AOPC gap moves independently of, and often opposite to, per-class F1.
We deliberately do not rest the claim on mitm. Proportional stratification puts only 4 mitm samples in the 2,000-sample explanation set, so its gap movement (0.07 → 0.38) is illustrative and carries no statistical weight; we report it for completeness and interpret nothing from it. The rare-class utility collapse and the rare-class faithfulness behaviour are on entirely different evidential footings, and we treat them that way. Section 7 records a class-floored explanation set as the robustness check that would put the rare-class faithfulness question on a testable basis.
We report the full per-class picture rather than the favourable subset, and it is not uniform: nine of the ten classes end at ε=1 with a wider gap than at no-DP, but scanning ends narrower (0.23 → 0.17), and four classes (ddos, normal, password, mitm) peak at ε=8 and then decline monotonically as the budget tightens. The aggregate direction is therefore an increase, but it is a non-monotone increase with one genuine per-class exception.
Class-floored robustness check. To put the rare-class faithfulness question on a testable footing — rather than resting it on 4 mitm samples — we rebuilt the explanation set with a floor of 50 samples per class, frozen and seeded identically, which lifts mitm from 4 to 50 samples (and, on CICIDS2017, Bot from 17 and WebAttack from 18 to 50 each). On this powered set the rare-class result is unambiguous and agrees with the aggregate: mitm’s gap rises from 0.23 (no-DP) to 0.55–0.69 under DP — the same direction as the well-supported classes — so DP does not degrade rare-class faithfulness once the estimate is adequately powered; the earlier caveat reflected sampling, not a real rare-class exception. The one genuine counter-trend survives the re-powering: scanning still ends below its no-DP gap at ε=1 (0.21 → 0.09), confirming it as a real per-class exception rather than an artifact.
Central regime, all ten classes (IG AOPC gap and utility F1). Values are the mean over the three seeds and correspond to Figure 5. Gap columns are computed on the 2,000-sample explanation set, F1 columns on the full held-out test set; the two therefore rest on different support. The mitm gap is based on 4 explanation samples and is reported for
5.4. RQ3 — Robust Aggregation Preserves Utility AND Faithfulness Under Attack (Figure 6)
Under the weak label-flip attack no aggregation rule is stressed on the utility side: two malicious clients out of ten, each mislabelling half of their attacks, are simply out-voted by the honest majority, and even FedAvg loses only 0.047 macro-F1. The explanation side is not equally untouched — FedAvg’s faithfulness gap falls from 0.58 to 0.49 under label-flip (Figure 6b), a cost roughly twice its utility cost in relative terms. Even a weak attack that a SOC would not notice in its detection metrics is therefore already visible in its explanations, which is an argument for monitoring faithfulness as an operational signal in its own right. The strong model-poisoning attack tells a very different story (Table 7). Two clients returning an update scaled by 10× produce outliers that dominate the FedAvg mean: FedAvg collapses in both utility (0.83 → 0.20) and explanation faithfulness (gap 0.58 → 0.21) — a broken model produces broken explanations — with large seed-to-seed variance as some runs are destroyed entirely — the ±1 std interval on the poisoned FedAvg gap extends below zero (Figure 6b), meaning that in at least one seed the attribution ranking is not merely uninformative but inverted, with the features it ranks as most important mattering less to the model than those it ranks as least important. Per-seed values are given in the supplementary material. Median, trimmed-mean and multi-Krum, which reject or down-weight outliers by construction, preserve both (utility ≈ 0.89, gap ≈ 0.4–0.55). Two further observations complete the RQ3 picture. First, robustness is not free of explanation cost: without any attack, median and multi-Krum reduce the faithfulness gap relative to FedAvg by 0.10–0.13, because discarding honest updates also discards signal, whereas trimmed-mean’s cost is negligible. Second, DP degrades robustness: under ε=4 the median rule loses the most under attack, as privacy noise blurs the very outliers robust rules must detect. The combined message is operational — for federated IDS that must be both robust and explainable, trimmed-mean is the best all-round trade-off.
5.5. RQ4 — Attribution Methods are Differentially Fragile
Methods are not interchangeable under DP. On the transformer, the pooled AOPC gap across regimes and seeds evolves (no-DP → ε=4 → ε=1) as attention 0.726 → 0.694 → 0.678 (a steady decline), IG 0.660 → 0.679 → 0.690, and GradientSHAP 0.485 → 0.569 → 0.569. Attention rollout is thus the most faithful method in the clear but the only one whose faithfulness significantly degrades under DP in the non-IID transformer setting (its Cliff’s δ turns positive, +0.15/+0.18), plausibly because DP noise perturbs the attention weights that rollout then compounds multiplicatively across layers [37,38]. Integrated Gradients and GradientSHAP remain robust (δ negative) across both architectures and both datasets. The practical takeaway for RQ4 is concrete: for explanation under DP-federated IDS, prefer gradient- or Shapley-based attributions over attention rollout.
Class-specific rollout: a faithfulness–discrimination trade-off. Vanilla rollout is class-agnostic by construction — the same feature map for every target class. To test whether that is a fixable limitation we implemented a gradient-weighted rollout [39] that weights each block’s attention by the positive gradient of the target-class logit before the rollout product, yielding a class-specific map. On the central M2 cells it recovers strong class-discrimination — 47–63% of the top-10 features change with the target class, versus 0% for vanilla — but at a real faithfulness cost: the AOPC gap falls by 20–30% (no-DP 0.71 → 0.57, ε=1 0.67 → 0.45). For this tabular transformer, class-specificity and faithfulness therefore trade off, and the class-agnostic rollout remains the most faithful M2 attribution — the opposite of the vision-transformer literature, where gradient weighting improves faithfulness [39]. This deepens rather than overturns RQ4: the class-agnosticism of the most-faithful M2 explainer is partly intrinsic. Under DP the trade-off sharpens (class-sensitivity rises to ~0.61 while the grad-rollout gap falls further).
5.6. Replication on CICIDS2017
Every qualitative finding replicates on the second dataset (Table 8). Utility falls with ε and is amplified by non-IID (FL-IID 0.973 → 0.808; FL-Dir(0.1) 0.932 → 0.728), while IG/GradientSHAP faithfulness does not degrade — the gap rises for FL-IID (0.545 → 0.745) and dips only mildly under the extreme-non-IID boundary. That the same picture holds across two datasets and two architectures is what turns a surprising single-dataset null into a claim with external validity.
5.7. The Faithfulness Gain is Largely a Reduced-Utility Effect, and its DP-Specific Remainder is Clipping-driven
The RQ1 result — DP raises the AOPC gap — invites an obvious confound: DP-SGD also lowers utility, and a lower-utility model might look more “faithful” for reasons unrelated to privacy. We test this with a pre-registered control (deviation log D15/D17). For each DP cell we throttle a non-DP model to the same macro-F1 by three independent mechanisms — early stopping (optimisation axis), width scaling (architecture) and stratified subsampling (data) — and ask whether the DP model’s gap exceeds what these utility-matched controls already produce. (Symmetric label noise, a fourth candidate, was excluded after measurement: on this highly-separable data even 60% label corruption leaves macro-F1 ≈ 0.90, so it never reaches the DP utility.)
Reducing utility by any of the three mechanisms raises the AOPC gap along a common trend (Figure 7): the faithfulness “gain” is, to first order, what any lower-utility model of this family exhibits. Fitting that trend and reading each DP cell’s residual from it (Table 9) localises the exception. In FL-IID at every budget, and in the central regime at the strongest noise (ε=1), the DP gap sits on the control trend (|residual| ≤ 0.03) — there the effect is fully explained by DP’s utility cost. A small DP-specific residual (+0.10–0.12) remains only in the central regime at the weaker budgets (ε=4, 8). Our pre-registered Cliff’s-δ rule (D15) returns “DP-specific” in every cell; because that paired-dominance statistic is deflated by the width control’s per-sample instability, we treat the mean-gap-versus-utility trend as the robust readout and report both, honestly, as pre-registered.
What produces the central residual? A clipping-versus-noise ablation (D16) answers cleanly. Running DP-SGD with per-sample clipping but zero noise (σ=0) reproduces 85–92% of the central gap increase — at essentially unchanged utility: clipping alone lifts the gap from 0.417 (no-DP) to 0.630 at macro-F1 0.898 (versus 0.898 with no DP), close to full DP’s 0.65, while the Gaussian noise contributes little and, at ε=1, slightly lowers the gap. The DP-specific part of the faithfulness gain is therefore gradient clipping acting as an implicit regulariser, not the privacy noise. The effect is regime-specific: in FL-IID the same clip-only ablation sits on the utility trend (macro-F1 0.877, gap 0.562, no above-trend jump), consistent with the FL-IID effect being utility-driven throughout — and mirroring the split in Table 9.
6. Discussion
A practical ε recommendation. The binding constraint on strong privacy in this setting is not explanation quality but rare-attack recall, which fails well before explanations do. Explanation faithfulness is intact even at ε = 1, and common-attack utility remains usable; what strong privacy sacrifices is the detection of scarce classes such as mitm. The deployment implication is therefore the reverse of the usual worry: practitioners can adopt strong DP for explainable federated IDS, provided they compensate for rare-class detection by other means — targeted oversampling, per-class decision thresholds, or cost-sensitive training — rather than by loosening the privacy budget. Weakening ε to “save” explanations would be a category error, because explanations were never the casualty.
Why the contrast with image and NLP. In perceptual domains an attribution is spread over a dense grid of pixels or a long sequence of tokens, and DP noise blurs that dense map, breaking spatial/semantic continuity [6]. Tabular flow decisions are different: they concentrate on a handful of volumetric features. Under no DP, the top ~5% of features already collapse the prediction (Figure 4 shows byte- and packet-count features dominating), and DP’s regularisation sharpens this concentration rather than diffusing it — a plausible mechanism for why the sign of the effect flips relative to images. Our control experiment (§5.7) turns this from conjecture into a measured claim: most of the gap increase is what any utility-matched non-DP model produces, and the ablation isolates the residual, DP-specific part to per-sample gradient clipping — an implicit regulariser — rather than the Gaussian noise, which images and text instead see as the disruptive component. The result is a reminder that XAI findings do not transfer across data modalities for free.
Trust under attack. RQ3 reframes robust aggregation as a requirement not only for accuracy but for trustworthy explanation under adversarial pressure. A poisoned FedAvg model’s attributions are as broken as its predictions; robust rules keep both intact. But the choice among robust rules is not neutral for explanations — median and Krum quietly cost faithfulness even with no attacker present — which is exactly the kind of trade-off an audit is meant to surface. Trimmed-mean dominates here.
Positioning. We do not claim to be the first to study DP × explanation faithfulness — Saifullah et al. [6] and NLP work precede us. Our claims are narrower and, we believe, defensible: the first such audit in federated, tabular IDS with formal accounting; the first study of robust-aggregation × faithfulness; and a domain-dependent, statistically-supported result that inverts the perceptual-domain intuition.
7. Limitations
Several boundaries qualify our conclusions. The privacy model is client-side DP-SGD without secure aggregation, not secure-aggregation central-DP, and results may differ under the latter. Masking-based faithfulness uses train-median substitution, whose semantics for tabular data differ from token deletion. We study two architectures and three seeds; effect sizes, not powered frequentist tests, carry the argument. Vanilla attention rollout is class-agnostic by construction; a gradient-weighted, class-specific variant (§5.5) recovers class-discrimination but at a 20–30% faithfulness cost, so for M2 the two properties trade off and the class-agnostic map remains the most faithful — a trade-off we quantify rather than a comparison we can make exact. The strong attack is one representative model-poisoning family; adaptive attackers that target robust rules directly are future work. CICIDS is the original rather than the WTMC-corrected release. Per-class faithfulness inherits the composition of the explanation set: proportional stratification of 2,000 test samples leaves the rarest class, mitm, with 4 samples, so no per-class faithfulness claim can be made for it and none is. Rare-class utility is unaffected by this, being computed on the full test set. We addressed the rare-class faithfulness question directly with a class-floored explanation set (≥50 samples per class, frozen identically; §5.3), which confirms that DP does not degrade rare-class faithfulness once the estimate is powered; that check inherits the same masking-based metric and single-corpus scope as the rest of the study.
8. Conclusions and Future Work
We audited explanation faithfulness under privacy and adversarial pressure in federated intrusion detection and found the widely-assumed privacy–explainability conflict largely absent in the tabular-network setting: differential privacy costs utility and — most sharply — rare-attack detection, but not explanation faithfulness, which it slightly sharpens; the two decouple at the per-class level. Byzantine-robust aggregation buys both accuracy and explanation robustness under a strong model-poisoning attack that destroys FedAvg, with trimmed-mean the best all-round trade-off, while attention rollout is the most DP-fragile attribution. These results hold across two datasets and two architectures with paired statistics and effect sizes. Future work includes adaptive, Shapley-guided noise allocation; secure-aggregation central-DP; stronger and adaptive poisoning; concept drift over time; and replication on the WTMC-corrected CICIDS and additional corpora.
Author Contributions
Please complete according to the CRediT taxonomy (e.g., conceptualization, methodology, software, validation, formal analysis, investigation, writing—original draft preparation, writing—review and editing). All authors have read and agreed to the published version of the manuscript.
Funding
This research received no external funding.
Data Availability Statement
Conflicts of Interest
The authors declare no conflicts of interest.
References
- McMahan, B.; Moore, E.; Ramage, D.; Hampson, S.; Agüera y Arcas, B. Communication-Efficient Learning of Deep Networks from Decentralized Data. AISTATS 2017, PMLR 54, 1273–1282. Available online: https://proceedings.mlr.press/v54/mcmahan17a.html.
- Kairouz, P.; McMahan, H.B.; Avent, B.; Bellet, A.; Bennis, M.; et al. Advances and Open Problems in Federated Learning. Found. Trends Mach. Learn. 2021, 14(1–2), 1–210. [Google Scholar] [CrossRef]
- Li, T.; Sahu, A.K.; Talwalkar, A.; Smith, V. Federated Learning: Challenges, Methods, and Future Directions. IEEE Signal Process. Mag. 2020, 37(3), 50–60. [Google Scholar] [CrossRef]
- Abadi, M.; Chu, A.; Goodfellow, I.; McMahan, H.B.; Mironov, I.; Talwar, K.; Zhang, L. Deep Learning with Differential Privacy. ACM CCS 2016, 308–318. [Google Scholar] [CrossRef]
- Dwork, C.; Roth, A. The Algorithmic Foundations of Differential Privacy. Found. Trends Theor. Comput. Sci. 2014, 9(3–4), 211–407. [Google Scholar] [CrossRef]
- Saifullah, S.; Mercier, D.; Lucieri, A.; Dengel, A.; Ahmed, S. The privacy–explainability trade-off: unraveling the impacts of differential privacy and federated learning on attribution methods. Front. Artif. Intell. 2024, 7, 1236947. [Google Scholar] [CrossRef] [PubMed]
- Jacovi, A.; Goldberg, Y. Towards Faithfully Interpretable NLP Systems: How Should We Define and Evaluate Faithfulness? ACL 2020, 4198–4205. [Google Scholar] [CrossRef]
- Kalakoti, R.; Nõmm, S.; Bahsi, H. Federated Learning of Explainable AI (FedXAI) for deep-learning-based intrusion detection in IoT networks. Comput. Netw. 2025, 270, 111479. [Google Scholar] [CrossRef]
- Ducange, P.; Marcelloni, F.; Miglionico, G.C.; Renda, A.; Ruffini, F. Federated SHAP: Privacy-Preserving and Consistent Post-hoc Explainability in Federated Learning. Mach. Learn. 2026, 115, 24. [Google Scholar] [CrossRef]
- Lazzarini, R.; Tianfield, H.; Charissis, V. Federated Learning for IoT Intrusion Detection. AI 2023, 4(3), 509–530. [Google Scholar] [CrossRef]
- Ribeiro, M.T.; Singh, S.; Guestrin, C. Why Should I Trust You?": Explaining the Predictions of Any Classifier. ACM SIGKDD 2016, 1135–1144. [Google Scholar] [CrossRef]
- Kalakoti, R.; Bahsi, H.; Nõmm, S. Explainable Federated Learning for Botnet Detection in IoT Networks. IEEE CSR 2024, 22–29. [Google Scholar] [CrossRef]
- DeYoung, J.; Jain, S.; Rajani, N.F.; Lehman, E.; Xiong, C.; Socher, R.; Wallace, B.C. ERASER: A Benchmark to Evaluate Rationalized NLP Models. ACL 2020, 4443–4458. [Google Scholar] [CrossRef]
- Samek, W.; Binder, A.; Montavon, G.; Lapuschkin, S.; Müller, K.-R. Evaluating the Visualization of What a Deep Neural Network Has Learned. IEEE TNNLS 2017, 28(11), 2660–2673. [Google Scholar] [CrossRef] [PubMed]
- Adebayo, J.; Gilmer, J.; Muelly, M.; Goodfellow, I.; Hardt, M.; Kim, B. Sanity Checks for Saliency Maps. NeurIPS 2018, 31, 9505–9515. [Google Scholar] [CrossRef]
- Yin, D.; Chen, Y.; Ramchandran, K.; Bartlett, P. Byzantine-Robust Distributed Learning: Towards Optimal Statistical Rates. ICML 2018, PMLR 80, 5650–5659. Available online: https://proceedings.mlr.press/v80/yin18a.html. [CrossRef]
- Blanchard, P.; El Mhamdi, E.M.; Guerraoui, R.; Stainer, J. Machine Learning with Adversaries: Byzantine Tolerant Gradient Descent. NeurIPS 2017, 30, 119–129. Available online: https://proceedings.neurips.cc/paper_files/paper/2017/hash/f4b9ec30ad9f68f89b29639786cb62ef-Abstract.html.
- Bagdasaryan, E.; Veit, A.; Hua, Y.; Estrin, D.; Shmatikov, V. How To Backdoor Federated Learning. AISTATS 2020, PMLR 108, 2938–2948. Available online: https://proceedings.mlr.press/v108/bagdasaryan20a.html.
- Fang, M.; Cao, X.; Jia, J.; Gong, N.Z. Local Model Poisoning Attacks to Byzantine-Robust Federated Learning. USENIX Secur. 2020, 1605–1622. Available online: https://www.usenix.org/conference/usenixsecurity20/presentation/fang.
- Bhagoji, A.N.; Chakraborty, S.; Mittal, P.; Calo, S. Analyzing Federated Learning through an Adversarial Lens. ICML 2019, PMLR 97, 634–643. Available online: https://proceedings.mlr.press/v97/bhagoji19a.html.
- Geyer, R.C.; Klein, T.; Nabi, M. Differentially Private Federated Learning: A Client Level Perspective. arXiv 2017, arXiv:1712.07557. [Google Scholar] [CrossRef]
- Naseri, M.; Hayes, J.; De Cristofaro, E. Local and Central Differential Privacy for Robustness and Privacy in Federated Learning. NDSS 2022. [Google Scholar] [CrossRef]
- Mironov, I. Rényi Differential Privacy. IEEE CSF 2017, 263–275. [Google Scholar] [CrossRef]
- Yousefpour, A.; Shilov, I.; Sablayrolles, A.; Testuggine, D.; Prasad, K.; Malek, M.; Nguyen, J.; Ghosh, S.; Bharadwaj, A.; Zhao, J.; et al. Opacus: User-Friendly Differential Privacy Library in PyTorch. arXiv 2021, arXiv:2109.12298. [Google Scholar] [CrossRef]
- Alsaedi, A.; Moustafa, N.; Tari, Z.; Mahmood, A.; Anwar, A. TON_IoT Telemetry Dataset: A New Generation Dataset of IoT and IIoT for Data-Driven Intrusion Detection Systems. IEEE Access 2020, 8, 165130–165150. [Google Scholar] [CrossRef]
- Sharafaldin, I.; Lashkari, A.H.; Ghorbani, A.A. Toward Generating a New Intrusion Detection Dataset and Intrusion Traffic Characterization. ICISSP 2018, 108–116. [Google Scholar] [CrossRef]
- Engelen, G.; Rimmer, V.; Joosen, W. Troubleshooting an Intrusion Detection Dataset: the CICIDS2017 Case Study. IEEE SPW 2021, 7–12. [Google Scholar] [CrossRef]
- Gorishniy, Y.; Rubachev, I.; Khrulkov, V.; Babenko, A. Revisiting Deep Learning Models for Tabular Data. NeurIPS 2021, 34, 18932–18943. [Google Scholar] [CrossRef]
- Arik, S.Ö.; Pfister, T. TabNet: Attentive Interpretable Tabular Learning. AAAI 2021, 35, 6679–6687. [Google Scholar] [CrossRef]
- Vaswani, A.; Shazeer, N.; Parmar, N.; Uszkoreit, J.; Jones, L.; Gomez, A.N.; Kaiser, Ł.; Polosukhin, I. Attention Is All You Need. NeurIPS 2017, 30, 5998–6008. [Google Scholar] [CrossRef]
- Sundararajan, M.; Taly, A.; Yan, Q. Axiomatic Attribution for Deep Networks. ICML 2017, PMLR 70, 3319–3328. [Google Scholar] [CrossRef]
- Lundberg, S.M.; Lee, S.-I. A Unified Approach to Interpreting Model Predictions. NeurIPS 2017, 30, 4765–4774. Available online: https://proceedings.neurips.cc/paper_files/paper/2017/hash/8a20a8621978632d76c43dfd28b67767-Abstract.html.
- Abnar, S.; Zuidema, W. Quantifying Attention Flow in Transformers. ACL 2020, 4190–4197. [Google Scholar] [CrossRef]
- Wilcoxon, F. Individual Comparisons by Ranking Methods. Biom. Bull. 1945, 1(6), 80–83. [Google Scholar] [CrossRef]
- Cliff, N. Dominance Statistics: Ordinal Analyses to Answer Ordinal Questions. Psychol. Bull. 1993, 114(3), 494–509. [Google Scholar] [CrossRef]
- Holm, S. A Simple Sequentially Rejective Multiple Test Procedure. Scand. J. Stat. 1979, 6(2), 65–70. Available online: https://www.jstor.org/stable/4615733.
- Jain, S.; Wallace, B.C. Attention is not Explanation. NAACL-HLT 2019, 3543–3556. [Google Scholar] [CrossRef]
- Wiegreffe, S.; Pinter, Y. Attention is not not Explanation. EMNLP-IJCNLP 2019, 11–20. [Google Scholar] [CrossRef]
- Chefer, H.; Gur, S.; Wolf, L. Transformer Interpretability Beyond Attention Visualization. IEEE/CVF CVPR 2021, 782–791. [Google Scholar] [CrossRef]
Figure 1.
Privacy–utility–faithfulness trade-off (ToN_IoT, M1, IG): (a) macro-F1, (b) comprehensiveness@10, (c) AOPC MoRF−LeRF gap, against the privacy budget for the four regimes. Shaded bands are ±1 std over the three seeds.
Figure 1.
Privacy–utility–faithfulness trade-off (ToN_IoT, M1, IG): (a) macro-F1, (b) comprehensiveness@10, (c) AOPC MoRF−LeRF gap, against the privacy budget for the four regimes. Shaded bands are ±1 std over the three seeds.
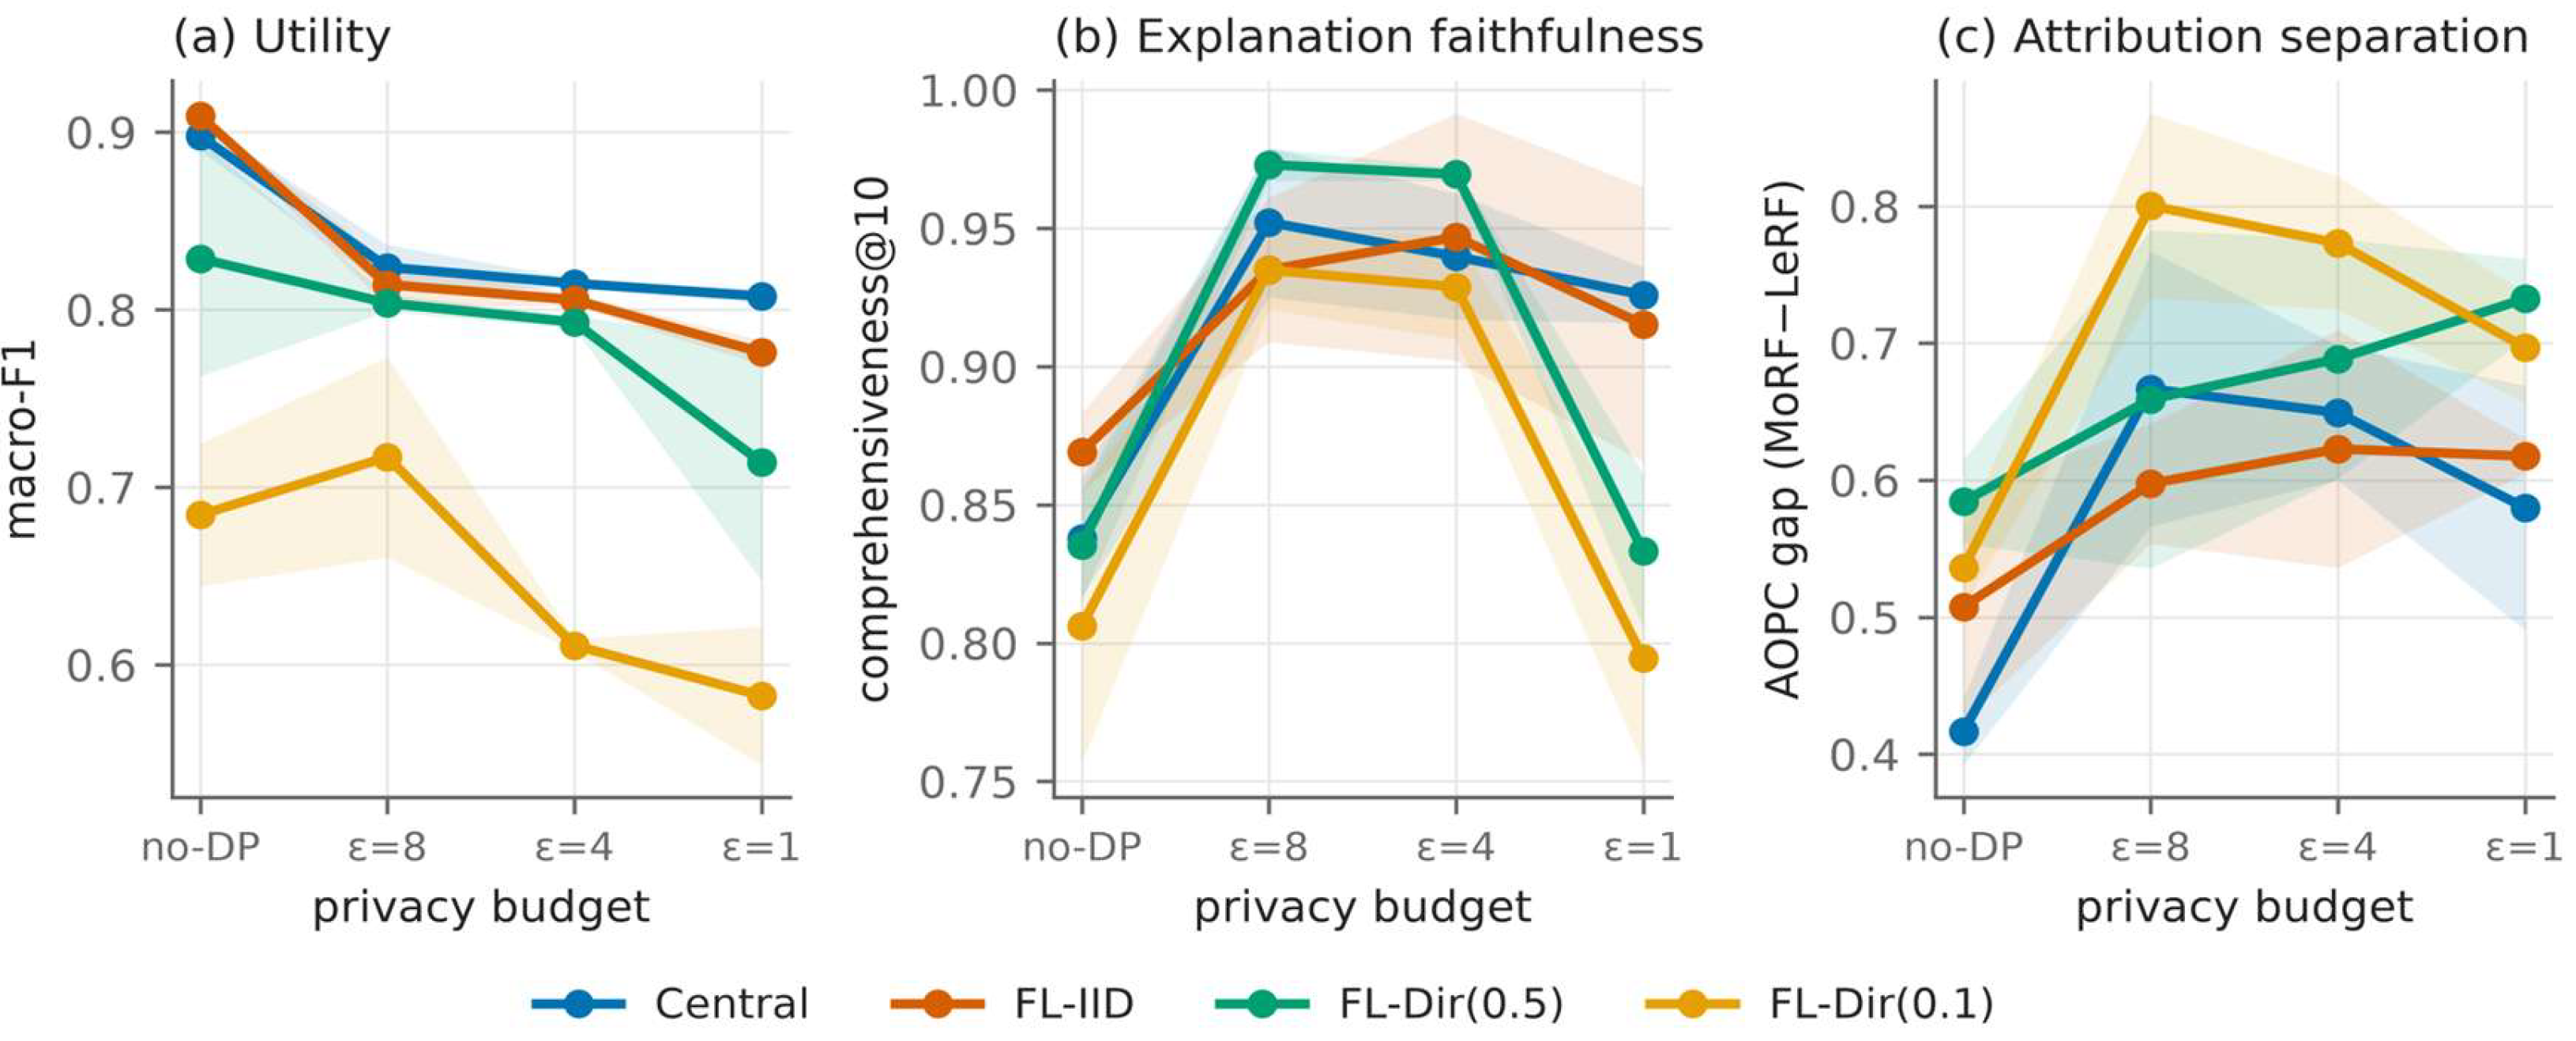
Figure 3.
Cross-seed top-10 Jaccard stability (regime × privacy budget; ToN_IoT, M1, IG).
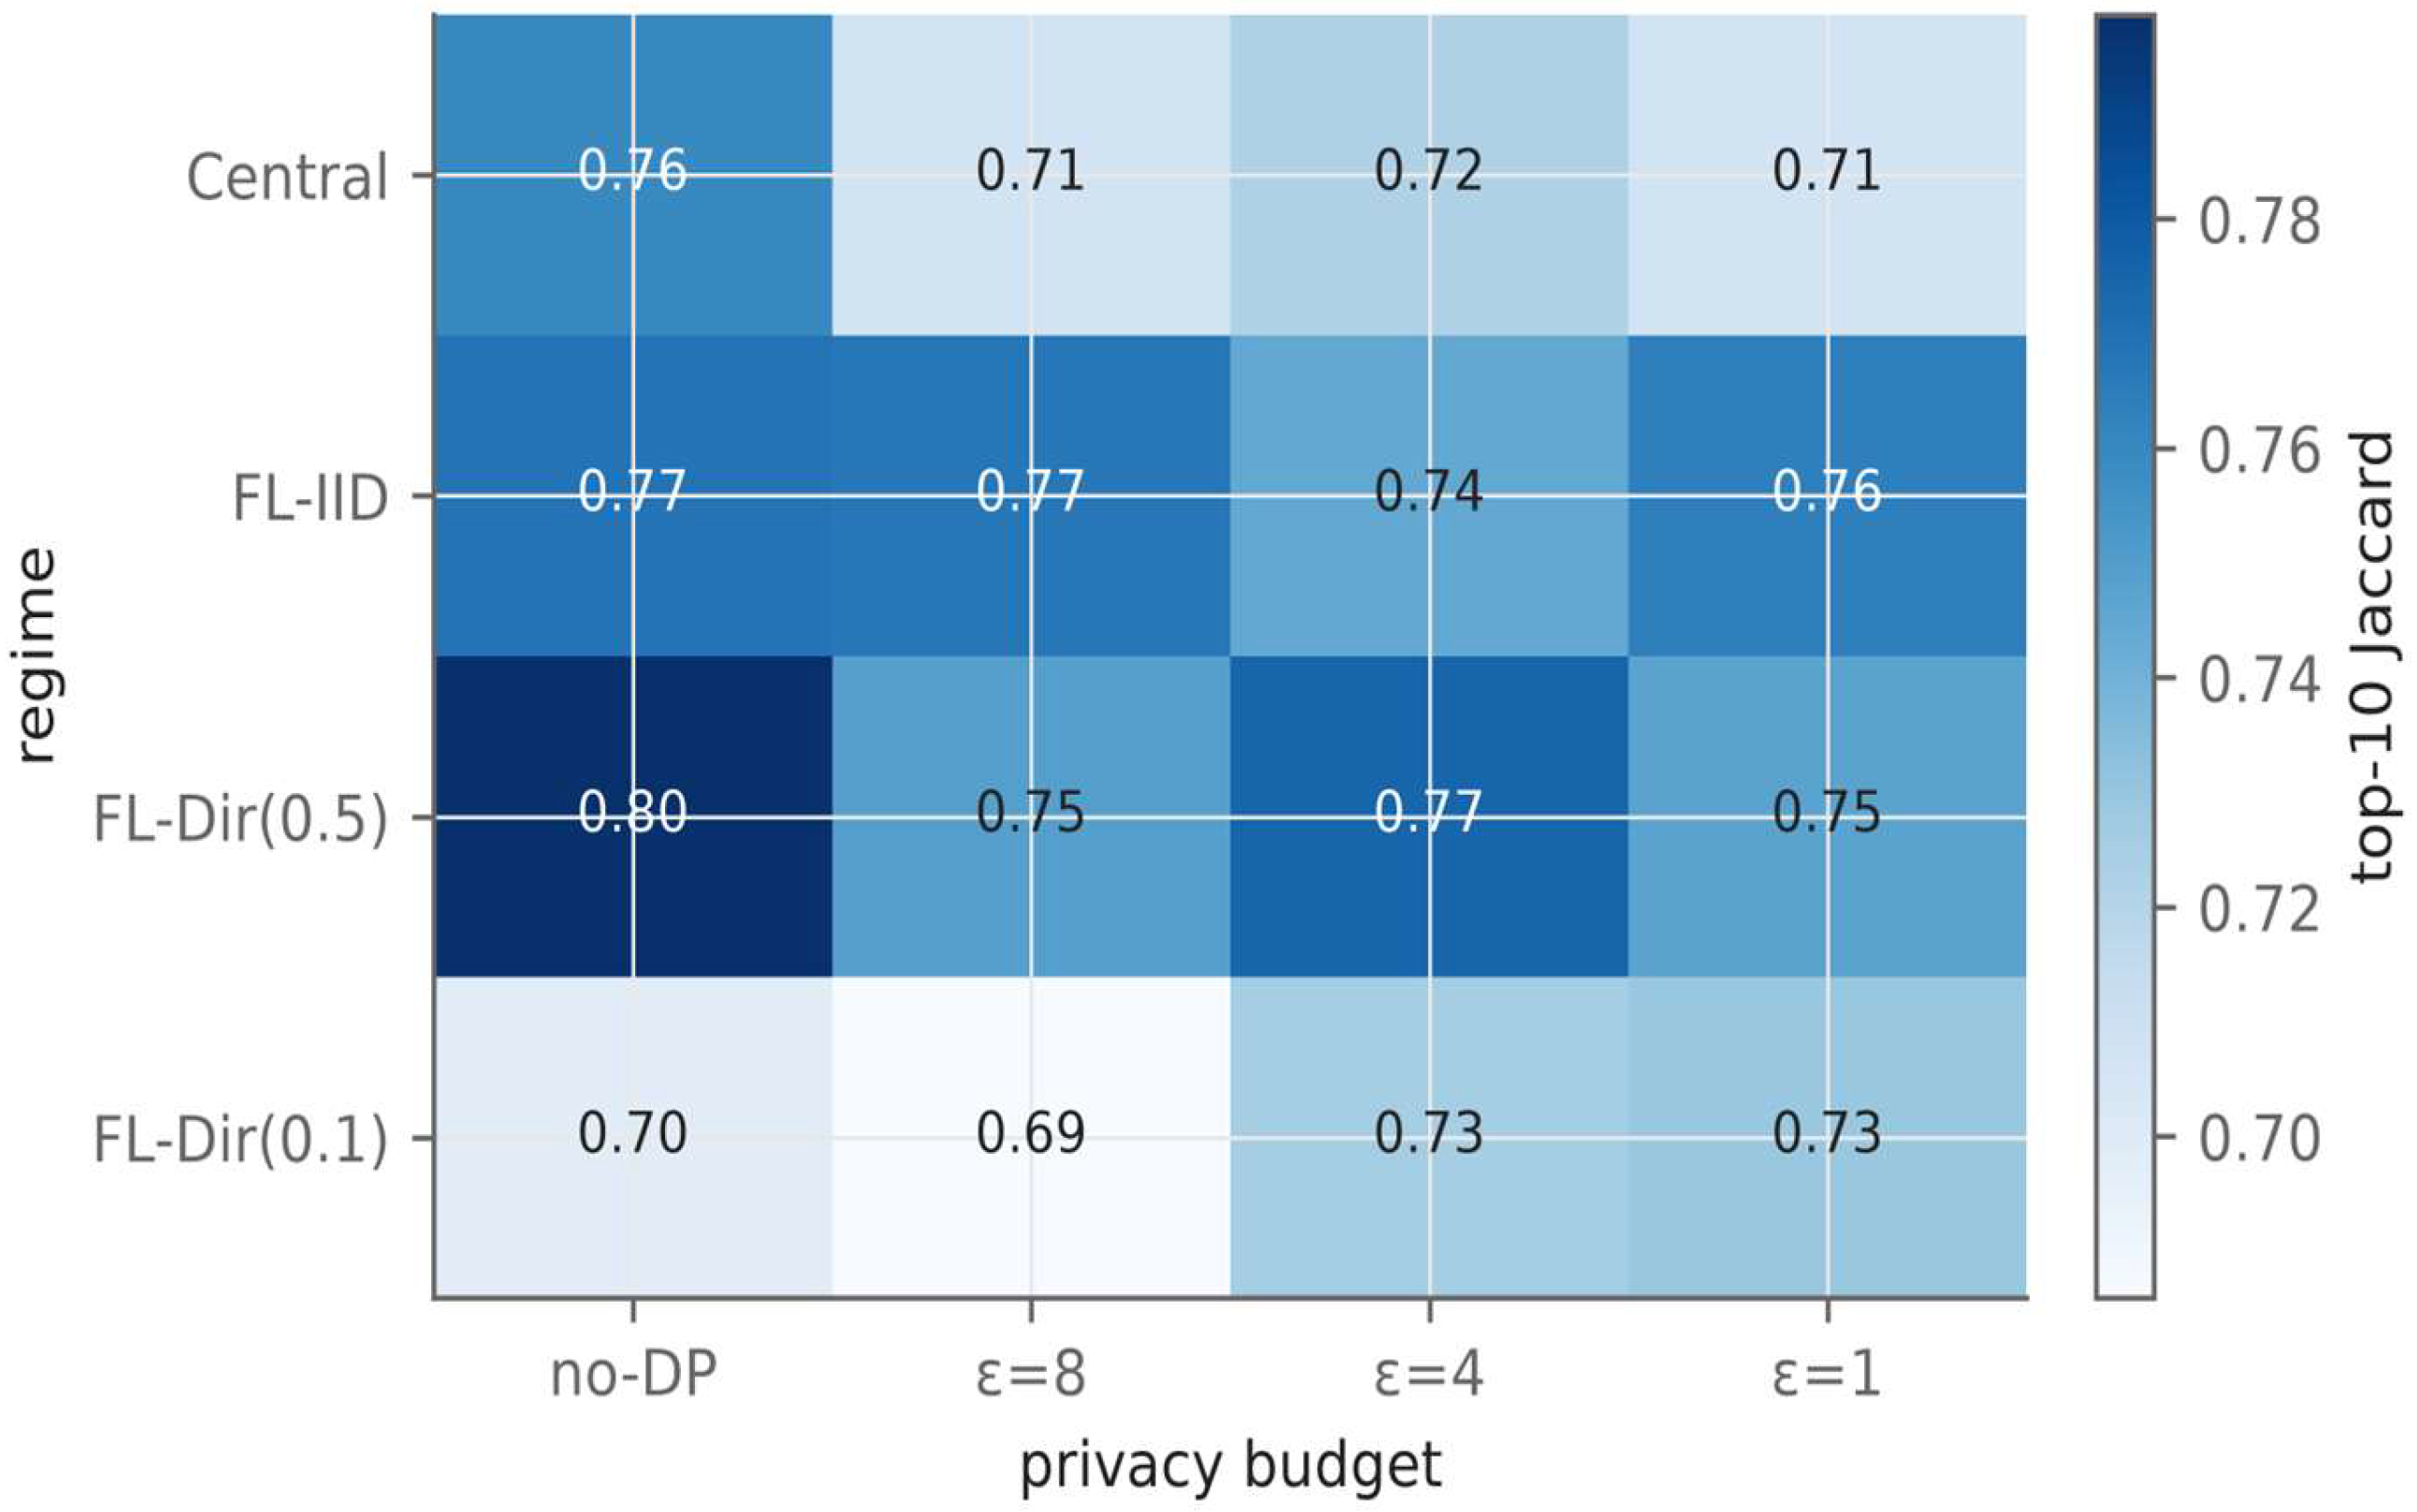
Figure 4.
Top-10 features of the Central no-DP model ranked by mean |IG| attribution (normalised). Features highlighted in orange leave the top-10 of the ε=1 model.
Figure 4.
Top-10 features of the Central no-DP model ranked by mean |IG| attribution (normalised). Features highlighted in orange leave the top-10 of the ε=1 model.
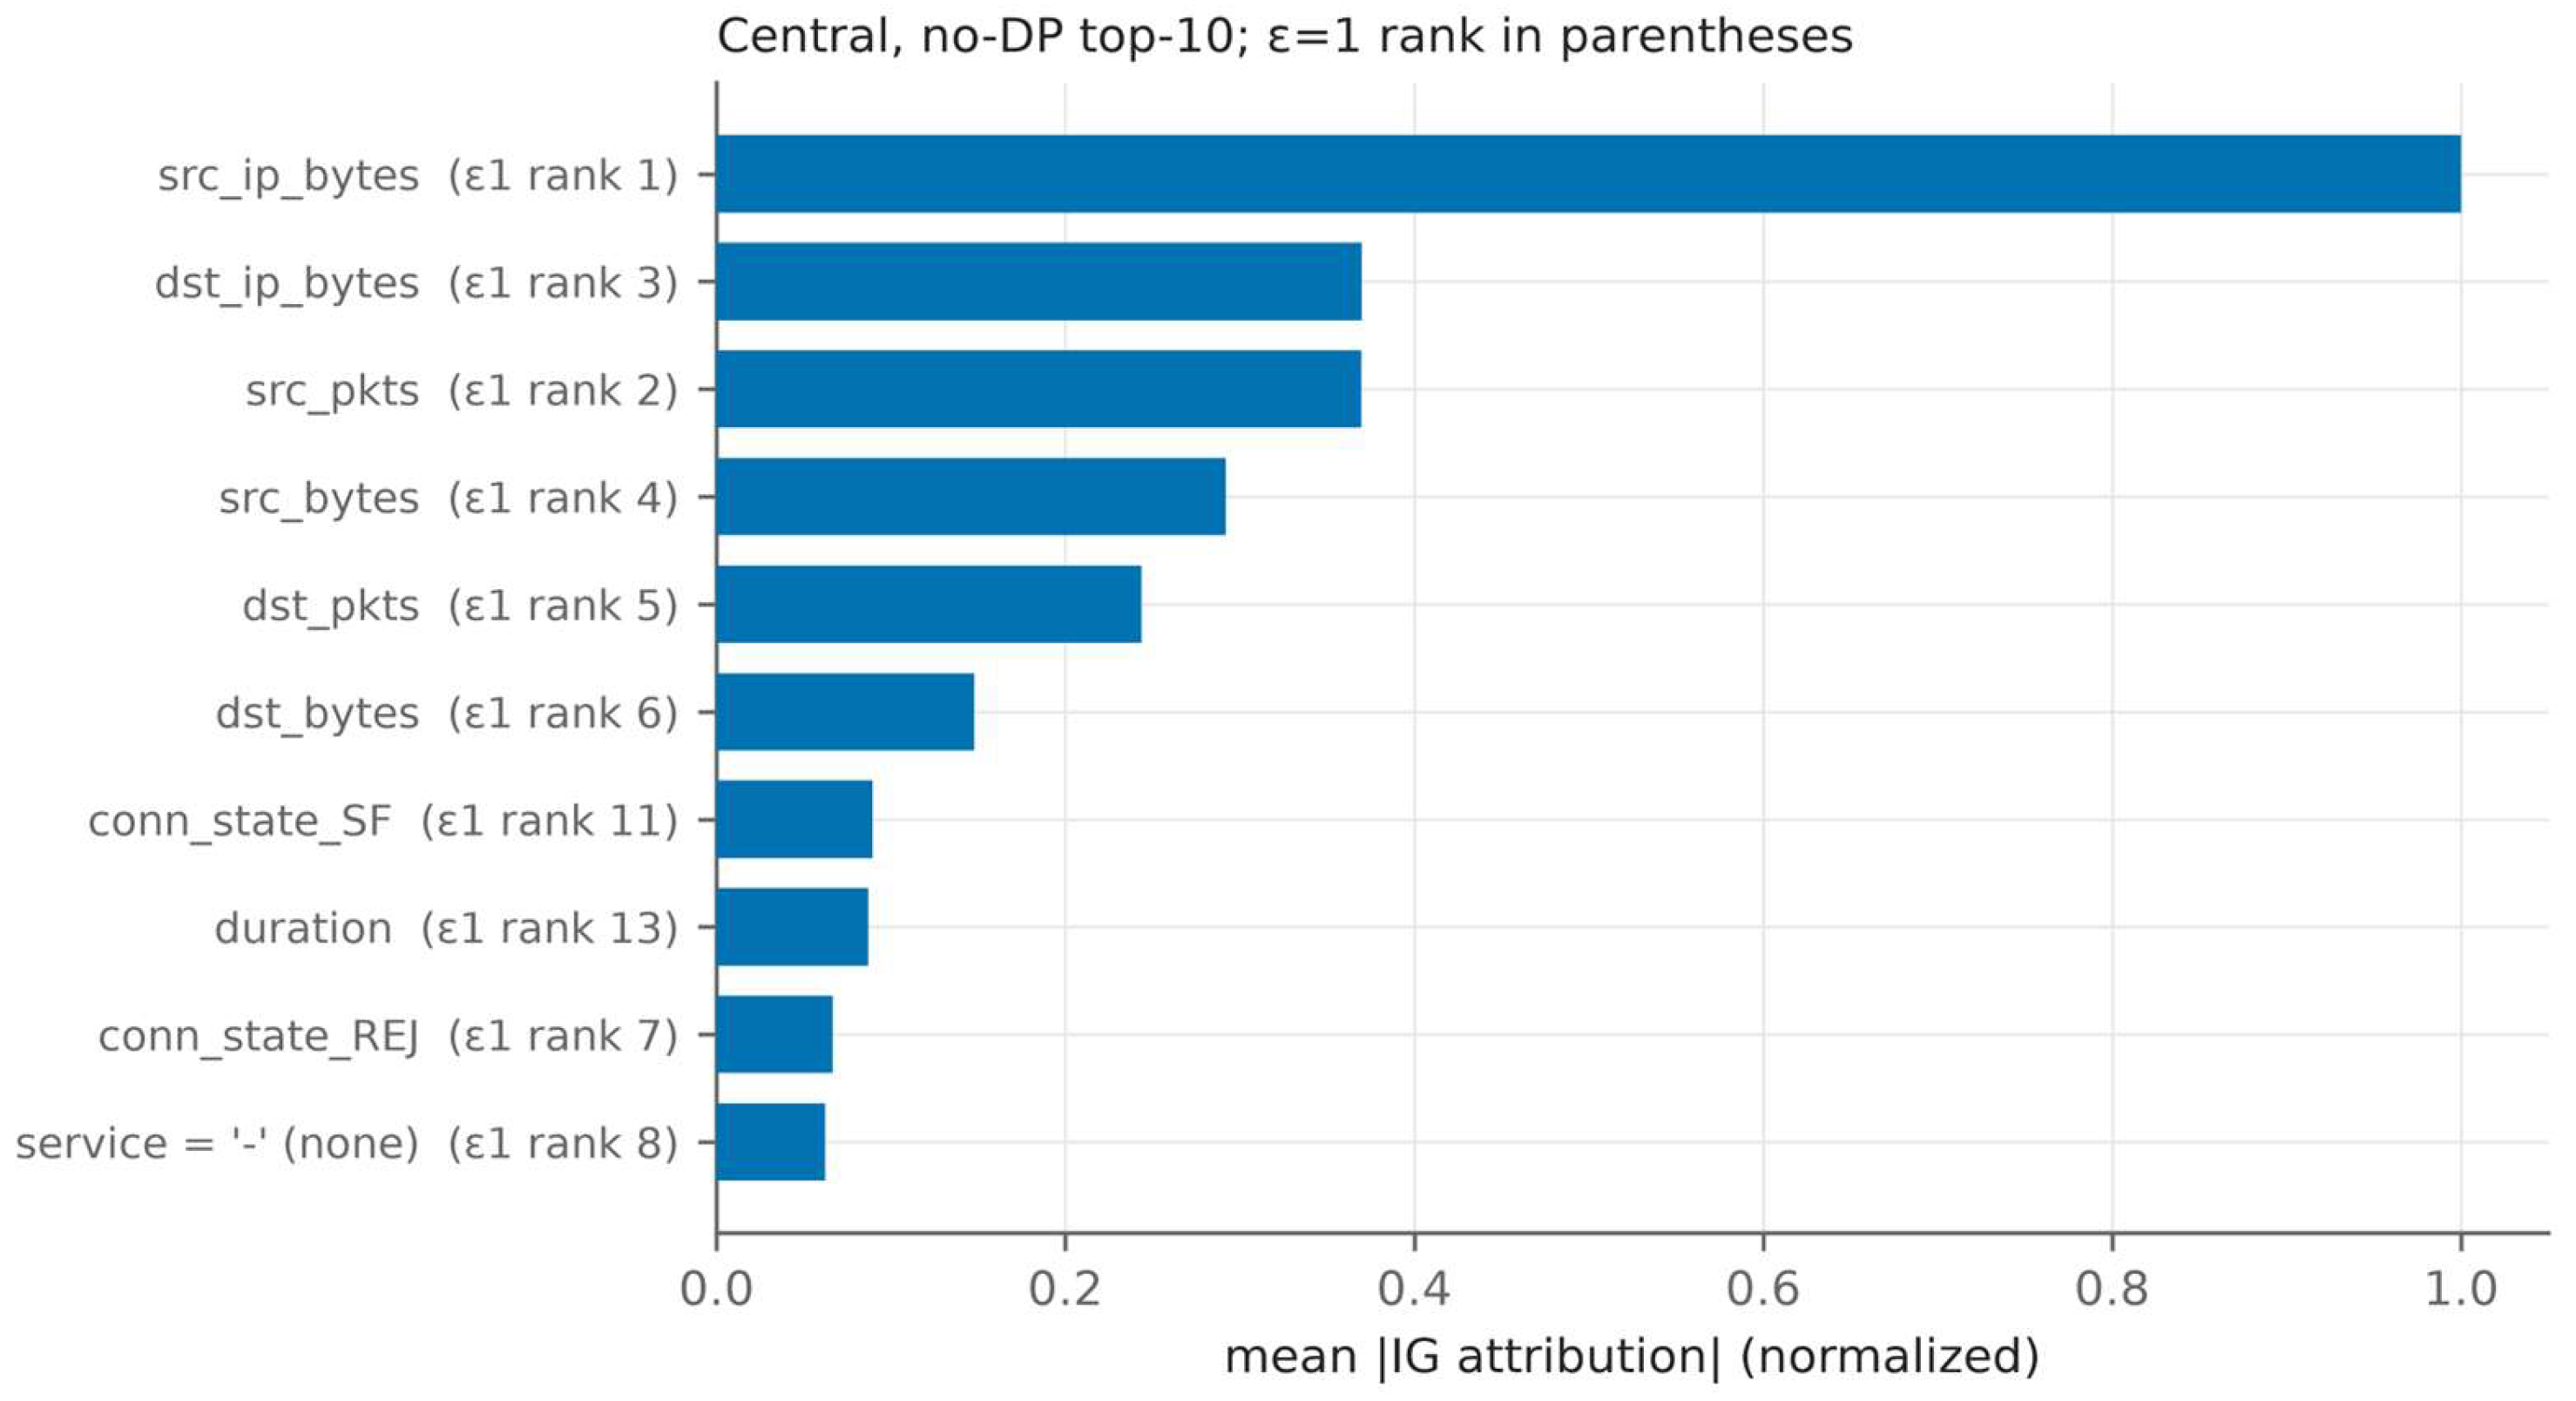
Figure 5.
Per-class utility versus faithfulness under DP (ToN_IoT, M1, Central): (a) per-class F1, (b) per-class AOPC gap. Utility and faithfulness move independently: well-supported classes such as dos and ddos hold their F1 while their gap widens. The mitm row of panel (b) rests on 4 explanation samples and should not be read as evidence.
Figure 5.
Per-class utility versus faithfulness under DP (ToN_IoT, M1, Central): (a) per-class F1, (b) per-class AOPC gap. Utility and faithfulness move independently: well-supported classes such as dos and ddos hold their F1 while their gap widens. The mitm row of panel (b) rests on 4 explanation samples and should not be read as evidence.
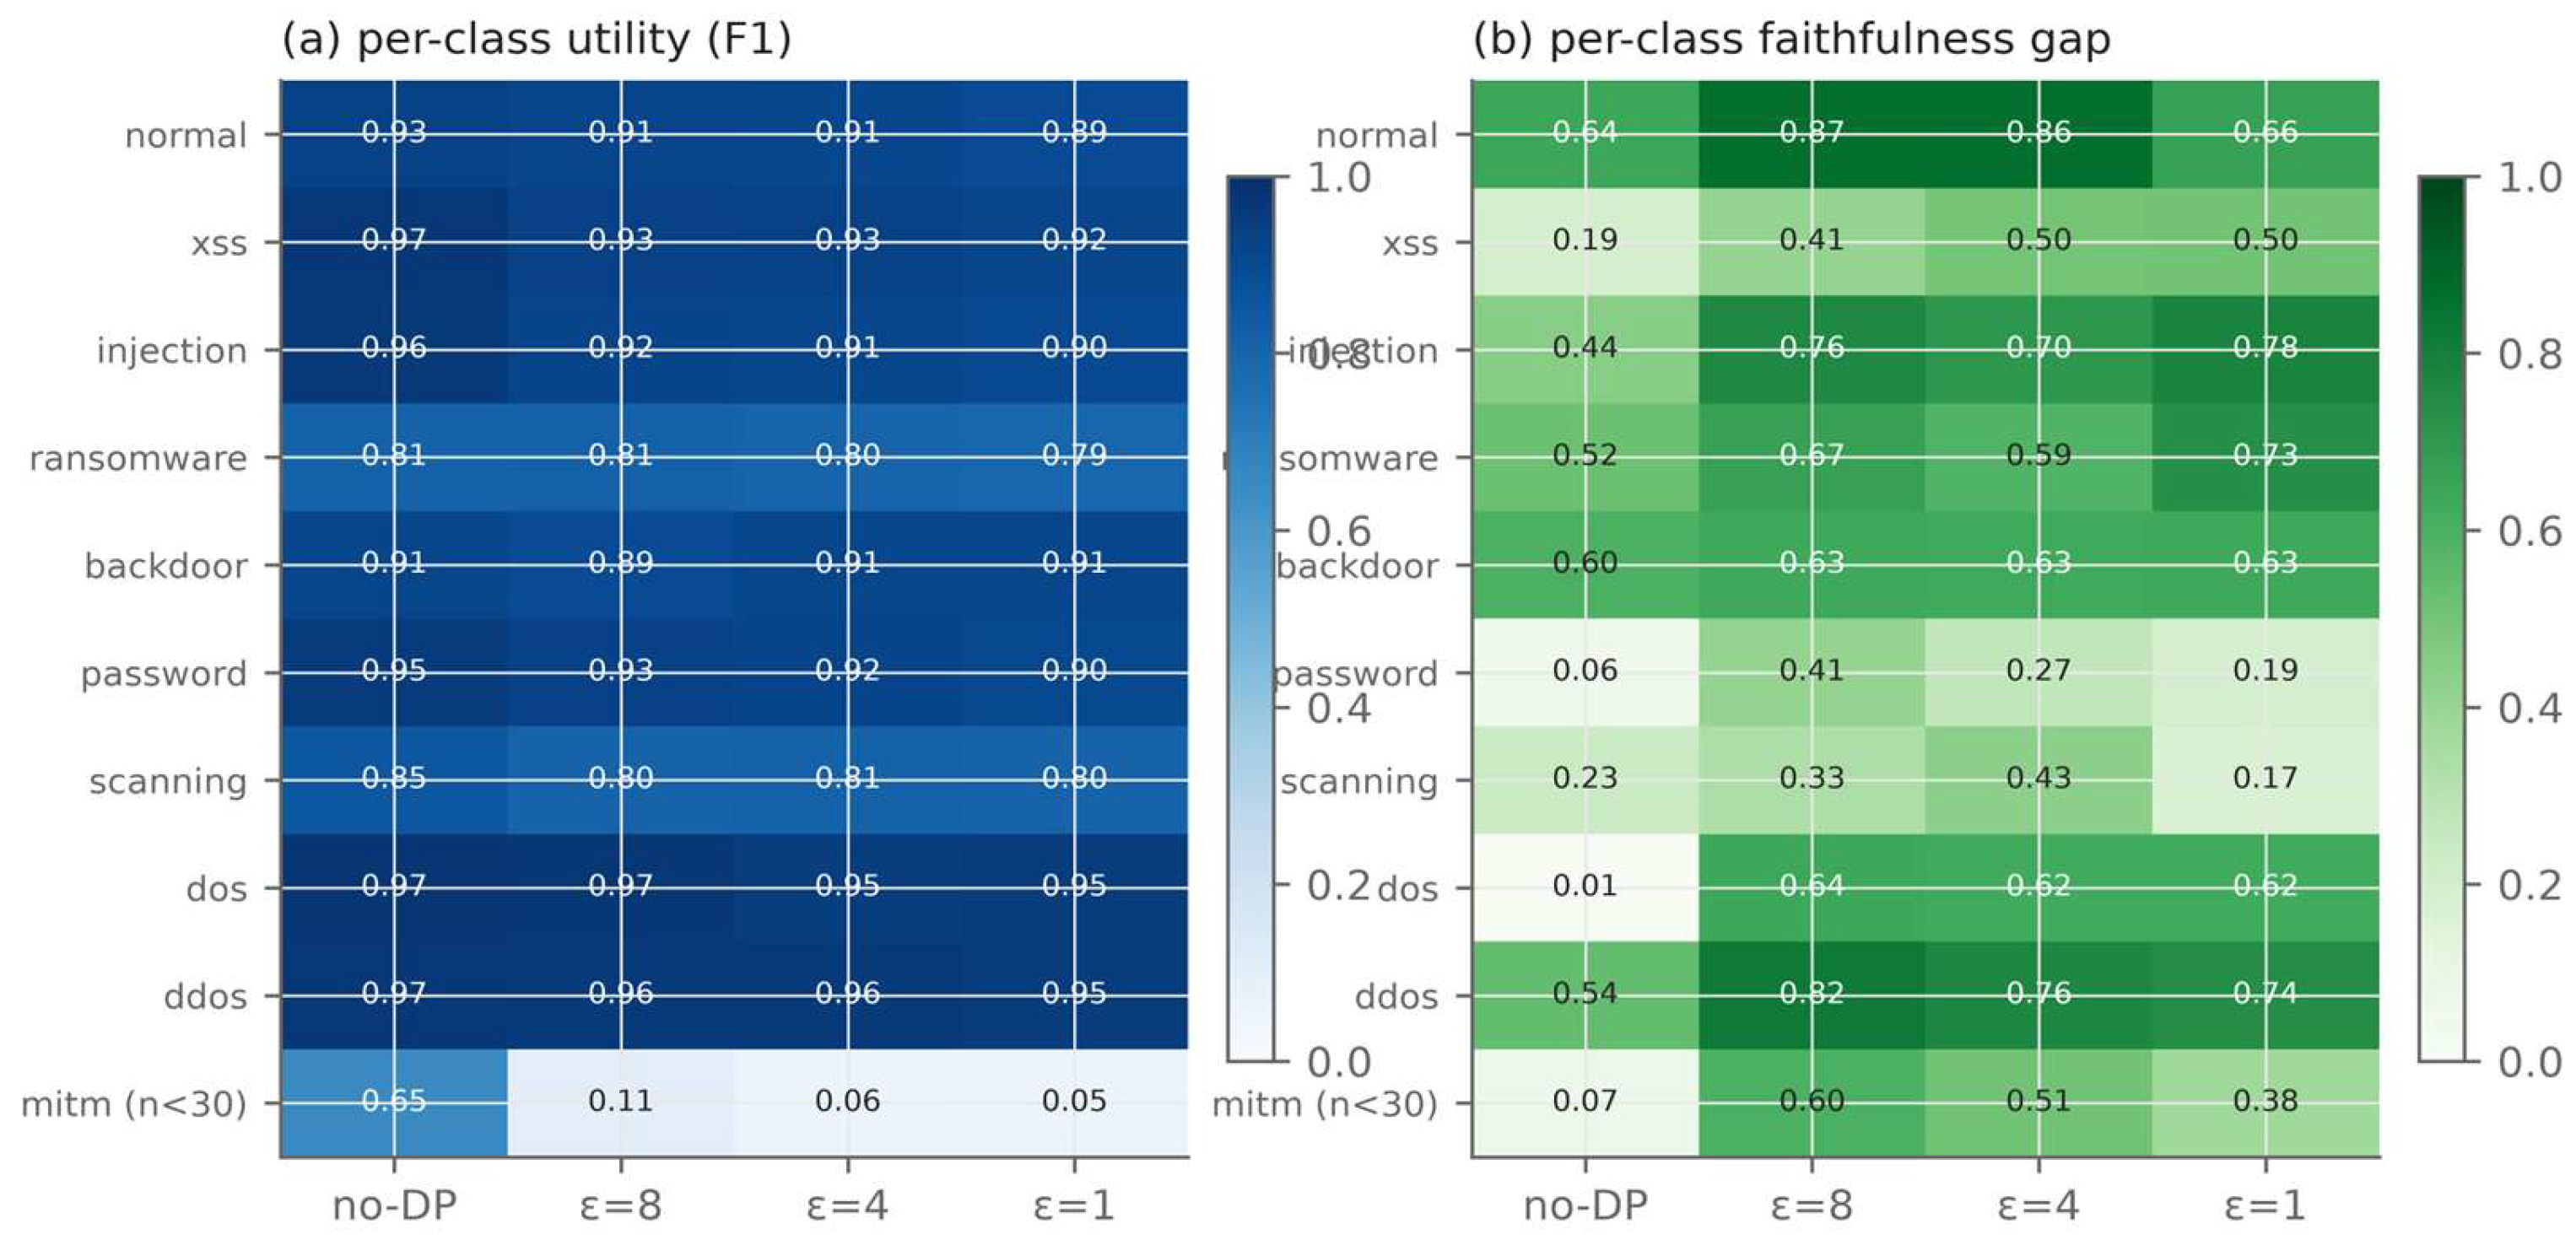
Figure 6.
Robust aggregation × attacker (ToN_IoT, M1, FL-Dir(0.5), no-DP): (a) utility and (b) faithfulness under no attack, label-flip (f=2) and scaling model poisoning (f=2). Error bars are ±1 std over the three seeds.
Figure 6.
Robust aggregation × attacker (ToN_IoT, M1, FL-Dir(0.5), no-DP): (a) utility and (b) faithfulness under no attack, label-flip (f=2) and scaling model poisoning (f=2). Error bars are ±1 std over the three seeds.
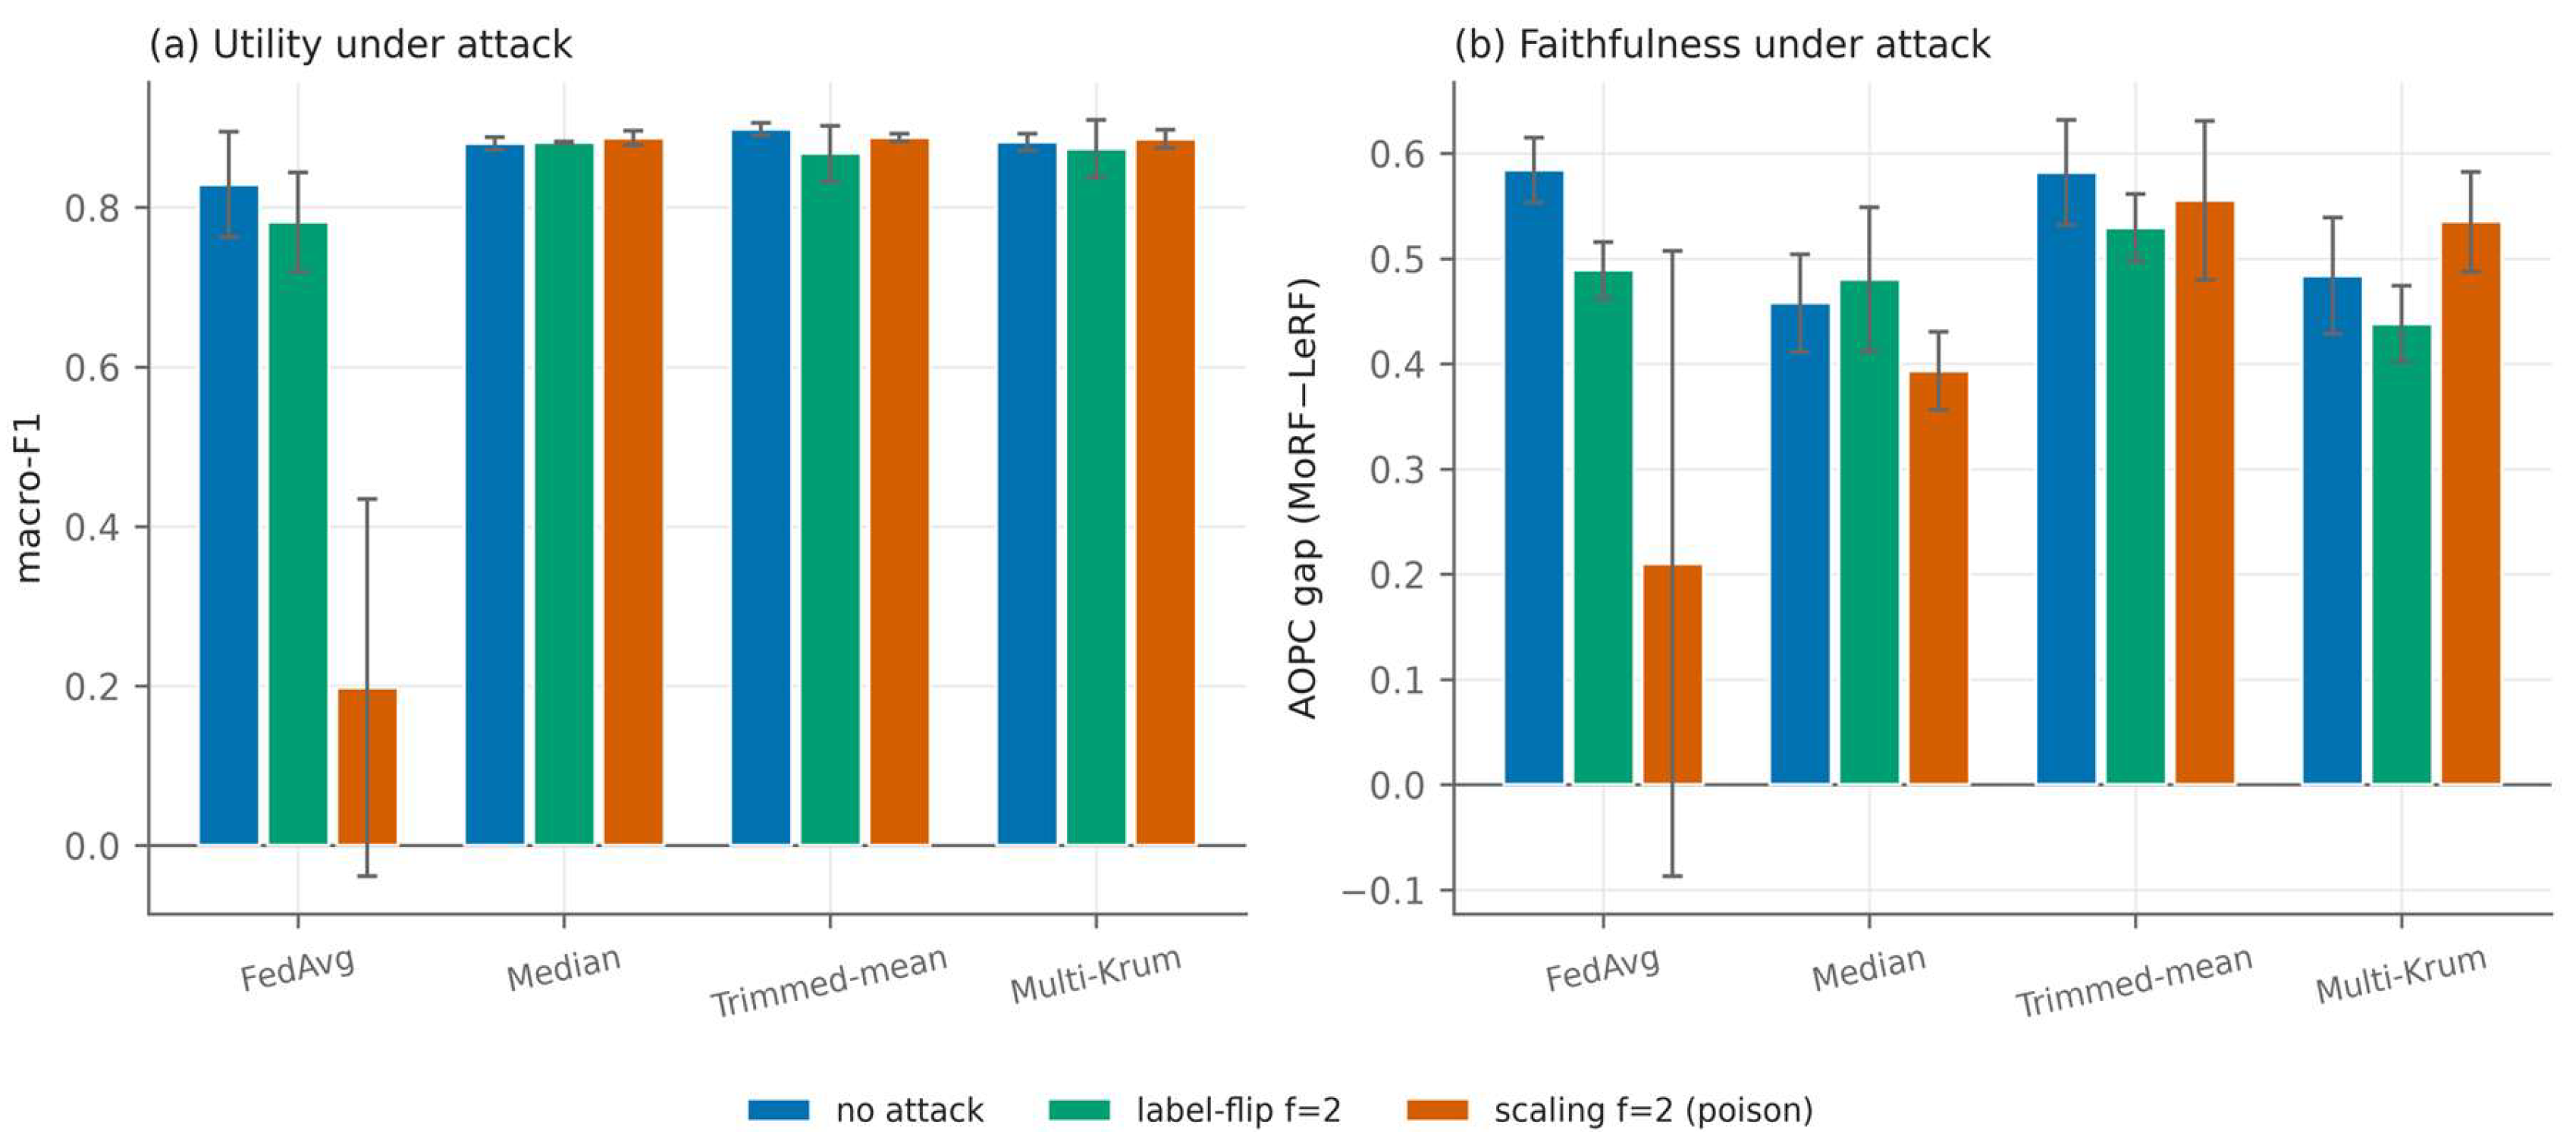
Figure 7.
Mean AOPC gap versus utility (macro-F1) for the utility-matched controls (early-stop, capacity, subsample) with a fitted trend, and the DP cells overlaid as stars (central and FL-IID panels). Central DP cells at ε=4,8 sit above the control trend — a clipping-driven, DP-specific component — whereas every FL-IID cell and central ε=1 lie on it, i.e. are explained by reduced utility alone.
Figure 7.
Mean AOPC gap versus utility (macro-F1) for the utility-matched controls (early-stop, capacity, subsample) with a fitted trend, and the DP cells overlaid as stars (central and FL-IID panels). Central DP cells at ε=4,8 sit above the control trend — a clipping-driven, DP-specific component — whereas every FL-IID cell and central ε=1 lie on it, i.e. are explained by reduced utility alone.
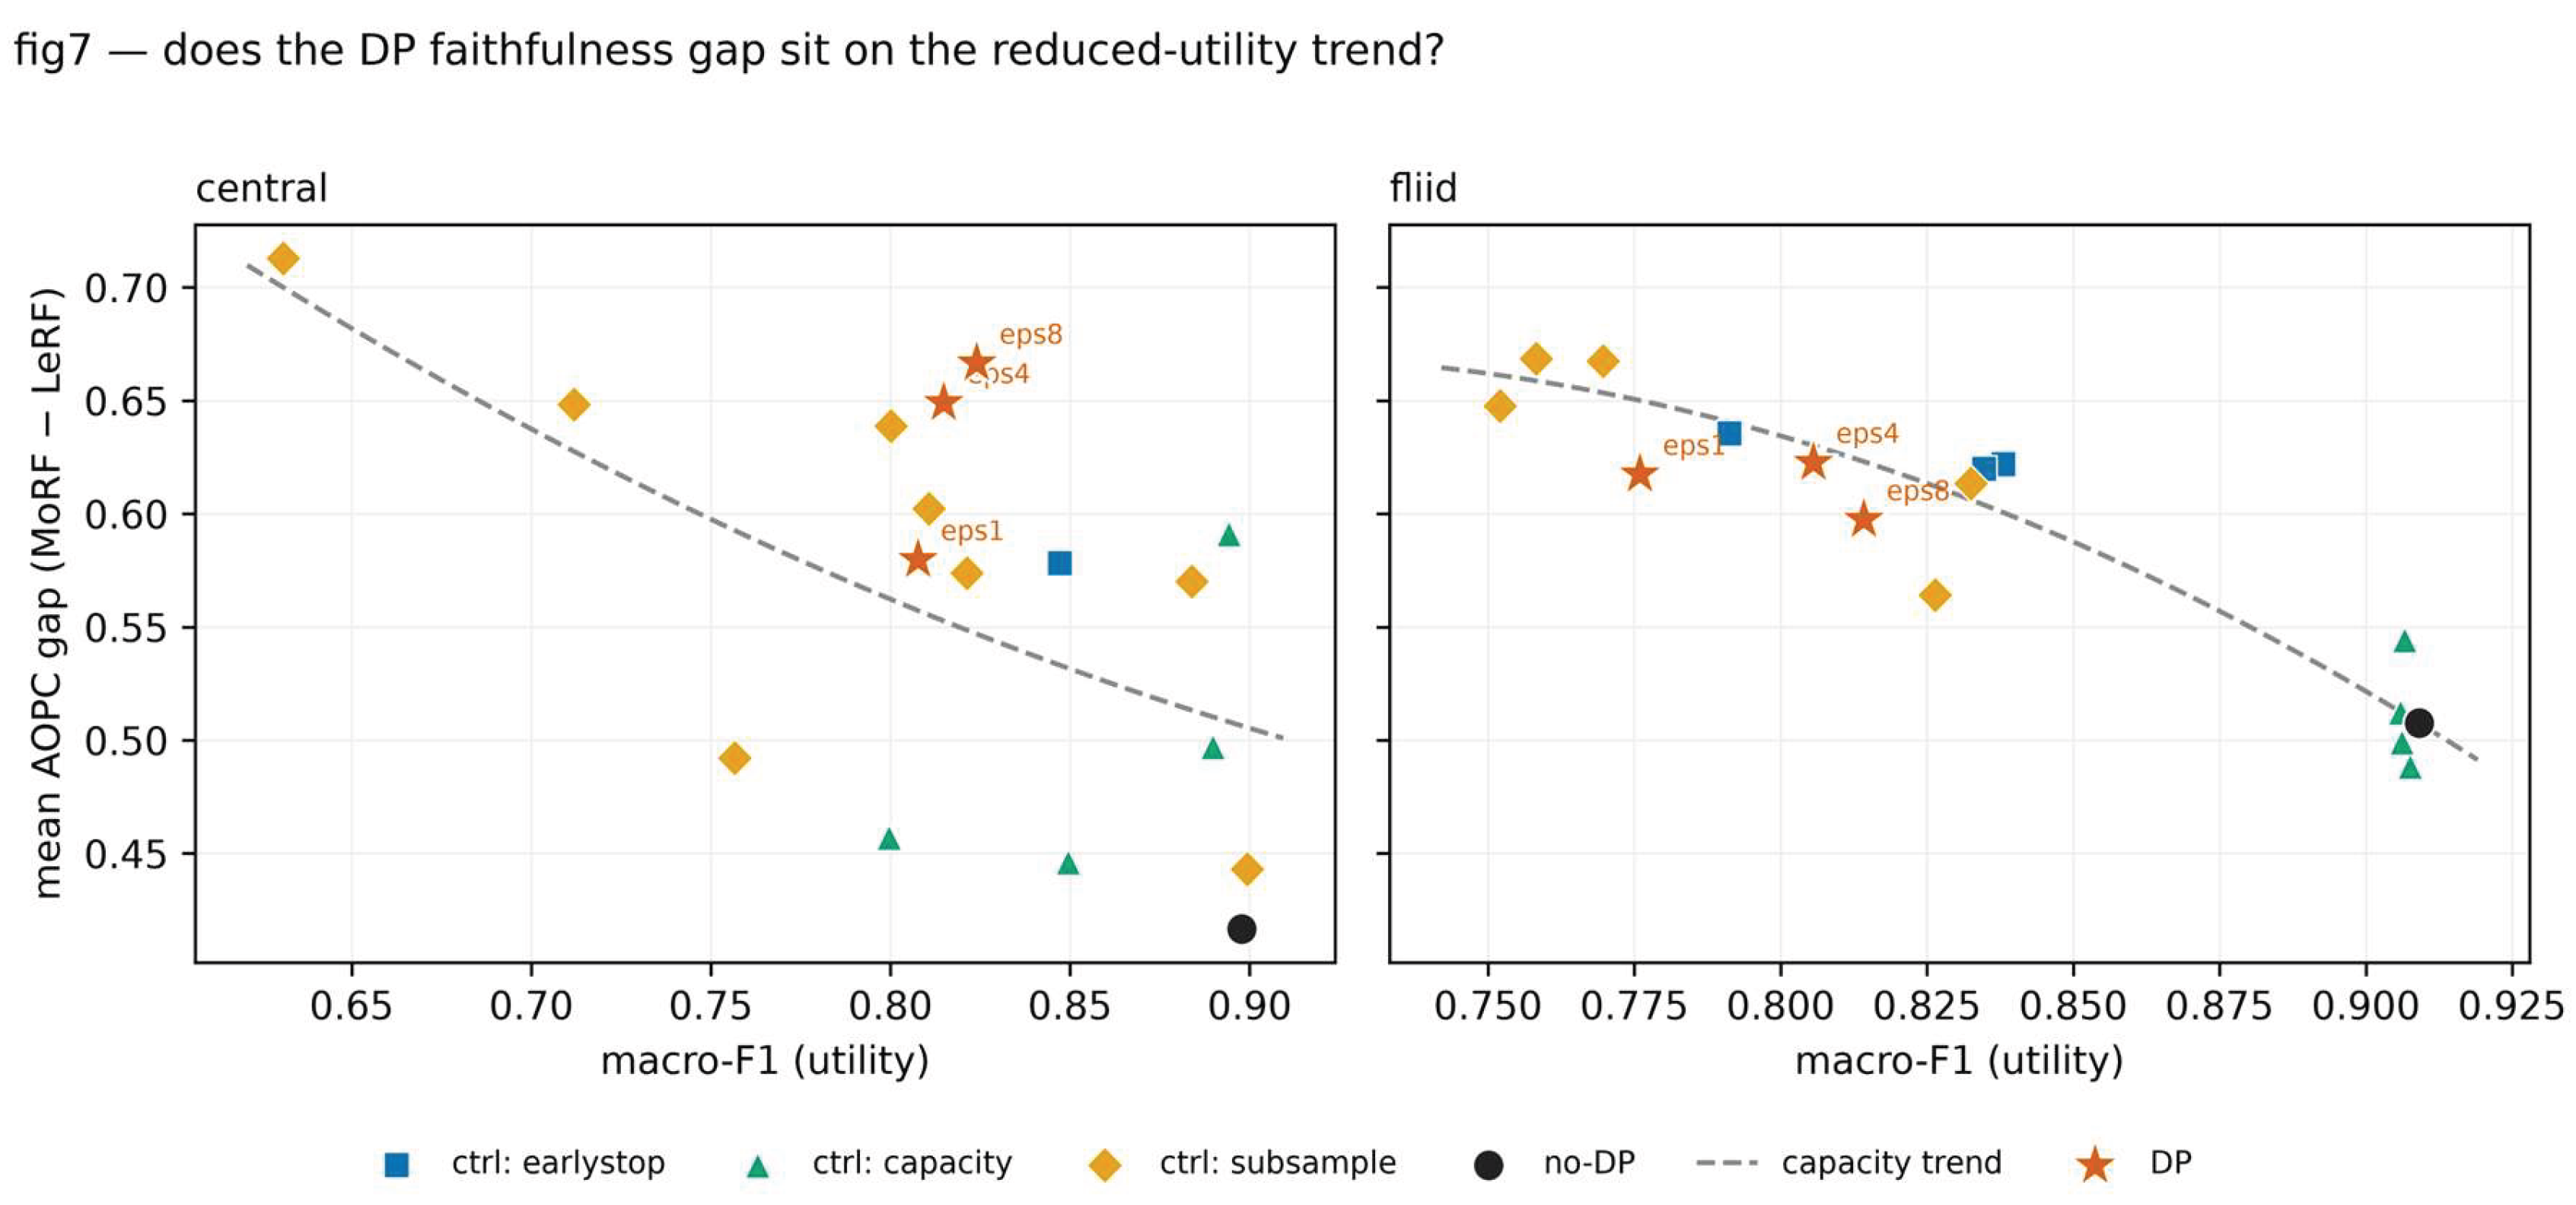

Table 1.
Positioning against the closest prior work.
| Prior work | What they did | What they did NOT do |
| Saifullah et al., Frontiers in AI 2024 [6] |
DP × FL × attribution faithfulness (AOPC MoRF/LeRF) on image / time-series / document / medical; DP → more discontinuous attributions | no IDS/tabular network; no robust aggregation |
| Kalakoti et al., Computer Networks 2025 [8] | FL + LIME/IG/SHAP faithfulness for deep-learning IoT botnet detection | no differential privacy; no robust aggregation |
| Federated SHAP, Machine Learning 2026 [9] | privacy-preserving, consistent SHAP aggregation in FL | not IDS; LDP baselines only, no formal (ε,δ) accounting; no faithfulness metrics |
| Lazzarini et al., AI 2023 [10] |
FedAvg-family comparison for IoT IDS (ToN_IoT, CICIDS2017), shallow ANN | no XAI; no DP — our dataset/setup bridge |
Table 2.
Frozen hyperparameters (deviation log D11/D13).
| M1 (MLP) | M2 (transformer) | |
| parameters | 68,810 | 113,674 |
| LR (federated / central) | 0.1 / 0.05 | 0.01 / 0.01 |
| rounds R | 100 | 150 |
| local epochs E | 1 | 1 |
| batch / momentum / weight-decay | 256 / 0.9 / 0 | 256 / 0.9 / 0 |
| DP: C, δ, ε | 1.0, 10⁻⁵, {8,4,1} | 1.0, 10⁻⁵, {4,1} |
| seeds | {13, 42, 2026} | {13, 42, 2026} |
Table 3.
Utility — macro-F1 (mean±std), ToN_IoT / M1.
| regime | no-DP | ε=8 | ε=4 | ε=1 |
| Central | 0.898±0.008 | 0.824±0.013 | 0.815±0.003 | 0.808±0.004 |
| FL-IID | 0.909±0.001 | 0.814±0.013 | 0.806±0.003 | 0.776±0.007 |
| FL-Dir(0.5) | 0.829±0.066 | 0.804±0.005 | 0.793±0.004 | 0.714±0.067 |
| FL-Dir(0.1) | 0.684±0.040 | 0.717±0.056 | 0.611±0.004 | 0.583±0.039 |
Table 4.
Faithfulness — IG AOPC gap MoRF−LeRF (higher = more faithful).
| regime | no-DP | ε=8 | ε=4 | ε=1 |
| Central | 0.417±0.024 | 0.667±0.100 | 0.649±0.049 | 0.580±0.089 |
| FL-IID | 0.508±0.084 | 0.597±0.044 | 0.623±0.087 | 0.617±0.013 |
| FL-Dir(0.5) | 0.584±0.031 | 0.659±0.123 | 0.688±0.088 | 0.732±0.029 |
| FL-Dir(0.1) | 0.536±0.028 | 0.800±0.067 | 0.773±0.048 | 0.697±0.040 |
Table 5.
DP effect (Cliff’s δ, no-DP vs DP; δ<0 ⇒ DP increases the metric; #seeds Holm-significant). Central, IG.
Table 5.
DP effect (Cliff’s δ, no-DP vs DP; δ<0 ⇒ DP increases the metric; #seeds Holm-significant). Central, IG.
| metric | ε=8 | ε=4 | ε=1 |
| comprehensiveness@10 | −0.788 (large, 3/3) | −0.699 (large, 3/3) | −0.649 (large, 3/3) |
| AOPC gap | −0.577 (large, 3/3) | −0.537 (large, 3/3) | −0.433 (medium, 3/3) |
Table 6.
Per-class decoupling.
| class | gap no-DP | gap ε=8 | gap ε=4 | gap ε=1 | F1 no-DP | F1 ε=1 |
| mitm (rare, n=4) | 0.07 | 0.60 | 0.51 | 0.38 | 0.65 | 0.05 |
| ransomware (rare) | 0.52 | 0.67 | 0.59 | 0.73 | 0.81 | 0.79 |
| backdoor | 0.60 | 0.63 | 0.63 | 0.63 | 0.91 | 0.91 |
| ddos | 0.54 | 0.82 | 0.76 | 0.74 | 0.97 | 0.95 |
| dos | 0.01 | 0.64 | 0.62 | 0.62 | 0.97 | 0.95 |
| injection | 0.44 | 0.76 | 0.70 | 0.78 | 0.96 | 0.90 |
| normal | 0.64 | 0.87 | 0.86 | 0.66 | 0.93 | 0.89 |
| password | 0.06 | 0.41 | 0.27 | 0.19 | 0.95 | 0.90 |
| scanning | 0.23 | 0.33 | 0.43 | 0.17 | 0.85 | 0.80 |
| xss | 0.19 | 0.41 | 0.50 | 0.50 | 0.97 | 0.92 |
Table 7.
Strong model-poisoning (scaling, f=2), FL-Dir(0.5) no-DP, M1 (mean±std).
| aggregator | macro-F1 no-attack | macro-F1 scaling | IG gap no-attack | IG gap scaling |
| FedAvg | 0.829±0.066 | 0.198±0.236 | 0.584±0.031 | 0.210±0.297 |
| Median | 0.880±0.008 | 0.887±0.009 | 0.458±0.046 | 0.393±0.037 |
| Trimmed-mean | 0.898±0.007 | 0.888±0.005 | 0.582±0.050 | 0.555±0.075 |
| Multi-Krum | 0.882±0.011 | 0.886±0.011 | 0.484±0.055 | 0.535±0.047 |
Table 8.
CICIDS2017 / M1 replication (macro-F1; IG gap), no-DP → ε8 → ε1.
| regime | macro-F1 | IG gap |
| FL-IID | 0.973 → 0.917 → 0.808 | 0.545 → 0.874 → 0.745 |
| FL-Dir(0.1) | 0.932 → 0.763 → 0.728 | 0.757 → 0.714 → 0.666 |
Table 9.
DP cell gap versus the utility-matched control trend (mean AOPC gap; residual = DP gap − trend-predicted gap at the DP macro-F1; |residual| < 0.05 ⇒ the DP point lies on the reduced-utility trend). Trend fitted through the early-stop/capacity/subsample controls.
Table 9.
DP cell gap versus the utility-matched control trend (mean AOPC gap; residual = DP gap − trend-predicted gap at the DP macro-F1; |residual| < 0.05 ⇒ the DP point lies on the reduced-utility trend). Trend fitted through the early-stop/capacity/subsample controls.
| regime | ε | DP macro-F1 | DP gap | trend gap | residual | reading |
| Central | 8 | 0.824 | 0.667 | 0.547 | +0.120 | above → DP-specific |
| Central | 4 | 0.815 | 0.649 | 0.553 | +0.097 | above → DP-specific |
| Central | 1 | 0.808 | 0.580 | 0.557 | +0.022 | on trend |
| FL-IID | 8 | 0.814 | 0.598 | 0.623 | −0.026 | on trend |
| FL-IID | 4 | 0.806 | 0.623 | 0.630 | −0.007 | on trend |
| FL-IID | 1 | 0.776 | 0.618 | 0.650 | −0.033 | on trend |
Disclaimer/Publisher’s Note: The statements, opinions and data contained in all publications are solely those of the individual author(s) and contributor(s) and not of MDPI and/or the editor(s). MDPI and/or the editor(s) disclaim responsibility for any injury to people or property resulting from any ideas, methods, instructions or products referred to in the content. |
© 2026 by the authors. Licensee MDPI, Basel, Switzerland. This article is an open access article distributed under the terms and conditions of the Creative Commons Attribution (CC BY) license (http://creativecommons.org/licenses/by/4.0/).
Copyright: This open access article is published under a Creative Commons CC BY 4.0 license, which permit the free download, distribution, and reuse, provided that the author and preprint are cited in any reuse.