

Submitted:
20 August 2026
Posted:
20 August 2026
You are already at the latest version
Abstract
Influenza A(H3N2) viruses show continuous antigenic and genetic evolution, requiring sustained molecular surveillance to understand their circulation and geographic spread. This study investigated the epidemiological, evolutionary, and phylogeographic dynamics of A(H3N2) viruses circulating in Brazil between 2011 and 2019. Epidemiological surveillance data from Northern and Northeastern Brazil were analyzed together with hemagglutinin (HA) gene sequences generated in this study and sequences retrieved from GISAID EpiFlu database. Phylogenetic and Bayesian phylogeographic analyses were performed to characterize genetic diversity and viral dispersal. Among 23,278 respiratory samples, 1,003 (4.31%) were positive for A(H3N2), with seasonal peaks occurring mainly between epidemiological weeks 13 and 16. Phylogenetic analyses revealed successive lineage replacement, with predominance of 3C.2a-derived clades after 2015. Phylogeographic reconstruction identified multiple international introductions into Brazil and extensive viral movement among Brazilian regions, with Southeastern Brazil acting as the main hub of national connectivity. Northern and Northeastern Brazil participated predominantly as recipient regions while also contributing to onward viral dissemination. These findings highlight the interconnected nature of A(H3N2) circulation in Brazil and reinforce the importance of integrating genomic and epidemiological surveillance to understand influenza dynamics.
Keywords:
influenza A(H3N2)
; seasonality
; phylogeography
; molecular epidemiology
; viral evolution
; genomic surveillance
Introduction
Influenza A(H3N2) viruses are among the most rapidly evolving human respiratory pathogens, exhibiting high nucleotide substitution rates that promote continuous genetic diversification and frequent lineage turnover (Bedford et al., 2015; Rambaut et al., 2008). This evolutionary plasticity facilitates the recurrent emergence of antigenically distinct variants, posing persistent challenges for global surveillance, vaccine strain selection, and public health preparedness (Koel et al., 2013; Petrova; Russell, 2018). Understanding how genetic diversity interacts with seasonal circulation and spatial dissemination is therefore essential for elucidating the epidemiological and evolutionary dynamics of A(H3N2) viruses.
At a global scale, Influenza A(H3N2) circulation is characterized by complex spatiotemporal dynamics involving recurrent viral introductions, long-distance dispersal, and region-specific transmission patterns (Bedford et al., 2010; Russell et al., 2008). Phylogeographic studies have shown that viral populations rarely persist locally for extended periods; instead, seasonal epidemics are frequently seeded by newly introduced lineages that subsequently replace previously circulating variants (Bedford et al., 2015; Nelson; Holmes, 2007; Born et al., 2016). These processes contribute to a globally interconnected viral population in which recurrent migration and lineage replacement continuously reshape the geographic distribution of genetic diversity.
In tropical and subtropical regions, influenza dynamics differ substantially from the well-defined winter epidemics typical of temperate climates. Viral activity may occur throughout the year or exhibit distinct seasonal peaks, with temporal patterns previously associated with climatic variables such as rainfall, humidity, and temperature (Moura; Perdigão; Siqueira, 2009; Tamerius et al., 2013). Such heterogeneous seasonal regimes may influence transmission intensity and the timing of viral introductions, further contributing to regional variation in influenza circulation (Bloom-Feshbach et al., 2013). Despite their epidemiological relevance, tropical regions remain comparatively underrepresented in studies addressing the global evolutionary and phylogeographic dynamics of influenza viruses.
Brazil represents a particularly informative setting for investigating the interaction between seasonality, viral evolution, and spatial dissemination because of its vast geographic extent and marked climatic and epidemiological heterogeneity. Northern and Northeastern Brazil are predominantly characterized by tropical and equatorial climates and exhibit influenza seasonal patterns that differ from those observed in Southern and Southeastern regions of the country (Alonso et al., 2007; Moura; Perdigão; Siqueira, 2009). Although regional differences in influenza seasonality in Brazil have been documented, the contribution of the North and Northeast to the broader evolutionary and spatial dynamics of A(H3N2), including their connectivity with other Brazilian macroregions and international viral populations, remains comparatively poorly characterized.
This study investigated the seasonal, genetic, evolutionary, and phylogeographic dynamics of Influenza A(H3N2) viruses circulating in Northern and Northeastern Brazil across multiple epidemic seasons. By integrating epidemiological surveillance data with large-scale phylogenetic and Bayesian phylogeographic analyses, the study aimed to characterize seasonal circulation and lineage turnover, reconstruct evolutionary relationships, and assess patterns of viral dispersal within Brazil and between Brazilian and international populations. This integrated framework was designed to clarify the contribution of Northern and Northeastern Brazil to the broader national and international evolutionary and spatial dynamics of Influenza A(H3N2).
Materials and Methods
Study Samples and Epidemiological Data
Respiratory specimens collected through the Brazilian national influenza surveillance system between 2011 and 2019 were included in the epidemiological analysis. The Instituto Evandro Chagas (IEC) serves as a reference center for laboratory-based influenza surveillance for ten states in Northern and Northeastern Brazil: Acre, Amazonas, Amapá, Pará, Roraima, Maranhão, Ceará, Paraíba, Pernambuco, and Rio Grande do Norte. Samples from patients with influenza-like illness (ILI) or severe acute respiratory infection (SARI) were collected at sentinel units and healthcare facilities, initially processed at regional public health laboratories, and subsequently forwarded to the Respiratory Virus Laboratory of the Instituto Evandro Chagas (LVR/IEC), one of the World Health Organization (WHO)-designated National Influenza Centres (NICs) in Brazil and part of the Global Influenza Surveillance and Response System (GISRS). A total of 23,278 respiratory specimens received and processed by the NIC/IEC from these ten states between 2011 and 2019 were included in the epidemiological analysis. Sampling date and geographic origin were used to characterize the temporal and regional distribution of influenza A(H3N2) circulation. Molecular analyses were performed using HA gene sequences selected as described below.
RNA Extraction and Viral Detection
Viral RNA was extracted from respiratory specimens using the QIAamp Viral RNA Mini Kit (QIAGEN, Hilden, Germany), according to the manufacturer’s instructions. Influenza A virus detection and subtype (H1 and H3) identification were performed by real-time reverse transcription polymerase chain reaction (RT-qPCR) using standardized primers and probes recommended by the WHO for influenza surveillance. Reactions were performed using the SuperScript™ III Platinum™ One-Step qRT-PCR Kit (Thermo Fisher Scientific, Waltham, MA, USA). Samples identified as Influenza A(H3N2) were included in the epidemiological analyses.
Sequencing, Assembly, and Sequence Curation
Influenza A(H3N2) positive samples with adequate viral loads were selected for molecular characterization of the hemagglutinin (HA) gene. cDNA was synthesized using SuperScript® III Reverse Transcriptase (Thermo Fisher Scientific, Waltham, MA, USA), and target regions were amplified with subtype-specific primers and Platinum™ Taq DNA Polymerase. Amplicons were sequenced by the Sanger method using the BigDye™ Terminator v3.1 Cycle Sequencing Kit on an ABI automated genetic analyzer. Sequence assembly, editing, and quality control were performed in Geneious v9.1.8 (Kearse et al., 2012) by reference mapping against WHO-recommended A(H3N2) vaccine strains for the Southern Hemisphere corresponding to each sampling year. Chromatograms were manually inspected, and consensus sequences were generated from overlapping fragments. A total of 155 HA sequences generated by NIC-IEC between 2011 and 2019 were included in the study and deposited in the GISAID EpiFlu database.
Sequence Dataset Construction and Subsampling
To provide broader temporal and geographic context for phylogenetic and phylogeographic analyses, additional Influenza A(H3N2) HA sequences collected between 2011 and 2019 were retrieved from the GISAID EpiFlu database. Sequences with complete sampling dates, defined geographic origin, and complete HA genes were included. The initial dataset comprised 857 Brazilian sequences and 65,431 international sequences representing North America (n = 98), South America (n = 60), Central America (n = 47), Europe (n = 125), Africa (n = 104), Asia (n = 97), Southeast Asia (n = 127), and Oceania (n = 94).
Brazilian and international datasets were independently subsampled using the augur filter command from the Nextstrain pipeline (Hadfield et al., 2018), followed by redundancy reduction with CD-HIT v4.8.1 (Li; Godzik, 2006). Sequences were retained according to temporal, geographic, and phylogenetic criteria, ensuring representation across years, geographic regions, and identified clades, with at least one representative per quarter whenever available. The Brazilian dataset comprised HA sequences from states within the reference areas of the three Brazilian National Influenza Centres (NICs), including 168 sequences from the reference area of the Instituto Evandro Chagas (NIC/IEC), 115 from the Instituto Adolfo Lutz (NIC/IAL), and 155 from the Instituto Oswaldo Cruz (NIC/IOC). HA sequences generated by the NICs were retained in their entirety during the subsampling procedure. After subsampling, 419 Brazilian and 752 international sequences were retained, resulting in a final dataset of 1,171 HA sequences (EPI_SET_260814cn). WHO-recommended A(H3N2) vaccine reference strains for the study period were also included for phylogenetic contextualization.
Seasonality Analysis
Seasonal patterns of Influenza A(H3N2) circulation were evaluated using epidemiological surveillance data from Northern and Northeastern Brazil between 2011 and 2019. Laboratory-confirmed A(H3N2) detections were aggregated by epidemiological week, month, year, and geographic region. Weekly positivity was calculated as the proportion of A(H3N2)-positive samples among all respiratory specimens tested in each epidemiological week, and mean weekly positivity was used to compare temporal patterns between regions and epidemic seasons. Temporal trends were visualized using locally estimated scatterplot smoothing (LOESS), while monthly distributions were represented as heatmaps to assess variation across years and regions. Graphical analyses were performed in R using the ggplot2 package (Wickham, 2016).
Phylogenetic Analyses
HA gene sequences were aligned using MAFFT v7.407 (Katoh; Toh, 2010) with automatically optimized parameters. The alignment was manually inspected and edited in Geneious v9.1.8 (Kearse et al., 2012) to correct ambiguities and poorly aligned regions and to standardize sequence length. The best-fitting nucleotide substitution model was selected using ModelFinder (Kalyaanamoorthy et al., 2017), implemented in IQ-TREE v2.2.0 (Minh et al., 2020), based on the Akaike information criterion (AIC), corrected AIC (AICc), and Bayesian information criterion (BIC). Maximum-likelihood phylogenetic inference was subsequently performed in IQ-TREE using the selected substitution model, with branch support assessed using 1,000 bootstrap replicates.
Temporal structure was evaluated from the maximum-likelihood phylogeny using TempEst v1.5.3 (Rambaut et al., 2016). Root-to-tip genetic distances were regressed against sampling dates to assess the relationship between genetic divergence and sampling time and the suitability of the dataset for molecular clock analysis. Regression plots were also inspected to identify sequences with anomalous temporal patterns potentially associated with sampling-date inconsistencies, evolutionary rate heterogeneity, or other artifacts. The resulting temporally structured dataset was subsequently used for Bayesian evolutionary and phylogeographic analyses.
Phylogeographic Analyses
Bayesian phylogeographic reconstruction was performed in BEAST v1.10.4 (Suchard et al., 2018) using a discrete-trait diffusion model, with sampling locations assigned as discrete geographic states. An asymmetric continuous-time Markov chain (CTMC) model was used to reconstruct viral movement among locations. Bayesian stochastic search variable selection (BSSVS) was applied to identify non-zero transition rates, and statistical support for dispersal routes was assessed using Bayes factors (BF), classified as decisive (BF ≥100), very strong (30≤BF<100), or strong (10≤BF<30). Supported routes and corresponding BF values are reported in Table S3 (Supplementary Material), and spatial diffusion patterns were processed using SPREAD3 v0.9.7 (Bielejec et al., 2016).
Markov jump counts were used to quantify geographic state transitions across the posterior distribution of phylogenetic trees. For each origin–destination pair, transitions were summarized by the mean number of jumps per tree and classified as international introductions into Brazil, international exports from Brazil, or dispersal among Brazilian macroregions. Markov jump estimates were used to characterize the magnitude and direction of viral dispersal and construct the network shown in Figure 4, whereas BSSVS and Bayes factors were used independently to assess statistical support for migration routes.
Evolutionary Analyses
Bayesian evolutionary analyses were performed in BEAST v1.10.4 (Suchard et al., 2018), with input files prepared in BEAUti v1.10.4 and sampling dates assigned as tip dates. Strict and uncorrelated lognormal relaxed (UCLN) molecular clocks were evaluated in combination with three coalescent priors: constant population size, exponential growth, and Bayesian Skygrid. Model performance was compared using marginal likelihood estimates obtained by path sampling (PS) and stepping-stone sampling (SS), with Bayes factors used to assess relative support (Table S1, Supplementary Material). The UCLN molecular clock combined with the Bayesian Skygrid prior showed the best fit and was used in the final analyses.
Three independent Markov chain Monte Carlo (MCMC) runs of 200 million generations each were performed and combined using LogCombiner v1.10.4 after discarding 10% of each run as burn-in. Convergence and sampling efficiency were assessed in Tracer v1.7.2 (Rambaut et al., 2018) by inspection of parameter traces and effective sample size (ESS) values. Posterior trees were summarized in TreeAnnotator v1.10.4 to generate a maximum clade credibility (MCC) tree and estimate evolutionary rates, divergence times, and 95% highest posterior density (HPD) intervals. Time-scaled phylogenies were visualized in FigTree v1.4.4.
Ethical Considerations
Activities from this study were conducted as part of routine public health surveillance authorized by the Brazilian Ministry of Health (MoH). The study was approved by the Research Ethics Committee for Human Subjects of the Instituto Evandro Chagas (CAAE No. 574858.8.0000.0019), in accordance with Resolution No. 466/2012 of the Brazilian National Health Council, and by the Research Ethics Committee associated with NIC-Fiocruz (CAAE No. 68118417.6.0000.5248). The SISGEN (National System for the Management of Genetic Heritage and Associated Traditional Knowledge) registration number for the Brazilian virus genomes used in this study is A15FAF3.
The study used respiratory specimens and associated epidemiological data obtained through routine influenza surveillance activities conducted within the Brazilian national surveillance system. Samples and epidemiological information were analyzed without individual identification, and confidentiality was maintained throughout the study. The requirement for individual informed consent was waived by the Research Ethics Committee in accordance with the approved study protocol.
Results
Seasonality of Influenza A(H3N2) Circulation
Influenza A(H3N2) circulation in Northern and Northeastern Brazil exhibited a consistent seasonal pattern throughout the study period. Early viral detections were observed during the first epidemiological weeks of the year (EW01–04), followed by an increase in A(H3N2) positivity beginning approximately between EW05 and EW07. Viral activity intensified during the subsequent weeks, with the highest positivity generally concentrated between EW13 and EW16, followed by a progressive decline from approximately EW19–22 and substantially lower circulation after EW25 (Figure 1).
Despite interannual variation in the magnitude of A(H3N2) positivity, the overall temporal pattern remained relatively stable throughout the nine-year study period. Northern and Northeastern Brazil showed largely overlapping seasonal patterns, characterized by increased viral activity during the first half of the year and reduced positivity during the second half. Monthly distributions further supported this temporal structure, showing greater A(H3N2) activity between February and May, with lower circulation during the remaining months (Figure 1).
Genetic Diversity and Clade Dynamics
A total of 270 Brazilian HA gene sequences collected between 2011 and 2019 were included in the genetic diversity analyses. The dataset comprised viruses sampled across all five Brazilian macroregions, providing comprehensive spatial coverage for evaluating patterns of genetic diversity and lineage dynamics (Figure 2A). Phylogenetic classification identified ten genetic clades circulating during the study period (3C.2, 3C.3a, 3C.2a, 3C.2a1, 3C.2a2, 3C.2a3, 3C.3a1, 3C.2a1b.1, 3C.2a1b.2, and 3C.2a1b.2b), revealing a progressive increase in genetic diversity over time (Figure 2B). While the early epidemic seasons were characterized by the predominance of a limited number of lineages, additional clades and derived subclades emerged from 2015 onwards, leading to greater genetic complexity and the simultaneous circulation of multiple viral variants.
The genetic composition of the viral population changed continuously throughout the study period, with successive replacement of predominant clades and no evidence of prolonged persistence of a single lineage across consecutive epidemic seasons (Figure 2B). Early clades were progressively replaced by newly emerged variants, reflecting the dynamic evolutionary turnover of Influenza A(H3N2) in Brazil. The temporal and geographic distribution of individual genomes demonstrated that both early and recently emerged clades were detected across multiple Brazilian macroregions without evident spatial restriction (Figure 2C). The widespread occurrence of genetically distinct lineages across different regions and years indicates extensive geographic dissemination and sustained viral exchange throughout the country.
Evolutionary Rate and tMRCA Estimates
Bayesian time-scaled phylogenetic analysis estimated a mean evolutionary rate of 2.83 × 10⁻³ substitutions per site per year for the HA gene, with a 95% highest posterior density (HPD) interval ranging from 2.60 × 10⁻³ to 3.07 × 10⁻³ substitutions/site/year. Posterior sampling was adequate for all estimated parameters (ESS >160), supporting the robustness of the evolutionary inferences. Detailed estimates of the time to the most recent common ancestor (tMRCA) for the major clades are provided in Table S2 (Supplementary Material).
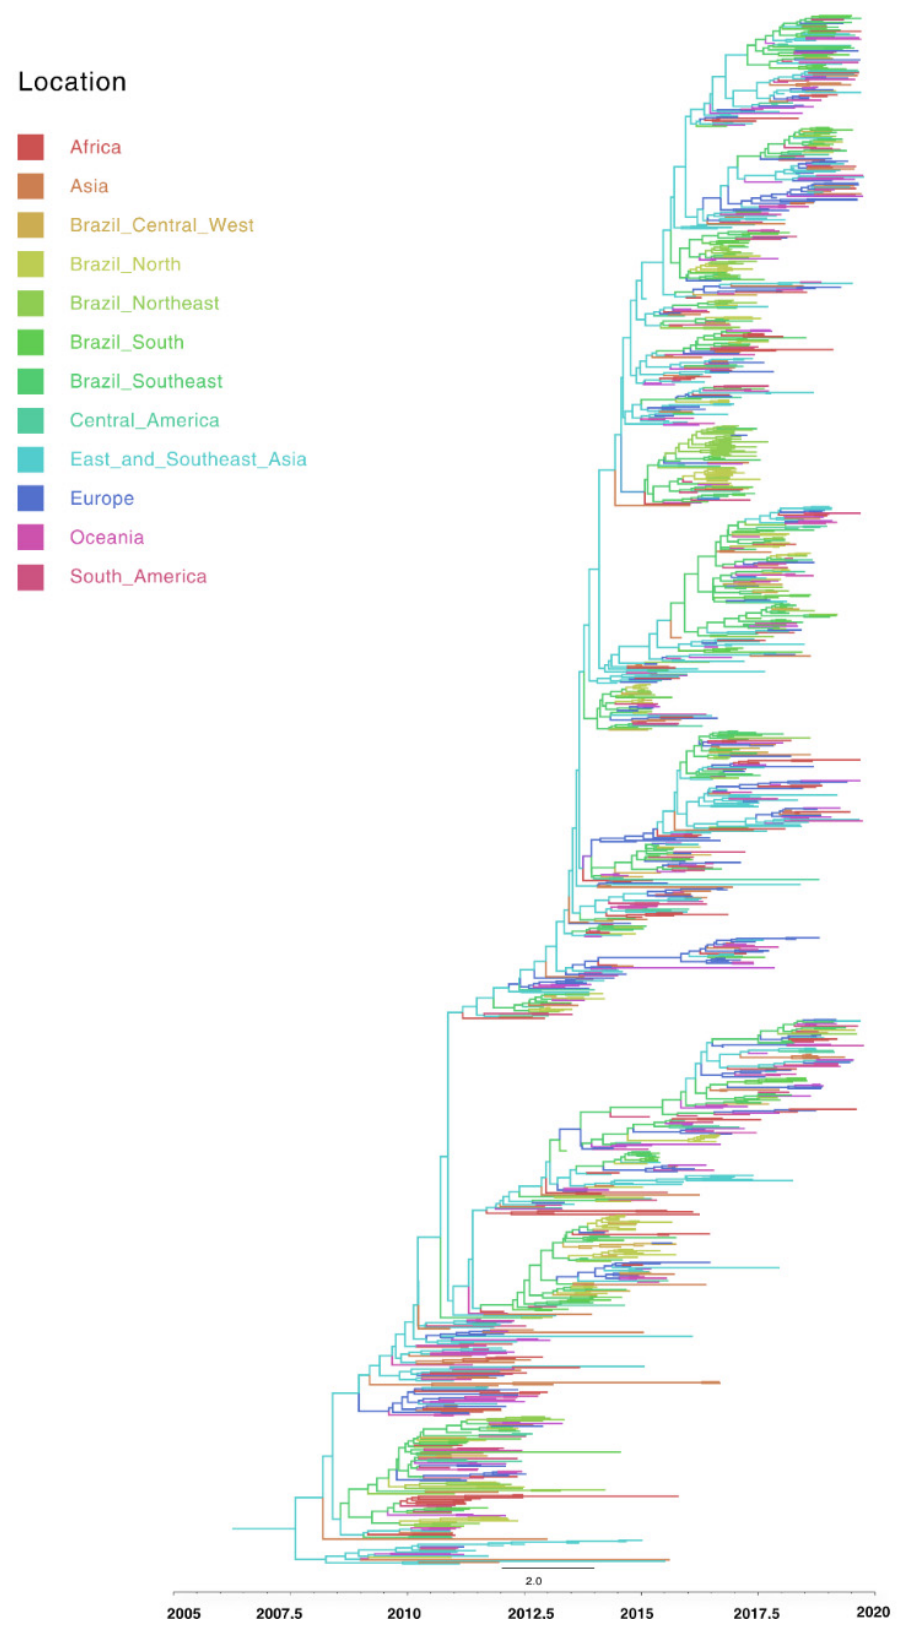
The maximum clade credibility (MCC) phylogeny revealed extensive phylogenetic intermixing among Brazilian and international sequences, with viruses sampled from different Brazilian macroregions distributed throughout the tree rather than forming geographically exclusive clusters (Figure 3). Likewise, sequences from the North, Northeast, Southeast, South, and Midwest were interspersed across multiple phylogenetic lineages, indicating the absence of persistent geographic structuring. Overall, the phylogenetic structure supports the continuous diversification of Influenza A(H3N2) lineages throughout the study period and is consistent with the broad spatial distribution of genetic clades observed across Brazil.
Phylogeographic Reconstruction and Viral Dispersal Dynamics
Bayesian stochastic search variable selection (BSSVS) identified 50 statistically supported migration routes among the 156 potential transitions evaluated, demonstrating extensive spatial connectivity within the global Influenza A(H3N2) transmission network (Table S3, Supplementary Material). Among these, 10 routes showed decisive support (Bayes factor [BF] ≥100), 13 showed very strong support (BF = 30–99.9), and 27 showed strong support (BF = 10–29.9). Markov jump analyses were subsequently used to quantify the intensity and direction of viral dispersal among geographic locations, complementing the statistical support provided by the BSSVS analysis.
Markov jump reconstruction revealed that international viral introductions into Brazil were concentrated in a limited number of major dispersal pathways (Figure 4A). Europe overwhelmingly represented the principal external source of viral introductions, whereas additional introductions from South America occurred at substantially lower intensity. Among the Brazilian macroregions, the Southeast exhibited the highest inferred number of introduction events. Conversely, international viral dissemination from Brazil was primarily driven by the Southeast, while the North and South also contributed to outward viral spread at lower intensity (Figure 4B).
Figure 4.
Principal viral dispersal flows inferred from Markov jump analyses of Influenza A(H3N2). (A) Principal inferred viral introduction flows into Brazil. (B) Principal inferred viral dissemination flows from Brazil to other geographic regions. (C) Principal inferred viral dispersal flows among the five Brazilian macroregions. Ribbon width is proportional to the mean number of inferred Markov jumps, representing the relative intensity of viral dispersal between geographic locations.
Figure 4.
Principal viral dispersal flows inferred from Markov jump analyses of Influenza A(H3N2). (A) Principal inferred viral introduction flows into Brazil. (B) Principal inferred viral dissemination flows from Brazil to other geographic regions. (C) Principal inferred viral dispersal flows among the five Brazilian macroregions. Ribbon width is proportional to the mean number of inferred Markov jumps, representing the relative intensity of viral dispersal between geographic locations.
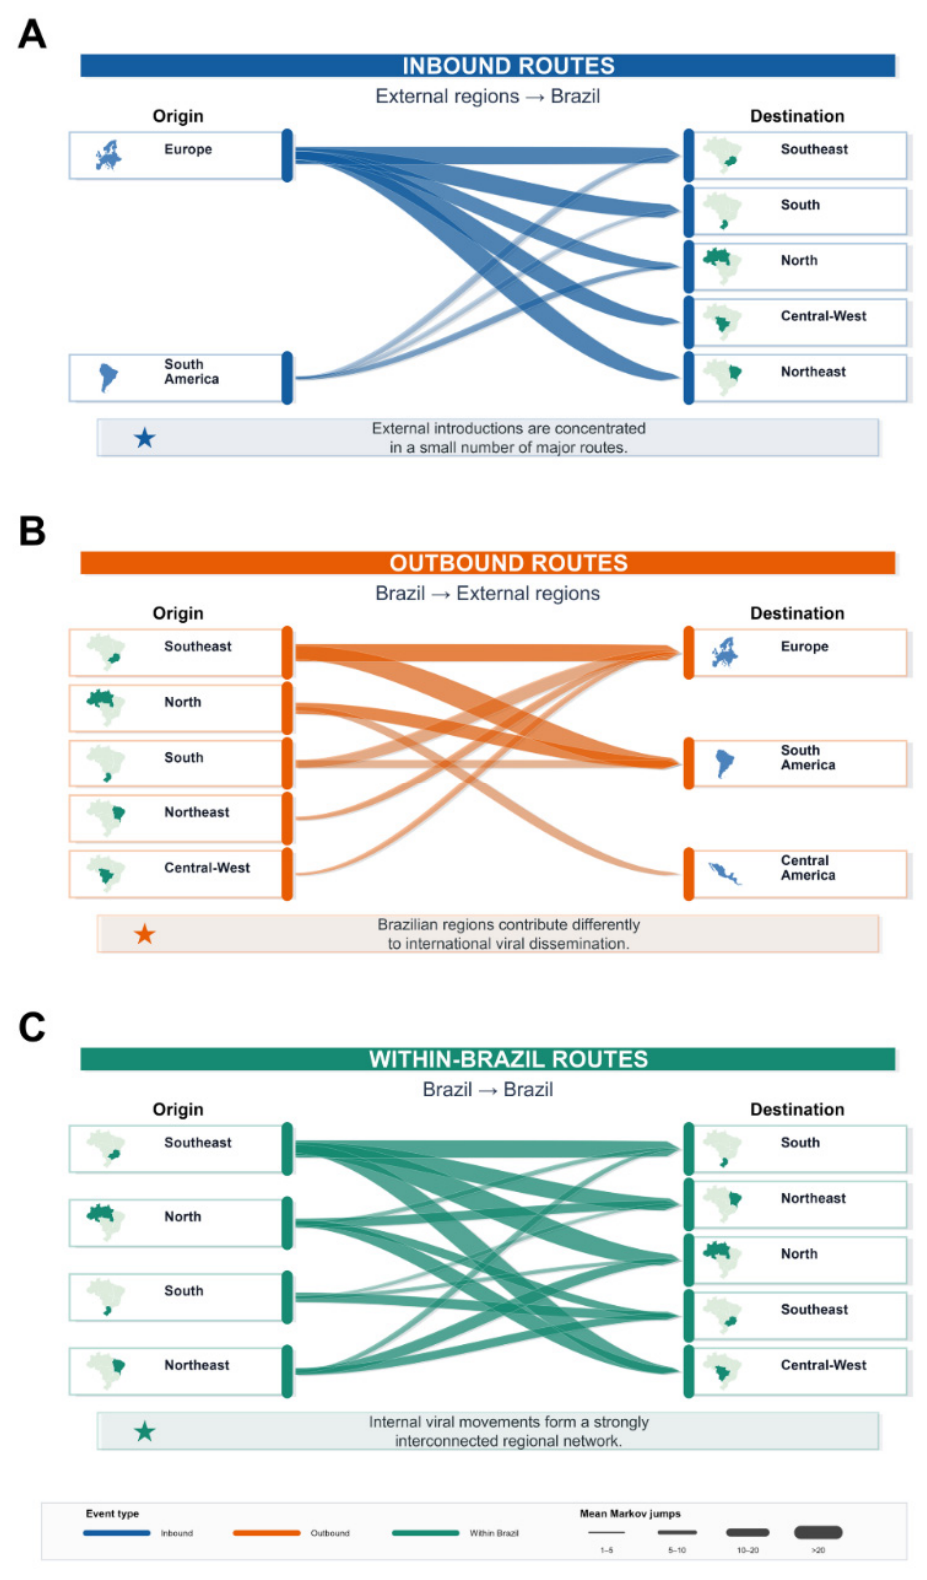
Within Brazil, viral dispersal formed a highly interconnected network linking all five macroregions (Figure 4C). Although the Southeast accounted for the greatest inferred intensity of outward viral dispersal, all Brazilian macroregions participated in substantial bidirectional exchanges, reflecting extensive connectivity throughout the national transmission network. The North and Northeast were actively involved in both viral importation and onward dissemination, reinforcing their contribution to the spatial dynamics of Influenza A(H3N2) circulation in Brazil.
Discussion
This study demonstrates that the spatial dynamics of Influenza A(H3N2) circulation in Brazil are sustained by a highly interconnected transmission network, characterized by recurrent international introductions and continuous viral exchange among Brazilian macroregions. Despite a remarkably stable seasonal pattern observed over nine consecutive years, viral populations exhibited progressive genetic diversification, continuous lineage turnover, and extensive phylogenetic intermixing across the country. Phylogeographic reconstruction further identified the Southeast region as the principal redistribution hub within Brazil while highlighting the contribution of the North and Northeast to the spatial dynamics of Influenza A(H3N2) circulation in Brazil. Collectively, these findings reveal that Influenza A(H3N2) circulation in Brazil is shaped by the interaction between stable seasonal dynamics, continuous viral evolution, and extensive spatial connectivity among Brazilian macroregions.
The consistent seasonal pattern observed throughout the study period reinforces previous evidence that influenza activity in Northern and Northeastern Brazil follows a temporal dynamic distinct from temperate regions, with epidemic peaks in the first months of the year, associated with local climatic conditions such as increased rainfall and humidity. This pattern contrasts with the winter-associated epidemics typical of temperate climates and has been consistently reported in tropical settings (Li et al., 2019; Lowen; Steel, 2014; Shaman et al., 2010; Tamerius et al., 2013; Zanobini et al., 2022). In Brazil, this heterogeneity has also been observed across geographic scales, including influenza activity linked to the rainy season in the Northeast and variation in timing along the latitudinal gradient (Almeida; Codeço; Luz, 2018; Moura; Perdigão; Siqueira, 2009).
This regional heterogeneity has important implications for influenza vaccination timing. Previous analyses of influenza activity in Belém and São Paulo between 1999 and 2007 showed that viral circulation in tropical and equatorial Brazil may not align with the traditional Southern Hemisphere vaccination schedule, with substantial activity occurring before the April campaign, particularly near the Equator (Mello et al., 2009). The findings from 2011–2019 confirm that early A(H3N2) circulation persists in the North and Northeast, reinforcing the stability of this pattern. Since vaccination should precede peak transmission, these results highlight the need to incorporate regional surveillance data when defining immunization strategies. This is particularly relevant in Brazil, where climatic diversity means a uniform schedule may not adequately cover all regions, supporting more regionally tailored, surveillance-informed vaccination policies.
The progressive increase in genetic diversity and the continuous replacement of viral lineages observed throughout the study period are consistent with the global evolutionary dynamics of Influenza A(H3N2), which are characterized by recurrent lineage turnover and the rapid emergence of antigenically distinct variants (Bahl et al., 2011; Bedford et al., 2015). Consistent with this global pattern, the Brazilian viral population did not exhibit prolonged persistence of a single dominant lineage but instead underwent successive lineage turnover accompanied by the transient co-circulation of multiple genetic clades. This evolutionary process is largely driven by antigenic drift, whereby the gradual accumulation of amino acid substitutions in the hemagglutinin protein generates variants capable of escaping pre-existing population immunity, favoring their establishment and subsequent replacement of previously circulating lineages (Koel et al., 2013). Similar evolutionary dynamics have been described in other tropical and highly connected regions, reinforcing that the diversification observed in Brazil is part of a broader global metapopulation maintained through recurrent viral migration and lineage replacement (Al Khatib et al., 2019; Boonnak et al., 2021; Jallow et al., 2024).
The evolutionary patterns observed in this study indicate that the genetic diversity of Influenza A(H3N2) circulating in Brazil is maintained through the continuous introduction, diversification, and replacement of viral lineages rather than by the prolonged persistence of locally evolving populations. This interpretation is supported by the extensive phylogenetic intermixing among Brazilian and international sequences, together with recent tMRCA estimates, which collectively indicate a process of continuous lineage renewal throughout the study period. The evolutionary rate estimated for the HA gene was consistent with previous reports describing the rapid molecular evolution of Influenza A(H3N2), reinforcing that the continuous emergence of genetically distinct variants is an intrinsic feature of this virus (Bedford et al., 2015; Rambaut et al., 2008). Collectively, these findings support the concept of Influenza A(H3N2) as a globally interconnected metapopulation, in which recurrent viral migration, rapid genetic diversification, and successive lineage replacement jointly shape the long-term evolutionary dynamics of Influenza A(H3N2) (Bahl et al., 2011; Bedford et al., 2015; Pollett et al., 2015).
The phylogeographic reconstruction revealed that Influenza A(H3N2) circulation in Brazil is sustained by a highly interconnected transmission network characterized by multiple international viral introductions and continuous viral exchange among Brazilian macroregions. Following their introduction into the country, viral lineages were extensively redistributed across Brazil, generating a dynamic pattern of bidirectional dispersal. Within this network, the Southeast emerged as the principal redistribution hub, whereas the North and Northeast actively participated in both viral introduction and onward dissemination. These findings expand previous phylogeographic evidence from Brazil by demonstrating that the national transmission network is structured through extensive connectivity among all macroregions, with the North and Northeast functioning as active components of this interconnected system rather than peripheral recipients of viral lineages (Born et al., 2016). Together, these results provide new insights into the spatial organization of Influenza A(H3N2) transmission in Brazil and reinforce the importance of considering the entire national transmission network when interpreting viral dissemination dynamics.
The integration of epidemiological, phylogenetic, evolutionary, and phylogeographic analyses provided a comprehensive framework for understanding the circulation dynamics of Influenza A(H3N2) in Brazil. Rather than describing isolated aspects of viral transmission, this integrated approach revealed how seasonal circulation, continuous viral evolution, and recurrent spatial dissemination interact to shape influenza epidemics across the country. These findings demonstrate the value of combining genomic and epidemiological surveillance to better characterize transmission networks and identify patterns of viral dissemination, thereby providing a stronger evidence base for surveillance and public health decision-making in geographically diverse settings such as Brazil.
This study should be interpreted in light of some limitations. The phylogenetic and phylogeographic inferences relied on sequences available through genomic surveillance programs and public databases, resulting in an uneven spatial and temporal distribution of samples across Brazilian macroregions. Consequently, some transmission pathways may have been underrepresented, particularly in areas with lower sequencing intensity. Nevertheless, the consistency of the seasonal patterns observed over nine years and the convergence of independent epidemiological, evolutionary, and phylogeographic analyses support the robustness of the main conclusions. Future studies integrating more comprehensive genomic surveillance with human mobility and environmental data may further refine our understanding of Influenza A(H3N2) transmission dynamics in Brazil.
Conclusions
This study provides an integrated view of the seasonal, evolutionary, and phylogeographic dynamics of Influenza A(H3N2) circulation in Brazil. By combining epidemiological, genomic, and phylogeographic evidence, this study demonstrates that influenza transmission is sustained by a highly interconnected national network characterized by recurrent international introductions, continuous lineage turnover, and extensive viral exchange among Brazilian macroregions. Within this network, the North and Northeast emerge as active contributors to viral introduction and dissemination, highlighting their importance for understanding national transmission dynamics. Together, these findings contribute to a more comprehensive understanding of Influenza A(H3N2) transmission in tropical settings and highlight the importance of integrating epidemiological and genomic data to strengthen future influenza surveillance and control strategies.
Supplementary Materials
The following supporting information can be downloaded at the website of this paper posted on Preprints.org.
Author Contributions
Wanderley Dias das Chagas Junior: conceptualization, investigation, data curation, visualization, writing – original draft, writing – review and editing. Amanda Mendes Silva Cruz: conceptualization, investigation, data curation, visualization, formal analysis, writing – original draft, writing – review and editing. Luana Soares Barbagelata: conceptualization, investigation, data curation, writing – original draft, writing – review and editing. Jessylene de Almeida Ferreira: investigation. Edivaldo Costa Sousa Junior: formal analysis. Edna Maria Acunã de Sousa Fillizola: investigation. James Lima Ferreira: investigation. Wagner Davy Lucas Barreto Junior: formal analysis. Tulio de Lima Campos: formal analysis. Terezinha Maria de Paiva: investigation. Katia Corrêa de Oliveira Santos: investigation. Marilda Agudo Mendonça Teixeira de Siqueira: investigation. Paola Cristina Resende: investigation, writing – original draft, writing – review and editing. Fernando do Couto Motta: investigation. Walquiria Aparecida Ferreira de Almeida: resources, investigation. Francisco José de Paula Junior: resources, investigation. Miriam Teresinha Furlam Prando Livorati: resources, investigation. Luana da Silva Soares Farias: resources. Mirleide Cordeiro dos Santos: investigation, supervision. Fernando Neto Tavares: conceptualization, supervision, writing – original draft, writing – review and editing. Rita Catarina Medeiros Sousa: supervision, writing – original draft, writing – review and editing. All authors have read and agreed to the published version of the manuscript.
Funding
This study was supported by the Brazilian Ministry of Health, through the Secretariat of Health and Environmental Surveillance and the Evandro Chagas Institute, which provided institutional funding, laboratory infrastructure, and resources for the development of the research. Additional support was provided by the Coordenação de Aperfeiçoamento de Pessoal de Nível Superior (CAPES), Brazil, through a doctoral scholarship. P.C.R. was supported by a CNPq Productivity Research Fellowship (311759/2022–0) and JCNE FAPERJ (E-26/204.426/2025). NIC Fiocruz was supported by CNPq PROEP (441699/2024-3), CVSLR/FIOCRUZ and General Laboratory Coordination (CGLab) of the Brazilian Ministry of Health.
Institutional Review Board Statement
Activities from this study were conducted as part of routine public health surveillance authorized by the Brazilian Ministry of Health (MoH). The study was approved by the Research Ethics Committee for Human Subjects of the Instituto Evandro Chagas (CAAE No. 574858.8.0000.0019), in accordance with Resolution No. 466/2012 of the Brazilian National Health Council, and by the Research Ethics Committee associated with NIC-Fiocruz (CAAE No. 68118417.6.0000.5248). The SISGEN (National System for the Management of Genetic Heritage and Associated Traditional Knowledge) registration number for the Brazilian virus genomes used in this study is A15FAF3.
Informed Consent Statement
The study used respiratory specimens and associated epidemiological data obtained through routine influenza surveillance activities conducted within the Brazilian national surveillance system. Samples and epidemiological information were analyzed without individual identification, and confidentiality was maintained throughout the study. The requirement for individual informed consent was waived by the Research Ethics Committee in accordance with the approved study protocol.
Data Availability Statement
The sequence data analyzed in this study are available in the GISAID EpiFlu database. The final dataset used for phylogenetic and phylogeographic analyses is available under accession EPI_SET_260814cn. Additional epidemiological data supporting the findings of this study are available from the corresponding author upon reasonable request, subject to institutional and ethical restrictions.
Acknowledgments
The authors are grateful to the healthcare professionals and scientists involved in influenza and respiratory virus surveillance across Brazil. The authors gratefully acknowledge all data contributors, i.e., the Authors and their Originating laboratories responsible for obtaining the specimens, and their Submitting laboratories for generating the genetic sequence and metadata and sharing via the GISAID Initiative, on which this research is based. The authors thank the State Health Departments and the Central Public Health Laboratories (LACENs) of Acre, Alagoas, Amapá, Amazonas, Bahia, Ceará, Espírito Santo, Goiás, Maranhão, Mato Grosso, Mato Grosso do Sul, Minas Gerais, Pará, Paraíba, Paraná, Pernambuco, Piauí, Rio de Janeiro, Rio Grande do Norte, Rio Grande do Sul, Rondônia, Roraima, Santa Catarina, São Paulo, Sergipe, Tocantins, and the Federal District for their contributions to influenza surveillance, sample collection, processing, and shipment. The WHO National Influenza Centres at the Oswaldo Cruz Institute (IOC/Fiocruz), Rio de Janeiro, and the Adolfo Lutz Institute, São Paulo, are also acknowledged for their contributions to influenza genomic surveillance and sequence generation. The authors thank the Aggeu Magalhães Institute (Fiocruz Pernambuco), Recife, Brazil, for its valuable contribution to the analytical procedures performed in this study. The authors further thank the Evandro Chagas Institute, Ministry of Health of Brazil, for providing the institutional and laboratory infrastructure that enabled the development of this study, and the Coordenação de Aperfeiçoamento de Pessoal de Nível Superior (CAPES), Brazil, for support through a doctoral scholarship.
Conflicts of Interest
The authors declare no conflicts of interest.
References
- AL KHATIB, Hebah A.; et al. Epidemiological and genetic characterization of pH1N1 and H3N2 influenza viruses circulated in MENA region during 2009–2017. BMC Infect. Dis. 2019, v. 19(n. 1), 314. [Google Scholar] [CrossRef] [PubMed]
- ALMEIDA, Alexandra; CODEÇO, Cláudia; LUZ, Paula M. Seasonal dynamics of influenza in Brazil: the latitude effect. BMC Infect. Dis. 2018, v. 18(n. 1), 695. [Google Scholar] [CrossRef] [PubMed]
- ALONSO, Wladimir J.; et al. Seasonality of Influenza in Brazil: A Traveling Wave from the Amazon to the Subtropics. Am. J. Epidemiol. 2007, v. 165(n. 12), 1434–1442. [Google Scholar] [CrossRef] [PubMed]
- BAHL, Justin; et al. Temporally structured metapopulation dynamics and persistence of influenza A H3N2 virus in humans. Proc. Natl. Acad. Sci. 2011, v. 108(n. 48), 19359–19364. [Google Scholar] [CrossRef] [PubMed]
- BEDFORD, Trevor; et al. Global Migration Dynamics Underlie Evolution and Persistence of Human Influenza A (H3N2). PLoS Pathog. 2010, v. 6(n. 5), e1000918. [Google Scholar]
- BEDFORD, Trevor; et al. Global circulation patterns of seasonal influenza viruses vary with antigenic drift. Nat. 2015, v. 523(n. 7559), 217–220. [Google Scholar] [CrossRef] [PubMed]
- BIELEJEC, Filip; et al. SpreaD3: Interactive Visualization of Spatiotemporal History and Trait Evolutionary Processes. Mol. Biol. Evol. 2016, v. 33(n. 8), 2167–2169. [Google Scholar] [CrossRef] [PubMed]
- BLOOM-FESHBACH, Kimberly; et al. Latitudinal Variations in Seasonal Activity of Influenza and Respiratory Syncytial Virus (RSV): A Global Comparative Review. PLoS ONE 2013, v. 8(n. 2), e54445. [Google Scholar]
- BOONNAK, Kobporn; et al. Molecular Characterization of Seasonal Influenza A and B from Hospitalized Patients in Thailand in 2018–2019. Viruses 2021, v. 13(n. 6), 977. [Google Scholar] [CrossRef] [PubMed]
- BORN; Silva, Priscila; et al. Phylodynamics of influenza A(H3N2) in South America, 1999–2012. Infect. Genet. Evol. 2016, v. 43, 312–320. [Google Scholar] [CrossRef] [PubMed]
- HADFIELD, James; et al. Nextstrain: real-time tracking of pathogen evolution. Bioinform. 2018, v. 34(n. 23), 4121–4123. [Google Scholar] [CrossRef] [PubMed]
- JALLOW; Malado, Mamadou; et al. Genetic and antigenic characterization of influenza A(H3N2) virus after 13 consecutive years of influenza surveillance in Senegal, 2010–2022. J. Med. Virol. 2024, v. 96(n. 10). [Google Scholar]
- KALYAANAMOORTHY, Subha; et al. ModelFinder: fast model selection for accurate phylogenetic estimates. Nat. Methods 2017, v. 14(n. 6), 587–589. [Google Scholar] [CrossRef] [PubMed]
- KATOH, Kazutaka; TOH, Hiroyuki. Parallelization of the MAFFT multiple sequence alignment program. Bioinform. 2010, v. 26(n. 15), 1899–900. [Google Scholar] [CrossRef] [PubMed]
- KEARSE, Matthew; et al. Geneious Basic: an integrated and extendable desktop software platform for the organization and analysis of sequence data. Bioinform. 2012, v. 28(n. 12), 1647–9. [Google Scholar] [CrossRef] [PubMed]
- KOEL, Björn F.; et al. Substitutions Near the Receptor Binding Site Determine Major Antigenic Change During Influenza Virus Evolution. Sci. 2013, v. 342(n. 6161), 976–979. [Google Scholar] [CrossRef] [PubMed]
- LI, Weizhong; GODZIK, Adam. Cd-hit: a fast program for clustering and comparing large sets of protein or nucleotide sequences. Bioinform. 2006, v. 22(n. 13), 1658–1659. [Google Scholar] [CrossRef] [PubMed]
- LI, You; et al. Global patterns in monthly activity of influenza virus, respiratory syncytial virus, parainfluenza virus, and metapneumovirus: a systematic analysis. Lancet Glob. Health 2019, v. 7(n. 8), e1031–e1045. [Google Scholar] [CrossRef] [PubMed]
- LOWEN, Anice C.; STEEL, John. Roles of Humidity and Temperature in Shaping Influenza Seasonality. J. Virol. 2014, v. 88(n. 14), 7692–7695. [Google Scholar] [CrossRef] [PubMed]
- MELLO; Alencar de, Wyller; et al. The Dilemma of Influenza Vaccine Recommendations when Applied to the Tropics: The Brazilian Case Examined Under Alternative Scenarios. PLoS ONE 2009, v. 4(n. 4), e5095. [Google Scholar]
- MINH, Bui Quang; et al. IQ-TREE 2: New Models and Efficient Methods for Phylogenetic Inference in the Genomic Era. Mol. Biol. Evol. 2020, v. 37(n. 5), 1530–1534. [Google Scholar] [CrossRef] [PubMed]
- MOURA, Fernanda E. A.; PERDIGÃO, Anne C. B.; SIQUEIRA, Marilda M. Seasonality of influenza in the tropics: a distinct pattern in northeastern Brazil. Am. J. Trop. Med. Hyg. 2009, v. 81(n. 1), 180–3. [Google Scholar] [CrossRef]
- NELSON, Martha I.; HOLMES, Edward C. The evolution of epidemic influenza. Nat. Rev. Genet. 2007, v. 8(n. 3), 196–205. [Google Scholar] [CrossRef] [PubMed]
- PETROVA, Velislava N.; RUSSELL, Colin A. The evolution of seasonal influenza viruses. Nat. Rev. Microbiol. 2018, v. 16(n. 1), 47–60. [Google Scholar] [CrossRef] [PubMed]
- POLLETT, Simon; et al. Phylogeography of Influenza A(H3N2) Virus in Peru, 2010–2012. Emerg. Infect. Dis. 2015, v. 21(n. 8), 1330–1338. [Google Scholar] [CrossRef] [PubMed]
- RAMBAUT, Andrew; et al. The genomic and epidemiological dynamics of human influenza A virus. Nat. 2008, v. 453(n. 7195), 615–619. [Google Scholar] [CrossRef] [PubMed]
- RAMBAUT, Andrew; et al. Exploring the temporal structure of heterochronous sequences using TempEst (formerly Path-O-Gen). Virus Evol. 2016, v. 2(n. 1), vew007. [Google Scholar] [CrossRef] [PubMed]
- RAMBAUT, Andrew; et al. Posterior Summarization in Bayesian Phylogenetics Using Tracer 1.7. Syst. Biol. 2018, v. 67(n. 5), 901–904. [Google Scholar] [CrossRef] [PubMed]
- RUSSELL, Colin A.; et al. Influenza vaccine strain selection and recent studies on the global migration of seasonal influenza viruses. Vaccine 2008, v. 26 Suppl 4, D31–4. [Google Scholar] [CrossRef] [PubMed]
- SHAMAN, Jeffrey; et al. Absolute Humidity and the Seasonal Onset of Influenza in the Continental United States. PLoS Biol. 2010, v. 8(n. 2), e1000316. [Google Scholar]
- SUCHARD, Marc A.; et al. Bayesian phylogenetic and phylodynamic data integration using BEAST 1.10. Virus Evol. 2018, v. 4(n. 1). [Google Scholar] [CrossRef] [PubMed]
- TAMERIUS, James D.; et al. Environmental Predictors of Seasonal Influenza Epidemics across Temperate and Tropical Climates. PLoS Pathog. 2013, v. 9(n. 3), e1003194. [Google Scholar]
- WICKHAM, Hadley. ggplot2; Springer International Publishing: Cham, 2016. [Google Scholar]
- ZANOBINI, Patrizio; et al. Global patterns of seasonal influenza activity, duration of activity and virus (sub)type circulation from 2010 to 2020. Influenza Other Respir. Viruses 2022, v. 16(n. 4), 696–706. [Google Scholar] [CrossRef] [PubMed]
Figure 1.
Seasonal dynamics of Influenza A(H3N2) circulation in Northern and Northeastern Brazil from 2011 to 2019. (A) Weekly heatmaps showing the weekly positivity (%) of Influenza A(H3N2) by epidemiological week (EW) for each year of the study period. Color intensity represents the weekly positivity rate, with darker shades indicating higher positivity. (B) LOESS-smoothed curves illustrating the overall seasonal trends of weekly Influenza A(H3N2) positivity in Northern (blue) and Northeastern (red) Brazil. Solid lines represent locally estimated scatterplot smoothing (LOESS) fitted trends, and shaded areas indicate the corresponding 95% confidence intervals.
Figure 1.
Seasonal dynamics of Influenza A(H3N2) circulation in Northern and Northeastern Brazil from 2011 to 2019. (A) Weekly heatmaps showing the weekly positivity (%) of Influenza A(H3N2) by epidemiological week (EW) for each year of the study period. Color intensity represents the weekly positivity rate, with darker shades indicating higher positivity. (B) LOESS-smoothed curves illustrating the overall seasonal trends of weekly Influenza A(H3N2) positivity in Northern (blue) and Northeastern (red) Brazil. Solid lines represent locally estimated scatterplot smoothing (LOESS) fitted trends, and shaded areas indicate the corresponding 95% confidence intervals.
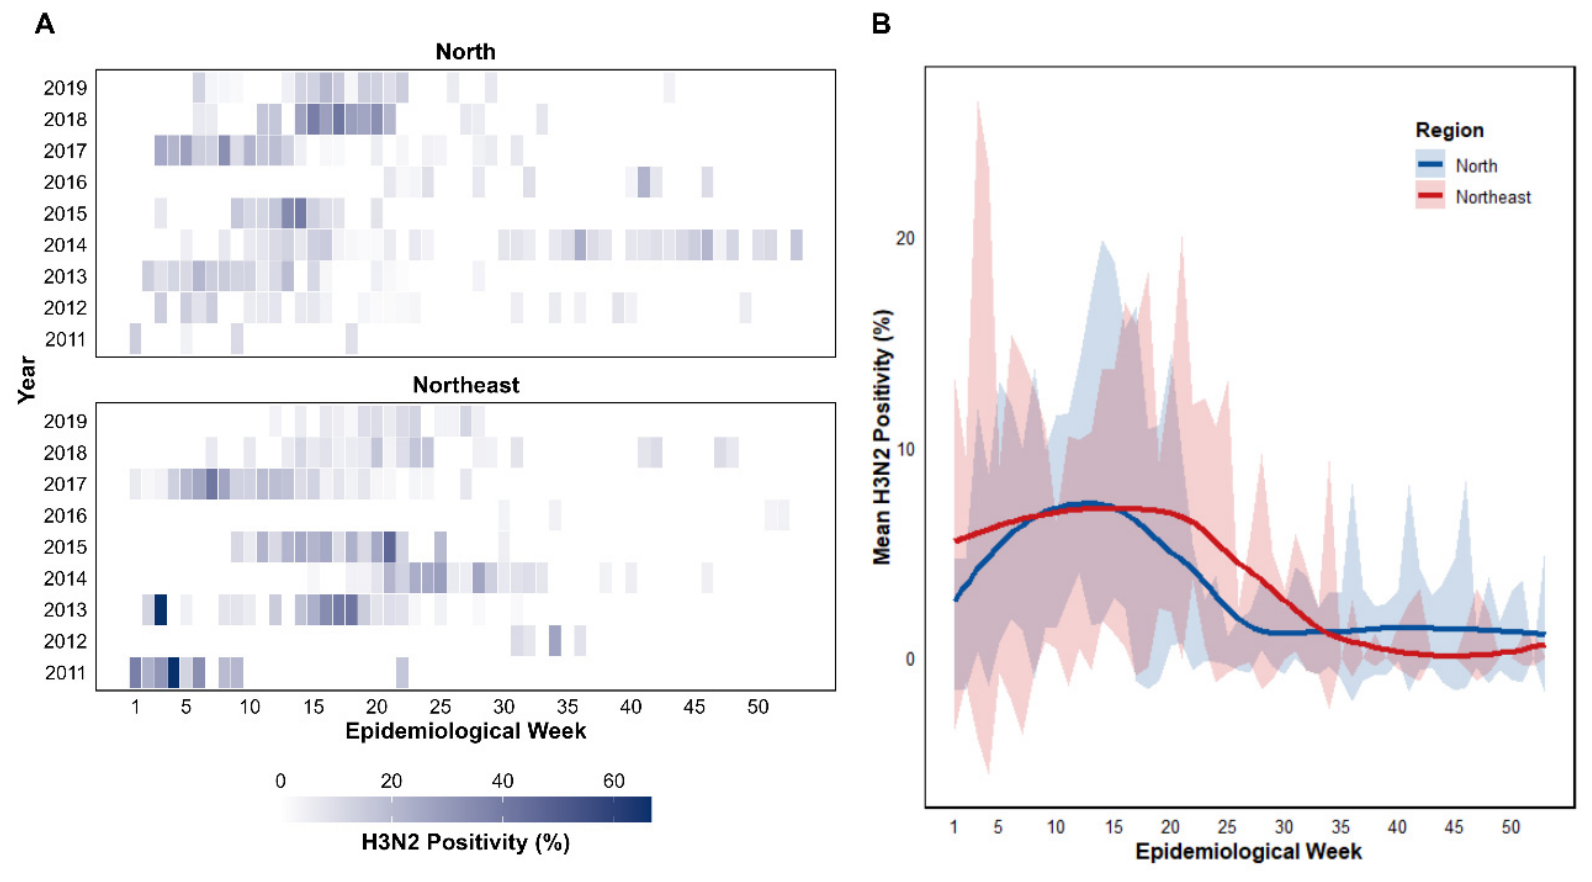
Figure 2.
Genetic diversity and temporal distribution of Influenza A(H3N2) clades circulating in Brazil between 2011 and 2019. (A) Geographic distribution of the 270 Brazilian HA gene sequences included in the study. Circle size is proportional to the number of sequences per state. (B) Annual distribution of Influenza A(H3N2) genetic clades. Bar height represents the total number of sequences analyzed each year, and colors indicate the corresponding clades. (C) Temporal and geographic distribution of individual HA gene sequences by sampling year, Brazilian macroregion, and genetic clade. Each circle represents one sequence.
Figure 2.
Genetic diversity and temporal distribution of Influenza A(H3N2) clades circulating in Brazil between 2011 and 2019. (A) Geographic distribution of the 270 Brazilian HA gene sequences included in the study. Circle size is proportional to the number of sequences per state. (B) Annual distribution of Influenza A(H3N2) genetic clades. Bar height represents the total number of sequences analyzed each year, and colors indicate the corresponding clades. (C) Temporal and geographic distribution of individual HA gene sequences by sampling year, Brazilian macroregion, and genetic clade. Each circle represents one sequence.
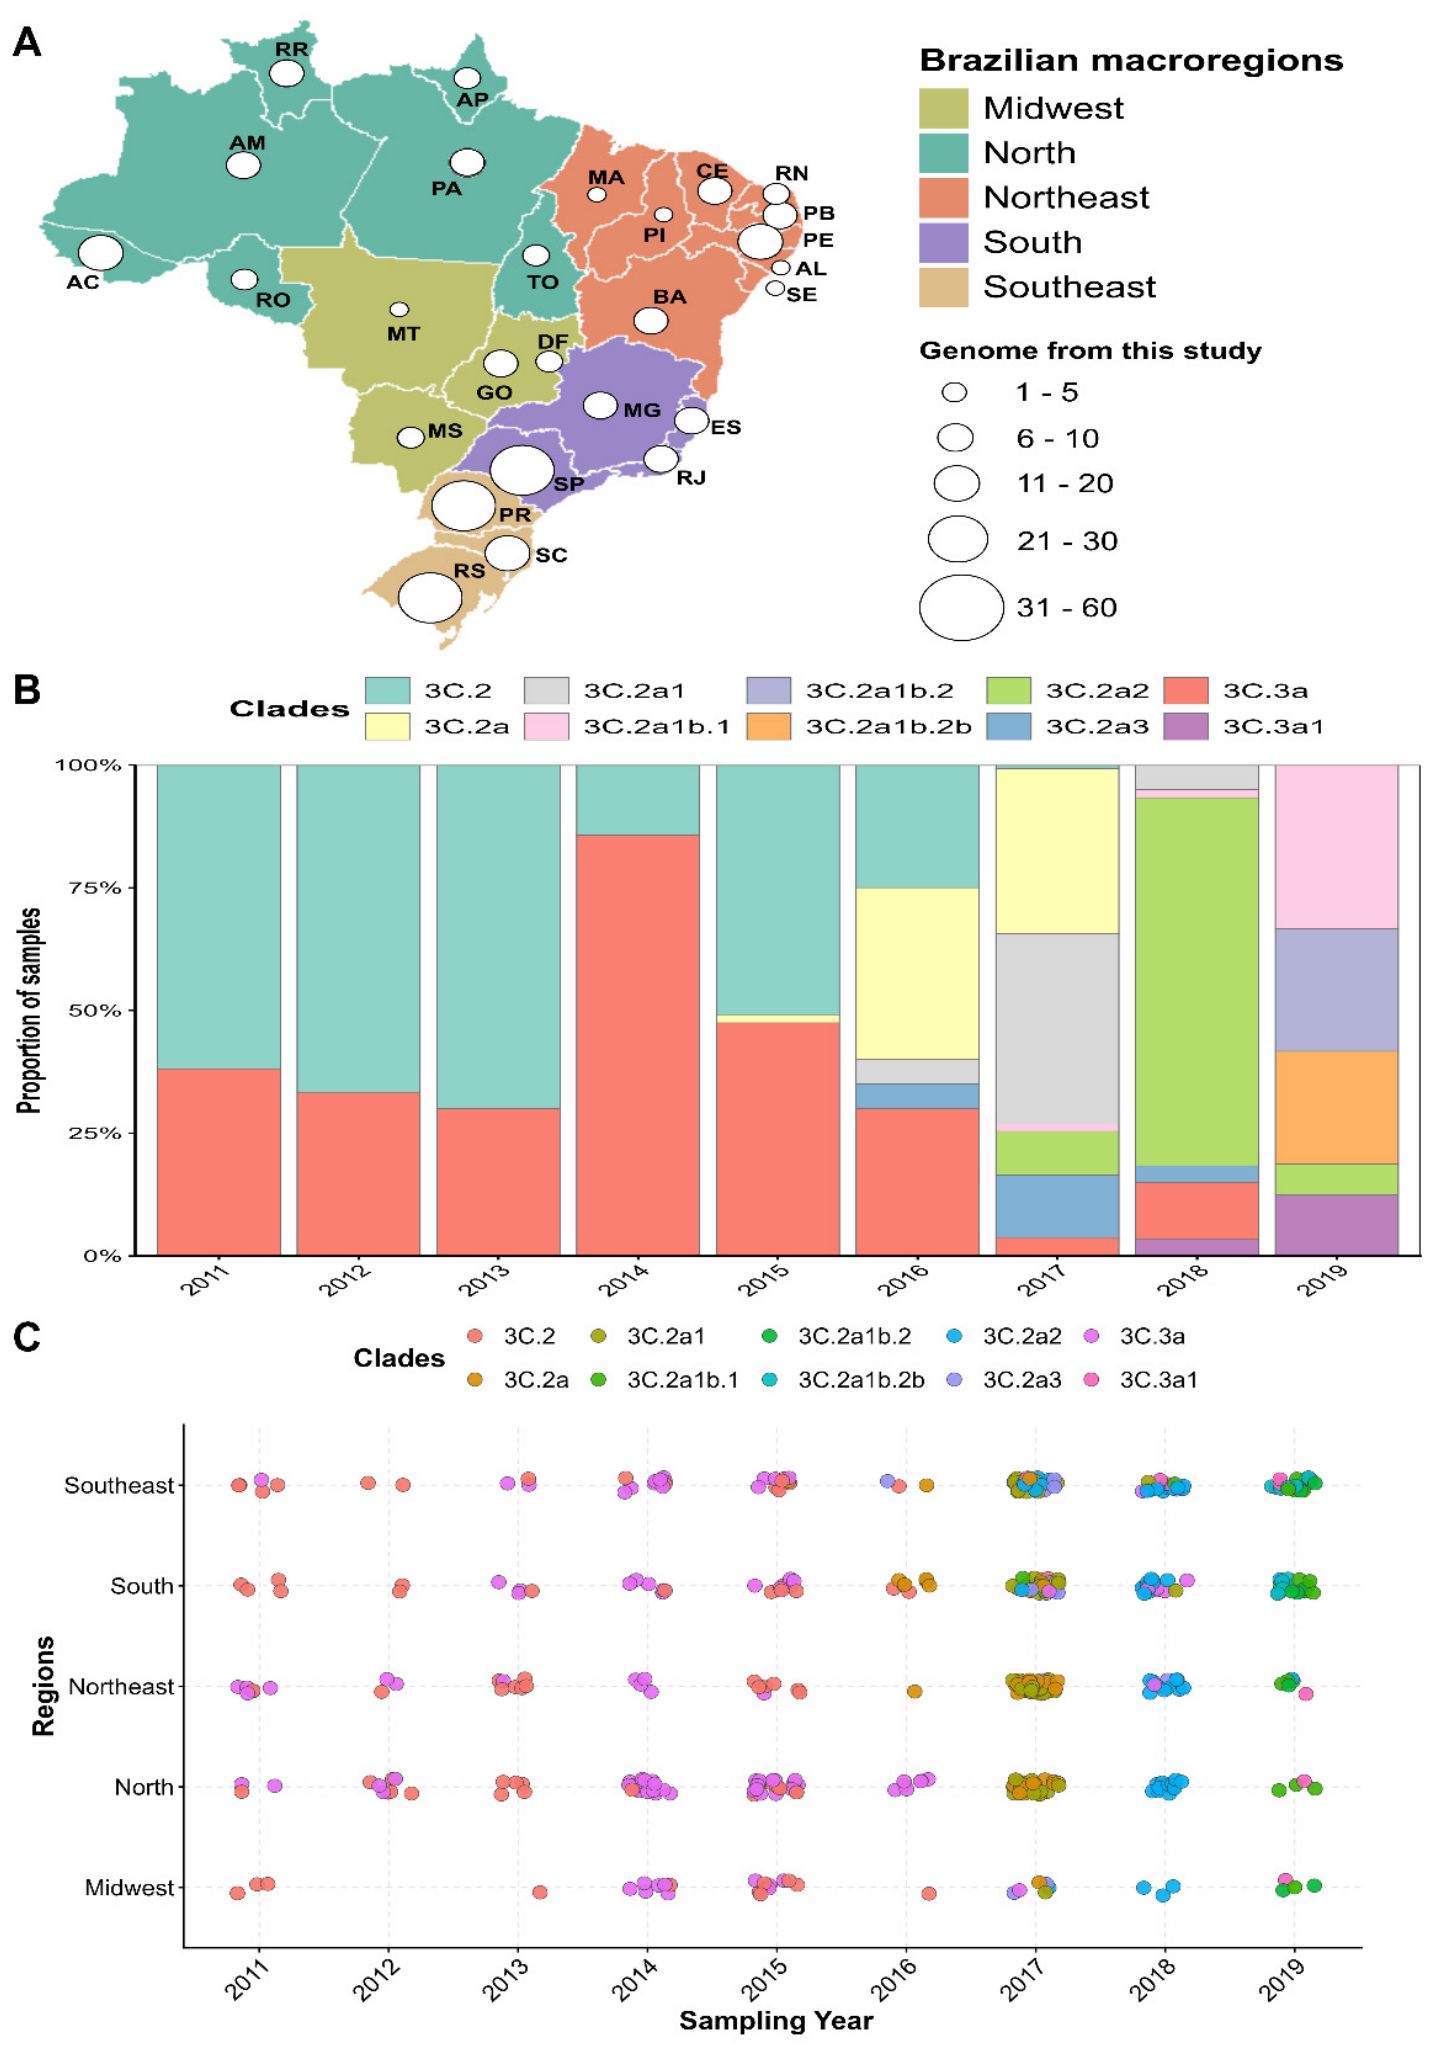
Figure 3.
Maximum clade credibility (MCC) tree inferred from Bayesian time-scaled phylogenetic analysis of Influenza A(H3N2) hemagglutinin (HA) gene sequences. Branch lengths represent time (years), and branches are colored according to sampling location (Africa, Asia, Central America, Europe, North America, Oceania, South America, Southeast Asia and the Brazilian macroregions: North, Northeast, Southeast, South, and Midwest). The tree illustrates the temporal distribution and phylogenetic relationships of Influenza A(H3N2) lineages sampled between 2011 and 2019.
Figure 3.
Maximum clade credibility (MCC) tree inferred from Bayesian time-scaled phylogenetic analysis of Influenza A(H3N2) hemagglutinin (HA) gene sequences. Branch lengths represent time (years), and branches are colored according to sampling location (Africa, Asia, Central America, Europe, North America, Oceania, South America, Southeast Asia and the Brazilian macroregions: North, Northeast, Southeast, South, and Midwest). The tree illustrates the temporal distribution and phylogenetic relationships of Influenza A(H3N2) lineages sampled between 2011 and 2019.
Disclaimer/Publisher’s Note: The statements, opinions and data contained in all publications are solely those of the individual author(s) and contributor(s) and not of MDPI and/or the editor(s). MDPI and/or the editor(s) disclaim responsibility for any injury to people or property resulting from any ideas, methods, instructions or products referred to in the content. |
© 2026 by the authors. Licensee MDPI, Basel, Switzerland. This article is an open access article distributed under the terms and conditions of the Creative Commons Attribution (CC BY) license (http://creativecommons.org/licenses/by/4.0/).
Copyright: This open access article is published under a Creative Commons CC BY 4.0 license, which permit the free download, distribution, and reuse, provided that the author and preprint are cited in any reuse.