
Submitted:
16 August 2026
Posted:
18 August 2026
You are already at the latest version
Abstract
In May 2026, the Democratic Republic of the Congo declared an outbreak of Bundibugyo virus disease (BVD) caused by Bundibugyo ebolavirus (BDBV), for which no licensed vaccine or antiviral treatment was available. We analysed the epidemic trajectory through 14 July 2026 and developed conditional six-month projections. Aggregated data from official INSP/COUSP Situation Reports (14 May–14 July 2026), supplemented by WHO and UN reports, were used to describe cases, deaths, case-fatality ratios (CFRs), and geographic spread. Log-linear models estimated phase-specific growth rates and doubling times; logistic, Gompertz, and constant-incidence scenarios were used for projections, with model comparison, Bayesian sensitivity analysis, deterministic sensitivity bounds, CFR confidence intervals, and rolling-origin validation. Confirmed cases increased from 8 to 2,073, with 796 deaths (national CFR, 38.4%), while affected health zones increased from 3 to 45 across five provinces. Doubling time increased from 8.9 to 19.5 and 25.1 days, representing a 64.1% reduction in growth rate. Ituri accounted for 89.9% of cases, while North Kivu had a CFR of 58.7%. Six-month projections ranged from 2,624 cases under rapid containment to 3,942 under continued deceleration and 10,839 with persistent recent incidence. Although proportional growth slowed, transmission and geographic expansion remained active. The divergence between modelling approaches and systematic under-prediction in temporal validation indicate substantial forecast uncertainty; projections should therefore be interpreted as conditional planning scenarios rather than deterministic forecasts.
Keywords:
Bundibugyo virus disease
; Ebola
; Democratic Republic of the Congo
; epidemic growth
; doubling time
; case fatality ratio
; geographic spread
; scenario projections
; Bayesian growth model
1. Introduction
Ebola virus disease (EVD) is a severe viral haemorrhagic fever caused by viruses belonging to the genus Orthoebolavirus, family Filoviridae, and order Mononegavirales. Among the recognised orthoebolaviruses associated with human disease, Bundibugyo ebolavirus represents one of the least extensively characterised species because relatively few outbreaks and clinical datasets have been documented [1]. Bundibugyo virus disease was first recognised during an outbreak in western Uganda in 2007 and was subsequently reported in the Democratic Republic of the Congo (DRC) in 2012 [2]. Compared with Zaire ebolavirus, the principal cause of previous large DRC outbreaks, Bundibugyo virus remains associated with major gaps in available medical countermeasures. Vaccines and therapeutics developed primarily against Zaire ebolavirus, including rVSV-ZEBOV and Zaire-specific monoclonal antibody products, cannot be assumed to provide equivalent protection against Bundibugyo virus because of substantial antigenic differences between species [3].
Taxonomically, Bundibugyo virus belongs to the species Bundibugyo orthoebolavirus. It is an enveloped, non-segmented, negative-sense single-stranded RNA virus with a genome of approximately 19 kb encoding seven major structural and functional proteins: nucleoprotein, VP35, VP40, glycoprotein, VP30, VP24, and the RNA-dependent RNA polymerase [4]. Comparative genomic studies have shown that Bundibugyo virus is genetically distinct from Zaire, Sudan, Taï Forest, and Reston orthoebolaviruses, particularly within the glycoprotein gene and other regions relevant to antigenicity, host-cell entry, immune evasion, and molecular diagnostics [5]. Whole-genome sequencing during an outbreak is therefore essential for confirming species identity, evaluating genetic relatedness to historical strains, distinguishing a new zoonotic introduction from sustained human-to-human transmission, and monitoring mutations that could affect diagnostic assay performance. Detailed phylogenetic data from the 2026 Bunia outbreak should be incorporated when officially released by INRB, WHO, or other authorised genomic surveillance partners [6,7].
On 15 May 2026, the DRC Ministry of Health officially declared an EVD outbreak following laboratory confirmation of Bundibugyo virus in Ituri Province. The outbreak subsequently expanded across eastern and northeastern DRC, affecting Ituri, North Kivu, South Kivu, Haut-Uélé, and Tshopo. By 14 July 2026, national surveillance reports documented 2,073 confirmed cases, 796 confirmed deaths, and transmission across 45 health zones. The rapid geographic expansion occurred in a setting characterized by recurrent insecurity, population displacement, mining-related mobility, cross-provincial travel, restricted access to healthcare, and variable availability of decentralized molecular diagnostics and treatment capacity [8,9].
Retrospective epidemiological investigations suggested that transmission may have preceded formal recognition by several weeks. Delayed detection may have been influenced by limited access to Bundibugyo-specific molecular assays in peripheral health zones, reliance on diagnostic platforms primarily configured for Zaire ebolavirus, incomplete community-based surveillance, and logistical barriers to specimen referral. Such delays are particularly consequential for EVD because late isolation, delayed contact identification, community deaths, and undetected transmission chains can accelerate geographic dissemination and increase mortality [10,11].
This study provides an updated epidemiological synthesis of the 2026 Bundibugyo virus disease outbreak using official Situation Reports issued between 14 May and 14 July 2026. The objectives were to: (1) characterise the overall epidemic trajectory; (2) estimate phase-specific growth rates and doubling times; (3) assess changes in the geographic distribution of cases across provinces and health zones; (4) compare provincial burden and reported case fatality ratios; (5) describe available demographic and operational indicators; and (6) evaluate evidence of temporal deceleration or continuing transmission. Based on the observed epidemiological trajectory, we also aimed to project the possible six-month progression of the outbreak under alternative rapid-containment, continued-deceleration, and sustained-incidence scenarios. Additional objectives were to: (7) compare candidate growth models and quantify the reduction in growth rate between phases; (8) characterize expected-trajectory versus posterior-predictive uncertainty using a complementary Bayesian framework; (9) extend the scenario comparison with deterministic sensitivity bounds; and (10) assess forecast calibration through rolling-origin validation.
2. Methods
2.1. Data Sources
Primary data were derived from 53 available official SitReps numbered 1–61 and issued by the INSP Centre des Opérations d'Urgence de Santé Publique (COUSP-RDC), available at https://insp.cd/ebola-17eme-epidemie/, covering 14 May to 14 July 2026 [12]. Not all sequentially numbered SitReps were available; analyses therefore used the reporting dates and observations contained in the available reports without interpolation. Supplementary contextual information was drawn, where necessary, from official communications issued by national authorities, WHO, and United Nations agencies. The INSP/COUSP series remained the primary source for all quantitative case, death, CFR, provincial, and health-zone analyses.
2.2. Case Definitions
Confirmed cases: Any person with a positive BDBV nucleic acid amplification test (NAAT) performed by the INRB reference laboratory, specifically its authorized mobile diagnostic units deployed in Ituri and all affected provinces
Confirmed deaths: deaths in laboratory-confirmed BDBV cases.
Case fatality rate (CFR) = confirmed deaths / confirmed cases × 100%.
2.3. Statistical Analysis
Each SitRep reporting date was treated as a discrete epidemiological observation point. Descriptive analyses were conducted across all available SitReps from 14 May to 14 July 2026 and included cumulative confirmed cases, confirmed deaths, recoveries, suspected cases, patients in isolation, contact follow-up rates, and the numbers of affected provinces and health zones. Absolute and percentage changes between consecutive available SitReps were calculated where data were reported. Because several SitReps documented retrospective cleaning, harmonisation, and reclassification of DHIS2 data, changes in cumulative totals were not automatically interpreted as incident events unless explicitly reported as new cases.
To characterise epidemic growth over time, log-linear regression models were fitted to cumulative confirmed case counts for three predefined periods: an early growth phase, an intermediate phase, and a late phase. The early phase covered SitReps 15–27, the intermediate phase covered SitReps 27–47, and the late phase covered SitReps 47–61. For each phase, the epidemic growth rate was estimated from the slope of the regression of the natural logarithm of cumulative confirmed cases on calendar time. Doubling time was calculated as T2 = ln(2)/r, where r represents the estimated daily growth rate. Model fit was assessed using the coefficient of determination, and estimates were interpreted descriptively because cumulative observations were serially correlated and subject to retrospective revision.
Six-month scenario projections were generated from 14 July 2026 to 14 January 2027 under three conditional assumptions. A logistic model represented rapid containment and progressive saturation; a Gompertz model represented slower but sustained deceleration; and a constant-incidence scenario assumed continuation of the mean absolute increase observed from 30 June to 14 July (47.6 confirmed cases per day). Logistic and Gompertz parameters were estimated by nonlinear least squares using all available cumulative-case observations. Residual bootstrap resampling with 1,000 iterations was used to derive empirical 95% uncertainty intervals. An unbounded exponential model was examined only as a stress test and was not retained as a plausible six-month forecast because it generated biologically and operationally unrealistic totals.
Province- and health-zone-level burden was summarized using cumulative confirmed cases, confirmed deaths, reported case fatality ratios, and proportional contribution to the national total. Geographic expansion was assessed by tracking the number of affected provinces and health zones over time. Reported case fatality ratios were calculated as cumulative confirmed deaths divided by cumulative confirmed cases multiplied by 100. These ratios were interpreted cautiously because they may have been influenced by delayed outcome reporting, community deaths, small denominators, incomplete case ascertainment, and retrospective reclassification. To quantify the statistical precision of province-level CFRs directly rather than relying solely on qualitative caution, exact Wilson score 95% confidence intervals were calculated for each province's CFR [13].
Demographic and exposure-related variables were analysed only when sufficiently disaggregated data were available. Because age, sex, occupation, household linkage, exposure category, and healthcare-worker status were not consistently reported across SitReps, no formal demographic modelling was undertaken.
2.3.1. National-Level Growth-Model Comparison
Four candidate nonlinear growth models exponential, logistic, Gompertz, and generalized-logistic (Richards) were fitted to the complete national aggregated cumulative-case series (21 unique data points spanning SitReps 1–61, combining the values reported in Table 1 and the values annotated in Figure 2, which agreed exactly on all overlapping SitReps) [14,15]. Models were fitted by nonlinear least squares and compared using the root-mean-square error (RMSE), the small-sample-corrected Akaike Information Criterion (AICc), and the Bayesian Information Criterion (BIC) [16,17]. This comparison was necessarily conducted at the national level: disaggregating growth-model comparison by province or health zone, would require case time series indexed by health zone and date, which were not available in the aggregated SitRep summaries used for this analysis.
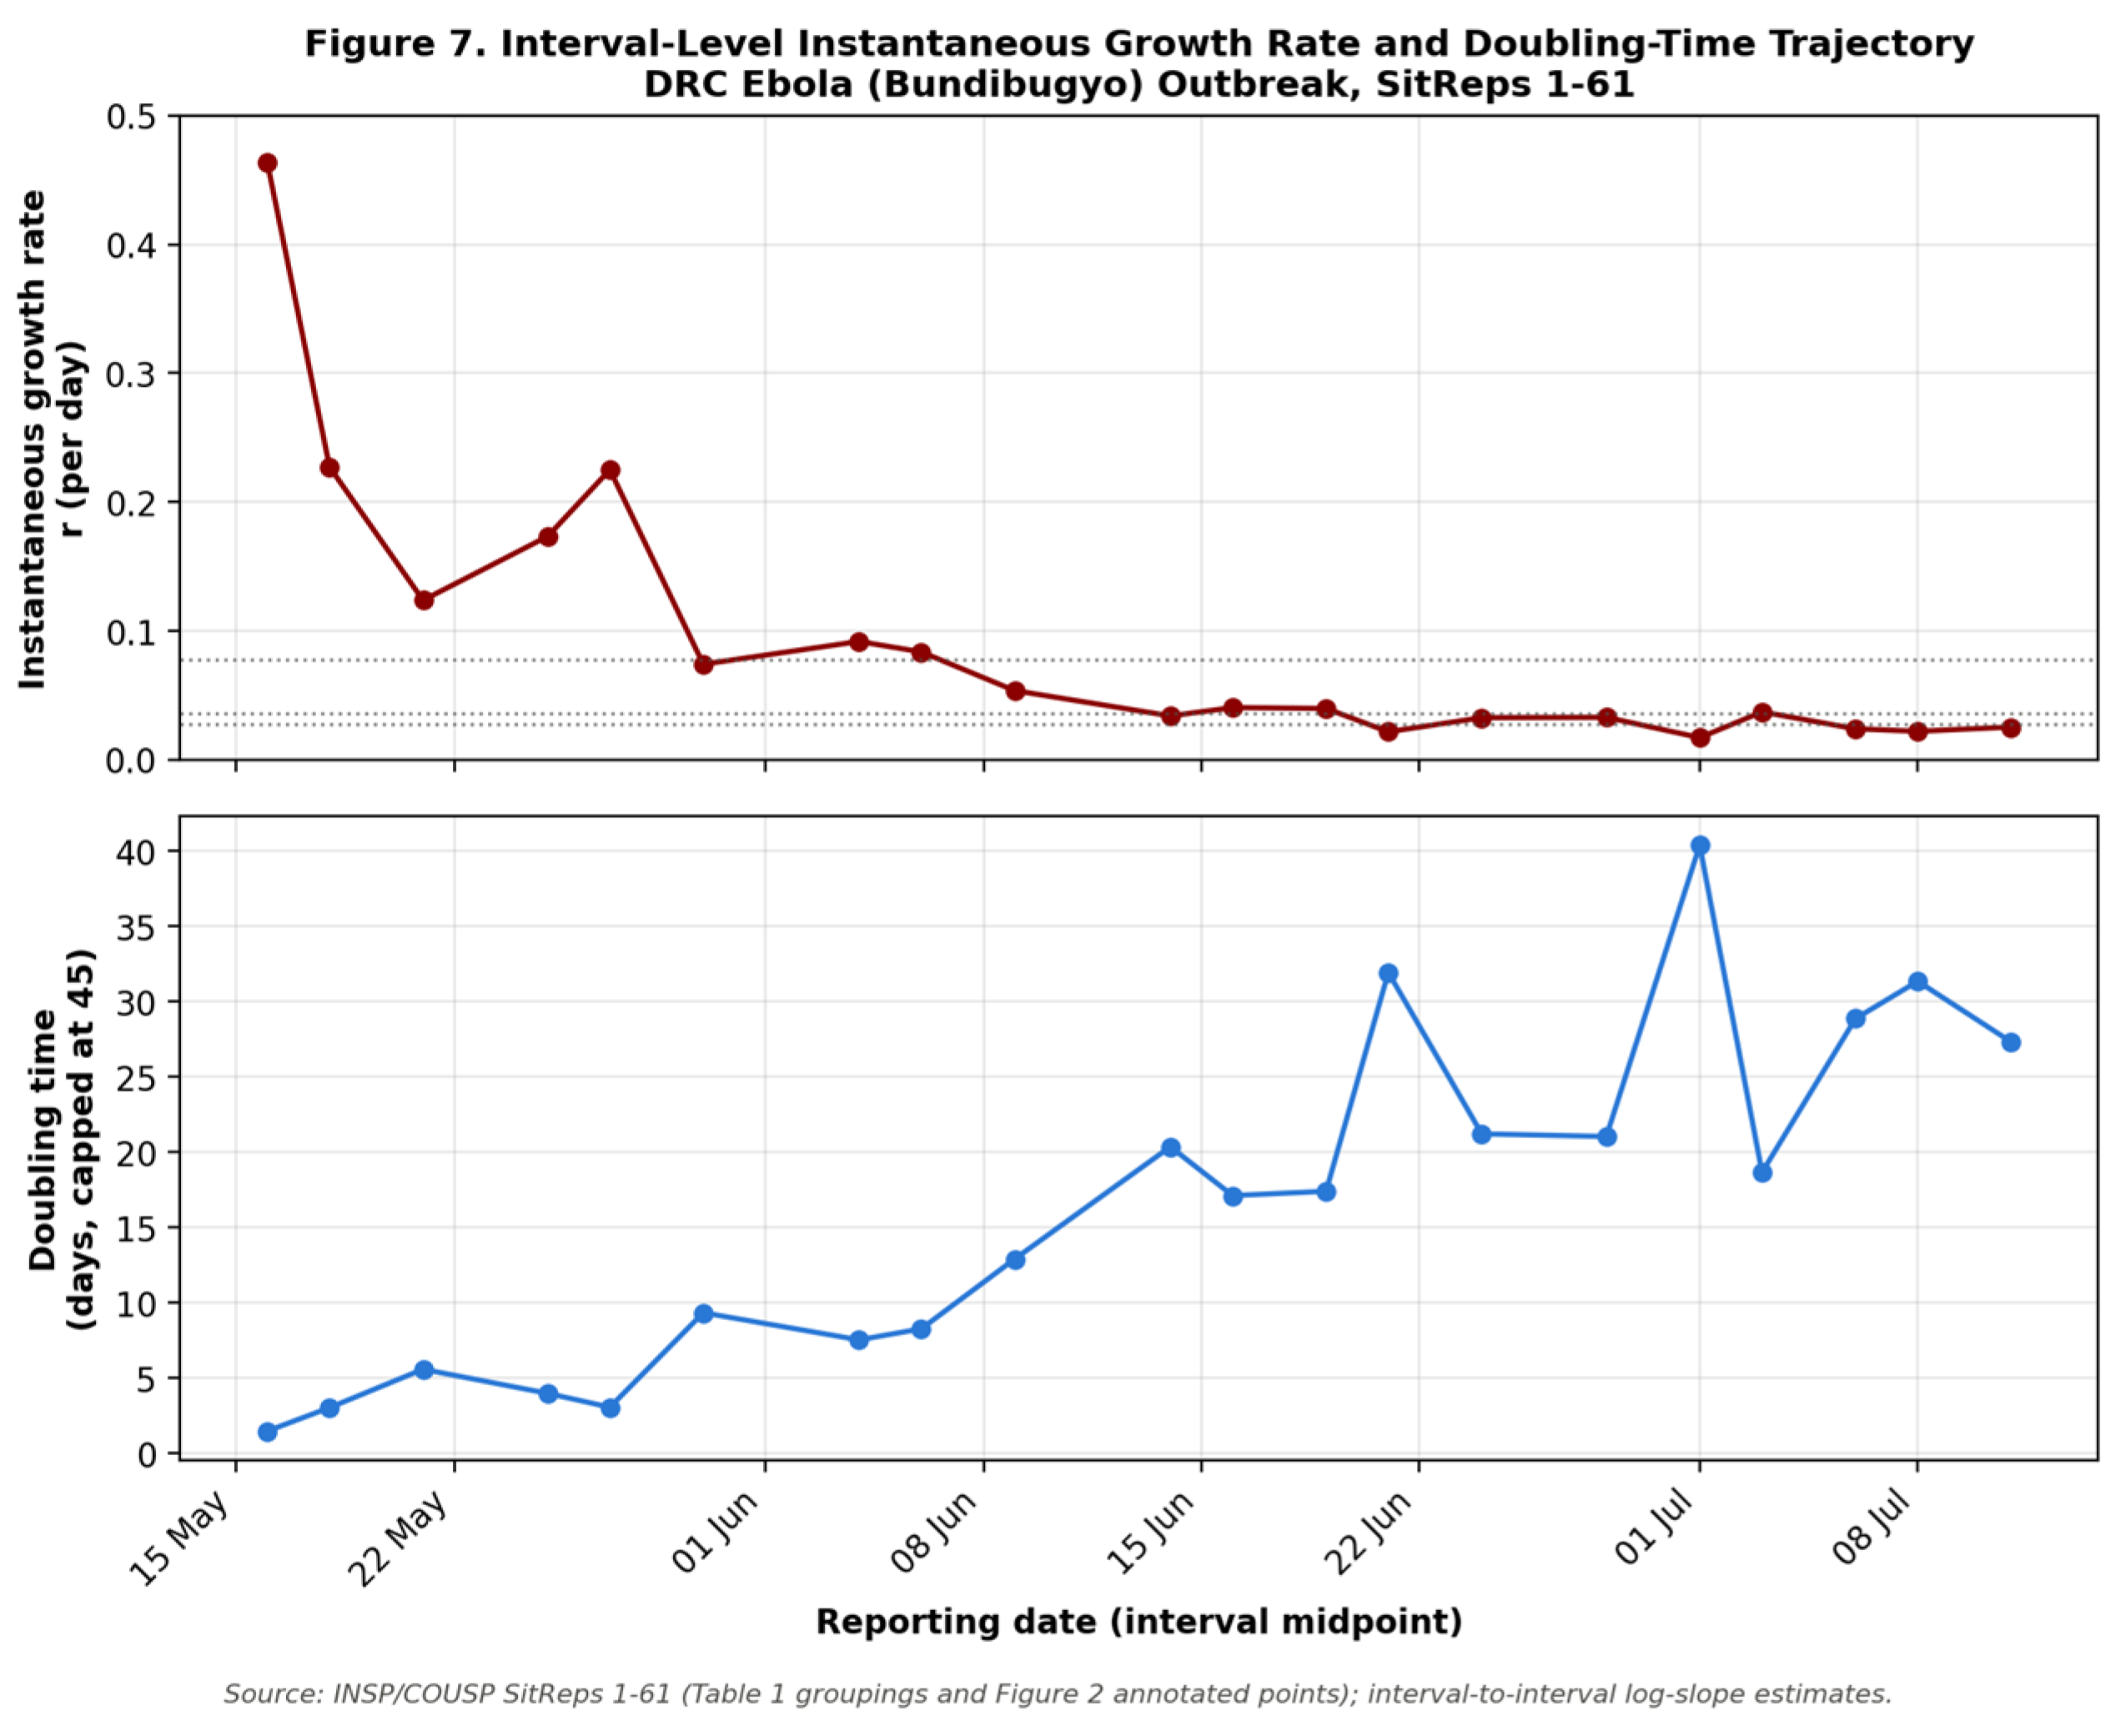
Interval-level growth-rate and doubling-time trajectory. To complement the three-phase summary above, instantaneous growth rates and doubling times were additionally estimated between each pair of consecutive available data points (ri = [ln(yi+1) − ln(yi)] / Δti; Td,i = ln(2)/ri), producing a finer-grained trajectory of acceleration, deceleration, and plateauing than the three discrete phases alone (Figure 3).
Growth-rate reduction between phases. The proportional reduction in growth rate between successive phases was calculated as Δr = rearlier − rlater and as the percentage reduction (Δr / rearlier × 100), to quantify the magnitude of epidemic deceleration between phases between phases rather than describing deceleration only qualitatively.
Bayesian sensitivity analysis. As a complementary Bayesian sensitivity analysis, a Bayesian nonlinear Gompertz growth model with a negative-binomial observation model (to accommodate overdispersion in count data) was fitted to the national aggregated case series using Markov chain Monte Carlo sampling, implemented with the affine-invariant ensemble sampler in the Python package emcee [18,19]. Sampling used 40 walkers for 25,000 iterations, with an 8,000-iteration burn-in and a thinning interval of 25. Posterior draws of the expected epidemic trajectory were used to quantify parameter and trajectory uncertainty, while posterior-predictive draws additionally incorporated observation-level dispersion. This Bayesian analysis was conducted as a complementary sensitivity analysis and was reported separately from the residual-bootstrap intervals presented in Table 5.
Extended deterministic sensitivity scenarios. Two further scenarios were generated by proportionally scaling both the growth rate (r) and carrying capacity (K) of the Gompertz curve underlying the primary six-month projection (Section 3.6) by ±30%, representing an illustrative improved-control scenario (reduced transmission and lower ultimate epidemic size) and an illustrative insecurity-driven resurgence scenario (increased transmission and higher ultimate epidemic size). The Gompertz parameters used for this perturbation were those calibrated to reproduce the originally primary Gompertz projection (Section 3.6), rather than the independently refitted Gompertz model used for the model-comparison exercise above (Section 3.2.2), which was fitted to a coarser aggregated series for the purpose of comparing functional forms on equal terms; the two Gompertz fits are therefore not numerically identical and are not intended to be combined. These sensitivity scenarios are deterministic bounds rather than probabilistic forecasts.
Forecast calibration. Forecast calibration was assessed through rolling-origin temporal validation: the Gompertz model was re-fitted using only data available up to each of four earlier truncation points (SitReps 39, 44, 50, and 55), and the resulting projection for SitRep 61 was compared with the actually reported value.
All statistical analyses and visualisations were performed using R version 4.3.x and Python, including the pandas, NumPy, SciPy, stats models, emcee, and matplotlib libraries. A two-sided significance level of 0.05 was applied where inferential statistics were reported.
2.4. Ethical Considerations
All data are derived from publicly available, aggregated official surveillance reports. No individual-level patient data were accessed. Ethical approval was not required per applicable guidelines for secondary analysis of aggregated public health surveillance data.
3. Results
3.1. Overall Epidemic Trajectory
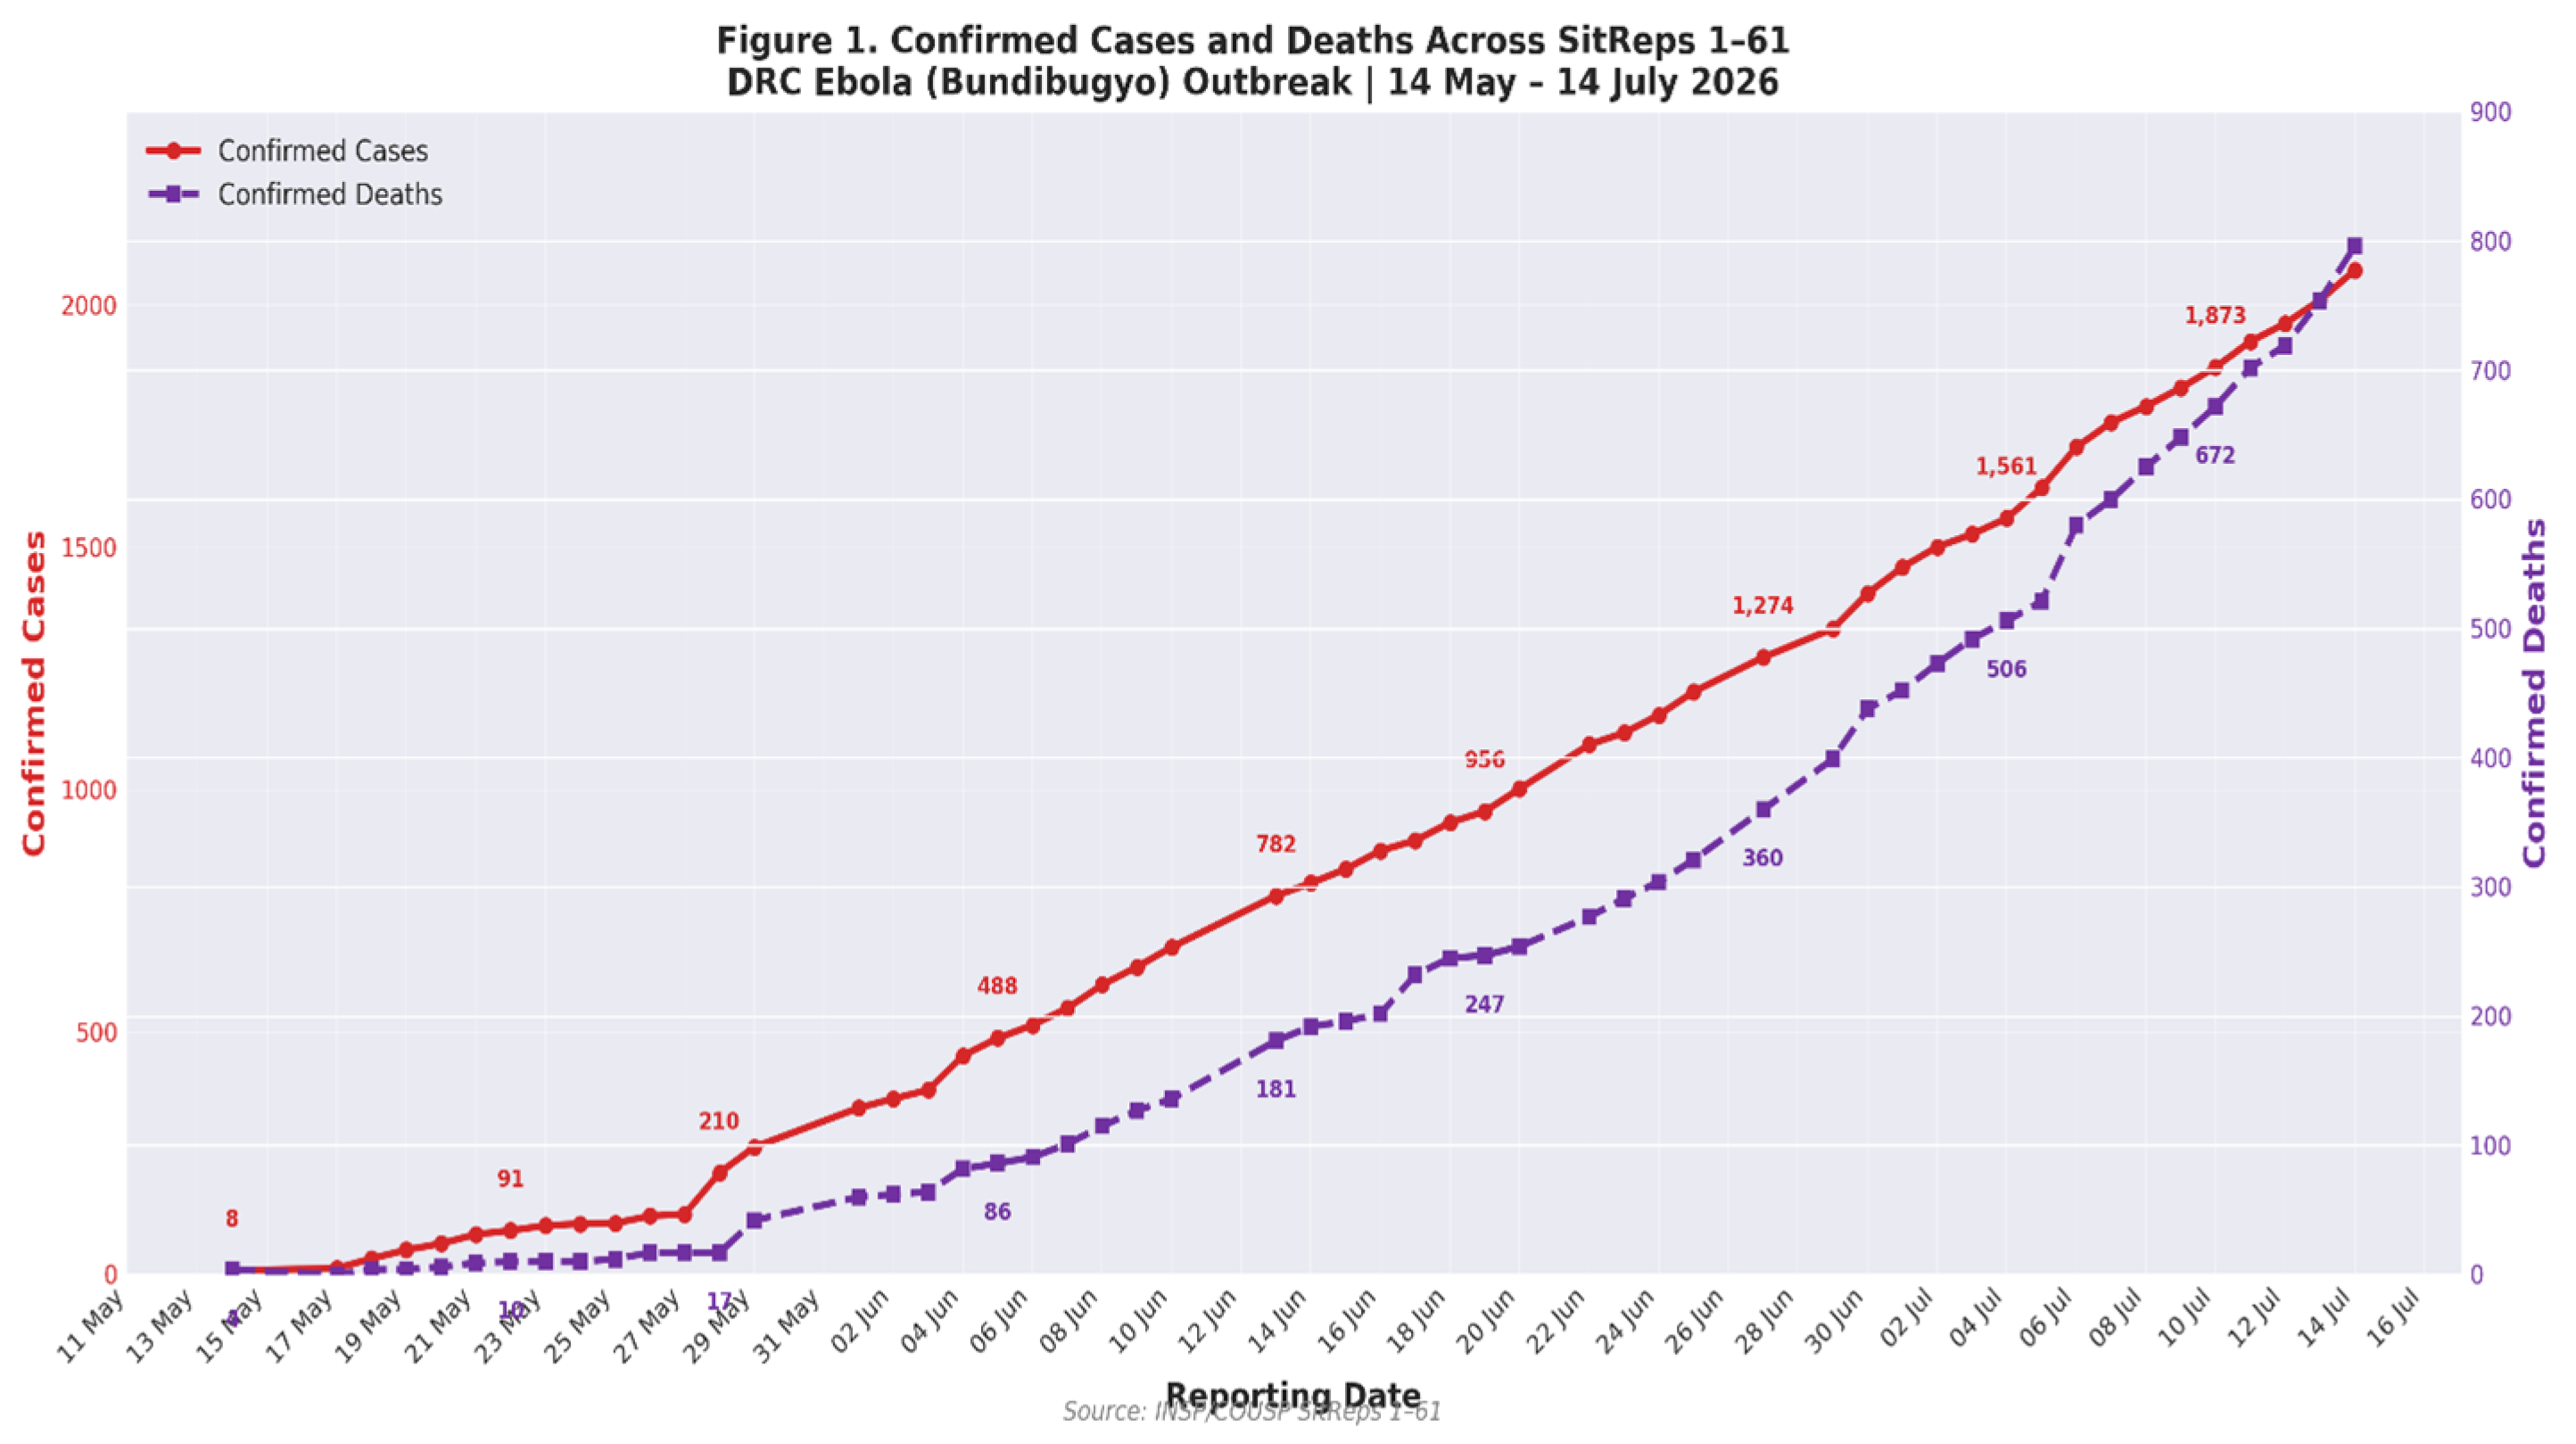
The epidemic expanded rapidly during the observation period. Confirmed cases increased from 8 in SitRep 1 on 14 May 2026 to 2,073 in SitRep 61 on 14 July 2026, representing a 259-fold increase over 61 days. During the same period, cumulative confirmed deaths increased from 4 to 796, while cumulative recoveries reached 377. The reported case fatality ratio increased from 16.0% in SitRep 15 on 29 May to 26.7% in SitRep 42 on 25 June, 31.2% in SitRep 47 on 30 June, and 38.4% in SitRep 61 on 14 July 2026. The number of affected health zones rose from 3 on 14 May to 22 by 29 May, 34 by 25 June, 37 by 6 July, and 45 by 14 July. The number of affected provinces increased from one to five following the recognition of Haut-Uélé and Tshopo in July 2026.
Overall, the updated trajectory indicates that transmission remained active through mid-July 2026. Although the estimated epidemic growth rate slowed over time, the outbreak had not entered a sustained decline by 14 July. Continued increases in confirmed cases, deaths, affected health zones, and provinces indicate ongoing community transmission and persistent gaps in early detection, referral, contact follow-up, and access to supportive care.
Figure 1.
Confirmed Cases and Deaths Across SitReps 1–61, DRC Ebola (Bundibugyo) Outbreak, May 14th–July 14th 2026.
Figure 1.
Confirmed Cases and Deaths Across SitReps 1–61, DRC Ebola (Bundibugyo) Outbreak, May 14th–July 14th 2026.
3.2. Epidemic Growth Rate and Doubling Time
3.2.1. Three-Phase Log-Linear Analysis
Log-linear regression applied to cumulative confirmed case counts showed progressive deceleration in epidemic growth. During the early phase (SitReps 15–27), the estimated daily growth rate was r = 0.078/day, corresponding to a doubling time of 8.9 days. During the intermediate phase (SitReps 27–47), the growth rate declined to r = 0.036/day, with a doubling time of 19.5 days. In the late phase (SitReps 47–61; 30 June–14 July 2026), the growth rate decreased further to r = 0.028/day, corresponding to a doubling time of 25.1 days.
These findings indicate a clear slowing of epidemic expansion between late May and mid-July 2026. However, the outbreak had not entered a sustained decline by 14 July, as cumulative confirmed cases continued to increase from 1,406 at SitRep 47 to 2,073 at SitRep 61. The progressive lengthening of the doubling time may reflect the combined effects of expanded Ebola Treatment Centre capacity, decentralized diagnostic services, intensified contact tracing, improved cross-border coordination, and broader implementation of response measures. Nevertheless, persistent community deaths, interruptions in response activities, variable contact follow-up, and continued geographic expansion to five provinces and 45 health zones indicate that containment remained incomplete.
These estimates should be interpreted cautiously because they are based on cumulative SitRep data that were repeatedly revised through DHIS2 cleaning, harmonisation, and reclassification. In addition, cumulative observations are serially correlated, and changes between consecutive SitReps do not always correspond exactly to incident cases. Therefore, the estimated growth rates and doubling times are best understood as descriptive indicators of epidemic trajectory rather than precise measures of transmission intensity.
Figure 2.
Log-linear growth of confirmed cases across SitReps 15–61.
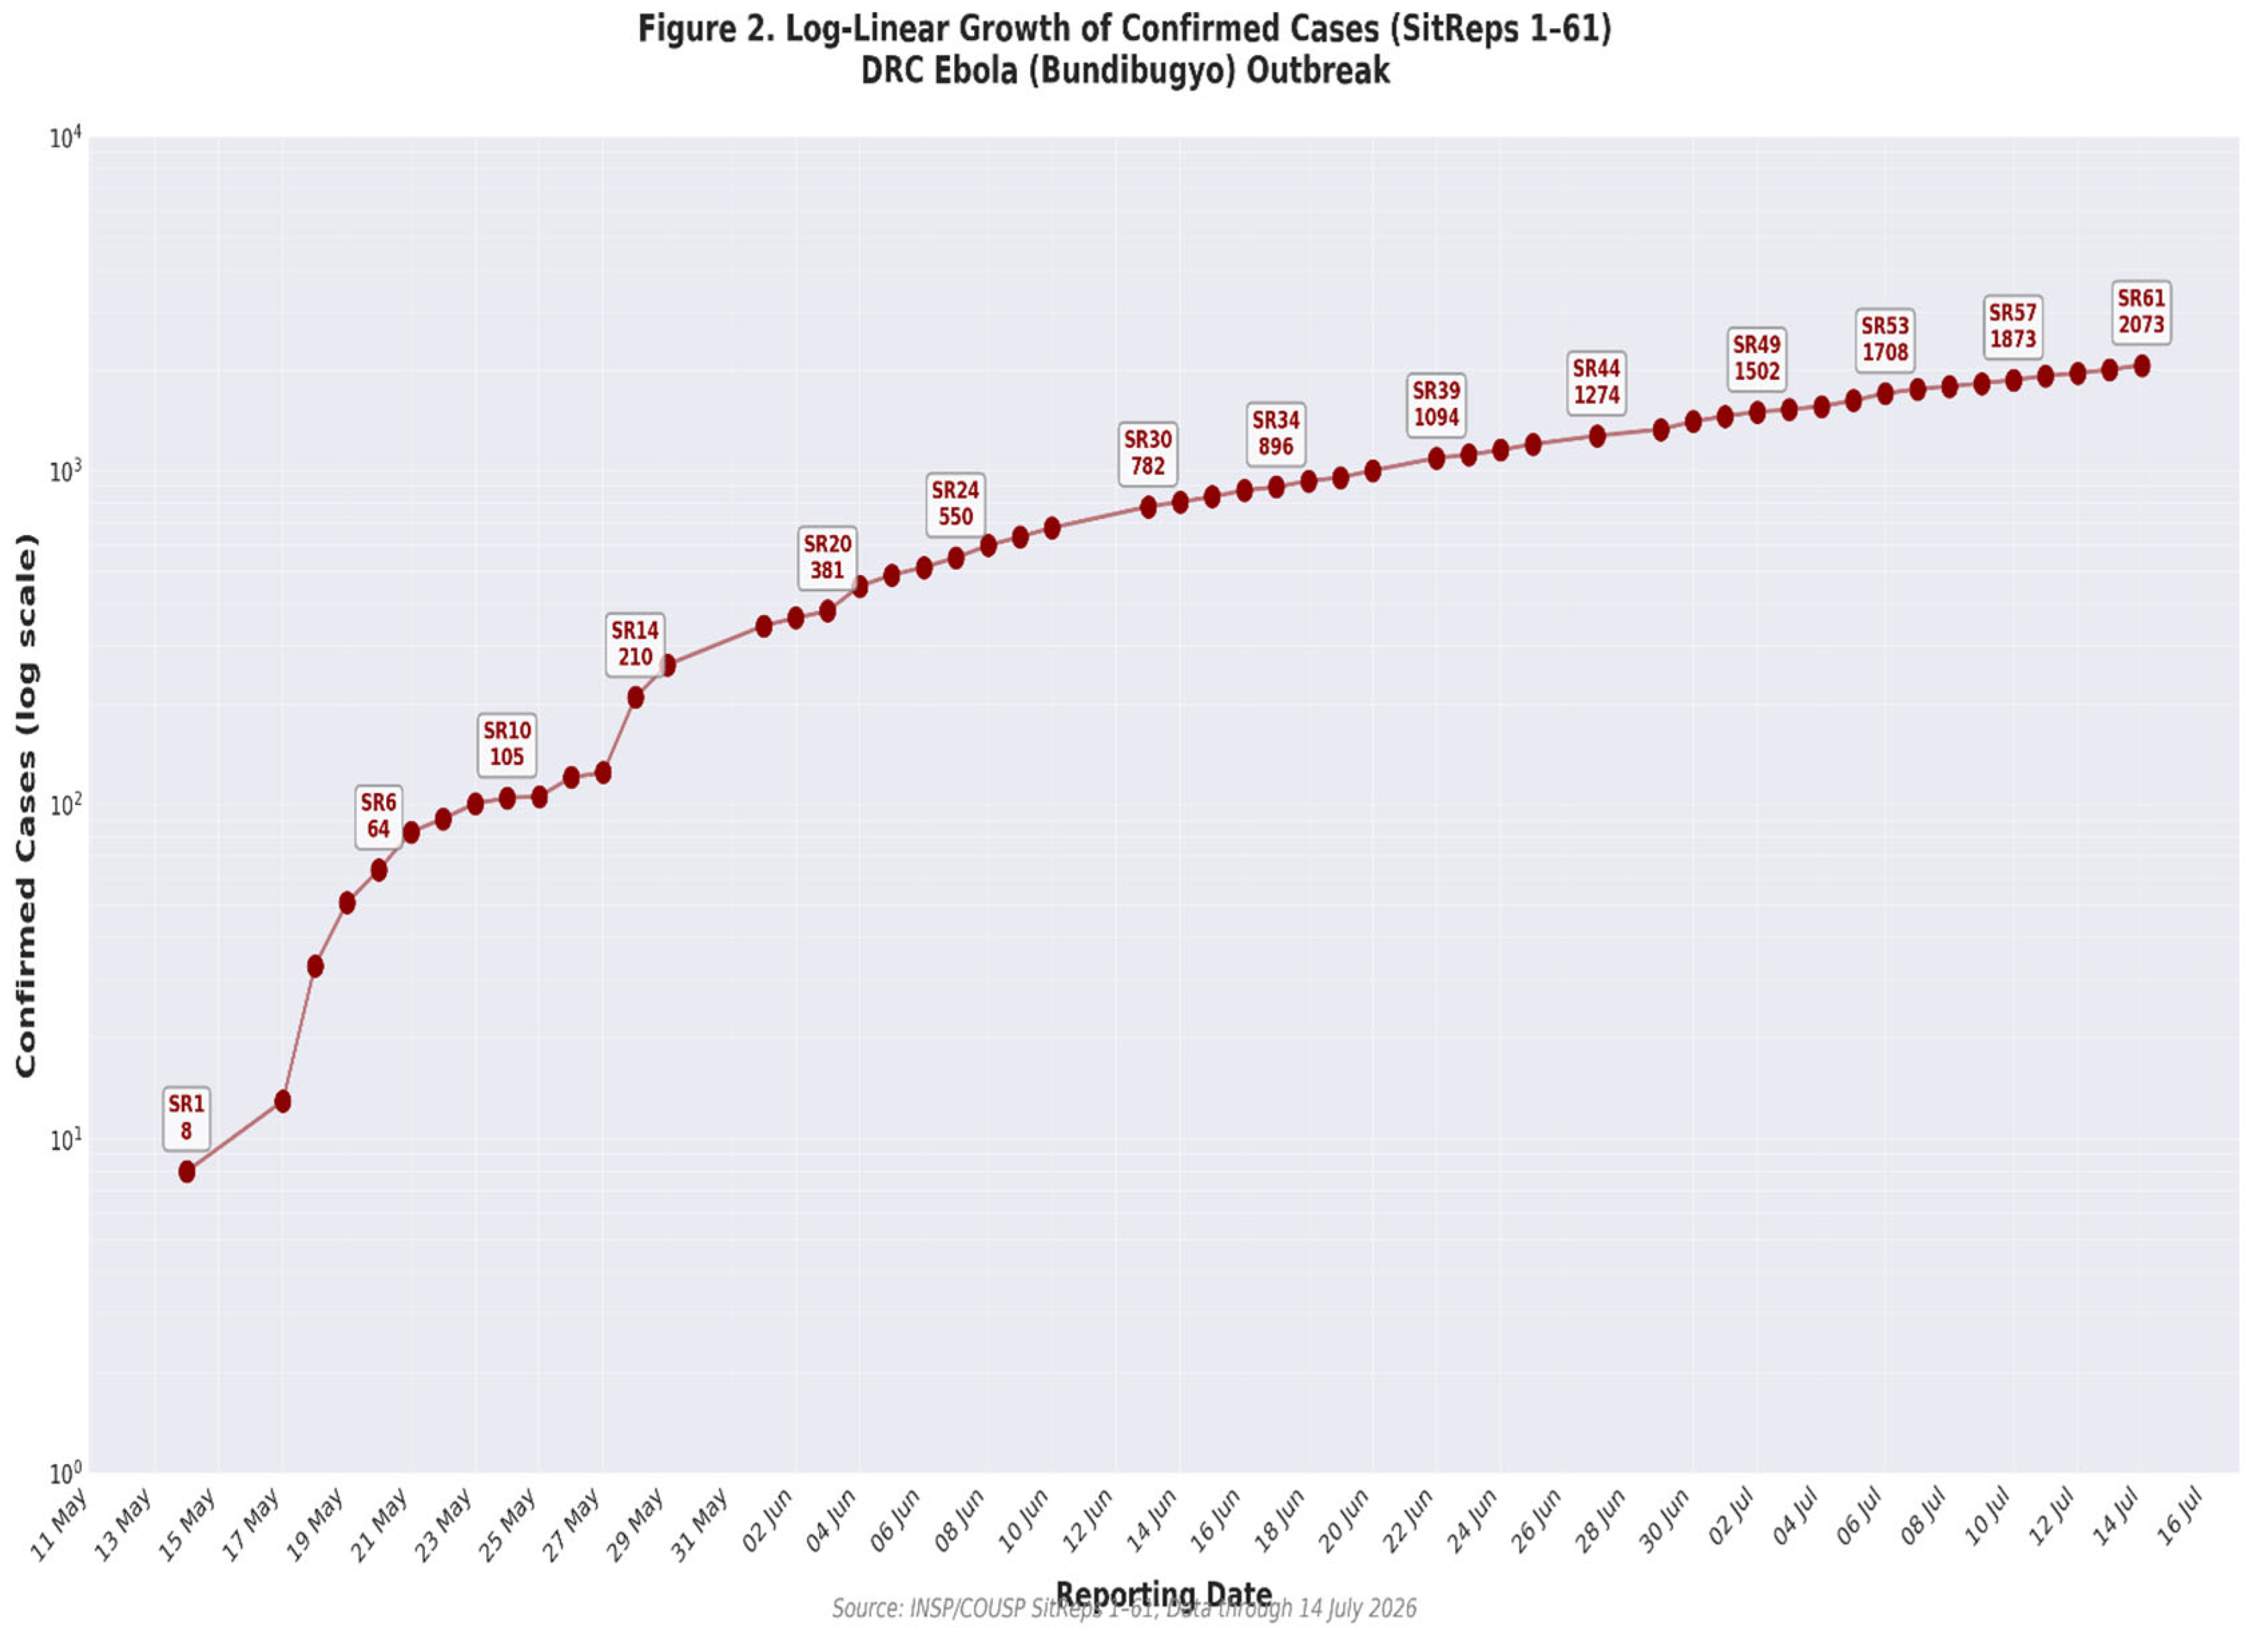
The estimated doubling time increased from approximately 8.9 days during the early phase (r = 0.078/day) to 19.5 days during the intermediate phase (r = 0.036/day) and 25.1 days during the late phase (r = 0.028/day), indicating progressive deceleration of epidemic growth.
3.2.2. National-Level Growth Model Comparison
Four candidate nonlinear growth models exponential, logistic, Gompertz, and generalized-logistic (Richards) were fitted to the reconciled 21-point national aggregated case series and compared by RMSE, AICc, and BIC (Section 2.3.1). The Gompertz model provided the best fit by both AICc and BIC, followed by the Richards model, the logistic model, and, considerably worse, the unbounded exponential model, which is not biologically plausible over a six-month horizon (Table 2). The Gompertz model's asymmetric shape implying a comparatively rapid deceleration after the inflection point followed by a long, slowly saturating tail is consistent with the progressive but incomplete deceleration described in Section 3.2.1, and provides model-based support for the Gompertz curve chosen a priori for the six-month projection reported in Section 3.6.
3.2.3. Interval-Level Growth-Rate and Doubling-Time Trajectory
Instantaneous growth rates and doubling times, estimated between each consecutive pair of the 21 reconciled data points, provide a finer-grained view of epidemic deceleration than the three discrete phases in Section 3.2.1 (Figure 3). Growth was fastest immediately after the outbreak's recognition (r = 0.463/day between SitRep 1 and SitRep 5, doubling time 1.5 days), a value that reflects the very small denominator at SitRep 1 (8 cases) rather than sustained exponential transmission. The growth rate fell rapidly over the following intervals, from 0.184/day (doubling time 3.8 days) around SitRep 10–15 to below 0.05/day by SitRep 40, after which it declined more gradually, reaching 0.024/day (doubling time 28.6 days) in the final interval (SitRep 55–61). This trajectory shows an early deceleration phase, an intermediate approach toward a slower, comparatively stable growth rate, and no evidence of a plateau or reversal by SitRep 61.
Figure 3.
Interval-level instantaneous growth rate (top) and doubling time (bottom) across SitReps 1–61, estimated between consecutive reconciled data points.
Figure 3.
Interval-level instantaneous growth rate (top) and doubling time (bottom) across SitReps 1–61, estimated between consecutive reconciled data points.
3.2.4. Growth-Rate Reduction Between Phases
Using the three phase-specific growth rates reported in Section 3.2.1, the absolute and proportional reduction in growth rate between phases was calculated (Δr = rearlier − rlater; Table 3). The growth rate fell by 53.8% between the early and intermediate phases and by a further 22.2% between the intermediate and late phases, for an overall reduction of 64.1% between the early and late phases. The comparatively smaller proportional reduction between the intermediate and late phases, relative to the early-to-intermediate transition, indicates that epidemic deceleration became less pronounced by mid-July 2026, although the aggregated data do not permit attribution of this pattern to specific control measures.
3.3. Geographic Spread
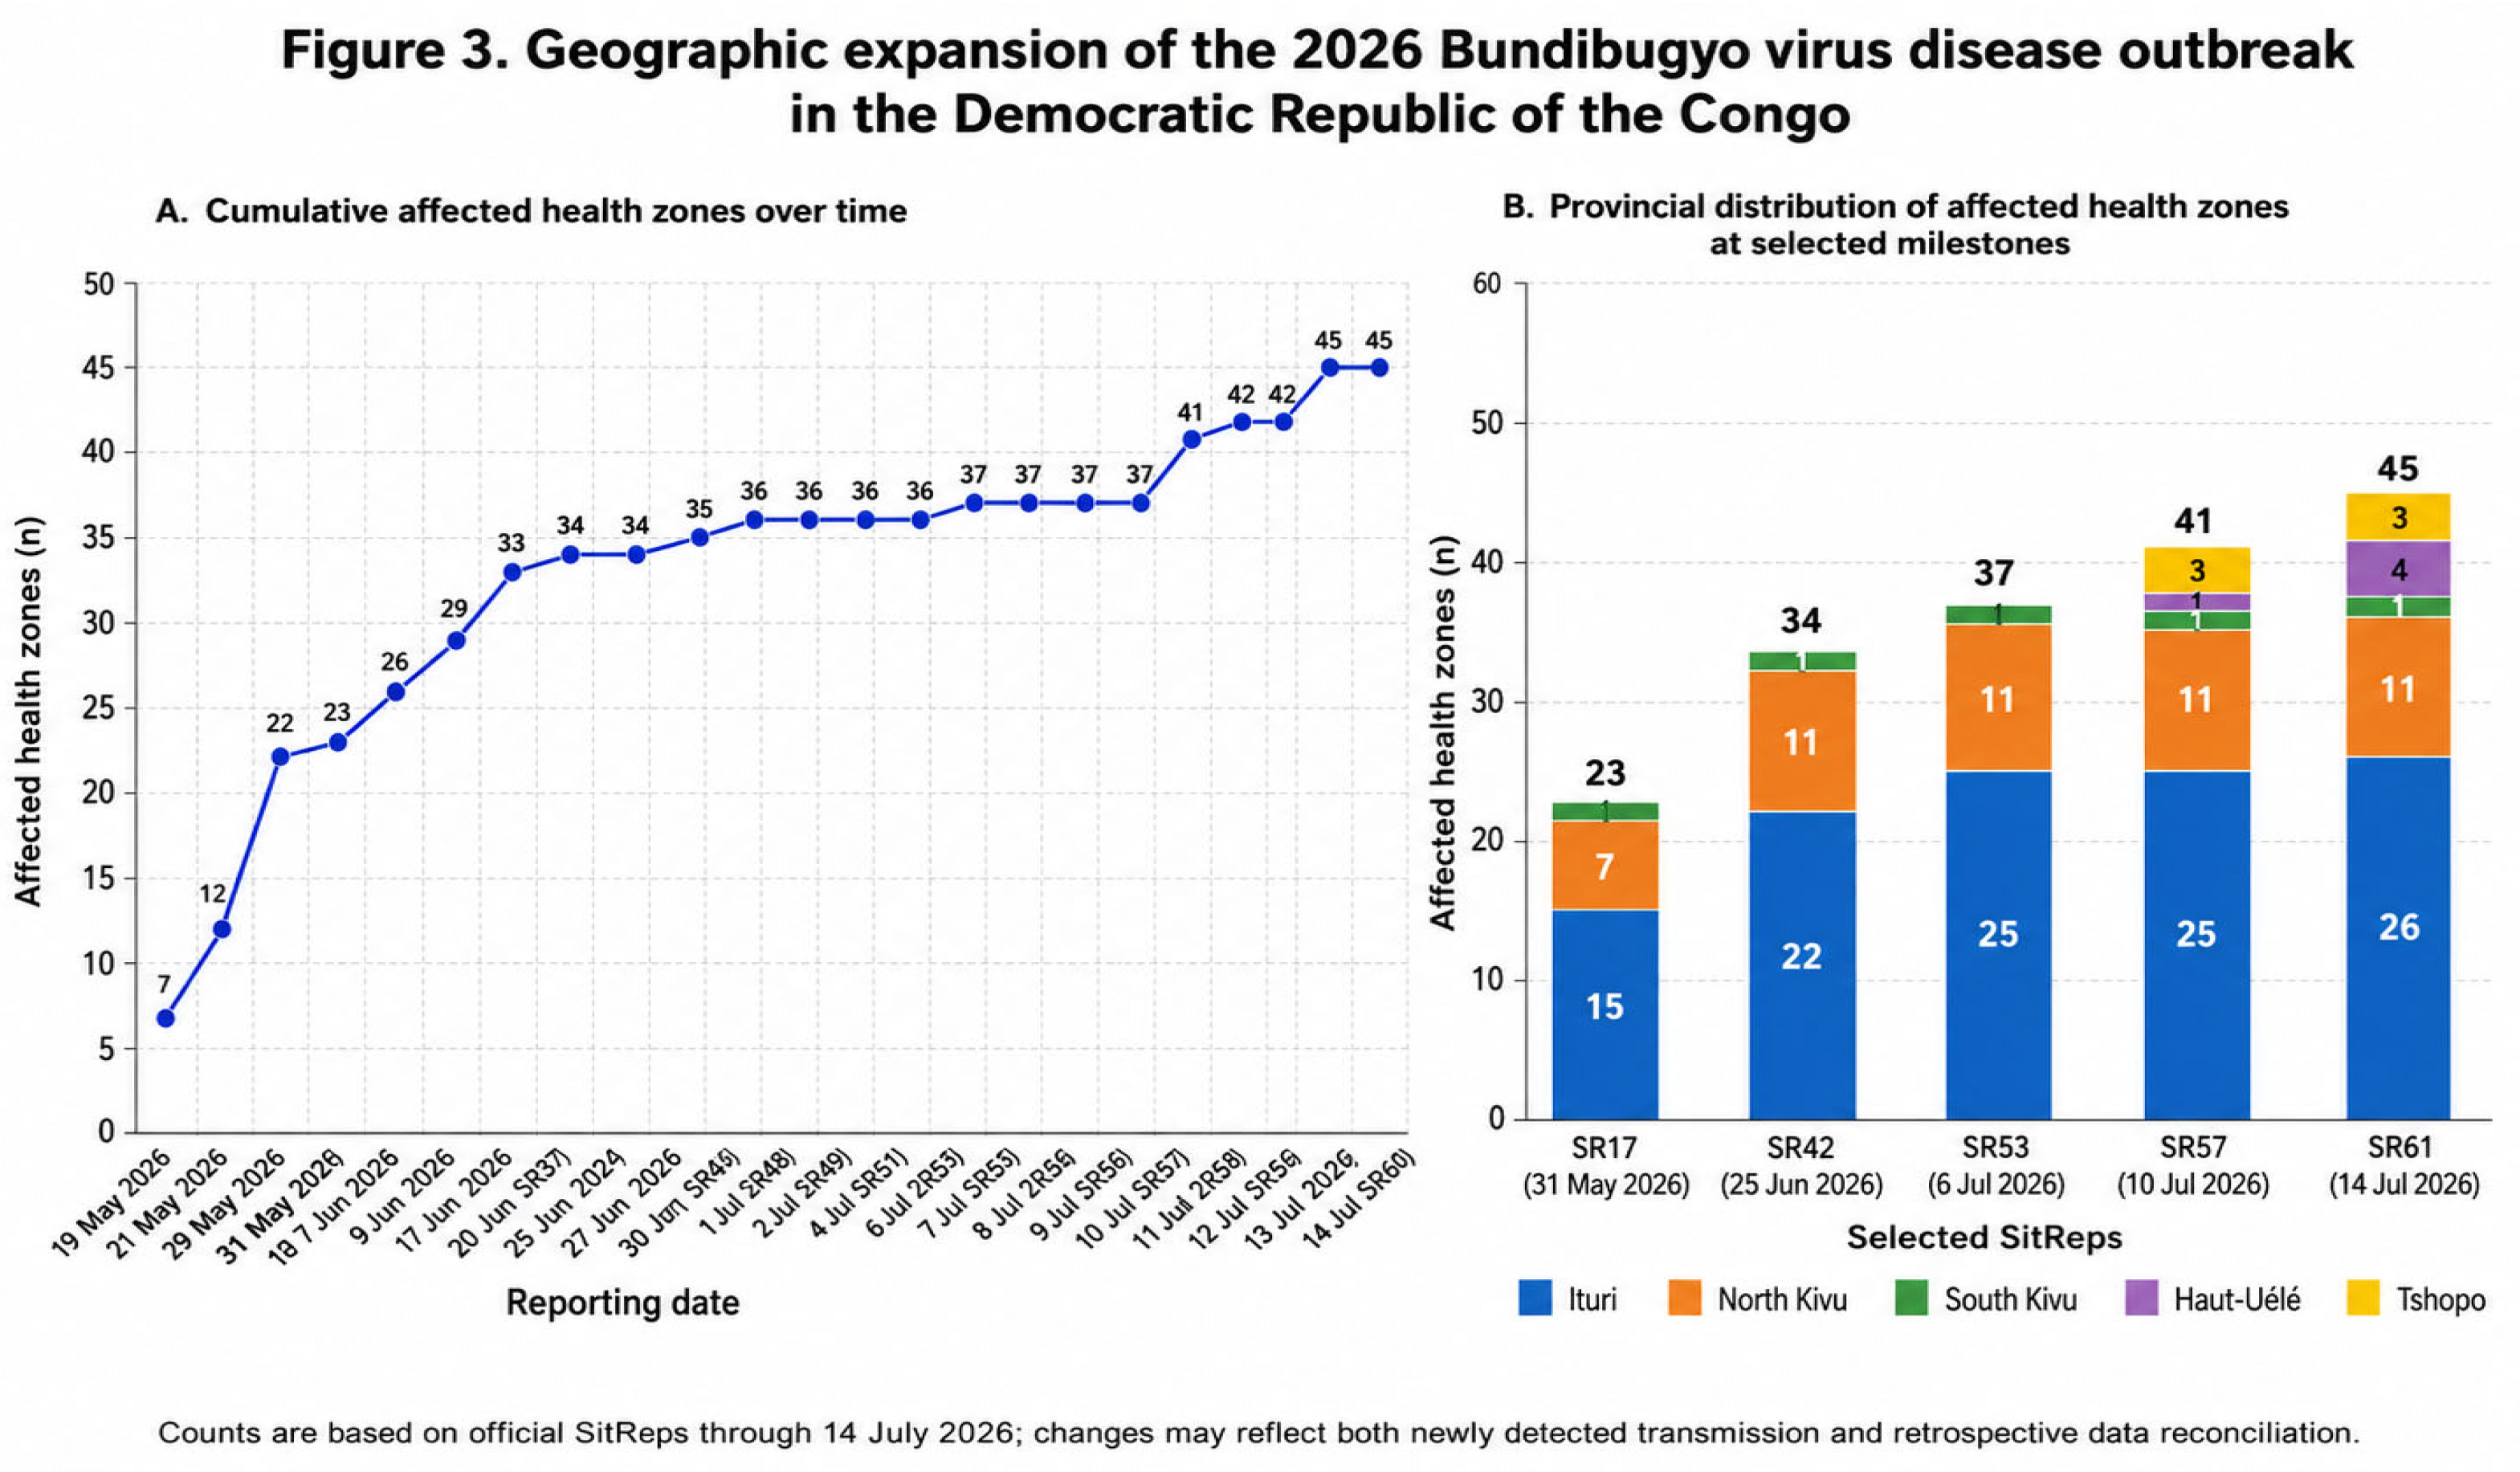
The geographic footprint expanded substantially, increasing from 3 affected health zones in one province at SitRep 1 on 14 May 2026 to 45 health zones across five provinces by SitRep 61 on 14 July 2026, representing a 15-fold increase in the number of affected health zones.
The most rapid early expansion occurred during the second half of May, when the number of affected health zones rose from 7 on 19 May to 22 by 29 May. Geographic spread continued through June, reaching 35 health zones by 27 June and 36 by 30 June. During July, the outbreak expanded further with the recognition of additional affected zones and the formal inclusion of Haut-Uélé and Tshopo. By 14 July, affected areas included 26 health zones in Ituri, 11 in North Kivu, 1 in South Kivu, 4 in Haut-Uélé, and 3 in Tshopo.
Although the rate of newly affected health zones slowed relative to the initial expansion phase, geographic spread had not stabilised by mid-July.
Figure 4.
Geographic Spread: Number of Affected Health Zones Over Time, DRC Ebola (Bundibugyo) Outbreak.
Figure 4.
Geographic Spread: Number of Affected Health Zones Over Time, DRC Ebola (Bundibugyo) Outbreak.
3.4. Province-Level Comparisons
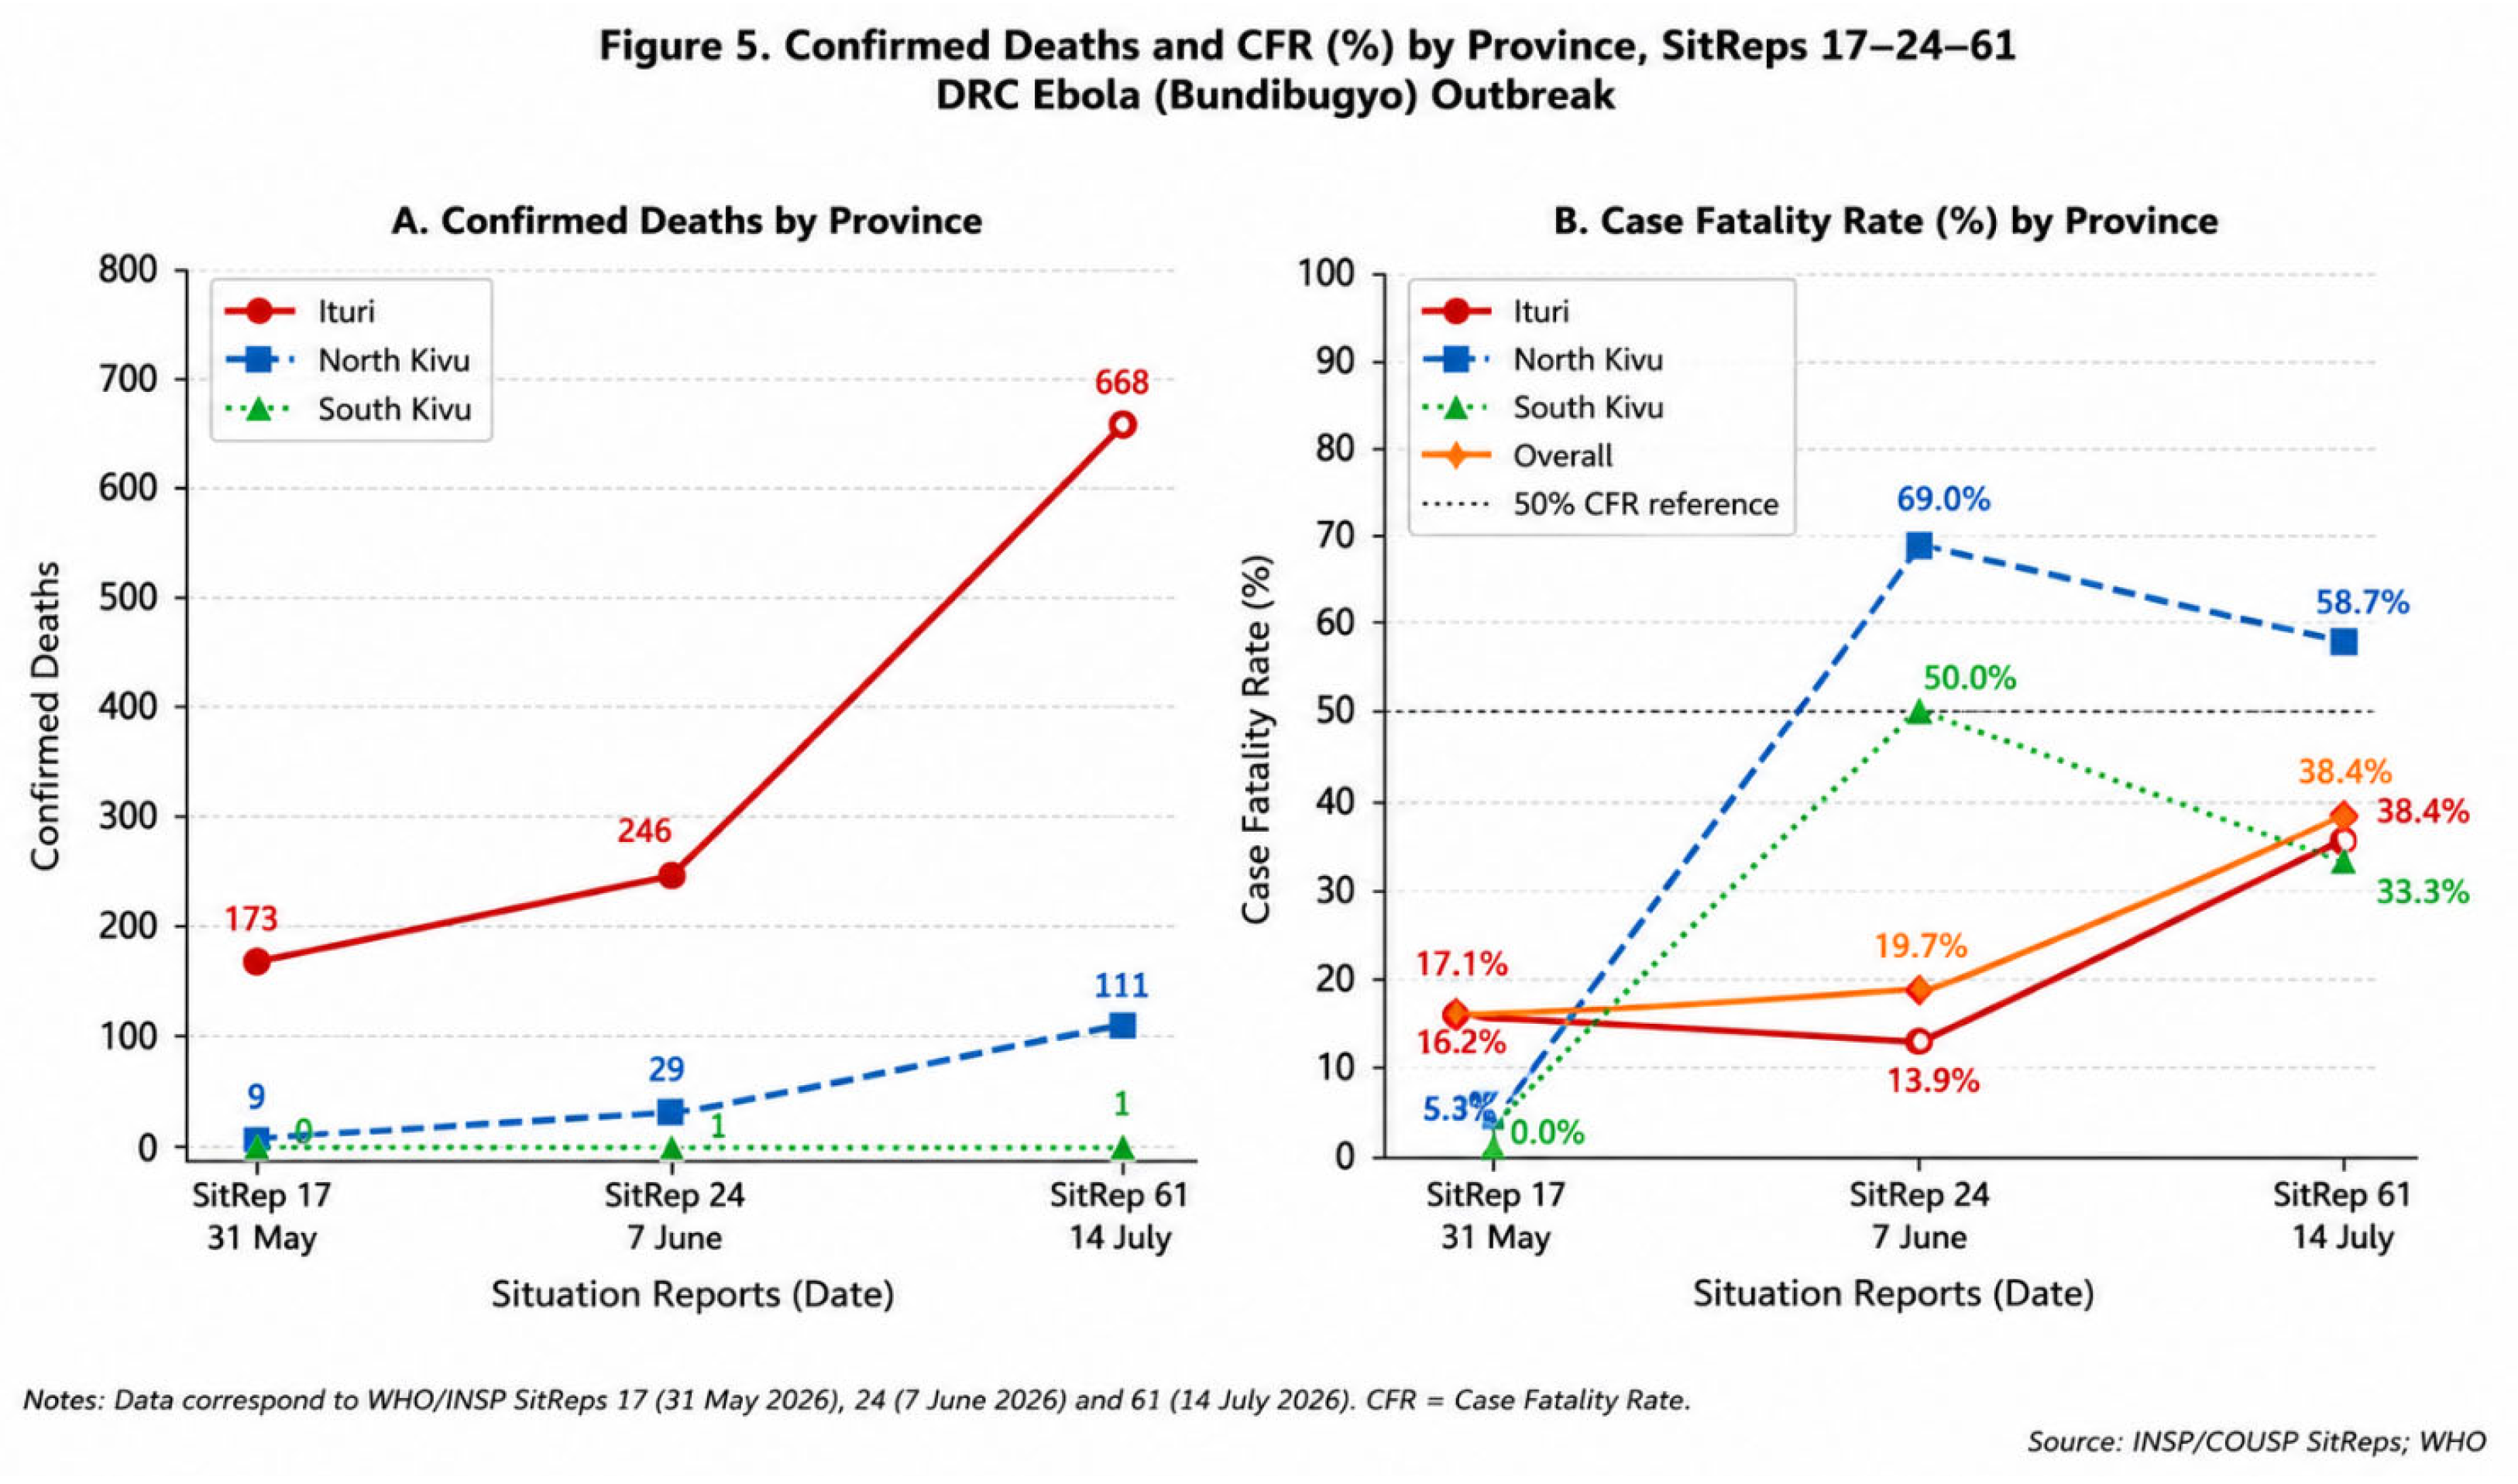
By SitRep 61 on 14 July 2026, Ituri remained the principal epicentre, accounting for 1,863 of 2,073 confirmed cases (89.9%) and 668 of 796 confirmed deaths (83.9%). North Kivu contributed a substantially smaller proportion of the national caseload, with 189 confirmed cases (9.1%), but accounted for 111 deaths (13.9%), corresponding to a markedly higher province-level CFR of 58.7% compared with 35.9% in Ituri. This disparity may reflect delayed case detection, higher proportions of community deaths, limited or delayed access to treatment, differential case ascertainment, or outcome-reporting biases rather than an intrinsic difference in disease severity.
The remaining provinces contributed relatively few cases. Haut-Uélé reported 14 cases and 13 deaths (CFR 92.9%), Tshopo 4 cases and 3 deaths (CFR 75.0%), and South Kivu 3 cases and 1 death (CFR 33.3%). These province-specific CFRs, particularly in Haut-Uélé and Tshopo, should be interpreted with considerable caution because they are based on very small denominators and are highly sensitive to the addition or reclassification of a single case or death. Exact Wilson score 95% confidence intervals were calculated for each province's CFR to make this denominator-driven imprecision explicit (Table 4): the intervals for Haut-Uélé (68.5–98.7%) and, especially, South Kivu (6.1–79.2%) are extremely wide, confirming that these point estimates alone should not be used to rank province-level severity. Overall, the provincial distribution at SitRep 61 indicates that the outbreak remained heavily concentrated in Ituri, while mortality was disproportionately high in North Kivu and in newly affected provinces with limited case counts.
Figure 5.
Confirmed Deaths and CFR (%) by Province, SitReps 17-24-61.
3.5. Bubble Analysis: Cases, Deaths, and CFR
The bubble plot (Figure 6), in which bubble size is proportional to the reported case fatality ratio, illustrates marked heterogeneity in epidemic burden and mortality across the five affected provinces at SitRep 61. Ituri accounted for the overwhelming majority of confirmed cases and deaths, with 1,863 cases and 668 deaths, but had a comparatively moderate CFR of 35.9%. North Kivu reported a much smaller caseload 189 cases yet contributed 111 deaths, corresponding to a substantially higher CFR of 58.7%.
The newly affected provinces showed even higher reported CFRs despite very small case counts: 92.9% in Haut-Uélé (13 deaths among 14 cases) and 75.0% in Tshopo (3 deaths among 4 cases). South Kivu reported 3 cases and 1 death, yielding a CFR of 33.3%. These patterns suggest that high-burden settings and high-fatality settings were not necessarily the same. The elevated CFRs in North Kivu, Haut-Uélé, and Tshopo may reflect delayed case detection, community deaths, restricted access to treatment, incomplete ascertainment of mild cases, or outcome-reporting delays. However, estimates for provinces with small denominators should be interpreted cautiously as quantified directly by the Wilson confidence intervals in Table 4 because a single additional case or death can substantially alter the CFR.
3.6. Six-Month Scenario Projections
3.6.1. Primary Scenario Projections
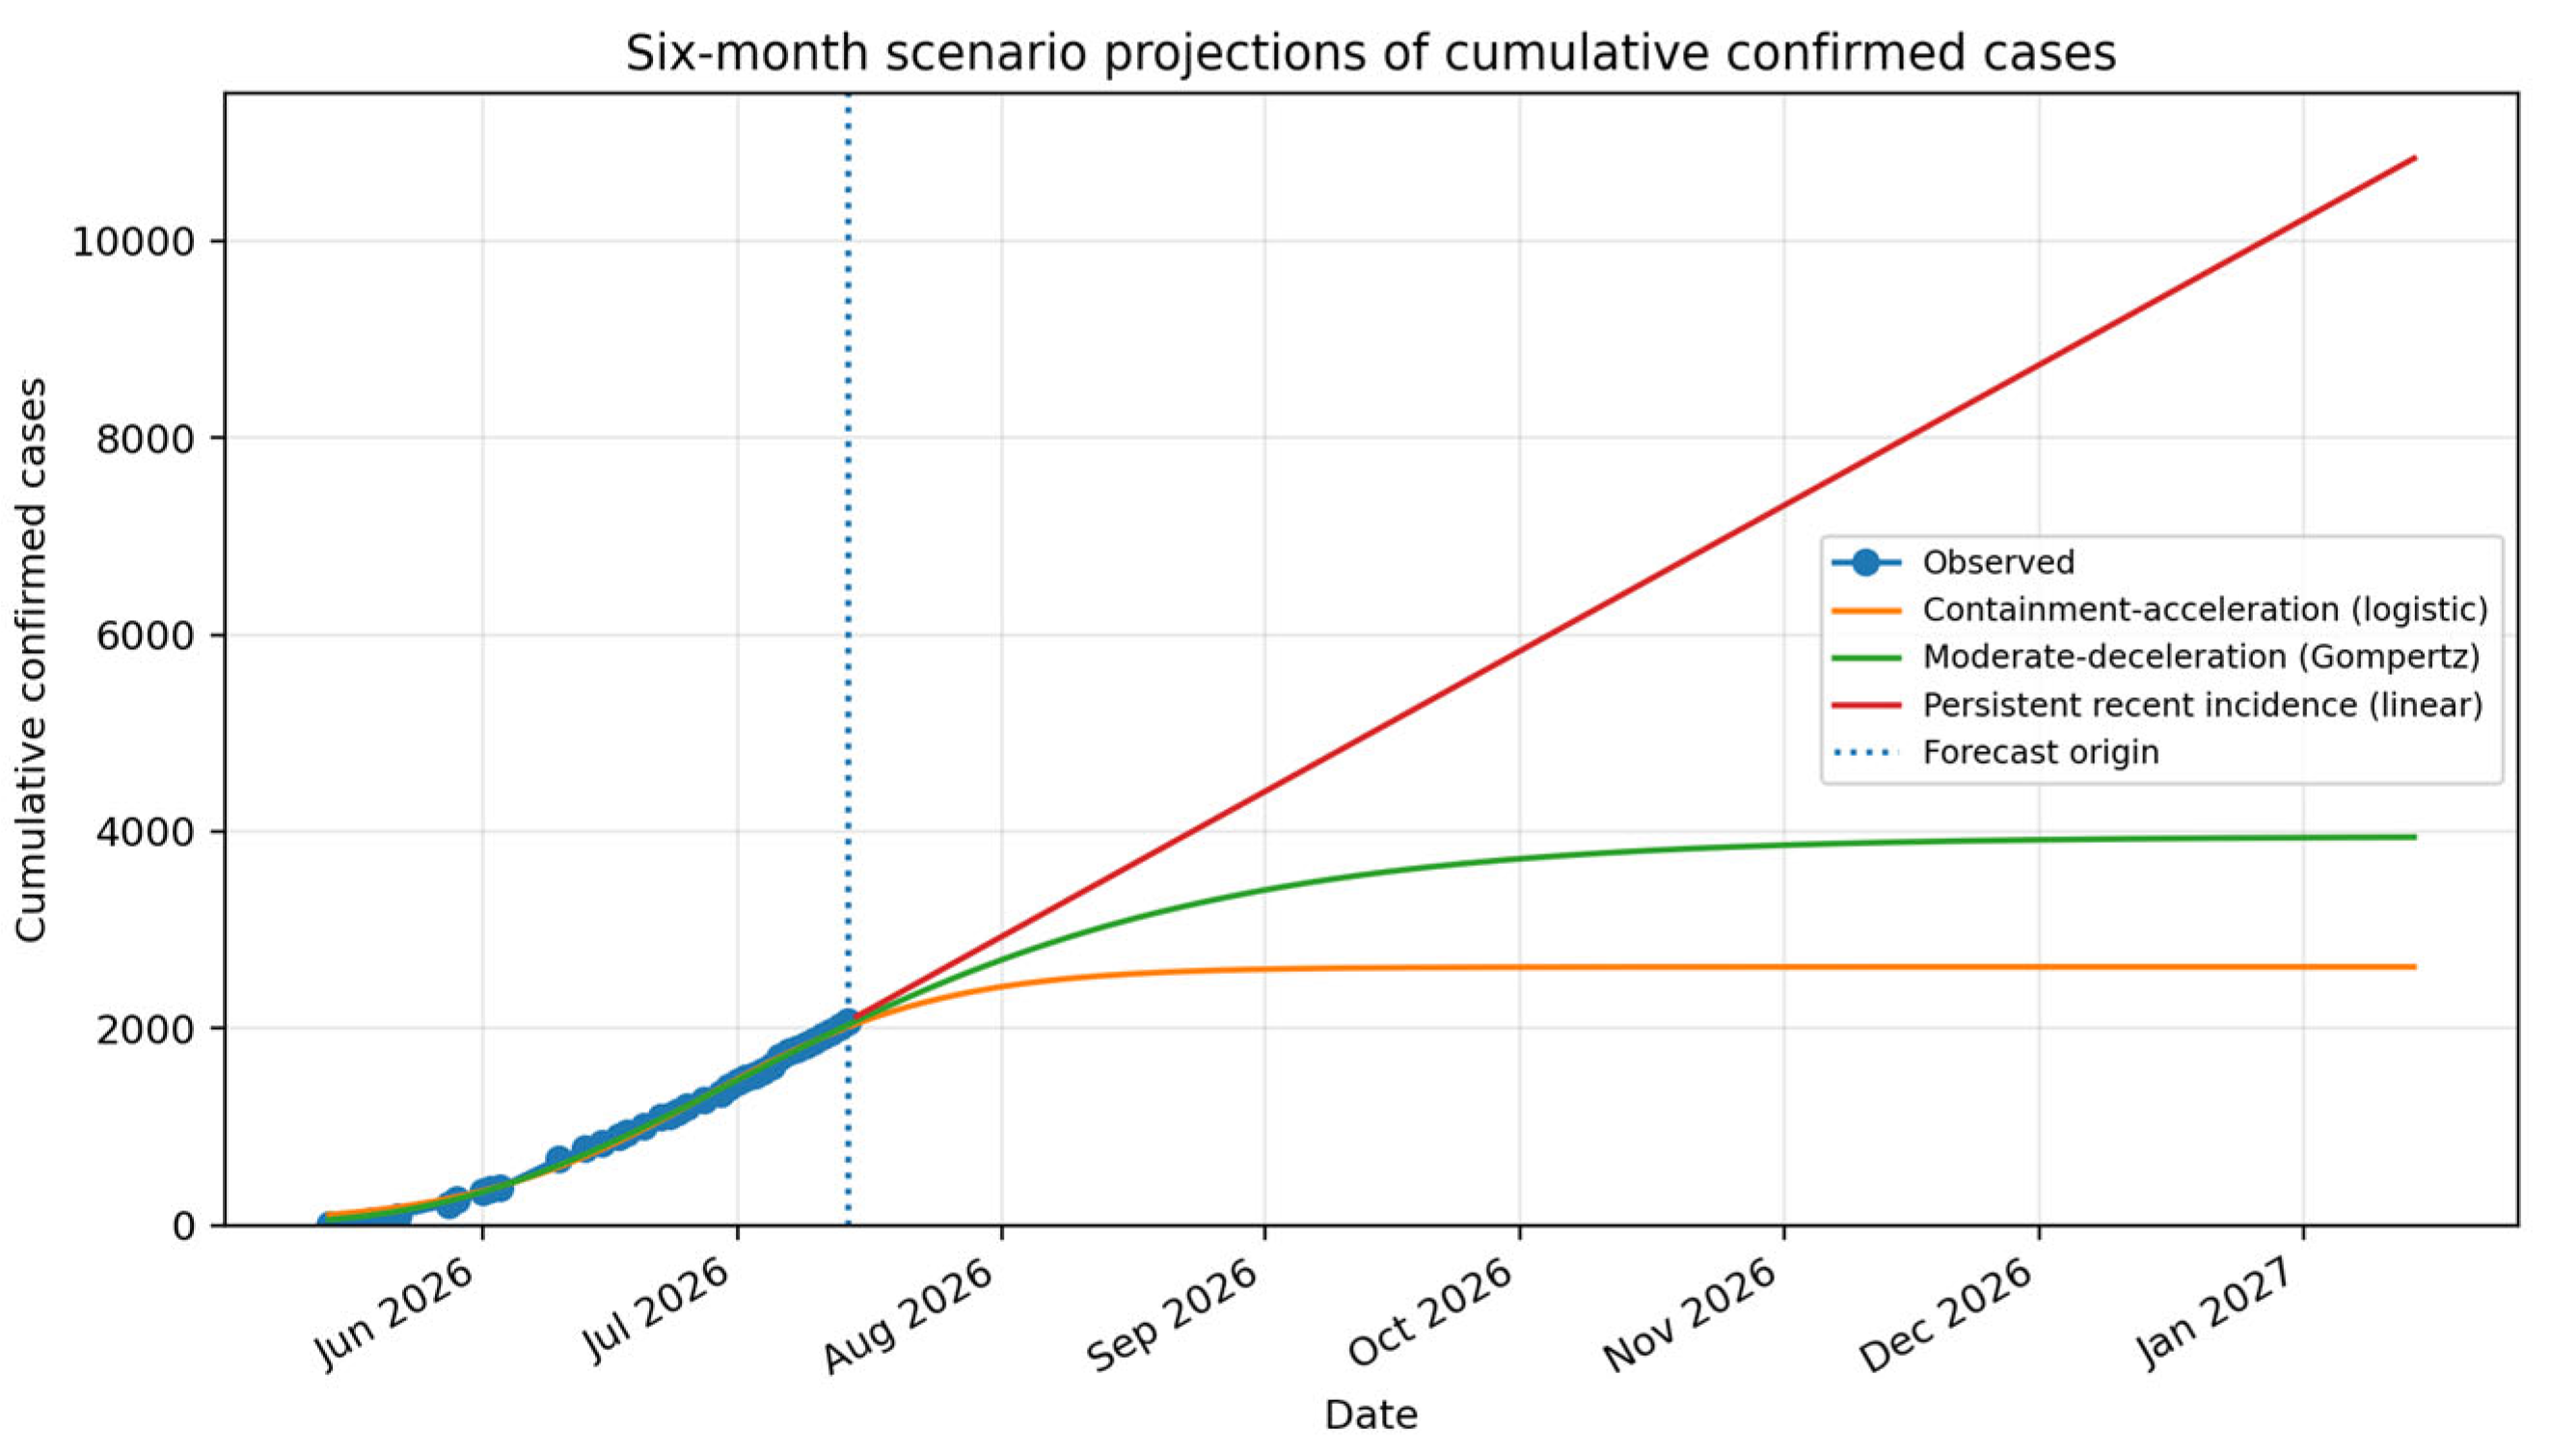
The three prediction scenarios diverged substantially after the forecast origin, illustrating the sensitivity of long-range forecasts to assumptions about future control. The logistic model projected approximately 2,624 cumulative cases by 14 January 2027 (bootstrap 95% interval: 2,446–2,980). The Gompertz model projected approximately 3,942 cases (95% interval: 3,519–4,668). Continuation of the recent absolute incidence of 47.6 cases per day yielded approximately 10,839 cumulative cases. These scenarios represent conditional planning bounds rather than predictions of what will necessarily occur.

Table 5.
Conditional Cumulative-Case Projections from 14 July 2026, Including Two Additional Deterministic Sensitivity Scenarios.
Table 5.
Conditional Cumulative-Case Projections from 14 July 2026, Including Two Additional Deterministic Sensitivity Scenarios.
| Scenario | Model | Basis | 1 month | 3 months | 6 months | 6-month uncertainty |
|---|---|---|---|---|---|---|
| Rapid containment | Logistic | Residual bootstrap 95% CI | 2,535 | 2,623 | 2,624 | 2,446–2,980 |
| Moderate deceleration | Gompertz (published) | Residual bootstrap 95% CI | 3,031 | 3,787 | 3,942 | 3,519–4,668 |
| Persistent recent incidence |
Constant 47.6 cases/day | Not model-based | 3,502 | 6,361 | 10,839 | Not model-based |
| Improved control | Gompertz, r & K −30% | Deterministic sensitivity | 1,525 | 2,339 | 2,701 | Deterministic bound (not probabilistic) |
| Insecurity-driven resurgence |
Gompertz, r & K +30% | Deterministic sensitivity | 4,567 | 5,082 | 5,139 | Deterministic bound (not probabilistic) |
Note: The Gompertz curve underlying the two new sensitivity rows was calibrated to reproduce the originally primary Gompertz projection (row 2) exactly at the observed SitRep 61 value and at the three published projection horizons (K=3,953.96, b=3.9367, r=0.02963/day), and is distinct from the independently refitted Gompertz model used for functional-form comparison in Table 2 (Section 2.3.1). The two sensitivity rows should be read as illustrative deterministic bounds (±30% on r and K), not as probabilistic forecasts with a defined confidence level.
Figure 7.
Six-month conditional projections. The divergence between scenarios reflects structural uncertainty and the unknown future effect of interventions.
Figure 7.
Six-month conditional projections. The divergence between scenarios reflects structural uncertainty and the unknown future effect of interventions.
3.6.2. Bayesian Sensitivity Analysis
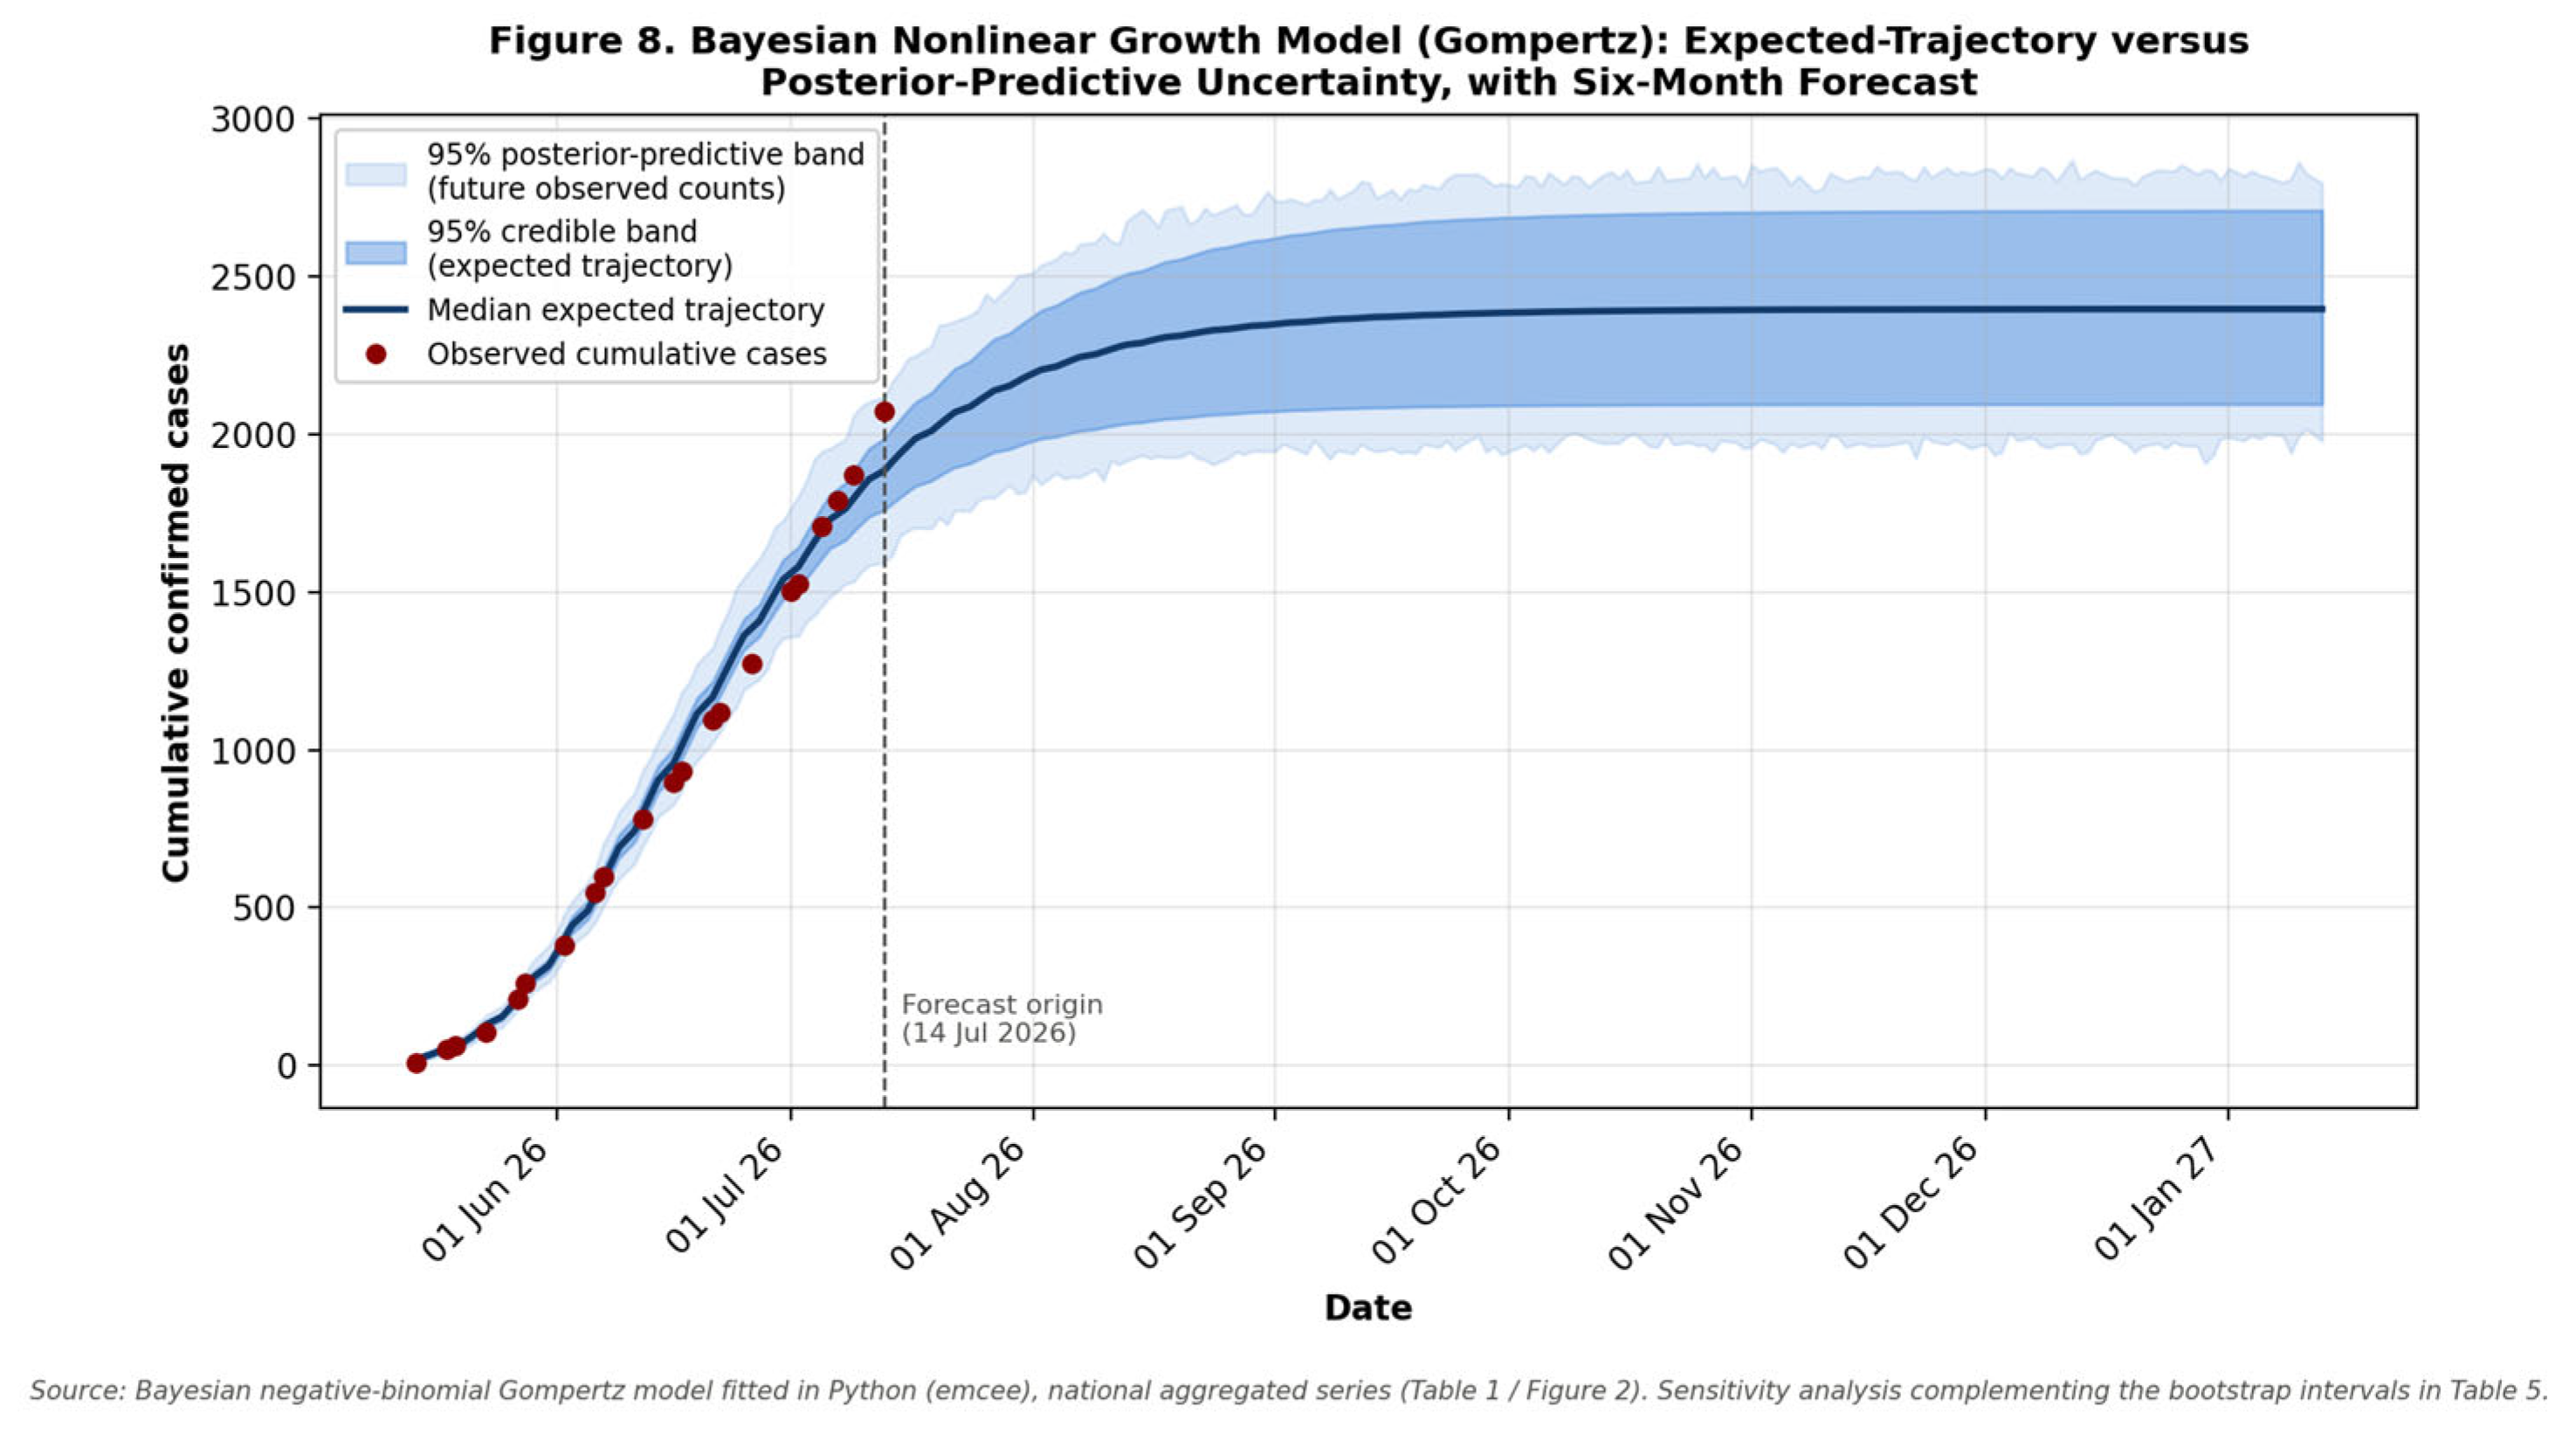
As a complementary Bayesian sensitivity analysis (Section 2.3.1), a negative-binomial Gompertz model fitted by MCMC (emcee) to the 21-point reconciled national series yielded posterior parameter estimates of K = 2,396.95 (95% credible interval [CrI] 2,082.95–2,727.82), b = 4.996 (95% CrI 4.784–5.255), r = 0.0497/day (95% CrI 0.0445–0.0565), and a negative-binomial dispersion parameter φ = 327.3 (95% CrI 102.0–1,216.4). The posterior median fitted value at SitRep 61 (1,883) under-predicted the actual observed value (2,073) by approximately 9%, a discrepancy discussed further below and in Section 4.
Table 6 compares, at each forecast horizon, the point estimate and bootstrap interval from the primary Gompertz projection (Section 3.6.1) with the Bayesian posterior expected-trajectory and posterior-predictive intervals. The Bayesian analysis produced a materially lower central estimate at every horizon than the originally primary bootstrap-based projection, together with a wider posterior-predictive interval at six months (1,948–2,839) than the bootstrap interval (3,519–4,668) the two intervals do not overlap. This divergence most plausibly reflects the different likelihoods and data weighting used by the two methods (least-squares fitting of a single point per SitRep-group versus a negative-binomial likelihood fitted to the full reconciled series, which gives relatively more influence to the earliest, smaller counts) rather than a single method being definitively correct; both are reported transparently as sensitivity analyses rather than reconciled into one number. Because the Bayesian median itself under-predicted the most recent observed count (Section 3.6.2, first paragraph), the true six-month burden may plausibly exceed even the wider Bayesian predictive interval, reinforcing rather than resolving the uncertainty already flagged for the moderate-deceleration scenario.
Figure 8.
Bayesian negative-binomial Gompertz fit: posterior median expected trajectory (solid line) with 95% expected-trajectory credible band (darker ribbon) and 95% posterior-predictive band (lighter ribbon), against observed confirmed cases (points).
Figure 8.
Bayesian negative-binomial Gompertz fit: posterior median expected trajectory (solid line) with 95% expected-trajectory credible band (darker ribbon) and 95% posterior-predictive band (lighter ribbon), against observed confirmed cases (points).
3.6.3. Extended Deterministic Sensitivity Scenarios
The two additional deterministic scenarios added in Table 5 (improved control and insecurity-driven resurgence, ±30% on r and K of the calibrated Gompertz curve) substantially widen the plausible six-month range: from approximately 2,701 cases under improved control to approximately 5,139 cases under an insecurity-driven resurgence, compared with the 2,624–10,839 range spanned by the three original scenarios. Figure 9 places all five scenarios on a common axis, showing a monotonic ordering from rapid containment through improved control, moderate deceleration (published), insecurity-driven resurgence, and persistent recent incidence.
3.6.4. Forecast Calibration: Rolling-Origin Validation
To assess how well the Gompertz projection would have performed if issued earlier in the outbreak, the Gompertz model was re-fitted using only data available up to four earlier truncation points and the resulting projection for SitRep 61 was compared with the value actually reported (Table 7). Projections issued earlier in the outbreak under-predicted the eventual SitRep 61 case count substantially by 27.0% when only data through SitRep 39 were available — and this under-prediction narrowed progressively as more data accrued, to 5.7% using data through SitRep 55. At every truncation point tested, the Gompertz model under-predicted rather than over-predicted the subsequent case count, a directionally consistent pattern that is discussed further in Section 4.
3.7. Demographic Profile
Demographic characteristics were not consistently disaggregated across the SitReps reviewed through 14 July 2026. Limited age- and sex-specific information was available in selected early reports, but the data were insufficient for robust longitudinal comparison or formal demographic modelling. Early summaries suggested that working-age adults constituted a substantial proportion of cases and that healthcare workers were affected; however, age-specific denominators, outcomes, occupational exposures, and healthcare-worker case counts were not reported consistently. These observations should therefore be regarded as descriptive signals rather than definitive demographic patterns. Individual-level line-list data would be required to evaluate age, sex, occupation, exposure history, healthcare-worker status, and clinical outcome reliably.
3.8. Key Epidemiological Findings Summary
Table 8.
Summary of Key Epidemiological Findings, DRC Bundibugyo Virus Disease Outbreak, SitReps 1–61, 14 May–14 July 2026.
Table 8.
Summary of Key Epidemiological Findings, DRC Bundibugyo Virus Disease Outbreak, SitReps 1–61, 14 May–14 July 2026.
| Finding | Updated detail | Priority |
|---|---|---|
| Rapid epidemic expansion | Confirmed cases increased from 8 on 14 May to 2,073 on 14 July 2026, representing a 259-fold increase over 61 days. Confirmed deaths reached 796. | CRITICAL |
| Persistent active transmission | Although proportional growth slowed over time, cumulative cases continued to rise through SitRep 61, including an increase from 1,406 cases on 30 June to 2,073 on 14 July. The epidemic had not entered a sustained decline. | CRITICAL |
| Ituri dominance | Ituri accounted for 1,863 of 2,073 confirmed cases (89.9%) and 668 of 796 deaths (83.9%) at SitRep 61, remaining the principal epidemic epicentre. | CRITICAL |
| Progressive growth deceleration | Estimated doubling time increased from 8.9 days in the early phase (r = 0.078/day) to 19.5 days in the intermediate phase (r = 0.036/day) and 25.1 days in the late phase (r = 0.028/day). | HIGH |
| Continued geographic spread | The number of affected health zones increased from 3 to 45, a 15-fold increase, while the number of affected provinces rose from one to five: Ituri, North Kivu, South Kivu, Haut-Uélé, and Tshopo. | CRITICAL |
| Rising national CFR | The reported national CFR increased from approximately 16.0% on 29 May to 38.4% on 14 July 2026. This may reflect true mortality, delayed detection, community deaths, incomplete ascertainment, and retrospective data reconciliation. | CRITICAL |
| Disproportionate mortality in North Kivu | North Kivu reported 189 cases and 111 deaths, corresponding to a CFR of 58.7% (Wilson 95% CI 51.6–65.5%), substantially higher than the 35.9% CFR in Ituri (95% CI 33.7–38.1%). | CRITICAL |
| Very high CFRs in low-count provinces | Haut-Uélé reported a CFR of 92.9% (95% CI 68.5–98.7%) and Tshopo 75.0% (95% CI 30.1–95.4%), but these estimates were based on very small denominators, as reflected in their wide Wilson confidence intervals, and should be interpreted cautiously. | HIGH |
| Small but persistent South Kivu burden | South Kivu reported 3 confirmed cases and 1 death, corresponding to a CFR of 33.3% (95% CI 6.1–79.2%). | MODERATE |
| Surveillance and response constraints | Persistent community deaths, variable contact follow-up, treatment-access limitations, insecurity, population mobility, and repeated DHIS2 data cleaning complicated interpretation and containment. | CRITICAL |
| Absence of consistently reported demographic data | Age, sex, occupation, healthcare-worker status, and exposure history were not consistently disaggregated across SitReps, preventing robust demographic or risk-factor analyses. | HIGH |
| Model-supported deceleration, quantified reduction | Among four candidate national growth models compared by AICc/BIC, the Gompertz curve was best supported; the national growth rate fell by 64.1% overall between the early and late phases (Δr = 0.050/day), with a smaller marginal reduction (22.2%) between the intermediate and late phases than between the early and intermediate phases (53.8%). | HIGH |
| Persistent under-prediction of future burden | Rolling-origin validation showed that Gompertz-based projections issued earlier in the outbreak under-predicted the subsequently observed SitRep 61 case count by 5.7–27.0%, narrowing but not eliminating the gap as more data accrued; a complementary Bayesian sensitivity analysis likewise produced a lower central six-month estimate (2,397) with a wide posterior-predictive interval (1,948–2,839) than the original bootstrap-based projection, suggesting the moderate-deceleration scenario in Table 5 may understate future burden. | CRITICAL |
| Limited disease-specific countermeasures | The response remained dependent primarily on early detection, isolation, contact tracing, infection prevention and control, and supportive clinical management. Any statement regarding the regulatory status of specific vaccines or therapeutics should be independently verified and referenced. | CRITICAL |
4. Discussion
Although the 2026 Bundibugyo virus disease outbreak in the Democratic Republic of the Congo showed a progressive deceleration in proportional growth, the epidemiological situation remained critical. The estimated doubling time increased from 8.9 days during the early phase to 19.5 days during the intermediate phase and 25.1 days during the late phase, an overall 64.1% reduction in the national growth rate between the early and late phases (Section 3.2.4). This slowing should not be interpreted as evidence of outbreak control. By 14 July 2026, more than 2,000 confirmed cases had been reported, alongside increasing mortality and continued geographic expansion into additional health zones and provinces. Transmission therefore remained intense, even though the epidemic curve had become less steep than during the initial phase. Two structural factors may have contributed substantially to the rapid early expansion: delayed recognition and confirmation of the outbreak, and the absence of licensed BDBV-specific vaccines and therapeutics, which limited the applicability of ring-vaccination strategies used during the 2018–2020 North Kivu Zaire ebolavirus outbreak [20,21].
The reported WHO declaration of a Public Health Emergency of International Concern shortly after the national outbreak declaration reflected concern regarding rapid geographic spread, the humanitarian context of eastern DRC, and the limited availability of species-specific medical countermeasures [22]. In this setting, clinical management depended largely on supportive care, while investigational products such as MBP134/MBP431, obeldesivir, and remdesivir required evaluation within appropriately regulated emergency-use or adaptive clinical-trial frameworks. These constraints highlight the comparatively limited clinical and operational evidence base available for BDBV relative to Zaire ebolavirus.
Marked heterogeneity in reported case fatality ratios between provinces was among the most operationally important findings. By SitRep 61, North Kivu had a CFR of 58.7% (Wilson 95% CI 51.6–65.5%), compared with 35.9% in Ituri (95% CI 33.7–38.1%); the non-overlapping confidence intervals for these two high-case-count provinces indicate that this difference is unlikely to be attributable to chance alone, even though it may still reflect reporting and ascertainment differences rather than a true difference in disease severity. This difference is unlikely to be explained solely by the natural history of BDBV. During the 2007 Uganda outbreak, the reported CFR was approximately 32% [23,24]. Several mechanisms may account for the higher CFR in North Kivu: delayed detection, confirmation of cases only at or near death, limited access to Ebola treatment centres, a high proportion of community deaths, and delayed care-seeking related to insecurity or mistrust of health authorities. These mechanisms are likely to be interrelated and may also have influenced the very high CFRs observed in newly affected provinces with small case counts; the correspondingly very wide Wilson intervals for Haut-Uélé (68.5–98.7%), Tshopo (30.1–95.4%), and South Kivu (6.1–79.2%) confirm that these point estimates should not be used, on their own, to rank province-level disease severity (Section 3.4).
The estimated growth rates and doubling times should nevertheless be interpreted cautiously. They were derived from cumulative SitRep observations that were serially correlated and subject to reporting delays, retrospective revisions, reclassification, and model uncertainty [25,26]. Operational constraints affecting surveillance, referral, laboratory confirmation, contact tracing, and outbreak control may also have influenced the observed trajectory [20]. The progressive lengthening of the doubling time is consistent with epidemic deceleration, but it does not establish that transmission was declining in absolute terms. Growth indicators should therefore be interpreted alongside incident case counts, community deaths, contact follow-up performance, geographic expansion, and treatment-centre occupancy. The reported international dimension of the outbreak further highlighted gaps in preparedness for non-Zaire orthoebolaviruses. Reports of cases in Uganda and an imported case in France, if confirmed by authoritative sources, would underline the importance of cross-border surveillance and international coordination [22,27,28]. Point-of-entry screening for Ebola disease remains challenging because early BDBV symptoms are non-specific and overlap with common febrile illnesses. Screening strategies should therefore emphasise epidemiological linkage, exposure history, longitudinal symptom monitoring, and rapid access to molecular confirmation rather than reliance on haemorrhagic manifestations alone. The DRC–Uganda cross-border response plan, coordinated through regional mechanisms, included rapid response teams, strengthened surveillance, laboratory confirmation, and infection prevention and control activities. Its effectiveness depends on two complementary components: real-time analysis of contact-tracing performance, case-detection delays, and epidemiological indicators; and sustained community engagement based on culturally appropriate risk communication, accepted safe-burial practices, and meaningful community participation. In settings affected by displacement, insecurity, and mistrust, community engagement should be treated as a core response function rather than a supporting activity. Reporting of community participation, refusal rates, and risk-perception indicators alongside epidemiological metrics would improve adaptive outbreak management [29,30].
By 14 July 2026, the provincial distribution remained highly asymmetric. Ituri accounted for 1,863 confirmed cases across 26 health zones, North Kivu reported 189 cases across 11 health zones, and South Kivu recorded 3 cases in one health zone. Haut-Uélé and Tshopo contributed relatively few cases but reported very high CFRs. These contrasts may reflect differences in transmission intensity, population mobility, surveillance sensitivity, diagnostic access, health-seeking behaviour, and retrospective geographic reassignment. Because provincial contact-follow-up indicators were not consistently reported across all SitReps, comparisons between provinces should be made cautiously and should not be interpreted as direct measures of response effectiveness [31,32].
4.1. Model Comparison, Growth-Rate Reduction, and Forecast Reliability
The multi-model comparison provides model-based support for the Gompertz curve used in the primary six-month projection: among four candidate national-level growth models, Gompertz was best supported by both AICc and BIC, and the Richards (generalised-logistic) model which nests both logistic and Gompertz-like behaviour performed similarly well, consistent with genuine asymmetric deceleration rather than symmetric logistic saturation [14,15]. However, three findings from the additional analyses temper confidence in the specific numerical projections reported in Table 5. First, rolling-origin validation showed that Gompertz-based projections issued earlier in the outbreak systematically under-predicted the subsequently observed case count, by as much as 27.0% when only data through SitRep 39 were available and still by 5.7% using data through SitRep 55 the most recent truncation point tested. Second, the complementary Bayesian sensitivity analysis (Section 3.6.2), fitted independently using a negative-binomial likelihood, produced a central six-month estimate (2,397) well below the originally primary bootstrap-based projection (3,942), with a posterior-predictive interval (1,948–2,839) that does not overlap the original bootstrap interval (3,519–4,668); the Bayesian model's own median fitted value at the most recent observed SitRep (1,883) itself under-predicted the actual count (2,073). Third, the growth-rate reduction between the intermediate and late phases (22.2%) was proportionally smaller than the reduction between the early and intermediate phases (53.8%). This pattern may be consistent with diminishing gains in epidemic control, although the aggregated data do not permit attribution of changes in growth rate to specific interventions (Table 3). Taken together, these findings highlight substantial structural uncertainty in the six-month projections and indicate that neither the moderate-deceleration nor rapid-containment scenario should be interpreted as an upper bound on future burden. All projections should therefore be considered conditional planning scenarios rather than deterministic forecasts [16,17,18,19].
4.2. Limitations and Future Research
The analyses reported here were conducted at the national and province levels because the aggregated SitRep summaries used in this study (Section 2.3.1) do not resolve case counts by health zone and date. This bears directly on interpretation. The three-phase deceleration we document nationally, and the widening forecast-calibration error at earlier truncation points (Section 3), are consistent with either a broadly uniform slowdown or a national curve dominated by localised flare-ups offset by decline elsewhere. The second reading is plausible: accounts of the 2018–2020 Nord-Kivu/Ituri epidemic describe transmission as spatially heterogeneous, with resurgences in specific health zones (e.g. Katwa, Butembo, Mabalako) tied to insecurity and interrupted response access [33,34]. A single national growth-model fit averages over exactly this structure.
The same gap limits covariate analysis. Forest cover has been linked to Ebola spillover location [35]; road infrastructure and mobility have shaped this outbreak's spatial trajectory [36]; and healthcare accessibility in Nord-Kivu is markedly uneven [37]. Testing these associations against growth rate, doubling time or final size requires health-zone-indexed case series and matched geospatial covariates, which the aggregated data cannot provide; we report this as open rather than approximate it. Trajectory-clustering of epidemic types [38] and daily-resolution early-warning indicators acceleration, autocorrelation, spatial synchrony [39,40,41] face the same constraint.
We regard health-zone-level line-list acquisition as the highest-priority extension, since disaggregated growth-model comparison, covariate analysis and clustering all follow directly from it; intervention-timing counterfactuals [42,43] are a natural subsequent step once that baseline exists.
Several limitations constrain this analysis. The study relied on aggregated surveillance data, which are vulnerable to reporting delays, incomplete ascertainment, retrospective reconciliation, and changing case classification. CFRs calculated from cumulative counts during an active outbreak may overestimate or underestimate the true risk of death because outcomes are not yet known for all cases and mild infections may be under detected. Demographic and exposure data were inconsistently disaggregated, limiting risk-factor analysis. The regression models were based on cumulative rather than incident case counts and did not explicitly account for serial correlation, changes in surveillance intensity, or intervention timing. Despite these limitations, the consistency of the overall epidemic pattern across INSP, WHO, and UN sources supports the qualitative conclusion that the outbreak remained active, geographically expanding, and operationally demanding through mid-July 2026.
5. Conclusion
The 2026 Bundibugyo virus disease outbreak remained active through mid-July despite progressive deceleration in proportional growth. Continued mortality, geographic expansion, and sustained incidence show that transmission had not yet been brought under control. The six-month projections demonstrate that future burden will depend strongly on the timeliness and effectiveness of containment and should be interpreted as conditional scenarios rather than deterministic forecasts. A multi-model comparison, growth-rate-reduction analysis, complementary Bayesian sensitivity analysis, extended deterministic sensitivity scenarios, and rolling-origin forecast validation provided additional evidence regarding epidemic dynamics and forecast uncertainty. The divergence between modelling approaches and the systematic under-prediction observed in rolling-origin validation indicate substantial structural uncertainty and suggest that the moderate-deceleration scenario should not be interpreted as an upper bound on future burden. The significance of this analysis lies in showing how routinely reported SitRep data can provide timely operational intelligence when growth rates and doubling times are interpreted alongside incident cases, community deaths, contact follow-up, treatment access, geographic spread, and an explicit, multi-method characterization of forecast uncertainty. These findings support intensified surveillance, earlier case detection, improved access to supportive care, accelerated development and evaluation of BDBV-specific medical countermeasures, the acquisition of health-zone-level time series and spatial covariate data needed to extend growth-model comparison, clustering, and intervention counterfactual analysis below the province level.
Funding
No specific funding was received for this analysis.
Institutional Review Board Statement
All data are derived from publicly available, aggregated official surveillance reports. No individual-level patient data were accessed. Ethical approval was not required per applicable guidelines for secondary analysis of aggregated public health surveillance data.
Informed Consent Statement
Not Applicable.
Data availability
All data are derived from publicly available official SitReps at https://insp.cd/ebola-17eme-epidemie/, WHO Disease Outbreak News, and UN agency publications. Code implementing the additional analyses undertaken (growth-model comparison, doubling-time trajectory, Bayesian MCMC sensitivity analysis, extended scenario sensitivity, and rolling-origin validation) is available from the corresponding author on reasonable request.
Acknowledgments
AI assistance disclosure: The authors acknowledge the use of Claude AI and ChatGPT during manuscript preparation. These tools assisted with language refinement, code development, data visualisation, and literature organisation. All code, numerical outputs, figures, interpretations, and manuscript revisions were independently reviewed and validated by the authors, who retain full responsibility for the integrity and accuracy of the work. The authors gratefully acknowledge Professor Peter Singer for his valuable comments and constructive feedback on an earlier version of the manuscript, which contributed to strengthening its scientific interpretation and presentation.
Conflicts of Interest
The authors declare no conflicts of interest.
References
- Biedenkopf, N.; Bukreyev, A.; Chandran, K.; Di Paola, N.; Formenty, P.B.H.; Griffiths, A.; et al. Renaming of genera Ebolavirus and Marburgvirus to Orthoebolavirus and Orthomarburgvirus, respectively, and introduction of binomial species names within the family Filoviridae. Arch. Virol. 2023, 168(8), 220. [Google Scholar] [CrossRef] [PubMed]
- Towner, J.S.; Sealy, T.K.; Khristova, M.L.; Albariño, C.G.; Conlan, S.; Reeder, S.A.; et al. Newly discovered Ebola virus associated with hemorrhagic fever outbreak in Uganda. PLoS Pathog. 2008, 4(11), e1000212. [Google Scholar] [CrossRef] [PubMed]
- Malten, A.J.; et al. Structural biology illuminates molecular determinants of broad ebolavirus neutralization by human antibodies for pan-ebolavirus therapeutic development. Viruses 2024, 12(12). [Google Scholar]
- Kuhn, J.H.; Amarasinghe, G.K.; Basler, C.F.; Bavari, S.; Bukreyev, A.; Chandran, K.; et al. ICTV virus taxonomy profile: Filoviridae. J. Gen. Virol. 2019, 100(6), 911–2. [Google Scholar] [CrossRef] [PubMed]
- Ontario Agency for Health Protection and Promotion (Public Health Ontario). Genomic epidemiology and molecular characteristics of Bundibugyo virus; King's Printer for Ontario: Toronto, 2026. [Google Scholar]
- Bettini, A.; Lapa, D.; Garbuglia, A.R. Diagnostics of Ebola virus. Front Public Health 2023, 11, 1123024. [Google Scholar] [CrossRef] [PubMed]
- Ayitewala, A.; Amuri-Aziza, A.; Nsawotebba, A.; Wawina-Bokalanga, T.; Ssewanyana, I.; Nabadda, S.; et al. Bundibugyo ebolavirus from the 2026 Ebola outbreak in Uganda and DR Congo: a new variant. Lancet 2026. [Google Scholar] [CrossRef] [PubMed]
- Dutt, M.; Wayengera, M.; Martinez, G.S.; et al. Remdesivir triphosphate as a potential repurposed drug against the emerging Bundibugyo ebolavirus 2026. J. Infect. 2026, 93(2). [Google Scholar] [CrossRef] [PubMed]
- Villa, J.; Wilkinson, A.; Bedford, J.; Schmidt-Sane, M.; Duclos, D. Ituri Ebola outbreak 2026 (DRC): summary overview of context; Institute of Development Studies and Partner Organisations: Brighton, 2026; Available online: https://hdl.handle.net/10779/ids.32625912.v1.
- Chamla, D.; Belizaire, M.R.D.; Co, I.F.; Jinadu, A.; Mamadu, I.; Atagbaza, A.O. Size of the 2026 Ebola outbreak and risk of cross-border spillover from Bundibugyo virus in Ituri Province, Democratic Republic of the Congo, and its implications for preparedness: a recalibrated stochastic modelling study. Lancet Infect. Dis. 2026, 26(8). [Google Scholar] [CrossRef] [PubMed]
- Wawina-Bokalanga, T.; Amuri-Aziza, A.; Vercauteren, K.; Mukadi-Bamuleka, D.; Ngandu, C.; Kindrachuk, J.; et al. Diagnostic performance of RADIONE for diagnosis of Bundibugyo virus disease. Lancet Infect. Dis. 2026, 26(8). [Google Scholar] [CrossRef] [PubMed]
- Institut National de Santé Publique; Centre des opérations d'urgence de santé publique de la République démocratique du Congo. 2026. Situation reports No. 1-61: 17th Ebola virus disease epidemic in the Democratic Republic of the Congo [Internet]. INSP: Kinshasa. Available online: https://insp.cd/ebola-17eme-epidemie/.
- Wilson, E.B. Probable inference, the law of succession, and statistical inference. J. Am. Stat. Assoc. 1927, 22(158), 209–212. [Google Scholar] [CrossRef]
- Chowell, G.; Sattenspiel, L.; Bansal, S.; Viboud, C. Mathematical models to characterize early epidemic growth: A review. Phys. Life Rev. 2016, 18, 66–97. [Google Scholar] [CrossRef] [PubMed]
- Richards, F.J. A flexible growth function for empirical use. J. Exp. Bot. 1959, 10(2), 290–301. [Google Scholar] [CrossRef]
- Akaike, H. A new look at the statistical model identification. IEEE Trans. Autom. Contr 1974, 19(6), 716–23. [Google Scholar] [CrossRef]
- Schwarz, G. Estimating the dimension of a model. Ann. Stat. 1978, 6(2), 461–4. [Google Scholar] [CrossRef]
- Foreman-Mackey, D.; Hogg, D.W.; Lang, D.; Goodman, J. emcee: The MCMC hammer. Publ. Astron Soc. Pac. 2013, 125(925), 306–12. [Google Scholar] [CrossRef]
- Bürkner, P.C. brms: An R package for Bayesian multilevel models using Stan. J. Stat. Softw. 2017, 80(1), 1–28. [Google Scholar] [CrossRef]
- Shears, P.; Garavan, C. The 2018-2019 Ebola epidemic in the Democratic Republic of the Congo: epidemiology, outbreak control, and conflict. Infect. Prev. Pract. Correction in Infect Prev Pract. 2021, 3, 100119. https://doi.org/10.1016/j.infpip.2021.100119.. 2020, 2(1), 100038. [Google Scholar] [CrossRef] [PubMed]
- Muyembe, J.J.; Pan, H.; Peto, R.; Diallo, A.; Touré, A.; Mbala-Kingebene, P.; Bateyi Mustafa, S.H.; Tambwe, N.; Mulangu, S.; Ahuka-Mundeke, S.; Mukamba Musenga, E.; Enwere, G.; Gsell, P.S.; Longini, I.M.; Riveros Balta, X.; Roberts, C.H.; Marks, M.; Yao, M.N.K.; Gueye, A.S.; Fall, I.S.; Salama, P.; Ryan, M.J.; Henao-Restrepo, A.M. Ebola Ring Vaccination Team in the DRC. Ebola Outbreak Response in the DRC with rVSV-ZEBOV-GP Ring Vaccination. N Engl. J. Med. 2024, 391(24), 2327–2336. [Google Scholar] [CrossRef] [PubMed]
- World Health Organization. Bundibugyo virus disease—Democratic Republic of the Congo and Uganda [Internet]; World Health Organization: Geneva, 17 [ May 2026; Available online: https://www.who.int/emergencies/disease-outbreak-news/item/2026-DON602.
- Kaweesa, R.E.; Katende, J.S.; Wayesu, R.R.; Ntabadde, A.D.; Opio, S.; Kato, L.; et al. Resilience and residuals beyond containment: the hidden burden of Bundibugyo Ebola virus survivorship sixteen years on—a cross-sectional observational study. New Microbes New Infect. 2026, 69, 101685. [Google Scholar] [CrossRef] [PubMed]
- Clark, D.V.; Kibuuka, H.; Millard, M.; Wakabi, S.; Lukwago, L.; Taylor, A.; et al. Long-term sequelae after Ebola virus disease in Bundibugyo, Uganda: a retrospective cohort study. Emerg. Infect. Dis. 2015, 21(11), 2012–8. [Google Scholar] [CrossRef]
- Meltzer, M.I.; Atkins, C.Y.; Santibanez, S.; Knust, B.; Petersen, B.W.; Ervin, E.D.; et al. Estimating the future number of cases in the Ebola epidemic—Liberia and Sierra Leone, 2014-2015. MMWR Suppl. 2014, 63(3), 1–14. [Google Scholar] [PubMed]
- Funk, S.; Ciglenecki, I.; Tiffany, A.; Gignoux, E.; Camacho, A.; Eggo, R.M.; et al. Assessing the performance of real-time epidemic forecasts: a case study of Ebola in the Western Area region of Sierra Leone, 2014-2015. PLoS Comput Biol. 2019, 15(2), e1006785. [Google Scholar] [CrossRef] [PubMed]
- MacNeil, A.; Farnon, E.C.; Wamala, J.; Okware, S.; Cannon, D.L.; Reed, Z.; et al. Proportion of deaths and clinical features in Bundibugyo Ebola virus infection, Uganda. Emerg. Infect. Dis. 2010, 16(12), 1969–72. [Google Scholar] [CrossRef] [PubMed]
- European Centre for Disease Prevention and Control. Ebola virus disease—Democratic Republic of the Congo and Uganda [Internet]; ECDC: Stockholm, 26 [ Jun 2026; Available online: https://www.ecdc.europa.eu/en/ebola-outbreak-democratic-republic-congo-and-uganda.
- Mukuku, O.; Govender, K.; Musung, J.M.; Lubala, T.K.; Kangitsi, C.K. When trust breaks down: Ebola, safe burials, and community engagement in eastern Democratic Republic of the Congo. Lancet Reg. Health Afr. 2026, 100101. [Google Scholar] [CrossRef]
- Nachega, J.B.; Tshiani Mbaya, O.; Mulangu, S.; et al. Clinical trial priorities, adaptive strategies, and equitable partnerships for the Bundibugyo Ebola outbreak. Lancet Infect. Dis. 2026. [Google Scholar] [CrossRef] [PubMed]
- World Health Organization. Ebola disease outbreak in the Democratic Republic of the Congo and Uganda [Internet]; World Health Organization: Geneva, 10 [ Jun 2026; Available online: https://www.who.int/emergencies/disease-outbreak-news/item/2026-DON607.
- Centers for Disease Control and Prevention. Ebola situation summary [Internet]; Centers for Disease Control and Prevention: Atlanta, 2026; Available online: https://www.cdc.gov/ebola/situation-summary/index.html.
- Wells, C.R.; Pandey, A.; Ndeffo Mbah, M.L.; Gauzère, B.-A.; Malvy, D.; Singer, B.H.; Galvani, A.P. The exacerbation of Ebola outbreaks by conflict in the Democratic Republic of the Congo. Proc. Natl. Acad. Sci. U S A 2019, 116(48), 24366–24372. [Google Scholar] [CrossRef] [PubMed]
- Kalenga, O.I.; Moeti, M.; Sparrow, A.; Nguyen, V.-K.; Lucey, D.; Ghebreyesus, T.A. The Ongoing Ebola Epidemic in the Democratic Republic of Congo, 2018–2019. N Engl. J. Med. 2019, 381, 373–383. [Google Scholar] [CrossRef] [PubMed]
- Olivero, J.; Fa, J.E.; Real, R.; Márquez, A.L.; Farfán, M.A.; Vargas, J.M.; et al. Recent loss of closed forests is associated with Ebola virus disease outbreaks. Sci. Rep. 2017, 7, 14291. [Google Scholar] [CrossRef] [PubMed]
- Huber, C.; Watts, A.; Thomas-Bachli, A.; McIntyre, E.; Tuite, A.; Khan, K.; Cetron, M.; Merrill, R.D. Using spatial and population mobility models to inform outbreak response approaches in the Ebola affected area, Democratic Republic of the Congo, 2018–2020. Spat. Spatiotemporal Epidemiol. 2023, 44, 100558. [Google Scholar] [CrossRef] [PubMed]
- Pu, Q.; Yoo, E.-H.; Rothstein, D.H.; Cairo, S.; Malemo, L. Improving the spatial accessibility of healthcare in North Kivu, Democratic Republic of Congo. Appl. Geogr. 2020, 121, 102262. [Google Scholar] [CrossRef]
- Genolini, C.; Falissard, B. KmL: k-means for longitudinal data. Comput Stat. 2010, 25(2), 317–328. [Google Scholar] [CrossRef]
- O'Regan, S.M.; Drake, J.M. Theory of early warning signals of disease emergence and leading indicators of elimination. Theor. Ecol. 2013, 6(3), 333–357. [Google Scholar] [CrossRef] [PubMed]
- Brett, T.S.; O'Dea, E.B.; Marty, É.; Miller, P.B.; Park, A.W.; Drake, J.M.; Rohani, P. Anticipating epidemic transitions with imperfect data. PLoS Comput Biol. 2018, 14(6), e1006204. [Google Scholar] [CrossRef] [PubMed]
- Bjørnstad, O.N.; Ims, R.A.; Lambin, X. Spatial population dynamics: analyzing patterns and processes of population synchrony. Trends Ecol. Evol. 1999, 14(11), 427–432. [Google Scholar] [CrossRef] [PubMed]
- Camacho, A.; Kucharski, A.J.; Funk, S.; Breman, J.; Piot, P.; Edmunds, W.J. Temporal changes in Ebola transmission in Sierra Leone and implications for control requirements: a real-time modelling study. PLoS Curr. Outbreaks 2015. [Google Scholar] [CrossRef] [PubMed]
- Kucharski, A.J.; Camacho, A.; Flasche, S.; Glover, R.E.; Edmunds, W.J.; Funk, S. Measuring the impact of Ebola control measures in Sierra Leone. Proc. Natl. Acad. Sci. U S A 2015, 112(46), 14366–14371. [Google Scholar] [CrossRef] [PubMed]
Figure 6.
Bubble analysis of confirmed cases, confirmed deaths, and reported CFR by province, SitRep 61 (14 July 2026). Bubble size is proportional to the reported CFR.
Figure 6.
Bubble analysis of confirmed cases, confirmed deaths, and reported CFR by province, SitRep 61 (14 July 2026). Bubble size is proportional to the reported CFR.
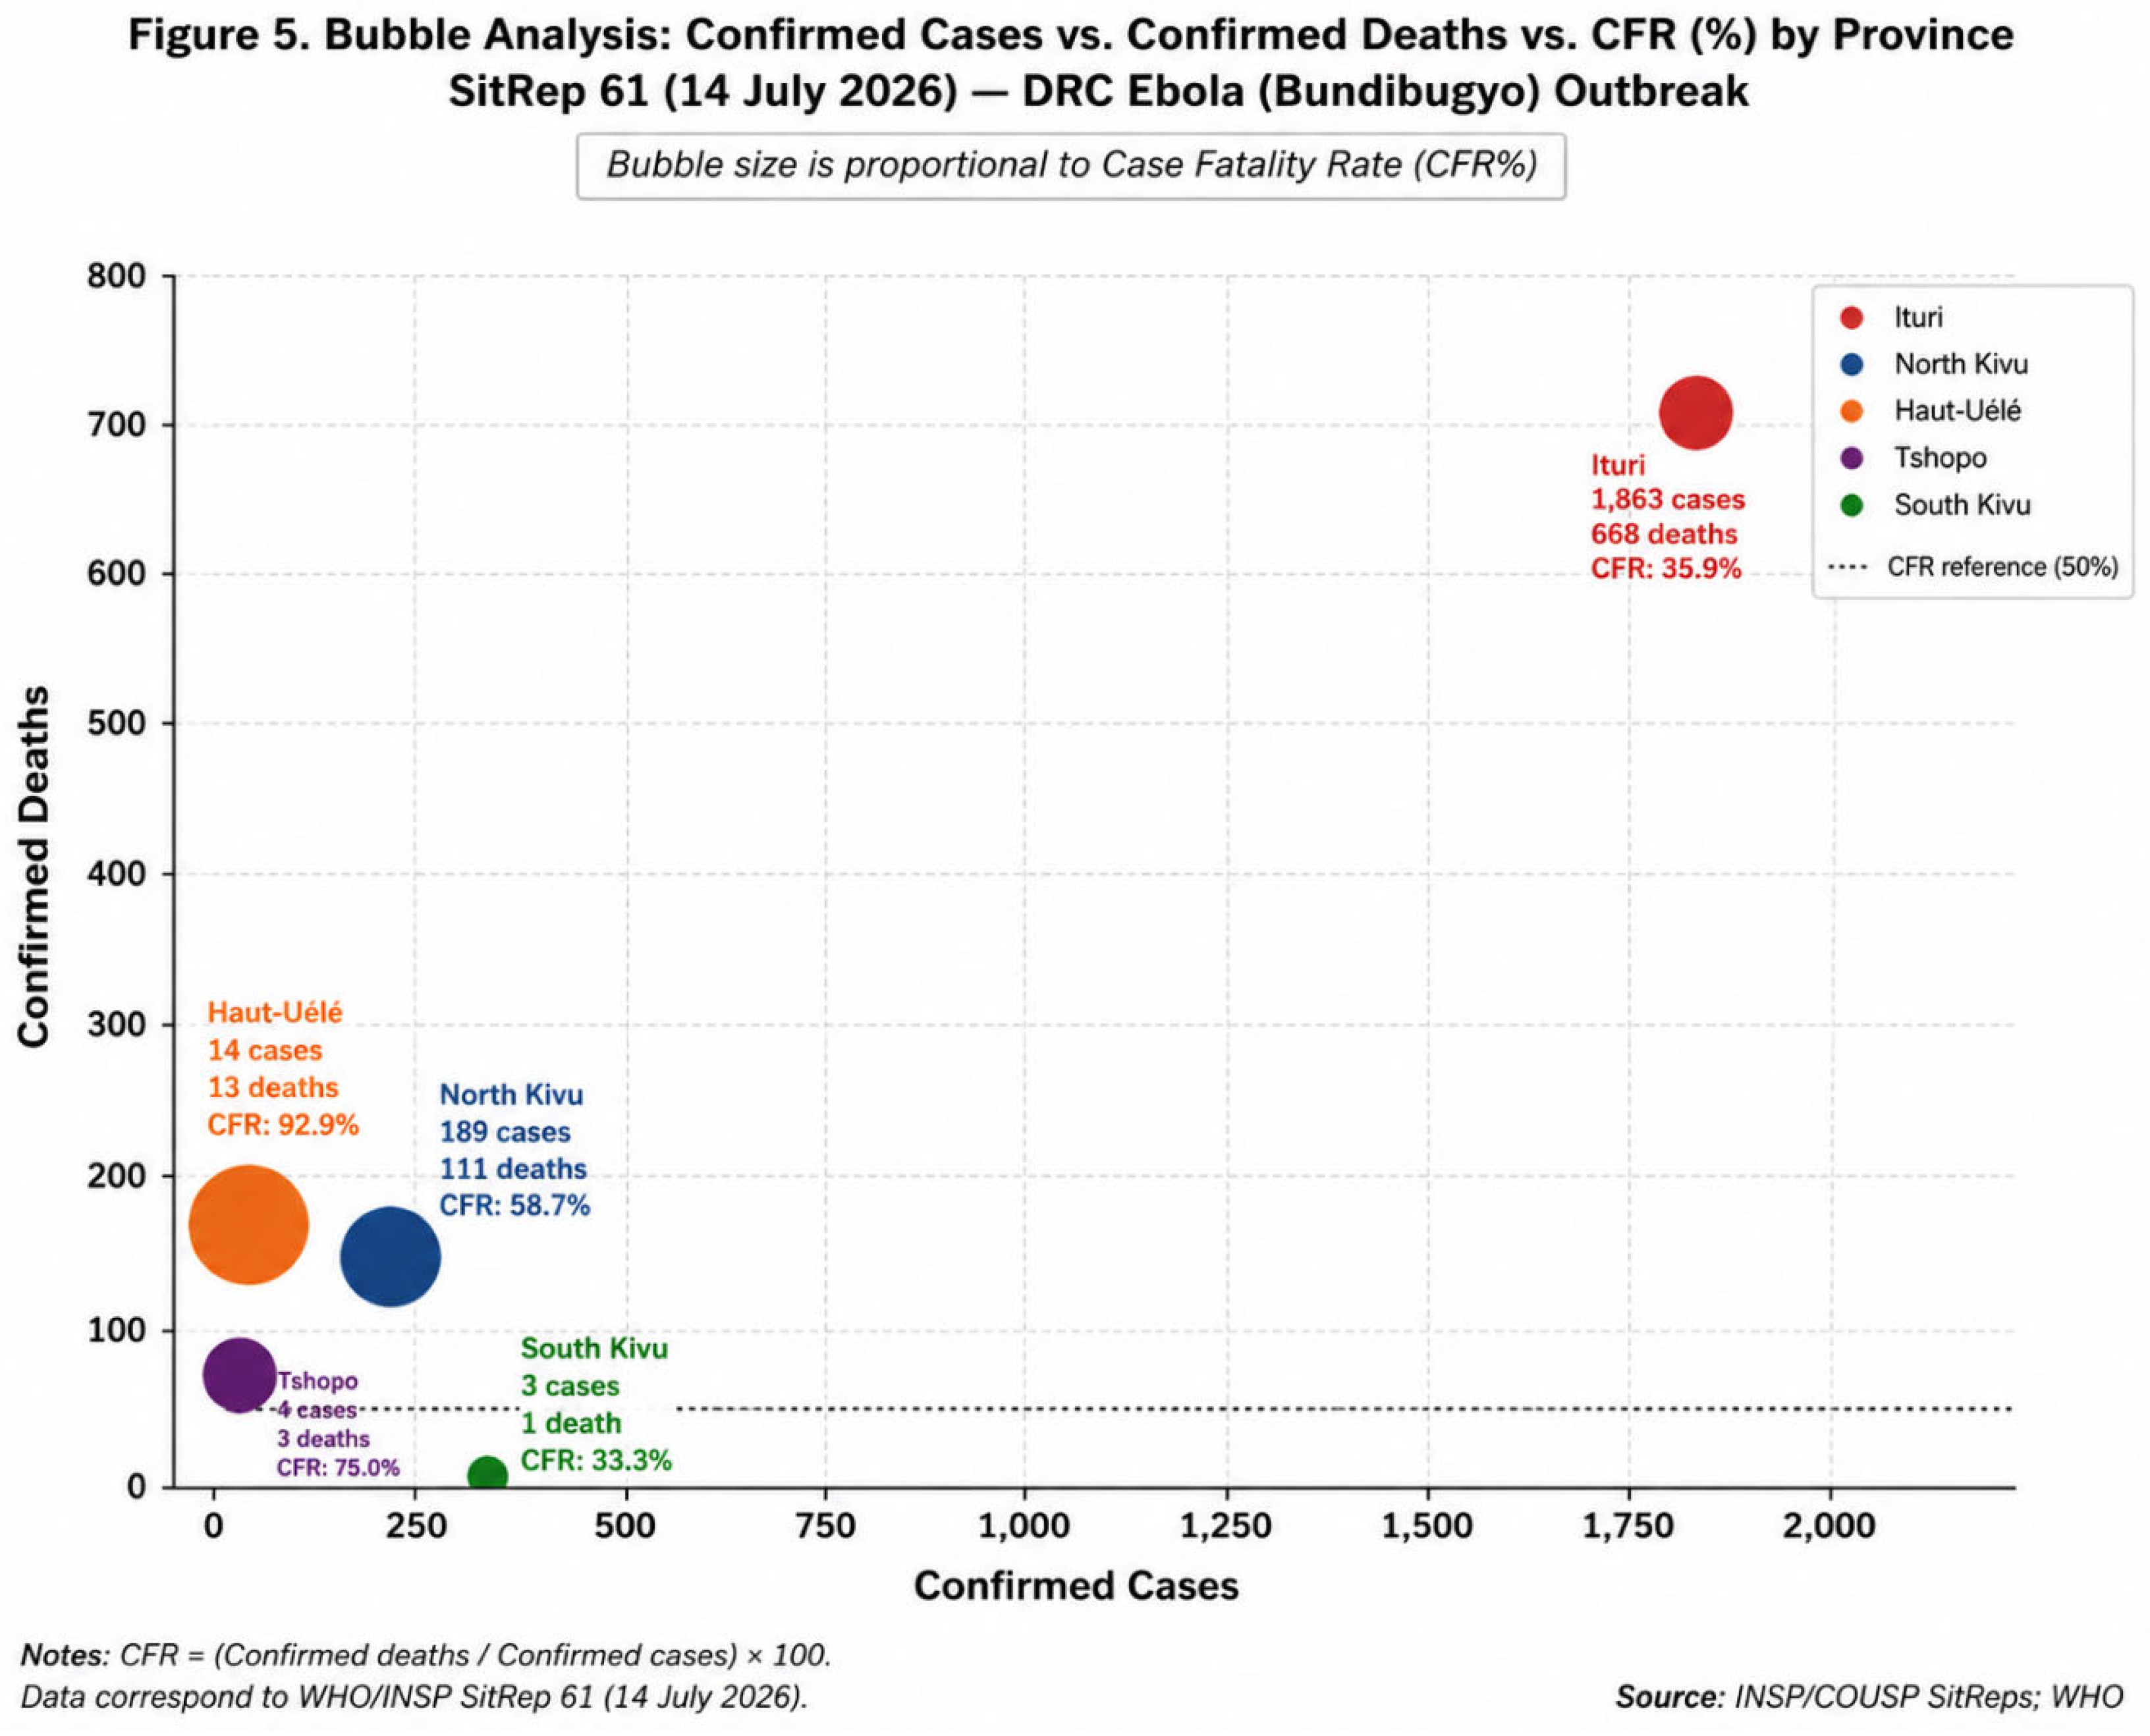
Figure 9.
Extended six-month (14 January 2027) scenario comparison, combining the three original scenarios with the two deterministic sensitivity scenarios.
Figure 9.
Extended six-month (14 January 2027) scenario comparison, combining the three original scenarios with the two deterministic sensitivity scenarios.
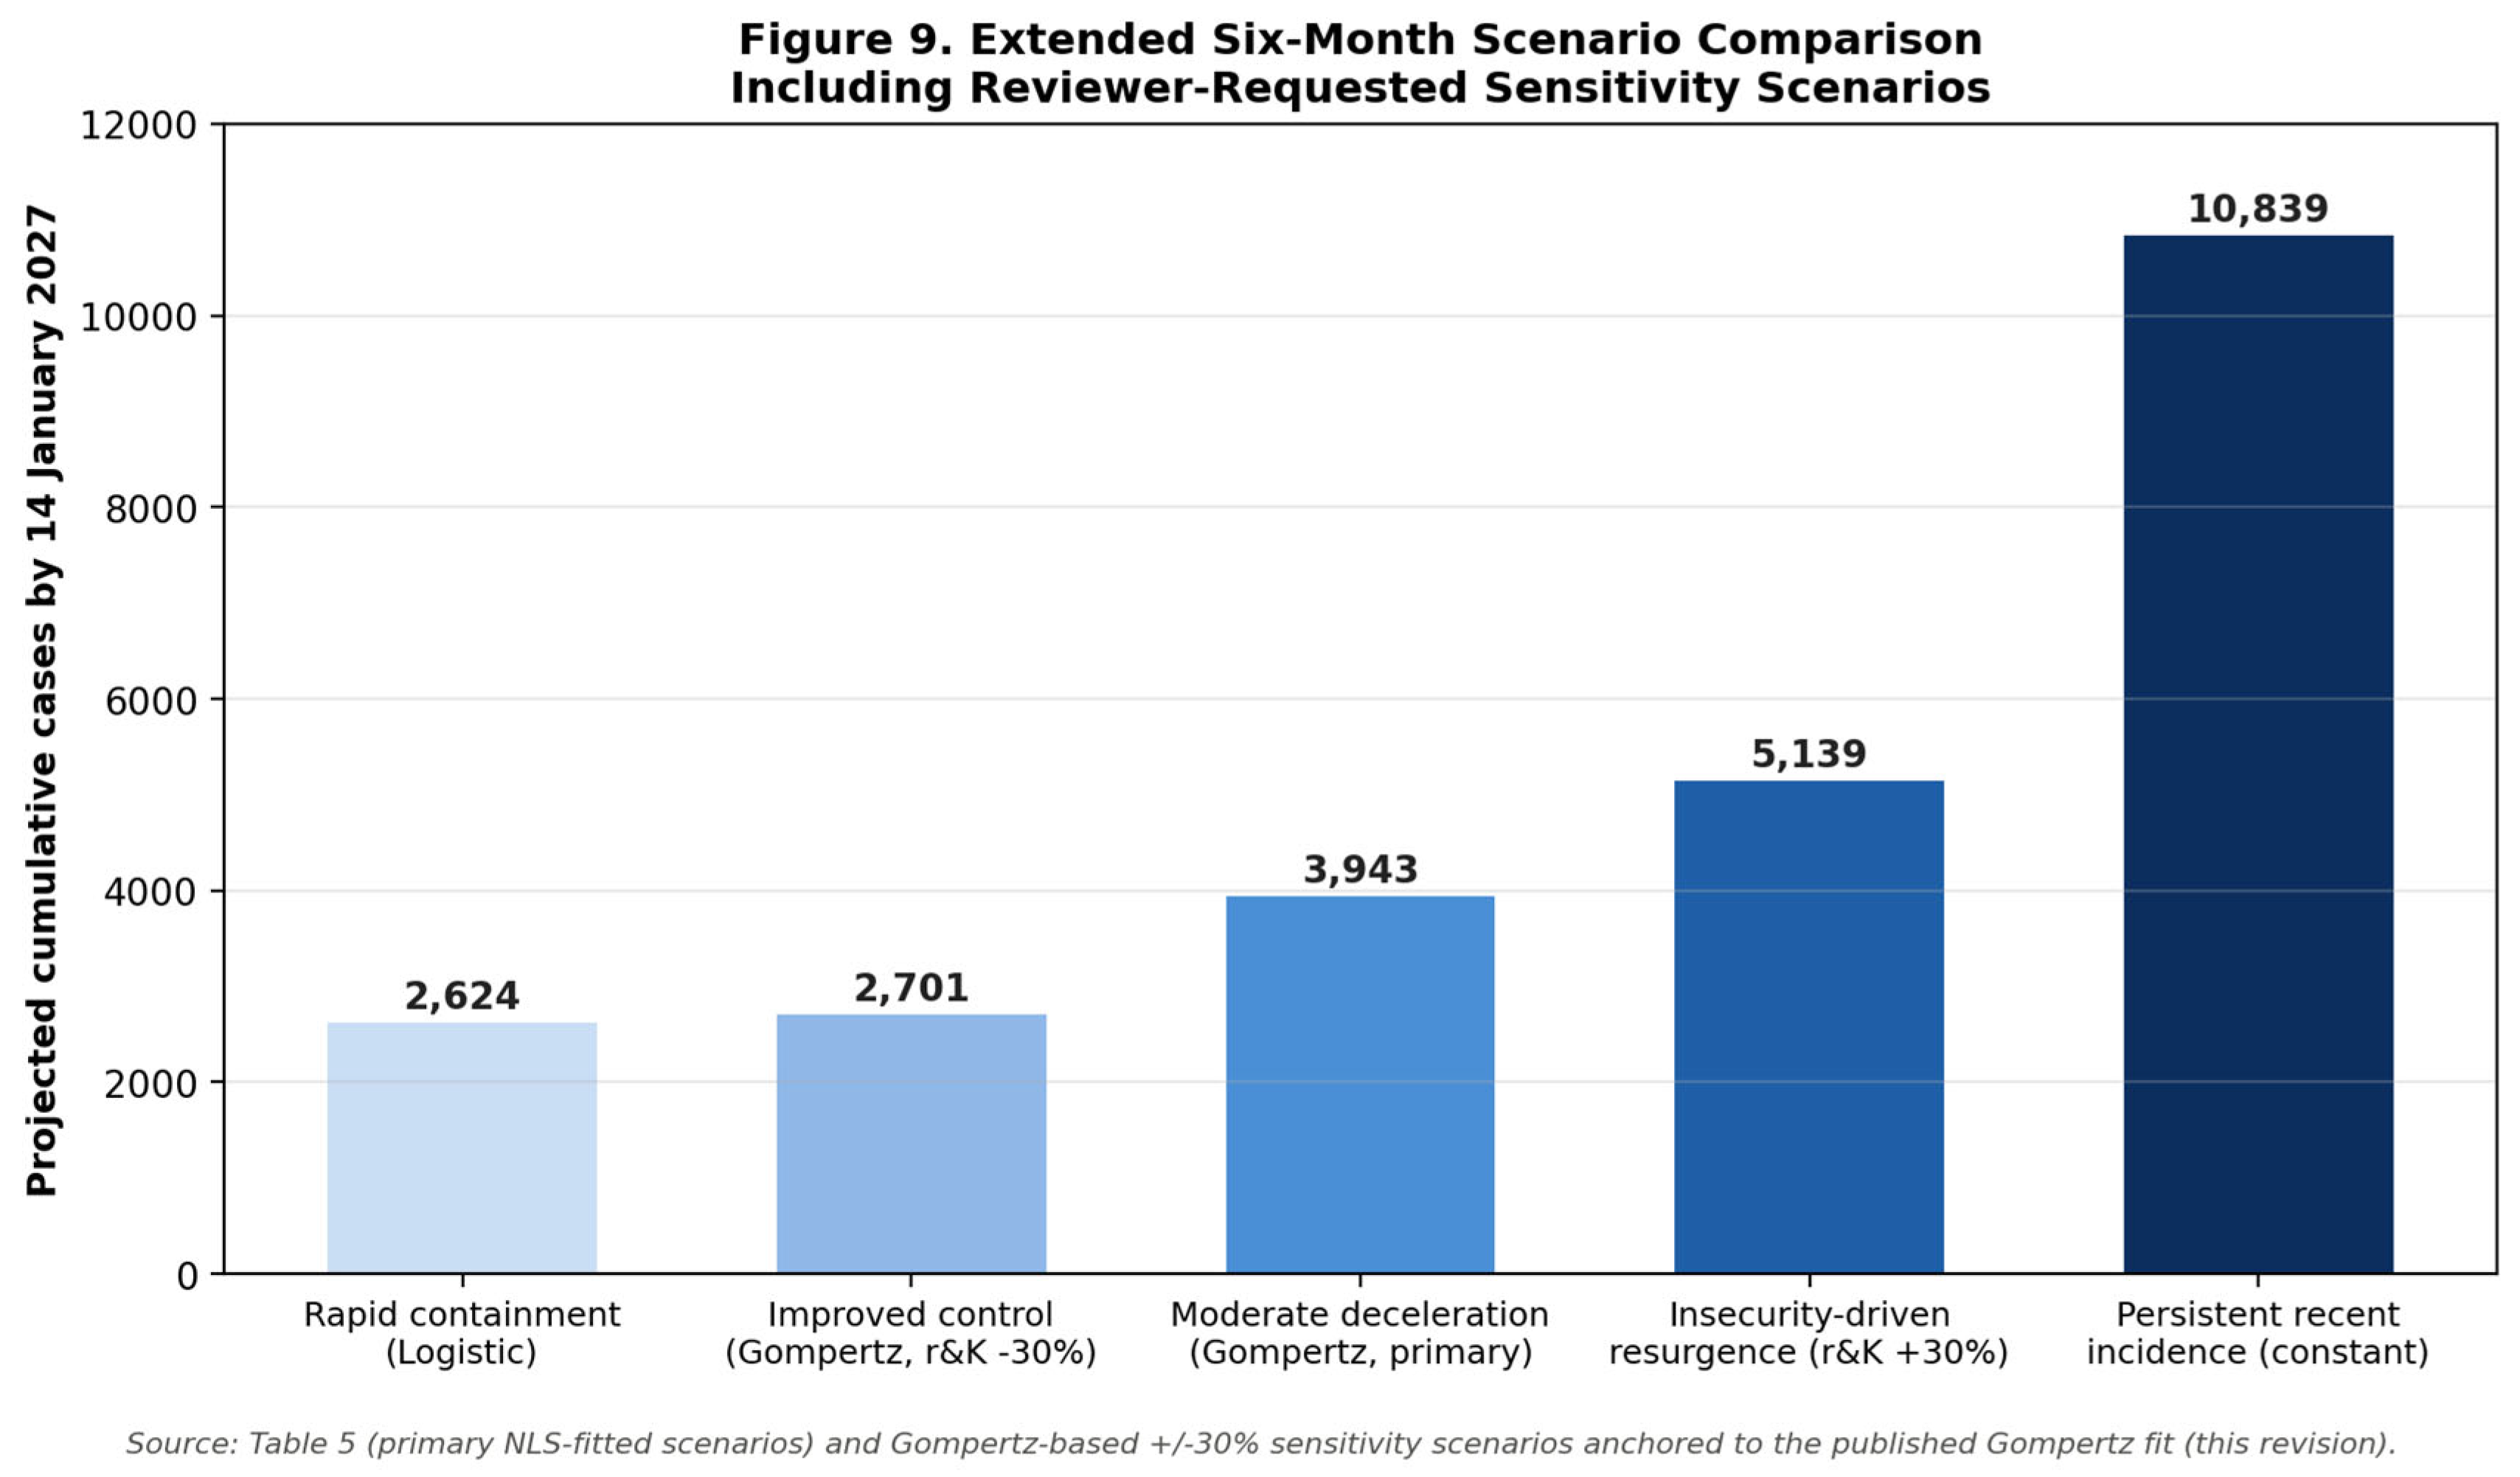
Table 1.
Extended Epidemic Trajectory: Confirmed Cases, Deaths, CFR, and Geographic Spread, 14 May–14 July 2026 (INSP Situation Reports 1–61).
Table 1.
Extended Epidemic Trajectory: Confirmed Cases, Deaths, CFR, and Geographic Spread, 14 May–14 July 2026 (INSP Situation Reports 1–61).
| SitRep Group | Final SitRep Used | Cum. Cases | Cum. Deaths | CFR (%) | HZ (n) | Provinces | Interval r (/day) | Interval Td (days) |
|---|---|---|---|---|---|---|---|---|
| SR1–SR5 | SR5 | 51 | 4 | 7.8 | 7 | 2 | 0.463 | 1.5 |
| SR6–SR10 | SR10 | 105 | 10 | 9.5 | 13 | 3 | 0.144 | 4.8 |
| SR11–SR15 | SR15 | 263 | 42 | 16.0 | 22 | 3 | 0.184 | 3.8 |
| SR16–SR20 | SR20 | 381 | 64 | 16.8 | 25 | 3 | 0.074 | 9.4 |
| SR21–SR25 | SR25 | 598 | 115 | 19.2 | 25 | 3 | 0.090 | 7.7 |
| SR26–SR30 | SR30 | 782 | 181 | 23.1 | 31 | 3 | 0.054 | 12.9 |
| SR31–SR35 | SR35 | 933 | 245 | 26.3 | 34 | 3 | 0.035 | 19.6 |
| SR36–SR40 | SR40 | 1,118 | 291 | 26.0 | 34 | 3 | 0.036 | 19.2 |
| SR41–SR45 | SR44 | 1,274 | 360 | 28.3 | 35 | 3 | 0.033 | 21.2 |
| SR46–SR50 | SR50 | 1,528 | 492 | 32.2 | 36 | 3 | 0.030 | 22.9 |
| SR51–SR55 | SR55 | 1,792 | 625 | 34.9 | 37 | 3 | 0.032 | 21.7 |
| SR56–SR61 | SR61 | 2,073 | 796 | 38.4 | 45 | 5 | 0.024 | 28.6 |
| Final situation | SR61 | 2,073 | 796 | 38.4 | 45 | 5 | — | — |
Note: Cumulative indicators represent the value reported in the final available SitRep of each group and are not summed across SitReps. Interval growth rates and doubling times (columns 8–9) were computed from the 21-point series formed by reconciling Table 1 with the annotated values in Figure 2, which agreed exactly on all overlapping SitReps (Section 2.3.1); the 12 intervals shown correspond to the 12 dated rows above, moving from the first observation (SitRep 1, 8 cases) through SitRep 61.
Table 2.
National-Level Growth Model Comparison, Fitted to 21 Reconciled Aggregated Case Observations (SitReps 1–61).
Table 2.
National-Level Growth Model Comparison, Fitted to 21 Reconciled Aggregated Case Observations (SitReps 1–61).
| Model | Fitted parameters | RMSE | AICc | BIC | Rank |
|---|---|---|---|---|---|
| Exponential | a=209.45, b=0.0391/day | 127.97 | 270.78 | 272.50 | 4 |
| Logistic | K=2,434.85, r=0.0780/day, x0=41.73 | 55.94 | 239.11 | 240.79 | 3 |
| Gompertz | K=3,511.99, b=4.3745, r=0.0340/day | 34.14 | 218.37 | 220.05 | 1 (best) |
| Richards (generalised logistic) | K=3,485.76, r=0.0344/day, x0=43.37, s≈0.010 | 34.40 | 222.20 | 223.42 | 2 |
Note: Fitted at the national level only. Disaggregating this comparison by province or health zone, would require case time series indexed by health zone and date that were not available in the aggregated SitRep summaries analysed here (Section 2.3.1; Section 4).
Table 3.
Growth-Rate Reduction Between Epidemic Phases.
| Comparison | Earlier r (/day) | Later r (/day) | Δr (/day) | Reduction (%) |
|---|---|---|---|---|
| Early → Intermediate | 0.078 | 0.036 | 0.042 | 53.8% |
| Intermediate → Late | 0.036 | 0.028 | 0.008 | 22.2% |
| Early → Late (overall) | 0.078 | 0.028 | 0.050 | 64.1% |
Table 4.
Province-Level Ebola Burden Summary — SitRep 61, 14 July 2026 (with exact Wilson 95% confidence intervals for CFR).
Table 4.
Province-Level Ebola Burden Summary — SitRep 61, 14 July 2026 (with exact Wilson 95% confidence intervals for CFR).
| Province | Confirmed Cases | Confirmed Deaths | CFR (%) | Wilson 95% CI (%) | Affected HZ |
|---|---|---|---|---|---|
| Ituri | 1,863 | 668 | 35.9 | 33.7–38.1 | 26 |
| North Kivu | 189 | 111 | 58.7 | 51.6–65.5 | 11 |
| South Kivu | 3 | 1 | 33.3 | 6.1–79.2 | 1 |
| Haut-Uélé | 14 | 13 | 92.9 | 68.5–98.7 | 4 |
| Tshopo | 4 | 3 | 75.0 | 30.1–95.4 | 3 |
| National total | 2,073 | 796 | 38.4 | 36.3–40.5 | 45 |
CFR = confirmed deaths / confirmed cases × 100. HZ = health zone. 95% CI computed using the Wilson score method [13]. Excludes 'Other/unallocated' category. SR = SitRep.
Table 6.
Bayesian versus Bootstrap Uncertainty Comparison for the Six-Month Gompertz Projection.
| Horizon | Published point estimate (Gompertz) | Bootstrap 95% CI | Bayesian expected-trajectory 95% CrI (median) | Bayesian posterior-predictive 95% CrI (median) |
|---|---|---|---|---|
| 1 month (SitRep 91) | 3,031 | not estimated at this horizon in the original analysis | 2,270 [2,018–2,511] | 2,270 [1,885–2,630] |
| 3 months (SitRep 152) | 3,787 | not estimated at this horizon in the original analysis | 2,391 [2,081–2,712] | 2,394 [1,960–2,816] |
| 6 months (SitRep 245) | 3,942 | 3,519–4,668 | 2,397 [2,083–2,728] | 2,397 [1,948–2,839] |
Table 7.
Rolling-Origin Forecast Calibration: Gompertz Projections for SitRep 61 Made at Earlier Truncation Points.
Table 7.
Rolling-Origin Forecast Calibration: Gompertz Projections for SitRep 61 Made at Earlier Truncation Points.
| Truncation origin | N points used | Gompertz projection for SitRep 61 | Actual SitRep 61 value | Error (%) |
|---|---|---|---|---|
| ≤ SitRep 39 | 13 | 1,514 | 2,073 | −27.0% |
| ≤ SitRep 44 | 15 | 1,620 | 2,073 | −21.9% |
| ≤ SitRep 50 | 17 | 1,820 | 2,073 | −12.2% |
| ≤ SitRep 55 | 19 | 1,956 | 2,073 | −5.7% |
Disclaimer/Publisher’s Note: The statements, opinions and data contained in all publications are solely those of the individual author(s) and contributor(s) and not of MDPI and/or the editor(s). MDPI and/or the editor(s) disclaim responsibility for any injury to people or property resulting from any ideas, methods, instructions or products referred to in the content. |
© 2026 by the authors. Licensee MDPI, Basel, Switzerland. This article is an open access article distributed under the terms and conditions of the Creative Commons Attribution (CC BY) license (http://creativecommons.org/licenses/by/4.0/).
Copyright: This open access article is published under a Creative Commons CC BY 4.0 license, which permit the free download, distribution, and reuse, provided that the author and preprint are cited in any reuse.