

Submitted:
14 August 2026
Posted:
17 August 2026
You are already at the latest version
Abstract
Background/Objectives: Paediatric oral health during primary school years profoundly impacts systemic development and psychosocial wellbeing, with parental health habits heavily dictating whether care follows a preventive or a reactive pathway. The aim of this study was to evaluate parent-reported oral health status, oral hygiene habits, and dietary patterns in primary schoolchildren, as well as parental awareness regarding the impact of oral health on children’s overall wellbeing across preventive and reactive care pathways. Methods: A cross-sectional study was conducted, administering an online questionnaire to 1889 parents of primary schoolchildren, which evaluated the parent’s knowledge, behaviors and attitudes regarding the oral health and diet of their children. Results: Parent-perceived child oral and gum health was overall favorable, with girls (p<0.01) and children of parents with higher educational background (p<0.001) receiving higher ratings. While toothbrushing with fluoridated toothpaste was widely reported, fluoride usage and dental flossing remained heavily stratified by socio-demographic factors (p<0.001). The consumption of fruits, sweet bakeries and cariogenic snacks was frequent and soft drink intake demonstrated an age-dependent increase (p=0.001). Dental pain was rarely reported; increased pain frequency was correlated with poorer parent-perceived oral health ratings and cariogenic diets (p<0.001). Child dental visits were predominantly low or reactive, with non-attendance and pain-triggered visits significantly linked to rural residence, lower parental academic attainment, poor brushing frequency and cariogenic diets, which affected the children’s quality of life (p<0.001). Conclusions: Schoolchildren’s oral healthcare remains largely reactive, with dental pain serving as the primary trigger for dental service utilization, despite generally favorable parental perceptions.
Keywords:
pediatric oral health
; dental caries prevention
; parent education
; dental anxiety
; health behavior
1. Introduction
Optimal maintenance of oral health in primary schoolchildren aged 6-to-12 years old constitutes a fundamental determinant of their future physiological development and psychosocial wellbeing [1]. The mixed dentition phase is of particular clinical significance, as it is characterized by the simultaneous presence of deciduous teeth, with their associated dental pathologies, and the eruption of permanent teeth, which are particularly vulnerable to carious lesions in the first years post-eruption [2,3]. Poor oral hygiene during this developmental phase extends beyond the associated symptomatology of localized odontogenic pathologies [4]. Systemic consequences may include sleep deprivation and nutritional compromises that may affect general development [5,6]. Beyond these physiological concerns, the consequences may be related to both aesthetic and functional aspects of the dentition, affecting phonation and psychosocial behaviour, eventually manifesting as lowered self-perception, increased school absenteeism and poor quality of life [7,8].
Parental involvement is the primary driver in establishing healthy oral hygiene and dietary habits during childhood [9]. By shaping the home environment, parents act as both facilitators and role models, and their active supervision directly influences how consistently and effectively a child removes plaque and maintains oral health [10]. Furthermore, parents play an essential role in managing the cariogenic risk by controlling sugar intake and establishing structured eating routines. For a child to adopt lifelong oral health routines, parents must successfully translate their own dental knowledge into daily practice, effectively reducing the likelihood of early dental disease [11].
The periodicity and motivation surrounding children’s dental attendances are highly mediated by parental influence, wherein transmitted dental anxiety and reactive, pain-driven care seeking directly compromise preventive, routine access of dental services. In alignment with this need, the Erasmus+ PaFein+ project aims to create positive oral health attitudes and prevent dental anxiety in paediatric populations [12]. As part of this initiative, a dedicated Parents’ Section was established to provide evidence-based guidance for managing stress-free dental visits, with the present study reflecting key research undertaken within this framework.
The main objective of this study was to evaluate parent-reported oral health status, oral hygiene habits, and dietary patterns in primary schoolchildren, differentiating between preventive and reactive care pathways. Additionally, the study aimed to assess parental awareness regarding the impact of oral health on children’s overall wellbeing across both pathways.
2. Materials and Methods
2.1. Study Design and Participants
This was a cross-sectional study, part of a broader longitudinal study, within the oral health education national program “Little Dentists”, 2025 Edition, which was conducted in primary schools in Bucharest and in 20 counties across Romania. This study was approved by the Research Ethics Committee of the “Carol Davila” University of Medicine and Pharmacy Bucharest (no. 13896/05 June 2025). The inclusion criteria are related to the voluntary enrolment of the primary school teachers in the “Little Dentists” program, who further distributed an online questionnaire to the parents of the schoolchildren attending their classes. The exclusion criteria are related to the refusal of participation. The study included 1889 parents of the schoolchildren enrolled in the classes of the 778 primary school teachers that previously enrolled in the “Little Dentists” program. Before enrolment, the parents were informed about the aims of the study and gave their consent for the participation in the study. The parents who refused to participate were further excluded (n=19), while those that gave their consent and further filled the questionnaire were included (n=1870). As part of the participation in the program, in addition to filling the online questionnaire, the parents were invited to join an online community initiated and administered by the “Little Dentists” partners, where they received access to useful information about their children’s oral health.
2.2. The oral Health Education National Program “Little Dentists”
The “Little Dentists” program (“Micii Stomatologi”, as originally entitled in Romanian) is an oral health educational program conducted by the National Society of Red Cross from Romania in partnership with the Romanian National Association of Paediatric Dentistry and the Discipline of Oral Health and Community Dentistry within the Faculty of Dentistry, at “Carol Davila” University of Medicine and Pharmacy in Bucharest. The “Little Dentists” program aims to provide oral health education to schoolchildren aged 6–to-12 years old, who are enrolled in the 1st level educational classes, through their primary school educators and their caregivers. Within the program, the three strategic and educational partners developed scientific, evidence-based materials regarding oral health and preventive dental approaches which were provided to primary school teachers, who were further encouraged to use and disseminate the information to schoolchildren attending their classes and to their subsequent families. The teaching and educational materials developed within the project are based on materials provided by the Erasmus+ 2023-1-TR01-KA220-HED-000155608 PaFein+ project team and are following the WHO recommendations [13].
The “Little Dentists” program is designed to be carried out in multiple phases. The objective of the first phase is to evaluate the knowledge, attitudes and behaviours of parents and primary school teachers regarding the oral health, routine oral hygiene practices, protective dietary habits, and scheduled prophylactic dental visits of schoolchildren. Problem-driven dental visits, symptom-triggered care-seeking behaviours, and parental responses to existing oral health conditions are further evaluated, in order to measure how parents perceive the impact of both preventive practices and reactive treatments on their children’s overall wellbeing and quality of life. The second phase of the program aims to provide educational materials and online training to primary school teachers, who will further disseminate the information related to oral health to schoolchildren attending their classes. The online training for teachers is performed by trained dental professionals.
2.3. Questionnaire Contents and Distribution
The questionnaire, comprising 17 items adapted for parents, is based on the World Health Organization Children’s Questionnaire from 2013 [13], and was previously validated for the Romanian population [14]. It evaluated the parent’s knowledge, behaviours and attitudes regarding the oral health and diet of their children. The general data collected through the questionnaire included information about the socio-demographic characteristics of the schoolchildren (Q1-Q4) and the educational levels of the parents (Q16-Q17). The items related to oral health collected data about the parents’ perceptions about their children’s oral health status (Q5), dental pain (Q6), dental visits (Q7-Q8), dental hygiene habits (Q9-Q12), quality of life related to oral health (Q13), eating (Q14) and smoking habits (Q15). The questionnaire was distributed online to parents by the primary school teachers enrolled in the program, and the responses were making reference to the children attending the classes of the teacher that distributed the questionnaire.
2.4. Statistical Analysis
Statistical analyses were performed using IBM SPSS Statistics 25 and were illustrated using Microsoft Office Excel and Word 2025. Quantitative variables were tested for normal distribution using the Shapiro-Wilk Test and data distributions were presented as means, standard deviations (SD), medians, quartiles and interquartile ranges. Qualitative variables were expressed as counts or percentages and were tested between groups using Fisher’s Exact Test. Z-tests with Bonferroni correction were used to further detail the results obtained in the contingency tables. Quantitative independent variables with non-parametric distribution were tested between groups using Mann-Whitney U or Kruskal-Wallis H tests (with post-hoc Dunn-Bonferroni tests). The threshold for the significance level was considered to be α = 0.05.
3. Results
3.1. Sociodemographic Distribution of Participants
Participant distribution across the sample was relatively balanced: 51.4% of the respondents were parents of boys, and 52.4% of the respondents were living in an urban area. The mean age of children was 8.48 ± 1.49 years old (median=8; IQR=7-10), the majority of them studying in the 3rd (22%) or 2nd grade (21%). Parents’ education analysis showed that 29.7% of the fathers had academic studies and 50% had high school education, while 41.1% of the mothers had academic studies and 43% had high school education.
3.2. Parent’s Perception of Their Children’s Oral Health Status
Parent-reported perceptions of children’s dental and gum health are detailed in Table 1. Excellent ratings of dental and gum health status were more frequently attributed to girls (p<0.01, Fisher’s Exact Test), while satisfactory and good ratings, respectively, were more frequently attributed to boys (p<0.01, Fisher’s Exact Test). Parent’s perception of children’s dental health differed significantly according to the parent's educational level. Children whose fathers had academic studies were more frequently perceived as having very good ratings of dental health status compared to poor/satisfactory/good ratings (40.4% vs. 17% / 25.9% / 26.7%, p < 0.001, Fisher’s Exact Test). Similarly, children whose mothers had academic studies were more frequently perceived as having very good ratings of dental health status compared with poor/good ratings (52.3% vs. 22.3% / 39.5%, p < 0.001, Fisher’s Exact Test). Excellent ratings of children’s dental health status showed no statistical differences regarding the parent’s educational levels. Children whose fathers had academic studies were more associated with very good/excellent ratings of gum health status compared to poor/satisfactory/good ratings (38.6% / 40.8% vs. 11.1% / 18.9% / 21.6%; p<0.001, Fisher’s Exact Test). Children whose mothers had academic studies were more associated with very good/excellent ratings of gum health status compared to poor/satisfactory/good ratings (48.5% / 48.2% vs. 20.7% / 32.4% / 36.3%; p<0.00,1, Fisher’s Exact Test).
3.3. Parents’ Perception of Their Children’s Dental Hygiene Habits
A percentage of 47.2% of the participating parents reported that their children brushed their teeth once daily, followed by brushing twice or more times a day (40.7%). Most of the children used a toothbrush (98.9%) and toothpaste (99%) for their dental hygiene, and only 22.4% associated dental floss in their routine. The toothpaste contained fluoride in 64.3% of the cases. However, the use of fluoride toothpaste differed significantly based on living environments, being predominant among children living in an urban area (p=0.001, Fisher’s Exact Test). Results showed that use of fluoride toothpaste was significantly different according to parents’ education, as fathers (p=0.001, Fisher’s Exact Test) or mothers (p<0.001, Fisher’s Exact Test) with academic studies were significantly more likely to provide fluoride toothpaste to their children. Oppositely, children of parents without academic studies were more likely to not use fluoride toothpaste. The presence of fluoridated toothpaste did not show any statistically significant correlations with parents' perception of their children’s dental and gum health status (p=0.062, and p=0.572, respectively, Fisher’s Exact Test).
Children who never brushed their teeth or brushed their teeth just a few times a month or a week were more likely to associate poor ratings of their dental and gum health status, as opposed to children who brushed their teeth daily, who were associated with satisfactory ratings of their dental health status and good ratings of their gum health status. Furthermore, children who brushed their teeth twice or more times a day were more associated with very good or excellent ratings of their dental health status (p<0.001, Fisher’s Exact Test).
3.4. Parents’ Perception of Their Children's Eating and Smoking Habits
Regarding eating habits, parents reported 40.5% of children ate fruits once a day, 36.4% ate sweet bakery once a day, 30.5% ate jam or honey a few times a week, while for milk, 26.7% consumed it a few times a month, and 25.9% consumed it a few times a week. The majority of children never consumed sweet coffee (76.9%) and 34.9% never had sweet milk. Most of the children consumed soft drinks, sweet gum and candy a few times a week (28%, 29%, and 32.1%, respectively). Only 4 parents reported that their children smoked (0.2%), and the absence or presence of smoking did not influence parents’ perception of children’s dental and gum health status (p=0.422, and p=0.532, respectively, Fisher’s Exact Test).
Consumption of soft drinks increased with age in children, as illustrated in Figure 1 (p=0.001, Kruskal-Wallis H Test). Post-hoc Dunn–Bonferroni comparisons showed that children who never consumed soft drinks had a statistically significant lower age (mean=8.06±1.38, median=8, IQR=7–9) compared to children consuming soft drinks once a week (mean=8.57±1.41, median=9, IQR=7–10; p=0.009), a few times a week (mean=8.52 ±1.51, median=9, IQR=7–10; p=0.007), once a day (mean=8.7±1.53, median=9, IQR=7–10; p<0.001), or a few times a day (mean=8.6±1.52, median=9, IQR=7–10; p=0.014).
3.5. Parent’s Perception of Their Children’s Dental Pain
Most of the parents reported that their children had rarely had dental pain in the last 12 months (42.4%) and no significant differences were shown by distribution according to living environment (p=0.06, Fisher’s Exact Test). Parent-reported frequency of dental pain showed a significant relationship to parental ratings of dental and gum health status, (p<0.001, Fisher’s Exact Test). Parents who reported that their children never had dental pain in the last 12 months were more likely to rate their children’s dental health status as very good and excellent; similar results were reported for gum health status. Parents who reported that their children rarely had dental pain were more likely to rate their children’s dental and gum health status as good as opposed to excellent ratings. Parents who reported that their children sometimes had dental pain were more likely to give poor, satisfactory or good ratings of their children’s dental health status as opposed to very good/excellent ratings. Parents who reported that their children sometimes had dental pain were more likely to give poor, satisfactory, and good ratings of their children’s gums health status as opposed to excellent ratings. Parents who reported that their children frequently had dental pain were more likely to rate their dental and gum health status as poor as opposed to other ratings.
The relationship between dietary habits and the frequency of dental pain is presented in Table 2. A statistically significant association was observed between the consumption of sweet bakery or soft drinks and parent-reported dental pain frequency. Children who received sweet bakery a few times a week were more likely to never have had dental pain in the last 12 months, while children who received sweet bakery a few times a day had frequently experienced dental pain in the last 12 months (p<0.001, Fisher’s Exact Test). Similarly, children who never received soft drinks or just received such products a few times a month were more likely to never have had dental pain in the last 12 months, while children who received soft drinks once or more than once a day had frequently experienced dental pain during the last 12 months (p<0.001, Fisher’s Exact Test).
3.6. Parents’ Perception of Their Children's Dental Visits
During the last 12 months, most of the children had only one dental visit (21.4%), either for routine controls (38.5%) or treatment of existing dental pain (37%), while 20% of the children never had a dental visit, mostly because of parent-perceived lack of need for such services (76.3%). Treatment costs were quoted as the reason for not scheduling dental visits by 18.3% of the parents.
Frequency of dental visits during the last 12 months differed significantly between rural and urban areas. Children who never attended the dental office were significantly more likely to be living in a rural environment, while participants who had seen the dentist twice to four times during the last 12 months were significantly more likely to be living in an urban area (p<0.001, Fisher’s Exact Test). The frequency of dental visits did not show any statistically significant differences regarding the children’s gender (p=0.421, Fisher’s Exact Test), mean age (p=0.282, Kruskal-Wallis H Test), dental health status (p=0.086, Fisher’s Exact Test), or gum health status (p=0.062, Fisher’s Exact Test). The frequency of dental visits did not show statistically significant differences between children regarding their satisfaction with their dental appearance (p=0.352, Fisher’s Exact Test), smile avoidance (p=0.636, Fisher’s Exact Test) or existence of social issues (p=0.403, Fisher’s Exact Test).
Parents’ academic background was another factor significantly correlated with the frequency of children’s dental visits. Children whose parents had academic studies were more likely to have had four dental visits during the last year, as opposed to never having a dental visit or having fewer dental visits in the last 12 months (p<0.001, Fisher’s Exact Test). Parents without academic studies were more likely to have never taken their children for a dental visit (p<0.001, Fisher’s Exact Test) or have never or only once taken their children for a dental visit during the last 12 months (p<0.001, Fisher’s Exact Test).
The relationship between the frequency of dental visits and dental pain is presented in Table 2. A statistically significant association was observed between the frequency of dental visits and parent-reported occurrence of dental pain, as parents of children who had never had a dental visit were more likely to report that their children were not experiencing dental pain (p<0.001, Fisher’s Exact Test). Conversely, higher dental visit frequencies were associated with frequent occurrence of dental pain, as children who had more than three dental visits in the last 12 months were more likely to have experienced frequent dental pain episodes (p<0.001, Fisher’s Exact Test). Moreover, the reason for the children’s most recent dental visit was significantly associated with parent-reported frequency of dental pain, as shown in Table 2, while routine dental check-ups were predominantly associated with the absence of dental pain in the last year (p<0.001, Fisher’s Exact Test).
Frequency of dental hygiene influenced the reason for dental visits (p<0.001, Fisher’s Exact Test), while the presence of fluoride toothpaste did not show any statistically significant relationship with the reason for the last dental visit (p=0.750, Fisher’s Exact Test), the result being detailed in Table 3. Children who brushed their teeth a few times per week were more likely to visit the dental office for reasons associated with dental pain. Children who brushed their teeth once a day were more likely to have a dental visit for dental pain rather than routine check. Children who brushed their teeth twice or more times a day were more likely to have dental visits for routine checks or dental treatments, rather than for dental pain.
Dietary habits and smoking habits influenced the frequency of dental visits and the reason for the last dental visit, and the results are presented in
3.7. Parents’ Perception of Their Children’s Oral Health-Related Quality of Life (OHRQoL)
Parents’ perception of their children's OHRQoL showed that 26.1% considered their children were dissatisfied with their current dental appearance. The most invoked aspects related to oral health were the difficulties in chewing hard food (19.7%) and school absenteeism due to dental problems (7.9%). The perceived OHRQoL showed no differences related to children’s gender (p>0.05, Fisher’s Exact Test) or age (p>0.05, Mann-Whitney U Test), except for difficulties in chewing hard food (p=0.011, Mann-Whitney U Test), which was reported for younger children (mean age= 8.29±1.52, median=8, IQR=7-9) and was absent for older children (mean age= 8.5±1.47, median=9, IQR=7-10), as shown in Figure 2.
Parent-reported children’s dissatisfaction with their own dental appearance was strongly associated with parent-perceived children’s dental health. Dissatisfaction was more frequent among children who had poor or satisfactory ratings of their dental and gum health status, while satisfaction was more frequently associated with excellent or very good ratings (p<0.001, Fisher’s Exact Test). Similarly, children who avoided smiling or laughing were more likely to receive lower ratings of their dental health, and were frequently associated with poor or satisfactory ratings of their dental and gum health status, while children who did not avoid smiling or laughing were associated with very good ratings of their dental health and excellent or very good ratings of their gum health status (p<0.001, and p=0.001, respectively, Fisher’s Exact Test). The reported presence or absence of social issues among children showed no significant statistical differences related to ratings of their dental and gum health status (p=0.130, and p=0.290, respectively, Fisher’s Exact Test). Unsurprisingly, children who avoided smiling or laughing and who had social issues related to oral health were significantly more likely to be dissatisfied with their own dental appearance (p<0.001, Fisher’s Exact Test).
Reported issues related to oral health such as school absenteeism, difficulties with chewing food of any consistency or only of hard consistency were not influenced by the use of toothpaste with fluoride content (p=0.614, p=0.130, and p=0.506, respectively, Fisher’s Exact Test). Furthermore, the analysed OHRQoL aspects were associated with the parent's education level. Mothers with academic studies were more likely to perceive their children as being satisfied with their dental appearance, as not avoiding to smile or laugh or as not having social issues (p<0.001, Fisher’s Exact Test). Similarly, fathers with academic studies were more likely to perceive their children as being satisfied with their dental appearance, as not avoiding to smile or laugh or as not having social issues (p<0.001, p=0.007, and p=0.03, respectively, Fisher’s Exact Test).
The frequency of consumption of cariogenic food and beverages significantly influenced the school absenteeism and difficulties in mastication. Differences in the distribution of school absenteeism or difficulties in food chewing across consumption categories were assessed using Z-tests with Bonferroni correction, indicating that these issues significantly depended on food consumption, as detailed in Table 4. Frequency of consumption of fresh fruit showed no influence on school absenteeism or on perceived difficulties in chewing in general (p=0.128, and p=0.192, respectively, Fisher’s Exact Test), but was significantly associated with lesser difficulties in chewing hard foods (p=0.007, Fisher’s Exact Test).
4. Discussion
This cross-sectional study, conducted within a national school-based oral health education program, demonstrates that families in the sample tend to follow two distinct oral care-related pathways. One pathway is predominantly preventive, characterized by a more consistent home-based prevention, including regular toothbrushing, fluoride toothpaste use, less intake of cariogenic foods, associated with a stronger tendency to seek dental care regularly, for routine check-ups. The second pathway is reactive, in which families access dental services mainly in response to symptoms, the individuals being characterized by higher dietary and hygiene-related risk profiles. Social and educational background impacts both pathways. A key finding is that, in the case of the reactive pathway, dental pain functions as a central driver of dental service seeking. This pattern aligns with wider evidence that problem-oriented or delayed care-seeking in children is linked to contextual factors, including social disadvantage and uneven access to preventive services [15,16,17]. The strong association between pain frequency, pain-driven dental visits, and less favourable parent-perceived oral health suggests a clear pattern: for many families, dental care is sought mainly when problems become noticeable and cannot be avoided anymore, which points to unmet needs and delayed care, rather than preventive attendance related to routine check-ups. Confirming and settling an association between dentistry and pain, this pattern risks potential long-term negative consequences upon children’s and future adults’ perceptions and attitudes toward oral care and oral health [18]. Consequently, clinical management must prioritize painless care delivery using non-pharmacological behavioural guidance [19], alongside advanced local anaesthesia methods [20,21], and minimally invasive operative procedures [22], which are in alignment with the objectives of the Erasmus+ PaFein+ project [23]. Integrating these techniques into routine practice is crucial to changing family perceptions of the dental setting, transforming potentially traumatic interventions into stress-free experiences that encourage timely, preventive visits [24].
Concurrently, the results indicate that prevention is more common in the families with higher parental education and living in an urban residence. Higher parental education was consistently associated with preventive-related indicators in parental reports: more frequent dental visits and use of fluoride toothpaste. It was also associated with differences in parents’ perception of the children's dental health and reported psychosocial impact. Importantly, these outcomes reflect parental perceptions and reports, rather than clinically verified oral health status, which would require objective professional dental examination. Our results are consistent with those of Perpelea et al., who administered the same WHO-based questionnaire and reported that the education level of the adults living with the child influences multiple domains, such as parental perceptions of dental and gingival health, oral hygiene practices and their frequency, and the use of fluoride toothpaste and brushing aids [14]. Similar education-linked patterns have been reported in other population-based or school-linked assessments, where parental education, health literacy, and socioeconomic context shape both preventive behaviours and dental service use [16,25]. These clinical and educational priorities mirror the strategic objectives of the WHO Global Strategy and Action Plan on Oral Health for 2023-2030 [26], which emphasizes reorienting oral health services from reactive care toward primary prevention, health promotion and the integration of patient-centred care models.
Dietary patterns also fit into the mentioned two-trajectory framework. The association between frequent intake of cariogenic foods and beverages and dental pain is consistent with the established evidence regarding the link between sugar and dental caries with its subsequent symptoms [27,28,29]. A similar co-occurrence of cariogenic dietary exposure and substantial caries experience has been reported by Jiménez-Núñez et al., who found frequent consumption of sugar-containing beverages and sweets (with urban children reporting higher soft drink intake and rural children more often consuming sugary drinks before bedtime) alongside a high caries burden measured clinically by DMFT index, particularly in rural areas [4]. Importantly, the positive relationship observed in our study between age and consumption of soft drinks is in accordance with findings from other research groups showing that cariogenic beverage choices intensify with age and autonomy, reinforcing the case for early prevention strategies among parents and school staff [30].
The results linking cariogenic intake to school absenteeism are particularly relevant from a public health perspective [31]. Although the etiology of school absenteeism is multifactorial and cannot be solely attributed to consequences of oral conditions in a cross-sectional design, the consistent sugar exposure might be incriminated as a factor able to increase dental caries burden and pain, and therefore affecting daily functioning and school participation [32]. Our findings are compatible with the broader literature suggesting that school absenteeism is more consistently linked to symptoms and unmet needs, than to clinically measured caries alone. In their review, Ruff et al. reported mixed evidence for associations between objectively assessed caries indices (e.g., DMFT/severe caries) and absenteeism, with several adjusted analyses showing no significant links, whereas subjectively reported dental pain and unmet oral health care needs were more consistently associated with missed school days [8]. Additional evidence on the burden of oral conditions supports the interpretation that oral symptoms can translate into meaningful limitations in daily functioning and quality of life. A systematic review concluded that common oral conditions, including dental caries, are generally associated with poorer health-related quality of life, reflecting impacts that extend beyond clinical findings [33].
In our findings, parent-reported chewing difficulties fit more clearly within the reactive pathway, as they cluster with higher cariogenic food intake and symptom-related outcomes. At the same time, the link between more frequent cariogenic intake and chewing difficulties may be bidirectional: a cariogenic diet can increase caries risk and dental pain, subsequently impairing chewing ability, while chewing discomfort may also encourage the preference for softer, easier-to-tolerate meals that may often be cariogenic. Similar bidirectional interpretations have been discussed in studies examining dietary patterns, oral symptoms, and functional limitations, particularly in cross-sectional designs [27,29]. Notably, because our findings rely on parents’ perceptions and the study is cross-sectional, we cannot establish causality. Nonetheless, the results support integrated parent education that links diet, early symptom recognition, routine preventive dental visits, rather than addressing these topics in isolation.
The reason for dental attendance, routine dental check-ups versus pain-driven visits, appears to be the most practical indicator of a family’s preventive orientation. This framing is helpful because it links home-based behaviours, like toothbrushing frequency and use of fluoride toothpaste, with patterns of dental visits frequency and with consequences of dental caries as reported by parents, such as pain, chewing difficulties, and school absenteeism. This interpretation is consistent with studies showing that early routine dental visits are of utmost importance, and that social inequalities influence whether families seek preventive care or delay attendance until symptoms appear [15].
The outcomes analysed in this study are parent-reported perceptions and behaviours, and not the direct result of children-reported data or outcomes of clinical examinations; this might induce reporting bias. Considering the cross-sectional design of the study, the associations between the analysed variables should be interpreted with caution. Confounding by socioeconomic factors, access to care, and health literacy is plausible, particularly in analyses involving environment and parental education. These limitations highlight the need for integrating these results within broader studies with longitudinal designs and should prioritize clinical validation to reduce reliance on perceptions and to clarify directionality. Multivariable analyses should be considered to comprehend the roles of education, environment, hygiene, fluoride use, and diet, and to evaluate whether targeted parent education can shift behaviours and improve child oral-health related quality of life over time.
In this national oral health education program, parents generally perceived their children’s oral and gingival health as favourable, yet they still reported dental pain, functional and psychosocial impact of oral diseases in their children’s lives. Parent-perceived oral health differs by child gender, suggesting that prevention efforts may need to be tailored to potentially different risk profiles and care pathways for boys and girls. Parental education and living environment emerged as key factors: lower education and rural residence were linked to less favourable patterns in parent-perceived outcomes and/or access to care, indicating priority targets for parent-focused education and outreach. Across domains, the data suggest a largely reactive pattern of dental service use, with pain acting as a major trigger for attending dental care and for reporting dental visits as pain-related rather than preventive. Educational efforts should therefore emphasize routine check-ups, early recognition of risk signs, and practical home routines. Consistent oral hygiene and fluoride toothpaste use, both associated with more favourable patterns, should be reinforced with clear, actionable guidance particularly for rural families and for those with lower educational background. Dietary findings also point to a consistent risk gradient: more frequent cariogenic intake was associated with dental pain, chewing difficulties, and school absenteeism, supporting focused messaging on reducing frequent sugary snacks and soft drinks, especially as children get older.
5. Conclusions
Our study highlights that primary schoolchildren’s oral healthcare remains largely reactive, with dental pain serving as the primary trigger for dental service utilization, despite generally favourable parental perceptions. Socioeconomic and environmental factors, namely parental education and rural living, alongside gender-based variations emerge as key determinants shaping these care pathways, the reactive versus the preventive patterns. Establishing effective preventive pathways will require equity-focused oral health education that addresses oral hygiene measures, cariogenic dietary risks and promotes routine dental attendance, specifically targeting rural communities and parents with lower educational backgrounds.
Author Contributions
Conceptualization, L.D, A.V., and R.S.; methodology, A.V., and R.P.V.; validation, L.D, and I.A.C.; formal analysis, I.A.C, and R.P.V.; investigation, L.D., R.P.V., R.S., and A.V.; resources, A.V.; data curation, R.P.V., and I.A.C.; writing—original draft preparation, L.D., and R.P.V.; writing—review and editing, L.D., R.P.V., R.S., I.A.C., and A.V.; visualization, L.D., and I.A.C.; supervision, R.S., and A.V.; project administration, L.D.; funding acquisition, A.V. All authors have read and agreed to the published version of the manuscript.
Funding
This research was partially funded by Erasmus+ 2023-1-TR01-KA220-HED-000155608 PaFein+ Project.
Institutional Review Board Statement
The study was conducted in accordance with the Declaration of Helsinki, and approved by the Research Ethics Committee of the “Carol Davila” University of Medicine and Pharmacy Bucharest (no. 13896/05 June 2025).
Informed Consent Statement
Informed consent was obtained from all subjects involved in the study.
Data Availability Statement
The data presented in this study is available upon request from the corresponding author.
Acknowledgments
The authors are grateful to the parents who participated in this study.
Conflicts of Interest
The authors declare no conflicts of interest. The funders had no role in the design of the study; in the collection, analyses, or interpretation of data; in the writing of the manuscript; or in the decision to publish the results.
Abbreviations
The following abbreviations are used in this manuscript:
| OHRQoL | Oral Health-Related Quality of Life |
References
- B, G.G.; Duijster, D.; J.M.G.v.d.H., G.; J, J.J.M.B.; Jerković-Ćosić, K. Oral health of Dutch primary school children in relation to social and health aspects. Acta Odontol. Scand. 2024, 83, 564–573. [Google Scholar] [CrossRef] [PubMed]
- Lynch, R.J.M. The primary and mixed dentition, post-eruptive enamel maturation and dental caries: a review. Int. Dent. J. 2013, 63, 3–13. [Google Scholar] [CrossRef] [PubMed]
- Vacaru, R.P.; Didilescu, A.C.; Constantinescu, I.; Mărunțelu, I.; Tănase, M.; Stanciu, I.A.; Kaman, W.E.; Brand, H.S. Salivary Enzymatic Activity and Carious Experience in Children: A Cross-Sectional Study. Children 2022, 9. [Google Scholar] [CrossRef] [PubMed]
- Jiménez-Núñez, J.C.; González-Aragón Pineda, Á.E.; Vázquez-Ortíz, M.F.; Flores-Preciado, J.C.; Jiménez-Corona, M.E.; Borges-Yáñez, S.A. Consequences of Untreated Dental Caries on Schoolchildren in Mexico State’s Rural and Urban Areas. Dent. J. 2025, 13, 359. [Google Scholar] [CrossRef] [PubMed]
- Alawady, A.; Alharbi, A.; Alharbi, H.; Almesbah, S.; Alshammari, N.; Alkandari, A.; Alhazmi, H.; Alqaderi, H. Association between sleep duration and dental caries in a nationally representative U.S. population. BMC Oral Health 2023, 23, 497. [Google Scholar] [CrossRef] [PubMed]
- de Lima, L.C.M.; Bernardino, V.M.M.; Leal, T.R.; Granja, G.L.; Paiva, S.M.; Granville-Garcia, A.F. Sleep disorders, anxiety and obesity associated with untreated dental caries in children eight to ten years of age. J. Public Health Dent. 2024, 84, 13–20. [Google Scholar] [CrossRef] [PubMed]
- Moreira-Santos, L.F.; Drumond, C.L.; Bittencourt, J.M.; Ramos-Jorge, M.L.; Serra-Negra, J.M.C.; Pordeus, I.A.; Ramos-Jorge, J. Childhood stress, dental caries and oral health-related quality of life in children with dental caries: A structural equation modeling approach. J. Dent. 2025, 162, 106009. [Google Scholar] [CrossRef] [PubMed]
- Ruff, R.R.; Senthi, S.; Susser, S.R.; Tsutsui, A. Oral health, academic performance, and school absenteeism in children and adolescents: A systematic review and meta-analysis. J. Am. Dent. Assoc. 2019, 150, 111–121.e114. [Google Scholar] [CrossRef] [PubMed]
- Opydo-Szymaczek, J.; Borysewicz-Lewicka, M.; Andrysiak, K.; Witkowska, Z.; Hoffmann-Przybylska, A.; Przybylski, P.; Walicka, E.; Gerreth, K. Clinical Consequences of Dental Caries, Parents' Perception of Child's Oral Health and Attitudes towards Dental Visits in a Population of 7-Year-Old Children. Int. J. Env. Res. Public Health 2021, 18. [Google Scholar] [CrossRef] [PubMed]
- Moya-López, M.; Ruiz-Guillén, A.; Romero-Maroto, M.; Carrillo-Díaz, M. Dental Caries in Children and Its Relationship with Parenting Styles: A Systematic Review. Children 2024, 11. [Google Scholar] [CrossRef] [PubMed]
- Gunasinghe, K.; Wijesinghe, M.S.D.; Ratnayake, N.C. Determinants of Early Childhood Caries and their interactions: A Structural Equation Modelling approach. Community Dent. Health 2023, 40, 227–232. [Google Scholar] [CrossRef] [PubMed]
- Munteanu, A.; Vinereanu, A.; Sfeatcu, R.; Tănase, M.; Condurache, I.A.; Garret-Bernardin, A.; Putrino, A.; Kușçu, Ö.; Peker, S.; Kargul, B.; et al. Incorporating the Psychological Perspective into Traditional Prevention in Pediatric Dentistry with the PaFein+ Project: Trained Parents Can Help. Behav. Sci. 2026, 16. [Google Scholar] [CrossRef] [PubMed]
- Petersen, P.E.; Baez, R.J.; World Health; O. Oral health surveys: basic methods, 5th ed ed.; World Health Organization: Geneva, 2013. [Google Scholar]
- Perpelea, A.-C.; Sfeatcu, R.; Tănase, M.; Meleșcanu Imre, M.; Ripszky Totan, A.; Cernega, A.; Funieru, C.; Pițuru, S.-M. A STEPwise Approach for Oral Hygiene Behavior of Schoolchildren in Romania. Healthcare 2024, 12, 198. [Google Scholar] [CrossRef] [PubMed]
- Qu, X.; Houser, S.H.; Tian, M.; Zhang, Q.; Pan, J.; Zhang, W. Effects of early preventive dental visits and its associations with dental caries experience: a cross-sectional study. BMC Oral Health 2022, 22, 150. [Google Scholar] [CrossRef] [PubMed]
- Dumitrescu, R.; Sava-Rosianu, R.; Jumanca, D.; Balean, O.; Damian, L.R.; Fratila, A.D.; Maricutoiu, L.; Hajdu, A.I.; Focht, R.; Dumitrache, M.A.; et al. The Impact of Parental Education on Schoolchildren's Oral Health-A Multicenter Cross-Sectional Study in Romania. Int. J. Env. Res. Public Health 2022, 19. [Google Scholar] [CrossRef] [PubMed]
- Ly-Mapes, O.; Jang, H.; Al Jallad, N.; Rashwan, N.; Castillo, D.A.; Lu, X.; Fiscella, K.; Xiao, J. Effectiveness of interventions on improving early-life dental care utilization: a systematic review and meta-analysis. Quintessence Int. 2024, 55, 722–732. [Google Scholar] [CrossRef] [PubMed]
- Riley, J.L., 3rd; Gilbert, G.H. Childhood dental history and adult dental attitudes and beliefs. Int. Dent. J. 2005, 55, 142–150. [Google Scholar] [CrossRef] [PubMed]
- Dhar, V.; Gosnell, E.; Jayaraman, J.; Law, C.; Majstorović, M.; Marghalani, A.A.; Randall, C.L.; Townsend, J.; Wells, M.; Chen, C.Y.; et al. Nonpharmacological Behavior Guidance for the Pediatric Dental Patient. Pediatr. Dent. 2023, 45, 385–410. [Google Scholar] [PubMed]
- Kuscu, O.O.; Akyuz, S. Is it the injection device or the anxiety experienced that causes pain during dental local anaesthesia? Int. J. Paediatr. Dent. 2008, 18, 139–145. [Google Scholar] [CrossRef] [PubMed]
- Kuşcu, O.O.; Akyuz, S. Children's preferences concerning the physical appearance of dental injectors. J. Dent. Child (Chic) 2006, 73, 116–121. [Google Scholar] [PubMed]
- Al-Kaff, A.A.; Alshehri, A.Z.; Alasmari, R.A.; Alsubaie, N.; Aldaws, A.; Althaqeel, A.; Alshehri, R.S.; Alawaji, Y.M. Minimally Invasive Techniques for Managing Dental Caries in Children: Efficacy, Applications, and Future Directions. Cureus 2025, 17, e87450. [Google Scholar] [CrossRef] [PubMed]
- Kuscu, O.O.; Ozcelik, S.M.; Kucuktepe, C.; Bekiroglu, N.; Akyuz, S. Effectiveness of the "pain-free dental injection" (PaFein) teaching model in reducing children's pain: A randomized, controlled study. J. Dent. Educ. 2023, 87, 303–312. [Google Scholar] [CrossRef] [PubMed]
- Carrillo-Díaz, M.; Migueláñez-Medrán, B.C.; Nieto-Moraleda, C.; Romero-Maroto, M.; González-Olmo, M.J. How Can We Reduce Dental Fear in Children? The Importance of the First Dental Visit. Children 2021, 8. [Google Scholar] [CrossRef] [PubMed]
- Firmino, R.T.; Ferreira, F.M.; Martins, C.C.; Granville-Garcia, A.F.; Fraiz, F.C.; Paiva, S.M. Is parental oral health literacy a predictor of children's oral health outcomes? Systematic review of the literature. Int. J. Paediatr. Dent. 2018. [Google Scholar] [CrossRef] [PubMed]
- Organization, W.H. Global strategy and action plan on oral health 2023–2030. 2024. [Google Scholar] [CrossRef] [PubMed]
- Palacios, C.; Rivas-Tumanyan, S.; Morou-Bermúdez, E.; Colon, A.M.; Torres, R.Y.; Elías-Boneta, A.R. Association between Type, Amount, and Pattern of Carbohydrate Consumption with Dental Caries in 12-Year-Olds in Puerto Rico. Caries Res. 2016, 50, 560–570. [Google Scholar] [CrossRef] [PubMed]
- Pitchika, V.; Standl, M.; Harris, C.; Thiering, E.; Hickel, R.; Heinrich, J.; Kühnisch, J. Association of sugar-sweetened drinks with caries in 10- and 15-year-olds. BMC Oral Health 2020, 20, 81. [Google Scholar] [CrossRef] [PubMed]
- Hasheminejad, N.; Malek Mohammadi, T.; Mahmoodi, M.R.; Barkam, M.; Shahravan, A. The association between beverage consumption pattern and dental problems in Iranian adolescents: a cross sectional study. BMC Oral Health 2020, 20, 74. [Google Scholar] [CrossRef] [PubMed]
- Ooi, J.Y.; Wolfenden, L.; Sutherland, R.; Nathan, N.; Oldmeadow, C.; McLaughlin, M.; Barnes, C.; Hall, A.; Vanderlee, L.; Yoong, S.L. A Systematic Review of the Recent Consumption Levels of Sugar-Sweetened Beverages in Children and Adolescents From the World Health Organization Regions With High Dietary-Related Burden of Disease. Asia Pac. J. Public Health 2022, 34, 11–24. [Google Scholar] [CrossRef] [PubMed]
- Goulart, M.A.; Sherriff, A.; Conway, D.I.; McMahon, A.D. Poor child oral health and school absences: a population-wide data linkage study. J. Epidemiol. Community Health 2025, 79, 882–888. [Google Scholar] [CrossRef] [PubMed]
- Dipalma, G.; Inchingolo, A.M.; Fiore, A.; Chieppa, S.; Carone, C.; Tartaglia, F.C.; Palermo, A.; Inchingolo, A.D.; Inchingolo, F. Role of nutrition in prevention of dental caries in children and adolescents: a systematic review. BMC Oral Health 2026, 26. [Google Scholar] [CrossRef] [PubMed]
- Haag, D.G.; Peres, K.G.; Balasubramanian, M.; Brennan, D.S. Oral Conditions and Health-Related Quality of Life: A Systematic Review. J. Dent. Res. 2017, 96, 864–874. [Google Scholar] [CrossRef] [PubMed]
Figure 1.
Comparison of participants age according to the frequency of soft drinks consumption. *Statistical significance p=0.001, Kruskal-Wallis H Test.
Figure 1.
Comparison of participants age according to the frequency of soft drinks consumption. *Statistical significance p=0.001, Kruskal-Wallis H Test.
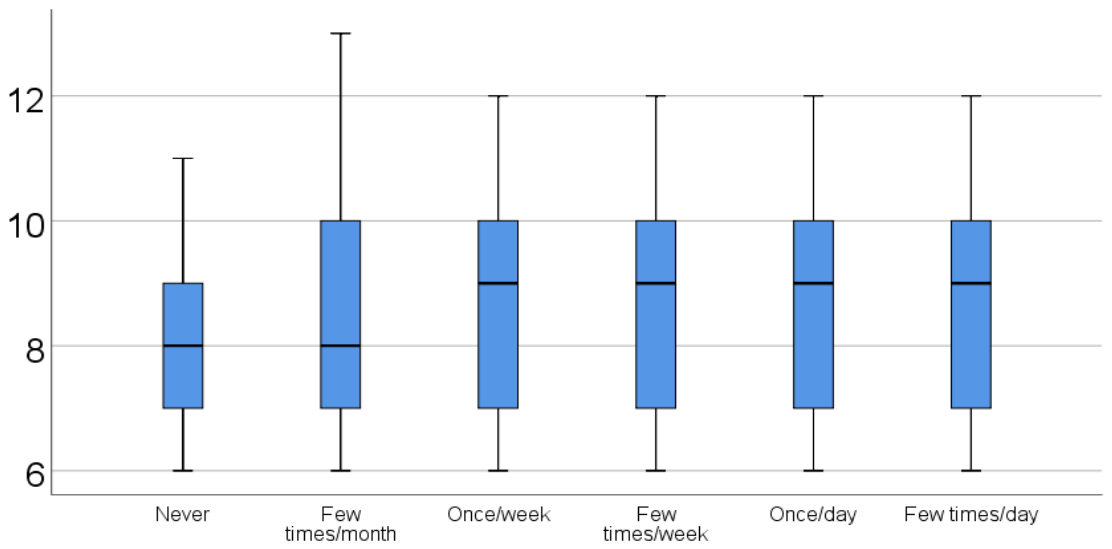
Figure 2.
Comparison of participants age according to the existence of difficulties while chewing food with hard consistency. *Statistical significance p=0.011, Mann-Whitney U Test.
Figure 2.
Comparison of participants age according to the existence of difficulties while chewing food with hard consistency. *Statistical significance p=0.011, Mann-Whitney U Test.
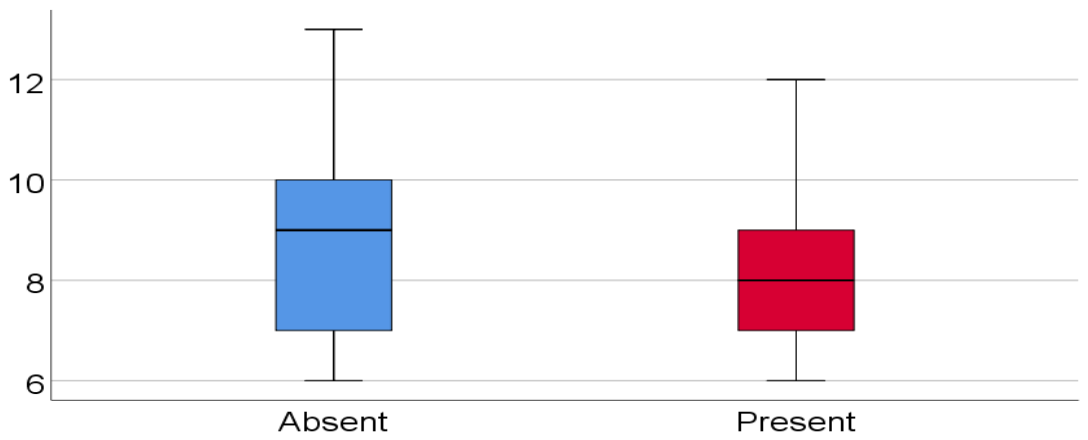

Table 1.
Distribution of oral health-related parameters according to gender and living environment (responses to questions Q5-Q15).
Table 1.
Distribution of oral health-related parameters according to gender and living environment (responses to questions Q5-Q15).
| Q5. Current dental health (Nr., %) (N=1792) | Poor | Satisfactory | Good | Very Good | Excellent | p-value | ||||||||||||||
| 106 (5.9%) | 217 (12.1%) | 908 (50.7%) | 429 (23.9%) | 132 (7.4%) | ||||||||||||||||
| Female | Nr. | 46 | 87 * | 439 | 222 | 77 * | p<0.01 | |||||||||||||
| % | 5.3% | 10% * | 50.4% | 25.5% | 8.8% * | |||||||||||||||
| Male | Nr. | 60 | 130 * | 469 | 207 | 55 * | ||||||||||||||
| % | 6.5% | 14.1% * | 50.9% | 22.5% | 6% * | |||||||||||||||
| Q5. Current gums health (Nr., %) (N=1803) | Poor | Satisfactory | Good | Very Good | Excellent | |||||||||||||||
| 29 (1.6%) | 114 (6.3%) | 749 (41.5%) | 627 (34.8%) | 284 (15.8%) | ||||||||||||||||
| Female | Nr. | 11 | 46 | 339 * | 313 | 165 * | p<0.01 | |||||||||||||
| % | 1.3% | 5.3% | 38.8% * | 35.8% | 18.9% * | |||||||||||||||
| Male | Nr. | 18 | 68 | 410 * | 314 | 119 * | ||||||||||||||
| % | 1.9% | 7.3% | 44.1% * | 33.8% | 12.8% * | |||||||||||||||
| Q6. Dental pain in the last 12 months (Nr., %) (N=1830) | Never | Rarely | Sometimes | Frequently | ||||||||||||||||
| 541 (29.6%) | 776 (42.4%) | 413 (22.6%) | 100 (5.5%) | |||||||||||||||||
| Rural | Nr. | 241 | 275 | 193 | 59 | p=0.06 | ||||||||||||||
| % | 27.8% | 43.2% | 22.2% | 6.8% | ||||||||||||||||
| Urban | Nr. | 300 | 401 | 220 | 41 | |||||||||||||||
| % | 31.2% | 41.7% | 22.9% | 4.3% | ||||||||||||||||
| Q7. Dental visit in the last 12 months (Nr., %) (N=1849) | Never | Never in the last 12 months | Once | Twice | Three times | Four times | Five times or more | |||||||||||||
| 369 (20%) | 216 (11.7%) | 395 (21.4%) | 323 (17.5%) | 202 (10.9%) | 135 (7.3%) | 209 (11.3%) | ||||||||||||||
| Female | Nr. | 178 | 99 | 183 | 166 | 110 | 68 | 96 | p>0.05 | |||||||||||
| % | 19.8% | 11% | 20.3% | 18.4% | 12.2% | 7.6% | 10.7% | |||||||||||||
| Male | Nr. | 191 | 117 | 212 | 157 | 92 | 67 | 113 | ||||||||||||
| % | 20.1% | 12.3% | 22.3% | 16.5% | 9.7% | 7.1% | 11.9% | |||||||||||||
| Rural | Nr. | 223 * | 114 | 176 | 134 * | 87 | 50 * | 97 | p<0.01 | |||||||||||
| % | 25.3% * | 12.9% | 20% | 15.2% * | 9.9% | 5.7% * | 11% | |||||||||||||
| Urban | Nr. | 146 * | 102 | 219 | 189 * | 115 | 85 * | 112 | ||||||||||||
| % | 15.1% * | 10.5% | 22.6% | 19.5% * | 11.9% | 8.8% * | 11.6% | |||||||||||||
| Q8. Last dental visit - Reason (Nr., %) (N=1250) |
Routine check | Treatment | Dental pain | |||||||||||||||||
| 481 (38.5%) | 306 (24.5%) | 463 (37%) | ||||||||||||||||||
| Q8. Reason for absence of dental visit (Nr., %) (N=93) | No need of medical services | Low financial possibilities | Transportation issues | Long waiting lists | ||||||||||||||||
| 71 (76.3%) | 17 (18.3%) | 3 (3.2%) | 2 (2.2%) | |||||||||||||||||
| Q9. Frequency – Dental hygiene (Nr., %) | Never | Few times/month | Once/week | Few times/week | Once/day | Twice or more/day | ||||||||||||||
| 6 (0.3%) | 30 (1.6%) | 33 (1.8%) | 157 (8.4%) | 883 (47.2%) | 761 (40.7%) | |||||||||||||||
| Q10-Q12. Use of dental products (Nr., %) |
Toothbrush | Wooden toothpicks | Plastic toothpicks | Dental floss | Other | Toothpaste | Fluoride toothpaste (N=1549) | |||||||||||||
| 1850 (98.9%) | 335 (17.9%) | 125 (6.7%) | 418 (22.4%) | 227 (12.1%) | 1852 (99%) | 996 (64.3%) | ||||||||||||||
| Q13. Analysed OHRQoL aspects (Nr., %) | Unsatisfying dental aspect (N=1622) | Smile/laugh avoidance (N=1733) | Social issues (N=1664) | School class avoidance (N=1776) | Difficult consumption of food with hard consistency (N=1773) | Difficulties while chewing food (N=1754) | ||||||||||||||
| 424 (26.1%) | 98 (5.7%) | 37 (2.2%) | 141 (7.9%) | 349 (19.7%) | 222 (12.7%) | |||||||||||||||
| Female | Nr. | 221 | 46 | 19 | 59 | p>0.05 | ||||||||||||||
| % | 27.4% | 5.5% | 2.3% | 6.9% | ||||||||||||||||
| Male | Nr. | 203 | 52 | 18 | 82 | |||||||||||||||
| % | 24.9% | 5.8% | 2.1% | 9% | ||||||||||||||||
| Q14. Food consumption (Nr., %) |
Never | Few times/month | Once/week | Few times/week | Once/day | Few times/day | ||||||||||||||
| Fresh fruit | 22 (1.2%) | 38 (2%) | 57 (3%) | 488 (26.1%) | 758 (40.5%) | 507 (27.1%) | ||||||||||||||
| Sweet bakery | 6 (0.3%) | 130 (7%) | 159 (8.5%) | 614 (32.8%) | 680 (36.4%) | 281 (15%) | ||||||||||||||
| Jam/Honey | 332 (17.8%) | 450 (24.1%) | 225 (12%) | 570 (30.5%) | 256 (13.7%) | 37 (2%) | ||||||||||||||
| Soft drinks | 169 (9%) | 529 (28.3%) | 239 (12.8%) | 523 (28%) | 224 (12%) | 186 (9.9%) | ||||||||||||||
| Sweet gum | 375 (20.1%) | 529 (28.3%) | 194 (10.4%) | 542 (29%) | 163 (8.7%) | 67 (3.6%) | ||||||||||||||
| Candy | 109 (5.8%) | 507 (27.1%) | 260 (13.9%) | 600 (32.1%) | 262 (14%) | 132 (7.1%) | ||||||||||||||
| Sweet milk | 652 (34.9%) | 302 (16.1%) | 169 (9%) | 434 (23.2%) | 231 (12.4%) | 82 (4.4%) | ||||||||||||||
| Milk | 456 (24.4%) | 500 (26.7%) | 181 (9.7%) | 485 (25.9%) | 189 (10.1%) | 59 (3.2%) | ||||||||||||||
| Sweet coffee | 1438 (76.9%) | 28 (1.5%) | 31 (1.7%) | 311 (16.6%) | 53 (2.8%) | 9 (0.5%) | ||||||||||||||
| Q15. Smoking (Nr., %) | 4 (0.2%) | |||||||||||||||||||
*Fisher’s Exact Test, statistical significance (p<0.05).
Table 2.
Distribution of the participants according to dental pain frequency and frequency of dental visits, reason for dental visit, and dietary habits.
Table 2.
Distribution of the participants according to dental pain frequency and frequency of dental visits, reason for dental visit, and dietary habits.
| Dental pain frequency | |||||
| Dental visit (Nr., %) | Never | Rarely | Sometimes | Frequently | p* |
| Never | 159 (29.7%) | 120 (15.6%) | 63 (15.4%) | 16 (16.2%) | <0.001 |
| Never in the last 12 months | 84 (15.7%) | 93 (12.1%) | 32 (7.8%) | 4 (4%) | |
| Once | 126 (23.6%) | 162 (21%) | 82 (20%) | 11 (11.1%) | |
| Twice | 77 (14.4%) | 166 (21.6%) | 65 (15.9%) | 12 (12.1%) | |
| Three times | 35 (6.5%) | 95 (12.3%) | 53 (13%) | 17 (17.2%) | |
| Four times | 18 (3.4%) | 53 (6.9%) | 51 (12.5%) | 11 (11.1%) | |
| Five times or more | 36 (6.7%) | 81 (10.5%) | 63 (15.4%) | 28 (28.3%) | |
| Reason for last dental visit (Nr., %) | |||||
| Routine check | 215 (74.1%) | 187 (34.1%) | 62 (19.8%) | 7 (9.1%) | <0.001 |
| Treatment | 52 (17.9%) | 153 (27.9%) | 79 (25.2%) | 18 (23.4%) | |
| Dental pain | 23 (7.9%) | 209 (38.1%) | 172 (55%) | 52 (67.5%) | |
| Sweet bakery consumption (Nr., %) | |||||
| Never | 2 (0.4%) | 2 (0.3%) | 1 (0.2%) | 1 (1%) | <0.001 |
| Few times/month | 43 (7.9%) | 45 (5.8%) | 30 (7.3%) | 8 (8%) | |
| Once/week | 59 (10.9%) | 63 (8.1%) | 29 (7%) | 5 (5%) | |
| Few times/week | 204 (37.7%) | 256 (33%) | 121 (29.3%) | 23 (23%) | |
| Once/day | 182 (33.6%) | 293 (37.8%) | 154 (37.3%) | 35 (35%) | |
| Few times/day | 51 (9.4%) | 117 (15.1%) | 78 (18.9%) | 28 (28%) | |
| Soft drinks consumption (Nr., %) | |||||
| Never | 71 (13.1%) | 56 (7.2%) | 28 (6.8%) | 9 (9%) | <0.001 |
| Few times/month | 180 (33.3%) | 223 (28.7%) | 102 (24.7%) | 13 (13%) | |
| Once/week | 62 (11.5%) | 108 (13.9%) | 55 (13.3%) | 10 (10%) | |
| Few times/week | 137 (25.3%) | 222 (28.6%) | 133 (32.2%) | 23 (23%) | |
| Once/day | 56 (10.4%) | 91 (11.7%) | 50 (12.1%) | 20 (20%) | |
| Few times/day | 35 (6.5%) | 76 (9.8%) | 45 (10.9%) | 25 (25%) | |
*Fisher’s Exact Test, statistical significance (p<0.05).
Table 3.
Children who seldom consumed soft drinks (a few times a month) were more likely to have had four dental visits in the last 12 months, while children who consumed soft drinks daily were more likely to never have had a dental visit (p<0.001, Fisher’s Exact Test). Frequency of soft drinks consumption also significantly influenced the reason for the last dental visit, as children who never consumed soft drinks were more associated with routine checks, while children who consumed soft drinks once or a few times a day were more associated with dental visits due to dental pain (p<0.001, Fisher’s Exact Test). Consumption of sweet bakery did not significantly influence the reason for dental visits (p=0.076, Fisher’s Exact Test).
Table 3.
Children who seldom consumed soft drinks (a few times a month) were more likely to have had four dental visits in the last 12 months, while children who consumed soft drinks daily were more likely to never have had a dental visit (p<0.001, Fisher’s Exact Test). Frequency of soft drinks consumption also significantly influenced the reason for the last dental visit, as children who never consumed soft drinks were more associated with routine checks, while children who consumed soft drinks once or a few times a day were more associated with dental visits due to dental pain (p<0.001, Fisher’s Exact Test). Consumption of sweet bakery did not significantly influence the reason for dental visits (p=0.076, Fisher’s Exact Test).
| Reason for last dental visit | |||||||
| Dental hygiene | Check | Treatment | Dental pain | p* | |||
| Nr. | % | Nr. | % | Nr. | % | ||
| Few times/month | 3 | 0.6% | 2 | 0.7% | 10 | 2.2% | <0.001 |
| Once/week | 4 | 0.8% | 4 | 1.3% | 11 | 2.4% | |
| Few times/week | 20 | 4.2% | 13 | 4.2% | 54 | 11.7% | |
| Once/day | 188 | 39.1% | 131 | 42.8% | 239 | 51.6% | |
| Twice or more/day | 266 | 55.3% | 156 | 51% | 149 | 32.2% | |
| Fluoride toothpaste usage | |||||||
| Absent | 129 | 31.7% | 80 | 30.7% | 130 | 33.3% | 0.750 |
| Present | 278 | 68.3% | 181 | 69.3% | 259 | 66.7% | |
| Sweet bakery consumption | |||||||
| Never | 1 | 0.2% | 3 | 1% | 2 | 0.4% | 0.076 |
| Few times/month | 30 | 6.2% | 23 | 7.5% | 36 | 7.8% | |
| Once/week | 51 | 10.6% | 26 | 8.5% | 31 | 6.7% | |
| Few times/week | 179 | 37.2% | 95 | 31% | 138 | 29.8% | |
| Once/day | 18 | 32.8% | 119 | 38.9% | 184 | 39.7% | |
| Few times/day | 62 | 12.9% | 40 | 13.1% | 72 | 15.6% | |
| Soft drinks consumption | |||||||
| Never | 73 | 15.2% | 29 | 9.5% | 22 | 4.8% | <0.001 |
| Few times/month | 142 | 29.5% | 115 | 37.6% | 136 | 29.4% | |
| Once/week | 61 | 12.7% | 46 | 15% | 68 | 14.7% | |
| Few times/week | 128 | 26.6% | 88 | 28.8% | 127 | 27.4% | |
| Once/day | 49 | 10.2% | 15 | 4.9% | 59 | 12.7% | |
| Few times/day | 28 | 5.8% | 13 | 4.2% | 51 | 11% | |
*Fisher’s Exact Test, statistical significance (p<0.05).
Table 4.
Distribution of the children according to the existence of school absenteeism and difficulties while chewing food in relationship to dietary habits.
Table 4.
Distribution of the children according to the existence of school absenteeism and difficulties while chewing food in relationship to dietary habits.
| Frequency of consumption | School absenteeism | Difficulties while chewing food with hard consistency | Difficulties while chewing food | |||||||||||||
| NO | YES | p* | NO | YES | p* | NO | YES | p* | ||||||||
| Nr. | % | Nr. | % | Nr. | % | Nr. | % | Nr. | % | Nr. | % | |||||
| Fresh fruit | Never | 20 | 1.2% | 1 | 0.7% | 0.128 | 13 | 0.9% | 7 | 2% | 0.007* | 14 | 0.9% | 6 | 2.7% | 0.192 |
| Few times/month | 35 | 2.1% | 3 | 2.1% | 36 | 2.5% | 1 | 0.3% | 35 | 2.3% | 2 | 0.9% | ||||
| Once/week | 47 | 2.9% | 8 | 5.7% | 39 | 2.7% | 17 | 4.9% | 47 | 3.1% | 6 | 2.7% | ||||
| Few times/week | 420 | 25.7% | 34 | 24.1% | 355 | 24.9% | 94 | 26.9% | 387 | 25.3% | 62 | 27.9% | ||||
| Once/day | 679 | 41.5% | 47 | 33.3% | 593 | 41.6% | 138 | 39.5% | 636 | 41.5% | 86 | 38.7% | ||||
| Few times/day | 434 | 26.5% | 48 | 34% | 388 | 27.2% | 92 | 26.4% | 413 | 27% | 60 | 27% | ||||
| Sweet bakery | Never | 6 | 0.4% | 0 | 0% | 0.006* | 5 | 0.4% | 1 | 0.3% | 0.007* | 5 | 0.3% | 1 | 0.5% | 0.009* |
| Few times/month | 118 | 7.2% | 6 | 4.3% | 99 | 7% | 28 | 8% | 108 | 7% | 18 | 8.1% | ||||
| Once/week | 143 | 8.7% | 10 | 7.1% | 133 | 9.3% | 22 | 6.3% | 143 | 9.3% | 10 | 4.5% | ||||
| Few times/week | 551 | 33.7% | 35 | 24.8% | 486 | 34.1% | 97 | 27.8% | 508 | 33.2% | 68 | 30.6% | ||||
| Once/day | 586 | 35.8% | 53 | 37.6% | 509 | 35.7% | 130 | 37.2% | 561 | 36.6% | 77 | 34.7% | ||||
| Few times/day | 231 | 14.1% | 37 | 26.2% | 192 | 13.5% | 71 | 20.3% | 207 | 13.5% | 48 | 21.6% | ||||
| Jam or honey | Never | 289 | 17.7% | 30 | 21.3% | <0.001* | 240 | 16.9% | 73 | 20.9% | 0.005* | 271 | 17.7% | 36 | 16.2% | <0.001* |
| Few times/month | 403 | 24.6% | 35 | 24.8% | 359 | 25.2% | 77 | 22.1% | 391 | 25.5% | 47 | 21.2% | ||||
| Once/week | 199 | 12.2% | 17 | 12.1% | 178 | 12.5% | 39 | 11.2% | 193 | 12.6% | 25 | 11.3% | ||||
| Few times/week | 507 | 31% | 23 | 16.3% | 445 | 31.3% | 93 | 26.6% | 463 | 30.2% | 61 | 27.5% | ||||
| Once/day | 217 | 13.3% | 25 | 17.7% | 184 | 12.9% | 53 | 15.2% | 195 | 12.7% | 40 | 18% | ||||
| Few times/day | 20 | 1.2% | 11 | 7.8% | 18 | 1.3% | 14 | 4% | 19 | 1.2% | 13 | 5.9% | ||||
| Soft drinks | Never | 157 | 9.6% | 4 | 2.8% | <0.001* | 139 | 9.8% | 23 | 6.6% | <0.001* | 140 | 9.1% | 21 | 9.5% | <0.001* |
| Few times/month | 499 | 30.5% | 18 | 12.8% | 432 | 30.3% | 84 | 24.1% | 472 | 30.8% | 42 | 18.9% | ||||
| Once/week | 212 | 13% | 22 | 15.6% | 190 | 13.3% | 39 | 11.2% | 204 | 13.3% | 24 | 10.8% | ||||
| Few times/week | 453 | 27.7% | 34 | 24.1% | 406 | 28.5% | 85 | 24.4% | 426 | 27.8% | 60 | 27% | ||||
| Once/day | 179 | 10.9% | 30 | 21.3% | 156 | 11% | 49 | 14% | 174 | 11.4% | 34 | 15.3% | ||||
| Few times/day | 136 | 8.3% | 33 | 23.4% | 101 | 7.1% | 69 | 19.8% | 116 | 7.6% | 41 | 18.5% | ||||
| Chewing gum with sugar | Never | 347 | 21.2% | 13 | 9.2% | <0.001* | 300 | 21.1% | 63 | 18.1% | 0.001* | 324 | 21.1% | 37 | 16.7% | <0.001* |
| Few times/month | 486 | 29.7% | 32 | 22.7% | 422 | 29.6% | 87 | 24.9% | 458 | 29.9% | 48 | 21.6% | ||||
| Once/week | 166 | 10.2% | 22 | 15.6% | 150 | 10.5% | 37 | 10.6% | 158 | 10.3% | 28 | 12.6% | ||||
| Few times/week | 463 | 28.3% | 43 | 30.5% | 405 | 28.4% | 101 | 28.9% | 441 | 28.8% | 62 | 27.9% | ||||
| Once/day | 131 | 8% | 17 | 12.1% | 112 | 7.9% | 36 | 10.3% | 115 | 7.5% | 31 | 14% | ||||
| Few times/day | 42 | 2.6% | 14 | 9.9% | 35 | 2.5% | 25 | 7.2% | 36 | 2.3% | 16 | 7.2% | ||||
| Candy | Never | 99 | 6.1% | 5 | 3.5% | <0.001* | 87 | 6.1% | 19 | 5.4% | <0.001* | 91 | 5.9% | 14 | 6.3% | 0.025* |
| Few times/month | 466 | 28.5% | 24 | 17% | 408 | 28.7% | 85 | 24.4% | 442 | 28.9% | 50 | 22.5% | ||||
| Once/week | 238 | 14.6% | 19 | 13.5% | 207 | 14.5% | 44 | 12.6% | 218 | 14.2% | 32 | 14.4% | ||||
| Few times/week | 522 | 31.9% | 42 | 29.8% | 465 | 32.7% | 97 | 27.8% | 487 | 31.8% | 68 | 30.6% | ||||
| Once/day | 215 | 13.1% | 26 | 18.4% | 181 | 12.7% | 57 | 16.3% | 207 | 13.5% | 32 | 14.4% | ||||
| Few times/day | 95 | 5.8% | 25 | 17.7% | 76 | 5.3% | 47 | 13.5% | 87 | 5.7% | 26 | 11.7% | ||||
| Sweet milk | Never | 601 | 36.8% | 31 | 22% | <0.001* | 512 | 36% | 114 | 32.7% | <0.001* | 561 | 36.6% | 63 | 28.4% | <0.001* |
| Few times/month | 277 | 16.9% | 20 | 14.2% | 249 | 17.5% | 48 | 13.8% | 264 | 17.2% | 34 | 15.3% | ||||
| Once/week | 139 | 8.5% | 18 | 12.8% | 133 | 9.3% | 23 | 6.6% | 141 | 9.2% | 12 | 5.4% | ||||
| Few times/week | 378 | 23.1% | 30 | 21.3% | 335 | 23.5% | 76 | 21.8% | 353 | 23% | 49 | 22.1% | ||||
| Once/day | 185 | 11.3% | 27 | 19.1% | 153 | 10.7% | 57 | 16.3% | 166 | 10.8% | 40 | 18% | ||||
| Few times/day | 55 | 3.4% | 15 | 10.6% | 42 | 2.9% | 31 | 8.9% | 47 | 3.1% | 24 | 10.8% | ||||
| Milk | Never | 411 | 25.1% | 26 | 18.4% | <0.001* | 362 | 25.4% | 73 | 20.9% | <0.001* | 389 | 25.4% | 45 | 20.3% | <0.001* |
| Few times/month | 461 | 28.2% | 28 | 19.9% | 394 | 27.7% | 89 | 25.5% | 435 | 28.4% | 47 | 21.2% | ||||
| Once/week | 160 | 9.8% | 14 | 9.9% | 139 | 9.8% | 32 | 9.2% | 146 | 9.5% | 23 | 10.4% | ||||
| Few times/week | 420 | 25.7% | 27 | 19.1% | 282 | 26.8% | 76 | 21.8% | 391 | 25.5% | 51 | 23% | ||||
| Once/day | 147 | 9% | 28 | 19.9% | 115 | 8.1% | 55 | 15.8% | 136 | 8.9% | 36 | 16.2% | ||||
| Few times/day | 36 | 2.2% | 18 | 12.8% | 32 | 2.2% | 24 | 6.9% | 35 | 2.3% | 20 | 9% | ||||
| Sweet coffee | Never | 1284 | 78.5% | 101 | 71.6% | <0.001* | 1121 | 78.7% | 258 | 73.9% | 0.036* | 1209 | 78.9% | 162 | 73% | 0.001* |
| Few times/month | 25 | 1.5% | 3 | 2.1% | 23 | 1.6% | 4 | 1.1% | 23 | 1.5% | 3 | 1.4% | ||||
| Once/week | 22 | 1.3% | 7 | 5% | 23 | 1.6% | 6 | 1.7% | 26 | 1.7% | 3 | 1.4% | ||||
| Few times/week | 263 | 16.1% | 18 | 12.8% | 224 | 15.7% | 63 | 18.1% | 239 | 15.6% | 38 | 17.1% | ||||
| Once/day | 37 | 2.3% | 7 | 5% | 29 | 2% | 13 | 3.7% | 32 | 2.1% | 11 | 5% | ||||
| Few times/day | 4 | 0.2% | 5 | 3.5% | 4 | 0.3% | 5 | 1.4% | 3 | 0.2% | 5 | 2.3% | ||||
*Fisher’s Exact Test, statistical significance (p<0.05).
Disclaimer/Publisher’s Note: The statements, opinions and data contained in all publications are solely those of the individual author(s) and contributor(s) and not of MDPI and/or the editor(s). MDPI and/or the editor(s) disclaim responsibility for any injury to people or property resulting from any ideas, methods, instructions or products referred to in the content. |
© 2026 by the authors. Licensee MDPI, Basel, Switzerland. This article is an open access article distributed under the terms and conditions of the Creative Commons Attribution (CC BY) license (http://creativecommons.org/licenses/by/4.0/).
Copyright: This open access article is published under a Creative Commons CC BY 4.0 license, which permit the free download, distribution, and reuse, provided that the author and preprint are cited in any reuse.