

Submitted:
13 August 2026
Posted:
17 August 2026
You are already at the latest version
Abstract
Objective: Vestibular disorders are rarely diagnosed through imaging examinations intuitively. We try to explore a new approach to visualize peripheral vestibular disorders using pseudo-color perceptual enhancement. Methods : A total of 53 patients with unilateral abnormal caloric test results and 23 patients with normal results, treated at outpatient clinics between March 2025 and March 2026, were selected for analysis. All patients underwent magnetic resonance imaging examinations. We used the software to process T2 sequences from magnetic resonance images of patients and calculated the values of peripheral vestibular organs. Results : Eighteen patients had an abnormal caloric test result on one side but had pseudo-color perceptual enhancement on the other side, thirty five patients had the abnormal caloric test result and pseudo-color perceptual enhancement on the same side, it was statistically different. However, the comparison of differences between both sides in these two groups and the normal group showed no statistically significant difference. Conclusion : The pseudo-color perceptual enhancement on the peripheral vestibular organ may indicate the vestibular disorders. However further research is still needed for the results through more precise differentiation of vestibular disorders.
Keywords:
vestibular disorders
; pseudo-color perceptual enhancement
; caloric test
1. Introduction
The vestibular disorders include peripheral and central, functional dizziness, and other causes like orthostatic dizziness, adverse drug effects and blood pressure regulation disorders [1]. Approximately 11% of adult Americans reported experiencing dizziness symptoms within a year [2], excluding those with vestibular dysfunction who did not exhibit dizziness symptoms. The peripheral vestibular disorders occur in the inner ear. The diagnosis for the most peripheral vestibular disorders relies upon history and physical examination. Imaging examination plays a minor role in diagnosing peripheral vestibular disorders. Magnetic resonance (MR) imaging is mostly used for the diagnosis of Menière’s disease (MD) and the Gadolinium-diethylenetriaminepentaacetic acid (Gd-DTPA) dimer injection as contrast agent is needed. Some patients feel apprehensive about receiving contrast agents. And many other peripheral vestibular disorders lack of imaging examinations may be limited by the small size of inner ear [3]. We attempt to explore an approach that can visually reveal the peripheral disorders without using contrast agent.
The pathological causes of peripheral vestibular disorders may be endolymphatic hydrops [4], inflammation of the peripheral labyrinth caused by ischemia of of the posterior cerebral circulation [5], autoimmune disease, toxic and metabolic abnormalities [6]. Some of these pathological changes were detected by magnetic resonance imaging using contrast agent, but many other changes haven’t been visualized by imaging examination. Based on the potential alterations in the lymphatic fluid of peripheral vestibular organs caused by these pathological causes, we speculate that these changes may be reflected in imaging examinations. Because the human eye’s ability to distinguish colors far exceeds its ability to distinguish gray levels, therefore, by mapping the originally single-dimensional grayscale information to a multi-dimensional color space, known as “pseudo-color” technology, invisible subtle density differences can be transformed into visible color differences, thereby significantly enhancing the visual effect and diagnostic value of the image [7]. This study investigates the manifestation of pseudo-color perceptual enhancement technology in peripheral vestibular organs, exploring whether it can provide a more intuitive examination method for clinical practice.
2. Materials and Methods
We selected 53 patients with unilateral abnormal caloric test results and 23 patients with normal results from outpatient clinics from March 2025 to March 2026. All the patients presented with dizziness as their chief complaint to the department of otolaryngology of our hospital. The duration of the disease ranged from 1 day to 15 years. In this study, only patients who met either of the following conditions were classified as abnormal: having an abnormal caloric test result during a videonystagmography (VNG) examination on one side but normal head impulse test, or having both the caloric test and head impulse test of the ipsilateral side showing abnormal results, while the results of other VNG sub-tests were normal in these patients. The normal patients in this study had normal VNG examination and head impulse test results. All of them underwent head MR exams. Patients who did not meet the above conditions were excluded.
All the head MR exams included T2 sequence and T1 sequence. The T2 images through the peripheral vestibular organ were processed using a software we created ourselves. First, manually outlined the area of the peripheral vestibular organs, and then after processing through software, the gray image would turn into color. This pseudo-color perceptual enhancement visually presented a rainbow-like color scale, where blue, green, yellow, and red correspond to grayscale signal intensity values ranging from zero to the maximum value. The software would present the value of the region where we outlined. It could also calculate the average value of each region that outlined. We selected the average value and conducted the analysis. Because the peripheral vestibular organ may be displayed across one to three layers, the average values from the same side were summed and used to calculate the overall mean value. We calculated the differences between the final mean values of the left and right sides, and divided the results into three groups: group 0: that the side of the high mean value (which means more pronounced pseudo-color perceptual enhancement) was not the side of abnormal caloric test, group 1: that the side of the high mean value was the side of abnormal caloric test, group 2: the normal patients. The differences among these three groups were analyzed by variance.
3. Results
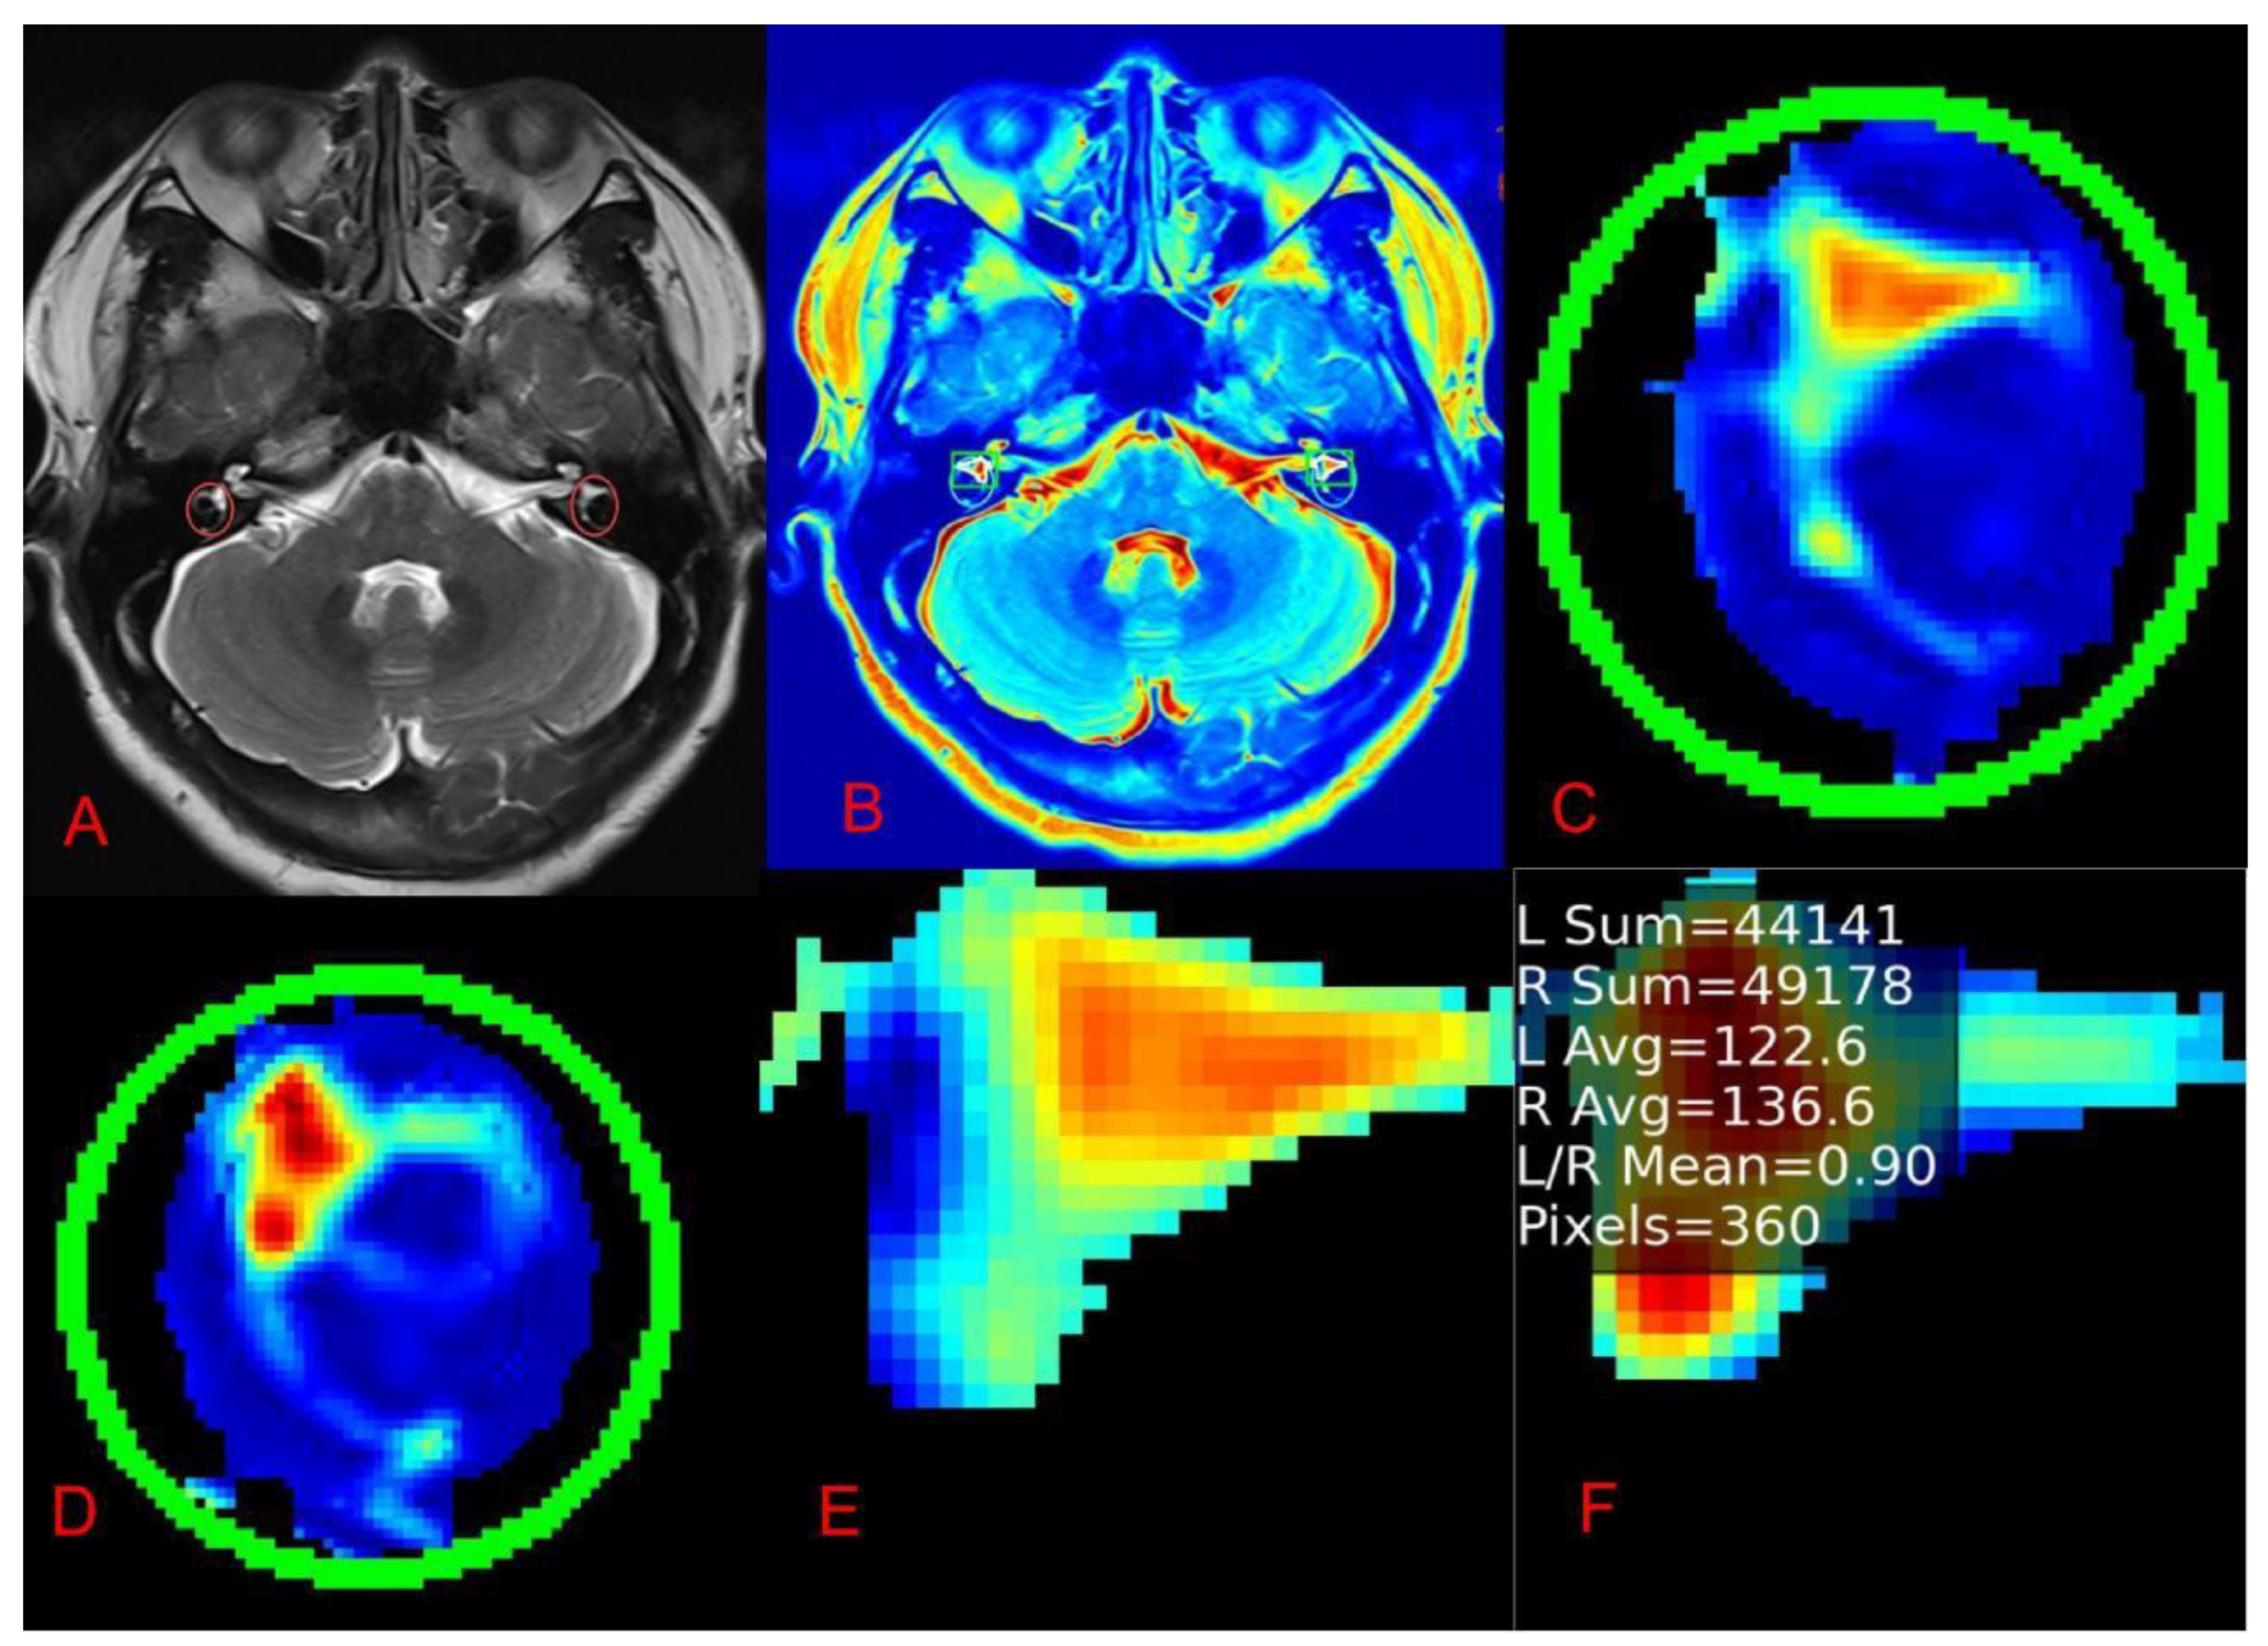
There were 53 patients in abnormal group, 27 male and 26 female, the mean age was 52.23±15.24 years old. The normal group had 23 patients, 10 male and 13 female, the mean age was 55.78±17.84 years old. There was no statistically significant difference in age between the two groups (p= 0.378). All these patients had normal MR results of inner ear in the report. After pseudo-color perceptual enhancement, we could see different colors between the two sides of the peripheral vestibular region(Figure 1). In some patients, the color differences were not obvious.
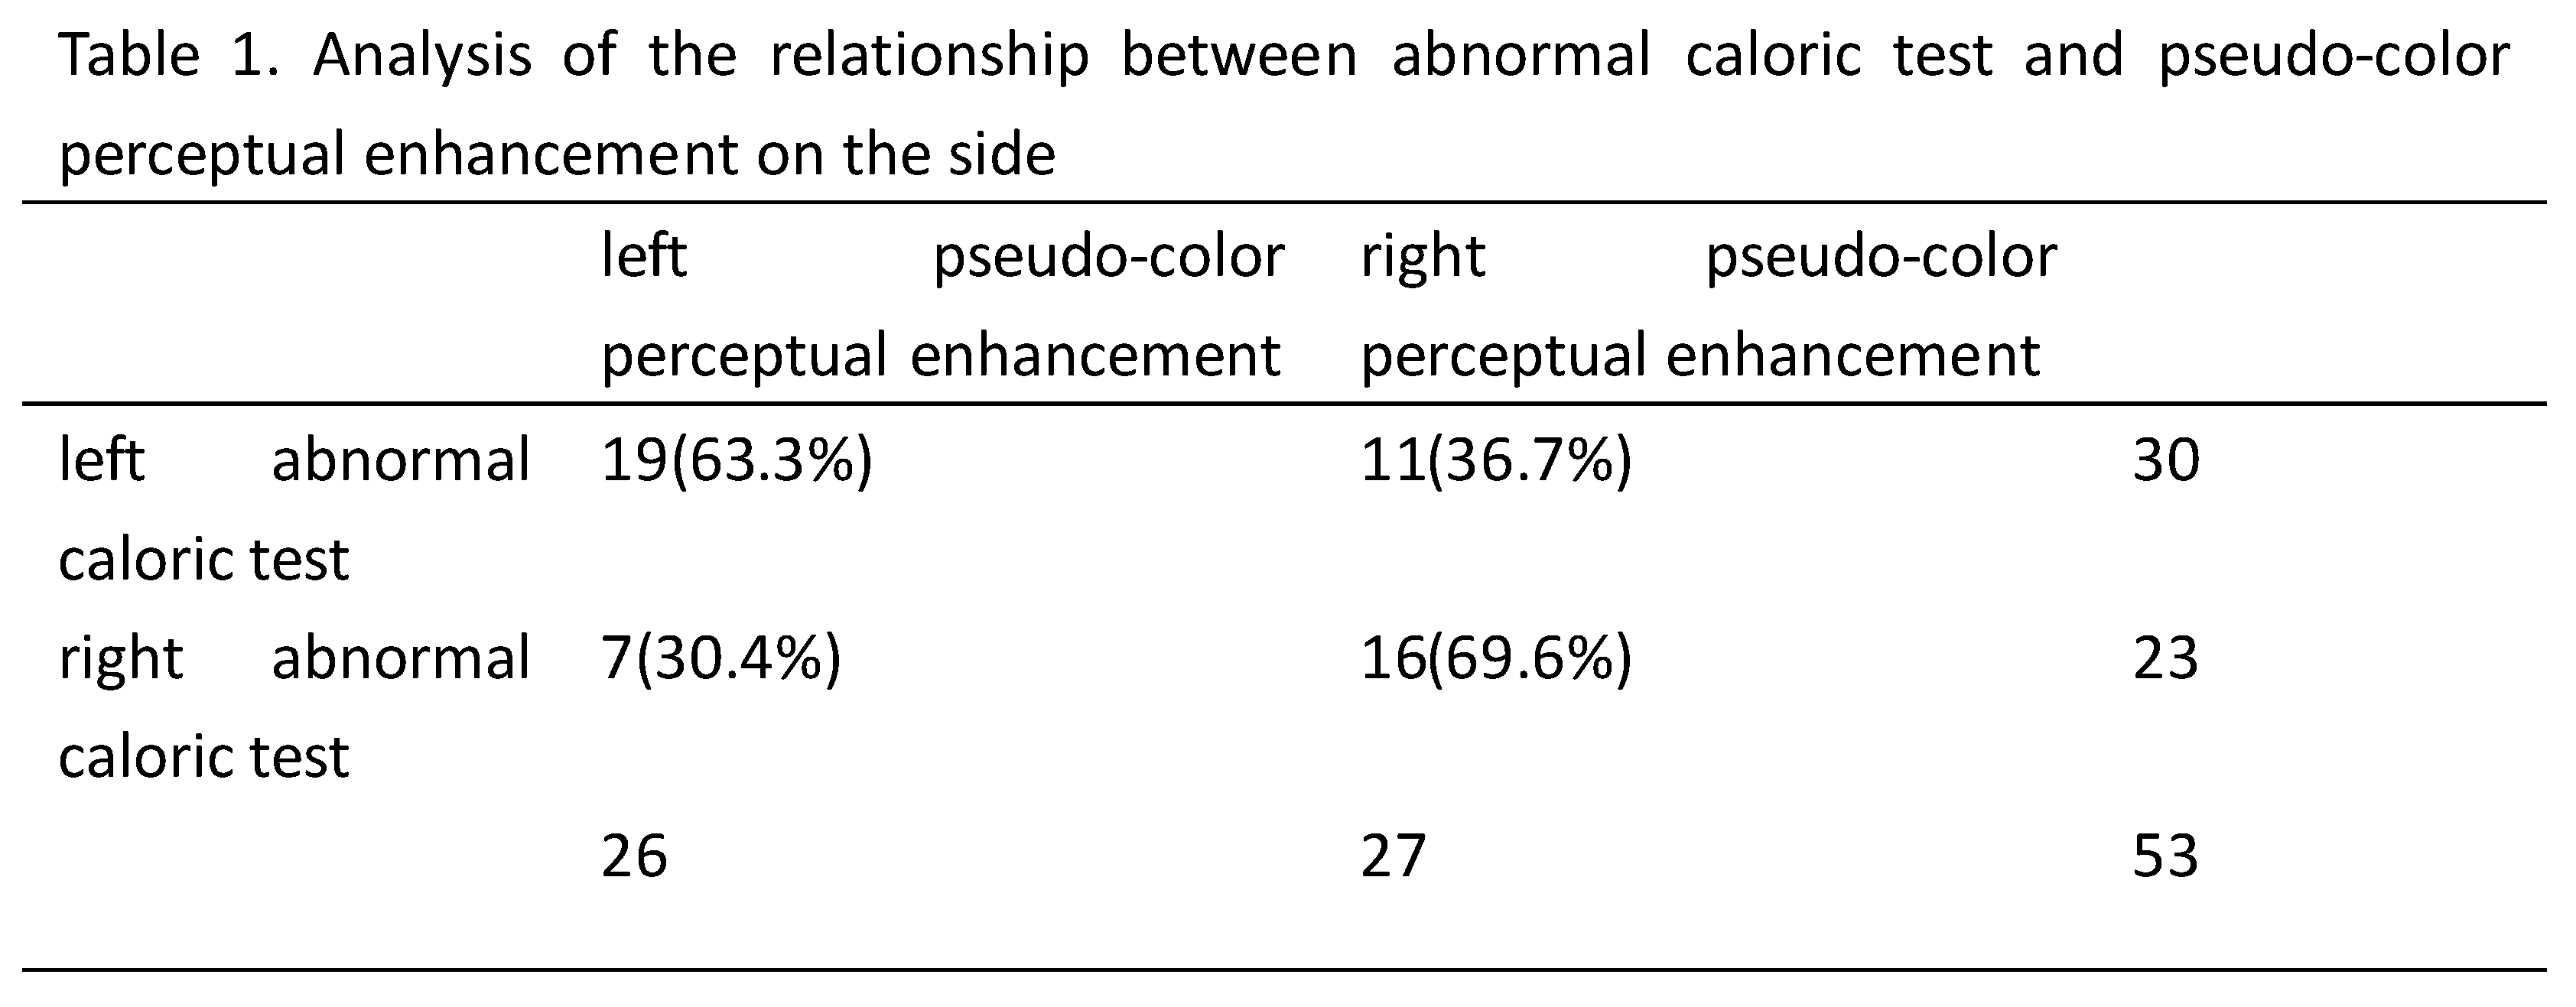
Thirty patients had an abnormal caloric test result on the left side, and twenty three had an abnormal result on the right side. Eighteen patients had an abnormal caloric test result on one side but had pseudo-color perceptual enhancement (here in the results, We meant that it has a higher value) on the other side, thirty five patients had the abnormal caloric test result and pseudo-color perceptual enhancement on the same side(Table 1). After analysis by the chi-square test, there was a statistically significant difference(OR=3.95, 95% CI:1.24-12.57, p=0.018). The probability of pseudo-color perceptual enhancement that occurred on same side with an abnormal caloric test was obviously higher than that which occurred on the contralateral side.
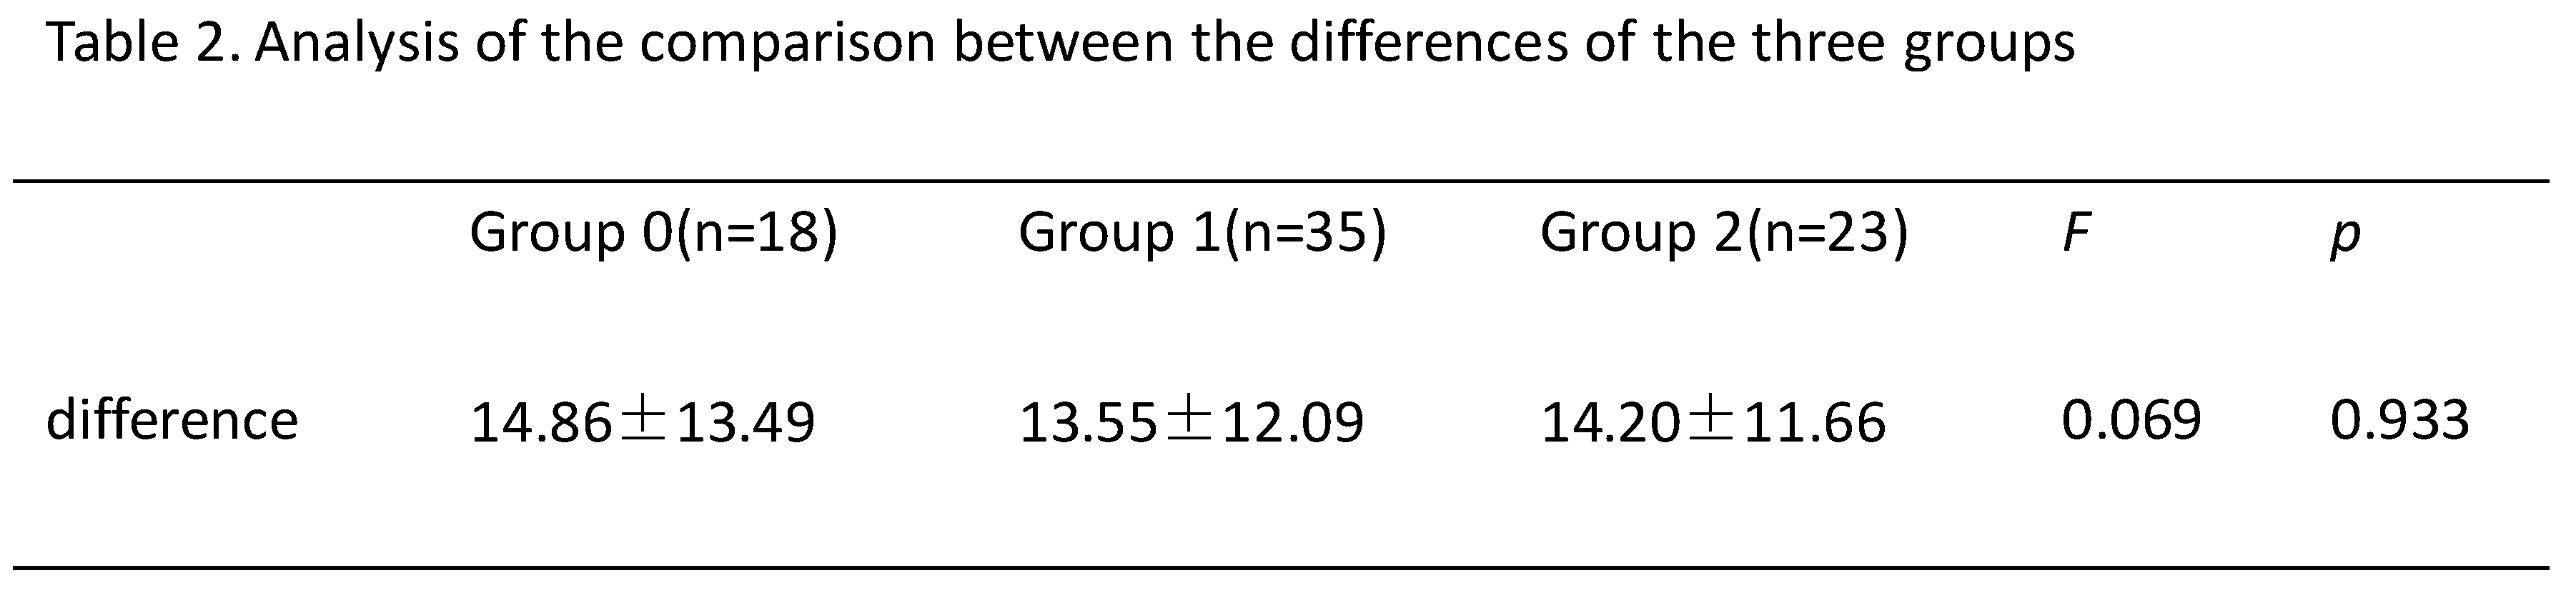
The difference of mean value on two sides on the same patient in group 0 was 14.86, 13.55 in group 1 and 14.2 in group 2. The differences among these three groups were not obvious(p=0.933)(Table 2).
4. Discussion
Pseudo-color perceptual enhancement is a technique that maps monochrome shades to a predetermined color scale, which is unrelated to the actual color of the objects being processed [8].The difference in hue corresponds to the grayscale before enhancement. It has been applied in many imaging examinations like ultrasonography [9], CT [10], X-ray [11], MR [8]. However, there has been little research conducted, especially on the inner ear. It improves contrast sensitivity in recorded images, and enables both quantitative and multi-parameter display [9]. So the use of pseudo-color perceptual enhancement can improve diagnostic performance and accuracy. But this is subjective, and it is related to the reader’s judgment, although some researches have analyzed the judgment results of different readers and achieved a good outcome that the color was better than gray to be distinguished [12,13].
Our research calculated the values of the lesions in the images, objectively displaying the differences between the lesions. We did not need to observe and judge whether the lesions on both sides were the same. Moreover, such judgment was also difficult to make in some cases. Another fact is that on many imaging examination results, the peripheral vestibular organs may be presented across one to three different layers, due to subtle differences in the patient’s position during the examination. Therefore, when we compared the peripheral vestibular organs on both sides of the same patient, we needed to splice and compare images from two or more different layers. This increased the difficulty of the comparison as well as the error rate. During our research, we outlined the peripheral vestibular organs of one patient at each layer, and the values were calculated by the software. We then obtained the total values of the ipsilateral peripheral vestibular organs by summing the values across different layers on the same side. Comparing the mean value of these total values allowed us to lower the error rate.
After comparison, we observed that the proportion of pseudo-color perceptual enhancement occurring on the side with an abnormal caloric test was significantly greater than that on the opposite side. An abnormal caloric test indicating canal paresis is more frequently observed in patients with MD [14]. And the pathological change of MD is endolymphatic hydrops [4]. Therefor the pseudo-color perceptual enhancement on the peripheral vestibular organ may indicate the endolymphatic hydrops. But there were also a few patients who exhibited pseudo-color perceptual enhancement on the side with a normal caloric test. Moreover, subsequent comparison of the mean values between the two sides of the same patient revealed no statistically significant difference among the three groups. This may indicate that the pseudo-color perceptual enhancement or this difference of values did not necessarily signify an anomaly. These results may be attributed to three possible factors: different pathological changes in the peripheral vestibular organ, or impure signals in the outlined area that contain signals originating from sources other than the peripheral vestibular organs, or the peripheral vestibular organ was not well visualized due to an insufficient number of imaging layers. The pathological changes may manifest as alterations in the inner ear lymphatic fluid, which can be visible on imaging examinations. Alternatively, the caloric test may reflect neurological function [15], which may not have changes in lymphatic fluid, making the imaging findings less pronounced. The shape of the figure we have outlined cannot change freely according to the shape of the peripheral vestibular organs. Therefore, the outlined area may include a small amount of surrounding tissue during this process, which may lead to inaccurate final values. An insufficient number of imaging layers could lead to some lesions not being displayed, resulting in inaccurate results.
5. Conclusions
We have developed a software specifically designed for pseudo-color perception enhancement of radiographic examination results. In this article, we used it to process T2 sequences from magnetic resonance images of patients with peripheral vestibular disorders, and calculated the values of peripheral vestibular organs.The results suggest that lesions in the peripheral vestibular organs may lead to more pronounced changes in pseudocolor perception enhancement on imaging, but the comparison of the differences between the abnormal and normal groups did not show statistical significance, thus the results remain somewhat confusing. In the future, we may achieve a more precise differentiation of peripheral vestibular disorders and then use this software for analysis, which may make the results more evident.
Author Contributions
Xiao yang designed this software, provided professional explanations of its principles, participated in the drafting and revising the manuscript. Yan guo designed this research, collected and analyzed data, drafted and revised the manuscript, provided final approval of the version to be published, and oversaw the presentation of the research.
Funding
This research received no external funding.
Institutional Review Board Statement
The study was conducted in accordance with the Declaration of Helsinki, and approved by the Ethics Committee of the First Affiliated Hospital of Soochow University (protocol code 2026906 and date of approval 4 August 2026).
Informed Consent Statement
Patient consent was waived due to this is a retrospective study.
Data Availability Statement
We encourage all authors of articles published in MDPI journals to share their research data. In this section, please provide details regarding where data supporting reported results can be found, including links to publicly archived datasets analyzed or generated during the study. Where no new data were created, or where data are unavailable due to privacy or ethical restrictions, a statement is still required. Suggested Data Availability Statements are available in the section “MDPI Research Data Policies” at https://www.mdpi.com/ethics.
Acknowledgments
I We would like to thank the audiologist from the Department of Otorhinolaryngology and Head and Neck Surgery, The First Affiliated Hospital of Soochow University for providing professional consultation on our examination results.
Conflicts of Interest
The authors declare no conflicts of interest.
Abbreviations
The following abbreviations are used in this manuscript:
| MR | Magnetic resonance |
| MD | Menière’s disease |
References
- Strupp, M.; Dlugaiczyk, J.; Ertl-Wagner, B.B.; Rujescu, D.; Westhofen, M.; Dieterich, M. Vestibular Disorders. Dtsch. Arztebl. Int. 2020, 117(17), 300–310. [Google Scholar] [CrossRef] [PubMed]
- Corrales, C.E.; Bhattacharyya, N. Dizziness and death: an imbalance in mortality. Laryngoscope Epub. 2016, 126(9), 2134–6. [Google Scholar] [CrossRef] [PubMed]
- Benson, J.C.; Carlson, M.L.; Lane, J.I. MRI of the internal auditory canal, labyrinth, and middle ear: how we do it. Radiology 2020, 297(2), 252–265. [Google Scholar] [CrossRef] [PubMed]
- Nakashima, T.; Pyykkö, I.; Arroll, M.A.; Casselbrant, M.L.; Foster, C.A.; Manzoor, N.F.; Megerian, C.A.; Naganawa, S.; Young, Y.H. Meniere’s disease. Nat. Rev. Dis. Prim. 2016, 12, 2:16028. [Google Scholar] [CrossRef] [PubMed]
- Bisdorff, A.R.; Staab, J.P.; Newman-Toker, D.E. Overview of the International Classification of Vestibular Disorders. Neurol. Clin. 2015, 33(3), 541–550, vii. [Google Scholar] [CrossRef] [PubMed]
- Steenerson, K.K. Acute Vestibular Syndrome. Continuum (Minneap Minn) 2021, 27(2), 402–419. [Google Scholar] [CrossRef] [PubMed]
- Sheppard, J.J.; Stratton, R.H.; Gazley, C. Pseudocolor as a means of image enhancement. Am. J. Optom. Arch. Am. Acad. Optom. 1969, 46(10), 735–54. [Google Scholar] [CrossRef] [PubMed]
- Whitehead, M.T.; Guillot, L.M.; Reilly, B. K. Cochlear signal alterations using pseudo-color perceptual enhancement for patients with sensorineural hearing loss. Pediatr. Radiol. 2021, 51(8), 1448–1456. [Google Scholar] [CrossRef] [PubMed]
- Pizer, S.M.; Zimmerman, J.B. Color display in ultrasonography. Ultrasound Med. Biol. 1983, 9(4), 331–345. [Google Scholar] [CrossRef] [PubMed]
- Elkersh, N.M.; Hassan, M.G.; Zakaria, O. Pseudo-color enhancement of CBCT images as a diagnostic tool for radicular cysts and periapical granulomas: A clinical feasibility study. Clin. Oral Investig. 2025, 29(7), 371. [Google Scholar] [CrossRef] [PubMed]
- Tjahjadi, T.; Bowen, D.K. The use of color in image enhancement of x-ray microtomographs. J. Xray Sci. Technol. 1989, 1(2), 171–189. [Google Scholar] [CrossRef] [PubMed]
- Zabala-Travers, S.; Choi, M.; Cheng, W.C.; Badano, A. Effect of color visualization and display hardware on the visual assessment of pseudocolor medical images. Med. Phys. 2015, 42(6), 2942–54. [Google Scholar] [CrossRef] [PubMed]
- Park, M.S.; Byun, J.Y.; Yeo, S.G.; Lee, H.Y. Use of pseudocolor for detecting otologic structures in CT. In Theory and applications of CT imaging and analysis; Homma, N., Ed.; Intech Europe: Rejeka; pp. 205–212.
- Vosbeek, E.G.; Seelen, M.; Schermer, T.R.; Terwindt, G.M.; Bruintjes, T.D. The Differences in Caloric Test and vHIT Results Between Menière’s Disease and Vestibular Migraine: A Systematic Review and Meta-Analysis. Otol. Neurotol. Epub. 2025, 46(10), 1191–1201. [Google Scholar] [CrossRef] [PubMed]
- Nilsen, K.S.; Nordahl, S.H.; Berge, J.E.; Dhayalan, D.; Goplen, F. K. Vestibular Tests Related to Tumor Volume in 137 Patients With Small to Medium-Sized Vestibular Schwannoma. Otolaryngol. Head. Neck Surg. Epub. 2023, 169(5), 1268–1275. [Google Scholar] [CrossRef] [PubMed]
Figure 1.
it is a patient who had an abnormal caloric test on the left side. A: is a magnetic resonance T2 sequence image, on which we have outlined the region we want to analyze. B: is a pseudo-color image after pseudo-color processing, and the program has outlined a rough ROI with a box for analysis. C: shows the program’s localization of the transition envelope ROI of the peripheral vestibular region of the left ear and the background masking of the remaining parts. D: shows the program’s localization of the transition envelope ROI of the peripheral vestibular region of the right ear. E: shows the program’s segmentation of the specific fine ROI of the vestibular region of the left ear, which is the inner layer fine segmentation mask. F: shows the program’s segmentation of the specific fine ROI of the vestibular region of the right ear (after flipping) and the results that calculated.
Figure 1.
it is a patient who had an abnormal caloric test on the left side. A: is a magnetic resonance T2 sequence image, on which we have outlined the region we want to analyze. B: is a pseudo-color image after pseudo-color processing, and the program has outlined a rough ROI with a box for analysis. C: shows the program’s localization of the transition envelope ROI of the peripheral vestibular region of the left ear and the background masking of the remaining parts. D: shows the program’s localization of the transition envelope ROI of the peripheral vestibular region of the right ear. E: shows the program’s segmentation of the specific fine ROI of the vestibular region of the left ear, which is the inner layer fine segmentation mask. F: shows the program’s segmentation of the specific fine ROI of the vestibular region of the right ear (after flipping) and the results that calculated.
Disclaimer/Publisher’s Note: The statements, opinions and data contained in all publications are solely those of the individual author(s) and contributor(s) and not of MDPI and/or the editor(s). MDPI and/or the editor(s) disclaim responsibility for any injury to people or property resulting from any ideas, methods, instructions or products referred to in the content. |
© 2026 by the authors. Licensee MDPI, Basel, Switzerland. This article is an open access article distributed under the terms and conditions of the Creative Commons Attribution (CC BY) license (http://creativecommons.org/licenses/by/4.0/).
Copyright: This open access article is published under a Creative Commons CC BY 4.0 license, which permit the free download, distribution, and reuse, provided that the author and preprint are cited in any reuse.