
Submitted:
04 August 2026
Posted:
17 August 2026
You are already at the latest version
Abstract
The evaluation of 3D forms in VR requires continuous process level computation, whereas traditional art training systems retain the final art and subjective scores. This paper presents a VR spatial-sketching platform, which integrates 60 Hz head-mount display posture, dual controller trajectory, stroke event, coordinate registration, state awareness filtering, multi-view coverage estimation, and geometric feature extraction. The trajectory of the algorithm is based on a three sample adaptive window, a low speed threshold of 0.03 m/s, a break point of 120 ms, and a break point of 80 mm. The feedback is updated every 2 s based on viewpoint-coverage entropy, the content ratio error, the center offset, and the interruption cost. A 12-week quasi-experiment involved 216 students, 1 296 works, 7 776 orthographic images, and approximately 7.2 million interaction records. The results of the ablation were 4.9 mm, the turning retention rate was 95.1%, the invalid trajectory was 93.6%, the error was 8.9%, and the delay was 42.6 ms. The results of the experiment were 85.4 ± 5.8 and 79.7 ± 6.4 in the control group, which confirmed the accuracy, continuity, interpretation, and adaptability of VR assessment.
Keywords:
virtual reality
; spatial doodling
; trajectory processing
; configuration features
; multi-view feedback
1. Introduction
VR sketching has evolved from an immersive display tool to a real-time spatial computing environment that needs to capture, synchronize, model, and interpret user actions. Li et al. demonstrated a six-degree-of-freedom motion feature for cross-system authentication via head-mounted display sequences [1]. Chaniaud et al. linked body movement with sketch quality but did not encode temporal relationships among observation, drawing, deleting, and reconstructing [2]. Yildirim et al. improved 3D sketch generation, although their method emphasized efficiency rather than process-state estimation [3]. Immersion assessment is supported by learning analytics and education data mining [4], and visual alerts reduce errors in hand tracking [5] and gestures enhance the experience of interaction [6]. However, the existing methods isolate device pose, controller trajectory, space stroke, and geometry errors, and lack of uniform registration, trajectory reconstruction, interpretable multi-view, latency-controlled feedback, and ablation testing. It records the pose at 60 Hz, identifies the status, corrects the missing data, maintains the rotation, suppresses the jitter, estimates the coverage of the viewpoint, extracts the geometrical features, and gives priority to the feedback. The evaluation included 216 students, 6 tasks, and 7.2 million records.
2. VR Spatial Sketching Training System
2.1. System Architecture
As shown in Figure 1, the VR Spatial Sketching Training System consists of five modules: Interactive Acquisition, Coordination Registration, Trajectory Calculation, Configuration Analysis, and Feedback Presentation. The Meta Quest headset and the dual controllers are capable of handling 6DoF poses, rotational quaternions, trigger states, undo events, and stroke attributes at 60 fps. Coordinate registration maps device coordinates into artwork space and normalizes scale using the initial bounding box. Trajectory computation performs filtering, segmentation, outlier removal, and behavior recognition. Configuration analysis measures the ratio error, center of mass offset, and view coverage, while feedback overlays the visual orientation, reference axis, and structure boundary to support continuous space correction.
2.2. Trajectory Data Processing
The original controller sequence includes natural vibration, floating motion, and short term tracking loss. Based on the status of the trigger button, the system separates the effective drawing trajectory, and then applies an adaptive weighting method that integrates the space distance with the motion speed to correct the sampling point:
where represents the raw 3D coordinates at time , represents the processed trajectory point, is the local window radius (set to 3 sampling points); is the instantaneous joystick velocity, and and control the influence of spatial distance and velocity difference on the neighborhood weight, respectively.When the speed of the controller is lower than 0.03 m/s, the neighborhood smoothing is increased to suppress the high frequency jitter. If the local angle of rotation is greater than 35 °, the window will contract to maintain sharp turns and profile changes [7]. When adjacent samples are more than 120 ms or 80 mm apart, a breakpoint is determined. Strokes invalidated by undo events are removed using their timestamps. The revised sequence is divided into drawing, floating, observing, and modifying states for overlapping, patching, and reconstructing.
2.3. Multi-View Feedback Optimization
Centered on the artwork, the observation space is divided into 12 horizontal directions and three vertical levels: bird’s-eye, eye-level, and worm’s-eye. When HMD gaze reaches the boundary for over 0.8 s, viewpoint duration is accumulated to calculate normalized coverage entropy:
where is the number of viewing regions and is the observation-time proportion in region. Lower values indicate concentrated viewing. Every 2 s, feedback priority is determined by coverage, contour-proportion error, center offset, and viewpoint-switching cost. The direction with highest deviation receives a spatial-frustum cue. If proportion or center-offset errors exceed thresholds for three cycles, bounding-box and reference-axis overlays appear. Feedback is activated only when inadequate coverage and structural deviation coexist, reducing interruptions to strokes. As shown in Figure 2, the process includes pre-feedback deviation detection, perspective and structural guidance, and post-feedback deviation convergence.
3. Modeling Overall Configuration Features
3.1. Training Data Synchronization
The three level index, based on student, task, and stroke ID, synchronizes the posture of the headset, the dual controller’s trajectory, the space moves, the reversal events, and the status of the art on the monotonously rising clock. Continuous data shall be sampled at 60 Hz. Missing position frames are reconstructed using cubic Hermite interpolation, while receiver and controller orientations are aligned through quaternion-based spherical linear interpolation. Discrete events, such as Undo, Delete, and Rotating Objects, are allocated to the closest sample frame in 8.3 ms. After the task is completed, orthographic images are generated in 6 directions — front, back, left, right, top, and bottom — to ensure that the trajectories, the changes, and the configuration characteristics are consistent.
3.2. Extraction of Configuration Features
As shown in Figure 3, the system uses the artwork’s three-dimensional bounding box as a common reference to extract global dimensions, key proportions, form center, and multi-view contour features. Front–back, left–right, and top–bottom orthographic projections are generated along the , , and axes. Task-specific structural points are configured for portraits, human movement, and animal forms. To preserve creative diversity, only essential structural relationships, such as head-to-body ratio, hip width, and segment spacing, are standardized. The center offset is calculated as:
In the equation, and represent the voxel-weighted centers of the student’s work and the reference structure, respectively, while , , and are bounding-box dimensions. Diagonal normalization enables cross-task comparison within a unified task-independent feature space for evaluation. Contour continuity is evaluated from breaks, open endpoints, and local curvature discontinuities across six views, supporting interpretable geometric assessment.
3.3. Quantification of Process Behavior
The system aggregates observation, rendering, and modification events in a 2-second window, and identifies structure generation, global correction, and local refinement based on stroke-adding rate, undo frequency, and modification range. The operation rate is computed from the number of Undo, Delete, and Redraw, divided by the time of the training, excluding the interruption of the device and the inactive pause. To distinguish local adjustments from whole-form reconstruction, the modified-area ratio is defined as:
where is the number of valid modification events, is the minimum bounding box of the strokes covered by the th modification, is the bounding box of the entire artwork.Spatial strokes are partitioned into voxels whose side length equals 1/80 of the artwork bounding-box diagonal. Stroke overlap is estimated from repeated voxel occupancy rather than retained as a formula. The operation frequency, the modified area ratio, the overlap level, the view coverage entropy, and the observation path length are combined into a process behavior vector, which is stored in the student level sequence.
4. Experimental Evaluation
4.1. Dataset Construction and Protocol
216 undergraduate art-education students from nine classes participated. In each class, the students were stratified according to entry drawing and spatial rotation scores, and were assigned to either the treatment group (n = 108) or the control group (n = 108), maintaining the nested class structure for hierarchical analysis. The 12-week program consisted of one task every two weeks: portrait drawing, human movement, animal anatomy, object composition, public sculpture, and space installation. Each 90-minute session consists of 40 minutes of structure creation, 30 minutes of global correction, and 20 minutes of local refinement. In the experiment, the Meta Quest headset generated synchronized posture, stroke, and editing streams, while the controls used charcoal and foam boards with the same geometry constraints. Instructors were given only task specifications and no feedback, ensuring that the task sequence, difficulty, sampling duration, and reviewer exposure were consistent.
4.2. Data Acquisition and Metrics
The corpus consists of 1,296 images and 7,776 standard-view images. Headset poses, dual-controller trajectories, stroke states, and undo events produced approximately 7.2 million interaction records. Each piece was evaluated by five instructors for the completeness of the form, the proportion precision, the continuity of the contour, the stability of the center of gravity, the consistency of the multiple views, and the space expression. The score was converted into a percentage, with an intraclass correlation factor of 0.887. Standardized task-level geometry features were compared with instructor labels to assess the consistency of automatic scoring. As illustrated in Table 1, the baseline differences were not significant, but the effective trajectory frames were more than 97%, supporting frame-, task-, label, and user-level analyses with no imputation or group correction.
4.3. Hierarchical Performance Model
Three level linear model divides task complexity (level 1), user difference (level 2) and class effect (level 3). The training period was centered from 0 to 5, with interactive mode, entry drawing score, space rotation, and previous VR exposure. Random class intercepts, user intercepts, and user slopes captured contextual and individual variation. Parameters were estimated by restricted maximum likelihood. Performance growth slopes were quantified using group-based interactions, and the adequacy of AIC, BIC, residual diagnosis, and coefficient significance were assessed.
5. Results and Discussion
5.1. Algorithm Performance Validation
Under identical hardware, sampling frequency, and task inputs, three ablation pipelines were configured: raw trajectories with periodic prompts, fixed-window filtering with coverage feedback, and state-aware processing with joint feedback. Trajectory computation was evaluated by endpoint deviation, turn retention, and invalid-sequence recognition; feedback computation was evaluated by false-trigger rate and single-cycle latency. Table 2 summarizes the comparative results. Identical input streams and labels separately isolated the contribution of each algorithmic component.
The integrated pipeline has an endpoint deviation of 4.9 mm and kept 95.1% of turning segments, which shows that there is a lower geometric distortion as compared to the fixed-window filtering. In addition, the invalid-sequence recognition achieved 93.6%, which further demonstrated that the trigger states and motion descriptors were able to filter out the hovering samples and incomplete strokes. The joint feedback to reduce false activations from 14.6% to 8.9%. Due to computing coverage, contour and center-offset features together, the single-cycle latency increased to 42.6 ms, but was still lower than the 2-second feedback interval, which was sufficient for meeting the real-time response constraint for continuous immersive interaction.
Figure 4 shows that the configuration score differed from instructor labels by -0.42 points on average, with 95% agreement limits ranging from -6.18 to 5.34 across all scores.
5.2. Process Representation Performance Analysis
As shown in Figure 5, the learned behavior vectors gradually shifted from local revision toward global modification in three-dimensional feature space. During the first two tasks, multi-view observation accounted for 31.2%, global modification for 19.7%, and local contour filling for 49.1%, indicating a predominance of local refinement. In the middle tasks, global modification increased to 28.6%, while local contour filling declined to 36.6%. By the final tasks, global modification and multi-view observation each reached 33.1%. In contrast, the control workflow achieved only 22.8% global modification at the late stage and remained centered on local revision. The hierarchical model produced a group-by-stage coefficient of 2.06, showing steeper growth in whole-form correction under the VR pipeline. Differences between pipelines were greater for multi-view consistency and center-of-gravity stability than for contour continuity. In Task 6, experimental scores reached 85.4 ± 5.8 versus 79.7 ± 6.4 for controls, confirming sensitivity to global structural change rather than operation frequency alone.
5.3. Computational Feature Contribution Analysis
A 5,000-sample bootstrap analysis quantified relationships among observation features, modification behavior, geometric errors, and configuration scores. The VR pipeline produced standardized effects of 0.284 on viewpoint-coverage entropy and 0.236 on the global-modification index, indicating a shift from localized interaction to broader structural correction. Each SD increase in global modification reduced proportional and center-offset errors by 0.218 and 0.191, respectively; these errors contributed −0.312 and −0.227 to the composite score. Local-modification frequency showed no significant independent effect. Thus, viewpoint entropy identifies incomplete inspection, the global-modification index measures correction scope, and normalized geometric errors provide interpretable links between raw interactions and automated scores.
6. Conclusions
To render headset poses, controller trajectories, strokes and editing events as synchronized representations, a VR spatial sketching system was implemented. The pipeline is a framework that integrates state-aware trajectory filtering, six-view feature extraction, viewpoint-coverage entropy, center-offset estimation and priority-based feedback. The algorithm’s results at 60 Hz were 4.9 mm endpoint deviation, 95.1% turn retention, 93.6% invalid-trajectory recognition, 8.9% false-trigger, and 42.6 ms single-cycle latency. The scores of the experimental group were found to be higher than the scores of the control group showing that interpretable process features can be used in a quantitative evaluation and correction of form construction. Preset ratios, orthographic projections and data from one single discipline are limitations. In the future, topology-aware graph representations, learned task templates, cross-device calibration and domain-adaptive models for free-form spatial creation should be introduced.
References
- Li, M.; Banerjee, N.; Banerjee, S. Cross-system forecasting-based user authentication for virtual reality (VR) [J]. Comput. Graph. 2026, 139104660–104660. [Google Scholar] [CrossRef]
- Chaniaud, N.; Fleury, S.; Poussard, B.; et al. “Why move during virtual reality sketching? An experimental study to improve the quality of sketches in virtual reality” [J]. Des. Stud. 2025, 97, 101298–101298. [Google Scholar] [CrossRef]
- Yildirim, E.; Altun, A. D. T. A 3D quick sketch algorithm in virtual reality for concept design in architectural studio [J]. Int. J. Archit. Comput. 2025, 23(1), 193–208. [Google Scholar] [CrossRef]
- Lampropoulos, G.; Evangelidis, G. Learning Analytics and Educational Data Mining in Augmented Reality, Virtual Reality, and the Metaverse: A Systematic Literature Review, Content Analysis, and Bibliometric Analysis [J]. Appl. Sci. 2025, 15(2), 971–971. [Google Scholar] [CrossRef]
- Gemici, M.; Phadnis, V.; Batmaz, U. A. Before Hands Disappear: Effect of an Early Warning Visual Feedback Method for Hand Tracking Failures in Virtual Reality [J]. PLoS ONE 2025, 20(6), e0323796. [Google Scholar] [CrossRef] [PubMed]
- Laine, H. T.; Suk, J. H. Investigating User Experience of an Immersive Virtual Reality Simulation Based on a Gesture-Based User Interface [J]. Appl. Sci. 2024, 14(11). [Google Scholar] [CrossRef]
- Abdlkarim, D.; Luca, D. M.; Aves, P.; et al. A methodological framework to assess the accuracy of virtual reality hand-tracking systems: A case study with the Meta Quest 2.[J]. Behav. Res. Methods 2024, 56(2), 1052–1063. [Google Scholar] [CrossRef] [PubMed]
Figure 1.
Architecture of the VR Spatial Doodling Training System.
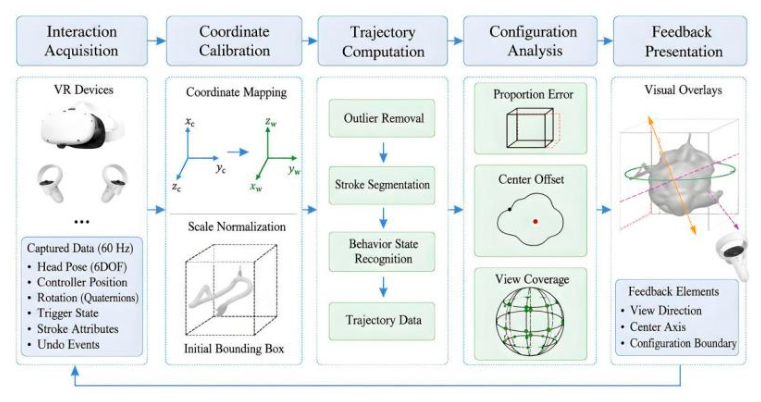
Figure 2.
Comparison of Multi-View Feedback Triggering and Configuration Correction Interfaces.
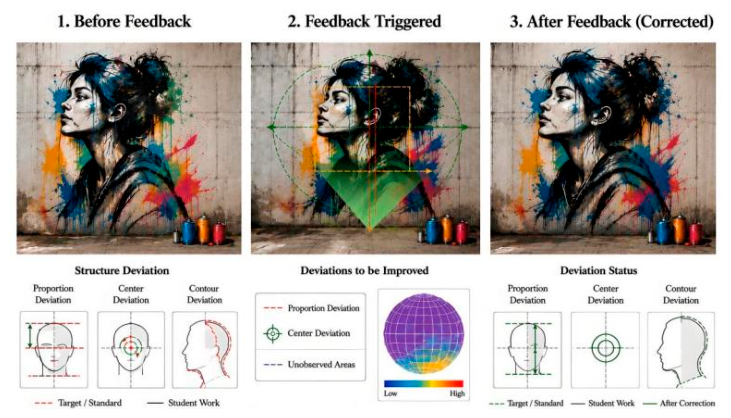
Figure 3.
Multi-view configurational feature measurements of graffiti works in VR space.
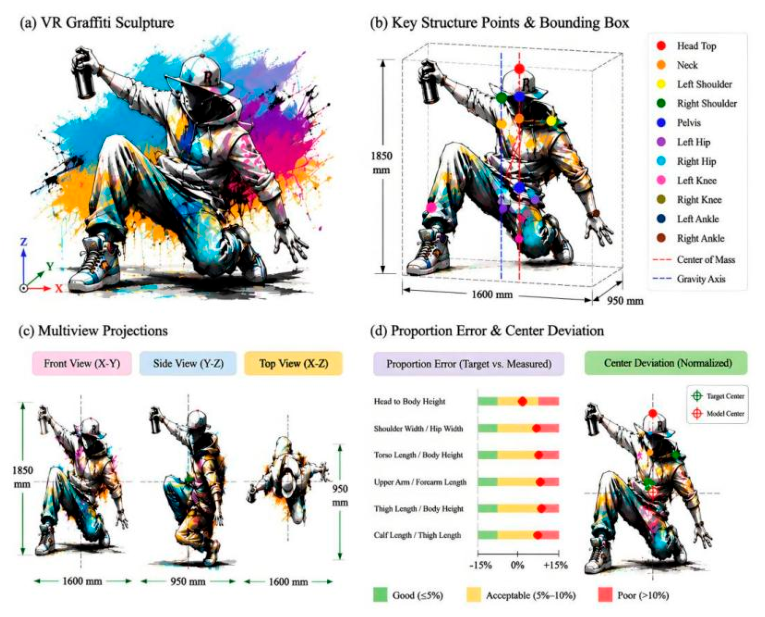
Figure 4.
Bland–Altman consistency analysis plot.
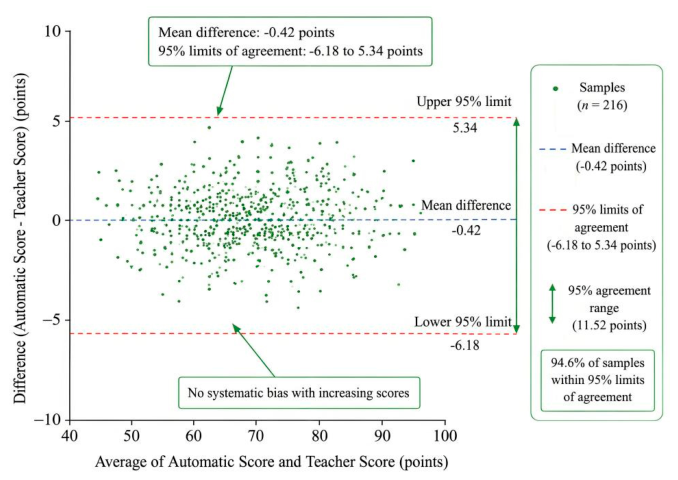
Figure 5.
Ternary Distribution of Training Behavior Composition.
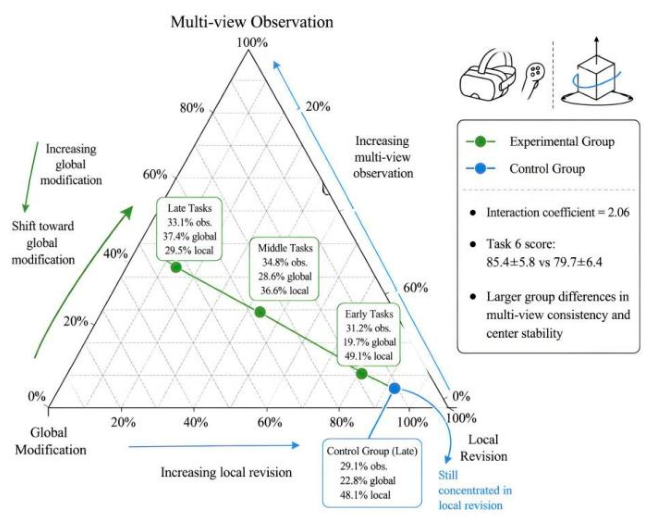

Table 1.
Baseline Characteristics and Data Quality of the Two Student Groups.
| Metric | Experimental Group (n=108) | Control Group (n=108) | P-value |
| Age (years) | 20.31 ± 0.87 | 20.27 ± 0.91 | 0.742 |
| Entrance Drawing Score/points | 82.41 ± 4.96 | 82.08 ± 5.21 | 0.635 |
| Spatial Rotation Ability/points | 24.73 ± 4.18 | 24.46 ± 4.27 | 0.641 |
| Percentage of Previous VR Use/% | 17.59 | 19.44 | 0.732 |
| Task completion rate (%) | 100 | 100 | — |
| Trajectory Valid Frame Rate / % | 97.82 ± 1.34 | 97.61 ± 1.42 | 0.267 |
| Standard-angle image completeness rate (%) | 100 | 100 | — |
Table 2.
Ablation Results for Trajectory Processing and Feedback Algorithms.
| Scheme | Stroke Endpoint Deviation/mm | Turn Retention Rate/% | Invalid Trajectory Recognition Rate/% | Feedback False Trigger Rate (%) | Single-Cycle Delay / ms |
| Original Trajectory + Fixed-Cycle Prompt | 7.6 | 88.3 | 81.7 | 14.6 | 24.8 |
| Fixed-Window Filtering + Coverage Feedback | 5.8 | 91.2 | 87.9 | 11.3 | 33.7 |
| State-Aware Processing + Joint Feedback | 4.9 | 95.1 | 93.6 | 8.9 | 42.6 |
Disclaimer/Publisher’s Note: The statements, opinions and data contained in all publications are solely those of the individual author(s) and contributor(s) and not of MDPI and/or the editor(s). MDPI and/or the editor(s) disclaim responsibility for any injury to people or property resulting from any ideas, methods, instructions or products referred to in the content. |
© 2026 by the authors. Licensee MDPI, Basel, Switzerland. This article is an open access article distributed under the terms and conditions of the Creative Commons Attribution (CC BY) license.
Copyright: This open access article is published under a Creative Commons CC BY 4.0 license, which permit the free download, distribution, and reuse, provided that the author and preprint are cited in any reuse.