

Submitted:
26 September 2026
Posted:
29 September 2026
You are already at the latest version
Abstract
Virtual-patient models need a way to represent a person’s biological state before they can model how that state may change. Many AI-for-science models focus on molecules, cells, or a single organ, while treatment decisions are made for people who may have several conditions and many possible interventions. We used drug repurposing as a human-scale test of whether organized biological modules can help rank known drug–disease relationships.We introduce SteeraMed Bench, which compares panels drawn from a 332-module library across drug-repurposing tasks. The benchmark included 1,916 small molecules and five primary chronic-disease tasks, with an exploratory analysis across 23 disease categories. In standard cross-validation, recall@20—the fraction of known positive drug–disease pairs found among the top 20 ranked drugs—was 0.494 for the 117-module nutraceutical panel across five diseases, close to 0.524 for the full library. In the 23-category analysis, the full library ranked first in only 9 categories; the best-performing panel varied by disease: aging-hallmark panels led for type 2 diabetes and osteoporosis, food-as-medicine for depression, and nutraceutical modules for atherosclerosis/hyperlipidemia. These findings show that different biological panels carry different ranking signals within the benchmark. Performance fell when drugs with related target families were kept out of training, and was near chance when an entire disease was held out.We also tested whether a language-model-assisted agent could propose new modules for the library. Two of 14 proposals showed nominal positive gains in the second round, but neither remained significant after correction for testing seven concepts. SteeraMed Bench provides a shared way to compare and update biological representations for future virtual-patient research. It is a benchmark for representation and candidate prioritization, not a complete virtual patient or a validated drug-discovery system.
Keywords:
virtual patients
; drug repurposing
; human-scale representation
; module panel library
; AI for science
; aging
; traditional Chinese medicine
; network medicine
; recall@20
; cross-validation
1. Introduction
People often live with more than one age-related condition. Type 2 diabetes, high blood pressure, atherosclerosis, osteoporosis, depression, and immune dysfunction can occur together and affect one another over time [1]. Yet many biological models are built around one disease or one organ at a time. Drug and lifestyle decisions, by contrast, have to be considered for the whole person.
AI-for-science has made it possible to study biology at molecular and cellular scales. Network pharmacology has also helped organize relationships between drugs and diseases [2]. These approaches answer important questions, but they do not by themselves provide a shared representation of whole-person biology on which different interventions can be compared. Virtual-cell models offer detailed views of cellular processes [3,4]; a virtual patient would need to represent the state of a person across interacting functions and conditions [5,6].
Building a complete model of whole-body dynamics is a large task. We take a smaller, testable step: before asking a model to simulate how a person changes, we ask whether a structured set of biological features can help rank known drugs for known diseases. Drug repurposing provides a practical test because there are existing drug–disease records against which rankings can be compared [5,7,8,9]. If a representation cannot recover useful signals in this setting, it is unlikely to serve as a strong starting point for a virtual patient. If it can, it provides a measurable coordinate layer for later modelling—not a simulator in itself.
A common approach uses protein–protein interaction (PPI) networks to measure how close a drug’s targets are to genes associated with a disease [6,10,11]. These methods can summarize proximity in a single score, such as a min-z score [12]. Researchers have also used these network methods to search for drugs that target aging hallmarks [13]. A single score is useful, but it does not show which organized biological dimensions carry the ranking signal, or whether different dimensions are useful for different diseases. Aging-hallmark gene sets add biologically organized information, but represent only one knowledge tradition [14,15]. A systematic comparison of modules drawn from different biological and medical sources is therefore needed.
We assembled a library of 332 gene modules from four sources: aging-related hallmarks, traditional Chinese medicine (TCM) syndrome proxies, nutraceutical targets, and food-as-medicine targets. A module is a curated gene set; a panel is a selected collection of modules. The library is not meant to be used as one fixed model for every disease. Instead, it provides a common basis for testing which panels help with which tasks, whether adding a panel improves a ranking, and whether a proposed module adds information beyond what is already represented.
The module–drug links in this study are based on network proximity. Some modules also retain links to compounds or sources used during curation. Those annotations are incomplete and, for some panels, share data sources with the module definitions. They therefore do not establish that a module can be controlled by an intervention, or that a drug will affect a module in a particular direction. Here we test whether the representation can rank known drug–disease pairs. We do not test a model of treatment response over time.
We introduce SteeraMed Bench as a framework for comparing module panels on these tasks. It evaluates ranking performance, compares panels with a scalar network-proximity baseline, measures overlap between modules, and tests how performance changes under more demanding validation splits. We also run an exploratory language-model-assisted workflow to propose and score new gene sets. The central question is whether this benchmark can help researchers compare human-scale biological representations before building more complete virtual-patient models.
2. Results
We tested two related questions. First, can panels of biologically organized modules help rank known drugs for known diseases? Second, can the same benchmark assess newly proposed modules? Standard cross-validation measures performance within the disease tasks used here. We therefore also report target-family and held-out-disease tests, which ask whether the ranking transfers when related drugs or an entire disease are excluded from training.
2.1. A Module Library for Comparing Biological Panels
We organized 332 gene modules into four panels (Figure 1). The aging-related panel contains 72 modules, including cellular aging hallmarks and modules for organ, metabolic, immune, and integrative functions. The TCM panel contains 38 syndrome-derived gene-set proxies. The nutraceutical panel includes 117 modules (the core NUT set plus its extensions, NUTX), and the food-as-medicine (FAM) panel contains 105 modules. Each module represents a set of genes associated with a biological direction, such as nutrient sensing, bone remodeling, or antioxidant defense. The Methods describe how each source was assembled.
The library is a set of alternatives to evaluate, not a claim that all 332 modules should be combined for every disease. For each drug, we calculated how close its target proteins were to the genes in each module on the STRING PPI network. The resulting drug-by-module matrix was then used to compare panels on their ability to rank drugs with known indications. Some modules also retain links to compounds or sources used during curation. Because those links come from incomplete and sometimes overlapping databases, we did not treat them as evidence that an intervention controls a module or produces a therapeutic effect.
2.2. Organized Panels Recover Known Drug–Disease Pairs Within the Benchmark
We first tested five chronic diseases: type 2 diabetes, hypertension, depression, osteoporosis, and atherosclerosis/hyperlipidemia. The dataset contained about 1,916 small molecules. A drug was labelled positive for a disease when its DrugBank indication or ATC code (a standard drug-classification system) matched that disease; drugs without a match were treated as non-positives for this benchmark, although some may be unrecorded positives. For each disease, a logistic-regression model ranked drugs from their PPI proximity to the modules. We used five-fold cross-validation with three random seeds. The main measure, recall@20, is the fraction of known positive drugs found among the top 20 ranked drugs.
We compared each observed panel with a null test that shuffled the drug–module feature columns. This kept each module’s score distribution but broke the pairing between a drug and its module scores. The observed panels performed better than these shuffled comparisons, indicating that the ranking signal depended on the structured drug–module pairing. Table 1 gives the five-disease averages. The 117-module nutraceutical panel reached a mean recall@20 of 0.494, close to 0.524 for the full 332-module library. The corresponding gains over the shuffled-feature null were 0.466 and 0.491. The difference between the two panels was modest (0.025). The result argues against simply adding every available module: compact panels can retain much of the within-benchmark ranking signal.
Small panels also carried signal. The six-module immune panel (A4) showed an excess recall@20 of 0.104 over its permutation null (95% CI, 0.091–0.117); the ten-module metabolic panel (A3) reached 0.212. The full library had a larger excess gain of 0.491, but the increase was not proportional to its size. Fold-enrichment results in Supplementary S1 were consistent with this pattern. These comparisons show that biologically organized panels can be useful ranking features in this benchmark; they do not show that the panels predict treatment benefit in patients.
These results are strongest under standard cross-validation, where drugs are randomly divided between training and test folds. When drugs from the same target family were kept together in the same fold, recall@20 fell to 0.256 ± 0.024—about half the standard-CV value (Supplementary S5). Performance was near chance when an entire disease was held out. Three further ways of splitting the data—by target-profile similarity, by chemical scaffold, and by publication order—are reported in Supplementary S4. In a separate repoDB analysis, the mean AUROC (a single-number summary of ranking quality across all cutoffs) was 0.688 and the atherosclerosis/hyperlipidemia task reached 0.848 (AUPR lift = 1.73×; Supplementary S2). This database-shift analysis is descriptive, not confirmatory external clinical validation. We therefore interpret standard-CV results as evidence of within-task ranking signal, not proof of broad generalization.
2.3. Different Diseases Favored Different Panels
No panel ranked first across all disease categories. In a leave-one-paradigm-out analysis of the full library, removing the aging-hallmark or TCM panel did not reduce average recall@20; it increased it by 0.031. Removing the nutraceutical or food-as-medicine panel reduced recall@20 by 0.010 and 0.030, respectively. These are aggregate results: they do not mean that Hallmarks or TCM are uninformative for every disease. Rather, the results show that a panel’s value depends on the disease task and on the other panels already included.
The exploratory extension across 23 DrugBank disease categories showed the same pattern (Figure 2; Supplementary S3). The full 332-module library had the highest observed recall@20 in only 9 of 23 categories (39%). Aging-hallmark panels ranked highest for cancer and osteoporosis; nutraceutical panels ranked highest for analgesic, antipsychotic, and cardiovascular categories; food-as-medicine panels ranked highest for depression and anti-inflammatory categories; and TCM panels ranked highest for sedative and antiepileptic categories. These rankings suggest that different panels may be useful in different disease settings. They are exploratory and do not establish that one panel is statistically superior for a particular disease.
The five primary disease tasks also showed different top panels. Aging hallmarks ranked highest for type 2 diabetes (0.700) and osteoporosis (0.300); the full library ranked highest for hypertension (0.750); food-as-medicine ranked highest for depression (0.700); and nutraceutical modules ranked highest for atherosclerosis/hyperlipidemia (0.400). This disease-dependent pattern motivates evaluating panels separately rather than assuming one universal representation.
2.4. Panel Value Depended on the Task and the Way Panels Were Combined
The main comparison asks how well each prespecified panel ranks drugs for a disease. It does not assume that the full 332-module library is a universal disease model. We also compared the real feature matrix with two types of chance comparison: shuffled drug–module pairings and random gene sets matched on size and PPI connectivity (Supplementary S1). The shuffled-feature null is the primary comparison in Table 1; the random-gene-set comparison is a separate registry-level robustness check.
Combining panels (exploratory). We tested whether a combination selected within the training data could outperform the best single panel. In each training fold, we ranked panels using inner cross-validation, selected the best single panel, and then added other panels one at a time, up to three. Only the held-out fold was used to evaluate the selected combination. For type 2 diabetes, the nutraceutical-plus-Hallmarks combination had a higher observed recall@20 than the selected nutraceutical panel alone (0.533 ± 0.051 versus 0.443 ± 0.069; difference +0.090; descriptive repeated-CV interval, −0.02 to +0.20). Across all tasks, the average difference was +0.026 (single panels, 0.484; combinations, 0.510). The full library remained comparable at 0.528 in this analysis. The nutraceutical panel was chosen as the best single panel in 67 of 75 training folds; nutraceuticals plus Hallmarks was the most frequent two-panel combination (29 of 75 folds). Because the folds share data, these repeated estimates are descriptive rather than independent biological replications. The result suggests that panel combinations may help for some diseases, but does not establish a universal combination advantage.
Classifier comparison. Our main panel comparisons use logistic regression because its coefficients are relatively easy to inspect. To check whether the observed ranking signal depended on this classifier, we compared five methods on the full 332-feature library using a separate cross-validation aggregation protocol (Table 2; Figure 2d). XGBoost had the highest five-disease average recall@20 (0.66), followed by MLP (0.62), random forest (0.50), logistic regression (0.49), and gradient boosting (0.41). Thus, other classifiers extracted more ranking signal from the same representation under this protocol, especially XGBoost. The values in Table 2 should not be compared directly with Table 1, which uses a different aggregation protocol. We retain logistic regression as the primary model for the panel analysis; a full comparison and selection of machine-learning models is outside that analysis.
2.5. Model Contributions Differed by Disease, but are Not Mechanisms
We examined which module features contributed most to the predictions from the full-library logistic-regression model. This analysis helps make the model auditable: it shows which features supported its rankings. It does not identify causal disease mechanisms. We fitted a separate model for each disease across 15 cross-validation folds (three seeds by five folds). A module was called a stable model-associated direction when its coefficient kept the same sign in more than 80% of folds and its contribution was large. The coefficient sign describes how the standardized feature relates to the model score; it does not mean that a biological process is activated, inhibited, beneficial, or harmful.
The modules that contributed most differed by disease. For type 2 diabetes, stable features included nutrient sensing, chromium metabolism, and extracellular-matrix remodeling. For hypertension, features included the kidney module and several food-as-medicine modules. Depression rankings drew on tyrosine metabolism, innate immunity, and CoQ10. Osteoporosis rankings included oxidative-stress, ovarian-function, and calcium modules. These patterns are biologically interpretable candidates, but they require independent biological validation. When we summed contributions by panel, modules from several knowledge sources appeared in each disease model; no single panel supplied all of the leading features.
We also asked how often each module appeared among the ten largest absolute coefficients across the 15 folds. This selection probability was at least 0.80 for only a small subset of modules. Type 2 diabetes models repeatedly selected nutrient sensing, chromium, and microbiota; hypertension models selected kidney, NAD-related, and food-as-medicine modules; depression models selected tyrosine, innate immunity, and leukocyte migration; and osteoporosis models selected ovarian function, free-radical defense, macrophage activation, and calcium. Most of the 332 features were not selected consistently. The fitted models therefore relied on a smaller, disease-dependent subset, although these model choices alone do not establish a biological mechanism.
To show how individual rankings could be inspected, we decomposed two held-out examples: glipizide for type 2 diabetes and escitalopram for depression (Figure 3a–g). For each drug, we identified the five modules contributing most to its model score. The glipizide example drew on chromium, microbiota, omega-3 fatty acids, pyridoxine, and yam modules. The escitalopram example drew on tyrosine, ephedra, raspberry, ginseng, and magnesium modules. These are traceable feature contributions from the ranking model, not evidence that each listed module explains the drug’s clinical action.
2.6. Prediction Maps Show How the Ranking Can be Inspected
A ranking model is not a causal model. Decomposing its score makes it possible to inspect which drug-target neighborhoods and module features contributed to a prediction, and to generate hypotheses for follow-up experiments.
In Figure 4, we connect the targets of one held-out positive drug per disease to the stable modules that contributed to its ranking and then to disease-related biological programs. The examples are glipizide for type 2 diabetes, escitalopram for depression, tiludronic acid for osteoporosis, and atorvastatin for atherosclerosis/hyperlipidemia. The resulting maps differ across diseases: the osteoporosis example emphasizes bone remodeling, oxidative stress, and hormone-related modules; the depression example emphasizes neurotransmitter, neuroinflammatory, and metabolic-stress modules; the atherosclerosis/hyperlipidemia example emphasizes lipid metabolism, vascular and extracellular-matrix modules, and innate immunity; and the type 2 diabetes example emphasizes glucose metabolism, nutrient sensing, and insulin signaling. These are prediction-evidence maps: they show which features the model used, not which pathways cause disease.
2.7. A Language-Model-Assisted Agent Proposed Candidate Modules
The module library could be updated as new biological findings emerge, but manual gene-set curation takes time. We therefore tested whether a language-model-assisted agent (DeepSeek) could propose gene sets and refine them using benchmark feedback (Figure 5). The agent received a biological concept, proposed a gene set, and received two scores: the change in recall@20 when the set was added to the 117-module nutraceutical panel, and its maximum Jaccard overlap with an existing module. It then used this feedback to produce a second proposal.
We tested seven aging-related concepts from literature published between 2023 and 2026: lysosomal membrane permeabilization (LMP) [16], tissue-resident macrophage (TRM) efferocytosis [17], senescent macrophages, ferroptosis defense, NAD+ salvage metabolism, extracellular-matrix (ECM) stiffening (proposed as a thirteenth hallmark of aging), and clonal hematopoiesis (CHIP).
Most proposals did not improve the benchmark: 12 of 14 (85.7%) had zero or negative changes in recall@20. Two second-round proposals had positive changes: TRM efferocytosis increased from −0.020 to +0.021 (change +0.041 between rounds), and ECM stiffening increased from 0.000 to +0.031. This pattern is consistent with the possibility that feedback can help refine proposals, but two positive examples do not establish that it does so reliably.
Across the 14 proposals, mean maximum Jaccard overlap with existing modules was 0.148; 13 had overlap below 0.3. This suggests that the agent often proposed gene sets that were not highly similar to a single existing set under this overlap measure, even when they did not improve the benchmark. One exception was the second-round NAD+ salvage proposal (Jaccard = 0.444), which overlapped substantially with an existing NUTX:NMN_NR module. This case shows how an overlap score can flag a potentially redundant proposal.

Table 3.
Candidate modules proposed by the agent. Results shown are from round 2.
| Concept | Genes (LCC) | Δrecall@20 | Max Jaccard | Top overlap |
| ECM stiffening | 485 | +0.031 | 0.155 | A1_extracellular_matrix |
| TRM efferocytosis | 113 | +0.021 | 0.066 | A4_macrophage_activation |
| LMP | 136 | −0.020 | 0.196 | A1_autophagy |
| Senescent macrophage | 256 | −0.019 | 0.128 | A3_lipid_metabolism |
| Ferroptosis defense | 55 | −0.040 | 0.076 | nutraceutical panel (highest-overlap module name omitted) |
| NAD+ salvage | 15 | −0.010 | 0.444 | nutraceutical panel (highest-overlap module name omitted) |
| CHIP | 24 | −0.010 | 0.100 | food-as-medicine panel (highest-overlap module name omitted) |
This is an early workflow test, using one language-model provider, two proposal rounds, and seven concepts. The agent did not outperform manual curation. Its current use is operational: the same benchmark can score proposed gene sets and quantify overlap, whether the proposal comes from a person or an AI agent.
We also compared the two positive second-round proposals with 100 random gene sets matched for size, drawn from the STRING largest connected component. Both observed gains exceeded their random-set distributions: ECM stiffening, empirical p = 0.010 (Z = 3.57; null mean −0.006 ± 0.010), and TRM efferocytosis, p = 0.020 (null mean −0.005 ± 0.010). After correcting for the seven concepts, both had q = 0.069, above the usual 0.05 threshold. With 100 random sets and seven tests, the smallest attainable q-value is 0.069, which limits the resolution of this correction. Random sets of the same size as the 485-gene ECM proposal averaged Δrecall@20 = −0.006; none reached +0.031. These findings are preliminary; independent holdout testing is needed before calling either proposal an library improvement.
3. Discussion
This study tests whether a library of biologically organized gene modules can help rank known drugs for known diseases. The answer is yes within the standard cross-validation tasks, but the amount of ranking signal depended on the disease and the panel. Different sources—aging-related modules, TCM proxies, nutraceuticals, and food-as-medicine—ranked best in different settings. The benchmark makes those alternatives comparable and makes it possible to test new modules against the same tasks.
3.1. A Shared Representation, Not One Universal Panel
People often have several interacting conditions, so no single pathway or knowledge source is likely to represent every disease equally well. In our analyses, the full 332-module library ranked first in only 9 of 23 exploratory categories. Hallmark, TCM, nutraceutical, and food-as-medicine panels each ranked first in some categories. Removing a panel could also improve aggregate performance, as occurred for Hallmarks and TCM in the leave-one-paradigm-out test. The practical implication is not that one knowledge tradition replaces another. It is that researchers can compare panels for a specific task instead of assuming that the largest combined feature set is always best.
3.2. What the Benchmark Establishes—And What It Does Not
The primary results measure ranking within disease tasks represented in the benchmark. Under random five-fold splits, panel features recovered known drug–disease labels at useful rates compared with shuffled features. When drugs sharing target families were held out together, recall@20 fell from 0.524 to 0.256 ± 0.024. When a whole disease was held out, performance approached chance. The benchmark therefore supports candidate prioritization for represented tasks; it does not establish transfer to a new disease or a drug’s efficacy in a patient.
The repoDB analysis provides a separate check across databases, but its mean AUROC of 0.688 and disease-specific results remain descriptive. In particular, the atherosclerosis/hyperlipidemia category in repoDB is based on lipid-modifying indications, not a strict atherosclerosis ontology. It should not be read as clinical validation.
3.3. Why the Module Library May Help
A scalar proximity score compresses the relationship between a drug’s targets and a disease-related gene set. The module library keeps several biological dimensions visible, allowing the benchmark to compare panels and inspect which module features support a ranking. Some compact panels performed close to the full library, and different panels performed best in different diseases. This is a useful property for representation research: investigators can ask which organized features add signal, which are redundant, and which may dilute performance in a particular task.
The feature-attribution analyses add a way to inspect model use. They show that the ranking model drew on different modules for different diseases and drugs. However, a coefficient or contribution score describes the model’s calculation; it does not establish that the corresponding module is a disease cause or that changing it would change the disease. The prediction maps are intended to make the ranking auditable and to suggest hypotheses for independent experiments.
3.4. A Benchmark that can Evaluate New Modules
The library is designed to evolve. Researchers can propose a gene set from new findings, score it on the same benchmark, and compare its added value and overlap with existing modules. The language-model-assisted workflow shows that such a proposal-and-scoring loop can be run, but it is not yet an autonomous discovery system: most proposals did not improve recall@20, and the two positive second-round gains did not pass the multiple-testing threshold. The immediate contribution is a common evaluation process, not proof that AI can curate a better library than experts.
3.5. Limits of the Intervention Links
Some gene sets retain provenance links to drugs, nutraceuticals, or food-derived compounds. These annotations are incomplete, may include predicted interactions, and in some cases overlap with the data used to construct the modules. They do not show that an intervention controls a module or that it will produce a beneficial change. Establishing such links would require evidence about direction, dose, tissue exposure, bioavailability, off-target effects, efficacy, and safety.
3.6. Relationship to Virtual Patients and Biomedical World Models
A virtual patient needs both a representation of biological state and a model of how that state changes after an intervention [18,19]. This study addresses the first task: it benchmarks module panels as candidate human-scale representations and evaluates how they rank known drug–disease pairs. It does not learn a transition function or simulate an individual’s response over time. Building those dynamics will require longitudinal data at a suitable scale.
SteeraMed Bench is therefore an early evaluation layer in a broader virtual-patient program [20,21], not a completed virtual patient. Other efforts, including STELLA [22], explore self-evolving agents for biomedical discovery. Our contribution is complementary: a benchmark for comparing and updating the biological coordinates that future models may use.
3.7. Why We Report Recall@k
Drug-repurposing datasets are highly imbalanced: there is roughly one labelled positive for every 70 non-positive drugs. Under this imbalance, AUROC can be strongly influenced by the many negative examples, even though users are usually interested in the highest-ranked candidates [23]. We therefore use recall@k as the primary measure: it reports what fraction of known positive drugs appears near the top of the ranked list. This choice makes the metric closer to the candidate-prioritization task, but does not turn a benchmark ranking into a clinical recommendation.
3.8. Study Limitations
This study has several limits. First, in the full-registry comparison, the 332-feature library was not separable from the degree-matched random-gene-set null (Supplementary S1). This suggests that the useful signal is concentrated in particular panels and tasks rather than uniformly distributed across every library feature. Second, the labelled drug–disease associations are incomplete. Drugs without a matching indication were treated as non-positives for benchmark construction, but some may be unrecorded positives. Robustness checks showed limited sensitivity to negative-pool size, while label-source choice and masking known positives changed performance to some degree. Third, standard cross-validation may place drugs with related targets in both training and test folds; stricter target-family and scaffold splits gave lower performance, and leave-one-disease-out performance was near chance. Fourth, the 23 exploratory categories do not cover all rare diseases or pediatric conditions.
Fifth, TCM and food-as-medicine modules are operational gene-set proxies derived from herb–target or food-compound–target mappings, not validated biological entities. Sixth, the target annotations are incomplete and can overlap with module construction; they do not encode dose, direction, tissue specificity, or therapeutic action. Seventh, the module library is currently curated manually. The agent workflow did not outperform manual curation and covered only seven concepts with one model provider. Finally, the food-as-medicine pipeline needs further validation because the quality of herb- and food-target extraction varies by source; affected modules should be reviewed in future library versions.
3.9. Conclusions
SteeraMed Bench provides a common way to compare biologically organized module panels on drug-repurposing tasks. The panels carried disease-dependent ranking information in within-task evaluation, but their performance decreased under stricter target-separated testing and did not generalize to held-out diseases. The library can therefore support representation comparison and candidate prioritization for diseases with existing therapeutic knowledge; it is not yet a causal intervention model, a cold-start indication-discovery system, or a complete virtual patient. The agent-assisted workflow offers a first way to score proposed additions, which remain provisional until independently validated.
4. Methods
4.1. Overview of the Evaluation Pipeline
The evaluation has five steps. First, we assemble the 332 gene modules from four knowledge sources (Section 4.2). Second, we calculate how close each drug’s targets are to each module on the STRING PPI network, producing a 1,916-drug-by-332-module score matrix (Section 4.4). Third, we train a separate logistic-regression model for each disease using five-fold cross-validation and three random seeds (Section 4.5). Fourth, we evaluate the rankings with recall@k and fold enrichment and compare them with three chance baselines (Section 4.8 and Section 4.9). Fifth, we compare disease-level results and correct for multiple testing where specified (Section 4.10). We use the same steps for each panel and disease category.
4.2. Module Library Construction
These 332 modules come from four knowledge paradigms, each constructed by a distinct pipeline.
Aging-related hallmarks (A series, 72 modules). We expanded the hallmarks-of-aging framework and later updates [14,15] into 72 defined gene modules, drawing on Reactome and MSigDB Hallmark sets. Each gene set contains 50–800 genes. The A series covers five domains: cellular hallmarks (A1, 14 modules; e.g., autophagy, inflammation, senescence and telomere maintenance); organ aging (A2, 36; e.g., brain, heart, kidney, liver and bone); metabolism (A3, 10; e.g., lipid, carbohydrate and purine processes); immune aging (A4, 6; e.g., adaptive and innate immunity, T- and B-cell activation, macrophages and leukocyte migration); and integrative functions (A5, 6; cognition, emotion, blood-cell production, movement, sensation and sleep). We mapped the genes to protein-coding genes represented in the STRING network.
Traditional Chinese Medicine (T series, 38 modules). We built these gene-set proxies by linking a TCM concept to herbs, the compounds in those herbs, and the genes associated with those compounds. The concepts include qi, blood, yin, yang, zang-fu organs and patterns such as phlegm, heat, dampness and stagnation. We matched concepts to herbs using Chinese Pharmacopoeia descriptions and SymMap annotations. BATMAN-TCM linked herbs to PubChem compound identifiers (CIDs); STITCH supplied compound–protein links with a score of at least 200; STRING v12 mapped protein identifiers (ENSP) to gene symbols. To reduce overlap between concepts, we used term frequency–inverse document frequency (TF-IDF), a weighting method that gives less weight to genes appearing in many concept lists. We first removed genes found in more than 80% of TCM terms, then retained the highest-ranked genes for each module. For example, the “tonifying qi” (buqi) set began with 127 herbs whose pharmacopoeia descriptions included qi-tonifying functions (e.g., ginseng, astragalus and licorice). Their 2,847 STITCH compound–target links yielded 312 genes after filtering, with enrichment in immune regulation and energy metabolism pathways. The “clearing heat” (qingre) set contained 268 genes, enriched in anti-inflammatory and antioxidant pathways. These are operational gene-set proxies derived from herb–target databases, not validated biological entities.
Nutraceuticals (NUT, 80 modules). We collected target genes for nutraceutical compounds from DrugBank and supplementary databases. We grouped the targets into gene sets by category, including vitamins, minerals, amino acids, polyphenols and fatty acids. A further 37 extension modules (NUTX) bring the nutraceutical total to 117.
Food-as-medicine (FAM, 105 modules). We took foods from food-composition databases, linked their compounds to protein targets using STITCH, and grouped the target genes into modules. These sets represent database-linked molecular targets of food-derived compounds; they are not evidence that eating a food changes those targets in people.
Final library. Merging and deduplication of the four panels yields 332 unique modules (72 aging hallmarks + 38 TCM + 117 nutraceuticals + 105 food-as-medicine). Gene set sizes range from 839 (A4) to 7,689 (ALL).
4.3. Disease Definitions and drug-disease associations
We used 1,916 small molecules from DrugBank version 5.1.10 (downloaded 2026-01-15). We assigned disease labels using both ATC (Anatomical Therapeutic Chemical) drug-class codes and DrugBank indication text. The code groups were A10 for type 2 diabetes; C02/C03/C07/C08/C09 for hypertension; N06A for depression; M05 for osteoporosis; and C10 for atherosclerosis/hyperlipidemia. A drug counted as a known positive if either its code or indication matched. Drugs without a match were treated as unlabeled non-positives—not as proven ineffective drugs—so this is a positive–unlabeled benchmark. We checked how sensitive results were to these labeling choices. Reducing the non-positive pool to 25%, 50% or 75% of its full size changed the five-disease mean recall@20 by a coefficient of variation of 7.7%. Using code-only versus text-only labels changed mean recall@20 by 0.092; combining both sources performed better than either alone. When we simulated missing labels by hiding 10–30% of known positives, mean recall@20 fell from 0.524 to 0.440 when 30% were hidden. The approximate ratio of known positives to non-positives was 1:70.
4.4. PPI Network and Proximity Scoring
We used the STRING v12 protein-interaction network, retaining links with a confidence score of at least 0.7 (combined score ≥400). Analyses were restricted to its largest connected component (LCC)—the largest group of genes in which every gene can be reached from every other through network links—containing approximately 19,486 nodes. Following Guney et al. (2016) [12], we measured each drug’s proximity to each module by finding, for every drug target, the shortest network path to a module gene and averaging those distances (average shortest path length, ASPL). We used a multi-source breadth-first search (BFS), an algorithm that finds shortest paths outward from a set of starting genes. To judge whether an observed distance was unusually short, we compared it with distances from 30 random target sets matched for network degree (the number of links per gene); degree was matched in bins of 100. We then expressed the observed distance as a z-score:
Here, dreal is the observed average distance from a drug’s targets to a module, while μ(dₙull) and σ(dₙull) are the average and standard deviation of distances from the 30 degree-matched random target sets. The z-score tells us how far the observed distance is from the random-set average, in standard-deviation units. Because shorter paths mean closer network proximity, a more negative z-score means the drug’s targets are closer to the module than expected by chance. Each drug therefore has 332 z-scores, one per module. The min-z baseline reduces these to one value per drug, zmin = minm=1M zm: the strongest (most negative) proximity to any of the 332 modules.
4.5. Supervised Model and Feature Matrix
The input to the model was a matrix with 1,916 rows (one per drug) and 332 columns (one per module). Each value, Xdm, is the z-score measuring how close drug d is to module m; missing values were set to zero. For each disease, we fitted a separate logistic-regression model. This model estimates the probability that a drug has a known indication from its 332 module-proximity scores:
Here, xd is the 332-score input for drug d, w contains the weights learned from the data, and b is the intercept. We used an L2 penalty (C = 0.1), which discourages very large weights; feature-selection analyses instead used an L1 penalty, which can shrink some weights to zero. “One-vs-rest” means that, for each disease, drugs labelled for that disease are compared with all other drugs. We evaluated each model by stratified five-fold cross-validation: drugs were split into five groups while preserving the positive-label proportion as closely as possible, and the process was repeated with three random seeds (42, 123, 456). Each drug’s evaluation score came from a model trained without the fold containing that drug (an out-of-fold prediction). For Table 2, we also compared XGBoost, random forest, gradient boosting and a multilayer perceptron (MLP) using the same folds; the aggregation differs from Table 1, as noted in its caption.
4.6. State and Intervention Representations
Some modules can be linked to candidate interventions because the databases used to build them also list drug, nutraceutical or food-compound targets. These links show what the databases contain, not that a module can be reliably changed by treatment. The target databases (DrugBank and STITCH) are incomplete and may include predicted interactions. NUT and FAM modules also draw on the same target sources used to annotate them, so the apparent match is not independent evidence. A listed target does not tell us whether an intervention raises or lowers a biological process, reaches the relevant tissue, works at a given dose, or is effective and safe. For these reasons, we do not treat the links as a primary result.
4.7. Cross-Validation Schemes
We used four validation splits to test how well rankings carried over to held-out data. (1) In standard five-fold cross-validation, drugs were randomly divided into five groups; each group was tested after training on the other four. We repeated this with three seeds (42, 123, 456). Its recall@20 of 0.524 is the least restrictive, and therefore most optimistic, estimate. (2) In target-cluster cross-validation [24], drugs sharing a DrugBank target family were kept in the same group, so closely related target families could not appear in both training and test sets. Across five seeds, recall@20 was 0.256 ± 0.024 (mean ± SD). (3) In the target-profile split, we grouped drugs by similarity in their target profiles, measured by cosine distance. We clustered 500 sampled drugs using agglomerative clustering (average linkage on precomputed distances), assigned the remaining drugs to the nearest cluster using one-nearest-neighbor (KNN-1), then held out whole clusters in five-fold validation, with three seeds. Unlike target-cluster validation, this split uses measured profile similarity rather than DrugBank family labels. (4) In leave-one-disease-out (LODO) validation, all examples for one disease were held out together to test transfer to a disease absent from training. AUROC was approximately 0.51–0.53, near chance, and recall@20 was near the random-ranking floor. We also ran a bibliographic-order sensitivity check: PubMed reference IDs were used as a rough ordering proxy to assign the earlier 70% of drugs to training and the later 30% to testing. This is not a true time-based validation.
4.8. Evaluation Metrics
We report recall@k and fold enrichment (FE@k). Recall@k asks what share of all known positive drugs appears among the top k ranked drugs. For a list of N drugs containing npos known positives, it is calculated as:
Fold enrichment adjusts for how rare positive drugs are. It is the proportion of positives in the top k divided by the overall proportion of positives in the dataset. A value above 1 means the top-ranked list contains a higher share of positives than a random list of the same size:
Here, π = npos/N is the share of known positives. We calculate recall@20 separately within each held-out fold, ranking only the drugs in that fold, then average across five folds and three seeds. The random-ranking baseline is therefore calculated from each fold’s candidate pool (Nfold), not from all 1,916 drugs at once. Averaged over diseases, folds and seeds, this empirical random floor is 0.031.
4.9. Null Models
We compared the model with three chance baselines. (a) Random ranking: drugs are ranked without using the model; the fold-wise average recall@20 floor is 0.031 (Section 4.8). (b) Shuffled drug–module scores: within each module, we randomly reassigned its z-scores across drugs 200 times. This keeps each module’s score distribution but breaks the link between a drug and its module scores; for the full library, mean recall@20 was 0.032 ± 0.019 across five diseases. (c) Random gene sets: we replaced each real module with a random gene set matched for size and PPI connectivity, repeated 200 times; mean recall@20 was 0.049 ± 0.018. For each panel, excess gain is its observed recall@20 minus the corresponding null result:
Δexcess = recall@20real − recall@20null
For panel-level analyses, we run 200 iterations per panel and report mean ± SD with 95% confidence intervals.
Module contribution analysis. Before fitting a model, we put each module’s scores on a comparable scale: within each fold, we used the training drugs to set the mean to zero and standard deviation to one (StandardScaler), then applied those same values to the held-out drugs. For a given drug, a module’s contribution to the model score is its fitted weight multiplied by that drug’s standardized module score:
cjd = wj · Xdj
Here, Xdj is the standardized proximity z-score for drug d and module j, and wⱼ is the model’s weight for that module. We calculated these contributions across 15 model fits (three seeds × five folds). The raw network z-score is negative when a drug is closer to a module than expected; after standardization, a positive weight means a higher score for that module raises the model’s predicted ranking score. A weight describes how the model uses a feature; it is not a biological activation or inhibition effect.
We report two measures of how consistently a module was used: sign consistency, the fraction of fits in which its weight had the same positive or negative sign; and selection frequency, the fraction of fits in which it ranked among the ten modules with the largest absolute weights. To inspect individual predictions (“prediction anatomy”), we used held-out drugs only and chose, for each disease, the known positive drug with the highest predicted score in its test fold. All these analyses used the same training and test splits as the performance evaluation.
We also report a separate, weaker shuffle in Supplementary S1. Here, each drug keeps the same set of z-scores, but those scores are randomly reassigned among modules. This preserves each drug’s score distribution but removes the module labels. Its five-disease mean baseline is approximately 0.101. We keep it separate and do not use it to calculate the Table 1 excess gains.
4.10. Statistical Tests
For panel comparisons, we used a paired Wilcoxon signed-rank test across the five diseases: for each disease, the two panels’ scores are compared, so the test uses five paired values. We estimated confidence intervals by resampling 1,000 times (bootstrap) and compared observed results with the distributions from the permutation nulls. Where many hypotheses were tested, we used the Benjamini–Hochberg procedure to limit the expected share of false-positive findings among results called significant. Disease-specific “best panel” results are exploratory because selecting the highest-scoring panel can make its performance look better than it is; these rankings were not corrected for that selection.
Training-fold panel selection and combination (exploratory). We used nested cross-validation so that panel choice did not use the data reserved for final testing. In the outer loop, drugs were split into five folds and the procedure was repeated with three seeds (42, 123, 456). Within each outer training set, an inner three-fold split compared five panels (A4, TCM, Hallmarks, NUT and FAM) using recall@20. We selected the best-performing panel, breaking ties in favor of the smaller panel, then added panels one at a time—up to three total—if they improved the inner-fold score. We refit the selected model on the full outer training set and evaluated it once on the untouched outer test fold. The reported total of 75 evaluations is 3 seeds × 5 folds × 5 diseases. Because these evaluations reuse many of the same drugs, differences across folds are descriptive, not independent replications; the reported interval is therefore a descriptive repeated-cross-validation interval, not a conventional independent-sample confidence interval.
Author Contributions
J.X. conceived the study, designed the framework, constructed the module library, performed all experiments and data analysis, and wrote the manuscript. Q.X. contributed to algorithm design. All authors read and approved the final manuscript.
Funding
This research received no external funding.
Data Availability
DrugBank is available at https://go.drugbank.com. STRING is available at https://string-db.org. The module definitions and disease-drug mappings are provided in Supplementary Materials. Analysis scripts and frozen result CSVs, along with module definitions, will be made available at GitHub (https://github.com/DeepoMe/SteeraMed-bench) upon acceptance of the manuscript. A live demo is available at https://steeramed.com/bench. Because DrugBank licensing prohibits redistribution, the release will include pre-computed benchmark matrices (not raw DrugBank data), enabling users to test their own module definitions (e.g., a nutraceutical, a food product, or a custom gene set) against the same drug repurposing benchmark. The module discovery agent code (Section 2.7) supports multiple LLM providers via a pluggable adapter architecture; users provide their own API key.
Acknowledgments
We thank colleagues at DeepoMe Inc. for critical feedback that improved the manuscript.
Conflicts of Interest
J.X. is employed by and holds equity in DeepoMe Inc. Q.X. declares no competing interests.
References
- Kennedy, B.K.; Berger, S.L.; Brunet, A.; et al. Geroscience: linking aging to chronic disease. Cell 2014, 159, 709–713. [Google Scholar] [CrossRef] [PubMed]
- Hopkins, A.L. Network pharmacology: the next paradigm in drug discovery. Nat. Chem. Biol. 2008, 4, 682–690. [Google Scholar] [CrossRef] [PubMed]
- Jumper, J.; Evans, R.; Pritzel, A.; et al. Highly accurate protein structure prediction with AlphaFold. Nature 2021, 596, 583–589. [Google Scholar] [CrossRef] [PubMed]
- Bunne, C.; Roohani, Y.; Rosen, Y.; et al. How to build the virtual cell with artificial intelligence: priorities and opportunities. Cell 2024, 187, 7045–7063. [Google Scholar] [CrossRef] [PubMed]
- Pushpakom, S.; Iorio, F.; Eyers, P.A.; et al. Drug repurposing: progress, challenges and recommendations. Nat. Rev. Drug Discov. 2019, 18, 41–58. [Google Scholar] [CrossRef] [PubMed]
- Barabási, A.-L.; Gulbahce, N.; Loscalzo, J. Network medicine: a network-based approach to human disease. Nat. Rev. Genet 2011, 12, 56–68. [Google Scholar] [CrossRef] [PubMed]
- Santos, R.; Ursu, O.; Gaulton, A.; et al. A comprehensive map of molecular drug targets. Nat. Rev. Drug Discov. 2017, 16, 19–34. [Google Scholar] [CrossRef] [PubMed]
- Stokes, J.M.; Yang, K.; Swanson, K.; et al. A deep learning approach to antibiotic discovery. Cell 2020, 180, 688–702. [Google Scholar] [CrossRef] [PubMed]
- Corsello, S.M.; Nagle, R.T.; Lu, X.; et al. Discovering the anti-cancer potential of non-oncology drugs by systematic viability profiling. Nat. Cancer 2020, 1, 235–248. [Google Scholar] [CrossRef] [PubMed]
- Yıldırım, M.A.; Goh, K.-I.; Cusick, M.E.; Barabási, A.-L.; Vidal, M. Drug-target network. Nat. Biotechnol. 2007, 25, 1119–1126. [Google Scholar] [CrossRef] [PubMed]
- Menche, J.; Sharma, A.; Kitsak, M.; et al. Uncovering disease-disease relationships through the incomplete interactome. Science 2015, 347, 1257601. [Google Scholar] [CrossRef] [PubMed]
- Guney, E.; Menche, J.; Vidal, M.; Barabási, A.L. Network-based in silico drug efficacy screening. Nat. Commun. 2016, 7, 10331. [Google Scholar] [CrossRef] [PubMed]
- Gross, B.; Ehlert, J.; Gladyshev, V.N.; Loscalzo, J.; Barabási, A.-L. Network-driven discovery of repurposable drugs targeting hallmarks of aging. Nat. Aging 2026. [Google Scholar] [CrossRef] [PubMed]
- López-Otín, C.; Blasco, M.A.; Partridge, L.; Serrano, M.; Kroemer, G. The hallmarks of aging. Cell 2013, 153, 1194–1217. [Google Scholar] [CrossRef] [PubMed]
- López-Otín, C.; Blasco, M.A.; Partridge, L.; Serrano, M.; Kroemer, G. Hallmarks of aging: An expanding universe. Cell 2023, 186, 243–278. [Google Scholar] [CrossRef] [PubMed]
- Steinhauser, M.L.; Liu, Y.; Sukoff Rizzo, S.J.; et al. Lysosomes and lysosomal dysfunction in ageing biology. Nat. Cell Biol. 2026. [Google Scholar] [CrossRef] [PubMed]
- Tan, Y.J.; Conley, T.E.; Yao, F.; et al. Restored clearance of senescent neutrophils by tissue-resident macrophages limits organ aging. Science 2026, 393, eaea3075. [Google Scholar] [CrossRef] [PubMed]
- Chen, Z.; Cong, Z.; Jin, Z.; et al. Medical world models in healthcare: foundations, applications, and challenges for trustworthy clinical translation. arXiv 2026, arXiv:2607.25242. [Google Scholar]
- Wang, G.; Yue, J.; Zhang, S.; et al. Towards world models in biomedical research. arXiv 2026, arXiv:2606.05925. [Google Scholar]
- Xiong, J. World models for biomedicine: a steerability framework. Preprints 2026. [Google Scholar] [CrossRef]
- Xiong, J. SteeraMed: a biomedical world model for N-of-1 intervention reasoning across chronic diseases and aging. Preprints 2026. [Google Scholar] [CrossRef]
- Jin, R.; Xu, M.; Meng, F.; et al. STELLA: towards a biomedical world model with self-evolving multimodal agents. bioRxiv 2025. [Google Scholar] [CrossRef]
- Saito, T.; Rehmsmeier, M. The precision-recall plot is more informative than the ROC plot when evaluating binary classifiers on imbalanced datasets. PLoS ONE 2015, 10, e0118432. [Google Scholar] [CrossRef] [PubMed]
- Pahikkala, T.; Airola, A.; Pietilä, S.; et al. Toward more realistic drug-target interaction predictions. Brief. Bioinform. 2015, 16, 325–337. [Google Scholar] [CrossRef] [PubMed]
Figure 1.
SteeraMed Bench compares module panels and evaluates proposed additions. Curated sources—aging-related modules (72), TCM proxies (38), nutraceuticals (117), and food-as-medicine modules (105)—form a library of 332 gene sets. The benchmark compares predefined panels on drug-repurposing tasks. In an exploratory workflow, a language-model-assisted agent proposes gene sets; the benchmark scores each proposal for added ranking value and overlap with existing modules. Five chronic diseases are primary case studies; 23 disease categories provide an exploratory extension. Proposed modules remain provisional until independently validated.
Figure 1.
SteeraMed Bench compares module panels and evaluates proposed additions. Curated sources—aging-related modules (72), TCM proxies (38), nutraceuticals (117), and food-as-medicine modules (105)—form a library of 332 gene sets. The benchmark compares predefined panels on drug-repurposing tasks. In an exploratory workflow, a language-model-assisted agent proposes gene sets; the benchmark scores each proposal for added ranking value and overlap with existing modules. Five chronic diseases are primary case studies; 23 disease categories provide an exploratory extension. Proposed modules remain provisional until independently validated.
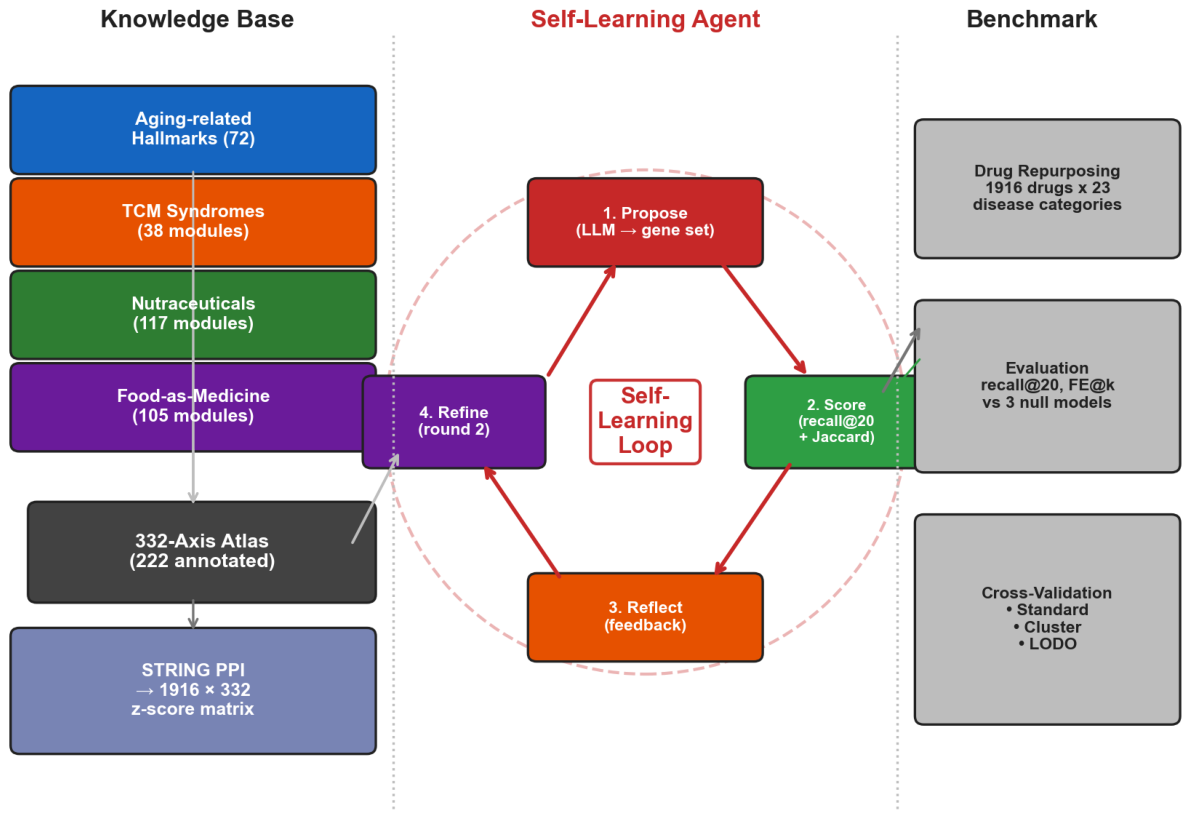
Figure 2.
Panel performance varied across drug-repurposing tasks. (a) Recall@20 across 23 disease categories and five panels. No panel ranked first in every category. (b) Excess recall@20 over the column-permutation null; A4 is the six-module immune panel. (c) Removing Hallmarks or TCM from the full library did not reduce average performance. (d) Classifier comparison on the full library using logistic regression, random forest, gradient boosting, MLP, and XGBoost. (e) The full library ranked first in 9 of 23 categories; category-specific winners are exploratory.
Figure 2.
Panel performance varied across drug-repurposing tasks. (a) Recall@20 across 23 disease categories and five panels. No panel ranked first in every category. (b) Excess recall@20 over the column-permutation null; A4 is the six-module immune panel. (c) Removing Hallmarks or TCM from the full library did not reduce average performance. (d) Classifier comparison on the full library using logistic regression, random forest, gradient boosting, MLP, and XGBoost. (e) The full library ranked first in 9 of 23 categories; category-specific winners are exploratory.
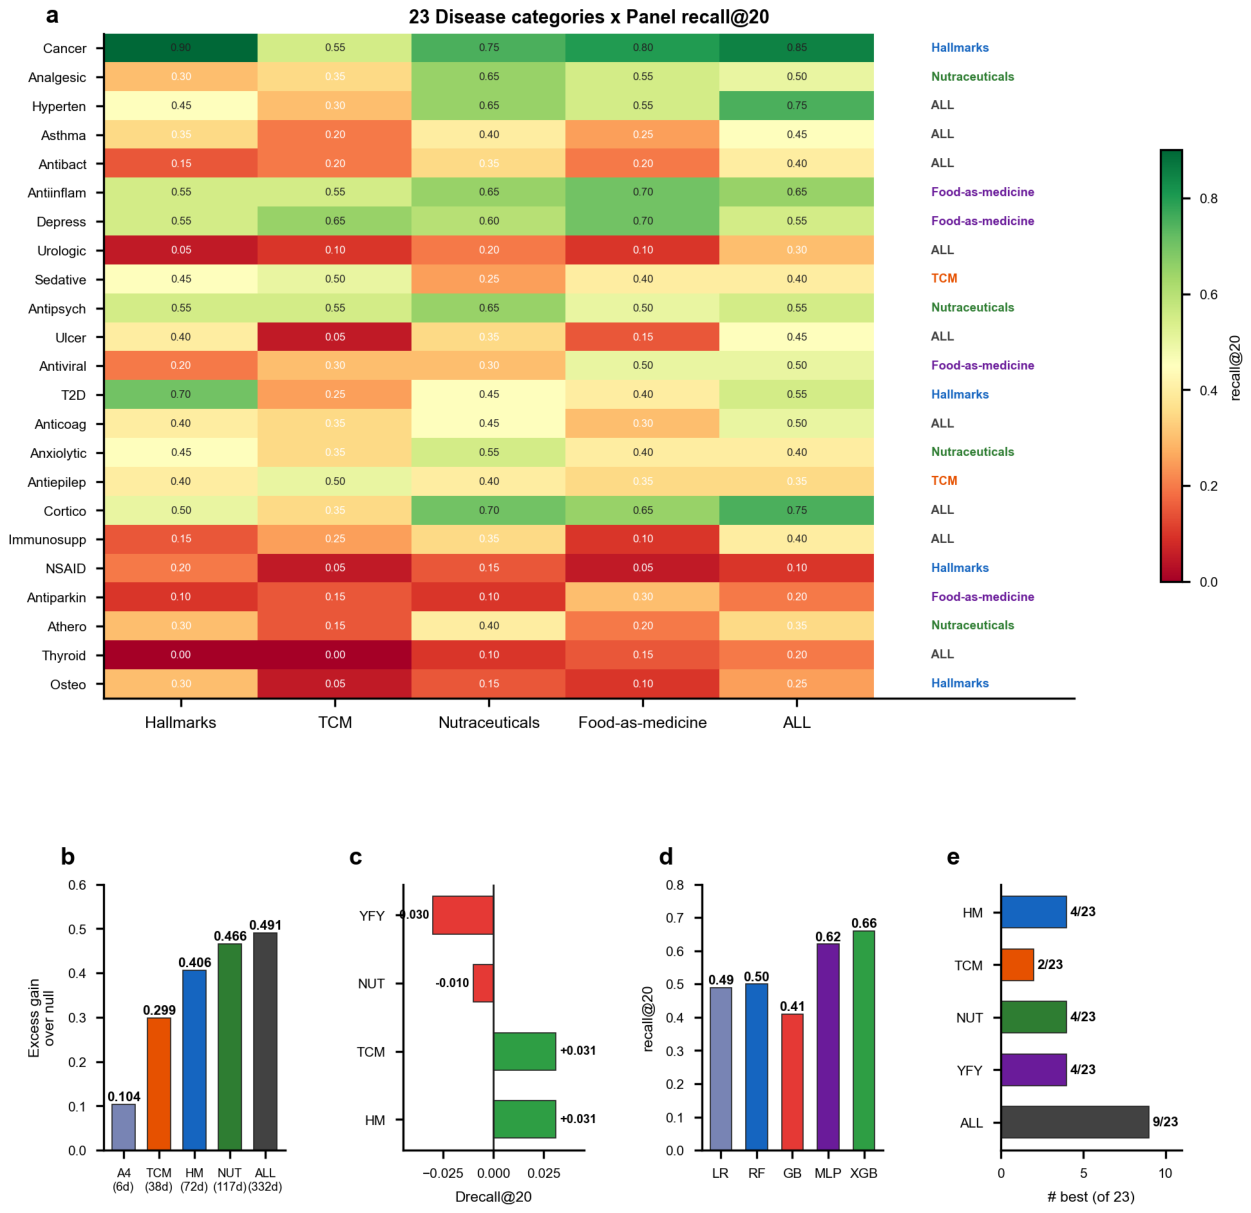
Figure 3.
Which module features contributed to the rankings? (a–d) Modules with stable model coefficients in each disease; sign consistency means that the coefficient kept its direction in more than 80% of 15 folds. Green and red indicate positive and negative model coefficients, not activation or inhibition in biology. (e) Total absolute coefficient size by panel. (f) Two held-out example rankings decomposed into their five largest module contributions. (g) How often modules entered the top ten across folds. This is an attribution analysis of the reference-union model, not a test of causal mechanisms or a replacement for the panel-level analysis.
Figure 3.
Which module features contributed to the rankings? (a–d) Modules with stable model coefficients in each disease; sign consistency means that the coefficient kept its direction in more than 80% of 15 folds. Green and red indicate positive and negative model coefficients, not activation or inhibition in biology. (e) Total absolute coefficient size by panel. (f) Two held-out example rankings decomposed into their five largest module contributions. (g) How often modules entered the top ten across folds. This is an attribution analysis of the reference-union model, not a test of causal mechanisms or a replacement for the panel-level analysis.
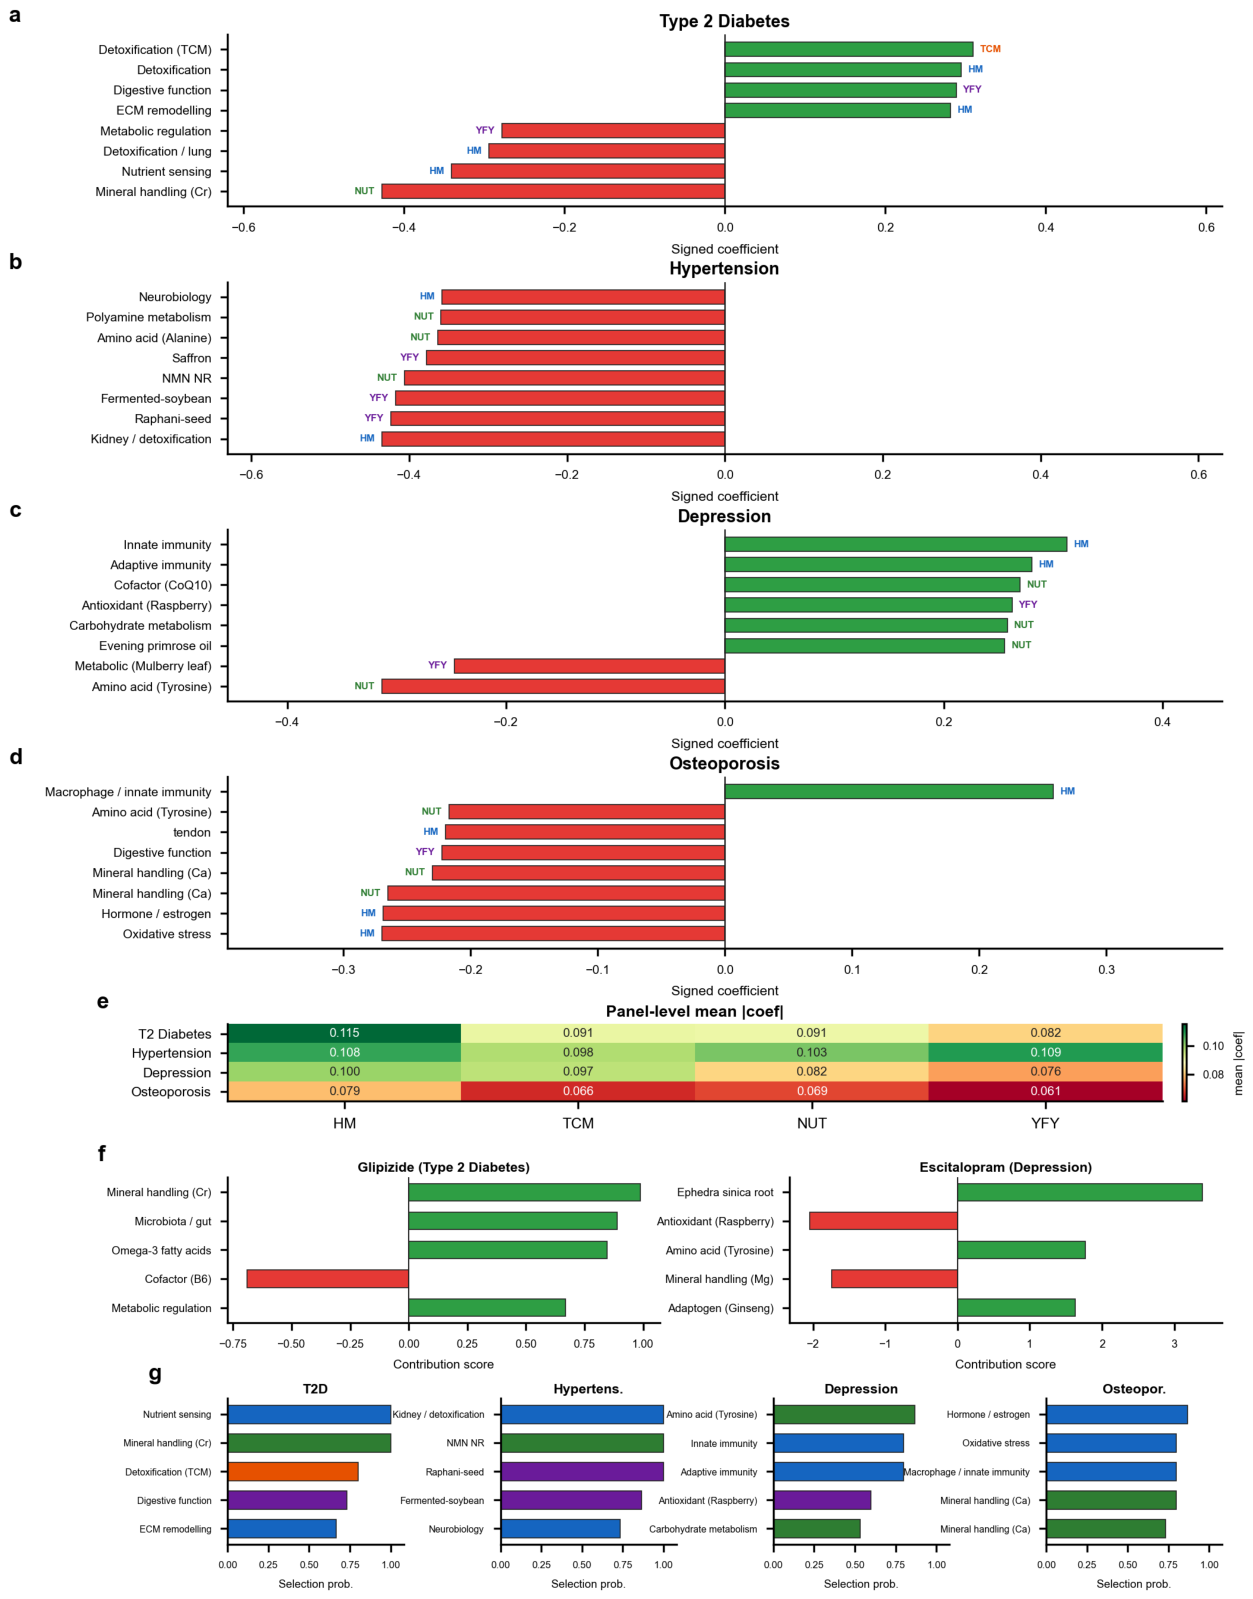
Figure 4.
Prediction-evidence maps connect drug targets, model features, and disease-related programs. Each of four disease examples uses the same three-part layout: a held-out drug and its targets; the stable modules contributing to its ranking; and disease-related biological programs. The examples are glipizide, escitalopram, tiludronic acid, and atorvastatin. Arrows show links used to organize the prediction evidence, not causal pathways.
Figure 4.
Prediction-evidence maps connect drug targets, model features, and disease-related programs. Each of four disease examples uses the same three-part layout: a held-out drug and its targets; the stable modules contributing to its ranking; and disease-related biological programs. The examples are glipizide, escitalopram, tiludronic acid, and atorvastatin. Arrows show links used to organize the prediction evidence, not causal pathways.
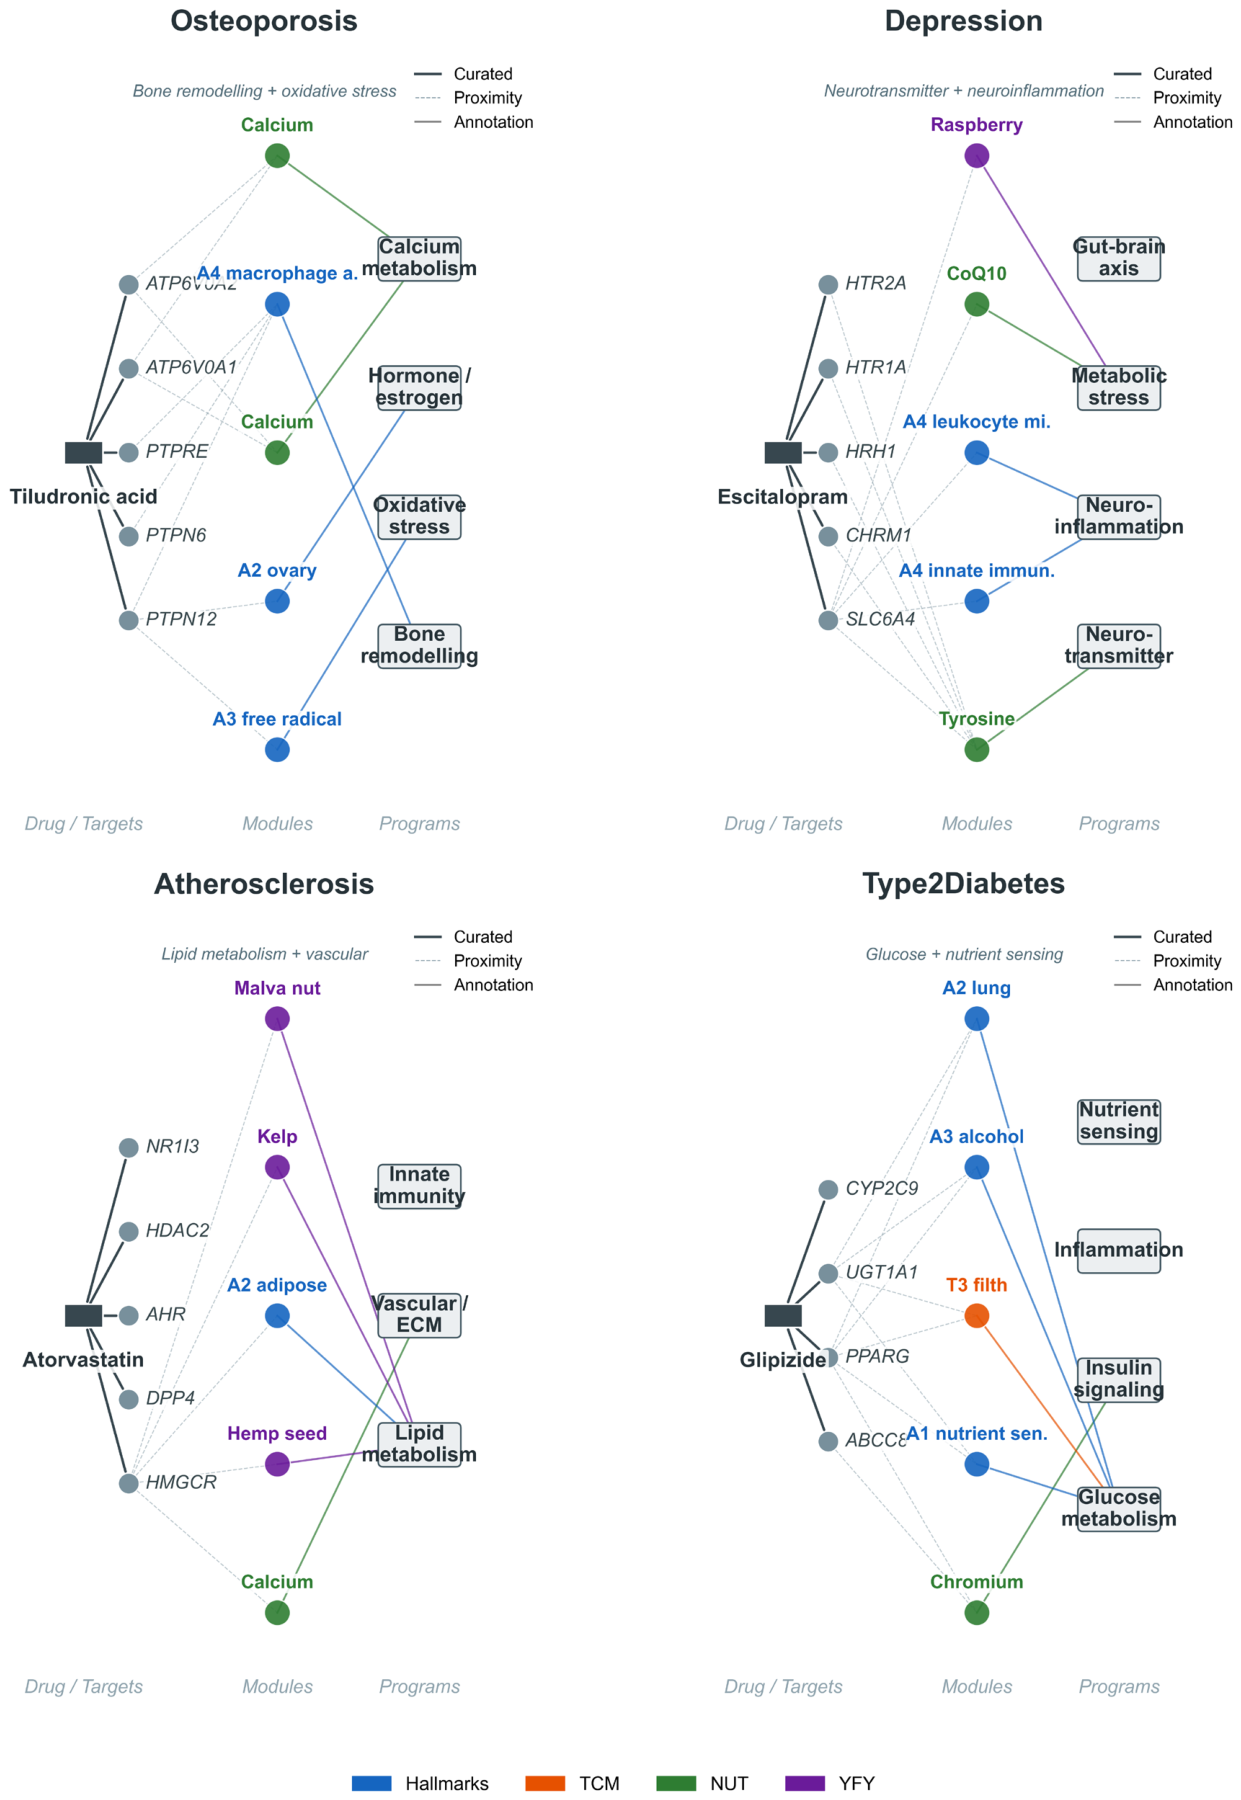
Figure 5.
Screening candidate modules proposed by a language-model-assisted agent. (a) The agent proposes a gene set, receives benchmark scores and overlap information, then revises the proposal. (b) Recall@20 changes for second-round proposals across seven concepts. Two showed nominal positive gains; neither remained significant after correction for testing seven concepts.
Figure 5.
Screening candidate modules proposed by a language-model-assisted agent. (a) The agent proposes a gene set, receives benchmark scores and overlap information, then revises the proposal. (b) Recall@20 changes for second-round proposals across seven concepts. Two showed nominal positive gains; neither remained significant after correction for testing seven concepts.
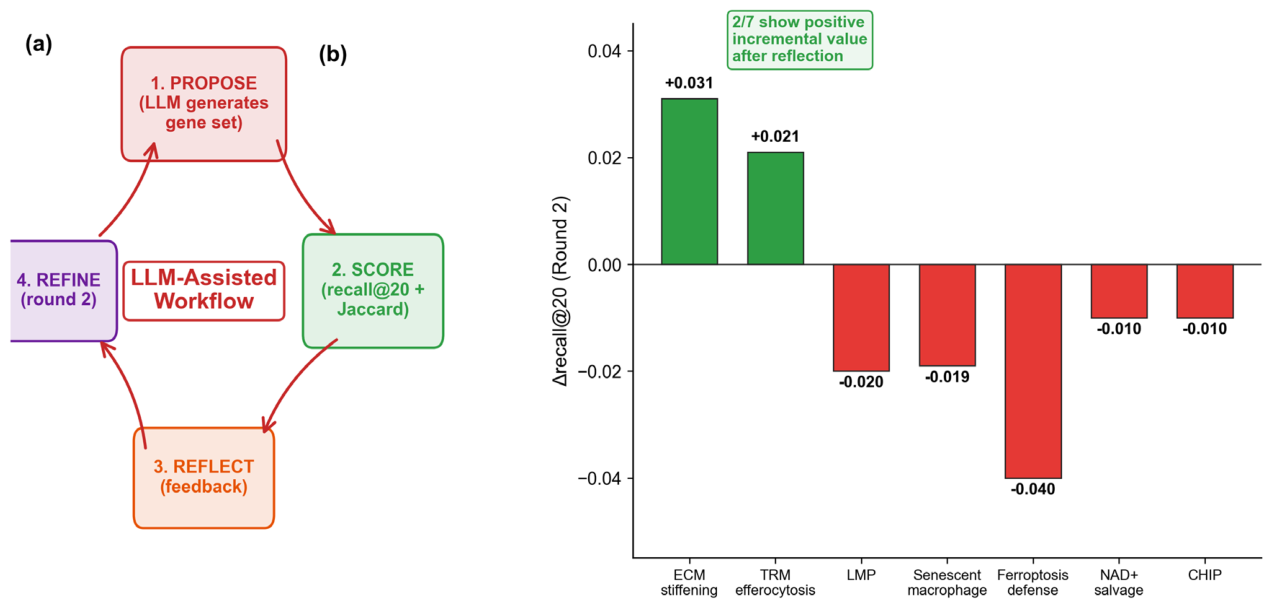
Table 1.
Mean recall@20 across five diseases by panel. The model used five-fold cross-validation with three seeds and 1,916 drugs. “Permutation null” is the mean performance after shuffling drug–module feature columns. “Excess gain” is the observed recall@20 minus the permutation-null recall@20. Confidence intervals are based on 200 permutations.
Table 1.
Mean recall@20 across five diseases by panel. The model used five-fold cross-validation with three seeds and 1,916 drugs. “Permutation null” is the mean performance after shuffling drug–module feature columns. “Excess gain” is the observed recall@20 minus the permutation-null recall@20. Confidence intervals are based on 200 permutations.
| Panel | Dimensions | recall@20 (real) | recall@20 (perm null) | Excess gain | 95% CI |
| A4 immunity (6) | 6 | 0.121 | 0.017 ± 0.013 | 0.104 | 0.091–0.117 |
| TCM proxies (38) | 38 | 0.324 | 0.025 ± 0.017 | 0.299 | 0.282–0.315 |
| Extended aging hallmarks (72) | 72 | 0.433 | 0.027 ± 0.014 | 0.406 | 0.392–0.421 |
| NUT+NUTX (117) | 117 | 0.494 | 0.028 ± 0.016 | 0.466 | 0.450–0.482 |
| Full library / ALL (332) | 332 | 0.524 | 0.032 ± 0.019 | 0.491 | 0.473–0.510 |
Table 2.
Cross-method comparison on the 332-feature library. Five-disease average recall@20. The cross-validation aggregation differs from Table 1, so the values are not directly comparable with the panel-level estimates there.
Table 2.
Cross-method comparison on the 332-feature library. Five-disease average recall@20. The cross-validation aggregation differs from Table 1, so the values are not directly comparable with the panel-level estimates there.
| Method | T2D | Hypertension | Depression | Osteoporosis | Atherosclerosis | Avg |
| LogisticRegression | 0.55 | 0.75 | 0.55 | 0.25 | 0.35 | 0.49 |
| RandomForest | 0.55 | 0.80 | 0.70 | 0.30 | 0.15 | 0.50 |
| GradientBoosting | 0.45 | 0.75 | 0.65 | 0.10 | 0.10 | 0.41 |
| MLP | 0.75 | 0.95 | 0.70 | 0.30 | 0.40 | 0.62 |
| XGBoost | 0.75 | 0.90 | 0.75 | 0.35 | 0.55 | 0.66 |
Disclaimer/Publisher’s Note: The statements, opinions and data contained in all publications are solely those of the individual author(s) and contributor(s) and not of MDPI and/or the editor(s). MDPI and/or the editor(s) disclaim responsibility for any injury to people or property resulting from any ideas, methods, instructions or products referred to in the content. |
© 2026 by the authors. Licensee MDPI, Basel, Switzerland. This article is an open access article distributed under the terms and conditions of the Creative Commons Attribution (CC BY) license (http://creativecommons.org/licenses/by/4.0/).
Copyright: This open access article is published under a Creative Commons CC BY 4.0 license, which permit the free download, distribution, and reuse, provided that the author and preprint are cited in any reuse.