

Submitted:
06 August 2026
Posted:
14 August 2026
You are already at the latest version
Abstract
Collusion is inherently unstable because individual firms have incentives to deviate from cooperative agreements. We study a novel hybrid oligopoly market structure, termed a failed cartel, in which one firm abandons a cartel agreement while the remaining firms continue to coordinate their production decisions. We further reinterpret the Cournot–Stackelberg hybrid structure as a natural punitive benchmark following cartel breakdown, in which the remaining firms abandon cooperation and compete while facing the deviating firm as a common Stackelberg follower. From a game-theoretic perspective, each firm’s quantity choice depends on its own action, its rivals’ actions, and the resulting market state. While simple inverse demand and cost functions permit equilibrium analysis by classical profit maximization, nonlinear specifications used in oligopoly research, such as isoelastic inverse demand, generally do not yield explicit reaction functions or closed-form equilibria. We therefore represent strategic adjustment as an iterative game generated by firms’ reaction mappings: at each stage, firms revise their production quantities in response to the current market configuration. Tripled fixed points of the resulting mapping characterize equilibrium and provide conditions for existence, uniqueness, stability, and convergence of successive quantity adjustments. Numerical comparisons, ranging from an illustrative triopoly to the asymptotic regime with many firms, characterize how the failed-cartel and punitive Cournot–Stackelberg structures differ from classical markets in terms of output, prices, profits, consumer surplus, and total welfare.
Keywords:
collusion
; market equilibrium
; Stackelberg oligopoly
; response functions
; fixed-point theory
MSC: 47H10; 54H25; 46B20; 65D15; 91A10
1. Introduction
Understanding how firms interact strategically has been a central objective of industrial organization since the pioneering work of [11] and [33]. The classical models of oligopoly describe two fundamental modes of competition. In the Cournot framework, firms choose production quantities simultaneously, each treating the outputs of its rivals as fixed, leading to a Nash equilibrium in quantities [11]. In contrast, the Stackelberg model introduces sequential decision making, where leaders anticipate the reactions of followers and exploit their informational advantage to influence market outcomes [33]. These two paradigms remain the cornerstones of oligopoly theory and have generated an extensive literature on market equilibrium, strategic behavior, and welfare analysis [14,35,38].
A second major strand of the literature concerns collusion and cartel formation. Unlike Cournot and Stackelberg competition, where firms maximize individual profits, cartel members coordinate production decisions to maximize joint profits, effectively behaving as a monopolist. The economic implications of collusion are well understood: successful cartels restrict output, increase prices, reduce consumer surplus, and increase aggregate producer profits. These predictions underpin modern antitrust policy and have motivated a large theoretical and empirical literature on cartel stability, incentives to deviate, and enforcement mechanisms [15,18,23,27,34].
A fundamental difficulty with collusion is that cartel agreements are inherently fragile. Since cartel members share monopoly profits while individually benefiting from expanding production, every participant has an incentive to deviate from the agreed allocation. This incentive is central to the theory of repeated games and self-enforcing collusion, where punishment mechanisms are required to sustain cooperation over time [13,15,29]. While the dynamics of cartel formation and stability have been extensively studied, considerably less attention has been devoted to market structures that emerge after collusive agreements partially break down. In particular, relatively little is known about how firms that continue to cooperate interact strategically with firms that defect.
This paper studies precisely this intermediate regime. We introduce a novel hybrid market structure, termed a failed cartel, in which one participant abandons a cartel agreement while the remaining firms continue to coordinate their production decisions. The resulting market is neither fully cooperative nor fully competitive. Instead, it combines elements of monopoly behavior within the surviving cartel with strategic competition from the deviating firm. Such situations naturally arise whenever collusive agreements deteriorate gradually rather than collapsing instantaneously, allowing subsets of firms to preserve coordinated behavior while others pursue independent objectives.
In addition, we reinterpret the classical Cournot–Stackelberg market structure as a natural benchmark for cartel breakdown. Hybrid Cournot–Stackelberg models, in which a subset of firms chooses outputs simultaneously while another firm acts as a Stackelberg follower, have previously been studied as intermediate forms of competition [3,4,24]. Rather than viewing this model solely as a timing game, we interpret it as a punitive miscoordination regime following cartel collapse: after one participant defects, the remaining firms abandon cooperation and compete non-cooperatively while facing the deviating firm as a Stackelberg follower. This interpretation provides a natural benchmark against which the proposed failed-cartel model can be compared.
Our analysis is developed for general oligopoly markets with differentiable inverse demand and cost functions. Rather than relying on explicit analytical solutions, we formulate market equilibrium as a fixed-point problem generated by firms’ reaction mappings. This formulation enables us to apply modern nonlinear fixed-point theory to establish existence, uniqueness, and stability of equilibrium under general nonlinear demand specifications, while simultaneously providing constructive iterative procedures for equilibrium computation.
To illustrate the framework, we first derive closed-form equilibrium solutions for a representative triopoly with linear demand and quadratic costs under Cournot, Stackelberg, Cournot–Stackelberg, cartel, and failed-cartel market structures. We then extend the analysis to oligopolies with nonlinear isoelastic demand, where explicit equilibrium solutions are unavailable. Finally, we investigate the asymptotic behavior of the proposed market structures as the number of firms increases, comparing their implications for equilibrium output, prices, profits, consumer surplus, and total welfare.
The paper contributes to the literature in three ways. First, it introduces the failed-cartel model as a novel hybrid market structure describing partial cartel breakdown. Second, it provides a new economic interpretation of the classical Cournot–Stackelberg model as a punishment benchmark following collusion failure. Third, it develops a unified fixed-point framework for analyzing equilibrium across classical, hybrid, and collusive oligopoly models under general nonlinear demand.
Although the linear oligopoly models considered in this paper admit explicit analytical solutions, this is no longer the case for more general nonlinear demand specifications. In particular, isoelastic inverse demand functions lead to systems of nonlinear equilibrium equations for which closed-form solutions are generally unavailable. This motivates the use of fixed-point methods, which have evolved from the classical Banach contraction principle [7] through coupled and tripled fixed-point theories [8,9,16,19]. In the present paper, the equilibrium problem for the nonlinear model is reformulated within a tripled fixed-point framework, allowing the construction of convergent iterative procedures for computing the equilibrium. Consequently, fixed-point theory is used not merely as an existence technique but also as a practical computational tool for analyzing nonlinear oligopoly models.
The application of tripled fixed-point techniques establishes a direct connection between modern nonlinear analysis and oligopoly theory. Building on recent developments in coupled and tripled fixed points [8,9,16,19,39], the proposed approach extends the analysis beyond the class of models that can be solved analytically and provides a rigorous framework for the existence and numerical approximation of nonlinear market equilibria.
From a game-theoretic perspective, the proposed fixed-point formulation describes an iterative process of strategic adjustment. At each stage, every firm revises its production quantity in response to its own current decision, the quantities selected by its competitors, and the resulting state of the market. In this way, the reaction mappings determine a dynamic game-like procedure whose stationary states coincide with market equilibria. The main fixed-point result does more than establish the existence and uniqueness of such an equilibrium. Under the stated contractive-type conditions, the sequence of successive production adjustments converges to the unique equilibrium from every admissible initial market state. Consequently, the iterative procedure provides computable approximations of the equilibrium quantities, together with a priori and a posteriori error estimates and an explicit rate of convergence. The framework therefore remains applicable even when nonlinear inverse demand and cost functions make closed-form equilibrium calculations unavailable.
When the reaction mappings are defined as genuine profit-maximizing best responses on the admissible strategy sets, their fixed point automatically satisfies the firms’ optimality requirements. In this setting, the maximization property, including the relevant second-order or global optimality conditions, is incorporated into the construction of the reaction mappings rather than verified separately after solving the fixed-point system. Moreover, if the admissible market region is invariant under these mappings, the iteration remains within the feasible domain and converges to the unique equilibrium contained in that region. This avoids a separate examination of possible boundary candidates.
2. Materials and Methods
2.1. Mathematical Preliminaries: Notation and Known Results
2.1.1. Fixed Points for Ordered Triples of Maps
The Banach fixed point concept [7], despite being over 100 years old, has numerous implementations, extensions and generalizations. [16] introduce coupled fixed points, which alter the concept of fixed points. By considering a map of two variables , the notion of a coupled fixed point of F in A is defined as and . [22] explore the fixed points concept in cyclic maps, i.e., and , verses self-maps. Further, [31] investigate maps , , and search sufficient conditions for the existence of an ordered pair so that and , that is, coupled fixed points for cyclic maps of two variables.
Until recently, the proposed sufficient conditions for existence of coupled fixed points for cyclic maps of two variables often result in an ordered pair such that ([9,16]). To overcome this limitation, [39] proposes a modified coupled fixed point for an ordered pair of maps , where , and an ordered pair as a coupled fixed point for provided and .1
The concept of tripled fixed points of three variables evolve similarly. [8,16] consider the ordered triple fulfilling , , and .2[19] consider ordered triples of maps and , , and for . The concept of a tripled fixed point extends to tripled points for that meet the contractive type condition. We will use a simplified version of the main results from [19].
2.1.2. Hardy-Rogers Fixed Point Theorem
Definition 1. ([17,28]) Let be a metric space. A map is called a Hardy-Rogers map if there exist non-negative constants , , such that and for all the following inequality holds:
Therefore, without loss of generality, we may consider Hardy-Rogers maps to satisfy the simplified inequality:
with .
Special cases include:
In the rest of this work, we will assume Hardy-Rogers maps satisfy inequality (2).
Theorem 1. ([17]) Let be a complete metric space and be a Hardy-Rogers map, then:
- 1.
- there is a unique fixed point of T and, moreover, for any initial guess , the iterated sequence for converges to the fixed point ξ;
- 2.
- there holds a priori error estimate: ;
- 3.
- there holds a posteriori error estimate: ;
- 4.
- the rate of convergence is: ,
where and , are the constants from (2).
Proof.
Starting from an arbitrary , define . Applying (2) to and , and collecting the terms containing , gives
Hence . Summation of the resulting geometric series shows that is Cauchy. Completeness provides a point with . Applying (2) to and , and then passing to the limit, yields .
If is another fixed point, (2) gives
Since , it follows that . Finally, summing the tail of the geometric estimate gives the a priori and a posteriori bounds, while applying the contractive estimate to and gives the stated rate of convergence. □
2.1.3. N-tupled Fixed Points
Definition 2. ([1]) Let , be nonempty sets. We will call the ordered n-tuple of maps a semi-cyclic map if for .
Definition 3. ([1]) Let , be nonempty sets and the ordered n-tuple be a semi-cyclic map. An ordered n-tuple is said to be a n-tupled fixed point of if for .
If we get the definition for coupled fixed points from [39]. If moreover we get the definition for coupled fixed points from [9,16]. If we get the definition for tripled fixed points from [19]. If moreover and we get the definition for tripled fixed points from [8]. Let us denote by the permutation . Then if we get the definition for n-tupled fixed point from [30].
Definition 4. ([1]) Let , be nonempty sets and the ordered n-tuple be a semi-cyclic map. For any n-tuple we define , for for all .
A profound observation in [25,26] connects fixed point results with coupled fixed point ones. Indeed, instead of considering the ordered pair of maps , we can define the map by , and will be a coupled fixed point for if and only if it is a fixed point for T. Using this notation. The same notation can be used and for n-tupled fixed points, by identifying them as fixed points for the map T, defined by
where .
2.2. Oligopoly Market
Consider n firms producing quantities and competing in a single market with inverse demand , where and P is continuous and, when necessary, differentiable. Firms have access to different production technologies reflected in their cost functions , . Firms’ profits (payoff functions) are for .
A market structure reflects a firm’s strategic interactions with the other competitors and dictates the conditions of the firm’s decisions. Importantly, market structures can fit different paradigms and result in outcomes that differ in their welfare implications. While much has been said about Stackelberg and Cournot models of competition, hybrid market structures that combine features of stylistic models of competitions have received less attention3.
Below we introduce a couple of hybrid market structures, that of a failed cartel and Cournot-Stackelberg models, which combine the timing and coordination features of stylistic oligopoly models. Our goal is two fold: to enrich the available conceptual toolbox in capturing richer market structures, particularly involving a failed cooperation, and to explore how punitive could be a non-cooperative punishment (as opposed to unstable fully cooperative punishing strategies of the stage game). We first start with a general setup and overview of classical oligopoly paradigms.
2.3. The Cournot Model
In the classical Cournot model, firms act simultaneously and non-cooperatively, i.e., each firm takes the output levels of its competitors as given, and assuming they will not be changed in time, when determining its own production ([11,13,32,37]):
Specifically, firms assume that rivals do not adjust their output in response to its decision. Under these assumptions, the first-order necessary conditions for optimality yield the system:
A Cournot-Nash equilibrium is a vector of outputs that maximizes each firm’s payoff given the output levels of its competitors. Any such equilibrium must satisfy system (3). However, the converse does not necessarily hold: solutions to the first-order system may fail to correspond to profit-maximizing strategies. Therefore, to ensure that a solution of (3) represents an equilibrium additional conditions are required, specifically conditions guaranteeing non-negativity of outputs, uniqueness, sufficiency and other regularity conditions guaranteeing well behaved solutions (vs set-valued correspondences).4
2.4. The Canonical Stackelberg Model
The canonical Stackelberg model (also referred to as the hierarchical Stackelberg model) assumes sequential decision making. For brevity, it will be denoted simply as Stackelberg throughout the tables, figures, and equations. Firm n moves first, firm observes firm n and moves second, and firm observes both previous choices made by players n & . This continues recursively, i.e., if firm has done its move, knowing the choices of firms , then player chooses its response according to the choices of . The last move is done by player 1, who responses by the reaction of all other competitors . We call player 1 a leader, player n a follower.
Below we develop the equilibrium conditions for to build intuition and prepare for an illustration in the section.5 For fixed , firm 3 chooses according to , that is, . We denote the corresponding response of the follower by , i.e., player 3 responses according to the volumes outputs on the market by participants 1 & 2.
Given this response , assuming that, firm 2 knows how the follower acts, maximizes the reduced payoff . Hence firm 2’s first-order condition is . By the chain rule, after a differentiation on we get
We denote the corresponding response of firm 2 by .
Finally, firm 1 maximizes . Thus, the leader’s first-order condition is . Equivalently,
where all partial derivatives of are evaluated at .
We will refer to this model as Case I throughout the manuscript.
2.5. A Cartelled Market
Assume that on the market acting according to price functions P, the cost functions of the n participants are equal, i.e. for , the n producers decide to make a cartel. Therefore they act as like as a monopoly, and dividing the outputs in some percentage between them. Just to simplify the model, we will assume that they divide the monopoly output in equal. Thus we a facing to maximize . This lead to the first order equation
If t is a solution of the above equation then the player decide to produce equal outputs for .
We will not comment at the moment the second order condition, that will ensure that the solution t needs to satisfy in order to maximize the payoff in the market.
2.6. Hybrid market structures
2.6.1. A Failed Cartel
Suppose that there is a cartel agreement, but one of the players, say player n, decide to brake it and chooses to maximize his profit, assuming that the other ones will not change their levels of production. The first players are facing two choices, either to move to the Cournot-Stackelberg model, or to continue working in a cartel structure.
Choice One: If they choose the option to maximize their profits according to Cournot-Stackalberg model, this will be the case from Section 2.6.2.
Choice Two: As far as at the moment , all players have been working according to the cartel agreement, i.e., .
Just to simplify the notations and to fit some of the formulas into the text field if will denote .
The change of player n, by exiting the cartel, leads for him, choosing , because . If the first two producers decide to work in a cartel structure, i.e., trying to maximize profits as a monopoly assuming, they will try to maximize their profit, assuming that player n has a production level . We will follow the assumptions, that the firms have identical cost functions . This leads to the maximization of the total payoff of the first two players:
Let us denote and to maximize . The first order equation will be
2.6.2. Cournot-Stackelberg Model
We also record the first-order conditions for the Cournot-Stackelberg structure. In this case firms 1, 2 to choose their outputs simultaneously, while firm n assumes that the first players are not eager to change their volumes of output and chooses so that to maximize his payoff .
For fixed , firm n chooses according to , that is, .
We denote the follower’s response by
Firms 1, 2 to anticipate this response and maximize the reduced payoffs
Their first-order conditions are for .
By the chain rule,
Hence the Cournot–Stackelberg equilibrium is characterized by
3. Linear Demand: Large-Market Comparative Statics and Asymptotic Results
For an oligopoly with n firms, let , , and , , denote aggregate output, market price, and the output of Firm i, respectively. Superscripts identify the market structure: C denotes Cournot, S canonical Stackelberg, Cournot–Stackelberg, failed cartel, and full cartel coordination. The same convention is used for aggregate output, prices, profits, and individual quantities.
3.1. Equilibrium Formulas for the n-Firm Models
Consider the inverse demand and cost functions and , and let and . In the appendix, we consider a numerical example with concrete choices for A, B, c, M, and .
Proposition 1
(Cournot–Stackelberg equilibrium with leaders). Let Firms be Cournot leaders and Firm n their common follower. Then the follower’s response is
For , the symmetric equilibrium quantities and aggregate output are
The corresponding price is .
Proof.
Assume that firms act simultaneously in a Cournot-type reduced game, while firm n is the follower. Denote . For fixed , the follower solves
The first-order condition gives . Hence the follower’s response is
By symmetry among the leaders, we look for an equilibrium of the form . Then . The reduced first-order condition for each leader gives
In the particular case , we have , and therefore
The follower’s output is . Thus the total output is
The corresponding market price is . For , this gives and , which coincides with the Cournot-Stackelberg values computed above. □
Proposition 2
(Cartel equilibrium with n firms). If all n firms form a cartel and divide the monopoly output equally, then
For , these formulas reduce to
The corresponding price is .
Proof.
Assume now that all n firms form a cartel and divide the monopoly output equally. If Q is the total cartel output, then each firm produces , and the cartel maximizes
That is,
The first-order condition is . Therefore,
For , this becomes . Thus each firm produces
The cartel price is . For , this gives and , which is exactly the cartel value obtained in the triopoly case. □
Proposition 3
(Failed-cartel equilibrium with one deviating firm). Let Firms coordinate their quantities, while Firm n deviates and selects its best response. For , the equilibrium quantities and aggregate output are
and
The corresponding price is .
Proof.
Finally, assume that firms continue to behave as a cartel, while firm n deviates and chooses its best response. We again denote by x the common output of the cooperating firms: . The deviating firm solves
Its first-order condition gives
The cooperating firms maximize their joint profit
For , the deviating firm’s response is . Solving the first-order condition for the cooperating firms gives
The deviating firm’s output is . Hence the total output is
Equivalently,
The market price is . In the context of the numerical example with , we obtain and . Therefore , which coincides with the failed-cartel values computed above. □
3.1.1. Ordering of Equilibrium Quantities
Proposition 4
(Ordering of individual equilibrium quantities). Let , , and . For the first firm,
whereas for the last firm,
Proof.
The individual-output orderings used in the comparative discussion follow from the explicit formulas above.
For , the cartel and Cournot quantities are
In the Cournot–Stackelberg case,
In the failed-cartel case,
We first compare the first participant. Since and , all denominators are positive. Moreover,
and
Thus, for , one obtains . The canonical Stackelberg benchmark gives the largest first-player quantity, as follows from the backward-induction formulas of the canonical model [6]. Hence
We next compare the last participant. Again, since and , all comparisons reduce to comparisons of positive fractions. We have
and
The last inequality holds for . Therefore, for the non-canonical structures,
In the canonical Stackelberg benchmark [6], the last participant produces less than in the Cournot-Stackelberg benchmark but more than under the symmetric cartel allocation. Therefore,
□

Table 1.
Total quantities, market prices, and aggregate profits in the Cournot-Stackelberg, cartel, and failed-cartel models.
Table 1.
Total quantities, market prices, and aggregate profits in the Cournot-Stackelberg, cartel, and failed-cartel models.
| Cournot-Stackelberg | Cartel | Failed Cartel | |||||||
|---|---|---|---|---|---|---|---|---|---|
| n | Total Profit | Total Profit | Total Profit | ||||||
| 2 | 324720 | 14760 | 3463935840 | 247968 | 18598 | 3843008064 | 324720 | 14760 | 3463935840 |
| 3 | 390320 | 11480 | 3202506720 | 265680 | 17712 | 4117508640 | 356924 | 13150 | 3625978683 |
| 4 | 432065 | 9393 | 2884902748 | 275520 | 17220 | 4270008960 | 371952 | 12398 | 3714907795 |
| 5 | 460966 | 7948 | 2596114915 | 281782 | 16907 | 4367054618 | 380653 | 11963 | 3770264144 |
| 6 | 482160 | 6888 | 2348504928 | 286117 | 16690 | 4434240074 | 386327 | 11680 | 3807895514 |
| 7 | 498367 | 6078 | 2138698259 | 289296 | 16531 | 4483509408 | 390320 | 11480 | 3835100640 |
| 8 | 511162 | 5438 | 1960537355 | 291727 | 16410 | 4521185958 | 393283 | 11332 | 3855671462 |
| 9 | 521520 | 4920 | 1808218080 | 293646 | 16314 | 4550930602 | 395568 | 11218 | 3871765267 |
| 10 | 530077 | 4492 | 1676926959 | 295200 | 16236 | 4575009600 | 397385 | 11127 | 3884697501 |
3.2. Aggregate Output and Price Effects
The explicit equilibrium formulas also allow a systematic comparison of the five market structures as the number of firms increases. The main distinction is between cooperation and competition. Cartel coordination restricts production, whereas informational hierarchy expands output. The Cournot, Cournot–Stackelberg, and failed-cartel structures naturally interpolate between these two extremes.
For every fixed number of firms, there holds .
Figure 1 illustrates this ordering for increasing market size. The cartel consistently produces the smallest aggregate output, whereas the canonical Stackelberg model generates the largest. The failed-cartel and Cournot–Stackelberg structures remain intermediate cases, reflecting different degrees of competition following cartel breakdown.
The comparison of individual outputs reveals two distinct patterns. For the first participant, , whereas for the last participant, .
These inequalities, established in SubSection 3.1.1, show that the strategic role of a firm determines how it benefits from market organization. Informational hierarchy favors the leading firms, whereas the failed-cartel regime provides the greatest advantage to the deviating participant.
Because higher aggregate production implies lower prices, the ordering of equilibrium prices is exactly the reverse of the output ordering: .
Figure 2 therefore illustrates the same competitive mechanism from the consumers’ perspective. Stronger competition reduces prices, whereas stronger coordination increases them through output restriction.
Aggregate profits satisfy .
Figure 3 shows that producer profits increase with the degree of coordination. The cartel maximizes aggregate profit, whereas the canonical Stackelberg model yields the lowest producer surplus. The failed-cartel structure again occupies an intermediate position, preserving part of the gains from cooperation despite the strategic deviation of one participant.
Overall, the five market structures illustrate the fundamental trade-off between competition and coordination. Informational hierarchy expands production, lowers prices, and improves consumer outcomes, while cooperation restricts output and increases producer profits. The failed-cartel model bridges these two mechanisms, providing a natural intermediate regime between full collusion and non-cooperative competition.
3.3. Asymptotic Behavior
The explicit formulas derived for the n-player models make it possible to compare the long-run behavior of the five market structures. Although the output of each firm converges to zero in the Cournot, Cournot–Stackelberg, canonical Stackelberg, and cartel models, the deviating firm in the failed-cartel model retains a positive limiting output. Aggregate production, prices, and market concentration approach different limiting values. These outcomes reflect the persistent effects of informational hierarchy and cooperative behavior, even in very large markets.
Figure 4 shows that the ordering of aggregate output remains unchanged for all market sizes. The canonical Stackelberg model consistently generates the highest production levels, whereas the cartel yields the lowest output. The Cournot, Cournot–Stackelberg, and failed-cartel regimes occupy intermediate positions and converge to distinct asymptotic limits.
Figure 5 demonstrates that all five models converge rapidly to their limiting equilibria. Consequently, the asymptotic formulas accurately describe the market already for a moderate number of firms.
Since the normalized price satisfies
the comparison of aggregate output immediately determines the asymptotic price behavior.
As illustrated in Figure 6, the price ordering is exactly the reverse of the output ordering. More competitive market structures generate lower equilibrium prices, whereas stronger coordination increases prices by restricting production.
The next comparison concerns the distribution of production among firms.
Figure 7 compares the asymmetry of individual production levels. As expected, the Cournot and cartel models remain perfectly symmetric, whereas the canonical Stackelberg model exhibits the greatest output inequality. The failed-cartel and Cournot–Stackelberg structures again represent intermediate regimes.
Finally, we examine market concentration using the Herfindahl–Hirschman index
Figure 8 confirms that informational hierarchy leads to greater market concentration by creating persistent differences between firms, while the symmetric Cournot and cartel structures remain the least concentrated. The failed-cartel model occupies an intermediate position, illustrating that partial cooperation preserves part of the concentration created by collusion without reaching the fully coordinated cartel outcome.
Overall, the asymptotic analysis shows that the qualitative differences between the five market structures do not disappear as the market expands. Instead, informational hierarchy and cooperative coordination continue to produce distinct patterns of output, prices, asymmetry, and market concentration, demonstrating that these effects are structural rather than finite-market phenomena.
3.4. Asymptotic Market Shares and Output Ratios
The explicit equilibrium formulas also permit a complete asymptotic comparison of the considered market structures. The following results summarize their long-run behavior.
Theorem 2
(Asymptotic aggregate output). The aggregate equilibrium outputs satisfy
and
Proof.
For , the explicit formulas are
Dividing the numerator and denominator of each expression by n gives the stated limits for the Cournot, Cournot–Stackelberg, failed-cartel, and cartel models. The backward-induction formula for the canonical Stackelberg model gives . Hence , completing the proof. □
Corollary 1.
The limiting aggregate outputs satisfy
Proof.
The preceding theorem gives the five limiting values , , and M. Since , one has , which proves the asserted ordering. □
Proposition 5
(Relative aggregate-output ratios). The limiting aggregate-output ratios satisfy
Proof.
All denominators have strictly positive limits after normalization. Therefore, the quotient rule for limits and the preceding theorem yield
These are precisely the four stated ratios. □
Proposition 6
(Asymptotic leader outputs). The limiting leader-output ratios satisfy
Proof.
For the first firm,
Thus , , , and . The canonical Stackelberg formula likewise gives . Dividing the corresponding normalized limits proves all four ratios. □
Proposition 7
(Asymptotic follower outputs). The limiting follower-output ratios satisfy
Proof.
The last-firm outputs satisfy
Consequently,
The canonical Stackelberg formula gives . The first, second, and fourth ratios now follow by division. Since , whereas , the third ratio tends to zero. □
Proposition 8
(Asymptotic leader–follower asymmetry). The leader–follower asymmetry satisfies
Proof.
In the Cournot model symmetry gives for every n. For the Cournot–Stackelberg model, the explicit formulas give
Finally, the canonical Stackelberg limits and imply . □
Theorem 3
(Asymptotic classification of the market structures).
As ,
whereas
Consequently, the Cournot, Cournot–Stackelberg and canonical Stackelberg models become asymptotically equivalent with respect to aggregate production, but remain fundamentally different in terms of the distribution of production among firms.
Proof.
The aggregate-output ordering is the corollary proved above. The three asymmetry limits are given by the preceding proposition, and . Combining these two conclusions proves the classification. □
Theorem 4
(Asymptotic market shares). The Cournot–Stackelberg leaders asymptotically produce the whole market output, . For the failed-cartel model, , and .
Proof.
For the Cournot–Stackelberg model,
Since and , the ratio tends to one. In the failed-cartel model,
Moreover,
Dividing by gives the last limit . □
The previous results show that the limiting ratios are structural characteristics of the considered market organizations. The outputs of the individual firms vanish in all benchmark models, whereas the deviating firm in the failed-cartel model retains the positive limiting output . In particular, the hierarchical Stackelberg and Cournot–Stackelberg structures asymptotically attain the same aggregate production, whereas the failed-cartel and cartel models preserve only two thirds and one half of this level, respectively. At the firm level, informational hierarchy generates persistent leader advantages, while the failed-cartel model assigns one quarter of its limiting aggregate output to the deviating firm.
4. Main Results
4.1. A Fixed-Point Framework for Nonlinear Oligopoly Models
The explicit formulas derived in the previous sections rely heavily on the linear inverse demand function and the quadratic cost structure. Under these assumptions, the equilibrium conditions can be solved analytically, allowing a complete comparison of the considered market organizations. However, many economically relevant models involve nonlinear demand or cost functions for which the first-order optimality conditions become highly nonlinear systems without closed-form solutions. In such situations, the classical optimization approach is often insufficient for establishing the existence, uniqueness, or approximation of equilibrium points. The purpose of this section is to overcome these limitations by reformulating the equilibrium problem as a fixed-point problem. This approach makes it possible to analyze a much broader class of oligopoly models and provides a unified framework for proving existence, uniqueness, stability, and iterative approximation of equilibrium quantities.
4.1.1. Limitations of Explicit Optimization Methods
It may be difficult or even impossible to solve the first-order conditions explicitly, both in the Cournot model and in the Stackelberg framework. For instance, if the inverse demand function is given by
for , then explicit closed-form expressions for the response functions generally cannot be obtained. This model has been investigated using a payoff-maximization approach in [2] and through response functions in [20].
As pointed out in [12], under suitable sufficient conditions, response functions may nevertheless exist as implicitly defined functions. However, even when firms are rational and payoff functions are differentiable, the resulting response functions do not necessarily correspond to profit-maximizing behavior.
This situation may arise, for example, when market participants base their decisions on perceived or approximated price functions that differ from the true market demand. In such cases, firms respond optimally to their own models of the market rather than to the actual market environment. As commonly assumed in oligopoly theory, each participant’s response depends on its own production level as well as on the production levels of competing firms.
Consequently, at any moment, each player formulates a response to the current market configuration and to competitors’ observed behavior. For example, in a triopoly market, if at iteration n the output vector is and the Cournot model is adopted, then a simultaneous adjustment of strategies may be described by the iterative scheme
In the Stackelberg framework, and in particular in Case I, the adjustment process reflects the underlying informational hierarchy. In this case, the follower updates its output according to
the first leader then responds by incorporating the follower’s reaction,
and finally the second leader updates its production level based on the anticipated responses of both preceding players,
Analogous iterative schemes can be constructed for the Cournot–Stackelberg case in the three-player setting. Their precise form reflects the corresponding informational assumptions and is developed in Section 4.2.
4.1.2. Mixed Tripled Fixed Points
Definition 5.
Let , , be metric spaces and set . Let also , , be mappings. A mapping is called admissible if it has one of the following architectures:
(1) Canonical:
(2) Cournot-Stackelberg:
The mapping was introduced in [6] to study market equilibrium in the canonical Stackelberg model.
Definition 6.
Let be any admissible map from Definition 5, with . For , define the summing metric by
The architecture-dependent short-hands are
Definition 7.
Let , , be nonempty sets and let for be given mappings. Let be any admissible map from Definition 5, that is, . A point is called a mixed tripled fixed point of the ordered triple of maps (with respect to the architecture ) if and only if it is a fixed point of , i.e.,
Definition 8.
Let , , be nonempty sets and let for be given mappings. Let be any admissible map from Definition 5, that is, . We say that the admissible map satisfies the local triple cross symmetry property at the point if the following hold: , , and .
Theorem 5.
Let , , be complete metric spaces, and let be mappings. Suppose that there exists an index such that one of the admissible maps from Definition 5 satisfies the following:
There exist non-negative constants such that , and for all there holds the inequality
where and .
Then the following statements hold for this particular admissible map :
- 1.
- There exists a unique such that . In particular, is the unique mixed tripled fixed point of in the architecture determined by .
- 2.
- For any initial point , the Picard iteration converges to .
- 3.
-
Let . Then, for all , the following hold:
- A priori estimate:
- A posteriori estimate:
- Rate of convergence: ,
where and for .
If in addition , , and the admissible map satisfies the local triple cross symmetry property at the mixed tripled fixed point , then we can conclude .
The particular case for was proved in [6].
Proof.
Let . We equip X with the metric
Since each is complete, the product space is complete.
For the admissible map selected in the theorem, the contractive condition (4) states that
where and . Thus is a Hardy–Rogers type contraction on . Since , the Hardy–Rogers fixed-point theorem gives a unique fixed point such that . Moreover, for every initial point , the Picard iteration , , converges to .
The error estimates follow directly from the Hardy–Rogers theorem with
It remains to prove the symmetry conclusion. Assume that , , and that satisfies the local triple cross-symmetry property at . Let
Because is a fixed point of , we have . By local triple cross-symmetry, . Therefore,
and hence . Moreover,
Applying the contractive condition (4) to and gives
Since and , this becomes
But , because . Therefore . Thus , and hence . □
4.2. Equilibrium Characterization of the Cournot–Stackelberg Model
We now apply the general framework of the preceding section by recasting the first-order optimality conditions (6) as a tripled fixed-point problem for the Cournot–Stackelberg model. The corresponding construction for the canonical Stackelberg model was developed in [6].
4.2.1. The Cournot–Stackelberg Model
Let , , and be the payoff functions of the three firms. In the Cournot-Stackelberg model, Firms 1 and 2 act in a Cournot-type interaction while anticipating the response of the follower, Firm 3.
Instead of solving the first-order optimality equations directly, we reformulate the equilibrium problem as a tripled fixed point problem.
For Firm 3, the follower, the first-order condition is equivalent to
Assume that there exists an explicit or implicit differentiable function satisfying the first-order equation (5) for Firm 3.
Firms 1 and 2 anticipate the follower through the substitution and consider the reduced payoffs
and
Players 1 and 2 act in the Cournot model in the reduced game. Thus the system of first-order equations
is equivalent to
Therefore, in the case of rational players with differentiable payoffs and Cournot-Stackelberg timing, the maximization problem can be viewed as a problem of mixed tripled fixed points for the map
A tripodal Cournot-Stackelberg equilibrium satisfies
If the responses of the three players satisfy the assumptions in Theorem 5, then there is a unique market equilibrium in the Cournot-Stackelberg model.
Theorem 6.
In a Cournot-Stackelberg tripodal market, an ordered triple is a solution of the system of first-order equations (6) if and only if it is a tripled fixed point for the response function .
Proof.
Suppose first that solves the system of first-order equations (6). Then
Therefore, by the definitions of , we obtain , , and . Hence , so is a tripled fixed point of .
Conversely, suppose that is a tripled fixed point of . Then , which means , , and . Using the definitions of , we obtain
Thus solves the system of first-order equations (6). □
Abstracting for a moment from the second-order sufficient conditions for the solutions of (6), Theorem 6 guarantees that a triple solves the first-order system if and only if it is a fixed point of the corresponding response map.
Corollary 2.
Let us consider a tripodal market satisfying:
- 1.
- The three players produce a homogeneous good that is a perfect substitute across firms.
- 2.
- Firm i can produce quantities from the set , where each is a closed, nonempty subset of .
- 3.
- There exists a closed set and maps , , such that for every , where is given by (7).
- 4.
-
There exists such that, for all and in D,where .
Then there exists a unique fixed point of , that is, .
The sequence of successive productions for , converges to for every initial market state .
If, in addition, and satisfies the local triple cross-symmetry property at , namely , , and , then
Proof.
Each is a closed subset of , hence complete, and the closed subset D of is complete under . Condition (8) states that is a contraction with constant . The Banach contraction principle therefore gives a unique fixed point , and the Picard iteration converges to it from every initial state in D.
Under the additional cross-symmetry assumption, the cyclic permutation is also a fixed point of . Uniqueness implies , and hence . □
5. Application to an Isoelastic Oligopoly Model
The fixed-point reformulation can be carried out for all three Stackelberg architectures discussed above. Because the derivations are analogous under the unified notation, we present only the Cournot–Stackelberg case in detail.
The response functions of all players in a simplified hierarchical Stackelberg model with n participants were investigated in [6]. Rather than repeating analogous calculations, we use the present application to show that the fixed-point approach also applies when the classical explicit method used in [6] is not available.
5.1. Fixed-Point Reformulation
We follow the isoelastic Cournot oligopoly framework of [2] and use the response-function/fixed-point viewpoint discussed in [20] to rewrite the equilibrium conditions as a tripled fixed point problem.
Corollary 3.
Let us consider the isoelastic Cournot-Stackelberg tripodal market from Section 5.1. Assume that:
- 1.
- The three firms produce a homogeneous good with total output and inverse demand
- 2.
- The firms have symmetric linear marginal costs with parameter , and their profit functions are
- 3.
- Firms 1 and 2 interact in a reduced Cournot game, while Firm 3 is the follower. The follower response is described by
- 4.
- The follower output is implicitly defined by .
- 5.
-
The leader response functions are given bywhere for .
- 6.
-
There exists a closed set such thatfor every .
- 7.
- On the economically relevant region one has , and satisfies
Then the map has a unique fixed point , that is,
Moreover, for every initial market state , the sequence for converges to .
Consequently, represents the unique market equilibrium of the isoelastic Cournot-Stackelberg oligopoly model in the considered region.
Proof.
Consider three firms producing a homogeneous good, with total output and inverse demand with .
Assume symmetric linear marginal costs with , so that the profits for each player are
We investigate this model under the Cournot-Stackelberg structure, where firms 1 and 2 interact in the reduced Cournot game and firm 3 is the follower.
After differentiation the follower gets the response map
The follower equilibrium condition is the fixed point equation or equivalently .
Assuming is implicitly defined from , we have the identity .
Differentiating the last equality (with x fixed) with respect to y gives
Hence
where .
The leaders, players 1 and 2, have to maximize their payoff functions and , respectively. Differentiation with respect to y yields
i.e.,
where . Equivalently,
where .
The last equality is equivalent to
Using (10) and the identity , we obtain
Therefore, the response function for player two is
and by symmetry we set .
From (9) it follows .
Let us put .
Hence we can write the response function for players 1 and 2 as
where .
Assume that the economically relevant region is bounded, so that .
Let us also assume that and define
Assume that on the region.
Let us denote . By the mean-value theorem, we get
Thus
Write . Using (12) gives us
Hence
By symmetry, the same estimate holds for .
For the map we obtain
Thus is a contraction whenever
A sufficient bound is , so by (12) it is enough that
Under this condition, Corollary 2 yields a unique fixed point of , which represents the unique market equilibrium in this model. □
5.2. Numerical Illustration: Implicit Follower Resolution and Convergence
We provide a numerical illustration of the tripled fixed-point reformulation in Section 5.1. The leader maps were derived by implicit differentiation along the follower’s decision, with . Thus, in the numerical procedure the follower output is computed implicitly as , rather than treated as an independent free variable.
We choose , , , and work on an economically relevant region where . The condition for all is equivalent to
Under this condition, on , and therefore
The contraction factor for satisfies
For , we obtain and . Moreover, , and the computed iterates remain in the admissible region. Hence the assumptions of the contraction argument are consistent with the numerical trajectory.
Let us denote the outputs of leaders 1 and 2 by and . The follower chooses as a solution of . Taking , we obtain the following sequence of successive productions.
The iterates stabilize rapidly. The limiting equilibrium quantities are approximately , , and . The corresponding price is . Since , the equilibrium features a positive markup . The firms’ equilibrium profits are
with total industry profit . The percentage shares of the three producers at equilibrium are and . Thus, the leader firms produce slightly more than the follower at equilibrium.
Figure 9 illustrates the firm-level convergence in the Cournot-Stackelberg benchmark. Firms 1 and 2 remain symmetric throughout the iteration, while firm 3 converges to a lower follower output.
Remark 1.
The isoelastic specification is often written with . By rescaling output via , and measuring costs in the same price units, one obtains . Thus, the numerical quantities reported above are normalized output levels, scaled so that the contractive condition on the response function is satisfied.
For comparison, we also report the corresponding Cournot, cartel, and canonical Stackelberg trajectories under the same isoelastic specification and parameter values.
5.2.1. Cournot Benchmark
The Cournot iteration converges to the symmetric equilibrium , with . The corresponding price is , and the equilibrium profits are symmetric: .
Figure 10 shows the firm-level Cournot trajectory. Since the Cournot benchmark is symmetric, all three firms follow the same output path.
A noteworthy observation follows from Table 3 and Table 2. In the isoelastic case considered here, the Cournot–Stackelberg structure generates a larger aggregate output than the Cournot equilibrium:
Thus, the production-expanding effect of the Cournot–Stackelberg organization is preserved in this numerical example.
Table 2.
Cournot–Stackelberg iteration for the isoelastic model with under the symmetry condition .
| i | ||||
|---|---|---|---|---|
| 0 | 0.800000 | 0.800000 | 0.743254 | 2.343254 |
| 1 | 0.822116 | 0.822116 | 0.738648 | 2.382880 |
| 2 | 0.832025 | 0.832025 | 0.736353 | 2.400403 |
| 3 | 0.836120 | 0.836120 | 0.735364 | 2.407604 |
| 4 | 0.837750 | 0.837750 | 0.734964 | 2.410464 |
| 5 | 0.838388 | 0.838388 | 0.734806 | 2.411582 |
| 6 | 0.838637 | 0.838637 | 0.734744 | 2.412018 |
| 7 | 0.838733 | 0.838733 | 0.734720 | 2.412187 |
| 8 | 0.838771 | 0.838771 | 0.734711 | 2.412253 |
| 9 | 0.838785 | 0.838785 | 0.734708 | 2.412278 |
| 10 | 0.838791 | 0.838791 | 0.734706 | 2.412288 |
| ⋮ | ⋮ | ⋮ | ⋮ | ⋮ |
| 28 | 0.838794 | 0.838794 | 0.734705 | 2.412293 |
Table 3.
Cournot iteration for the isoelastic model with .
| i | ||||
|---|---|---|---|---|
| 0 | 0.800000 | 0.800000 | 0.800000 | 2.400000 |
| 1 | 0.736408 | 0.736408 | 0.736408 | 2.209223 |
| 2 | 0.752974 | 0.752974 | 0.752974 | 2.258922 |
| 3 | 0.750409 | 0.750409 | 0.750409 | 2.251228 |
| 4 | 0.750886 | 0.750886 | 0.750886 | 2.252657 |
| 5 | 0.750799 | 0.750799 | 0.750799 | 2.252398 |
| 6 | 0.750815 | 0.750815 | 0.750815 | 2.252445 |
| 7 | 0.750812 | 0.750812 | 0.750812 | 2.252436 |
| 8 | 0.750813 | 0.750813 | 0.750813 | 2.252438 |
| 9 | 0.750813 | 0.750813 | 0.750813 | 2.252438 |
| 10 | 0.750813 | 0.750813 | 0.750813 | 2.252438 |
| ⋮ | ⋮ | ⋮ | ⋮ | ⋮ |
| 28 | 0.750813 | 0.750813 | 0.750813 | 2.252438 |
This reversal illustrates that the relationship between informational hierarchy and market output is not universal but depends crucially on the curvature of the demand function.
Under a linear inverse demand function, the strategic advantage enjoyed by the leaders tends to increase total production because the follower reacts aggressively to the leaders’ output choices. As a result, Stackelberg-type structures typically generate larger aggregate quantities than the corresponding Cournot equilibrium.
When the inverse demand function becomes nonlinear, however, the situation changes. The marginal revenue effects induced by additional production become stronger, and the leaders internalize these effects when anticipating the follower’s reaction. Consequently, the leaders may find it optimal to restrain production more aggressively than in the linear-demand setting. The reduction in the leaders’ outputs is not fully compensated by the follower, leading to a lower aggregate quantity.
Therefore, Table 4 suggests that the output-enhancing effect of informational leadership is sensitive to the shape of the demand function. While canonical structures generally redistribute production toward better-informed firms, they do not necessarily increase total market output. In the present nonlinear setting, the curvature of demand dominates the informational advantage, causing the Cournot equilibrium to produce a larger aggregate quantity than the Cournot–Stackelberg outcome.
5.2.2. Cartel Benchmark
We also report the successful-cartel benchmark corresponding to Section 2.4. In this case, firm 3 acts as a Stackelberg leader, while firms 1 and 2 form a cartel and choose equal quantities . For a fixed leader output z, the cartel maximizes , and the cartel response satisfies . In the isoelastic model with linear costs,
The cartel iteration is initialized at the same market state as the other isoelastic benchmarks, . From the next step onward, the quantities are projected onto the cartel-consistent path . Since the isoelastic cartel benchmark is pushed toward the lower admissible boundary, the projected iteration approaches .
The projected cartel iteration approaches , , and . The corresponding price is . The equilibrium profits are and . Thus, the cartel benchmark produces the lowest admissible total output and the highest price among the reported isoelastic benchmarks.
Table 4.
Projected cartel iteration for the isoelastic model with .
| i | ||||
|---|---|---|---|---|
| 0 | 0.800000 | 0.800000 | 0.800000 | 2.400000 |
| 1 | 0.373501 | 0.373501 | 1.557304 | 2.304306 |
| 2 | 0.375706 | 0.375706 | 1.490693 | 2.242105 |
| 3 | 0.376629 | 0.376629 | 1.448417 | 2.201675 |
| 4 | 0.377016 | 0.377016 | 1.421362 | 2.175395 |
| 5 | 0.377179 | 0.377179 | 1.403954 | 2.158313 |
| 6 | 0.377248 | 0.377248 | 1.392714 | 2.147210 |
| 7 | 0.377277 | 0.377277 | 1.385439 | 2.139993 |
| 8 | 0.377289 | 0.377289 | 1.380723 | 2.135302 |
| 9 | 0.377294 | 0.377294 | 1.377664 | 2.132252 |
| 10 | 0.377297 | 0.377297 | 1.375677 | 2.130270 |
| ⋮ | ⋮ | ⋮ | ⋮ | ⋮ |
| 28 | 0.377298 | 0.377298 | 1.371995 | 2.126591 |
Figure 11 illustrates the projected cartel trajectory. The iteration starts from the same initial state as the other isoelastic benchmarks. From the next step onward, firm 3 produces the larger quantity, while firms 1 and 2 move together as cartel members.
5.2.3. Canonical Stackelberg Benchmark
Finally, we report the canonical Stackelberg benchmark. This case is included only as a comparison of trajectories. With the same parameters, the iteration leaves the economically relevant contraction region after a few steps.
The canonical iteration behaves differently from the Cournot, Cournot-Stackelberg, and cartel benchmarks. With the same parameters, the total output leaves the contraction region after a few steps. Indeed, the admissible lower bound is , whereas the canonical trajectory reaches . By the twenty-eighth iteration, total output has fallen to . Thus, under the same numerical assumptions, the canonical benchmark is not covered by the contraction argument used above, and we report the trajectory only as a comparison of the induced dynamics.
Figure 12 displays the canonical Stackelberg trajectory. Unlike the Cournot and Cournot-Stackelberg benchmarks, this trajectory leaves the admissible contraction region under the same parameter values.
Figure 13 summarizes the total-output trajectories across all isoelastic benchmarks.
The comparison of Tables 4–7 reveals that the ranking of the market structures is not invariant with respect to the choice of the inverse demand and cost functions. While the cartel outcome consistently generates the smallest aggregate quantity, the relative positions of the Cournot, Cournot-Stackelberg, and canonical Stackelberg models change across the four specifications.
Table 5.
Canonica Stackelberg iteration for the isoelastic model with .
| i | ||||
|---|---|---|---|---|
| 0 | 0.743254 | 0.800000 | 0.800000 | 2.343254 |
| 1 | 0.743254 | 0.822116 | 0.628114 | 2.193484 |
| 2 | 0.753535 | 0.777543 | 0.528456 | 2.059534 |
| 3 | 0.753548 | 0.730094 | 0.447263 | 1.930905 |
| 4 | 0.745820 | 0.679790 | 0.377901 | 1.803510 |
| 5 | 0.731079 | 0.626980 | 0.318074 | 1.676133 |
| 6 | 0.709672 | 0.572554 | 0.267010 | 1.549236 |
| 7 | 0.682103 | 0.517854 | 0.224321 | 1.424277 |
| 8 | 0.649242 | 0.464442 | 0.189456 | 1.303140 |
| 9 | 0.612334 | 0.413792 | 0.161518 | 1.187644 |
| 10 | 0.572836 | 0.367020 | 0.139350 | 1.079206 |
| ⋮ | ⋮ | ⋮ | ⋮ | ⋮ |
| 28 | 0.111254 | 0.050921 | 0.022454 | 0.184629 |
A first important observation is that the ordering of total outputs is stable only at the extremes. In all considered cases, the cartel produces the lowest aggregate quantity, whereas the more competitive structures generate substantially larger outputs. However, the relative ranking of the Cournot and Cournot-Stackelberg models is not preserved. In some specifications the Cournot-Stackelberg structure produces more than the Cournot equilibrium, while in others the opposite occurs. This indicates that the output-enhancing effect of informational leadership depends strongly on the curvature of the demand and cost functions.
A second observation concerns the distribution of production among participants. The inequalities for the first participant (follower) and for the last participant (leader) are not identical across the four settings. In some cases informational leadership generates a substantial increase in the leader’s quantity, while in other cases this effect is considerably weaker. Similarly, the quantitative disadvantage of the follower depends on the underlying functional forms. Consequently, informational asymmetry affects not only aggregate output but also the distribution of market shares.
The third observation is that changes in the ranking originate from the interaction between two competing forces. On the one hand, informational advantages tend to increase production by the leading firms. On the other hand, nonlinear demand and nonlinear costs may induce stronger strategic output restraint. Depending on which effect dominates, a canonical market structure may either increase or decrease aggregate production relative to the Cournot benchmark.
From an economic perspective, Tables 4–7 suggest that the strategic architecture of the market cannot be analyzed independently of the technological and demand environment. The same informational structure may lead to different welfare and output rankings when the demand function or the cost function changes. Therefore, conclusions obtained for linear demand and linear costs should not automatically be transferred to nonlinear environments.
6. Discussion
The results presented in this paper provide a unified comparison of five representative triopoly market structures, ranging from fully non-cooperative competition to complete cooperation and intermediate hybrid regimes. The comparison shows that the market outcome is determined not only by the degree of coordination among firms but also by the underlying informational structure.
The numerical analysis confirms the expected ordering of the classical Cournot, Stackelberg, and cartel models. The Cournot equilibrium serves as a natural benchmark for symmetric non-cooperative competition, the canonical Stackelberg model intensifies competition through sequential decision making, and the cartel represents the opposite extreme by maximizing aggregate industry profit at the expense of consumers. The Cournot–Stackelberg model consistently occupies an intermediate position, illustrating how partial informational hierarchy modifies the equilibrium without reaching the full effect of the canonical Stackelberg structure.
The failed-cartel model exhibits qualitatively different behavior. Although one firm abandons the cartel agreement, the remaining firms continue to coordinate their decisions. Consequently, the market outcome remains substantially closer to the cartel equilibrium than to the fully competitive benchmark. The numerical results demonstrate that partial coordination preserves a significant portion of the cartel’s profitability while simultaneously creating a strong individual incentive for unilateral deviation. This dual effect explains why failed cartels may remain economically relevant even after cooperative agreements begin to collapse.
The computational study with an isoelastic inverse demand function further demonstrates that the proposed methodology is not restricted to linear models. While explicit analytical solutions are generally unavailable in this setting, the equilibrium can still be computed through iterative procedures supported by the fixed-point framework developed in the theoretical part of the paper. This suggests that the approach can be extended to considerably more general oligopoly models in which classical analytical techniques become intractable.
Several directions for future research naturally arise from the present work. Possible extensions include oligopolies with an arbitrary number of firms, multiple deviating cartel members, heterogeneous production costs, alternative demand specifications, dynamic adjustment processes, and incomplete information. These problems appear particularly suitable for further investigation by combining game-theoretic equilibrium analysis with fixed-point methods.
7. Conclusions
This paper presented a unified analysis of five representative triopoly market structures: the Cournot equilibrium, the canonical Stackelberg model, the Cournot–Stackelberg model, the cartel, and the failed-cartel regime. Closed-form equilibrium solutions were obtained for the linear inverse demand model with quadratic production costs, allowing a systematic comparison of equilibrium quantities, prices, profits, consumer surplus, and total welfare.
The results demonstrate how both informational hierarchy and partial coordination influence market performance. While the classical Cournot, Stackelberg, and cartel models represent well-known benchmark market organizations, the Cournot–Stackelberg and failed-cartel structures provide intermediate regimes that capture more realistic patterns of competition. In particular, the failed-cartel model shows that partial cooperation may preserve a substantial share of cartel profitability even after one firm abandons the agreement, whereas the Cournot–Stackelberg model illustrates how partial informational hierarchy leads to outcomes between simultaneous and fully sequential competition.
The paper also extends the analysis to an isoelastic inverse demand function, where explicit analytical solutions are generally unavailable. By employing an iterative procedure motivated by the fixed-point framework developed in the theoretical part of the paper, equilibrium quantities can still be computed, demonstrating that the proposed methodology remains applicable beyond the linear setting.
Overall, the developed framework provides a flexible approach for analyzing hybrid oligopoly structures that combine cooperation and hierarchy. The obtained results suggest several natural directions for future research, including markets with heterogeneous firms, multiple deviating cartel members, dynamic adjustment processes, and more general nonlinear demand and cost functions.
Author Contributions
The mentioned authors participated equally to the study and are arranged in alphabetical order as follows: conceptualization, methodology, investigation, writing—original draft preparation, writing—review and editing: A.B., V.I., D.N., M.P., and B.Z. All authors have read and agreed to the published version of the manuscript.
Data Availability Statement
The original contributions presented in the study are included in the article; further inquiries can be directed to the corresponding author.
Acknowledgments
The third author is partially supported by the Bulgarian National Science Fund under Grant No. KP-06-H92/6. The fifth author is partially supported by the Bulgarian National Science Fund (BNSF), Grant number KP-06-N92/1.
Conflicts of Interest
The authors declare no conflicts of interest.
Appendix A. Linear Triopoly: Equilibrium and Welfare Comparisons
We will consider the illustrative example from [6]. This example, although, a simplified one will present some ideas for the market dynamics, when initial agreements are not followed. We will illustrate first with just 3 players.
Example A1.
We consider a triopoly market with linear demand and quadratic costs. Let x, y, and z denote the output levels of the three firms. The inverse demand function is We use the linear inverse demand , where , and the symmetric cost function .
Consider the market in Example A1. Let , , and . The payoff functions are
Appendix A.1. Cournot Benchmark
By [6], the Cournot equilibrium is symmetric. The Cournot equilibrium is symmetric, with . At this point, , and the market price is .
Appendix A.2. Equilibrium in the Canonical Stackelberg Model
The equilibrium production levels are , , .6 The corresponding profits are , , and . The market price is .
Appendix A.3. Equilibrium in the Cournot-Stackelberg Model
In the Cournot-Stackelberg case, Firms 1 and 2 act in a Cournot-type reduced game while Firm 3 is the follower. For fixed x and y, the follower solves
Hence the follower’s response function is
Firms 1 and 2 anticipate this response and maximize the reduced payoff functions for .
Thus the first-order conditions of the reduced Cournot game are
Solving this system gives . Substituting into the follower’s response gives .
Therefore, the total output in the market is , market price is , the corresponding profits are and .
Appendix A.4. Cartel Equilibrium
Suppose now that the three firms form a cartel and act as a monopolist. Since the firms are symmetric, the monopoly output is divided equally among them:
where t denotes the total market production.
The cartel maximizes the total profit .
Using the data from Example A1, , , we obtain
Hence and the first-order condition is
which gives .
Therefore, . The market price is . The profit of each firm is . The total market profit is .
Appendix A.5. Equilibrium in the Failed Cartel Case
Assume now that the cartel agreement collapses because player 3 deviates and chooses his output strategically, while firms 1 and 2 continue to cooperate and behave as a cartel.
For fixed , the third firm solves . Using the payoff functions from Example A1, we obtain
Hence the follower’s response function is .
Since firms 1 and 2 remain in a cartel agreement, they choose equal outputs . Substituting gives .
The joint profit of firms 1 and 2 is .
Since
the market price becomes .
Therefore, . The first-order condition is
Thus . The follower’s production is . Hence the total output equals . The market price is .
The profits of firms 1 and 2 are . The profit of firm 3 is . The total market profit is .
As we have discussed, there are two choices for a failed cartel. The first choice leads to the Cournot-Stackelberg model. Therefore we will not distinguish between Cournot-Stackelberg model and a failed cartel that reduces to the mentioned structure. The only difference is the if a failed cartel turns the a Cournot-Stackelberg model, the initial start in the market will be at the levels for and for the classical Cournot-Stackelberg we do not need the initial outputs in the market to satisfy .
Appendix A.6. Comparative Analysis of the Equilibrium Outcomes
Table A1 and Table A2 summarize the equilibrium outcomes under the five market structures. Table A1 reports the equilibrium quantities, aggregate output, and market price, whereas Table A2 presents the corresponding individual and aggregate profits. Throughout this section, denotes the total market output and P the corresponding equilibrium price.
Table A1.
Equilibrium quantities and market prices in the triopoly market. For readability, decimal digits have been omitted.
Table A1.
Equilibrium quantities and market prices in the triopoly market. For readability, decimal digits have been omitted.
| Model | x | y | z | Q | P |
|---|---|---|---|---|---|
| Cournot | 123984 | 123984 | 123984 | 371952 | 12398 |
| Case I | 151200 | 133920 | 111600 | 396720 | 11160 |
| Case II | 137760 | 137760 | 114800 | 390320 | 11480 |
| Cartel | 88560 | 88560 | 88560 | 265680 | 17712 |
| Failed cartel | 112713 | 112713 | 131498 | 356924 | 13150 |
The five market structures exhibit distinct economic characteristics. The cartel produces the lowest aggregate output and the highest market price, whereas the canonical Stackelberg model generates the highest output and the lowest price. The Cournot equilibrium lies between these extremes, while the Cournot–Stackelberg and failed-cartel structures represent intermediate regimes arising from informational hierarchy and partial cooperation, respectively.
Table A2.
Individual and total profits in the triopoly market.
| Model | ||||
|---|---|---|---|---|
| Cournot | 1152902419 | 1152902419 | 1152902419 | 3458707257 |
| Case I | 1115856000 | 1046183040 | 934092000 | 3096131040 |
| Case II | 1107039360 | 1107039360 | 988428000 | 3202506720 |
| Cartel | 1372502880 | 1372502880 | 1372502880 | 4117508640 |
| Failed cartel | 1164547898 | 1164547898 | 1296882887 | 3625978683 |
The profit distribution reflects the strategic organization of the market. The Cournot and cartel models remain symmetric, whereas the Stackelberg and failed-cartel structures introduce asymmetry through leadership and strategic deviation. In particular, the deviating firm in the failed-cartel regime captures the largest individual profit, while the cooperating firms still benefit from partial coordination.
Figure A1.
Firm-level outputs in the linear-demand example. Blue: Cournot. Orange: Case I. Green: Case II. Red: cartel. Purple: failed cartel.
Figure A1.
Firm-level outputs in the linear-demand example. Blue: Cournot. Orange: Case I. Green: Case II. Red: cartel. Purple: failed cartel.
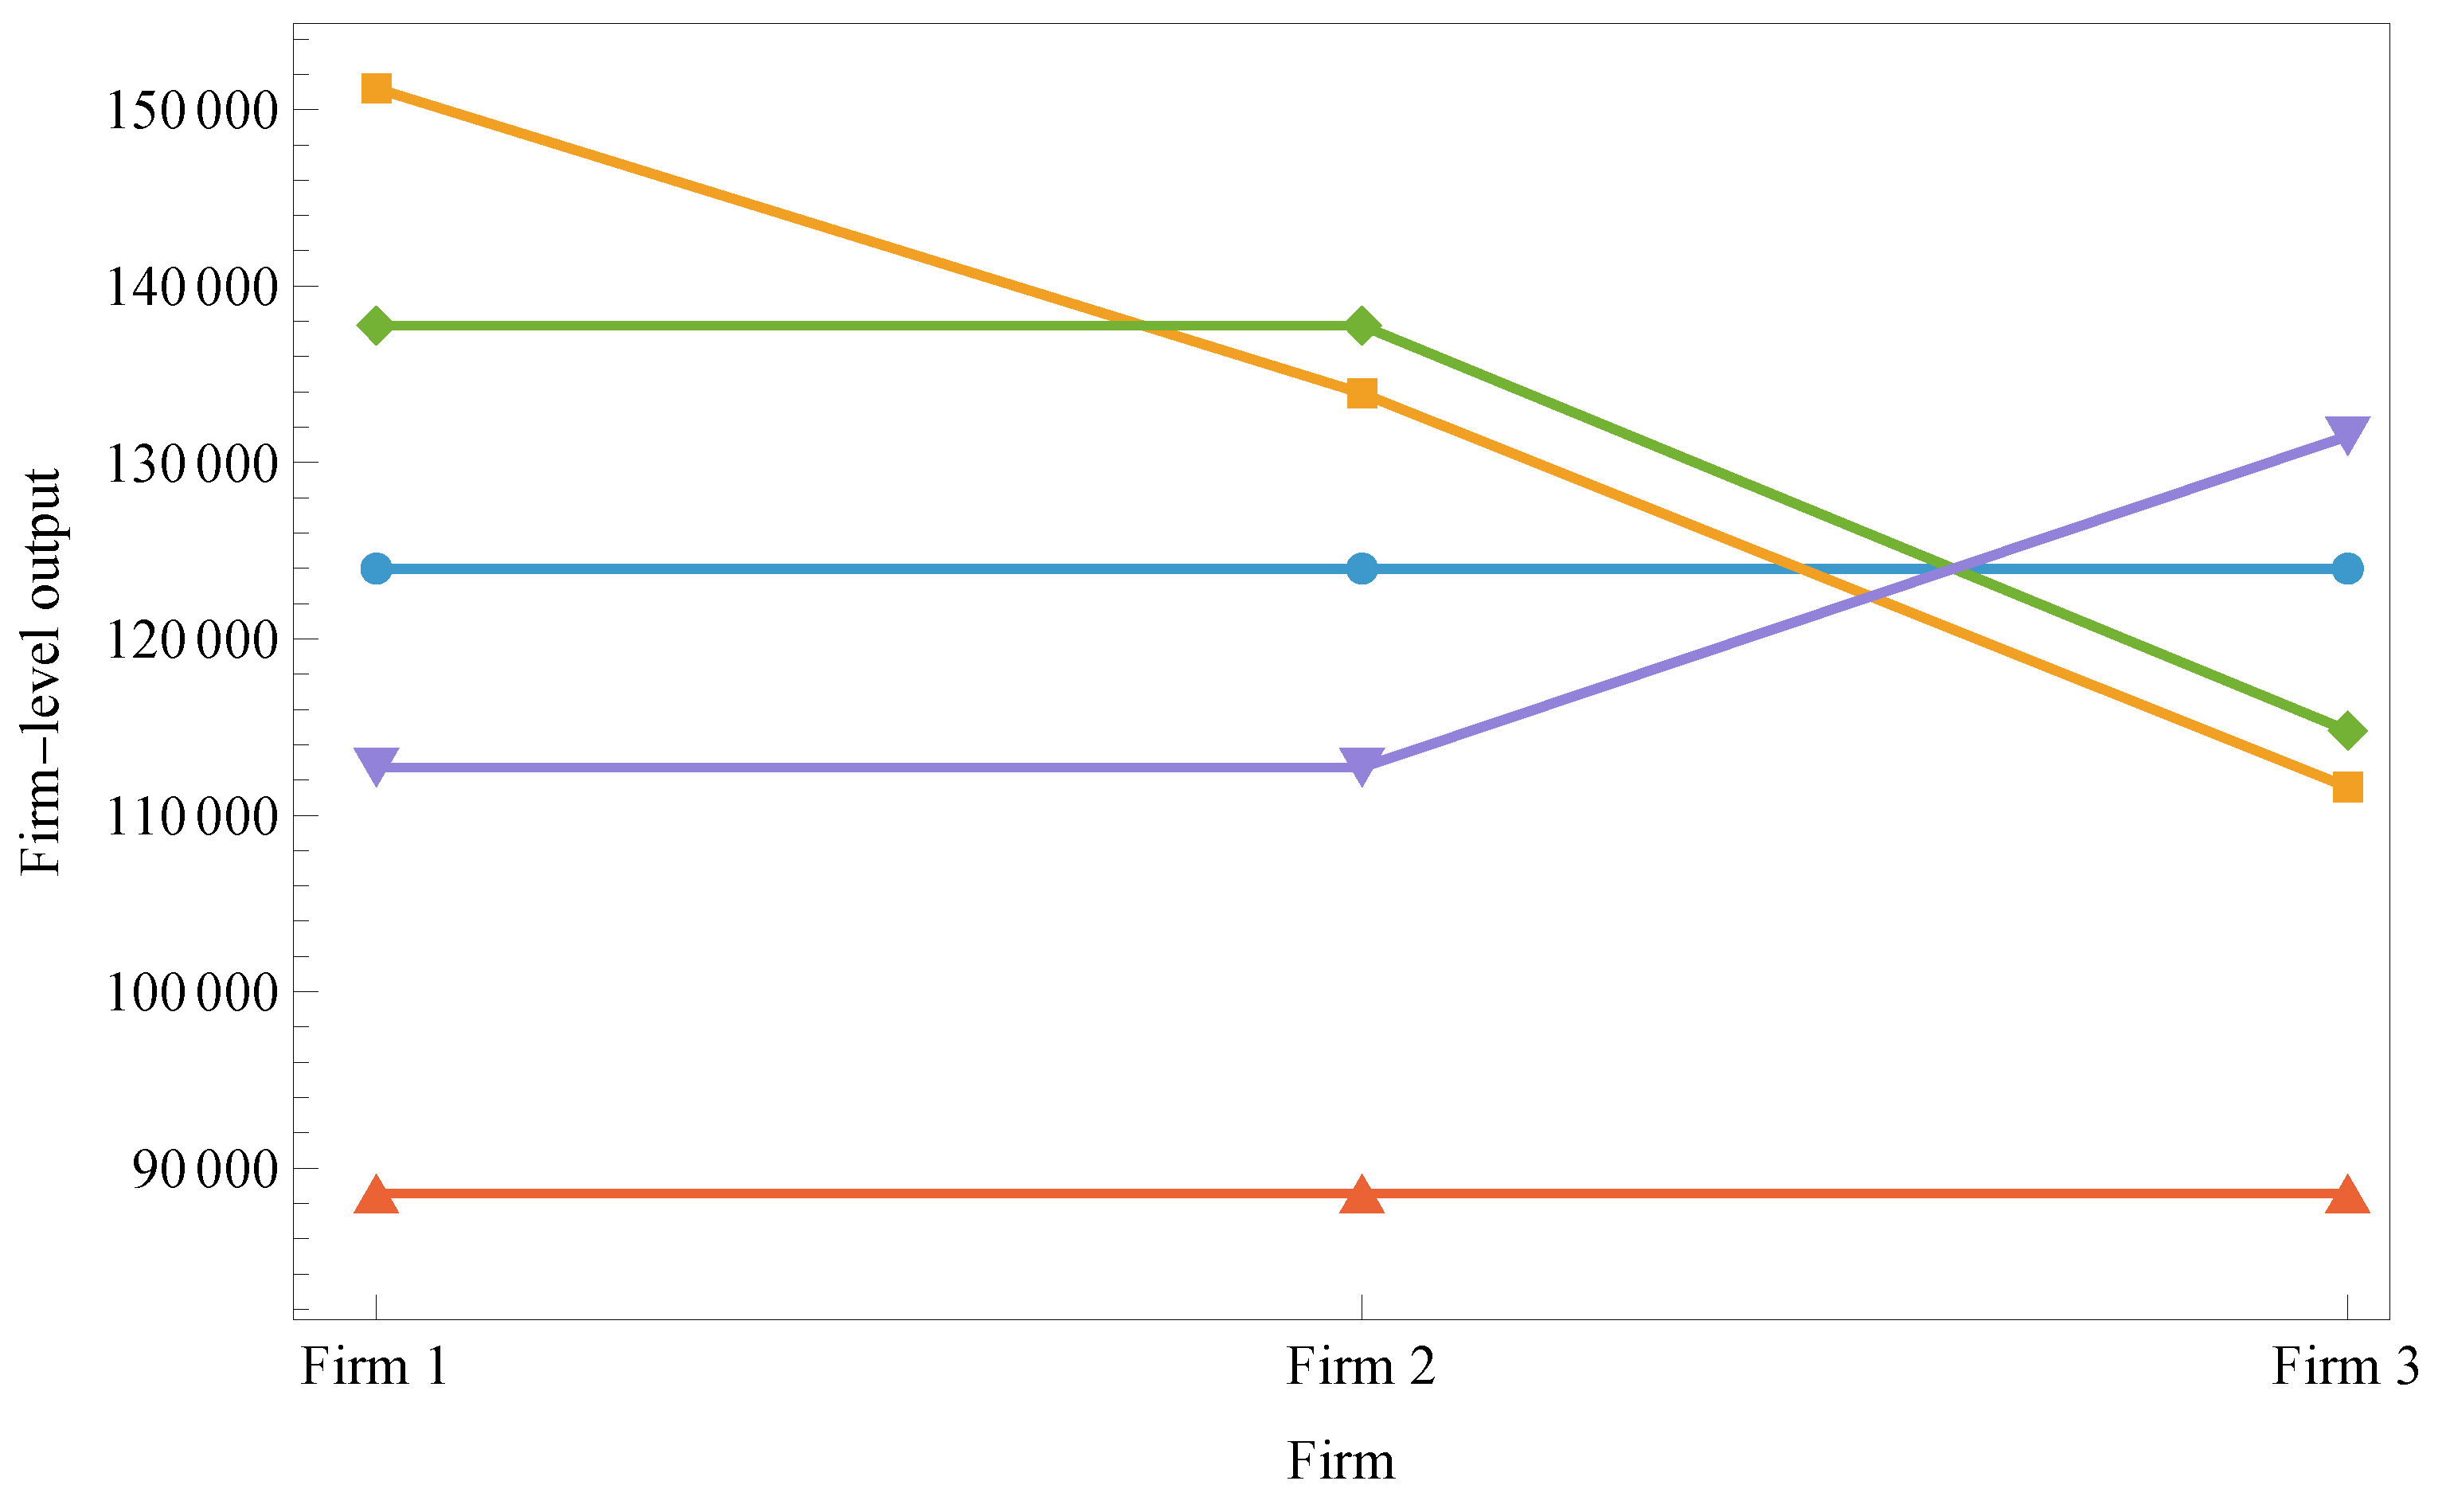
Figure A1 visualizes the equilibrium production levels. It clearly illustrates the symmetry of the Cournot and cartel models and the asymmetric output allocation generated by the Stackelberg and failed-cartel structures.
The price–cost margins provide an additional economic interpretation. Since , firms producing larger quantities incur higher marginal costs. Nevertheless, in the failed-cartel regime the deviating firm combines a relatively high output with a relatively high market price, explaining its superior individual profitability.
The qualitative differences become more transparent when the equilibrium outcomes are expressed as percentage deviations from the symmetric Cournot equilibrium, which serves as the natural benchmark throughout the comparative analysis.
Table A3.
Relative changes in equilibrium quantities and market price with respect to the Cournot equilibrium.
Table A3.
Relative changes in equilibrium quantities and market price with respect to the Cournot equilibrium.
| Market structure | x | y | z | Q | P |
|---|---|---|---|---|---|
| Cournot (benchmark) | |||||
| Stackelberg (Case I) | |||||
| Cournot–Stackelberg (Case II) | |||||
| Cartel | |||||
| Failed cartel |
Table A3 highlights the different effects of informational hierarchy and partial cooperation. The canonical Stackelberg model strongly favors the leader, whereas the Cournot–Stackelberg model distributes the production increase more evenly between the leaders. In contrast, the failed-cartel regime shifts production toward the deviating firm while preserving part of the price-increasing effect of cartel coordination.
Table A4.
Relative changes in individual and aggregate profits with respect to the Cournot equilibrium.
Table A4.
Relative changes in individual and aggregate profits with respect to the Cournot equilibrium.
| Market structure | ||||
|---|---|---|---|---|
| Cournot (benchmark) | ||||
| Stackelberg (Case I) | ||||
| Cournot–Stackelberg | ||||
| Cartel | ||||
| Failed cartel |
Table A4 illustrates the trade-off between competition and coordination. Informational hierarchy reduces aggregate producer profits, whereas full cooperation maximizes them. The failed-cartel regime remains particularly interesting because it preserves higher aggregate profitability while providing the strongest individual incentive to deviate.
Overall, the numerical comparisons reveal a consistent economic pattern. Stronger coordination restricts production, increases prices, and raises producer profits, whereas stronger informational hierarchy expands output and benefits consumers through lower prices. The Cournot–Stackelberg and failed-cartel models naturally bridge these two extremes by combining elements of competition and coordination.
Let us denote by a upper subscript the model, i.e., , , and the quantities for each player in the , where , , , and .
The comparison for the three players are for the leader , for the middle players , and for the followers .
Thus, the cartel outcome generates the lowest individual output for each participant. In contrast, the Stackelberg-type models increase the production of the leading firms, while the follower produces less than in the symmetric Cournot benchmark.
Appendix A.7. Consumer and Total Surplus
Consumer surplus is computed as . For the linear demand function , this gives . Total surplus is the sum of consumer surplus and total industry profit, i.e. .
Table A5.
Consumer surplus and total surplus under the considered market structures.
| Model | Consumer Surplus | Total Surplus |
|---|---|---|
| Cournot | 3458707258 | 6917414515 |
| Canonical Stackelberg | 3934668960 | 7030800000 |
| Cournot–Stackelberg | 3808742560 | 7011249280 |
| Cartel | 1764646560 | 5882155200 |
| Failed cartel | 3184868544 | 6810847227 |
Table A6 confirms that market hierarchy benefits consumers, while cartel coordination benefits producers. The Cournot–Stackelberg model represents a compromise between these two extremes, whereas the failed-cartel regime remains much closer to the Cournot benchmark than to the full cartel in terms of both consumer and total welfare.
Table A6.
Relative changes in consumer surplus and total surplus with respect to the Cournot equilibrium.
Table A6.
Relative changes in consumer surplus and total surplus with respect to the Cournot equilibrium.
| Market structure | Consumer Surplus | Total Surplus |
|---|---|---|
| Cournot | ||
| Canonical Stackelberg | ||
| Cournot–Stackelberg | ||
| Cartel | ||
| Failed cartel |
Overall, the results indicate that the market structures generating larger aggregate outputs (Stackelberg and Cournot–Stackelberg) provide the highest levels of consumer welfare and total welfare. In contrast, successful collusion substantially harms consumers and reduces aggregate welfare, while cartel breakdown mitigates but does not completely eliminate these welfare losses.
An additional noteworthy observation is that both welfare indicators induce exactly the same ranking of the considered market structures. More precisely,
and
Therefore, the ordering of the market structures is invariant with respect to whether welfare is measured by consumer surplus or by total surplus. In both cases, the Stackelberg model yields the most favorable outcome, followed by the Cournot–Stackelberg and Cournot equilibria. The failed cartel occupies an intermediate position, while the fully coordinated cartel produces the lowest welfare levels. This coincidence suggests that, for the considered demand and cost specifications, the relative efficiency of the market structures is robust with respect to the choice of welfare criterion.
References
- Ali, A.; Hristov, M.; Ilchev, A.; Kulina, H.; Zlatanov, B. Applications of N-Tupled Fixed Points in Partially Ordered Metric Spaces for Solving Systems of Nonlinear Matrix Equations. Mathematics 2025, 13, 2125. [Google Scholar] [CrossRef]
- Andaluz, J.; Elsadany, A.; Jarne, G. Dynamic Cournot oligopoly game based on general isoelastic demand. Nonlinear Dyn. 2020, 99, 1053–1063. [Google Scholar] [CrossRef]
- Anderson, S.P.; Engers, M. Stackelberg versus Cournot oligopoly equilibrium. Int. J. Ind. Organ. 1992, 10, 127–135. [Google Scholar] [CrossRef]
- Askar, S.S. Cournot–Stackelberg and Stackelberg–Cournot duopoly models. Appl. Math. Comput. 2018, 330, 261–271. [Google Scholar] [CrossRef]
- Badev, A.; Kabaivanov, S.; Kopanov, P.; Zhelinski, V.; Zlatanov, B. Long-Run Equilibrium in the Market of Mobile Services in the USA. Mathematics 2024, 12, 724. [Google Scholar] [CrossRef]
- Badev, A.; Pavlov, M.; Zlatanov, B. Equilibrium in the Canonical Stackelberg Triopoly via Response Functions and Fixed Point Theory. arXiv 2026, arXiv:2604.26487. [Google Scholar] [CrossRef]
- Banach, S. Sur les opérations dans les ensembles abstraits et leurs applications aux intégrales. Fundam. Math. 1922, 3, 133–181. [Google Scholar] [CrossRef]
- Berinde, V.; Borcut, M. Tripled Fixed Point Theorems for Contractive Type Mappings in Partially Ordered Metric Spaces. Nonlinear Anal. Theory Methods Appl. 2011, 74, 4889–4897. [Google Scholar] [CrossRef]
- Bhaskar, T.G.; Lakshmikantham, V. Fixed Point Theorems in Partially Ordered Metric Spaces and Applications. Nonlinear Anal. Theory Methods Appl. 2006, 65, 1379–1393. [Google Scholar] [CrossRef]
- Chatterjea, S.K. Fixed-Point Theorems. Comptes Rendus De l’Académie Bulg. Des. Sci. 1972, 25, 727–730. [Google Scholar]
- Cournot, A.-A. Researches into the Mathematical Principles of the Theory of Wealth; Originally published in French as Recherches sur les principes mathématiques de la théorie des richesses (1838); Augustus M. Kelley, New York, USA, 1960. [Google Scholar]
- Dzhabarova, Y.; Kabaivanov, S.; Ruseva, M.; Zlatanov, B. Existence, Uniqueness and Stability of Market Equilibrium in Oligopoly Markets. Adm. Sci. 2020, 10, 70. [Google Scholar] [CrossRef]
- Friedman, J.W. A non-cooperative equilibrium for supergames. Rev. Econ. Stud. 1971, 38, 1–12. [Google Scholar] [CrossRef]
- Friedman, J.W. Oligopoly Theory; Cambridge University Press: Cambridge, UK, 1983; ISBN 978-0521278648. [Google Scholar]
- Green, E.J.; Porter, R.H. Noncooperative collusion under imperfect price information. Econometrica 1984, 52, 87–100. [Google Scholar] [CrossRef]
- Guo, D.; Lakshmikantham, V. Coupled Fixed Points of Nonlinear Operators with Applications. Nonlinear Anal. Theory Methods Appl. 1987, 11, 623–632. [Google Scholar] [CrossRef]
- Hardy, G.E.; Rogers, T.D. A Generalization of a Fixed Point Theorem of Reich. Can. Math. Bull. 1973, 16, 201–206. [Google Scholar] [CrossRef]
- Harrington, J.E., Jr. How Do Cartels Operate? Foundations and Trends in Microeconomics; Now Publishers: Hanover, MA, USA, 2006. [Google Scholar] [CrossRef]
- Ilchev, A.; Ivanova, V.; Kulina, H.; Yaneva, P.; Zlatanov, B. Investigation of Equilibrium in Oligopoly Markets with the Help of Tripled Fixed Points in Banach Spaces. Econometrics 2024, 12, 18. [Google Scholar] [CrossRef]
- Kabaivanov, S.; Zhelinski, V.; Zlatanov, B. Coupled Fixed Points for Hardy–Rogers Type of Maps and Their Applications in the Investigations of Market Equilibrium in Duopoly Markets for Non-Differentiable, Nonlinear Response Functions. Symmetry 2022, 14, 605. [Google Scholar] [CrossRef]
- Kannan, R. Some Results on Fixed Points. Bull. Calcutta Math. Soc. 1968, 60, 71–76. [Google Scholar]
- Kirk, W.A.; Srinivasan, P.S.; Veeramani, P. Fixed Points for Mappings Satisfying Cyclical Contractive Conditions. Fixed Point Theory 2003, 4, 79–89. Available online: http://www.math.ubbcluj.ro/~nodeacj/srfcpt/fpt2003.html (accessed on 28 June 2026).
- Motta, M. Competition Policy: Theory and Practice; Cambridge University Press: Cambridge, UK, 2004. [Google Scholar] [CrossRef]
- Ohnishi, K. Cournot–Stackelberg competition in nonlinear oligopoly models. J. Ind. Manag. Optim. 2021, 17, 1329–1346. [Google Scholar] [CrossRef]
- Petruşel, A. Fixed Points vs. Coupled Fixed Points. J. Fixed Point Theory Appl. 2018, 20, 150. [Google Scholar] [CrossRef]
- Petruşel, A.; Petruşel, G.; Xiao, Y.-B.; Yao, J.-C. Fixed Point Theorems for Generalized Contractions with Applications to Coupled Fixed Point Theory. J. Nonlinear Convex Anal. 2018, 19, 71–88. [Google Scholar] [CrossRef]
- Porter, R.H. A study of cartel stability. Bell J. Econ. 1983, 14, 301–314. [Google Scholar] [CrossRef]
- Reich, S. Kannan’s Fixed Point Theorem. Bull. Unione Mat. Ital. 1971, 4, 1–11. [Google Scholar]
- Rotemberg, J.J.; Saloner, G. A supergame-theoretic model of price wars during booms. Am. Econ. Rev. 1986, 76, 390–407. [Google Scholar]
- Samet, B.; Vetro, C. Coupled Fixed Point, f-Invariant Set and Fixed Point of N-Order. Ann. Funct. Anal. 2010, 1, 46–56. [Google Scholar] [CrossRef]
- Sintunavarat, W.; Kumam, P. Coupled Best Proximity Point Theorem in Metric Spaces. Fixed Point Theory Appl. 2012, 2012, 93. [Google Scholar] [CrossRef]
- Smith, A. A Mathematical Introduction to Economics; Basil Blackwell: Oxford, UK, 1982; ISBN 978-0631129769. [Google Scholar]
- von Stackelberg, H. Marktform und Gleichgewicht; Julius Springer: Vienna, Austria, 1934. [Google Scholar]
- Stigler, G.J. A theory of oligopoly. J. Political Econ. 1964, 72, 44–61. [Google Scholar] [CrossRef]
- Tirole, J. The Theory of Industrial Organization; MIT Press: Cambridge, MA, USA, 1988. [Google Scholar] [CrossRef]
- Tron, N.H.; Théra, M. N-tupled regularity and cyclic fixed points of multivalued mappings in metric spaces. In Decisions in Economics and Finance; 2026. [Google Scholar] [CrossRef]
- Varian, H.R. Intermediate Microeconomics: A Modern Approach, 9th ed.; W. W. Norton & Company: New York, USA, 2014; ISBN 978-0393919670. [Google Scholar]
- Vives, X. Oligopoly Pricing: Old Ideas and New Tools; MIT Press: Cambridge, MA, USA, 1999. [Google Scholar]
- Zlatanov, B. Coupled Best Proximity Points for Cyclic Contractive Maps and Their Applications. Fixed Point Theory 2021, 22, 431–452. Available online: http://www.math.ubbcluj.ro/~nodeacj/srfcpt/fpt.htm (accessed on 28 June 2026). [CrossRef]
| 1 | |
| 2 | See also [30] for generalization to N tuples of fixed points. |
| 3 | |
| 4 | |
| 5 | Using the notation in [6], we extend their results for in the case of a failed cartel. |
| 6 | [6] develops this example and here we describe the market outcome. |
Figure 1.
Total output as a function of the number of players in the market. Blue: Cournot. Green: cartel. Orange: failed cartel, where firms continue to cooperate and one firm deviates. Red: Cournot–Stackelberg. Purple: canonical Stackelberg.
Figure 1.
Total output as a function of the number of players in the market. Blue: Cournot. Green: cartel. Orange: failed cartel, where firms continue to cooperate and one firm deviates. Red: Cournot–Stackelberg. Purple: canonical Stackelberg.
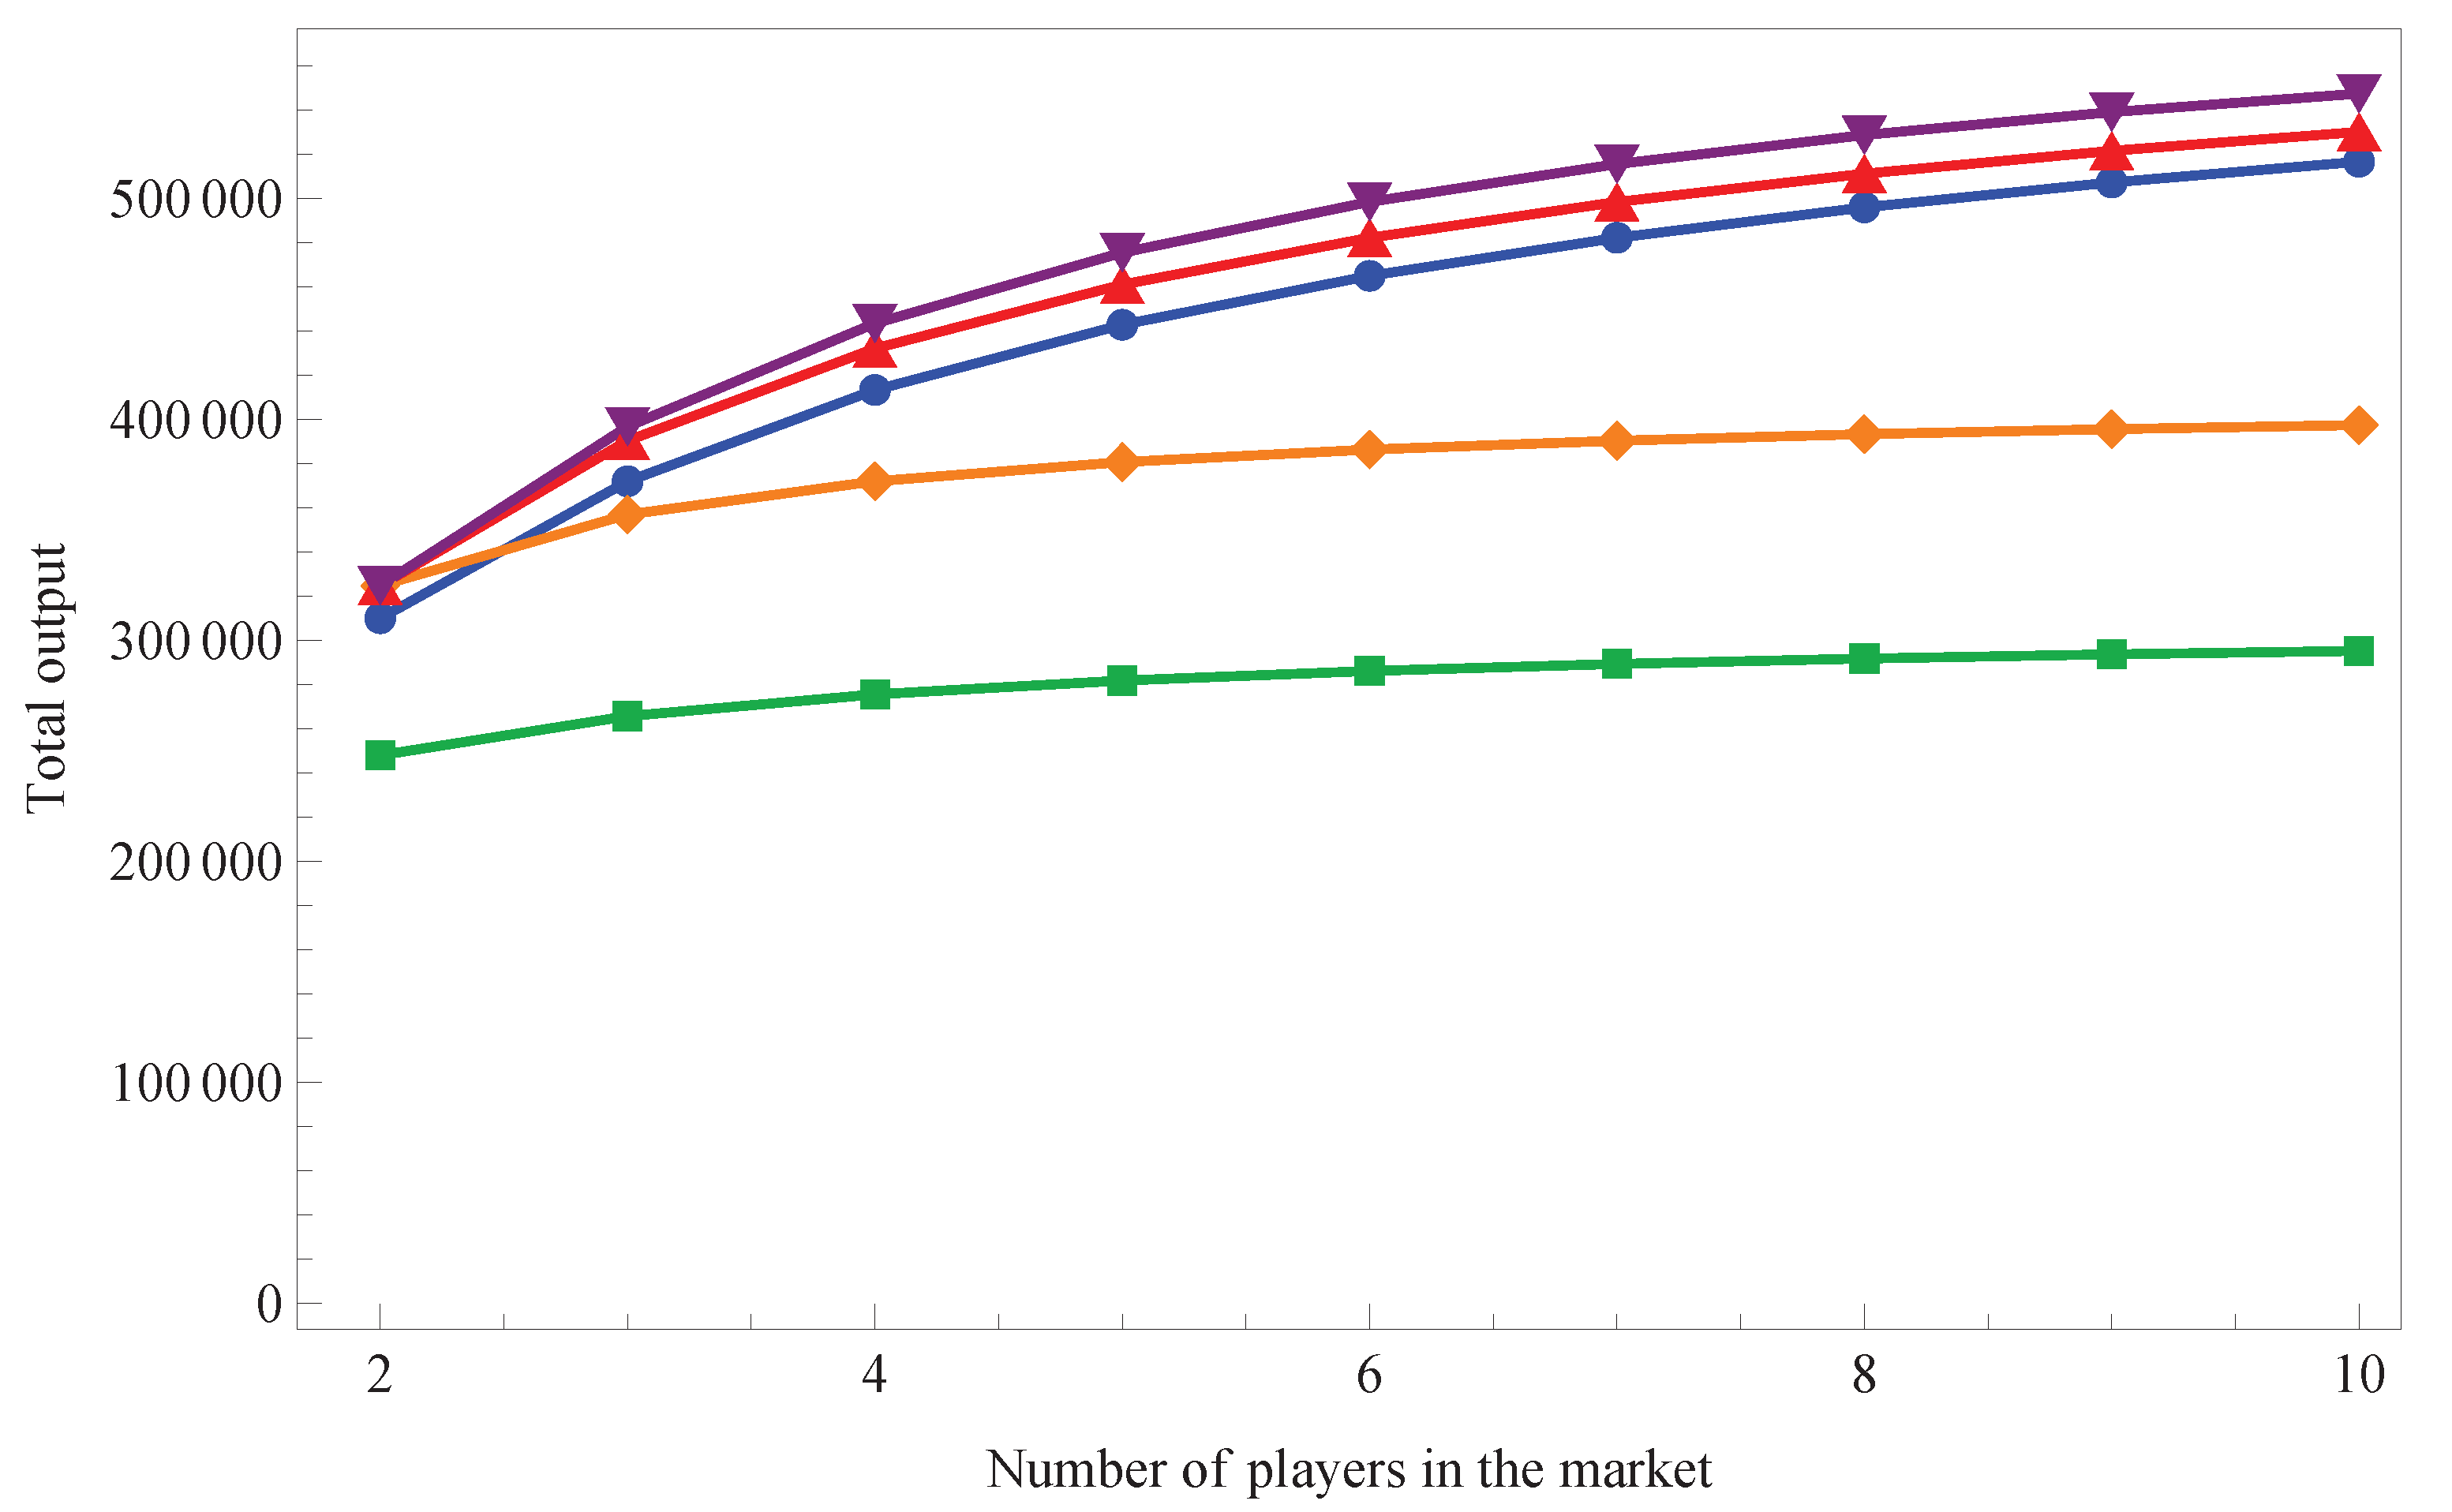
Figure 2.
Market price as a function of the number of players in the market. Blue: Cournot. Green: cartel. Orange: failed cartel. Red: Cournot–Stackelberg. Purple: canonical Stackelberg.
Figure 2.
Market price as a function of the number of players in the market. Blue: Cournot. Green: cartel. Orange: failed cartel. Red: Cournot–Stackelberg. Purple: canonical Stackelberg.
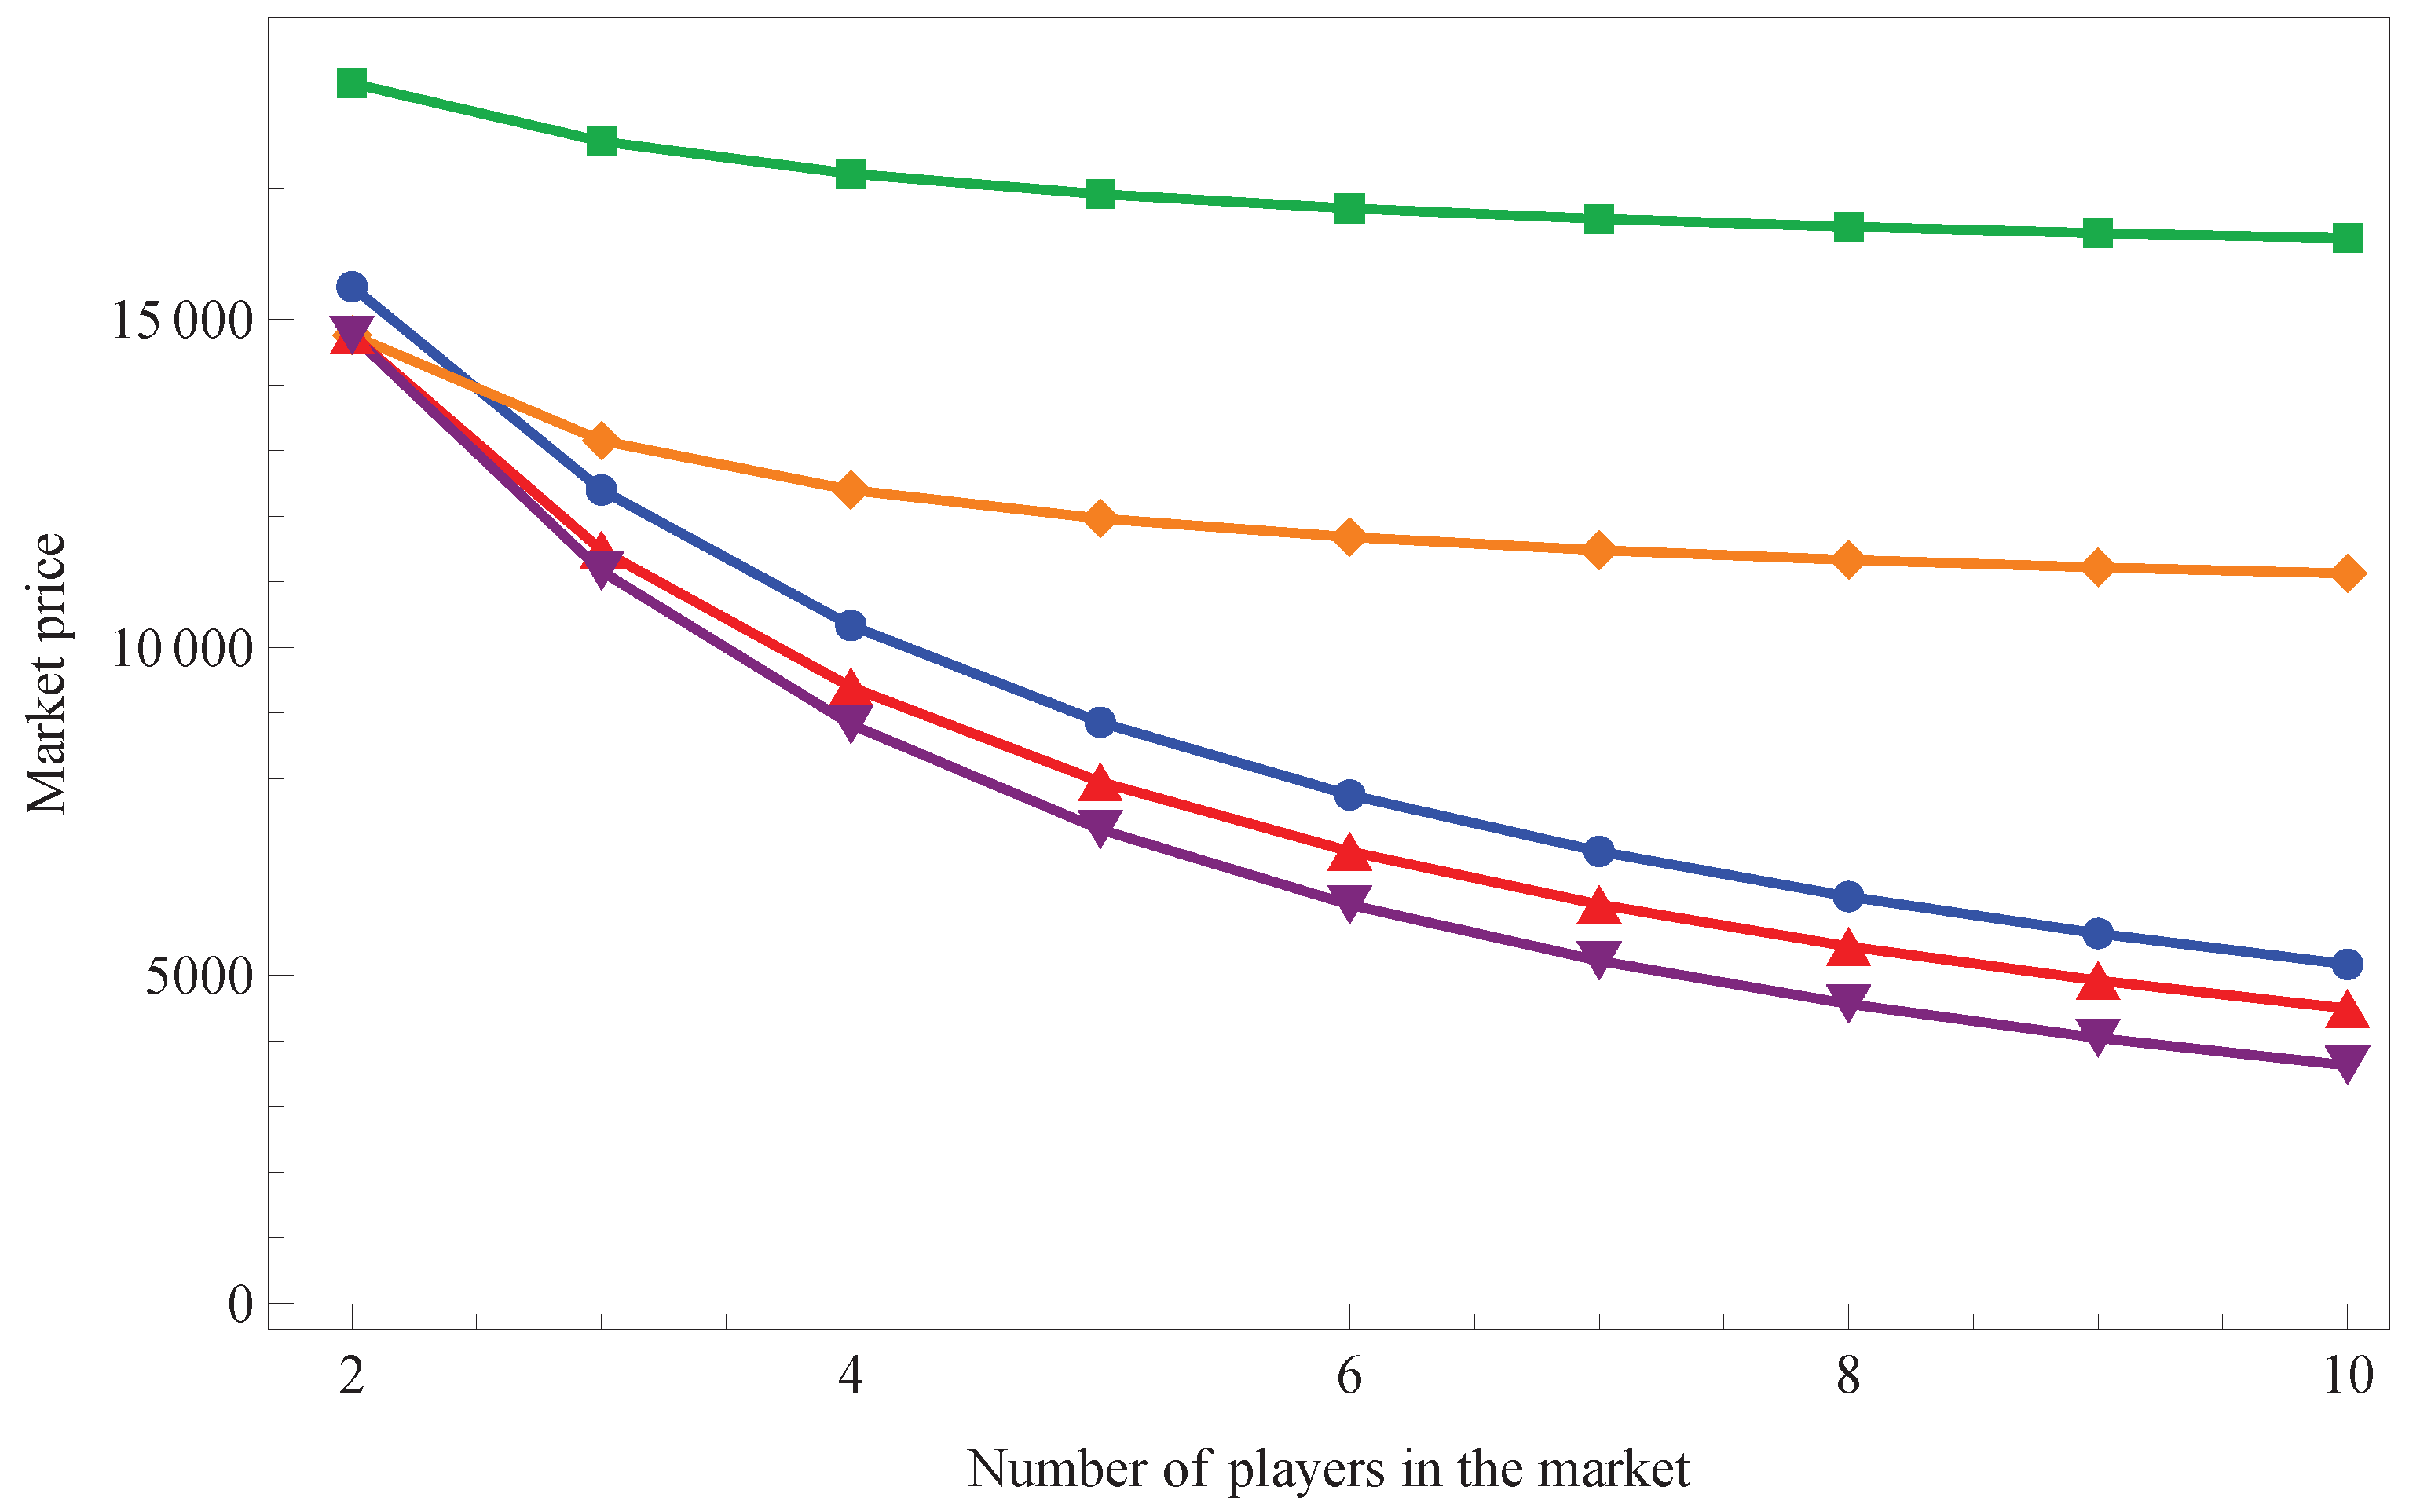
Figure 3.
Total industry profit as a function of the number of players in the market. Blue: Cournot. Green: cartel. Orange: failed cartel. Red: Cournot–Stackelberg. Purple: canonical Stackelberg.
Figure 3.
Total industry profit as a function of the number of players in the market. Blue: Cournot. Green: cartel. Orange: failed cartel. Red: Cournot–Stackelberg. Purple: canonical Stackelberg.
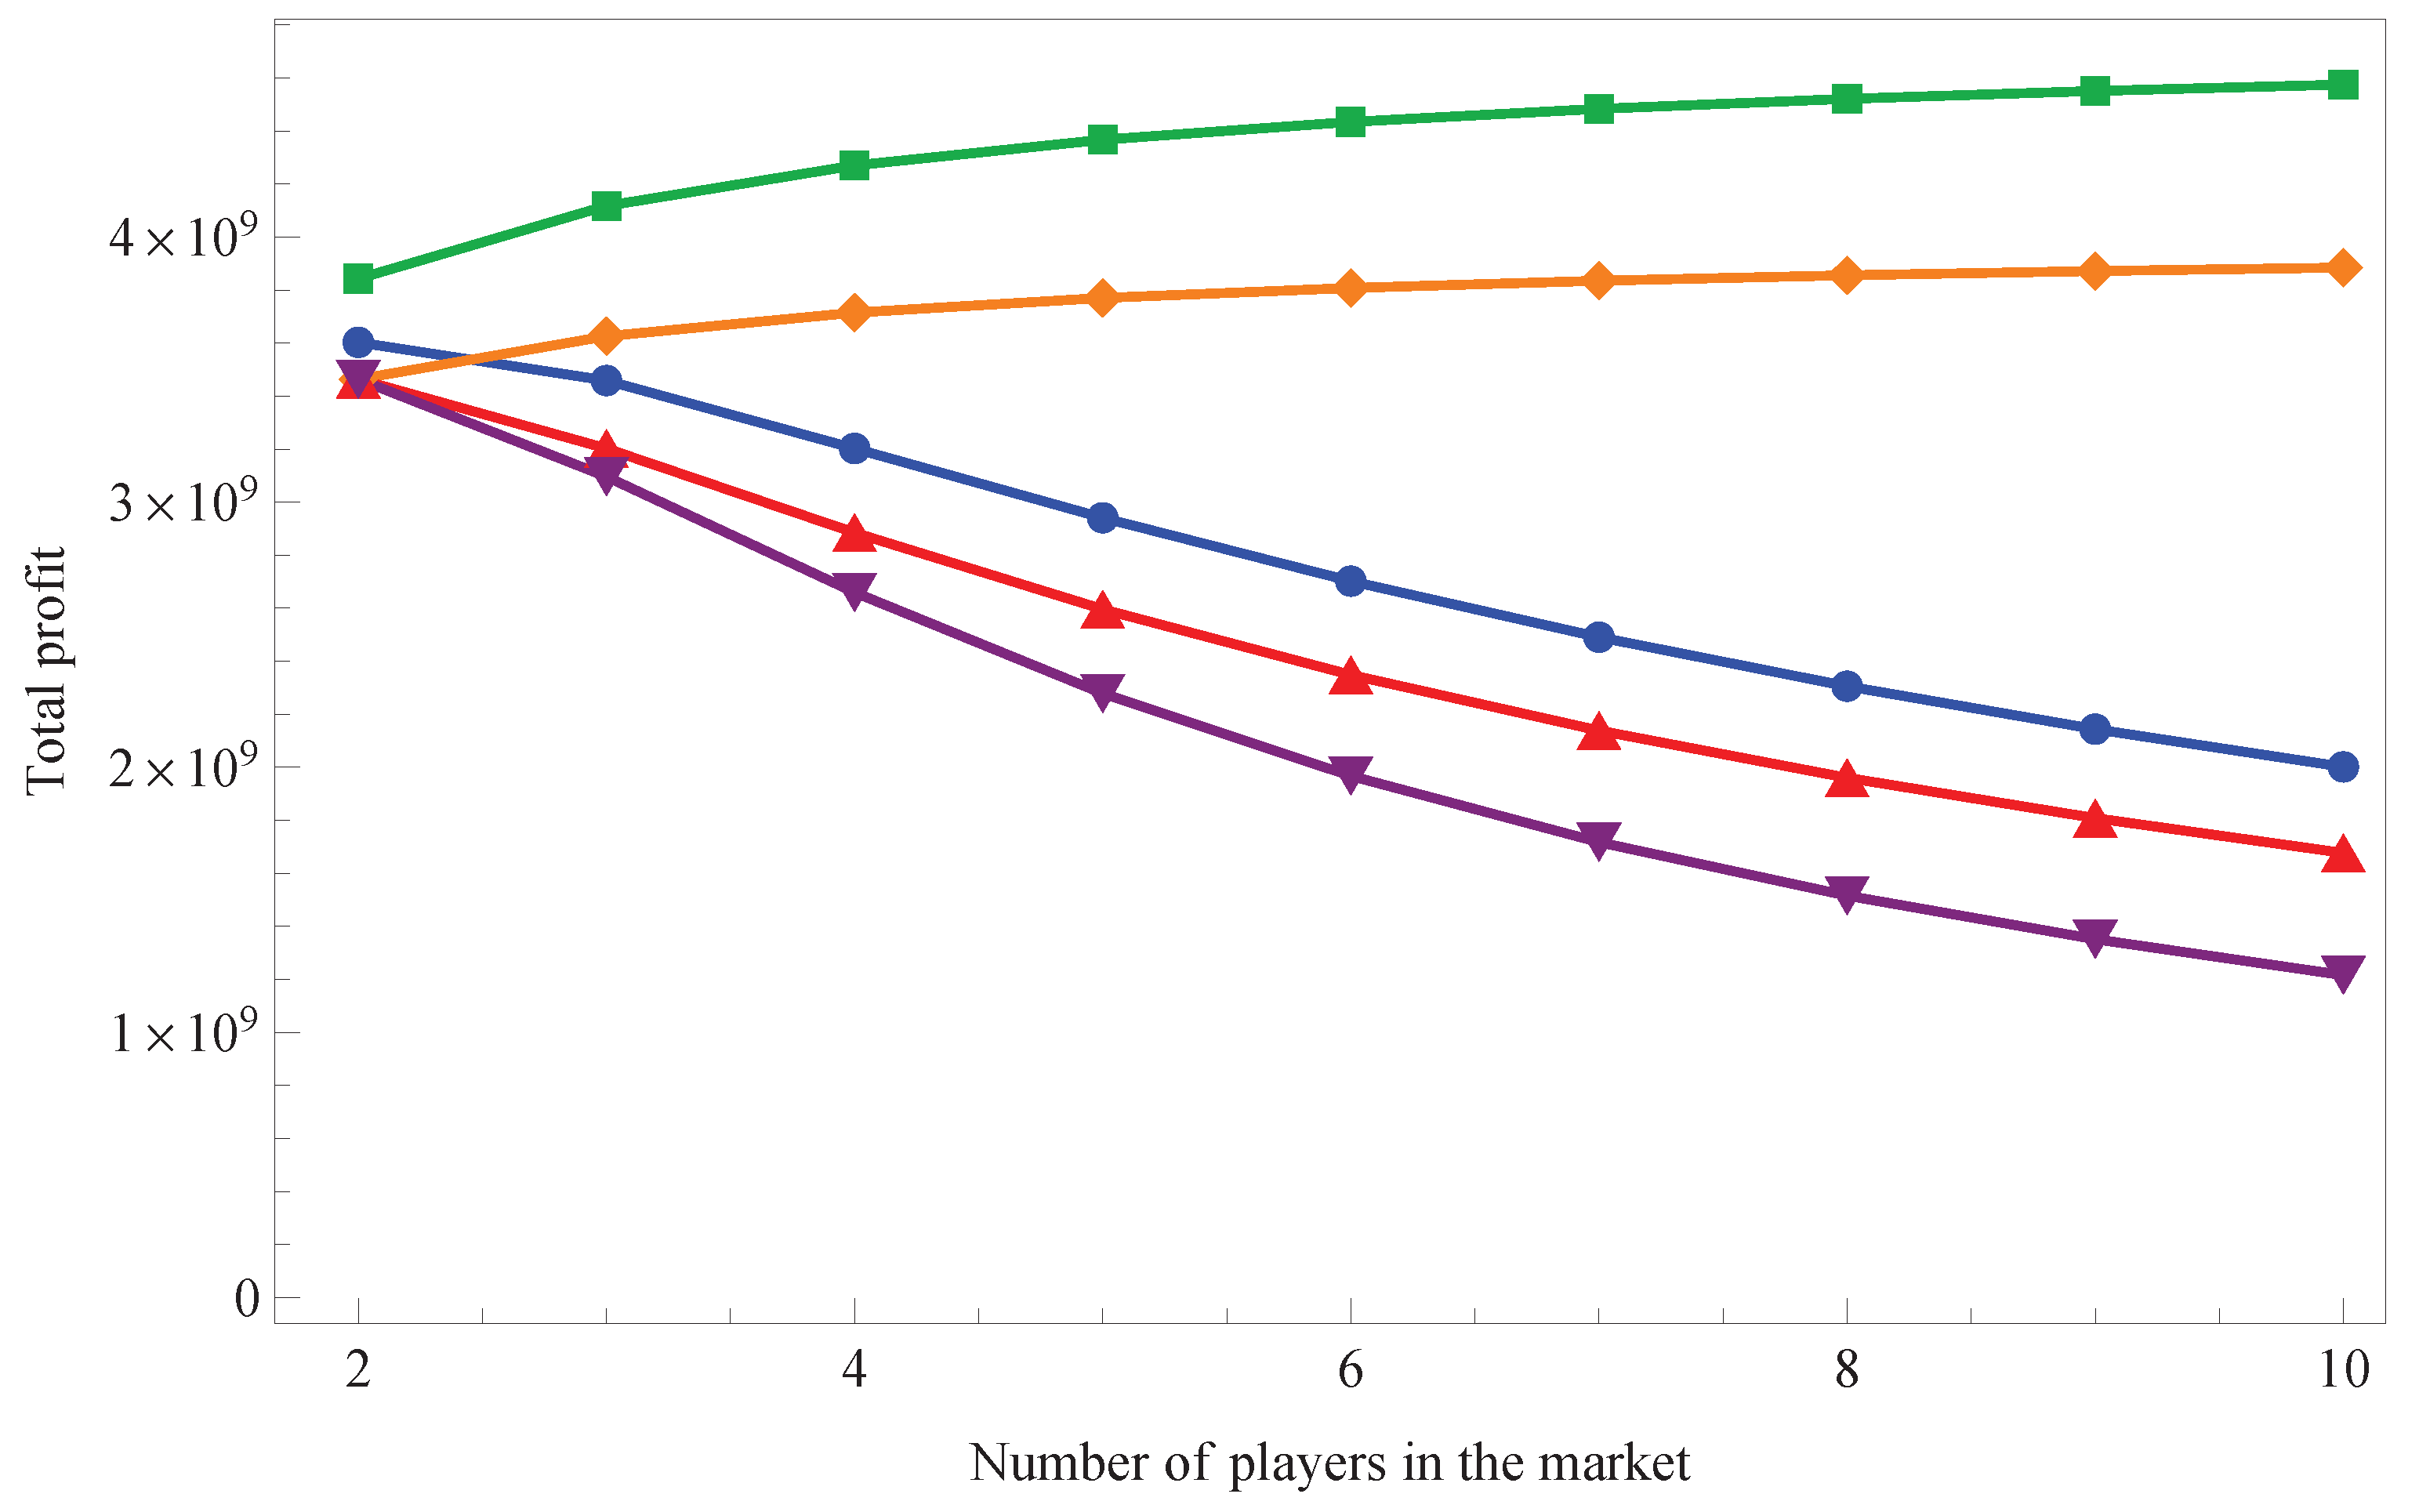
Figure 4.
Normalized total output . Blue: Cournot. Green: cartel. Orange: failed cartel. Red: Cournot–Stackelberg. Purple: canonical Stackelberg.
Figure 4.
Normalized total output . Blue: Cournot. Green: cartel. Orange: failed cartel. Red: Cournot–Stackelberg. Purple: canonical Stackelberg.
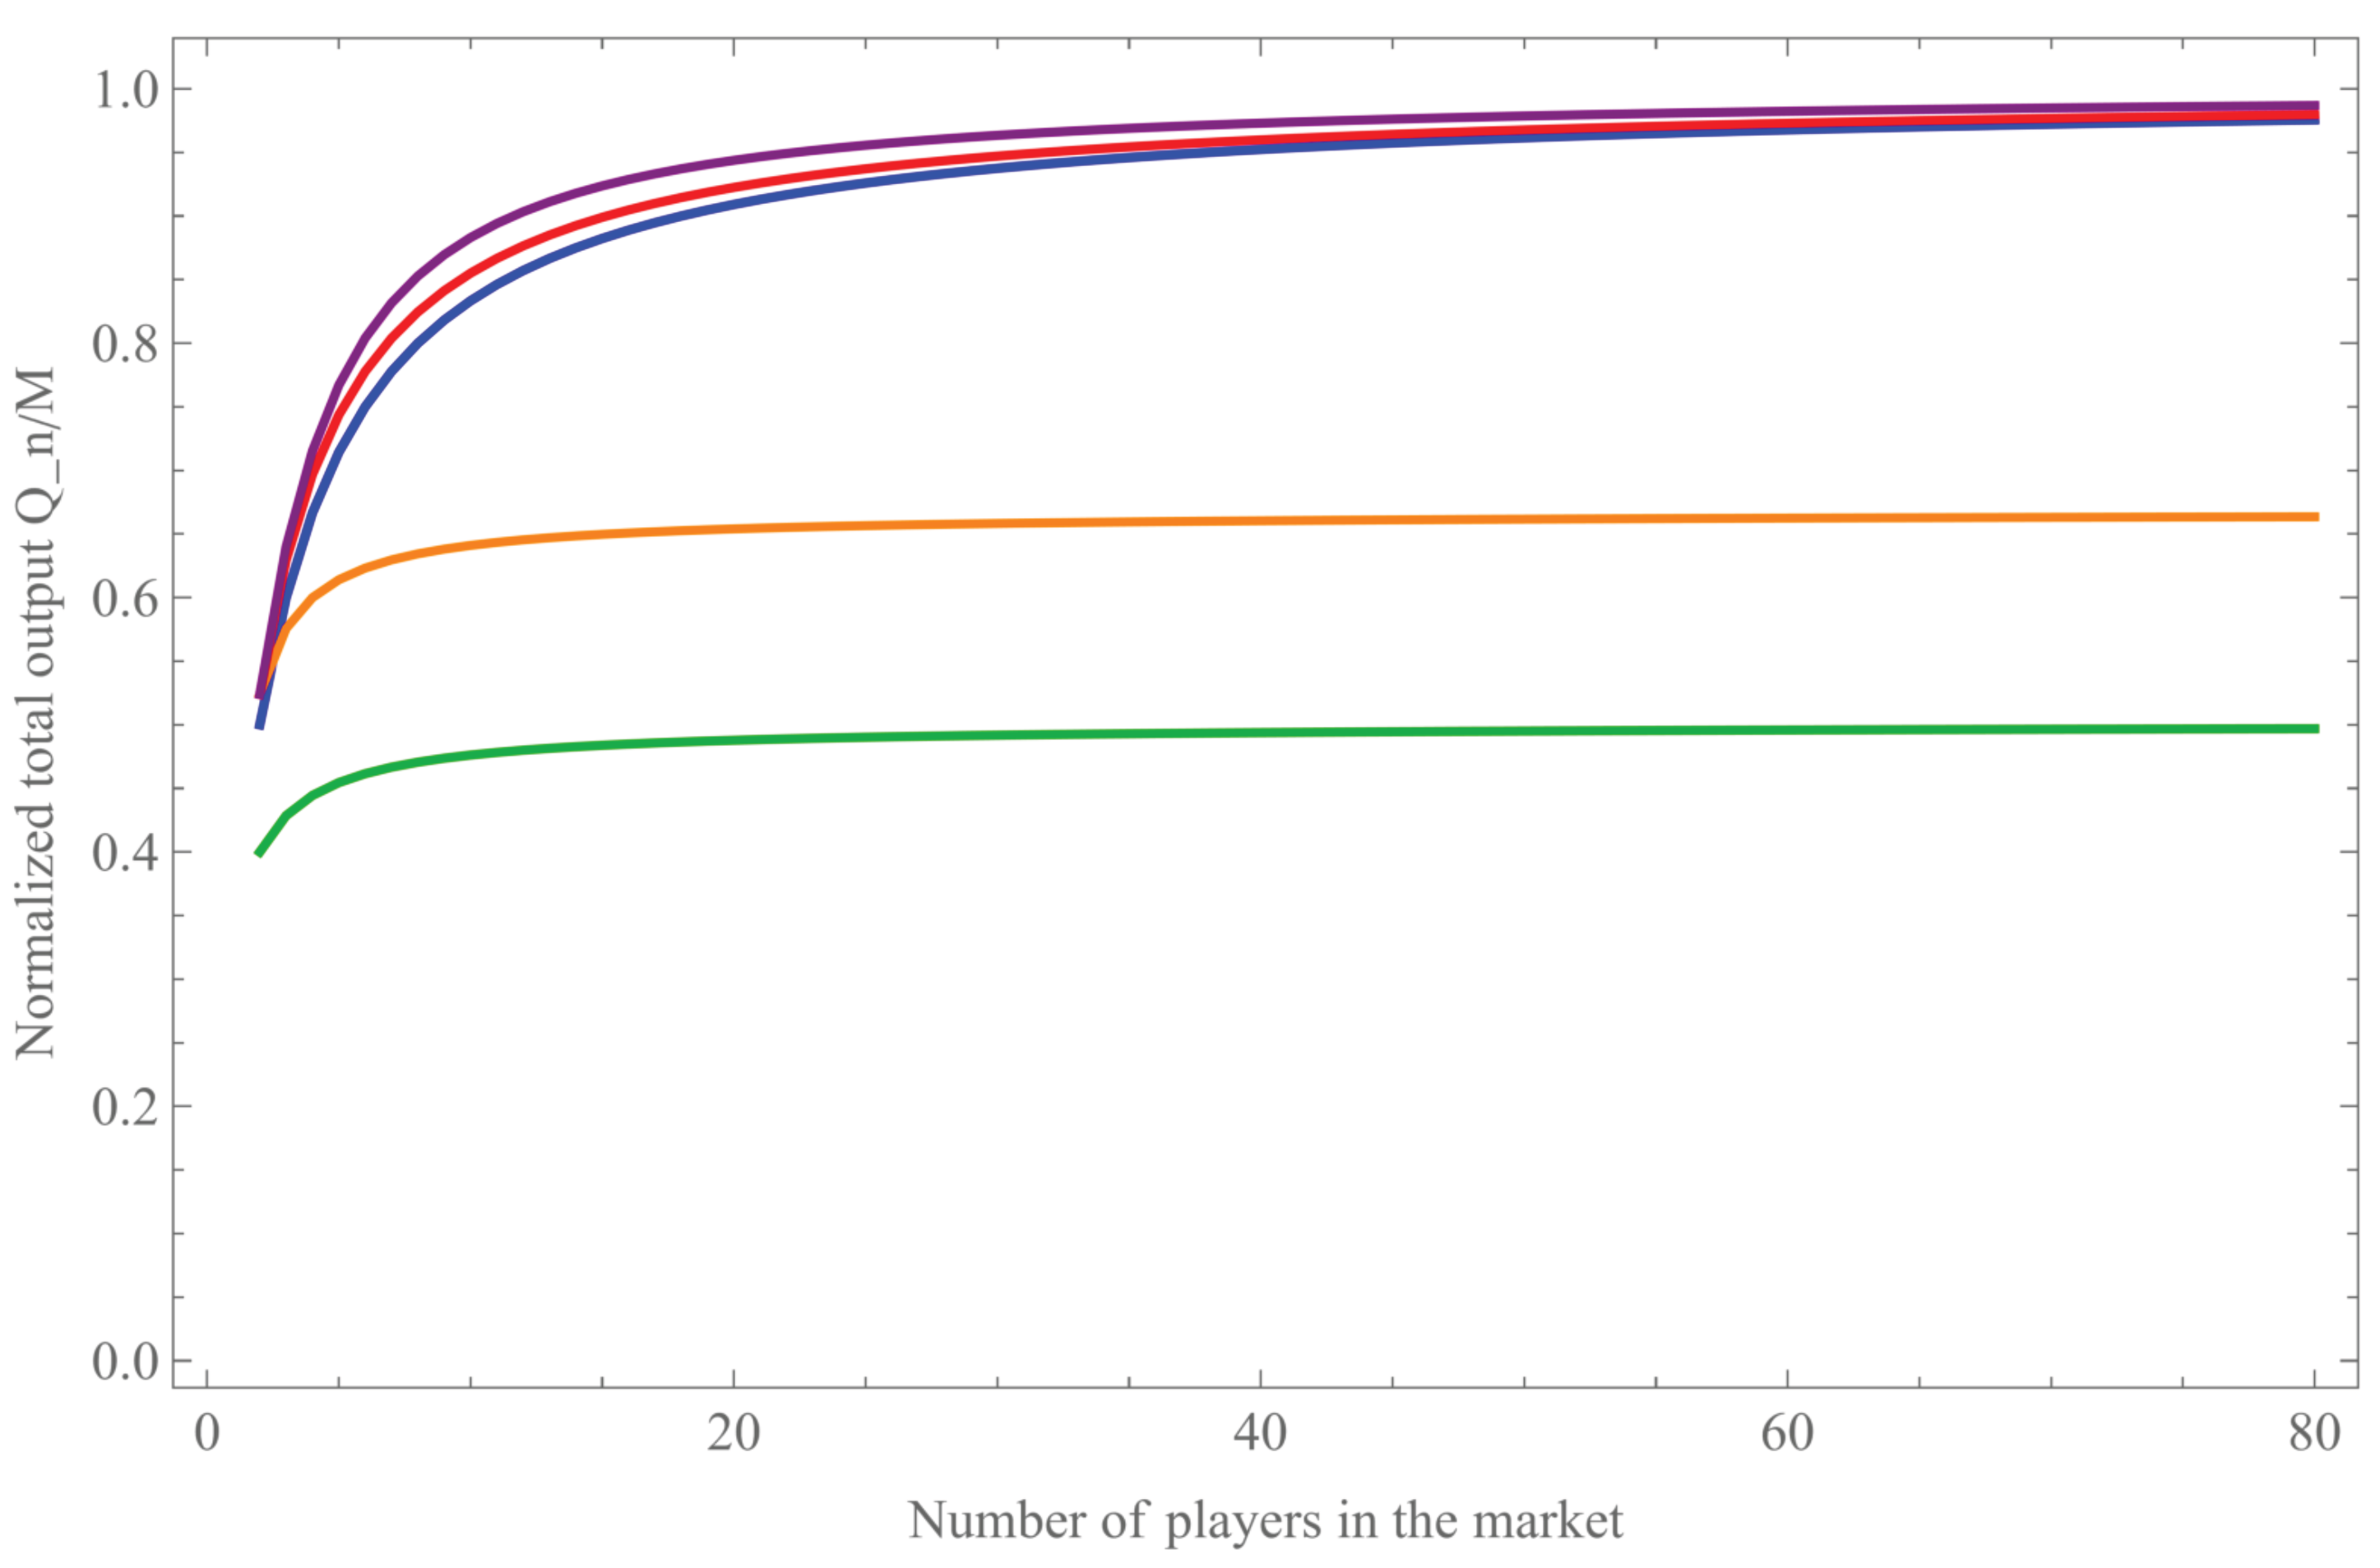
Figure 5.
Distance from the corresponding asymptotic limit. Blue: Cournot. Green: cartel. Orange: failed cartel. Red: Cournot–Stackelberg. Purple: canonical Stackelberg.
Figure 5.
Distance from the corresponding asymptotic limit. Blue: Cournot. Green: cartel. Orange: failed cartel. Red: Cournot–Stackelberg. Purple: canonical Stackelberg.
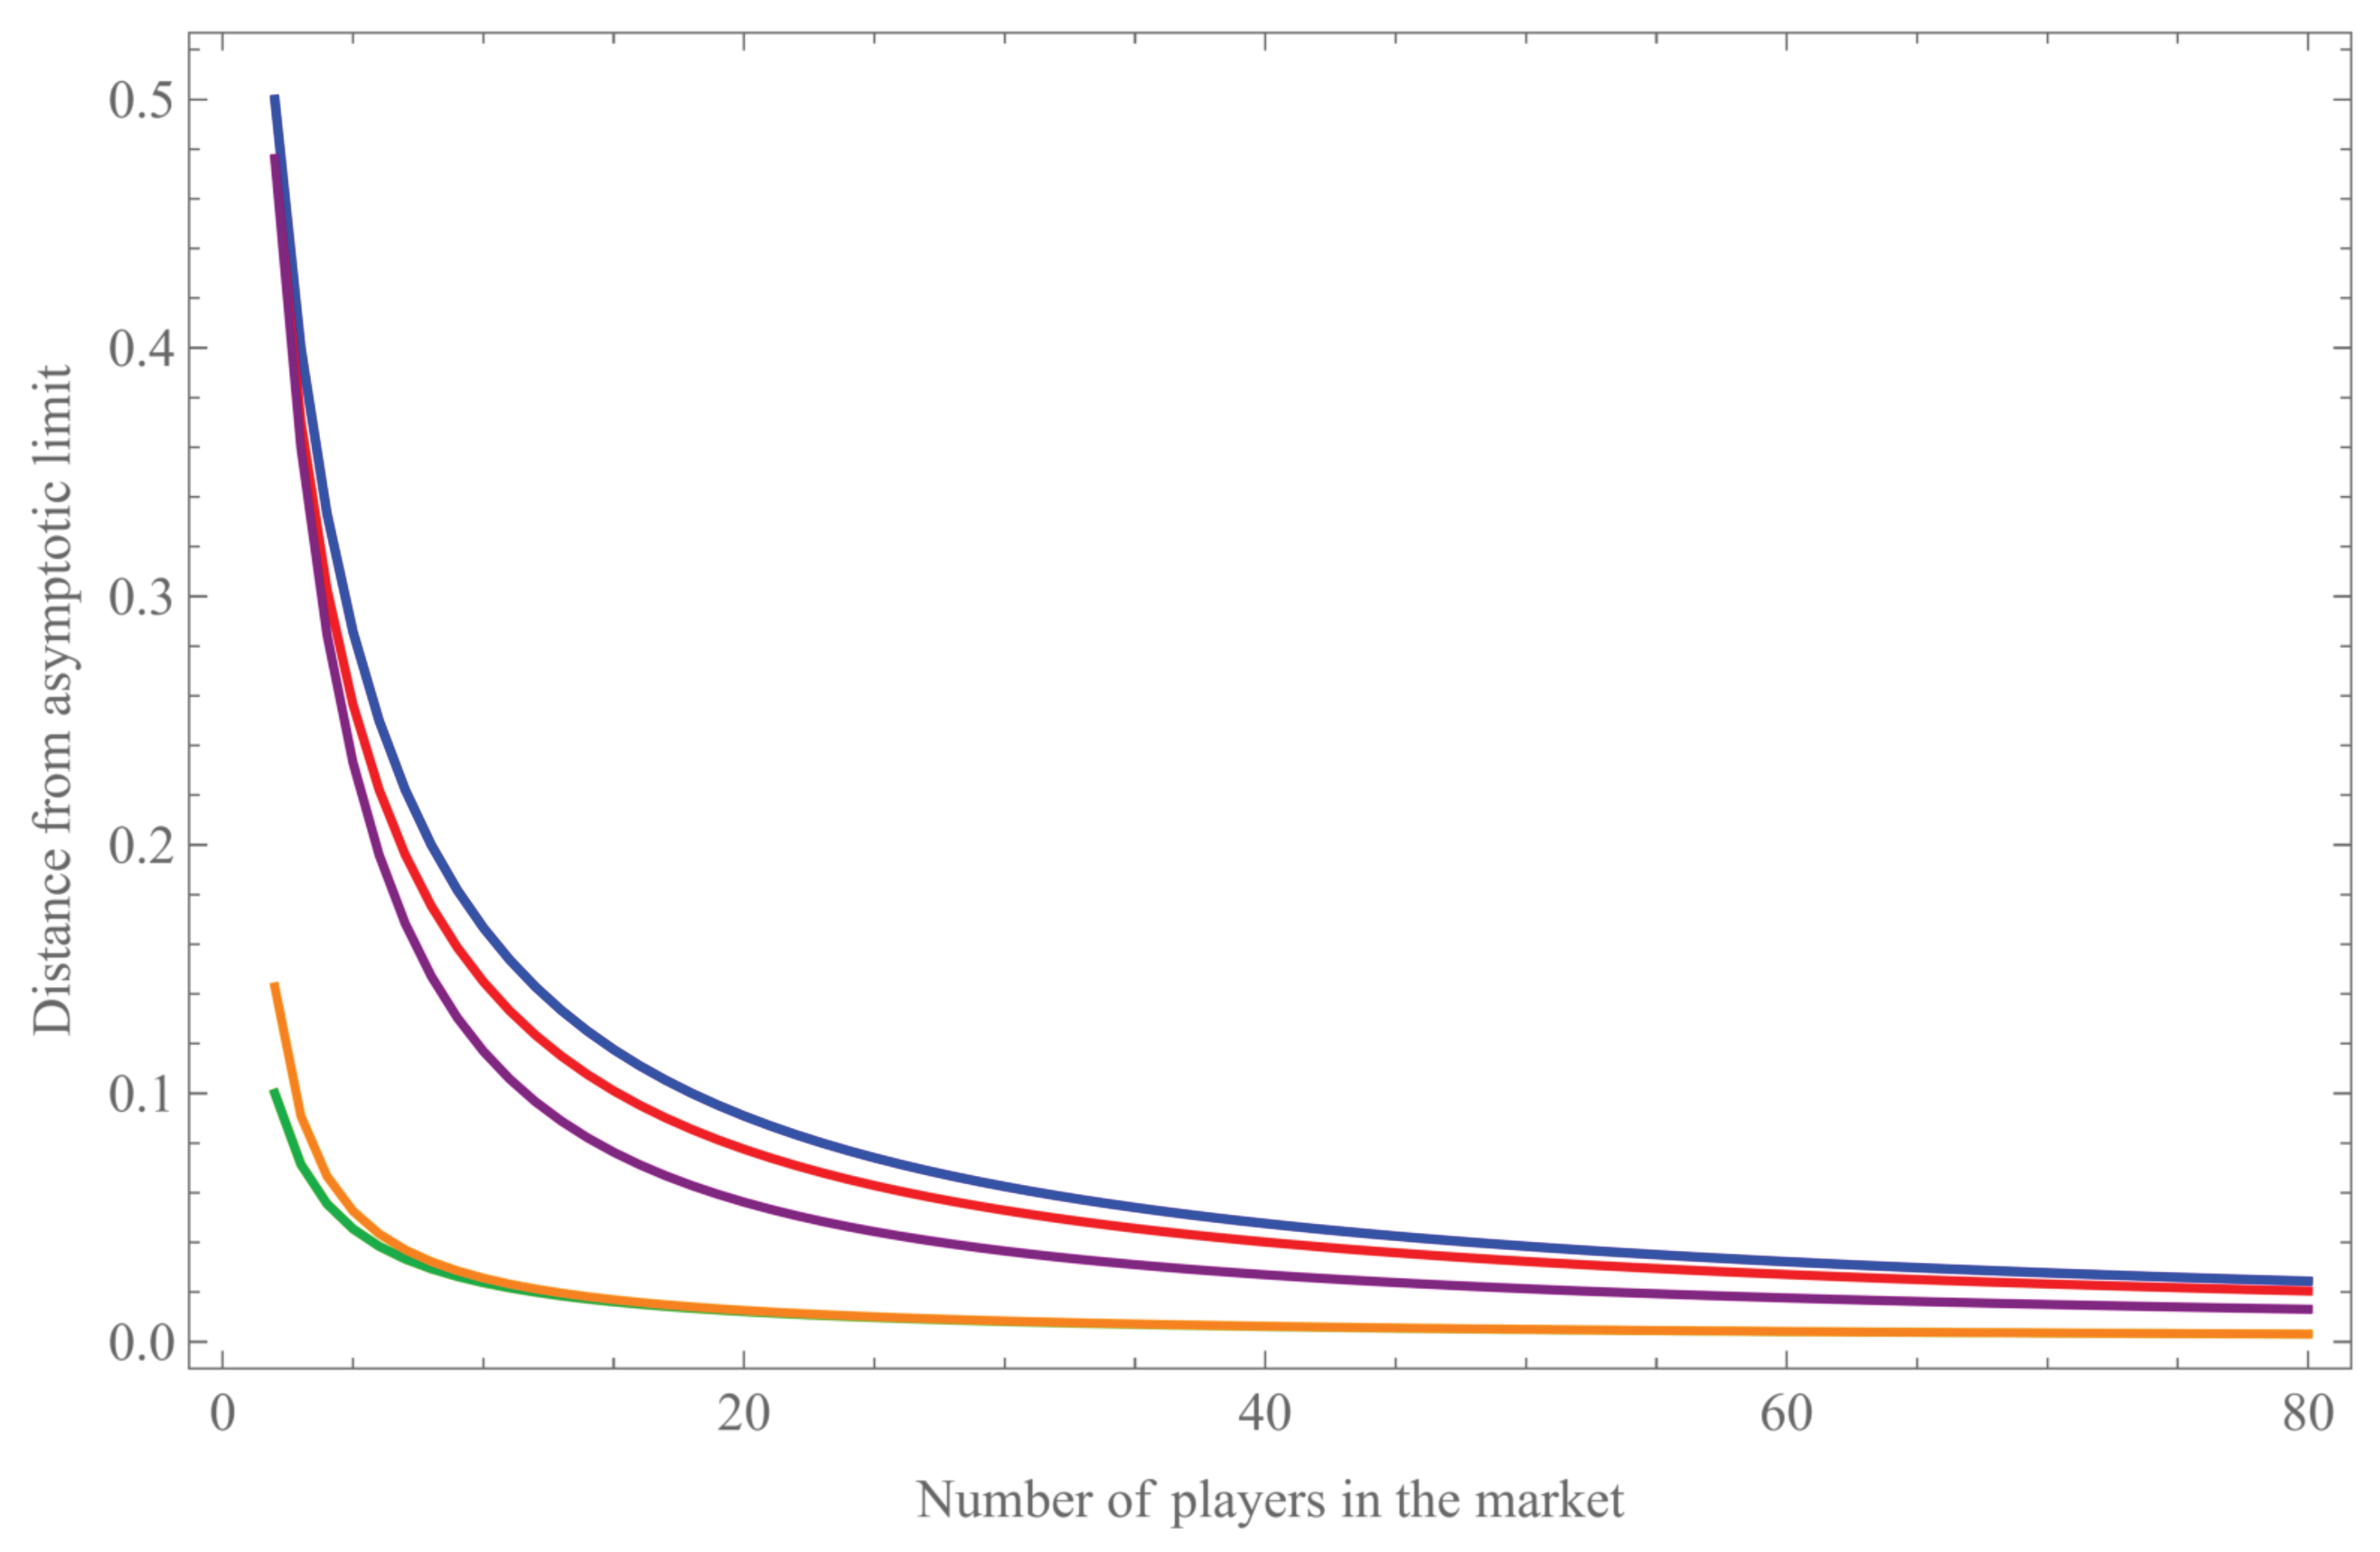
Figure 6.
Normalized market price . Blue: Cournot. Green: cartel. Orange: failed cartel. Red: Cournot–Stackelberg. Purple: canonical Stackelberg.
Figure 6.
Normalized market price . Blue: Cournot. Green: cartel. Orange: failed cartel. Red: Cournot–Stackelberg. Purple: canonical Stackelberg.
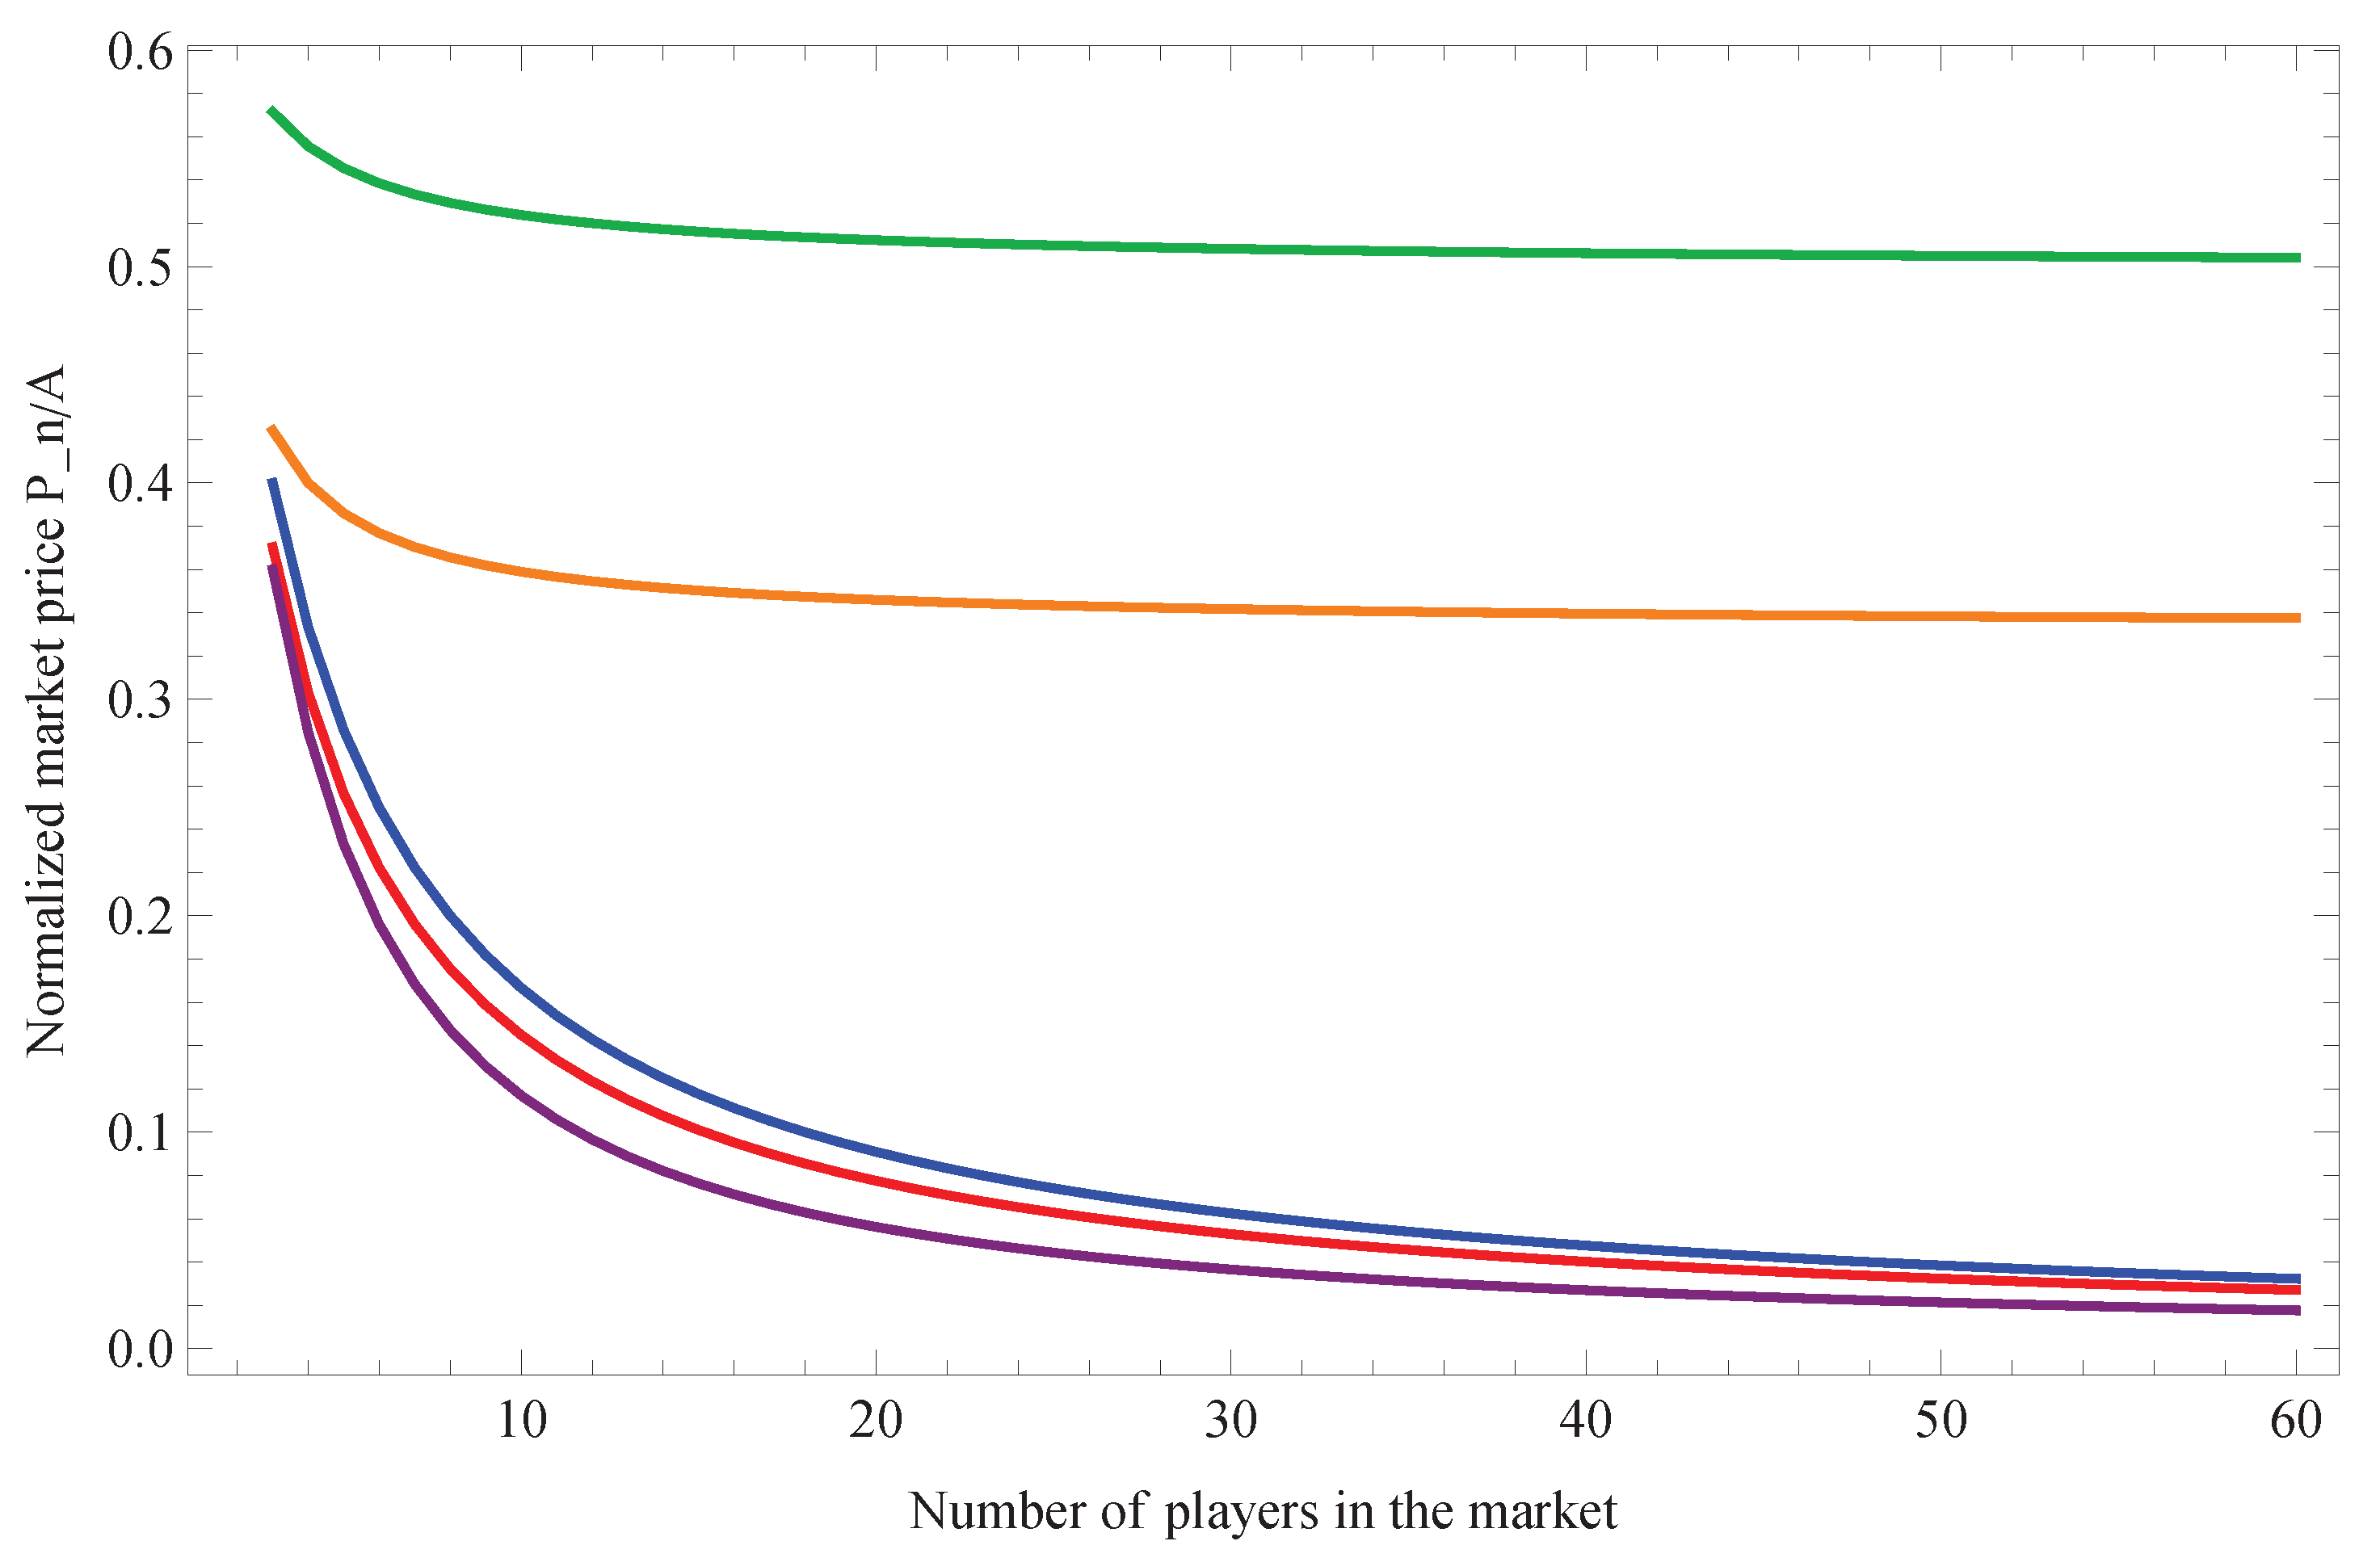
Figure 7.
Output asymmetry ratio . Blue: Cournot. Green: cartel. Orange: failed cartel. Red: Cournot–Stackelberg. Purple: canonical Stackelberg.
Figure 7.
Output asymmetry ratio . Blue: Cournot. Green: cartel. Orange: failed cartel. Red: Cournot–Stackelberg. Purple: canonical Stackelberg.
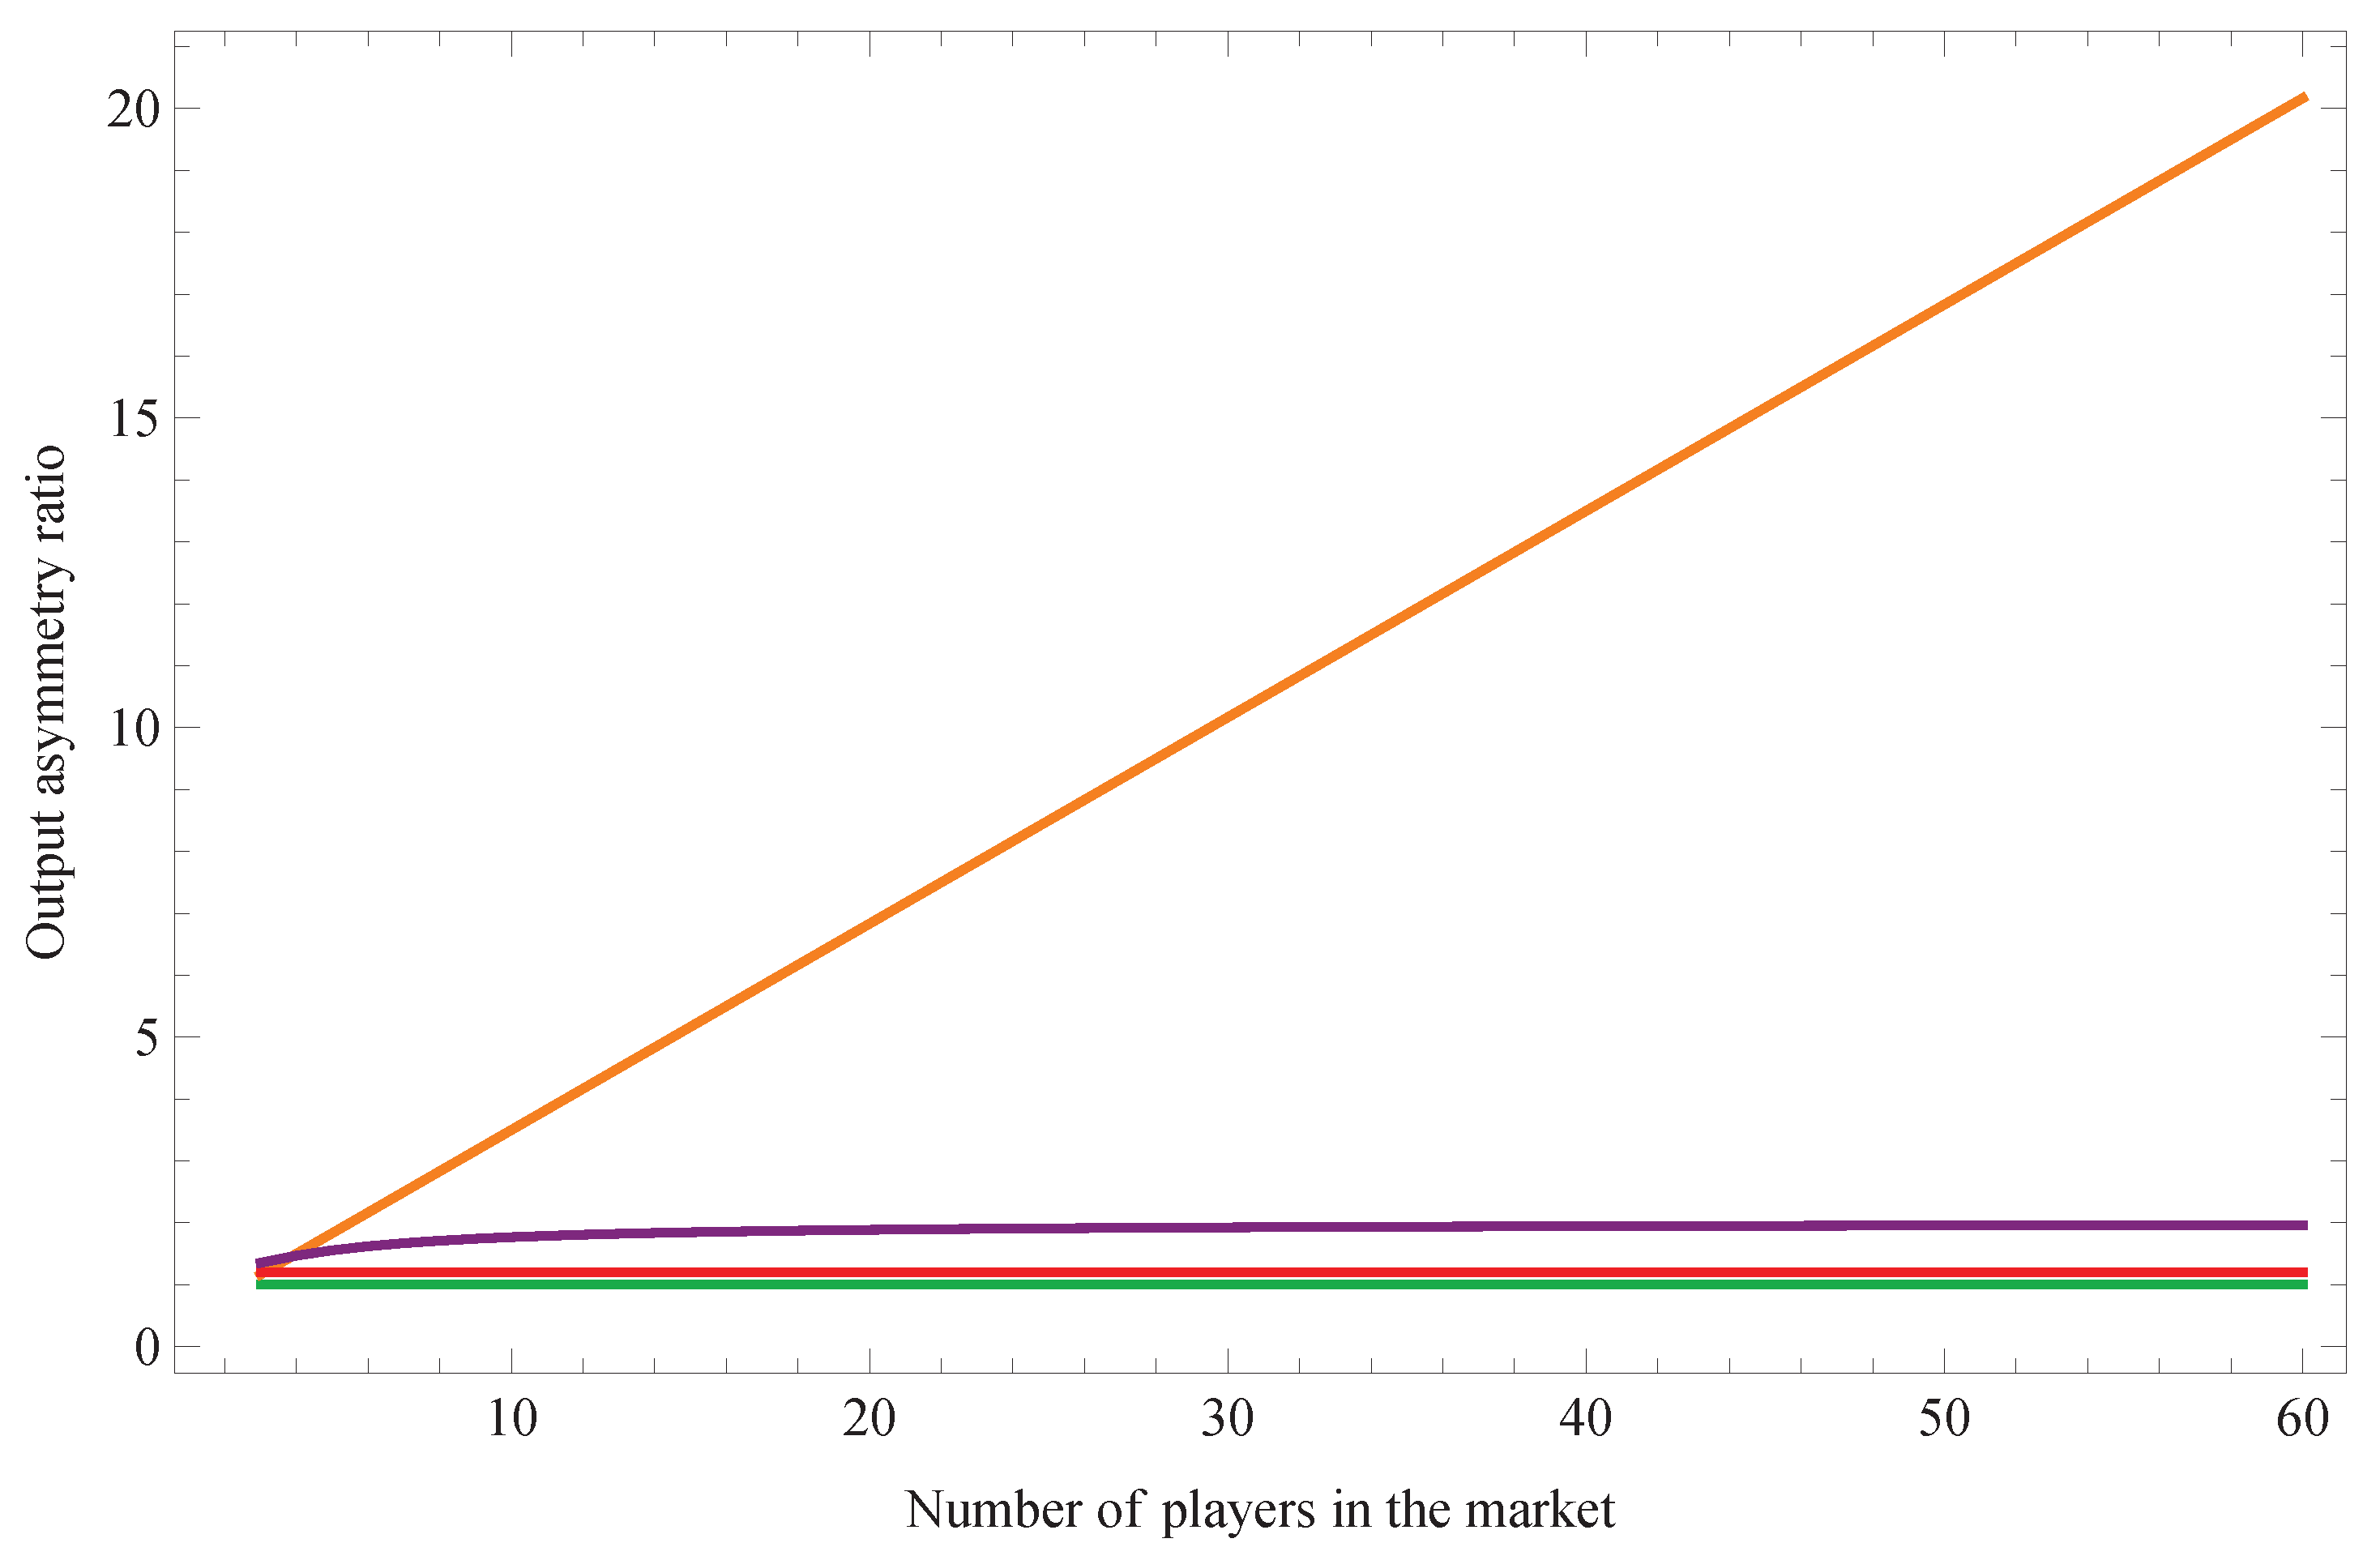
Figure 8.
Market concentration index . Blue: Cournot. Green: cartel. Orange: failed cartel. Red: Cournot–Stackelberg. Purple: canonical Stackelberg.
Figure 8.
Market concentration index . Blue: Cournot. Green: cartel. Orange: failed cartel. Red: Cournot–Stackelberg. Purple: canonical Stackelberg.
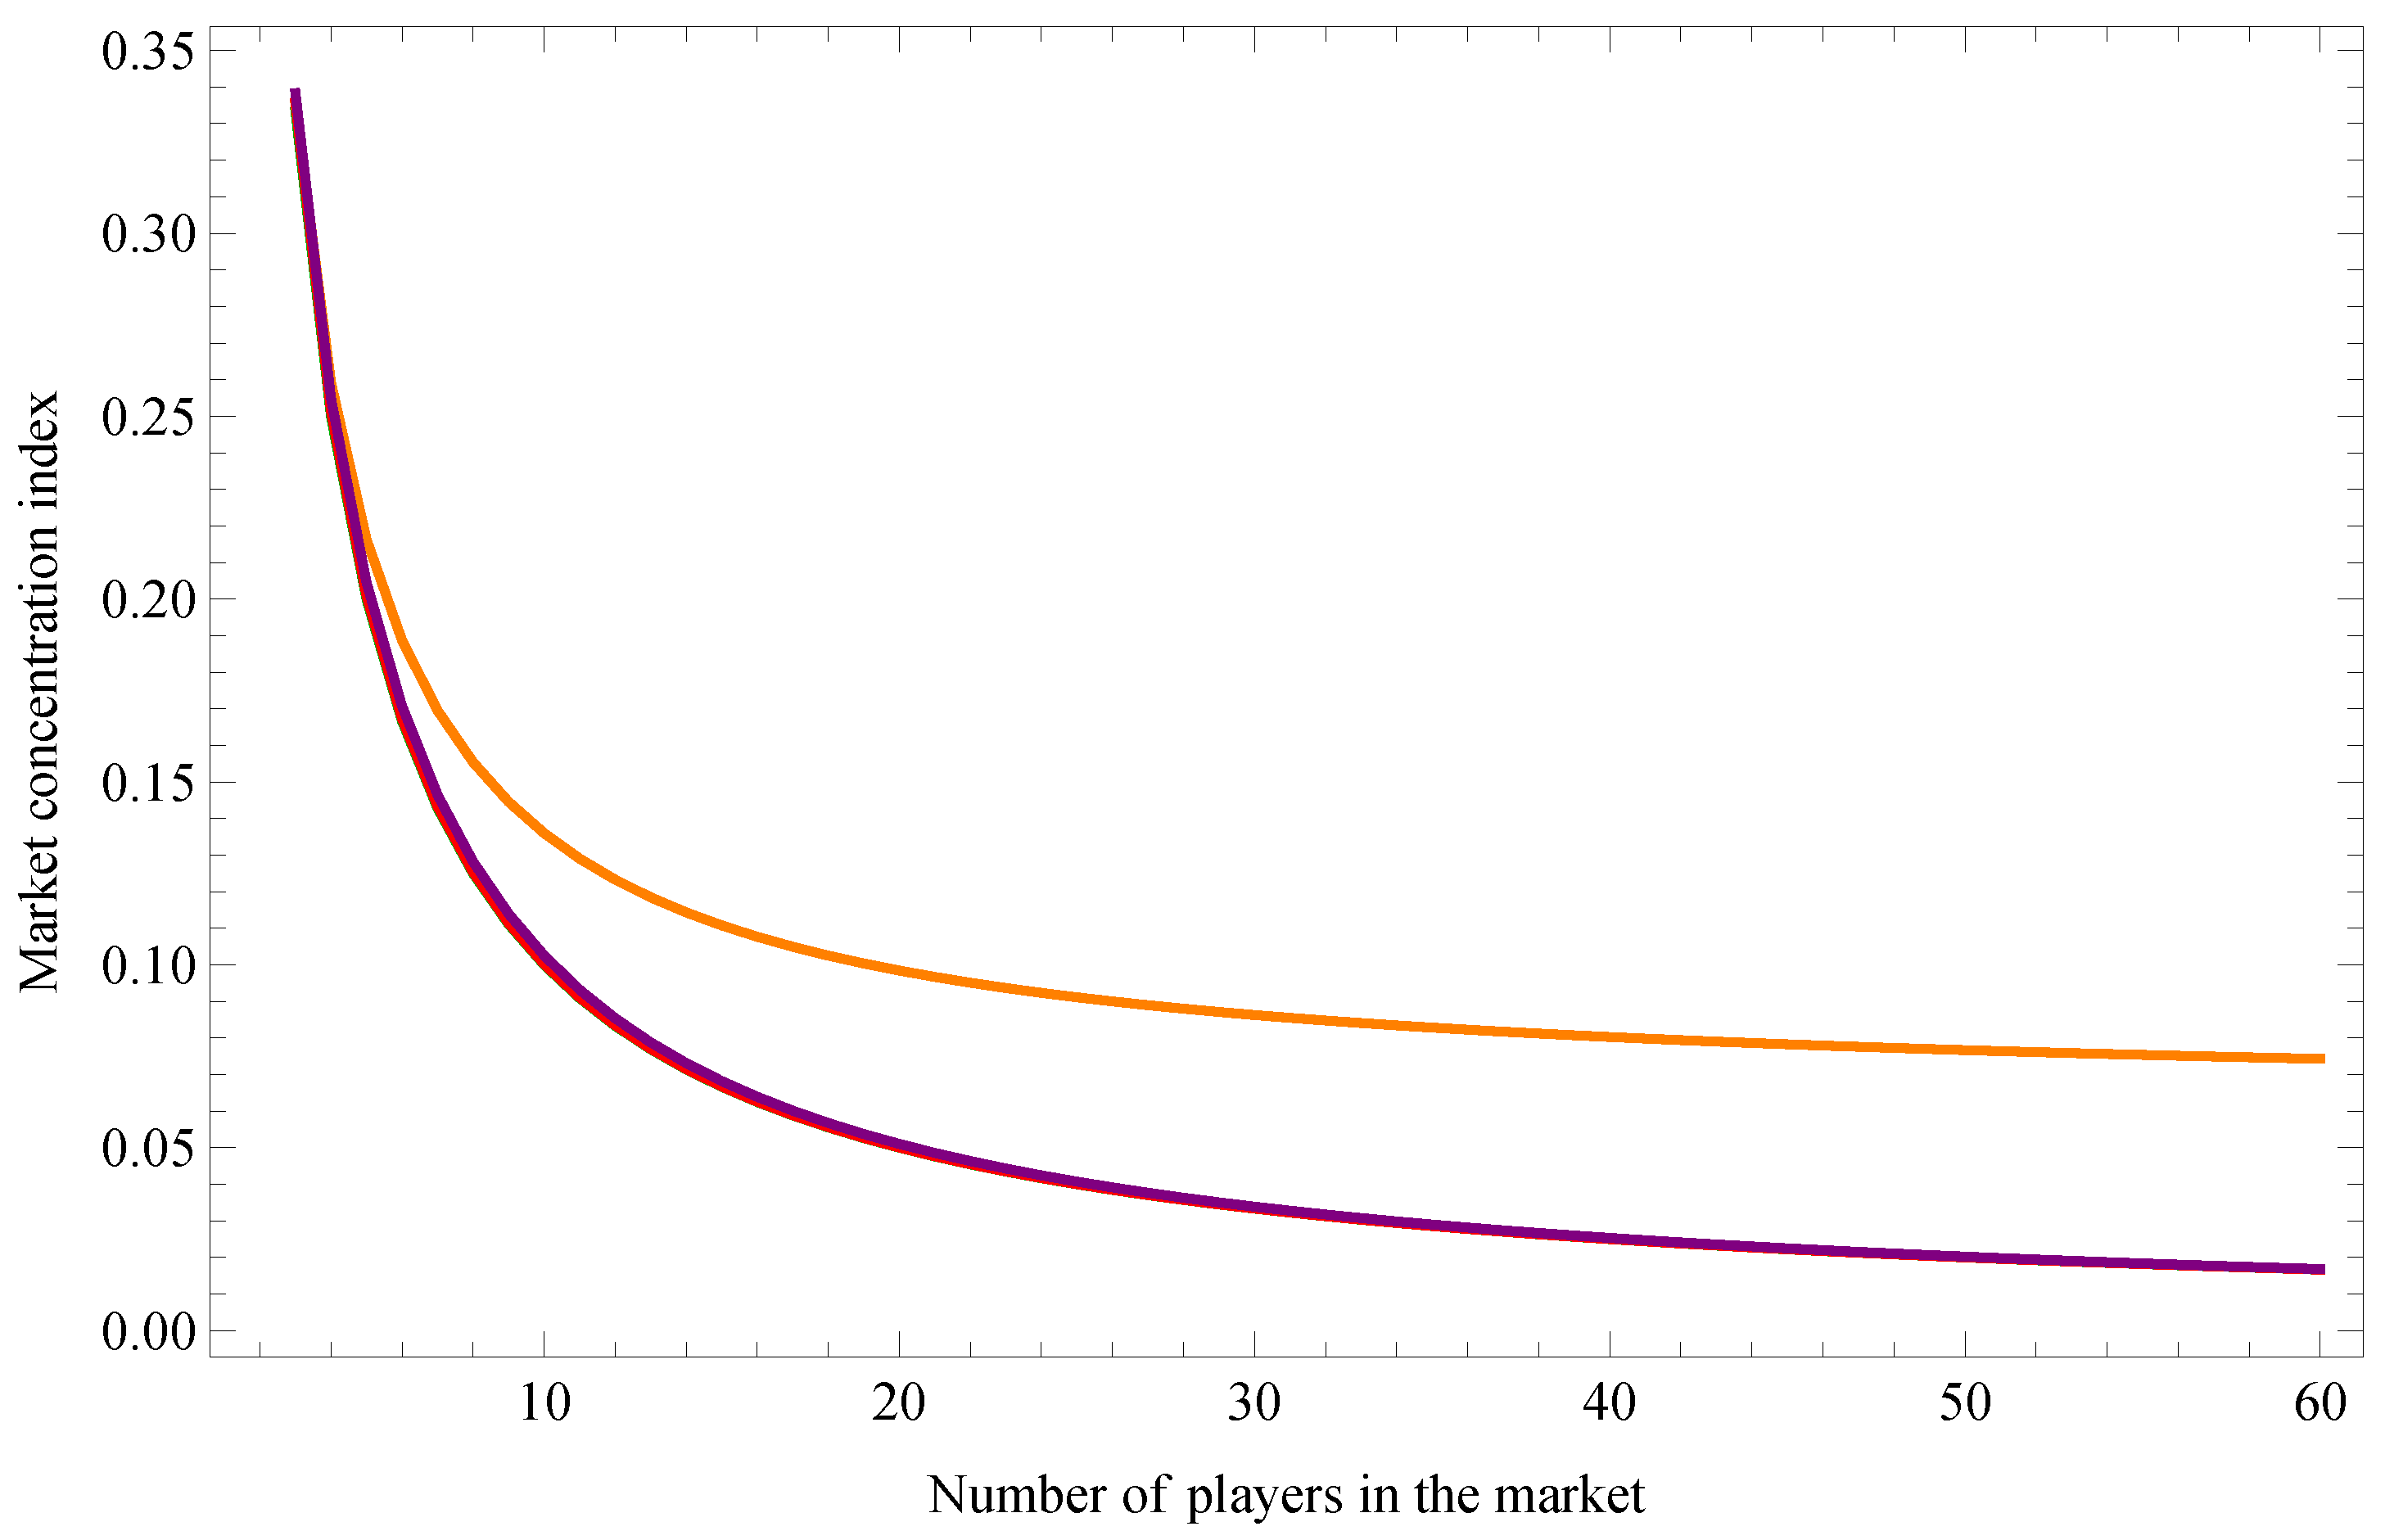
Figure 9.
Firm-level output trajectories in the Cournot-Stackelberg isoelastic benchmark. Blue: firms 1 and 2. Orange: firm 3.
Figure 9.
Firm-level output trajectories in the Cournot-Stackelberg isoelastic benchmark. Blue: firms 1 and 2. Orange: firm 3.
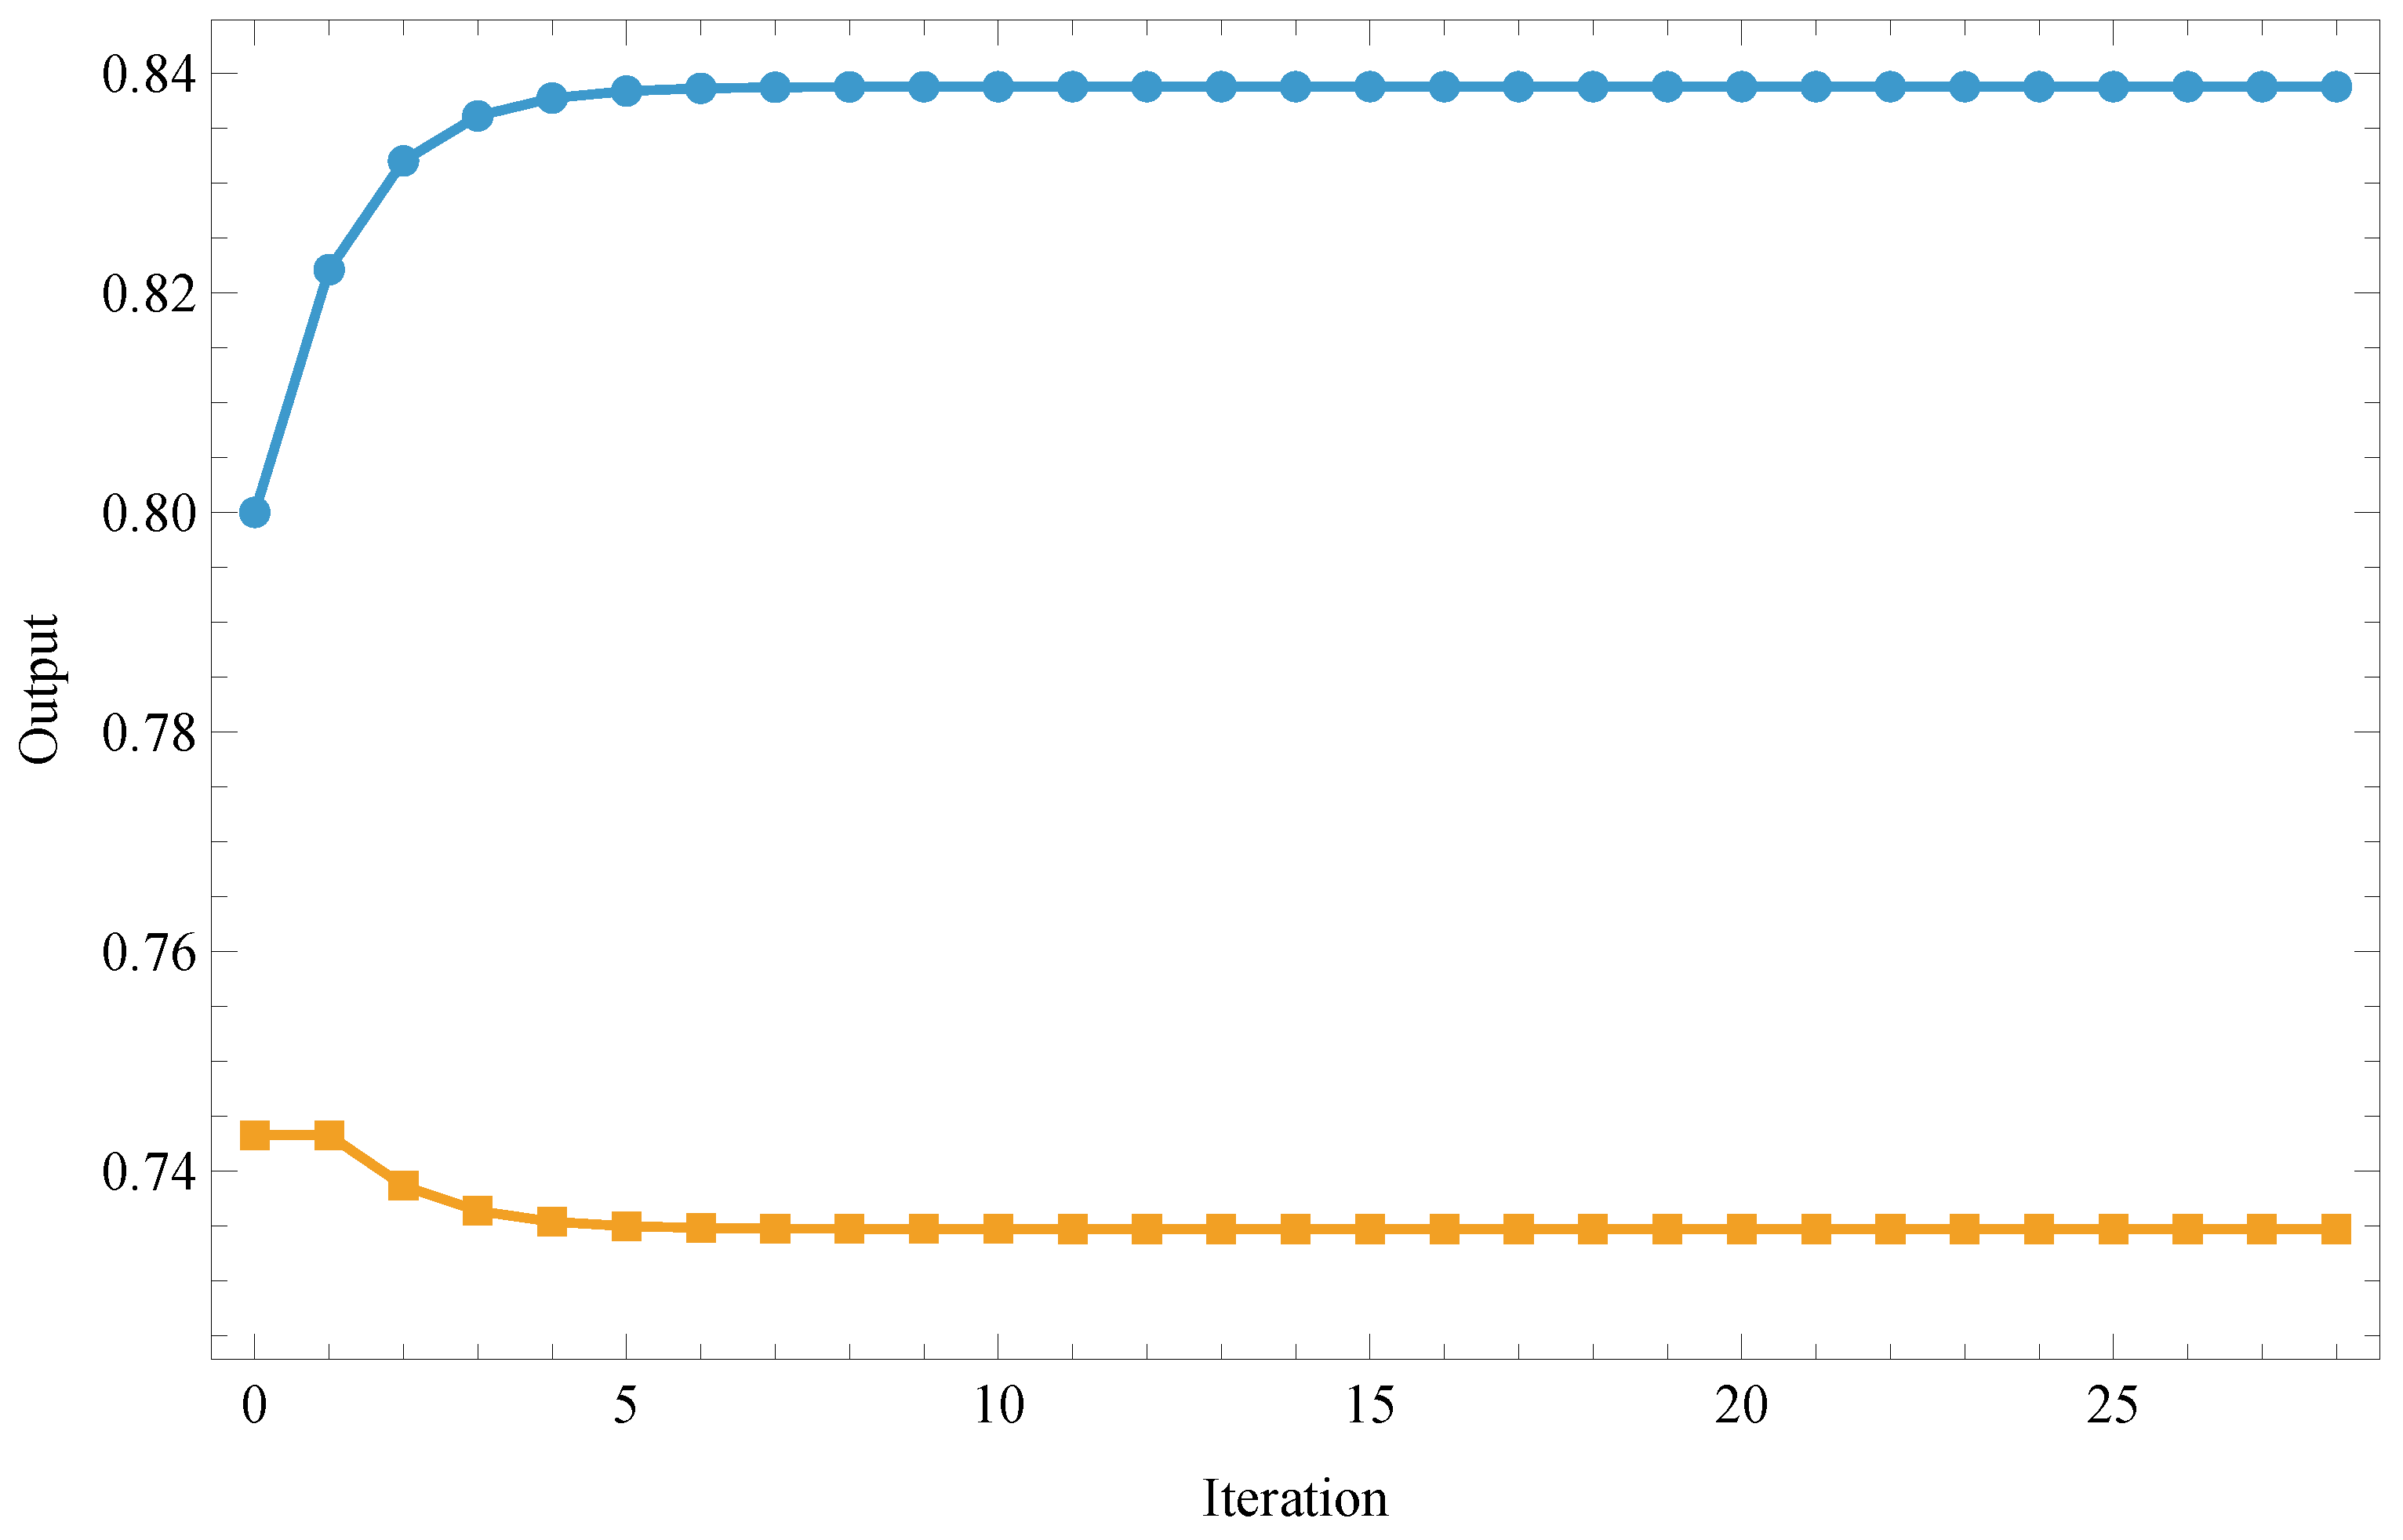
Figure 10.
Firm-level output trajectory in the symmetric Cournot isoelastic benchmark. The single line represents firms 1, 2, and 3.
Figure 10.
Firm-level output trajectory in the symmetric Cournot isoelastic benchmark. The single line represents firms 1, 2, and 3.
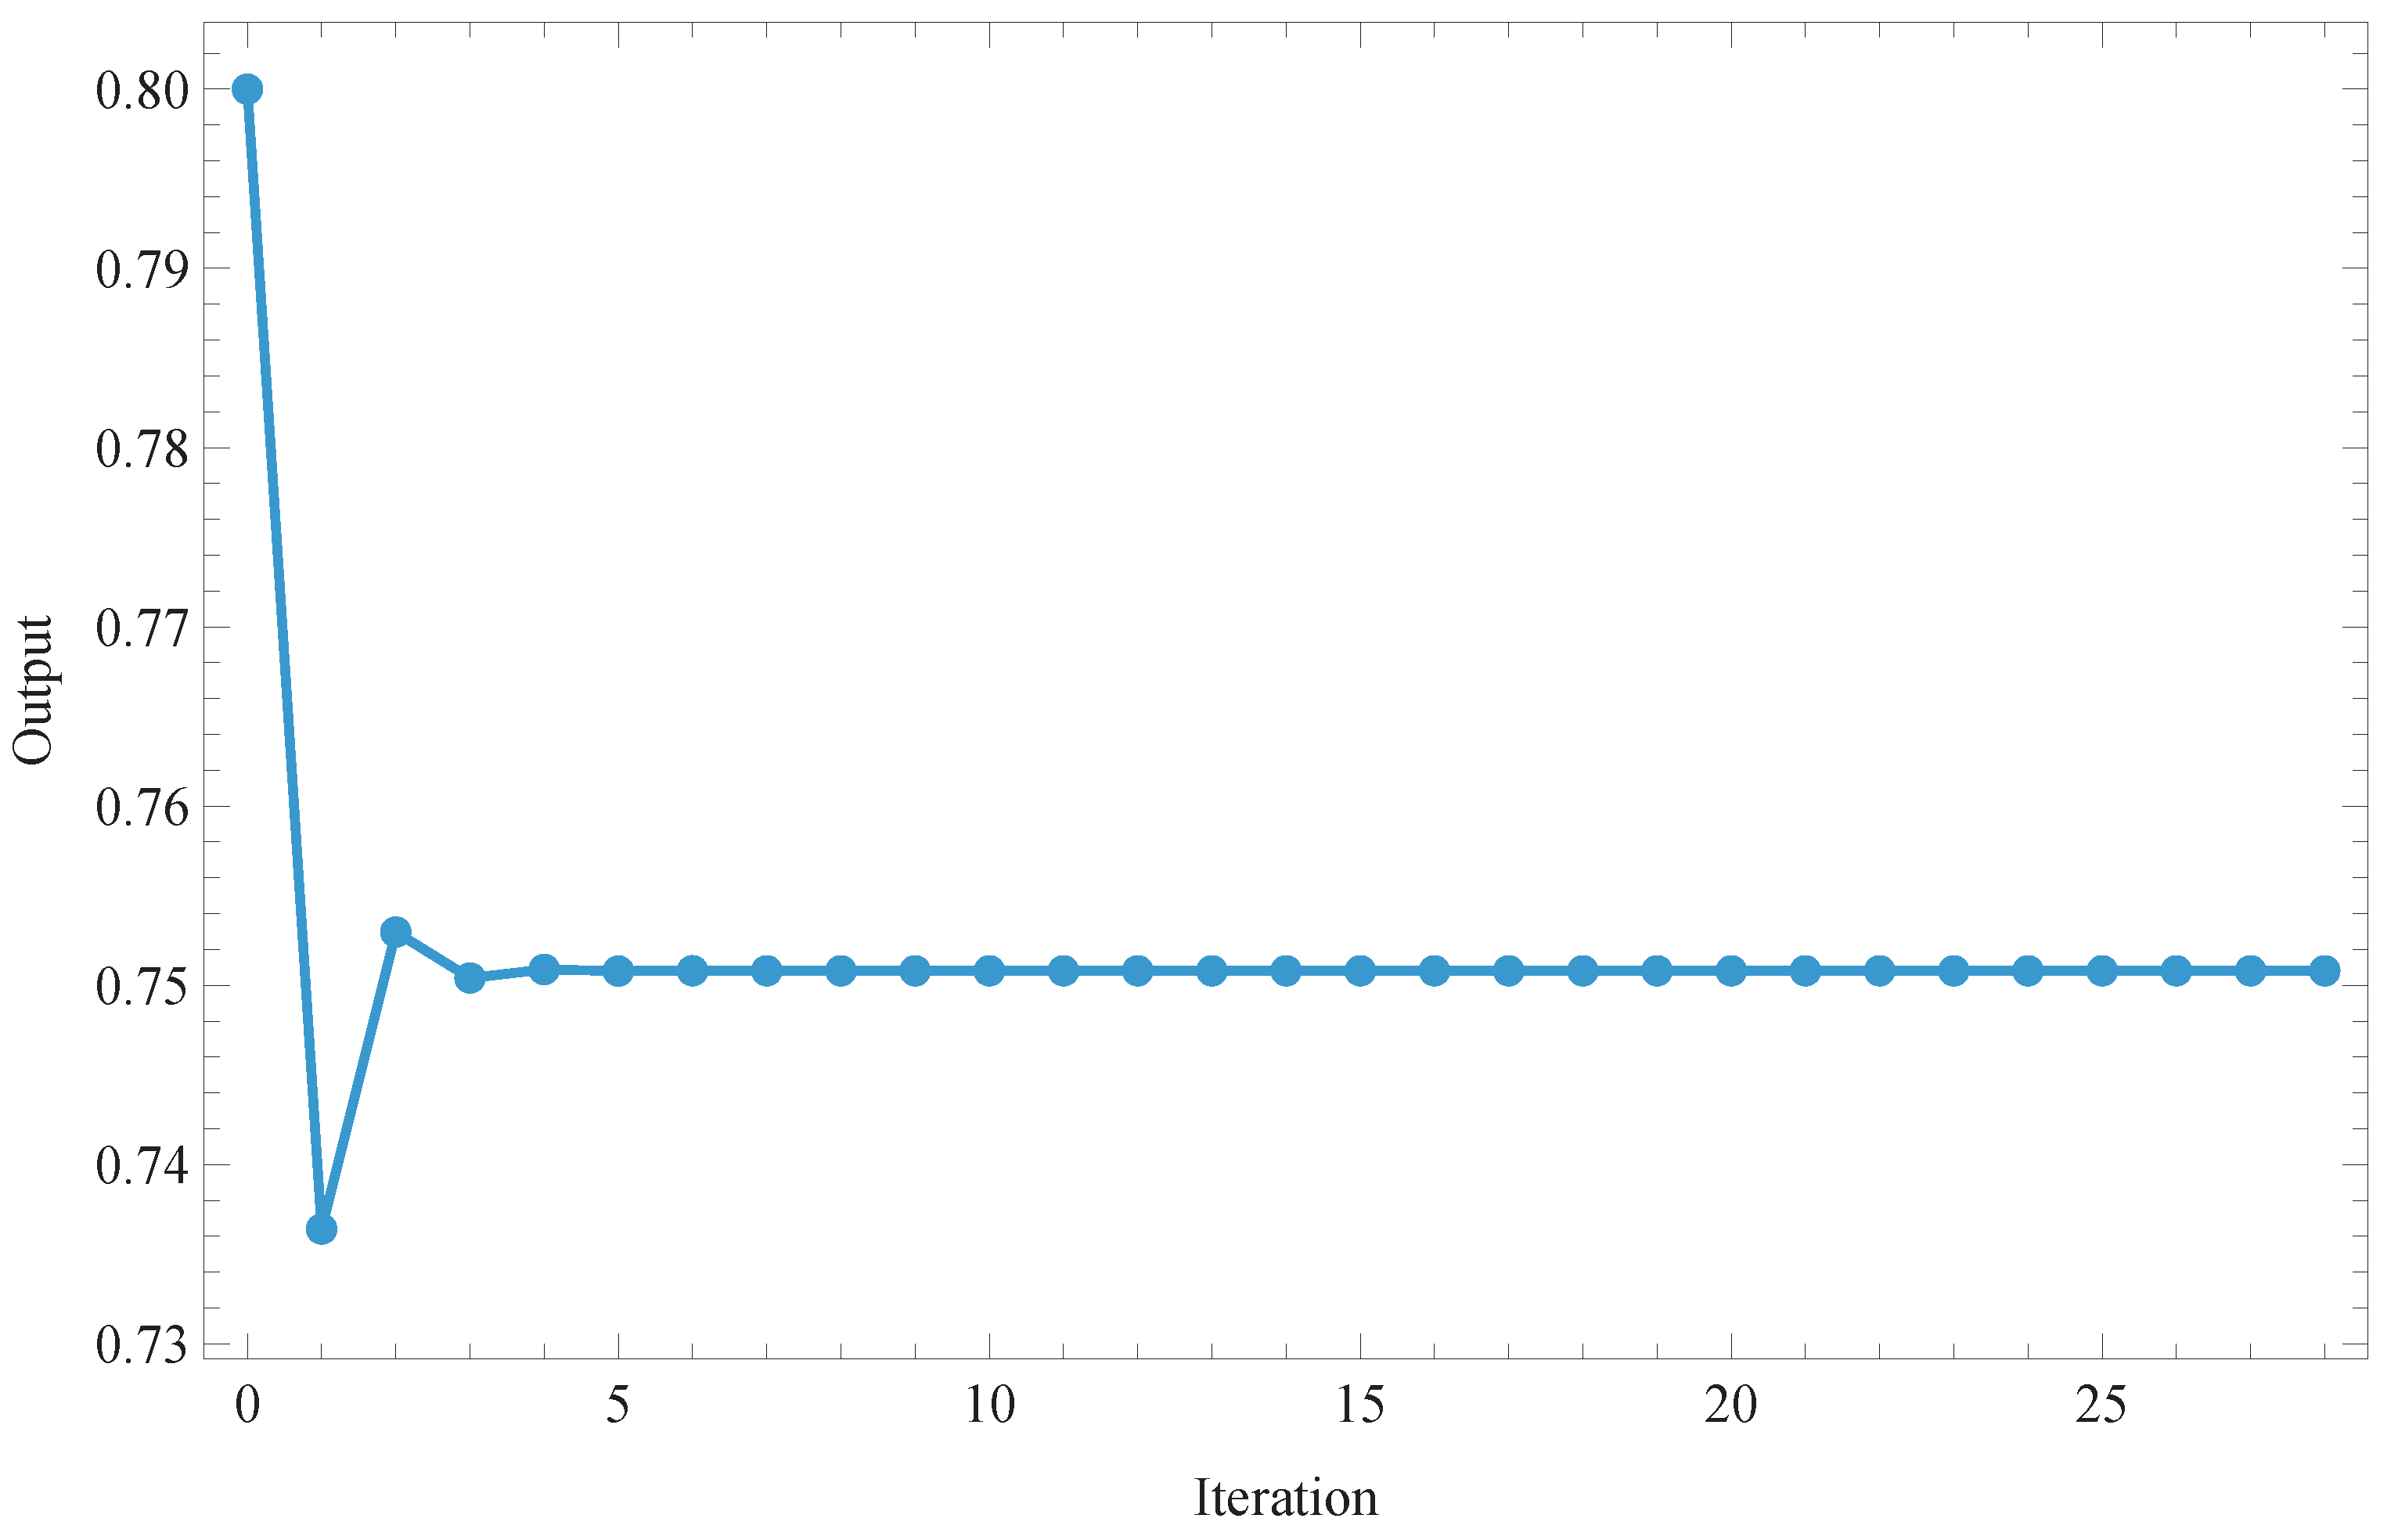
Figure 11.
Firm-level output trajectories in the projected cartel isoelastic benchmark. Blue: firm 3. Orange: firms 1 and 2.
Figure 11.
Firm-level output trajectories in the projected cartel isoelastic benchmark. Blue: firm 3. Orange: firms 1 and 2.
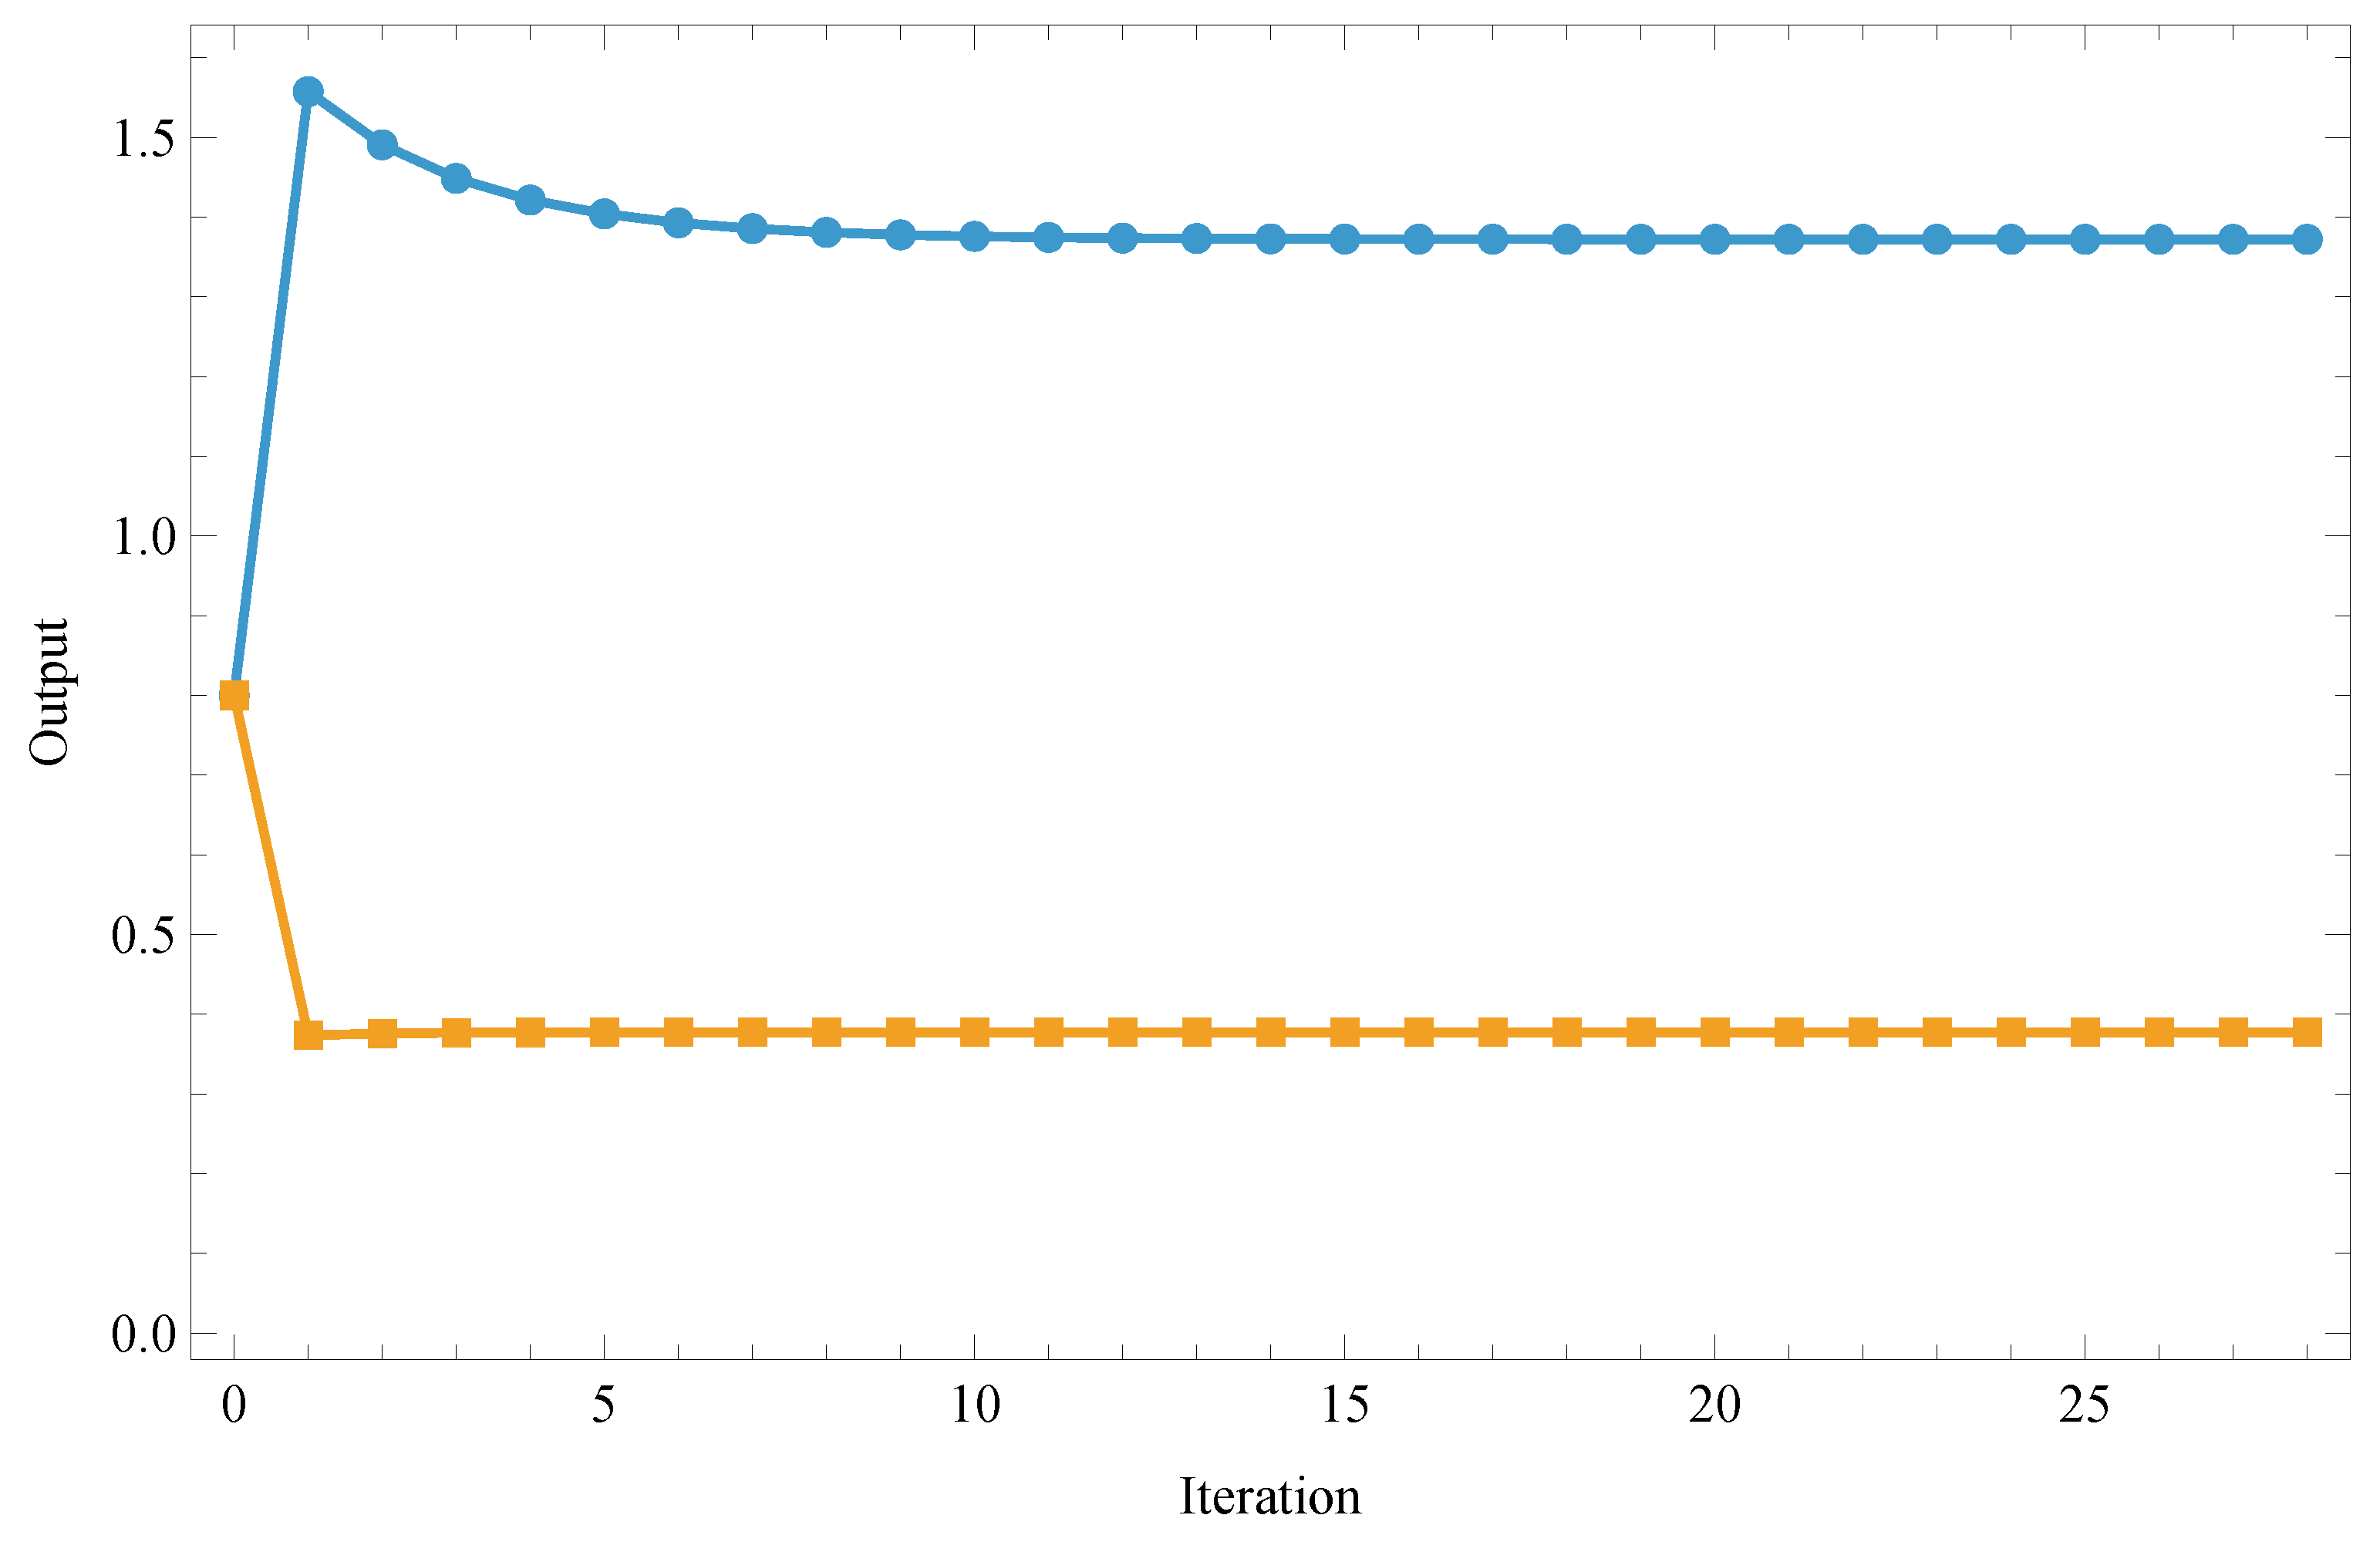
Figure 12.
Firm-level output trajectories in the canonical Stackelberg isoelastic benchmark. Blue: firm 3. Orange: firm 2. Green: firm 1.
Figure 12.
Firm-level output trajectories in the canonical Stackelberg isoelastic benchmark. Blue: firm 3. Orange: firm 2. Green: firm 1.
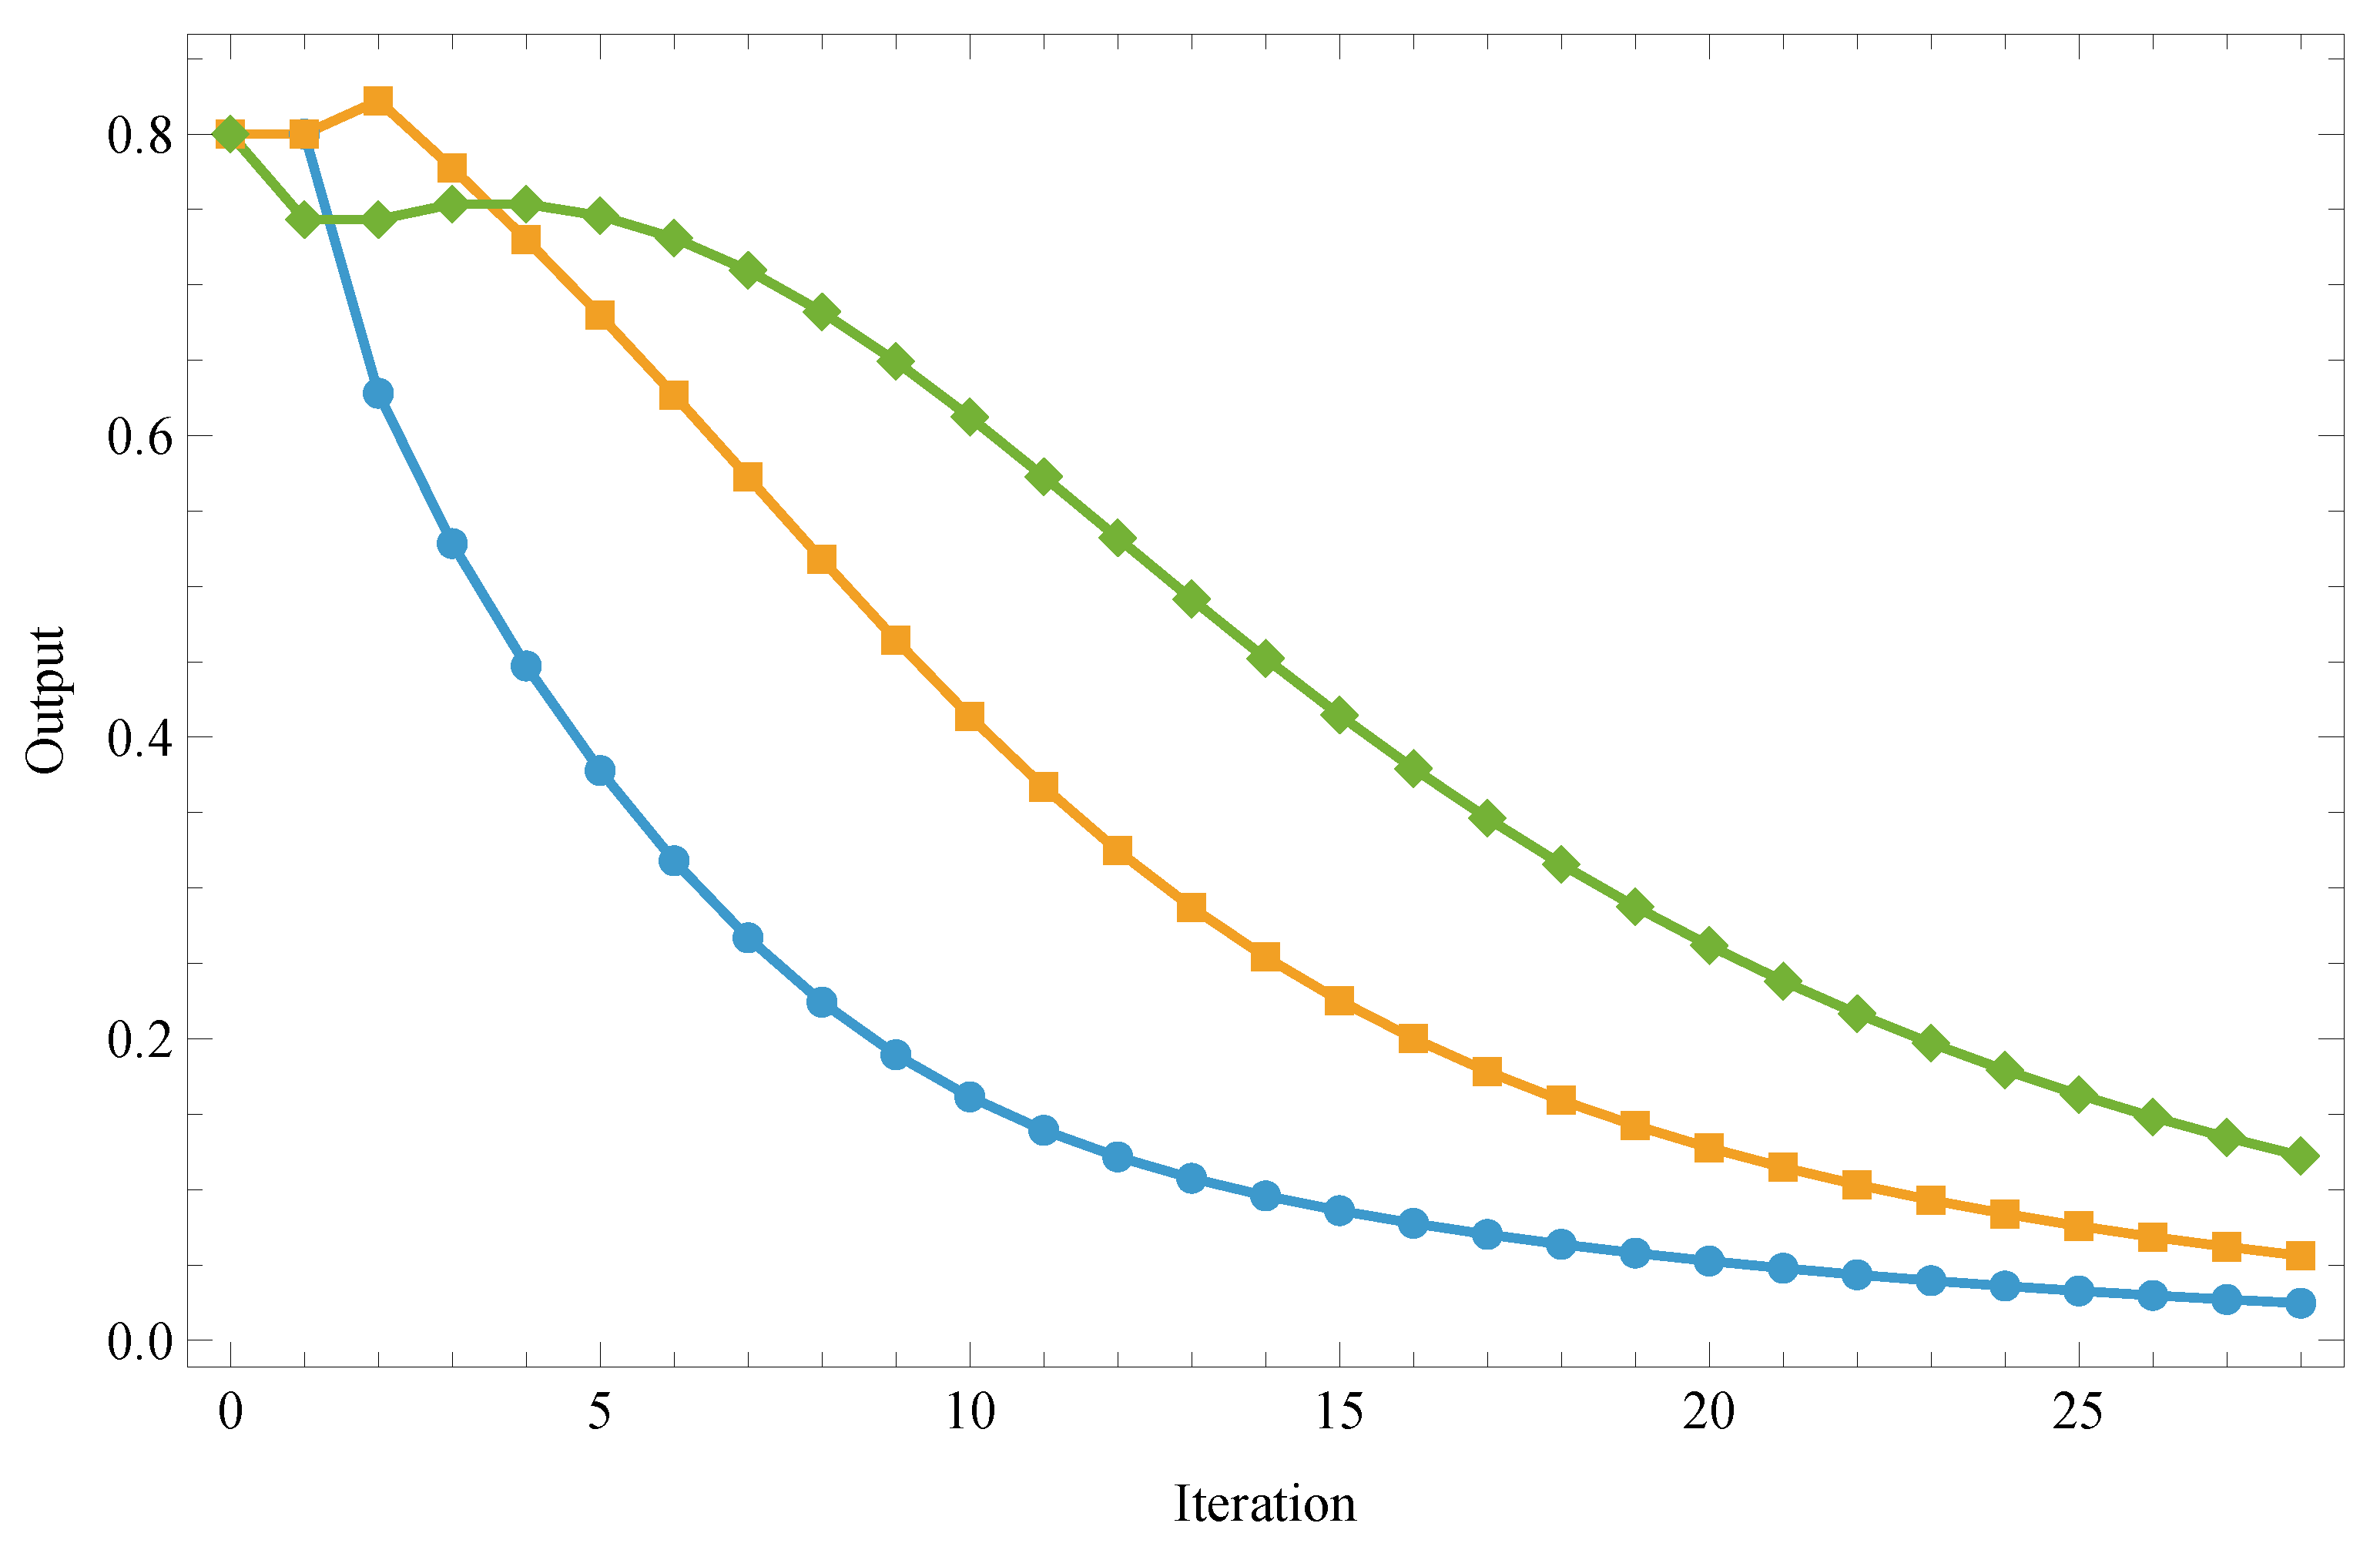
Figure 13.
Total output trajectories under the isoelastic specification. Blue: Cournot. Orange: cartel. Green: Cournot-Stackelberg. Red: canonical Stackelberg.
Figure 13.
Total output trajectories under the isoelastic specification. Blue: Cournot. Orange: cartel. Green: Cournot-Stackelberg. Red: canonical Stackelberg.
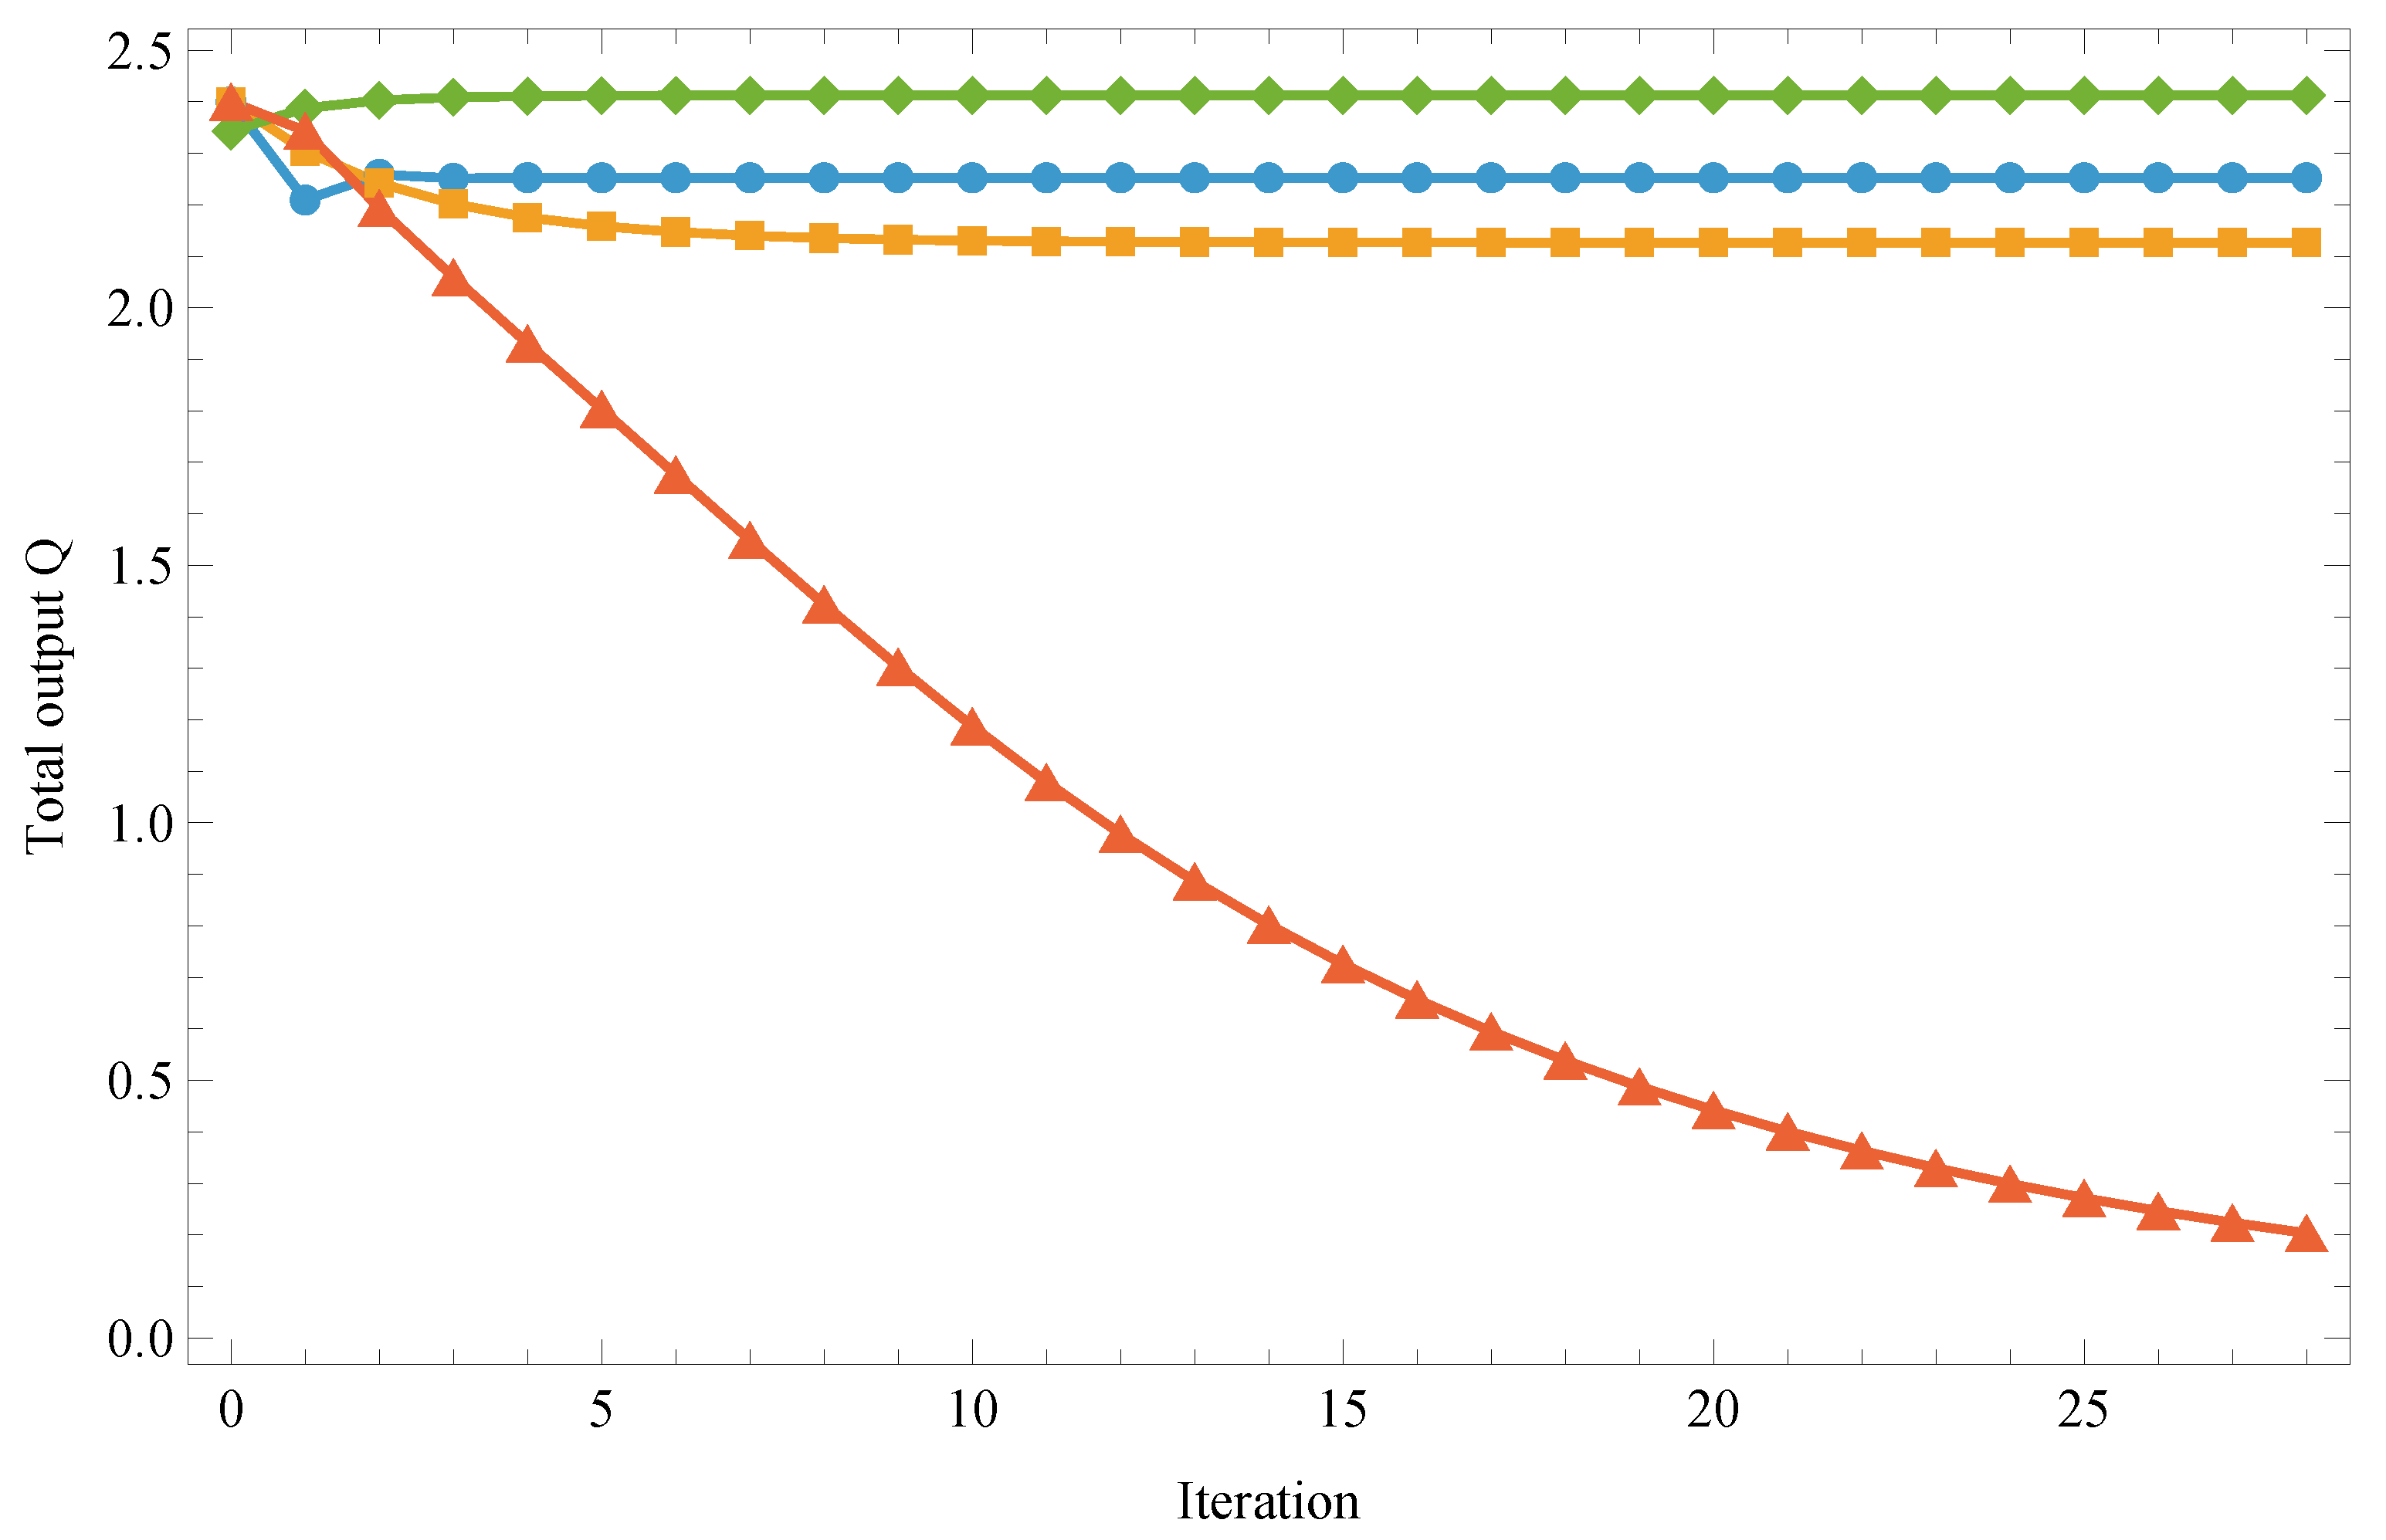
Disclaimer/Publisher’s Note: The statements, opinions and data contained in all publications are solely those of the individual author(s) and contributor(s) and not of MDPI and/or the editor(s). MDPI and/or the editor(s) disclaim responsibility for any injury to people or property resulting from any ideas, methods, instructions or products referred to in the content. |
© 2026 by the authors. Licensee MDPI, Basel, Switzerland. This article is an open access article distributed under the terms and conditions of the Creative Commons Attribution (CC BY) license (http://creativecommons.org/licenses/by/4.0/).
Copyright: This open access article is published under a Creative Commons CC BY 4.0 license, which permit the free download, distribution, and reuse, provided that the author and preprint are cited in any reuse.