

Submitted:
13 August 2026
Posted:
14 August 2026
You are already at the latest version
Abstract
This study develops an integrated Explain–Predict–Classify framework to investigate the determinants, territorial heterogeneity, and predictability of regional innovation performance. Using Regional Innovation Scoreboard data for 246 regional units across 31 European countries over 2016–2023, the analysis combines panel-data econometrics, unsupervised clustering, and supervised machine-learning regression. The Summary Innovation Index (SII) is examined alongside indicators capturing scientific collaboration, non-R&D innovation expenditure, SME product and process innovation, collaborative networks, design applications, innovative sales, and environmental conditions. Econometric results show positive and statistically significant associations across all selected innovation dimensions. The Hausman test favors fixed effects over random effects, while the dynamic specification indicates significant persistence in regional innovation performance, although instrument-validity diagnostics require caution. The clustering analysis compares six algorithms using multiple internal validation criteria. K-Means provides the strongest overall solution, with R² = 0.6301, a Calinski–Harabasz index of 370.60, and relatively balanced cluster sizes, revealing ten heterogeneous and partially overlapping regional innovation profiles. The predictive analysis compares seven regression algorithms. K-Nearest Neighbors achieves the strongest test performance (R² = 0.9482; RMSE = 7.90; MAE = 4.793), followed by Random Forest (R² = 0.9289). Permutation importance identifies international scientific co-publications, design applications, and SME collaboration as the most influential KNN predictors. Overall, the findings demonstrate that regional innovation combines common systematic relationships with heterogeneous territorial configurations and nonlinear predictive structures. Integrating econometrics, clustering, and machine learning therefore provides a richer empirical basis for understanding regional innovation and designing differentiated, place-sensitive innovation policies.
Keywords:
regional innovation
; machine learning
; panel data
; innovation performance
; clustering algorithms
1. Introduction
Innovation has become a fundamental determinant of regional competitiveness, productivity, technological transformation, and long-term economic resilience. Nevertheless, innovation performance remains highly heterogeneous across territories (Ascani et al., 2020; Hervás-Oliver et al., 2021; Żółtaszek & Olejnik, 2024). Regions operating within similar institutional and macroeconomic environments may differ substantially in their ability to generate knowledge, develop innovative firms, establish collaborative networks, exploit intellectual assets, and transform innovation into market outcomes (Ascani et al., 2020; Hervás-Oliver et al., 2021). Understanding this heterogeneity is therefore important both academically and for designing effective place-based innovation policies. Composite measures such as the Summary Innovation Index (SII) provide a multidimensional representation of regional innovation, while longitudinal regional datasets offer opportunities to combine conventional econometric analysis with data-driven methods (Żółtaszek & Olejnik, 2024; Beynon et al., 2024).
Regional innovation presents several methodological challenges. First, innovation performance is persistent over time because knowledge, technological capabilities, networks, infrastructure, and institutional conditions accumulate gradually. Second, regions differ in characteristics that are difficult to observe directly, including industrial specialization, entrepreneurial culture, institutional quality, and historical development trajectories (Ascani et al., 2020). Third, relationships among innovation dimensions may be nonlinear and characterized by interactions that conventional parametric models cannot fully capture (Beynon et al., 2024; Xiang et al., 2023). Finally, regions cannot necessarily be treated as a homogeneous population, since similar aggregate innovation outcomes may result from different combinations of scientific collaboration, business innovation, intellectual assets, cooperation, and commercialization capabilities. In particular, configurational evidence suggests that economically developed and lagging European regions may exhibit different combinations of innovation conditions and pathways (Filippopoulos & Fotopoulos, 2022).
These characteristics suggest that no single empirical methodology can capture the full complexity of regional innovation. Panel-data econometrics can identify systematic conditional associations while controlling for unobserved regional heterogeneity and temporal dynamics. Supervised machine-learning algorithms can assess predictive performance and capture potentially nonlinear structures, complementing conventional explanatory approaches with a prediction-oriented perspective (Xiang et al., 2023). Unsupervised learning, particularly clustering, can identify latent regional configurations without imposing predefined territorial classifications. More broadly, the innovation-ecosystem literature emphasizes the systemic and interconnected character of innovation processes, reinforcing the need for multidimensional analytical perspectives (Shi et al., 2023). Accordingly, this study conceptualizes regional innovation simultaneously as an explanatory, predictive, and structural phenomenon.
Despite extensive research on regional innovation systems, these perspectives are frequently investigated separately. Econometric studies generally emphasize interpretable relationships between innovation performance and R&D, human capital, collaboration, knowledge spillovers, and institutional characteristics (Hervás-Oliver et al., 2021; Ascani et al., 2020), but often devote limited attention to predictive accuracy and latent territorial structures. Machine-learning and forecasting studies prioritize predictive performance and potentially nonlinear relationships but may provide less direct economic interpretation (Xiang et al., 2023). Configurational approaches, in turn, demonstrate that heterogeneous combinations of conditions may underlie regional innovation performance (Filippopoulos & Fotopoulos, 2022; Beynon et al., 2024), but rarely connect these structures systematically with both explanatory and predictive evidence. This methodological fragmentation constitutes the central research gap addressed by the study.
The paper therefore develops an integrated Explain–Classify–Predict framework in which the three methodological families perform complementary functions. The explanatory component compares fixed-effects, random-effects, and dynamic panel specifications to identify robust associations between SII and selected innovation dimensions while accounting for territorial heterogeneity and temporal persistence. The structural component compares Density-Based, Fuzzy C-Means, Hierarchical, Model-Based, K-Means, and Random Forest clustering using multiple internal validation criteria. Finally, the predictive component compares K-Nearest Neighbors, Random Forest, Boosting Regression, Decision Tree, Support Vector Machine Regression, Lasso, and Linear Regression using common out-of-sample performance metrics. Rather than selecting estimators or algorithms a priori, methodological choice is consequently treated as an empirical question. This strategy responds to the broader need to account for both heterogeneous regional innovation configurations (Filippopoulos & Fotopoulos, 2022; Beynon et al., 2024) and predictive relationships that may not be adequately represented by conventional linear models (Xiang et al., 2023).
Three interconnected research questions follow. RQ1 asks which dimensions of the regional innovation ecosystem are systematically associated with innovation performance after accounting for unobserved heterogeneity and temporal dynamics. RQ2 examines whether identifiable latent innovation configurations exist across regions and which clustering algorithm provides the most coherent representation of this heterogeneity. RQ3 investigates the extent to which machine-learning algorithms can predict SII and which algorithm achieves the strongest out-of-sample performance. The objective is not to interpret econometric relationships automatically as causal effects, but to compare explanatory robustness, structural heterogeneity, and predictive capability using the same underlying information set.
Empirically, the study employs a longitudinal dataset covering the 2016–2023 period, with up to 1,968 region-year observations. SII is examined alongside indicators capturing international scientific collaboration, non-R&D innovation expenditure, SME product and business-process innovation, innovative collaboration, design applications, innovative sales, and environmental conditions. This multidimensional approach is consistent with evidence showing that regional innovation performance depends on multiple interconnected capabilities rather than a single innovation input (Hervás-Oliver et al., 2021; Shi et al., 2023). The panel structure further enables innovation to be analyzed as an evolving territorial process rather than merely as a cross-sectional ranking.
The originality of the research therefore lies primarily in methodological integration rather than in any individual technique. Preliminary evidence illustrates the value of this strategy: fixed effects receive strong support relative to random effects; K-Means achieves the strongest overall clustering profile, while hierarchical clustering performs particularly well on separation criteria; and KNN provides the strongest predictive performance among the supervised algorithms. More broadly, the study contributes by connecting explanation, classification, and prediction, systematically benchmarking competing methodologies, and shifting attention from average innovation relationships toward the coexistence of common drivers and heterogeneous territorial configurations. This integrated perspective extends existing evidence on regional innovation heterogeneity and configurational pathways (Filippopoulos & Fotopoulos, 2022; Beynon et al., 2024) and may provide a stronger empirical foundation for differentiated and place-sensitive regional innovation policies.
The remainder of the paper is structured as follows. Section 2 reviews the literature and identifies the research gap. Section 3 describes the dataset, variables, and integrated methodology. Section 4 presents the panel econometric models and diagnostic tests. Section 5 compares alternative clustering algorithms and examines regional innovation profiles. Section 6 evaluates the predictive performance of machine-learning regression algorithms. Section 7 integrates and discusses the econometric, clustering, and predictive findings. Section 8 develops the main policy implications. Section 9 discusses the study’s limitations. Section 10 concludes and identifies future research directions. Appendix A reports the countries and regional units included in the dataset.
2. Literature Review
2.1. Regional Innovation Systems, Ecosystems and Measurement
Innovation is now widely treated as a systemic and territorially embedded phenomenon, a tradition progressively reframed through the language of innovation ecosystems (Shi et al., 2023). Helix models remain the dominant heuristic, from the triple helix (Tao & Shuliang, 2022) to the quadruple helix, in which civil society mediates innovation outcomes (González-Martinez et al., 2023), and the quintuple helix, which reveals science-anchored but structurally imbalanced regional configurations (Carayannis et al., 2026). A parallel strand stresses that regional systems also carry meaning and normative orientation, through innovation cultures and narratives (Pfotenhauer et al., 2023), long-run cultural legacies (Chen & Ye, 2025), responsible-innovation practices (Bankins et al., 2026), sector-specific actors (Poček, 2026), contested technological objects (van Apeldoorn et al., 2025) and coordination problems that cannot be assumed away (Shakiba & Belitski, 2025). Measurement choices are themselves consequential: alternative aggregation rules reorder European regions (Damiani et al., 2026; Gerlitz et al., 2020), efficiency-based approaches distinguish leaders from followers and separate technology development from commercialisation (Żółtaszek & Olejnik, 2024; Min et al., 2020; Mukhiyayeva et al., 2026), and purpose-built composite architectures capture capacity, adaptability, niche fitness and inequality (Wu et al., 2026; Xie et al., 2023; Yang et al., 2023b; Xu et al., 2022). This motivates the present use of the Summary Innovation Index together with its constituent dimensions rather than the composite alone.
2.2. Determinants of Regional Innovation Performance
Scientific collaboration. External connectivity and local capability are complementary rather than substitutes (Ascani et al., 2020; Xie & Su, 2021), and network position translates into innovation capacity while generating knowledge asymmetries (Ferrer-Serrano et al., 2025; Archibugi et al., 2022; Françoso & Vonortas, 2023; Araki et al., 2024). Proximity operates through absorptive capacity (Zhao & Wang, 2025), and collaboration shapes technological complexity, knowledge transfer, spillovers and resilience to shocks (Frigon, 2026; Sun & Li, 2026; Sergio et al., 2023; Ma et al., 2026). Universities and public research organisations anchor these networks (Pfister et al., 2021; Robbiano, 2022; Xia et al., 2026; Zhao et al., 2024), with organisational conditions examined by Villani and Lechner (2021), Vefago et al. (2020), Bukhari et al. (2021), Tomasi et al. (2024), Bogers et al. (2026) and Messina et al. (2022).
SME innovation and non-R&D expenditure. SME innovation rests on a plurality of internal sources, both R&D and non-R&D based, and on external drivers (Hervás-Oliver et al., 2021; Aronica et al., 2022), with configurational evidence showing that distinct combinations of conditions generate comparable outcomes (Beynon et al., 2024; Filippopoulos & Fotopoulos, 2022; Mamatzakis et al., 2026). Related variety operates through non-linear pathways (Ejdemo & Örtqvist, 2020; Yang et al., 2020; De Noni et al., 2021), while firm-level evidence concerns managerial engagement with ecosystems, green business models, innovative milieux and public investment (Zabudkina et al., 2026; Lee et al., 2024; Yu et al., 2020; Antenozio et al., 2025).
Cooperation and intermediaries. Cluster policy measurably affects collaboration networks and science–industry linkages (Graf & Broekel, 2020; Quignon, 2025; Ungureanu, 2023; Creanga et al., 2022; Bhawsar, 2023; Bratanova et al., 2022), and intermediaries and incubators organise cooperation where it does not emerge spontaneously (Duan & Jin, 2022a, 2022b; Yin et al., 2022; Wang et al., 2020; Toroslu et al., 2025; Chu et al., 2023; Liao, 2025; Bouguerra et al., 2024; Fatemi et al., 2024; Kruse, 2025).
Intellectual assets, design and commercialisation. Aesthetic and creative forms of intellectual property have measurable regional effects (Bergamini et al., 2026; Huang & Zou, 2024; Nylund & Brem, 2024), while the circulation and protection of intellectual assets qualifies the interpretation of patent counts (Kadlec et al., 2023; Cai et al., 2024; Wang & Wang, 2025; Elhorst & Faems, 2021). Commercial outcomes diffuse through foreign investment, with effects contingent on entry mode and concentration risks (Jiang et al., 2022; Damioli & Marin, 2024; Zhang & Liu, 2024; Liang et al., 2022; Pardy, 2025), and through digitalisation (Ouyang & Hu, 2026; Gao, 2025; Zhou et al., 2026a; Deng, 2026; Wu & Wang, 2025; Yang & Liu, 2024), although convergence remains contested (Yang et al., 2023a).
Contextual conditions. Government action shapes performance through standardisation, subsidies, support and institutional quality (Hu & Liu, 2022; Wang et al., 2026; Gao et al., 2021; Zheng et al., 2021; Edeh & Prévot, 2024; Zhang et al., 2023; Liang & Li, 2023; Chen et al., 2024; Zhou et al., 2026b; Yin et al., 2025). Accessibility and infrastructure matter (Komikado et al., 2021; Miwa et al., 2022; Yang et al., 2021; Tang et al., 2024; He & Gao, 2026; Feng & Yuan, 2023), as do financial conditions (Tian & Han, 2021; Lu & Lu, 2026; Li et al., 2022; Wang et al., 2024; Suhrab et al., 2026; Kumar & Operti, 2025) and human capital mobility (Crown et al., 2020; Costa et al., 2023; Yalcinkaya & Ding, 2026). The environmental dimension links innovation to sustainability transitions (Walpole et al., 2025; Ruan & Chen, 2024; Durugbo et al., 2020).
2.3. Methodological Strands and the Research Gap
Panel designs dominate the explanatory literature, with dynamic and GMM specifications where persistence matters (Yin et al., 2022; Wang et al., 2024; Xia et al., 2026; Suhrab et al., 2026; Mamatzakis et al., 2026), instrumental variables and quasi-experiments for identification (Jiang et al., 2022; Damioli & Marin, 2024; Pardy, 2025; Pfister et al., 2021; Cheng et al., 2023; Robbiano, 2022), and explicit treatment of spatial dependence (Yu et al., 2023; Deng, 2026; Wu & Wang, 2025). Algorithmic methods have so far been used mainly for evaluation and forecasting rather than for systematic comparison of competing learners (Xiang et al., 2023; Xie et al., 2023; Yang et al., 2023b; Liao, 2025), and territorial heterogeneity has been addressed largely through configurational calibration rather than unsupervised partitioning (Beynon et al., 2024; Filippopoulos & Fotopoulos, 2022; Chen et al., 2024; Yin et al., 2025; Bratanova et al., 2022; Mukhiyayeva et al., 2026; Xu et al., 2022; Kadlec et al., 2023).
Three gaps follow. Explanation, prediction and classification are pursued in largely separate literatures; methodological choices—estimator, algorithm and cluster number—are typically made a priori rather than tested; and the case for non-linearity is asserted more often than benchmarked against linear specifications. The present study addresses these gaps by applying an Explain–Predict–Classify design to a single panel of 246 regional units over eight years, comparing dynamic, fixed- and random-effects estimators under diagnostic testing, ranking seven supervised algorithms on common out-of-sample metrics, and evaluating six clustering algorithms on multiple internal validation criteria.
See Table 1.
3. Data and Methodology
This study adopts an integrated empirical strategy combining panel-data econometrics, unsupervised machine learning, and supervised machine-learning regression to investigate regional innovation performance from complementary explanatory, structural, and predictive perspectives. The methodological design follows the Explain–Classify–Predict framework introduced in this study. Panel econometric models are first employed to examine the relationships between regional innovation performance and selected dimensions of regional innovation systems while accounting for unobserved territorial heterogeneity and temporal dynamics. Clustering algorithms are subsequently used to identify latent configurations of regional innovation without imposing predefined territorial groups. Finally, supervised machine-learning regression algorithms are compared to evaluate the extent to which regional innovation performance can be predicted from the selected innovation indicators. The combination of these approaches is intended to provide a broader empirical representation of regional innovation than would be obtainable through any single methodological framework.
The empirical analysis is based on regional innovation data derived from the Regional Innovation Scoreboard (RIS) of the European Commission. The final dataset comprises 246 regional units belonging to 31 European countries, observed annually over the 2016–2023 period, resulting in a balanced panel of 1,968 region-year observations. The RIS provides harmonized indicators describing different dimensions of innovation performance at the regional level and represents an appropriate source for comparative analysis because indicators are constructed according to a common methodological framework. The original dataset was reorganized into a longitudinal panel structure in which the regional unit represents the cross-sectional dimension and year represents the temporal dimension. After data preparation and the selection of variables with adequate temporal and territorial coverage, the resulting dataset comprises 246 regional units observed over the period 2016–2023, corresponding to eight annual observations per region and a maximum balanced sample of 1,968 region-year observations. The longitudinal structure of the dataset is particularly important because regional innovation is not treated as a static phenomenon but as a process characterized by persistence, territorial heterogeneity, and changes over time. The principal outcome variable is the Summary Innovation Index (SII), which provides a synthetic measure of overall regional innovation performance. A parsimonious subset of innovation indicators was selected from the wider RIS database after considering data availability and their conceptual relevance to different components of regional innovation systems. The explanatory variables used in the final econometric specifications capture international scientific collaboration (ISCP), non-R&D innovation expenditure (NRDIE), product innovation among SMEs (SMEPI), business-process innovation among SMEs (SMEBPI), innovative collaboration between SMEs (SMECOLL), design applications (DES), sales generated by new-to-market and new-to-firm innovations (NEWSALES), and environmental performance measured through fine-particulate emissions (PMEM). This selection therefore covers several stages of the innovation process, ranging from knowledge creation and collaborative capacity to firm-level innovation, intellectual assets, commercialization, and environmental conditions. See Table 2.
The empirical strategy integrates three complementary methodological components: panel-data econometrics, unsupervised clustering, and supervised machine-learning regression. Panel econometrics provides the explanatory layer of the analysis and is particularly appropriate given the longitudinal structure of the dataset and the presence of persistent regional heterogeneity. European regions differ in institutional capacity, industrial specialization, accumulated knowledge, infrastructure, entrepreneurial culture, and technological trajectories, many of which are difficult to observe directly. The study therefore compares Fixed Effects (FE), Random Effects (RE), and dynamic panel specifications. FE controls for time-invariant regional heterogeneity, whereas RE assumes that region-specific effects are uncorrelated with the regressors. The Hausman test supports FE as the preferred explanatory specification. A dynamic model is also estimated by including lagged SII to capture persistence in regional innovation performance. Internal instruments address the endogeneity associated with the lagged dependent variable. Although the absence of significant second-order serial correlation supports the dynamic specification, rejection of the Sargan test requires caution; consequently, the dynamic model is treated as a complementary robustness specification. The second component uses unsupervised machine learning to identify latent regional innovation configurations. Clustering is motivated by the possibility that similar innovation outcomes may emerge from different combinations of scientific collaboration, SME innovation, networking, intellectual assets, commercialization, and environmental characteristics. Six algorithms are compared: Density-Based, Fuzzy C-Means, Hierarchical, Model-Based, K-Means, and Random Forest clustering. Their performance is evaluated through multiple criteria, including Silhouette, Dunn, Pearson’s gamma, Calinski–Harabasz, and within- and between-cluster dispersion. This comparative approach avoids selecting a clustering method a priori and identifies K-Means as the strongest overall solution, while Hierarchical Clustering performs particularly well on separation-oriented measures. The third component employs supervised machine-learning regression for prediction. K-Nearest Neighbors, Random Forest, Boosting, Decision Tree, Support Vector Machine, Lasso, and Linear Regression are compared using out-of-sample MSE, RMSE, MAE, and R2. Retaining Linear Regression as a benchmark makes it possible to assess whether nonlinear algorithms provide meaningful predictive improvements. Overall, the framework assigns distinct but complementary functions to each methodology: econometrics explains, clustering classifies, and machine learning predicts. Their integration enables regional innovation to be investigated simultaneously in terms of systematic relationships, heterogeneous territorial configurations, and predictive structure. See Figure 1.
4. The Econometric Model
The econometric analysis represents the explanatory component of the empirical framework and is designed to investigate how different dimensions of regional innovation systems are associated with overall innovation performance. The Summary Innovation Index (SII) is employed as the dependent variable, while eight indicators capture complementary dimensions of the innovation process: international scientific co-publications (ISCP), non-R&D innovation expenditures (NRDIE), product innovation among SMEs (SMEPI), business-process innovation among SMEs (SMEBPI), innovative collaboration (SMECOLL), design applications (DES), sales of new-to-market and new-to-firm innovations (NEWSALES), and fine-particulate emissions (PMEM). Three panel estimators are compared: a one-step dynamic panel model, a fixed-effects model, and a random-effects model. This comparative strategy makes it possible to assess whether the estimated relationships remain stable when different assumptions concerning regional heterogeneity and temporal persistence are introduced.
The baseline static panel specification can be expressed as:
where i denotes the regional unit, t denotes the year, μi captures time-invariant regional heterogeneity, and εit is the idiosyncratic error term. In the fixed-effects specification, μi may be correlated with the explanatory variables, whereas the random-effects estimator assumes that the region-specific component is uncorrelated with the regressors.
SIIit = α + Σk₌18 βkXkit + μi + εit
SIIit = α + β1ISCPit + β2NRDIEit + β3SMEPIit + β4SMEBPIit + β5SMECOLLit + β6DESit + β7NEWSALESit + β8PMEMit + μi + εit
Because innovation performance may also exhibit temporal persistence, the dynamic specification introduces the lagged dependent variable:
SIIit = ρSIIi,t−1 + β1ISCPit + β2NRDIEit + β3SMEPIit + β4SMEBPIit + β5SMECOLLit + β6DESit + β7NEWSALESit + β8PMEMit + μi + εit
The dynamic model is estimated on 1,476 observations, whereas the fixed- and random-effects specifications exploit the complete panel of 1,968 observations across 246 regional units and eight years. The coefficient on the lagged SII is positive and statistically significant (ρ = 0.2143, SE = 0.0514, p = 3.05×10⁻⁵). This result provides evidence of persistence in regional innovation performance: after controlling for the selected innovation dimensions, previous innovation performance remains positively associated with current SII. The magnitude of the coefficient nevertheless suggests partial rather than complete persistence, leaving substantial scope for contemporaneous regional innovation characteristics to explain differences in performance.
A particularly important result is the remarkable stability of the signs across the three specifications. All eight explanatory variables have positive and statistically significant coefficients in the dynamic, fixed-effects, and random-effects models. This consistency indicates that the main empirical relationships are not driven exclusively by the choice of panel estimator. However, the coefficients should be interpreted as conditional associations rather than automatically as causal effects.
ISCP, which represents international scientific co-publications, exhibits coefficients of 0.0511, 0.0729 and 0.0765 in the dynamic, FE and RE models, respectively. The result suggests that stronger international scientific integration is systematically associated with higher regional innovation performance. NRDIE is similarly stable, with coefficients between 0.0373 and 0.0415, indicating a positive relationship between innovation expenditures outside formal R&D and overall innovation performance.
The two SME innovation variables also provide strong evidence. SMEPI ranges from 0.0403 in the dynamic model to 0.0544 in the RE model, while SMEBPI ranges between approximately 0.0325 and 0.0364. Taken together, these estimates suggest that both product innovation and organizational or process-oriented innovation among SMEs represent relevant dimensions of regional innovation systems. The results therefore emphasize that regional innovation cannot be reduced exclusively to formal R&D activities.
Collaboration also appears consistently relevant. SMECOLL has remarkably stable coefficients of 0.0346, 0.0315 and 0.0315 across the three estimators. Such stability is noteworthy because it indicates that the association between collaborative innovation and SII changes very little when regional heterogeneity and dynamic persistence are treated differently.
Among the explanatory variables, DES displays some of the largest estimated coefficients, increasing from 0.0574 in the dynamic model to 0.0698 under FE and 0.0735 under RE. This finding highlights the importance of intellectual assets and design-related innovative activity within regional innovation performance. NEWSALES is also positive and exceptionally stable across specifications, with coefficients between 0.0277 and 0.0284, linking the commercialization of new-to-market and new-to-firm innovations to higher SII values.
Finally, PMEM records coefficients of 0.0261, 0.0404 and 0.0402. This result requires particularly careful interpretation because the economic meaning of the coefficient depends on the precise direction and transformation of the RIS environmental indicator. If higher values correspond directly to greater particulate emissions, a positive coefficient would be counterintuitive from an environmental-performance perspective; if the RIS indicator is normalized so that higher values represent better environmental performance, the positive sign becomes consistent with the expected relationship. The direction of the original indicator should therefore be explicitly documented before assigning a substantive environmental interpretation.
Overall, the econometric evidence reveals a high degree of coefficient stability across dynamic, fixed-effects and random-effects estimators. Scientific internationalization, innovation expenditure, SME product and process innovation, collaborative networks, intellectual assets, commercialization outcomes, and the environmental dimension are all systematically associated with SII. At the same time, the significant lagged dependent variable demonstrates that regional innovation has a persistent component. The econometric results consequently support a multidimensional interpretation of regional innovation performance: innovation appears to emerge from the interaction of knowledge creation, firm-level capabilities, collaboration, intellectual assets and market outcomes rather than from a single isolated factor. These findings provide the explanatory foundation for the subsequent clustering and machine-learning analyses, which investigate whether the same multidimensional information can respectively identify heterogeneous regional innovation profiles and predict innovation performance. See Table 3.
The model-fit statistics provide additional evidence on the relative performance and structure of the three panel specifications. The fixed-effects model shows a very high overall explanatory capacity, with an LSDV R-squared of 0.9962 and a within R-squared of 0.8446. The latter is particularly relevant because it indicates that approximately 84.5% of the within-region variation in the Summary Innovation Index is explained by changes in the included regressors over time. This result reinforces the suitability of the fixed-effects framework for analysing regional innovation dynamics. The random-effects model also displays substantial explanatory power, as indicated by corr(y, ŷ)2 = 0.8042. However, its residual dispersion is considerably larger than that of the fixed-effects specification. The sum of squared residuals is 801,439.3 under random effects, compared with 8,509.8 under fixed effects, while the regression standard error rises from 2.23 to 20.22. Although these statistics are not always directly comparable across estimators, they suggest a markedly weaker fit for the random-effects specification. The information criteria point in the same direction. The fixed-effects model reports lower values for the Akaike criterion (8,974.5), Schwarz/BIC (10,393.0), and Hannan-Quinn criterion (9,495.8) than the random-effects model, whose corresponding values are substantially higher. This provides additional evidence in favor of the fixed-effects specification, although comparisons of information criteria across differently estimated panel models should be interpreted cautiously. The estimated rho of 0.4314 indicates a meaningful degree of persistence in the disturbances, while the Durbin-Watson statistic of 0.9394 is consistent with positive serial correlation and therefore motivates additional diagnostic testing. In the random-effects model, the large difference between between-region variance (417.252) and within-region variance (4.324) highlights substantial structural heterogeneity across regional units. Finally, the dynamic panel specification uses 29 instruments, reflecting the instrumental-variable strategy required to address the endogeneity associated with the lagged dependent variable and to capture persistence in regional innovation performance. See Table 4.
The diagnostic and specification tests provide important evidence regarding the adequacy of the alternative panel estimators and the statistical properties of the residuals. For the dynamic panel model, the AR(1) test rejects the null hypothesis of no first-order serial correlation (z = -4.67094; p = 0.0000), while the AR(2) test does not reject the null of no second-order serial correlation (z = -0.650523; p = 0.5154). This pattern is consistent with the usual requirements of dynamic panel estimation, where first-order correlation may arise after transformation, whereas the absence of second-order correlation is particularly relevant for model validit The Sargan test, however, strongly rejects the validity of the over-identifying restrictions (χ2(20) = 102.517; p = 0.0000). This indicates that the instrument set should be interpreted cautiously and suggests that the dynamic specification should be regarded primarily as a robustness exercise rather than the sole basis for inference. At the same time, the joint Wald test confirms that the regressors are jointly significant in the dynamic specification. For the static panel estimators, the joint significance tests are highly significant for both fixed and random effects. The group-intercepts test strongly rejects the hypothesis of a common intercept, confirming the relevance of unobserved regional heterogeneity. The Breusch-Pagan test also rejects the absence of a unit-specific variance component, supporting the use of a panel framework rather than pooled estimation. The Hausman test is particularly decisive. Its highly significant result (χ2(8) = 155.536; p = 1.37×10⁻²⁹) rejects the consistency of the random-effects estimator and therefore favors the fixed-effects model as the preferred explanatory specification. Finally, the Wooldridge test detects first-order autocorrelation, while the Pesaran CD test indicates cross-sectional dependence in the random-effects output. These findings imply that inference should account for non-independence in the disturbances and reinforce the need for robust standard-error corrections when interpreting the preferred fixed-effects specification. See Table 5.
5. Clustering
The clustering analysis represents the structural component of the empirical framework and identifies latent heterogeneity in regional innovation performance. Six algorithms—Density-Based, Fuzzy C-Means, Hierarchical, Model-Based, K-Means, and Random Forest Clustering—are compared using the same 1,968 observations. Rather than imposing predefined regional categories, clustering identifies homogeneous innovation profiles based on multidimensional characteristics, including collaboration, firm innovation, intellectual assets, commercialization, and environmental conditions. Algorithm performance is evaluated through multiple validation metrics, including R2, Silhouette, Dunn, Pearson’s gamma, Calinski–Harabasz, cluster diameter, separation, AIC, BIC, and entropy, allowing model selection to balance compactness, separation, and overall partition quality.
Comparison of clustering performance. The results reveal substantial differences among the six clustering approaches. Overall, K-Means provides the strongest combination of global performance indicators. It achieves the highest R2, equal to 0.6301, indicating that approximately 63% of the total variability is accounted for by between-cluster differences. This value exceeds Fuzzy C-Means (0.6132), Random Forest (0.5208), Model-Based Clustering (0.5167), Hierarchical Clustering (0.4107), and Density-Based Clustering (0.0202). The extremely low R2 of the Density-Based solution suggests that its partition captures only a limited proportion of the overall structure of the dataset. K-Means also records the highest Silhouette coefficient (0.1800). Hierarchical and Density-Based clustering follow with values of 0.1400 and 0.1500, respectively, while Fuzzy C-Means reaches 0.0900 and both Model-Based and Random Forest clustering report 0.0800. Although K-Means therefore provides the best relative performance on this criterion, the absolute magnitude of its Silhouette coefficient remains modest. Consequently, the results should not be interpreted as evidence of sharply separated or naturally isolated regional groups. Rather, they suggest the presence of partially overlapping latent innovation profiles, which is plausible given the multidimensional and continuous nature of regional innovation performance. The compactness indicators further support K-Means. Its maximum cluster diameter of 6.332 is the lowest among all algorithms, compared with 7.817 for Fuzzy C-Means, 8.149 for Hierarchical Clustering, 8.233 for Random Forest, 9.443 for Model-Based Clustering, and 10.750 for Density-Based Clustering. Thus, K-Means produces the most compact solution according to the worst-case within-cluster dispersion criterion. A somewhat different picture emerges when separation-oriented metrics are considered. Hierarchical Clustering achieves by far the highest minimum separation (0.8438), compared with 0.4343 for Random Forest and 0.1555 for K-Means. Hierarchical Clustering also records the highest Pearson’s gamma (0.5266) and Dunn index (0.10360). These results indicate that, although Hierarchical Clustering explains less overall variability than K-Means, it generates a partition characterized by stronger separation between its most proximate clusters. Random Forest also performs relatively well according to the Dunn index (0.05276), exceeding Density-Based (0.03378) and K-Means (0.02456). The Calinski–Harabasz index provides particularly strong support for K-Means. Its value of 370.60 is substantially higher than Fuzzy C-Means (260.00), Random Forest (236.40), Model-Based Clustering (234.80), Hierarchical Clustering (151.60), and Density-Based Clustering (15.19). Since this index evaluates the relationship between between-cluster separation and within-cluster dispersion, the result reinforces the conclusion that K-Means provides the strongest overall balance between compactness and differentiation. The reported information criteria also favor K-Means, which records the lowest AIC (6,728) and BIC (7,231), followed by Fuzzy C-Means and Random Forest. However, these results should be interpreted cautiously because information criteria are not necessarily directly comparable across clustering algorithms based on different objective functions or likelihood structures. Similarly, entropy should not be used as a universal ranking measure. The very low entropy of Density-Based Clustering (0.0894), for example, does not compensate for its extremely low R2 and Calinski–Harabasz index. Taken together, the results identify K-Means as the preferred clustering solution for the subsequent regional profiling analysis. It ranks first on R2, Silhouette, maximum-diameter compactness, Calinski–Harabasz, AIC, and BIC, providing the most balanced global performance across the reported metrics. Hierarchical Clustering nevertheless represents an important robustness benchmark because of its superior minimum separation, Pearson’s gamma, and Dunn index. Accordingly, K-Means can be retained as the primary classification algorithm, while the hierarchical solution can be used to assess the robustness of the underlying territorial structure. Importantly, the relatively modest Silhouette values suggest that the resulting groups should be interpreted as heterogeneous and partially overlapping regional innovation profiles rather than as sharply separated natural clusters. This distinction is relevant for the subsequent analysis, where the economic characteristics of each K-Means cluster can be examined to determine which combinations of innovation dimensions differentiate regional innovation trajectories. See Table 6.
Comparison of Cluster Structure and Algorithm Selection. The decomposition of total variability into between-cluster and within-cluster components provides further evidence for selecting the most appropriate algorithm for the regional innovation analysis. A desirable clustering solution should maximize between-cluster variation while minimizing within-cluster variation, thereby producing groups that are internally homogeneous but sufficiently differentiated from one another. K-Means provides the strongest overall performance according to these criteria. It generates a Between Sum of Squares (BSS) of 11,154.66 and the lowest Within Sum of Squares (WSS) among the directly comparable solutions, equal to 6,548.34. Its BSS/TSS ratio of 0.630 indicates that approximately 63% of total variation is attributable to differences between clusters. This result is consistent with the previous validation metrics, where K-Means also achieved the highest R2, Silhouette coefficient, and Calinski–Harabasz index. Moreover, its cluster sizes range from 106 to 267 observations, producing a comparatively balanced partition without extremely small or dominant groups. This characteristic is particularly important for the subsequent construction and interpretation of regional innovation profiles. Fuzzy C-Means also performs well, with a BSS/TSS ratio of 0.613. However, its cluster distribution is considerably less balanced, ranging from 51 to 670 observations. Its principal advantage lies in allowing observations to have partial membership in multiple clusters, which may be conceptually useful when regional innovation profiles overlap. Nevertheless, for the objective of constructing clearly interpretable regional typologies, the harder partition produced by K-Means is more straightforward. Model-Based and Random Forest clustering provide intermediate results, explaining approximately 51.7% and 52.1% of total variability, respectively. Random Forest has the additional advantage of providing feature-importance information, but its cluster distribution is relatively uneven, including one cluster containing 753 observations and another containing only 37. Hierarchical clustering performs particularly well on separation-based metrics, as shown in the previous analysis, but its BSS/TSS ratio is substantially lower at 0.411. More importantly, its partition is extremely unbalanced, with 1,098 observations assigned to one cluster and several clusters containing fewer than 15 observations. This reduces its suitability for constructing meaningful and comparable regional innovation profiles.
Density-Based clustering is clearly the least appropriate solution for the present purpose. Its BSS/TSS ratio is only 0.020, while 1,940 of the 1,968 observations are assigned to a single cluster. Although density-based methods can be useful for identifying anomalies and noise observations, this structure provides little meaningful segmentation of regional innovation patterns.
Overall, the evidence supports the selection of K-Means as the preferred algorithm. It combines the highest explained between-cluster variation, the lowest within-cluster dispersion, relatively balanced cluster sizes, and the strongest overall validation performance. K-Means is therefore particularly suitable for the objective of this study: identifying interpretable and differentiated regional innovation profiles that can subsequently be compared in terms of their underlying innovation characteristics. Hierarchical clustering remains useful as a robustness benchmark because of its stronger separation metrics, while Random Forest may complement the analysis through feature-importance assessment.
One methodological caution remains important. For K-Means, as well as several competing algorithms, the optimum number of clusters reaches the maximum tested value of 10. Therefore, before interpreting the ten-cluster solution as definitive, the search range should be extended beyond ten clusters to verify whether model performance continues to improve or whether a stable optimum emerges. See Table 7.
The K-Means solution reveals substantial heterogeneity across the ten regional innovation profiles. Because the reported cluster means are standardized values, positive scores indicate above-average performance for a given dimension, whereas negative values indicate below-average performance. This makes it possible to interpret each cluster as a distinct configuration of strengths and weaknesses rather than simply as a ranking based on SII. Cluster 2 represents one of the strongest innovation profiles. It combines a high SII (1.149) with very strong scientific collaboration (ISCP = 1.494), product innovation (SMEPI = 1.117), business-process innovation (SMEBPI = 0.986), SME collaboration (SMECOLL = 1.316), and relatively strong innovative sales. Cluster 4 is also highly innovative, with the highest SII (1.198) and the strongest ISCP value (1.733), but it differs from Cluster 2 because NRDIE is strongly negative (-0.935). This suggests a science-intensive innovation model in which strong research connectivity coexists with relatively weak non-R&D innovation expenditure. Clusters 5 and 7 represent the weakest innovation configurations. Cluster 5 records the lowest SII (-1.630) and strongly negative values across almost all dimensions, suggesting a broad structural innovation deficit rather than weakness in a single component. Cluster 7 also performs poorly in SII (-1.149), SME product and process innovation, collaboration, innovative sales, and environmental performance, although it shows a relatively strong DES value (0.787). This indicates that isolated strengths in intellectual assets are insufficient to compensate for broader weaknesses in the regional innovation system. Other clusters exhibit more specialized profiles. Cluster 6 combines low overall innovation performance (SII = -0.974) with relatively high NRDIE (0.974), suggesting that innovation expenditure alone does not necessarily translate into broader innovation outcomes. Cluster 8 presents an almost average SII (-0.073) despite strong NRDIE, SME innovation, collaboration, and NEWSALES, indicating a comparatively balanced but not yet high-performing profile. Cluster 9 is particularly distinctive: it combines a positive SII (0.638), very strong SME collaboration (1.880), and the highest NEWSALES value (1.444), but an extremely low PMEM score (-1.708). This profile may therefore represent commercially successful and highly networked regions facing important environmental weaknesses. Cluster 10 also displays above-average innovation performance (SII = 0.683), characterized by strong SME innovation and especially high design applications (DES = 1.461). It may therefore be interpreted as a design- and firm-innovation-oriented regional profile. The internal-quality statistics provide additional information on the reliability of these profiles. Cluster 7 has the highest Silhouette coefficient (0.2963), followed by Cluster 9 (0.2849) and Cluster 5 (0.2675), indicating that these groups are comparatively well separated from neighboring clusters. Conversely, Cluster 8 has the lowest Silhouette value (0.0857), suggesting substantial overlap with other profiles. Cluster 10 has the largest size (267 observations), while Cluster 9 is the smallest (106), but overall cluster sizes remain reasonably balanced compared with the alternative clustering solutions. Taken together, the K-Means results indicate that regional innovation heterogeneity is not reducible to a simple high-versus-low distinction. Instead, the ten-cluster solution identifies multiple innovation configurations, including science-intensive, SME-driven, collaboration-oriented, design-oriented, commercially strong, and structurally weak profiles. This supports the use of clustering as a complement to the econometric analysis: while the regressions identify average associations with SII, K-Means reveals how different combinations of innovation dimensions coexist across regional observations.

Table 8.
K-Means Cluster Characteristics and Standardized Regional Innovation Profiles.
| Cluster | Size | Explained prop. | WSS | Silhouette | SII | ISCP | NRDIE | SMEPI | SMEBPI | SMECOLL | DES | NEWSALES | PMEM |
| 1 | 227 | 0.09889 | 647.6 | 0.1907 | -0.3899 | -0.2629 | -0.556 | -0.9238 | -0.6551 | -0.602 | -0.342 | 0.3186 | 0.4228 |
| 2 | 168 | 0.1179 | 772 | 0.1017 | 1.149 | 1.494 | 0.5416 | 1.117 | 0.9858 | 1.316 | -0.05676 | 0.4611 | 0.9028 |
| 3 | 233 | 0.08882 | 581.6 | 0.2181 | 0.2629 | -0.4197 | -0.233 | 0.412 | 0.27 | 0.3014 | -0.09873 | -0.3805 | 0.7085 |
| 4 | 205 | 0.1185 | 776.3 | 0.166 | 1.198 | 1.733 | -0.9346 | 0.5449 | 0.4548 | 0.1986 | 0.2945 | -0.07777 | 0.4613 |
| 5 | 143 | 0.05198 | 340.4 | 0.2675 | -1.63 | -0.9267 | -1.076 | -1.589 | -1.631 | -1.285 | -1.003 | -1.178 | -0.7108 |
| 6 | 191 | 0.1139 | 745.9 | 0.1284 | -0.9744 | -0.6551 | 0.9741 | -0.3201 | -0.1356 | -0.4555 | -1.047 | -0.5276 | -0.8916 |
| 7 | 196 | 0.06331 | 414.5 | 0.2963 | -1.149 | -0.8151 | -0.00306 | -1.318 | -1.385 | -1.036 | 0.7874 | -0.9384 | -1.019 |
| 8 | 232 | 0.1357 | 888.9 | 0.08573 | -0.07339 | -0.2518 | 0.8826 | 0.6138 | 0.8361 | 0.4477 | -0.5647 | 0.8511 | 0.2832 |
| 9 | 106 | 0.07011 | 459.1 | 0.2849 | 0.6376 | 0.4156 | 0.3117 | 0.2327 | -0.08745 | 1.88 | -0.1903 | 1.444 | -1.708 |
| 10 | 267 | 0.1408 | 922.1 | 0.1318 | 0.6831 | -0.06374 | 0.04407 | 0.7262 | 0.6473 | -0.09206 | 1.461 | 0.2153 | 0.299 |
Note. The table reports cluster size, explained proportion, within-cluster dispersion, Silhouette coefficients, and standardized means for SII and eight innovation dimensions. Positive values indicate above-average performance, while negative values indicate below-average performance across observations.
Figure 2 summarizes the K-Means clustering results by combining model selection, cluster visualization, standardized innovation profiles, and indicator distributions. Overall, the results confirm substantial heterogeneity across regional innovation systems and suggest that the ten clusters represent different combinations of innovation capabilities rather than a simple high-versus-low performance classification. Panel A reports the model-selection criteria. AIC, BIC, and WSS progressively decline as the number of clusters increases, indicating improvements in fit and within-cluster compactness. The lowest BIC is obtained at ten clusters, supporting k = 10 within the tested range. However, since this value corresponds to the maximum number considered, additional values of k should be tested as a robustness check. Panel B displays the t-SNE projection of the 1,968 observations. The clusters show recognizable structures but also considerable overlap, consistent with the relatively modest K-Means Silhouette coefficient 0.180). The identified groups should therefore be interpreted as partially overlapping regional innovation profiles rather than sharply separated territorial categories. Panel C compares standardized cluster means across SII and the eight innovation dimensions. The profiles reveal that similar levels of innovation performance can emerge from different combinations of scientific collaboration, SME innovation, cooperation, design, commercialization, and non-R&D expenditure. Some clusters are science-intensive, whereas others are more collaboration-, design-, or market-oriented. Conversely, weaker clusters display negative values across several dimensions, indicating broader structural innovation disadvantages. Panel D complements these averages by showing cluster-specific density distributions. Considerable overlap exists for several indicators, although ISCP, SMECOLL, SII, DES, and NEWSALES provide visible differentiation among profiles. Taken together, the four panels support K-Means as an effective structural component of the analysis. The results reveal a multidimensional regional innovation landscape characterized by heterogeneous and partially overlapping configurations, supporting the broader Explain–Predict–Classify framework adopted in the study. See Figure 2.
6. Machine Learning Regressions
The supervised machine-learning analysis represents the predictive component of the empirical framework and complements the econometric and clustering approaches developed in the previous sections. While panel econometrics examines conditional associations between innovation dimensions and the Summary Innovation Index (SII), and clustering identifies heterogeneous regional innovation profiles, machine-learning regression addresses a different question: how accurately can regional innovation performance be predicted from the selected innovation indicators? To answer this question, seven algorithms with different functional structures are compared: K-Nearest Neighbors (KNN), Random Forest, Boosting Regression, Linear Regression, Decision Tree, Regularized Linear Regression (Lasso), and Support Vector Machine Regression (SVM). Their predictive performance is assessed through validation and test Mean Squared Error (MSE), scaled MSE, Root Mean Squared Error (RMSE), Mean Absolute Error (MAE/MAD), and R2. Lower error measures and higher R2 values indicate superior predictive performance. The comparison provides clear evidence in favor of KNN. The algorithm achieves the lowest test MSE (62.41), scaled MSE (0.05232), RMSE (7.900), and MAE (4.793), while simultaneously obtaining the highest R2 (0.9482). Thus, KNN explains approximately 94.8% of the variation in SII in the reported test results, substantially outperforming the conventional linear benchmark. Its test MSE is approximately 60% lower than that of Linear Regression (157.1), while its RMSE declines from 12.53 to 7.90. This substantial improvement suggests that the relationship between the selected innovation indicators and overall regional innovation performance is not adequately represented by a purely global linear function. Random Forest emerges as the second-best algorithm, with a test MSE of 88.08, RMSE of 9.385, MAE of 7.155, and R2 of 0.9289. Interestingly, Random Forest records the lowest validation MSE (68.55), even outperforming KNN during validation (104.8). However, its weaker test performance indicates that KNN generalizes better to the final test sample under the reported evaluation design. The difference between validation and test performance also demonstrates why algorithm selection should not rely exclusively on validation error. Boosting Regression ranks third, achieving R2 = 0.8872 and RMSE = 11.68. It still outperforms Linear Regression, whose R2 is 0.8708 and RMSE is 12.53, providing further evidence that flexible nonlinear algorithms can extract predictive structures not fully captured by conventional linear specifications. Nevertheless, the relatively good performance of Linear Regression remains important: an R2 above 0.87 indicates that a substantial component of regional innovation performance is still captured through approximately linear relationships. Decision Tree, Lasso, and SVM show progressively weaker predictive performance. The single Decision Tree obtains R2 = 0.8544, substantially below Random Forest, illustrating the predictive advantage of ensemble learning over a single-tree structure. Lasso achieves R2 = 0.8413, while SVM records the lowest performance, with the highest test MSE (199.0), RMSE (14.11), MAE (11.40), and the lowest R2 (0.8202). These results do not imply that these algorithms are intrinsically inferior, but rather that they are less effective under the present dataset, feature specification, preprocessing, and tuning configuration. MAPE cannot provide meaningful discrimination among the models because it is reported as infinite for most algorithms and undefined for KNN. This is likely associated with zero or near-zero values in the denominator and therefore makes percentage-based prediction errors unsuitable for the present comparison. Model selection should consequently rely on MSE, RMSE, MAE, and R2. Overall, KNN emerges as the preferred predictive algorithm because it simultaneously minimizes all reported test-error measures and maximizes explanatory performance. The superiority of a neighborhood-based method is also substantively interesting: it suggests that regional innovation performance can be predicted particularly effectively by exploiting similarities among observations in the multidimensional innovation space. Accordingly, KNN is selected as the primary machine-learning regression model, with Random Forest providing the strongest alternative benchmark. Together with the econometric and clustering evidence, this result completes the Explain–Classify–Predict architecture by demonstrating that regional innovation is not only associated with identifiable determinants and characterized by heterogeneous configurations, but can also be predicted with high accuracy using flexible data-driven methods. See Table 9.
The KNN interpretability results provide complementary global and local evidence on the contribution of the selected innovation indicators to predicted regional innovation performance. At the global level, permutation-based feature importance identifies ISCP as the most influential predictor, with a mean dropout loss of 19.67. This indicates that disrupting information on international scientific co-publications produces the largest deterioration in predictive accuracy. DES and SMECOLL follow with values of 15.38 and 15.06, respectively, suggesting that intellectual assets and collaborative innovation also play a central role in the predictive structure of SII. PMEM and SMEPI occupy intermediate positions, while SMEBPI, NRDIE, and NEWSALES display comparatively lower global importance. The case-level explanations reveal, however, that global importance does not translate into identical contributions across individual predictions. For Case 1, DES (+12.25), ISCP (+9.429), and SMECOLL (+9.225) are the main positive contributors. Case 4 is particularly dependent on ISCP, whose contribution reaches +27.41, while SMECOLL adds +13.18. By contrast, Case 5 is primarily driven by SMECOLL (+15.81), demonstrating that collaborative capacity may dominate prediction even when ISCP ranks first globally. The local explanations also highlight important negative contributions. In Case 2, NEWSALES (-7.88) and NRDIE (-7.063) reduce the predicted value, whereas SMEPI (+8.717), DES (+9.201), and PMEM (+7.394) offset these effects. In Case 3, NRDIE contributes positively (+8.403), while NEWSALES (-6.358) lowers the prediction. Starting from a common base prediction of 94.69, the resulting KNN predictions range from 106.3 to 149.6. Overall, the results demonstrate that KNN captures heterogeneous combinations of innovation drivers: the same variable can contribute differently across observations, reinforcing the view that regional innovation performance emerges from multiple, context-specific configurations rather than from a uniform predictive mechanism. See Table 10.
Figure 3 provides a graphical assessment of the predictive performance and tuning process of the K-Nearest Neighbors (KNN) regression model. The three panels jointly describe the data-partitioning strategy, the correspondence between observed and predicted SII values, and the selection of the optimal number of nearest neighbors. Panel A shows the partition of the complete dataset of 1,968 observations into training, validation, and test samples. The training set contains 1,260 observations, while 315 observations are assigned to validation and 393 to the final test set. This separation allows model tuning to be performed independently from the final evaluation, reducing the risk of selecting the KNN configuration directly on the test sample. Panel B compares observed and predicted SII values for the test set. Most observations are concentrated close to the 45-degree reference line, indicating strong agreement between actual and predicted regional innovation performance. This visual evidence is consistent with the previously reported KNN performance metrics, particularly the test MSE of 62.41, RMSE of 7.90, MAE of 4.79, and R2 of 0.9482. Prediction errors appear somewhat larger for some observations in the intermediate and upper ranges, but no major systematic deviation from the reference line is visually apparent. The figure therefore confirms the high predictive accuracy indicated by the quantitative metrics. Panel C illustrates the tuning of the number of nearest neighbors. The validation MSE reaches its minimum at k = 1 and increases as additional neighbors are included. This indicates that, under the reported validation design, the most localized KNN specification provides the strongest predictive performance. The training and validation error patterns also suggest that increasing k introduces excessive smoothing, reducing the model’s ability to capture local structures in the innovation data. Overall, the figure reinforces the selection of KNN as the preferred predictive algorithm. Its strong test-set performance suggests that observations with similar configurations of innovation indicators tend to exhibit similar SII values. Nevertheless, the selection of k = 1 warrants additional robustness analysis, since such a highly localized specification may be sensitive to individual observations. Testing its stability through repeated or grouped cross-validation would therefore further strengthen the predictive evidence. See Figure 3.
7. Discussion of the Results
The empirical findings support the central premise of this study: regional innovation performance is best understood as a multidimensional phenomenon requiring complementary explanatory, structural, and predictive perspectives. This interpretation is consistent with the innovation ecosystem literature, which conceptualizes innovation as the outcome of interconnected actors, capabilities, networks, and territorial conditions rather than isolated inputs (Shi et al., 2023; Hervás-Oliver et al., 2021). Rather than producing competing conclusions, panel econometrics, clustering, and supervised machine learning reveal different dimensions of the same regional innovation process. Their integration therefore provides information that would remain partially hidden if each methodology were applied independently. The econometric evidence demonstrates that all selected innovation dimensions are positively and significantly associated with SII across the estimated specifications. International scientific collaboration, non-R&D innovation expenditure, SME product and process innovation, collaboration, design applications, innovative sales, and the environmental indicator retain statistically significant coefficients. These findings are broadly consistent with previous evidence emphasizing the importance of multiple firm-level and territorial capabilities in explaining innovation differences across European regions (Hervás-Oliver et al., 2021). The fixed-effects specification is particularly relevant because the Hausman test strongly favors FE over RE, confirming the importance of controlling for unobserved regional characteristics. Moreover, the significant lagged SII coefficient in the dynamic model (0.2143) suggests persistence in regional innovation performance. Innovation capacity therefore appears to be partly path-dependent rather than reconstructed independently in each period. This interpretation is consistent with research emphasizing accumulated capabilities, regional knowledge networks, local specialization, and territorially embedded innovation processes (Ascani et al., 2020).
The clustering analysis extends these findings by demonstrating that common associations do not imply the existence of a single homogeneous regional innovation model. K-Means provides the strongest overall clustering performance, explaining approximately 63% of total variability through between-cluster differences. More importantly, the resulting ten profiles reveal different combinations of innovation capabilities. High SII values can coexist with science-intensive configurations, strong SME collaboration, design-oriented capabilities, or commercialization strengths. Conversely, some low-performing clusters exhibit isolated strengths that are insufficient to compensate for broader structural weaknesses. This result is consistent with configurational studies showing that regional innovation outcomes can emerge through multiple combinations of conditions rather than through a unique development trajectory (Filippopoulos & Fotopoulos, 2022; Beynon et al., 2024). Thus, the clustering evidence reinforces a configurational interpretation of regional innovation. The relatively modest Silhouette coefficient (0.180) nevertheless indicates that these profiles should be interpreted as partially overlapping configurations rather than sharply separated regional categories.
The supervised machine-learning results provide a third and complementary perspective. KNN clearly outperforms the alternative algorithms, achieving a test MSE of 62.41, RMSE of 7.90, MAE of 4.79, and R2 of 0.9482. Its substantial advantage over Linear Regression (R2 = 0.8708) indicates that nonlinear and localized relationships contain additional predictive information beyond that captured by a global linear specification. This result complements previous research demonstrating the usefulness of predictive and regularized approaches for modelling regional innovation outcomes (Xiang et al., 2023). The strong performance of Random Forest (R2 = 0.9289) provides additional support for the relevance of flexible predictive structures. However, the relatively strong performance of Linear Regression also indicates that linear relationships remain an important component of the underlying innovation structure.
Particularly important is the convergence between explanatory and predictive evidence. ISCP is statistically significant in all econometric specifications and emerges as the most important KNN predictor according to permutation importance. DES and SMECOLL also occupy prominent positions in the predictive ranking while displaying robust positive econometric associations. At the same time, local KNN explanations demonstrate that their contributions vary considerably across individual observations. This finding is consistent with configurational evidence showing that the importance and interaction of innovation capabilities may differ substantially across regional contexts (Filippopoulos & Fotopoulos, 2022; Beynon et al., 2024). Common relationships therefore coexist with heterogeneous regional configurations.
Taken together, the results support the Explain–Classify–Predict framework. Econometrics identifies systematic conditional associations, clustering reveals heterogeneous combinations of regional capabilities, and machine learning demonstrates that these multidimensional configurations contain substantial predictive information. The central implication is not that one methodology dominates the others, but that regional innovation combines common drivers with heterogeneous territorial pathways, consistent with previous evidence on regional specialization and configurational heterogeneity (Ascani et al., 2020; Filippopoulos & Fotopoulos, 2022; Beynon et al., 2024). The integration of explanatory, structural, and predictive evidence consequently provides a richer interpretation of regional innovation performance and establishes an empirical basis for differentiated, place-sensitive policy interventions rather than uniform regional innovation strategies. See Table 11.
8. Policy Implications
The empirical results provide several implications for the design of regional innovation policies. The central policy message emerging from the Explain–Classify–Predict framework is that innovation strategies should move beyond uniform interventions toward differentiated, place-based approaches. This interpretation is consistent with evidence showing substantial disparities in innovation effectiveness across European regions and emphasizing the importance of territorial characteristics in shaping innovation outcomes (Żółtaszek & Olejnik, 2024; Filippopoulos & Fotopoulos, 2022). The econometric results indicate that regional innovation performance is systematically associated with multiple dimensions, including scientific collaboration, non-R&D expenditure, SME innovation, collaborative networks, intellectual assets, commercialization, and environmental conditions. Simultaneously, the clustering results demonstrate that these dimensions combine differently across territories, reinforcing the view that regional innovation ecosystems are characterized by heterogeneous configurations rather than a single development trajectory (Beynon et al., 2024; Chen et al., 2024).
A first implication concerns scientific and knowledge connectivity. ISCP is positively and significantly associated with SII and emerges as the most important predictor in the KNN permutation analysis. This finding is consistent with research showing that external connectivity, network position, knowledge flows, and international collaboration can strengthen regional innovation capabilities (Ascani et al., 2020; Ferrer-Serrano et al., 2025). Policy interventions should therefore facilitate participation in international research networks, interregional partnerships, university–industry collaboration, and European research programmes. Applied research institutions and university–industry linkages can play an important role in translating scientific knowledge into regional innovation outcomes (Pfister et al., 2021; Zhao et al., 2024). However, the clustering evidence shows that scientific strength alone does not guarantee a balanced innovation system. Cluster 4, for example, combines exceptionally strong scientific collaboration with relatively weak non-R&D innovation expenditure. Research connectivity should therefore be complemented by mechanisms supporting knowledge absorption, diffusion, and commercialization.
A second implication concerns SMEs. SMEPI, SMEBPI, and SMECOLL are consistently associated with regional innovation performance, while collaboration ranks among the most important KNN predictors. These findings reinforce previous European evidence showing that SME innovation depends on multiple R&D and non-R&D capabilities and on the characteristics of the surrounding regional ecosystem (Hervás-Oliver et al., 2021; Aronica et al., 2022). Regional authorities should consequently support organizational, process, and product innovation alongside formal R&D. Innovation vouchers, collaborative platforms, technology-transfer mechanisms, incubators, and university–SME partnerships represent potential instruments. This recommendation is consistent with evidence that intermediaries and incubators can strengthen regional innovation performance by facilitating interaction among ecosystem actors (Wang et al., 2020; Duan & Jin, 2022a, 2022b). Cooperation should therefore be considered an innovation capability in itself rather than merely a secondary consequence of innovative activity.
Third, the results emphasize intellectual assets and commercialization. DES displays relatively large econometric coefficients and ranks second in KNN global importance. Innovation policy should therefore extend beyond conventional R&D- and patent-centered strategies to recognize design and other non-technological forms of innovation. This interpretation is supported by research highlighting the regional economic relevance of creative, aesthetic, and design-related capabilities (Huang & Zou, 2024; Bergamini et al., 2026). At the same time, NEWSALES demonstrates the importance of transforming innovation inputs into market outcomes. Policies should consequently address the entire innovation chain, from knowledge creation and firm capabilities to intellectual assets and commercialization, rather than concentrating resources exclusively on upstream research activities.
The clustering results are particularly relevant for policy targeting. The ten K-Means profiles reveal science-intensive, SME-driven, collaboration-oriented, design-oriented, commercially strong, and structurally weaker configurations. This heterogeneity is consistent with configurational research showing that comparable innovation outcomes may emerge from different combinations of regional conditions (Filippopoulos & Fotopoulos, 2022; Beynon et al., 2024). Consequently, policy priorities should depend on the specific bottlenecks characterizing each regional profile. Structurally weak regions may require comprehensive capacity-building interventions, whereas regions possessing isolated strengths may benefit more from policies addressing missing links. For example, a region combining substantial innovation expenditure with weak SII may require stronger knowledge diffusion, collaboration, absorptive capacity, or commercialization rather than additional expenditure alone. This approach is closely aligned with place-sensitive innovation policy, where intervention responds to the specific configuration of regional capabilities rather than applying identical instruments across territories.
Finally, the strong predictive performance of KNN (R2 = 0.9482) suggests a potential complementary role for machine learning in regional policy monitoring. Data-driven methods are increasingly employed to evaluate and forecast regional innovation capacity and ecosystem performance (Xiang et al., 2023; Xie et al., 2023; Yang et al., 2023b). Predictive models could therefore complement conventional monitoring systems by identifying regions whose innovation trajectories deviate from comparable territorial profiles and by highlighting dimensions associated with predicted performance. Such tools should support rather than replace institutional assessment and policy judgment. Overall, the evidence favors adaptive, data-informed, and territorially differentiated innovation strategies in which econometric analysis identifies systematic relationships, clustering reveals regional configurations, and predictive analytics contributes to monitoring and policy targeting.
9. Limitations
Despite the advantages of combining panel econometrics, clustering, and supervised machine learning within a unified analytical framework, several limitations should be considered when interpreting the results. These limitations concern the construction of the dataset, the interpretation of the econometric estimates, the clustering procedure, and the predictive validation of the machine-learning models.
First, the analysis relies on data from the Regional Innovation Scoreboard and therefore inherits the conceptual and measurement constraints associated with composite innovation indicators. The Summary Innovation Index (SII) aggregates multiple dimensions of regional innovation, while several explanatory variables used in this study represent components or closely related dimensions of the same innovation measurement system. Consequently, the strong statistical relationships observed between SII and the selected indicators should primarily be interpreted as conditional associations rather than causal effects. The study identifies which dimensions are systematically associated with and predictive of overall innovation performance, but it cannot establish that changes in individual indicators necessarily cause subsequent changes in SII.
Second, although the dataset contains 246 regional units and 1,968 region-year observations, the temporal dimension covers only eight years (2016–2023). This relatively short time horizon limits the analysis of long-term innovation trajectories and structural transformations. Moreover, regional innovation may respond to policy interventions, institutional reforms, technological shocks, or economic crises with substantial time lags that cannot be fully captured within the available period. Future research could extend the temporal coverage as additional harmonized RIS observations become available.
Third, the econometric diagnostics indicate several issues requiring cautious interpretation. The Hausman test supports fixed effects over random effects, but the Wooldridge test identifies serial correlation, while evidence of cross-sectional dependence also emerges from the available diagnostics. In addition, although the dynamic specification satisfies the AR(2) condition, the Sargan test rejects the over-identifying restrictions. The dynamic model should therefore be interpreted as complementary evidence rather than as definitive causal identification. Future extensions could investigate alternative instrument structures and robust covariance estimators capable of addressing serial and cross-sectional dependence more explicitly.
Fourth, the clustering results depend on methodological choices concerning standardization, distance measures, algorithms, and the number of clusters considered. Although K-Means provides the strongest overall performance across several validation criteria, its Silhouette coefficient remains relatively modest (0.180), indicating partially overlapping rather than sharply separated innovation profiles. Moreover, the preferred ten-cluster solution corresponds to the maximum number of clusters evaluated. Therefore, k = 10 should be interpreted as the best solution within the investigated range, not necessarily as the global optimum. Extending the search beyond ten clusters and testing cluster stability across alternative samples would strengthen the robustness of the regional taxonomy.
Finally, the machine-learning results require similar caution. KNN achieves high test performance (R2 = 0.9482), but the optimal specification uses k = 1, making predictions highly localized and potentially sensitive to individual observations. Furthermore, because the dataset has a panel structure, conventional random train-validation-test partitioning may allow observations from the same region in different years to appear across different subsets. This could produce more favorable predictive performance than a genuinely out-of-region or future-period forecasting exercise. Future research should therefore employ temporal holdouts, grouped cross-validation by region, or both, to test whether predictive accuracy persists under stricter generalization conditions.
Overall, these limitations do not invalidate the integrated framework but define the boundaries within which its results should be interpreted. Future research should extend temporal coverage, strengthen econometric robustness, examine alternative cluster structures, and adopt panel-aware machine-learning validation. Such extensions would provide a stronger basis for assessing the generalizability and potential policy application of the Explain–Classify–Predict framework.
10. Conclusions
This study investigated regional innovation performance through an integrated empirical framework combining panel-data econometrics, unsupervised clustering, and supervised machine learning. Using Regional Innovation Scoreboard data for 246 regional units over the period 2016–2023, the analysis was designed to move beyond a single methodological perspective and examine regional innovation simultaneously in terms of systematic associations, heterogeneous territorial configurations, and predictive performance. The resulting Explain–Classify–Predict framework represents the central contribution of the study, demonstrating how econometric and machine-learning techniques can provide complementary rather than competing forms of evidence.
The econometric results show that regional innovation performance is systematically associated with multiple dimensions of the innovation ecosystem. International scientific co-publications, non-R&D innovation expenditure, SME product and business-process innovation, innovative collaboration, design applications, innovative sales, and the environmental indicator display positive and statistically significant coefficients across the estimated specifications. The fixed-effects model emerges as the preferred explanatory specification, with the Hausman test providing strong evidence against the random-effects assumption. Furthermore, the positive and significant coefficient of lagged SII in the dynamic model indicates persistence in regional innovation performance, although the rejection of the Sargan test requires caution in interpreting the dynamic specification. Overall, these findings emphasize that innovation performance reflects the interaction of multiple regional capabilities rather than a single dominant factor.
The clustering analysis provides complementary evidence of substantial regional heterogeneity. Among the six algorithms considered, K-Means offers the strongest overall balance between explained variation, compactness, cluster-size distribution, and internal validation performance. Its BSS/TSS ratio of 0.630 indicates that approximately 63% of total variation is attributable to differences between the identified profiles. More importantly, the ten-cluster solution reveals qualitatively different innovation configurations. High-performing observations do not necessarily share an identical combination of characteristics: some profiles are more science-intensive, others emphasize SME innovation, collaboration, design capabilities, or commercialization. Conversely, weaker profiles frequently combine disadvantages across several dimensions. Regional innovation should therefore be understood as configurational and territorially heterogeneous rather than as a simple continuum between innovation leaders and laggards.
The predictive analysis further reinforces this interpretation. K-Nearest Neighbors provides the strongest test performance among the seven regression algorithms, achieving an R2 of 0.9482, RMSE of 7.90, MAE of 4.793, and test MSE of 62.41. Random Forest represents the second-best predictive model, while the weaker performance of conventional Linear Regression indicates that nonlinear and localized structures contain additional predictive information. The KNN interpretability analysis also identifies international scientific co-publications as the most influential global predictor, followed by design applications and SME collaboration. At the same time, local explanations show substantial variation in feature contributions across individual observations, confirming that different combinations of characteristics can generate similar levels of predicted innovation performance.
Taken together, these findings answer the three research questions through complementary evidence. Panel econometrics identifies common relationships underlying regional innovation performance; clustering demonstrates that these relationships coexist with heterogeneous regional configurations; and machine learning shows that the multidimensional structure of innovation can be exploited to generate high predictive accuracy. The contribution of the study therefore lies not in establishing the superiority of one methodological family, but in demonstrating the analytical value of their integration.
From a policy perspective, the findings support a transition from uniform innovation interventions toward more adaptive and place-sensitive strategies. Regional authorities should consider not only overall innovation performance but also the specific configuration of capabilities underlying that performance. Scientific connectivity, SME innovation, collaboration, intellectual assets, commercialization, and environmental conditions may require different policy combinations across different regional profiles.
Future research can extend this framework through longer temporal series, spatial econometric specifications, alternative dynamic-panel instruments, broader cluster searches, and panel-aware machine-learning validation. Despite these avenues for further development, the evidence demonstrates that integrating explanation, classification, and prediction provides a richer representation of regional innovation systems and offers a promising methodological foundation for both future research and evidence-based regional innovation policy.
Appendix A. Countries and Regions
| Country | Regions included in the dataset |
| Austria | Ostösterreich; Südösterreich; Westösterreich |
| Belgium | Région de Bruxelles-Capitale / Brussels Hoofdstedelijk Gewest; Région wallonne; Vlaams Gewest |
| Bulgaria | Severen tsentralen; Severoiztochen; Severozapaden; Yugoiztochen; Yugozapaden; Yuzhen tsentralen |
| Croatia | Grad Zagreb; Jadranska Hrvatska; Panonska Hrvatska; Sjeverna Hrvatska |
| Cyprus | Cyprus |
| Czechia | Jihovýchod; Jihozápad; Moravskoslezsko; Praha; Severovýchod; Severozápad; Strední Cechy; Strední Morava |
| Denmark | Hovedstaden; Midtjylland; Nordjylland; Sjælland; Syddanmark |
| Estonia | Estonia |
| Finland | Etelä-Suomi; Itä-Suomi; Länsi-Suomi; Pohjois-Suomi; Åland |
| France | Auvergne—Rhône-Alpes; Bourgogne—Franche-Comté; Bretagne; Centre—Val de Loire; Corse; Grand Est; Hauts-de-France; Normandie; Nouvelle-Aquitaine; Occitanie; Pays de la Loire; Provence-Alpes-Côte d’Azur; RUP FR—Régions ultrapériphériques françaises; Île de France |
| Germany | Arnsberg; Berlin; Brandenburg; Braunschweig; Bremen; Chemnitz; Darmstadt; Detmold; Dresden; Düsseldorf; Freiburg; Gießen; Hamburg; Hannover; Karlsruhe; Kassel; Koblenz; Köln; Leipzig; Lüneburg; Mecklenburg-Vorpommern; Mittelfranken; Münster; Niederbayern; Oberbayern; Oberfranken; Oberpfalz; Rheinhessen-Pfalz; Saarland; Sachsen-Anhalt; Schleswig-Holstein; Schwaben; Stuttgart; Thüringen; Trier; Tübingen; Unterfranken; Weser-Ems |
| Greece | Anatoliki Makedonia, Thraki; Attiki; Dytiki Ellada; Dytiki Makedonia; Ionia Nisia; Ipeiros; Kentriki Makedonia; Kriti; Notio Aigaio; Peloponnisos; Sterea Ellada; Thessalia; Voreio Aigaio |
| Hungary | Budapest; Dél-Alföld; Dél-Dunántúl; Közép-Dunántúl; Nyugat-Dunántúl; Pest; Észak-Alföld; Észak-Magyarország |
| Ireland | Eastern and Midland; Northern and Western; Southern |
| Italy | Abruzzo; Basilicata; Calabria; Campania; Emilia-Romagna; Friuli-Venezia Giulia; Lazio; Liguria; Lombardia; Marche; Molise; Piemonte; Provincia Autonoma Bolzano/Bozen; Provincia Autonoma Trento; Puglia; Sardegna; Sicilia; Toscana; Umbria; Valle d’Aosta/Vallée d’Aoste; Veneto |
| Latvia | Latvia |
| Lithuania | Sostines regionas; Vidurio ir vakaru Lietuvos regionas |
| Luxembourg | Luxembourg |
| Malta | Malta |
| Netherlands | Drenthe; Flevoland; Friesland; Gelderland; Groningen; Limburg; Noord-Brabant; Noord-Holland; Overijssel; Utrecht; Zeeland; Zuid-Holland |
| Norway | Agder og Sør-Østlandet; Innlandet; Jan Mayen and Svalbard; Nord-Norge; Oslo og Viken; Trøndelag; Vestlandet |
| Poland | Dolnoslaskie; Kujawsko-Pomorskie; Lubelskie; Lubuskie; Lódzkie; Malopolskie; Mazowiecki regionalny; Opolskie; Podkarpackie; Podlaskie; Pomorskie; Slaskie; Swietokrzyskie; Warminsko-Mazurskie; Warszawski stoleczny; Wielkopolskie; Zachodniopomorskie |
| Portugal | Alentejo; Algarve; Centro; Lisboa; Norte; Região Autónoma da Madeira; Região Autónoma dos Açores |
| Romania | Bucuresti—Ilfov; Centru; Nord-Est; Nord-Vest; Sud—Muntenia; Sud-Est; Sud-Vest Oltenia; Vest |
| Serbia | Beogradski region; Region Juzne i Istocne Srbije; Region Sumadije i Zapadne Srbije; Region Vojvodine |
| Slovakia | Bratislavský kraj; Stredné Slovensko; Východné Slovensko; Západné Slovensko |
| Slovenia | Vzhodna Slovenija; Zahodna Slovenija |
| Spain | Andalucía; Aragón; Canarias; Cantabria; Castilla y León; Castilla-la Mancha; Cataluña; Ciudad de Ceuta; Ciudad de Melilla; Comunidad Foral de Navarra; Comunidad de Madrid; Comunitat Valenciana; Extremadura; Galicia; Illes Balears; La Rioja; País Vasco; Principado de Asturias; Región de Murcia |
| Sweden | Mellersta Norrland; Norra Mellansverige; Småland med öarna; Stockholm; Sydsverige; Västsverige; Östra Mellansverige; Övre Norrland |
| Switzerland | Espace Mittelland; Nordwestschweiz; Ostschweiz; Région lémanique; Ticino; Zentralschweiz; Zürich |
| United Kingdom | East Midlands; East of England; London; North East; North West; Northern Ireland; Scotland; South East; South West; Wales; West Midlands; Yorkshire and The Humber |
References
- Antenozio, L.; Di Berardino, D.; Consorti, A.; Migliori, S. Regional public institutions’ investments and innovative SMEs: a dual relationship. Azienda Pubblica 2025, 38(2), 401–421. [Google Scholar] [CrossRef]
- Araki, M. E.; Bennett, D. L.; Wagner, G. A. Regional innovation networks & high-growth entrepreneurship. Research Policy 2024, 53(1), 104900. [Google Scholar] [CrossRef]
- Archibugi, D.; Evangelista, R.; Vezzani, A. Regional Technological Capabilities and the Access to H2020 Funds. Journal of Common Market Studies 2022, 60(4), 926–944. [Google Scholar] [CrossRef]
- Aronica, M.; Fazio, G.; Piacentino, D. A micro-founded approach to regional innovation in Italy. Technological Forecasting and Social Change 2022, 176, 121494. [Google Scholar] [CrossRef]
- Ascani, A.; Bettarelli, L.; Resmini, L.; Balland, P. A. Global networks, local specialisation and regional patterns of innovation. Research Policy 2020, 49(8), 104031. [Google Scholar] [CrossRef]
- Bankins, S.; Molloy, C.; Kriz, A. Enacting Responsible Innovation in a Region: Stakeholder Perceptions and Insights From Australia. R and D Management 2026, 56(3), 460–473. [Google Scholar] [CrossRef]
- Bergamini, M.; Sleuwaegen, L.; Van Looy, B. Aesthetic innovation and the growth of EU regions: Real effects of artists? Technovation 2026, 150, 103372. [Google Scholar] [CrossRef]
- Beynon, M.; Pickernell, D.; Battisti, M.; Jones, P. A panel fsQCA investigation on European regional innovation. Technological Forecasting and Social Change 2024, 199, 123042. [Google Scholar] [CrossRef]
- Bhawsar, P. Clusters: semantically different yet a panacea for achieving resilient competitiveness. Competitiveness Review 2023, 33(5), 841–860. [Google Scholar] [CrossRef]
- Bogers, M. L. A. M.; Poursaeidi, S. A.; Mahdad, M.; Norn, M. T. Catalyzing Regional Innovation Ecosystems to Address Global Challenges: Toward the Fourth-Generation University? Research Technology Management 2026, 69(2), 14–22. [Google Scholar] [CrossRef]
- Bouguerra, A.; Hughes, M.; Rodgers, P.; Stokes, P.; Tatoglu, E. Confronting the grand challenge of environmental sustainability within supply chains: How can organizational strategic agility drive environmental innovation? Journal of Product Innovation Management 2024, 41(2), 323–346. [Google Scholar] [CrossRef]
- Bratanova, A.; Pham, H.; Mason, C.; Hajkowicz, S.; Naughtin, C.; Schleiger, E.; Sanderson, C.; Chen, C.; Karimi, S. Differentiating artificial intelligence activity clusters in Australia. Technology in Society 2022, 71, 102104. [Google Scholar] [CrossRef]
- Bukhari, E.; Dabic, M.; Shifrer, D.; Daim, T.; Meissner, D. Entrepreneurial university: The relationship between smart specialization innovation strategies and university-region collaboration. Technology in Society 2021, 65, 101560. [Google Scholar] [CrossRef]
- Cai, Z.; Ma, D.; Zhou, R.; Zhang, Z. Unraveling the impact of patent transfers on regional innovation: Empirical insights through the lens of entity relationships. Technological Forecasting and Social Change 2024, 208, 123666. [Google Scholar] [CrossRef]
- Carayannis, E. G.; Papamichail, G.; Angelakis, A.; Manioudis, M.; Zotas, N. R. Profiling the Entrepreneurship and Innovation Ecosystem (EIE) of crete: A Quintuple Innovation Helix perspective. Technovation 2026, 156, 103642. [Google Scholar] [CrossRef]
- Chen, H.; Zhang, Z.; Lin, C. How to Enhance Regional Innovation Ecosystem Resilience in China? A Configuration Analysis Based on Panel Data. IEEE Transactions on Engineering Management 2024, 71, 14401–14414. [Google Scholar] [CrossRef]
- Chen, Y.; Ye, Q. Gospel across the millennium: impact of Confucian culture on innovation in China. Technology Analysis and Strategic Management 2025. [Google Scholar] [CrossRef]
- Cheng, S.; Lin, P.; Tan, Y.; Zhang, Y. “High” innovators? Marijuana legalization and regional innovation. Production and Operations Management 2023, 32(3), 685–703. [Google Scholar] [CrossRef]
- Chu, Y.; Pang, L.; Ayoungman, F. Z. Research on the Impact of Enterprise Innovation and Government Organization Innovation on Regional Collaborative Innovation. Journal of Organizational and End User Computing 2023, 35(3). [Google Scholar] [CrossRef]
- Costa, A. R.; Garcia, R.; Roselino, J. E.; Cruz Júnior, J. C. Set skilled workers free: the mobility of workers and innovation in Brazil. Industry and Innovation 2023, 30(10), 1357–1379. [Google Scholar] [CrossRef]
- Creanga, D. E.; Stefan, G.; Mursa, G. C.; Mihai, C.; Brezuleanu, C. O. EUROPEAN CLUSTERS: FACTS AND TRENDS. Transformations in Business and Economics 2022, 21(2), 690–706. [Google Scholar]
- Crown, D.; Faggian, A.; Corcoran, J. Foreign-Born graduates and innovation: Evidence from an Australian skilled visa program. Research Policy 2020, 49(9), 103945. [Google Scholar] [CrossRef]
- Damiani, F.; Muzzioli, S.; De Baets, B. A poset-based analysis of regional innovation at European level; Economics of Innovation and New Technology, 2026. [Google Scholar] [CrossRef]
- Damioli, G.; Marin, G. The effects of foreign entry on local innovation by entry mode. Research Policy 2024, 53(3), 104957. [Google Scholar] [CrossRef]
- De Noni, I.; Ganzaroli, A.; Pilotti, L. Spawning exaptive opportunities in European regions: The missing link in the smart specialization framework. Research Policy 2021, 50(6), 104265. [Google Scholar] [CrossRef]
- Deng, Q. Spatiotemporal evolution and configuration pathways of digital-intelligent regional innovation ecosystem sustainability: Evidence from China based on symbiosis theory. Technology in Society 2026, 85, 103144. [Google Scholar] [CrossRef]
- Duan, R.; Jin, L. Influence of the leading role of collaboration in knowledge transfer in the regional context. Knowledge Management Research and Practice 2022a, 20(4), 619–629. [Google Scholar] [CrossRef]
- Duan, R.; Jin, L. The role of public innovation intermediaries in regional innovation: a comparative study of two regions in Japan. Technology Analysis and Strategic Management 2022b, 34(5), 578–593. [Google Scholar] [CrossRef]
- Durugbo, C. M.; Al-Jayyousi, O. R.; Almahamid, S. M. Wisdom from Arabian Creatives: Systematic Review of Innovation Management Literature for the Gulf Cooperation Council (GCC) Region. International Journal of Innovation and Technology Management 2020, 17(6), 2030004. [Google Scholar] [CrossRef]
- Edeh, J.; Prévot, F. Beyond funding: The moderating role of firms’ R&D human capital on government support and venture capital for regional innovation in China. Technological Forecasting and Social Change 2024, 203, 123351. [Google Scholar] [CrossRef]
- Ejdemo, T.; Örtqvist, D. Related variety as a driver of regional innovation and entrepreneurship: A moderated and mediated model with non-linear effects. Research Policy 2020, 49(7), 104073. [Google Scholar] [CrossRef]
- Elhorst, P.; Faems, D. Evaluating proposals in innovation contests: Exploring negative scoring spillovers in the absence of a strict evaluation sequence. Research Policy 2021, 50(4), 104198. [Google Scholar] [CrossRef]
- Fatemi, M.; Ghazinoory, S.; Nasri, S.; Pakzad, M. Linear Optimization Modeling for Smart Specialization in Primary Sectors of a Developing Country. IEEE Transactions on Engineering Management 2024, 71, 13890–13904. [Google Scholar] [CrossRef]
- Feng, W.; Yuan, H. The impact of medical infrastructure on regional innovation: An empirical analysis of China’s prefecture-level cities. Technological Forecasting and Social Change 2023, 186, 122125. [Google Scholar] [CrossRef] [PubMed]
- Ferrer-Serrano, M.; Latorre-Martínez, M. P.; Fuentelsaz, L. Regional knowledge asymmetries and innovation performance from collaborations across European regions. Journal of Technology Transfer 2025, 50(4), 1491–1523. [Google Scholar] [CrossRef]
- Filippopoulos, N.; Fotopoulos, G. Innovation in economically developed and lagging European regions: A configurational analysis. Research Policy 2022, 51(2), 104424. [Google Scholar] [CrossRef]
- Françoso, M. S.; Vonortas, N. S. Gatekeepers in regional innovation networks: Evidence from an emerging economy. Journal of Technology Transfer 2023, 48(3), 821–841. [Google Scholar] [CrossRef]
- Frigon, A. The sources of technological complexity in regions. Research Policy 2026, 55(4), 105455. [Google Scholar] [CrossRef]
- Gao, J. Internet Development Empowering Innovation Activities to Achieve Efficient and Balanced Development: Evidence From China. International Journal of Knowledge Management 2025, 21(1). [Google Scholar] [CrossRef]
- Gao, Y.; Hu, Y.; Liu, X.; Zhang, H. Can Public R&D Subsidy Facilitate Firms’ Exploratory Innovation? The Heterogeneous Effects between Central and Local Subsidy Programs. Research Policy 2021, 50(4), 104221. [Google Scholar] [CrossRef]
- Gerlitz, L.; Meyer, C.; Prause, G. Methodology approach on benchmarking regional innovation on smart Specialisation (Ris3): A joint macro-regional tool to regional performance evaluation and monitoring in Central Europe. Entrepreneurship and Sustainability Issues 2020, 8(2), 1359–1385. [Google Scholar] [CrossRef] [PubMed]
- González-Martinez, P.; García-Pérez-De-Lema, D.; Castillo-Vergara, M.; Hansen, P. B. Determinants and performance of the quadruple helix model and the mediating role of civil society. Technology in Society 2023, 75, 102358. [Google Scholar] [CrossRef]
- Graf, H.; Broekel, T. A shot in the dark? Policy influence on cluster networks. Research Policy 2020, 49(3), 103920. [Google Scholar] [CrossRef]
- He, P.; Gao, Y. Learning by exporting: The impact of the China–Europe Railway Express on city-level innovation in China. Transportation Research Part A: Policy and Practice 2026, 207, 104956. [Google Scholar] [CrossRef]
- Hervás-Oliver, J. L.; Parrilli, M. D.; Rodríguez-Pose, A.; Sempere-Ripoll, F. The drivers of SME innovation in the regions of the EU. Research Policy 2021, 50(9), 104316. [Google Scholar] [CrossRef]
- Hu, Y.; Liu, D. Government as a non-financial participant in innovation: How standardization led by government promotes regional innovation performance in China. Technovation 2022, 114, 102524. [Google Scholar] [CrossRef]
- Huang, E. X.; Zou, X. How do CCIs contribute to regional innovation? International Journal of Innovation Science 2024, 16(2), 320–337. [Google Scholar] [CrossRef]
- Jiang, H.; Liang, Y.; Pan, S. Foreign direct investment and regional innovation: Evidence from China. World Economy 2022, 45(6), 1876–1909. [Google Scholar] [CrossRef]
- Kadlec, V.; Květoň, V.; Vlčková, J.; Blažek, J.; Horák, P. Contrasting patterns and dynamics of patent offshoring in European regions. Journal of Technology Transfer 2023, 48(4), 1300–1326. [Google Scholar] [CrossRef]
- Komikado, H.; Morikawa, S.; Bhatt, A.; Kato, H. High-speed rail, inter-regional accessibility, and regional innovation: Evidence from Japan. Technological Forecasting and Social Change 2021, 167, 120697. [Google Scholar] [CrossRef]
- Kruse, M. On sustainability in regional innovation studies and smart specialisation. Innovation: The European Journal of Social Science Research 2025, 38(2), 961–982. [Google Scholar] [CrossRef]
- Kumar, A.; Operti, E. Recessions, institutions, and regional exploration. Research Policy 2025, 54(3), 105189. [Google Scholar] [CrossRef]
- Lee, M. J.; Choi, H.; Roh, T. Is institutional pressure the driver for green business model innovation of SMEs? Mediating and moderating roles of regional innovation intermediaries. Technological Forecasting and Social Change 2024, 209, 123814. [Google Scholar] [CrossRef]
- Li, Y.; Long, W.; Ning, X.; Zhu, Y.; Guo, Y.; Huang, Z.; Hao, Y. How can China’s sustainable development be damaged in consequence of financial misallocation? Analysis from the perspective of regional innovation capability. Business Strategy and the Environment 2022, 31(7), 3649–3668. [Google Scholar] [CrossRef]
- Liang, L.; Li, Y. How does government support promote digital economy development in China? The mediating role of regional innovation ecosystem resilience. Technological Forecasting and Social Change 2023, 188, 122328. [Google Scholar] [CrossRef]
- Liang, Y.; Giroud, A.; Rygh, A. Strategic asset-seeking acquisitions, technological gaps, and innovation performance of Chinese multinationals. Journal of World Business 2022, 57(4), 101325. [Google Scholar] [CrossRef]
- Liao, J. Evolution and coordination optimisation of regional innovation and entrepreneurship space layout under the background of social networks. International Journal of Networking and Virtual Organisations 2025, 32(1-4), 313–331. [Google Scholar] [CrossRef]
- Lu, W.; Lu, S. Low interest rate environment and regional innovation. Economics of Innovation and New Technology 2026, 35(3), 497–515. [Google Scholar] [CrossRef]
- Ma, H.; Hu, X.; Fang, C.; Dai, L.; Li, Y. Assessing regional innovation resilience within China’s city networks under COVID-19: Resistance, recoverability, and adaptability. Cities 2026, 172, 106822. [Google Scholar] [CrossRef]
- Mamatzakis, E.; Staikouras, C.; Tsamadias, C. Bayesian dynamic analysis on innovation adjustment to SME human capital capacity in EU regions. Journal of Technology Transfer 2026. [Google Scholar] [CrossRef]
- Messina, L.; Miller, K.; Galbraith, B.; Hewitt-Dundas, N. A recipe for USO success? Unravelling the micro-foundations of dynamic capability building to overcome critical junctures. Technological Forecasting and Social Change 2022, 174, 121257. [Google Scholar] [CrossRef]
- Min, S.; Kim, J.; Sawng, Y. W. The effect of innovation network size and public R&D investment on regional innovation efficiency. Technological Forecasting and Social Change 2020, 155, 119998. [Google Scholar] [CrossRef]
- Miwa, N.; Bhatt, A.; Morikawa, S.; Kato, H. High-Speed rail and the knowledge economy: Evidence from Japan. Transportation Research Part A: Policy and Practice 2022, 159, 398–416. [Google Scholar] [CrossRef]
- Mukhiyayeva, D.; Kabikenov, A.; Kaliyeva, A.; Moldakenova, Y. Regional innovation efficiency in Kazakhstan: Evidence from stochastic frontier and cluster analysis. Problems and Perspectives in Management 2026, 24(3), 118–129. [Google Scholar] [CrossRef]
- Nylund, P.; Brem, A. The Complex Diffusion of Electric Vehicles: A Dominant Design Perspective. IEEE Transactions on Engineering Management 2024, 71, 11629–11637. [Google Scholar] [CrossRef]
- Ouyang, Y.; Hu, M. Data factor marketization and regional innovation: Evidence from the establishment of data trading platforms in China. Technology in Society 2026, 87, 103371. [Google Scholar] [CrossRef]
- Pardy, M. Multinationals and intra-regional innovation concentration. Research Policy 2025, 54(6), 105235. [Google Scholar] [CrossRef]
- Pfister, C.; Koomen, M.; Harhoff, D.; Backes-Gellner, U. Regional innovation effects of applied research institutions. Research Policy 2021, 50(4), 104197. [Google Scholar] [CrossRef]
- Pfotenhauer, S. M.; Wentland, A.; Ruge, L. Understanding regional innovation cultures: Narratives, directionality, and conservative innovation in Bavaria. Research Policy 2023, 52(3), 104704. [Google Scholar] [CrossRef]
- Poček, J. Healthcare organizations in entrepreneurial ecosystems: an integrative framework and future research agenda. Technology in Society 2026, 86, 103245. [Google Scholar] [CrossRef]
- Quignon, A. Cluster and local science-industry collaborations: evidence from a place-based innovation policy. Journal of Technology Transfer 2025. [Google Scholar] [CrossRef]
- Robbiano, S. The innovative impact of public research institutes: Evidence from Italy. Research Policy 2022, 51(10), 104567. [Google Scholar] [CrossRef]
- Ruan, R.; Chen, W. Research on the impact of geographic distance on corporate technology for social good: From the perspective of institutional environment and regional innovation capability. Journal of Cleaner Production 2024, 457, 142391. [Google Scholar] [CrossRef]
- Sergio, I.; Iandolo, S.; Ferragina, A. M. Inter-sectoral and inter-regional knowledge spillovers: The role of ICT and technological branching on innovation in high-tech sectors. Technological Forecasting and Social Change 2023, 194, 122728. [Google Scholar] [CrossRef]
- Shakiba, H.; Belitski, M. A game theory analysis of regional innovation ecosystems. Journal of Technology Transfer 2025, 50(3), 797–820. [Google Scholar] [CrossRef]
- Shi, X.; Liang, X.; Luo, Y. Unpacking the intellectual structure of ecosystem research in innovation studies. Research Policy 2023, 52(6), 104783. [Google Scholar] [CrossRef]
- Suhrab, M.; Pinglu, C.; Radulescu, M.; Magazzino, C. Innovation’s dark side: how digital finance and regional innovation ecosystems amplify corporate debt risks in China. Financial Innovation 2026, 12(1), 10. [Google Scholar] [CrossRef]
- Sun, K.; Li, Y. Knowledge complexity and intercity technology transfer in China, 2001–2020. Technology in Society 2026, 86, 103246. [Google Scholar] [CrossRef]
- Tang, H.; Zhang, J.; Fan, F.; Wang, Z. High-speed rail, urban form, and regional innovation: a time-varying difference-in-differences approach. Technology Analysis and Strategic Management 2024, 36(2), 195–209. [Google Scholar] [CrossRef]
- Tao, Z.; Shuliang, Z. Collaborative innovation relationship in Yangtze River Delta of China: Subjects collaboration and spatial correlation. Technology in Society 2022, 69, 101974. [Google Scholar] [CrossRef]
- Tian, L.; Han, L. Nurturing regional innovation: The effects of bank competition in the USA. International Journal of Banking, Accounting and Finance 2021, 12(1), 75–96. [Google Scholar] [CrossRef]
- Tomasi, S.; García Urdiales, O.; Fornara, M. A.; Flad, M.; da Rocha Oliveira Teixeira, R.; Moberg, K.; Henry, C.; Klotz, M.; Cavicchi, A. Boosting Regional Innovation through Co-creation for Sustainable Entrepreneurship: Stakeholders’ Perspective on the Start for Future Initiative. Triple Helix 2024, 11(3), 286–322. [Google Scholar] [CrossRef]
- Toroslu, A.; Schemmann, B.; Chappin, M. M. H.; Castaldi, C.; Herrmann, A. M. The business of supporting open innovation: drivers of value capture of business incubators across German regions. Journal of Technology Transfer 2025. [Google Scholar] [CrossRef]
- Ungureanu, P. Putting Space in Place. Multimodal Translation of the Grand Challenge of Regional Smart Specialization from Policy to Cross-sector Partnerships. Journal of Business Ethics 2023, 184(4), 895–915. [Google Scholar] [CrossRef]
- van Apeldoorn, N.; Mayer, I.; Zhou, Q. Making (common) sense of Urban Digital Twins with Q methodology. Cities 2025, 165, 106123. [Google Scholar] [CrossRef]
- Vefago, Y. B.; Trierweiller, A. C.; de Paula, L. B. The third mission of universities: the entrepreneurial university. Brazilian Journal of Operations and Production Management 2020, 17(4), e2020971. [Google Scholar] [CrossRef]
- Villani, E.; Lechner, C. How to acquire legitimacy and become a player in a regional innovation ecosystem? The case of a young university. Journal of Technology Transfer 2021, 46(4), 1017–1045. [Google Scholar] [CrossRef]
- Walpole, G.; Bacon, E.; Malik, T.; Rich, N. Developing a model of circular economy engagement for public sector organizations. Public Money and Management 2025, 45(7), 788–798. [Google Scholar] [CrossRef]
- Wang, S.; Wang, J. Intellectual property protection and energy efficiency: Evidence from a quasi-natural experiment in China. Journal of Cleaner Production 2025, 525, 146625. [Google Scholar] [CrossRef]
- Wang, Y.; Qin, M.; Yan, X.; Liu, L.; Shang, T. Research on the impact of government-led technical standardization on regional innovation performance. Journal of Technology Transfer 2026, 51(4), 2731–2752. [Google Scholar] [CrossRef]
- Wang, Z.; He, Q.; Xia, S.; Sarpong, D.; Xiong, A.; Maas, G. Capacities of business incubator and regional innovation performance. Technological Forecasting and Social Change 2020, 158, 120125. [Google Scholar] [CrossRef]
- Wang, Z.; Yin, H.; Fan, F.; Fang, Y.; Zhang, H. Science and technology insurance and regional innovation: evidence from provincial panel data in China. Technology Analysis and Strategic Management 2024, 36(4), 746–764. [Google Scholar] [CrossRef]
- Wu, F.; Chen, J.; Tang, Y.; Zhang, Y. Spatiotemporal evolution of regional innovation capacity from an open innovation perspective. Technology in Society 2026, 85, 103157. [Google Scholar] [CrossRef]
- Wu, W.; Wang, Z. Industrial robot diffusion and regional innovation disparities. Technology in Society 2025, 83, 103003. [Google Scholar] [CrossRef]
- Xia, S.; Zhou, Y.; Wang, Z.; He, Q.; Parry, G. Enhancing green innovation through university–industry collaboration and artificial intelligence: insights from regional innovation systems in China. Journal of Technology Transfer 2026, 51(2), 653–681. [Google Scholar] [CrossRef]
- Xiang, L.; Xuemei, H.; Junwen, Y. Regularized Poisson regressions predict regional innovation output. Journal of Forecasting 2023, 42(8), 2197–2216. [Google Scholar] [CrossRef]
- Xie, Q.; Su, J. The spatial-temporal complexity and dynamics of research collaboration: Evidence from 297 cities in China (1985–2016). Technological Forecasting and Social Change 2021, 162, 120390. [Google Scholar] [CrossRef]
- Xie, X.; Liu, X.; Blanco, C. Evaluating and forecasting the niche fitness of regional innovation ecosystems: A comparative evaluation of different optimized grey models. Technological Forecasting and Social Change 2023, 191, 122473. [Google Scholar] [CrossRef]
- Xu, A.; Qiu, K.; Jin, C.; Cheng, C.; Zhu, Y. Regional innovation ability and its inequality: Measurements and dynamic decomposition. Technological Forecasting and Social Change 2022, 180, 121713. [Google Scholar] [CrossRef]
- Yalcinkaya, B.; Ding, W. W. Abortion restriction laws and mobility of scientists. Strategic Management Journal 2026, 47(9), 2395–2433. [Google Scholar] [CrossRef]
- Yang, J.; Liu, W. Knowledge source switching under state interventions of latecomer regions: A case study of Shenzhen. Technology in Society 2024, 79, 102730. [Google Scholar] [CrossRef]
- Yang, N.; Liu, Q.; Chen, Y. Does Industrial Agglomeration Promote Regional Innovation Convergence in China? Evidence From High-Tech Industries. IEEE Transactions on Engineering Management 2023a, 70(4), 1416–1429. [Google Scholar] [CrossRef]
- Yang, N.; Liu, Q.; Qi, Y. Does (un)-related variety promote regional innovation in China? Industry versus services sector. Chinese Management Studies 2020, 14(3), 769–788. [Google Scholar] [CrossRef]
- Yang, X.; Zhang, H.; Lin, S.; Zhang, J.; Zeng, J. Does high-speed railway promote regional innovation growth or innovation convergence? Technology in Society 2021, 64, 101472. [Google Scholar] [CrossRef]
- Yang, Y.; Wu, X.; Zhang, Y.; Wang, C.; Liu, F.; Zhou, S.; Hu, F.; Liu, C. Data-Driven Evaluation of Regional Innovation Capability: A Case Study of Anhui Province. Journal of Global Information Management 2023b, 31(4). [Google Scholar] [CrossRef]
- Yin, H. T.; Wen, J.; Chang, C. P. Science-technology intermediary and innovation in China: Evidence from State Administration for Market Regulation, 2000–2019. Technology in Society 2022, 68, 101864. [Google Scholar] [CrossRef]
- Yin, Y.; Gu, J.; Li, M. How regional innovation ecology drives rural entrepreneurial vitality? a dynamic QCA analysis based on Chinese experience. Technology Analysis and Strategic Management 2025. [Google Scholar] [CrossRef]
- Yu, F.; Shi, Y.; Wang, T. R&D investment and Chinese manufacturing SMEs’ corporate social responsibility: The moderating role of regional innovative milieu. Journal of Cleaner Production 2020, 258, 120840. [Google Scholar] [CrossRef]
- Yu, H.; Ke, H.; Ye, Y.; Fan, F. Agglomeration and flow of innovation elements and the impact on regional innovation efficiency. International Journal of Technology Management 2023, 92(3), 229–254. [Google Scholar] [CrossRef]
- Zabudkina, A.; Lisein, O.; Pichault, F. Go your own way: Managerial engagement with regional innovation ecosystems for Industry 4.0 transformation in Belgian SMEs. Technovation 2026, 156, 103648. [Google Scholar] [CrossRef]
- Zhang, J.; Chen, X.; Zhao, X. A perspective of government investment and enterprise innovation: Marketization of business environment. Journal of Business Research 2023, 164, 113925. [Google Scholar] [CrossRef]
- Zhang, Y.; Liu, Z. Connect Globally, Thrive Locally: The Spillover Effect of Sister-City Inward FDI on Regional Innovation. IEEE Transactions on Engineering Management 2024, 71, 4634–4646. [Google Scholar] [CrossRef]
- Zhao, S.; Wang, J. Proximity and regional innovation performance: the mediating role of absorptive capacity. Journal of Science and Technology Policy Management 2025, 16(6), 1094–1110. [Google Scholar] [CrossRef]
- Zhao, Y.; Yongquan, Y.; Jian, M.; Lu, A.; Xuanhua, X. Policy-induced cooperative knowledge network, university-industry collaboration and firm innovation: Evidence from the Greater Bay Area. Technological Forecasting and Social Change 2024, 200, 123143. [Google Scholar] [CrossRef]
- Zheng, Y.; Han, W.; Yang, R. Does government behaviour or enterprise investment improve regional innovation performance?—Evidence from China. International Journal of Technology Management 2021, 85(2-4), 274–296. [Google Scholar] [CrossRef]
- Zhou, D.; Wang, Y.; Hao, F.; Feng, L. Digital technology diffusion and occupational diversity: Evidence from China. Technovation 2026a, 153, 103538. [Google Scholar] [CrossRef]
- Zhou, Y.; Wang, Z.; Feng, Q. Shaping regional futures: how education and career imprints of officials drive the rise of emerging industries. Journal of Technology Transfer 2026b, 51(2), 911–941. [Google Scholar] [CrossRef]
- Żółtaszek, A.; Olejnik, A. Regional effectiveness of innovation: leaders and followers of the EU NUTS 0 and NUTS 2 regions. Innovation: The European Journal of Social Science Research 2024, 37(2), 399–420. [Google Scholar] [CrossRef]
Figure 1.
Explain–Classify–Predict Framework for Regional Innovation Analysis. Note. The figure illustrates the integrated empirical framework, combining regional panel data with econometric explanation, unsupervised classification, and supervised prediction. The three complementary analytical stages generate integrated evidence on innovation drivers, regional profiles, and predictive performance.
Figure 1.
Explain–Classify–Predict Framework for Regional Innovation Analysis. Note. The figure illustrates the integrated empirical framework, combining regional panel data with econometric explanation, unsupervised classification, and supervised prediction. The three complementary analytical stages generate integrated evidence on innovation drivers, regional profiles, and predictive performance.
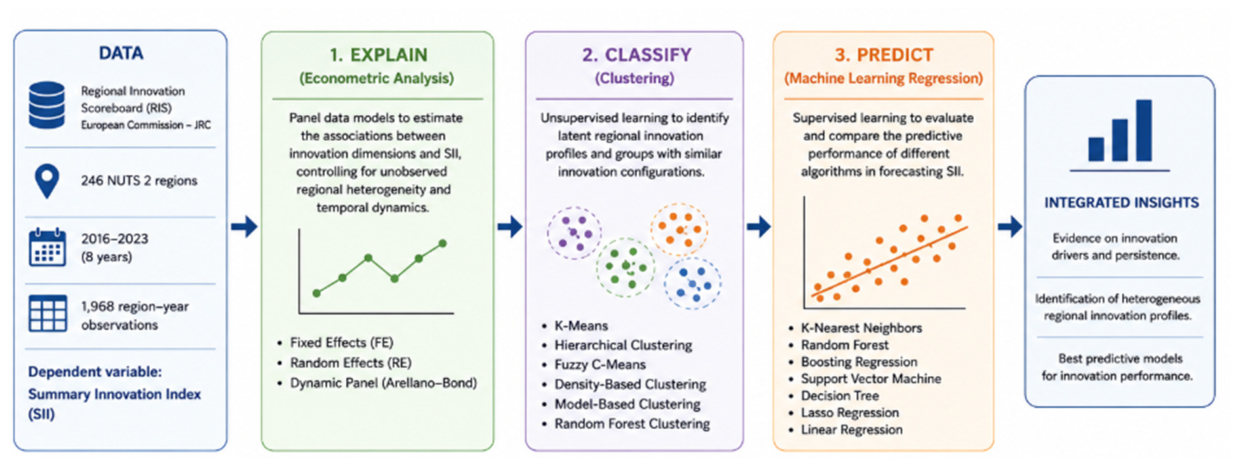
Figure 2.
K-Means Cluster Selection, Visualization, and Regional Innovation Profiles. Note. Panel A reports the model-selection criteria (AIC, BIC, and WSS) across alternative numbers of clusters, with the lowest reported BIC supporting the ten-cluster solution within the tested range. Panel B presents the two-dimensional t-SNE projection of the 1,968 observations, illustrating the spatial configuration and partial overlap of the ten K-Means clusters. Panel C reports standardized cluster means across SII and the selected innovation indicators, allowing comparison of the distinctive strengths and weaknesses characterizing each regional innovation profile. Panel D displays cluster-specific density distributions for the innovation indicators, highlighting within-cluster dispersion, distributional overlap, and the variables that most clearly differentiate the identified regional profiles.
Figure 2.
K-Means Cluster Selection, Visualization, and Regional Innovation Profiles. Note. Panel A reports the model-selection criteria (AIC, BIC, and WSS) across alternative numbers of clusters, with the lowest reported BIC supporting the ten-cluster solution within the tested range. Panel B presents the two-dimensional t-SNE projection of the 1,968 observations, illustrating the spatial configuration and partial overlap of the ten K-Means clusters. Panel C reports standardized cluster means across SII and the selected innovation indicators, allowing comparison of the distinctive strengths and weaknesses characterizing each regional innovation profile. Panel D displays cluster-specific density distributions for the innovation indicators, highlighting within-cluster dispersion, distributional overlap, and the variables that most clearly differentiate the identified regional profiles.
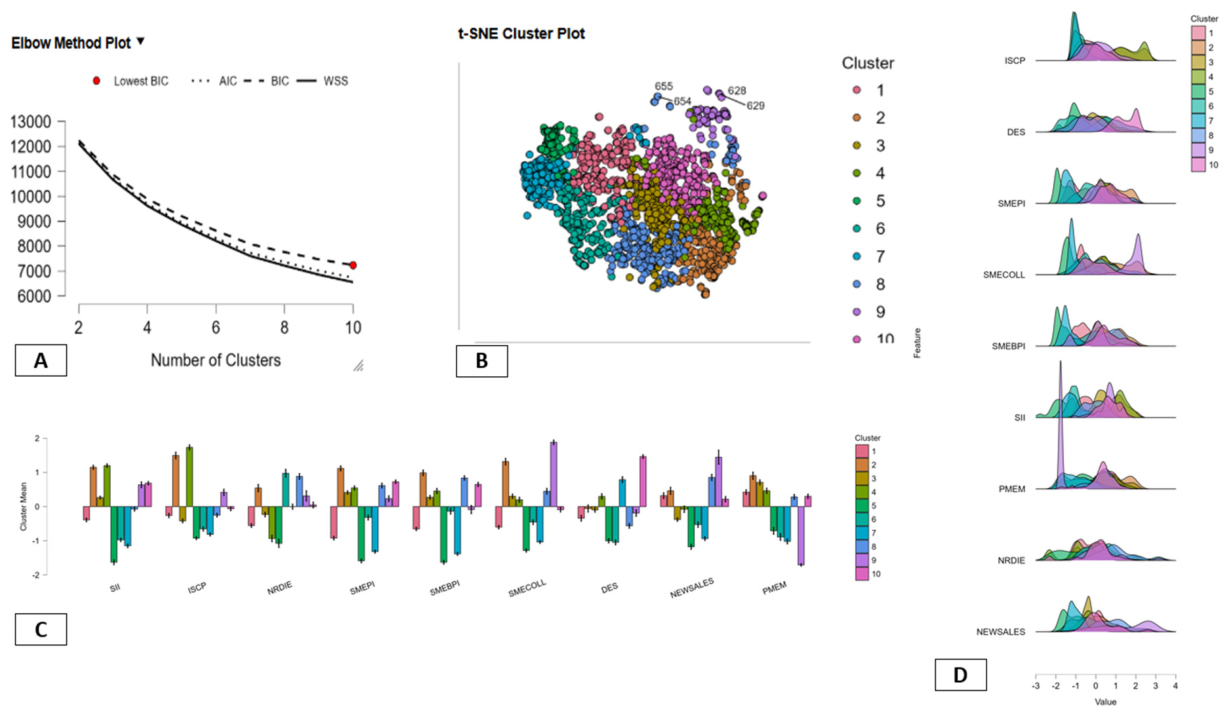
Figure 3.
K-Nearest Neighbors Regression: Data Partitioning, Predictive Performance, and Model Tuning. Note. Panel A shows the partition of the 1,968 observations into training (1,260), validation (315), and test (393) sets used for model estimation, tuning, and final evaluation. Panel B compares observed and KNN-predicted SII values in the test set; observations close to the 45-degree reference line indicate high predictive accuracy. Panel C reports training and validation Mean Squared Error across alternative numbers of nearest neighbors. The minimum validation error occurs at k = 1, identifying the most localized specification as the preferred KNN configuration under the adopted validation procedure.
Figure 3.
K-Nearest Neighbors Regression: Data Partitioning, Predictive Performance, and Model Tuning. Note. Panel A shows the partition of the 1,968 observations into training (1,260), validation (315), and test (393) sets used for model estimation, tuning, and final evaluation. Panel B compares observed and KNN-predicted SII values in the test set; observations close to the 45-degree reference line indicate high predictive accuracy. Panel C reports training and validation Mean Squared Error across alternative numbers of nearest neighbors. The minimum validation error occurs at k = 1, identifying the most localized specification as the preferred KNN configuration under the adopted validation procedure.
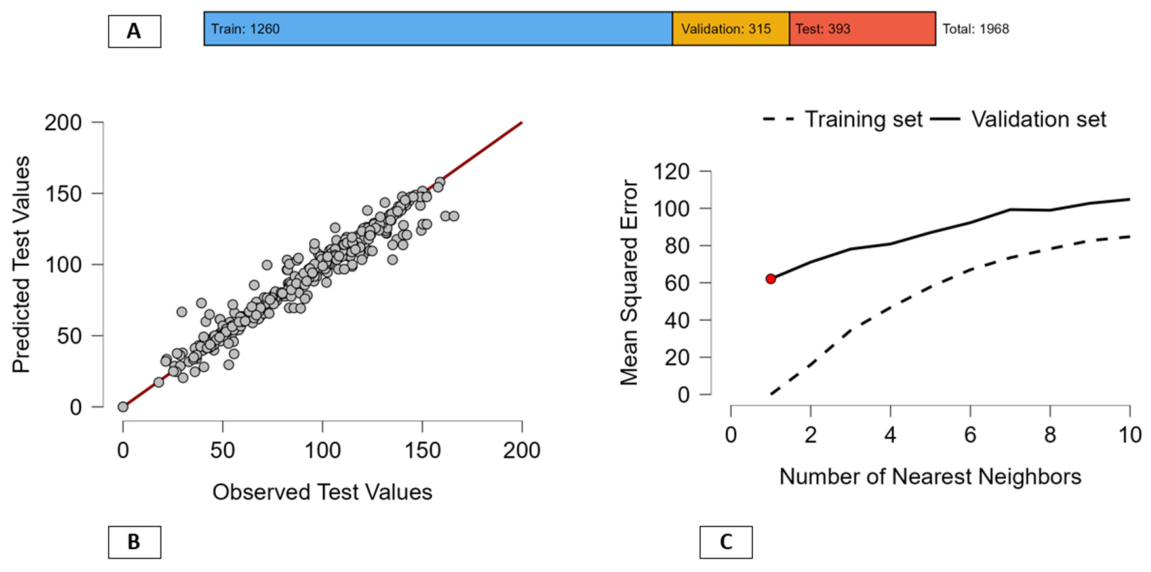
Table 1.
Synthesis of the reviewed literature by analytical dimension.
| Dimension (model variables) | Mechanism examined in the literature | Representative studies | Implication for the present analysis |
| Knowledge generation and scientific collaboration (ISCP) | External connectivity, network position and brokerage; university and public-research anchoring of collaborative networks | Ascani et al. (2020); Xie & Su (2021); Archibugi et al. (2022); Françoso & Vonortas (2023); Ferrer-Serrano et al. (2025); Zhao & Wang (2025); Pfister et al. (2021); Robbiano (2022); Xia et al. (2026) | Positive association expected, but mediated by absorptive capacity and by institutional configurations that differ across territories |
| SME innovation activity and non-R&D expenditure (NRDIE, SMEPI, SMEBPI) | Innovation modes not based on formal research; internal capability, related variety, digital and organisational upgrading | Hervás-Oliver et al. (2021); Aronica et al. (2022); Beynon et al. (2024); Filippopoulos & Fotopoulos (2022); Ejdemo & Örtqvist (2020); Yang et al. (2020); Zabudkina et al. (2026); Zhou et al. (2026a) | Supports treating non-R&D spending as a distinct driver; relationships may be non-linear, motivating flexible learning algorithms |
| Cooperation, clusters and intermediaries (SMECOLL) | Cluster policy and science–industry linkages; innovation intermediaries and business incubators | Graf & Broekel (2020); Quignon (2025); Ungureanu (2023); Duan & Jin (2022a, 2022b); Yin et al. (2022); Wang et al. (2020); Toroslu et al. (2025) | Cooperation is partly policy- induced rather than spontaneous, which qualifies its reading as a regional endowment |
| Intellectual assets and market outcomes (DES, NEWSALES) | Aesthetic and non- technological IP; circulation of intellectual assets; commercialisation and FDI-driven diffusion | Bergamini et al. (2026); Huang & Zou (2024); Nylund & Brem (2024); Cai et al. (2024); Kadlec et al. (2023); Min et al. (2020); Jiang et al. (2022); Damioli & Marin (2024); Pardy (2025) | Design captures appropriation beyond patents; commercialisation is often the weakest stage and its gains may concentrate within regions |
| Contextual and environmental conditions (PMEM and unobserved heterogeneity) | Government action and standardisation; infrastructure and accessibility; credit conditions and human capital; green transition | Hu & Liu (2022); Wang et al. (2026); Komikado et al. (2021); Tang et al. (2024); Lu & Lu (2026); Crown et al. (2020); Kruse (2025); Wang & Wang (2025); Ruan & Chen (2024) | Main source of time-invariant regional heterogeneity, supporting the fixed-effects specification; innovation and environmental quality are mutually conditioning |
Note: references are representative rather than exhaustive. Methodologically, the reviewed studies cluster into three largely separate strands—panel econometrics for explanation, forecasting and optimisation for prediction, and configurational or cluster analysis for classification—which the Explain–Predict–Classify design of this study integrates on a single dataset.
Table 2.
Variables and Innovation Dimensions Included in the Empirical Analysis.
| Acronym | Variable | Role in the model | Innovation dimension |
| SII | Summary Innovation Index | Dependent variable | Overall regional innovation performance |
| ISCP | International scientific co-publications | Explanatory | Knowledge creation and international research collaboration |
| NRDIE | Non-R&D innovation expenditures | Explanatory | Firm innovation investment |
| SMEPI | SMEs introducing product innovations | Explanatory | Product innovation |
| SMEBPI | SMEs introducing business process innovations | Explanatory | Business-process innovation |
| SMECOLL | Innovative SMEs collaborating with others | Explanatory | Innovation networks and collaboration |
| DES | Design applications | Explanatory | Intellectual assets |
| NEWSALES | Sales of new-to-market and new-to-firm innovations | Explanatory | Commercialization and innovation output |
| PMEM | Air emissions by fine particulates | Explanatory | Environmental dimension |
Note. SII represents the dependent variable, while the remaining indicators are explanatory variables capturing complementary dimensions of regional innovation, including knowledge creation, investment, SME innovation, collaboration, intellectual assets, commercialization outcomes, and environmental performance.
Table 3.
Panel Econometric Model Characteristics and Coefficient Estimates.
| Characteristic / Variable | Dynamic Panel | Fixed Effects | Random Effects |
| Panel A. Model characteristics | |||
| Estimator | One-step dynamic panel | Fixed effects (LSDV) | Random effects GLS (Nerlove transformation) |
| Observations | 1,476 | 1,968 | 1,968 |
| Cross-sectional units | 246 | 246 | 246 |
| Time-series length | — | 8 | 8 |
| Dependent variable | SII | SII | SII |
| Panel B. Coefficient estimates | |||
| SII(-1) | 0.2143*** (0.0514) [3.05e−05] |
— | — |
| ISCP | 0.0511*** (0.0079) [8.20e−11] |
0.0729*** (0.0026) [5.22e−141] |
0.0765*** (0.0025) [9.61e−199] |
| NRDIE | 0.0373*** (0.0039) [1.87e−21] |
0.0415*** (0.0021) [3.57e−76] |
0.0412*** (0.0021) [1.56e−84] |
| SMEPI | 0.0403*** (0.0028) [1.40e−47] |
0.0539*** (0.0026) [6.95e−84] |
0.0544*** (0.0026) [5.26e−97] |
| SMEBPI | 0.0364*** (0.0040) [1.18e−19] |
0.0328*** (0.0025) [3.64e−37] |
0.0325*** (0.0025) [4.21e−39] |
| SMECOLL | 0.0346*** (0.0024) [2.93e−47] |
0.0315*** (0.0020) [5.58e−50] |
0.0315*** (0.0020) [1.57e−54] |
| DES | 0.0574*** (0.0055) [6.38e−26] |
0.0698*** (0.0042) [5.83e−57] |
0.0735*** (0.0042) [5.12e−70] |
| NEWSALES | 0.0277*** (0.0021) [8.16e−39] |
0.0284*** (0.0015) [1.65e−74] |
0.0282*** (0.0015) [9.98e−83] |
| PMEM | 0.0261*** (0.0032) [5.00e−16] |
0.0404*** (0.0028) [4.20e−44] |
0.0402*** (0.0028) [9.67e−48] |
| Constant | — | 52.3041*** (0.5692) [0.0000] |
51.5482*** (1.4917) [1.16e−261] |
Note: Panel A summarizes estimator characteristics and sample structure. Panel B reports coefficient estimates, with standard errors in parentheses and p-values in brackets. Three asterisks indicate statistical significance as reported by Gretl.
Table 4.
Model Fit and Performance Statistics across Panel Econometric Specifications.
| Statistic | Dynamic panel | Fixed effects | Random effects |
| Mean dependent variable | — | 94.20184 | 94.20184 |
| SD dependent variable | — | 33.72941 | 33.72941 |
| Sum squared residuals | 7,471.191 | 8,509.790 | 801,439.3 |
| S.E. of regression | 1.590878 | 2.228199 | 20.22122 |
| LSDV R-squared | — | 0.996197 | — |
| Within R-squared | — | 0.844598 | — |
| corr(y, yhat)^2 | — | — | 0.804238 |
| Log likelihood | — | -4,233.243 | -8,705.712 |
| Akaike criterion | — | 8,974.487 | 17,429.42 |
| Schwarz/BIC | — | 10,393.02 | 17,479.69 |
| Hannan-Quinn | — | 9,495.767 | 17,447.89 |
| rho | — | 0.431446 | 0.431446 |
| Durbin-Watson | — | 0.939400 | 0.939400 |
| Between variance | — | — | 417.252 |
| Within variance | — | — | 4.32408 |
| Theta | — | — | 0.964032 |
| Number of instruments | 29 | — | — |
Note: The table compares goodness-of-fit, residual dispersion, information criteria, serial correlation measures, variance components, and instrument counts across dynamic panel, fixed-effects, and random-effects specifications. Dashes indicate statistics unavailable or inapplicable for specific estimators.
Table 5.
Diagnostic and Specification Tests for the Panel Econometric Models.
| Test | Null hypothesis / purpose | Dynamic panel | Fixed effects | Random effects | Interpretation |
| AR(1) | No first-order serial correlation | z = -4.67094; p = 0.0000 | — | — | Rejected in dynamic model |
| AR(2) | No second-order serial correlation | z = -0.650523; p = 0.5154 | — | — | Not rejected |
| Sargan | Validity of over-identifying restrictions | Chi2(20) = 102.517; p = 0.0000 | — | — | Rejected |
| Joint Wald | Joint significance of regressors | Chi2(9) = 3846.62; p = 0.0000 | — | — | Regressors jointly significant |
| Residual normality | Errors are normally distributed | Chi2(2) = 171.18; p = 6.74107e-38 | — | — | Normality rejected |
| Joint regressors test | Joint significance of regressors | — | F(8,1714) = 1164.43; p = 0 | Chi2(8) = 9851.54; p = 0 | Significant in FE and RE |
| Group intercepts | Groups have a common intercept | — | F(245,1714) = 271.954; p = 0 | — | Rejected; individual effects matter |
| Breusch-Pagan | Variance of unit-specific error = 0 | — | — | Chi2(1) = 4438.2; p = 0 | Panel component is relevant |
| Hausman | GLS estimates are consistent | — | — | Chi2(8) = 155.536; p = 1.37056e-29 | Rejected; favors FE over RE |
| Wooldridge | No first-order autocorrelation | — | F(1,245) = 140.167; p = 7.14934e-26 | F(1,245) = 140.167; p = 7.14934e-26 | Serial correlation detected |
| Pesaran CD | No cross-sectional dependence | z = NaN; p not reported | z = NaN; p not reported | z = 9.34023; p = 9.6124e-21 | Dependence detected in RE output; unavailable in other outputs |
Note: The table reports diagnostic and specification tests for dynamic, fixed-effects, and random-effects models, assessing serial correlation, instrument validity, joint significance, individual heterogeneity, estimator consistency, residual normality, and cross-sectional dependence across regional units.
Table 6.
Comparative Performance and Internal Validation Metrics of Clustering Algorithms.
| Algorithm | Clusters | N | R2 | AIC | BIC | Silhouette | Max. diameter | Min. separation | Pearson’s γ | Dunn | Entropy* | Calinski–Harabasz |
| Density-Based | 3 | 1968 | 0.0202 | 17,190 | 17,340 | 0.1500 | 10.750 | 0.3633 | 0.1596 | 0.03378 | 0.0894 | 15.19 |
| Fuzzy C-Means | 10 | 1968 | 0.6132 | 8,245 | 8,747 | 0.0900 | 7.817 | 0.1407 | 0.3852 | 0.01800 | 2.0390 | 260.00 |
| Hierarchical | 10 | 1968 | 0.4107 | 10,610 | 11,110 | 0.1400 | 8.149 | 0.8438 | 0.5266 | 0.10360 | 1.1080 | 151.60 |
| Model-Based | 10 | 1968 | 0.5167 | 8,695 | 9,197 | 0.0800 | 9.443 | 0.1427 | 0.3101 | 0.01511 | 2.1330 | 234.80 |
| K-Means | 10 | 1968 | 0.6301 | 6,728 | 7,231 | 0.1800 | 6.332 | 0.1555 | 0.3918 | 0.02456 | 2.2740 | 370.60 |
| Random Forest | 10 | 1968 | 0.5208 | 8,663 | 9,166 | 0.0800 | 8.233 | 0.4343 | 0.3213 | 0.05276 | 1.9530 | 236.40 |
Note: Higher is generally preferred for R2, Silhouette, minimum separation, Pearson’s γ, Dunn and Calinski–Harabasz; lower is preferred for maximum diameter. AIC/BIC are reported exactly as supplied and are most defensible for comparisons when the underlying objective/likelihood is comparable. Entropy has algorithm-specific meaning and should not be treated as a universal stand-alone ranking criterion.
Table 7.
Comparison of Cluster Structure, Variance Decomposition, and Partition Balance across Clustering Algorithms.
Table 7.
Comparison of Cluster Structure, Variance Decomposition, and Partition Balance across Clustering Algorithms.
| Algorithm | Between SS | Total SS | Within SS (TSS−BSS) | BSS/TSS | Cluster sizes / noise | Structural comment |
| Density-Based | 353.39 | 17,492.00 | 17,138.61 | 0.020 | Noise: 12; C1: 1,940; C2: 11; C3: 5 | Strongly imbalanced solution; most observations fall in one cluster. |
| Fuzzy C-Means | 12,785.42 | 20,850.25 | 8,064.83 | 0.613 | 157, 150, 230, 171, 74, 670, 127, 51, 126, 212 | BIC-optimized; reported optimum is the maximum tested number of clusters (10). |
| Hierarchical | 7,270.77 | 17,703.00 | 10,432.23 | 0.411 | 1,098, 53, 657, 47, 11, 5, 75, 11, 8, 3 | Best separation-based metrics; BIC optimum reaches the maximum tested cluster count. |
| Model-Based | 9,103.40 | 17,618.08 | 8,514.68 | 0.517 | 336, 337, 211, 209, 77, 391, 56, 138, 119, 94 | Ellipsoidal equal-shape mixture model; BIC optimum reaches 10 clusters. |
| K-Means | 11,154.66 | 17,703.00 | 6,548.34 | 0.630 | 227, 168, 233, 205, 143, 191, 196, 232, 106, 267 | Best overall fit/compactness metrics; BIC optimum reaches the maximum tested count (10). |
| Random Forest | 9,219.62 | 17,703.00 | 8,483.38 | 0.521 | 176, 753, 192, 179, 110, 230, 37, 140, 71, 80 | Adds feature-importance output; BIC optimum reaches the maximum tested count (10). |
Note. The table compares clustering solutions through between- and within-cluster variation, explained variance ratios, cluster-size distributions, and structural characteristics. Higher BSS/TSS indicates stronger separation, while lower Within SS indicates greater within-cluster compactness overall.
Table 9.
Comparative Predictive Performance of Machine-Learning Regression Algorithms.
| Algorithm | Validation MSE | Test MSE | Scaled MSE | RMSE | MAE / MAD | MAPE | R2 | Overall assessment |
| K-Nearest Neighbors (KNN) | 104.8 | 62.41 | 0.05232 | 7.900 | 4.793 | NaN | 0.9482 | 1st—Best |
| Random Forest | 68.55 | 88.08 | 0.07225 | 9.385 | 7.155 | ∞ | 0.9289 | 2nd—Very strong |
| Boosting Regression | 131.4 | 136.5 | 0.1159 | 11.68 | 9.205 | ∞ | 0.8872 | 3rd—Strong |
| Linear Regression | — | 157.1 | 0.1333 | 12.53 | 9.992 | ∞ | 0.8708* | 4th—Good / interpretable |
| Decision Tree | 155.4 | 162.5 | 0.1510 | 12.75 | 9.303 | ∞ | 0.8544 | 5th—Moderate |
| Regularized Linear Regression (Lasso) | 159.5 | 174.2 | 0.1651 | 13.20 | 10.76 | ∞ | 0.8413 | 6th—Weaker |
| Support Vector Machine Regression | 157.7 | 199.0 | 0.1882 | 14.11 | 11.40 | ∞ | 0.8202 | 7th—Weakest |
Note. The table compares validation and test performance across seven regression algorithms. Lower MSE, RMSE, and MAE indicate better predictive accuracy, whereas higher R2 indicates stronger performance. MAPE is unsuitable because of undefined values.
Table 10.
Global Feature Importance and Local KNN Prediction Contributions.
| Feature | Mean Dropout Loss (RMSE) | Rank | Case 1 | Case 2 | Case 3 | Case 4 | Case 5 |
| ISCP | 19.67 | 1 | 9.429 | -1.898 | -2.067 | 27.41 | 5.622 |
| DES | 15.38 | 2 | 12.25 | 9.201 | 9.297 | -2.049 | 3.215 |
| SMECOLL | 15.06 | 3 | 9.225 | 3.695 | 3.655 | 13.18 | 15.81 |
| PMEM | 13.61 | 4 | -3.357 | 7.394 | 8.35 | 2.214 | -3.596 |
| SMEPI | 13.56 | 5 | 4.384 | 8.717 | 8.417 | 4.673 | 4.568 |
| SMEBPI | 11.54 | 6 | -2.448 | -0.597 | 0.042 | 3.744 | 0.857 |
| NRDIE | 11.39 | 7 | -1.651 | -7.063 | 8.403 | 2.628 | 2.393 |
| NEWSALES | 10.73 | 8 | 2.758 | -7.88 | -6.358 | 3.074 | 1.286 |
| Base prediction | — | — | 94.69 | 94.69 | 94.69 | 94.69 | 94.69 |
| KNN predicted value | — | — | 125.3 | 106.3 | 124.4 | 149.6 | 124.9 |
Note. The table combines global permutation importance, measured through mean RMSE dropout loss, with local feature contributions across five representative cases. Positive contributions increase predicted SII, whereas negative contributions reduce predictions relative to baseline values.
Table 11.
Integrated Summary of Econometric, Clustering, and Machine-Learning Results.
| Analytical component | Main method selected | Key quantitative results | Main empirical finding | Interpretation |
| Econometric analysis | Fixed Effects (FE) | Within R2 = 0.8446; Hausman χ2(8) = 155.536, p < 0.001 | FE preferred to RE; all selected variables are positively and significantly associated with SII | Regional innovation depends on multiple dimensions and substantial unobserved regional heterogeneity exists |
| Dynamic analysis | Dynamic Panel | SII(-1) = 0.2143, p < 0.001; AR(2) p = 0.5154; Sargan p < 0.001 | Previous innovation performance is positively associated with current SII | Regional innovation exhibits temporal persistence, although instrument validity requires caution |
| Clustering comparison | K-Means | R2 = 0.6301; Silhouette = 0.180; CH = 370.60; BSS/TSS = 0.630 | K-Means provides the strongest overall clustering performance | Regional innovation can be represented through heterogeneous latent profiles |
| K-Means structure | 10-cluster solution | Cluster sizes = 106–267; WSS = 6,548.34 | Clusters are comparatively balanced but partially overlapping | Regional heterogeneity is configurational rather than a simple high/low innovation divide |
| Predictive analysis | K-Nearest Neighbors (KNN) | Test MSE = 62.41; RMSE = 7.90; MAE = 4.793; R2 = 0.9482 | KNN achieves the highest predictive accuracy | Local nonlinear relationships substantially improve SII prediction |
| Alternative ML benchmark | Random Forest | Test MSE = 88.08; RMSE = 9.385; R2 = 0.9289 | Second-best predictive algorithm | Confirms the relevance of flexible nonlinear predictive structures |
| Linear benchmark | Linear Regression | Test MSE = 157.1; RMSE = 12.53; R2 = 0.8708 | Good performance, but substantially below KNN | Linear relationships remain important but do not capture the full predictive structure |
| Global KNN importance | Permutation importance | ISCP = 19.67; DES = 15.38; SMECOLL = 15.06 | ISCP is the strongest global predictor, followed by DES and SMECOLL | Knowledge connectivity, intellectual assets, and collaboration are central predictive dimensions |
| Local KNN explanations | Additive explanations | Contributions vary substantially across Cases 1–5 | The same variables do not contribute equally to every prediction | Innovation performance depends on context-specific combinations of regional characteristics |
| Cross-method evidence | Explain–Classify–Predict | ISCP, DES and SMECOLL emerge prominently across multiple analytical layers | Econometric, clustering and ML evidence is complementary | Regional innovation combines common systematic relationships with heterogeneous territorial pathways |
Note. The table synthesizes the main findings across explanatory, structural, and predictive analyses, highlighting selected methods, key performance metrics, empirical outcomes, and interpretations. Together, the results demonstrate complementary evidence on heterogeneous regional innovation dynamics.
Disclaimer/Publisher’s Note: The statements, opinions and data contained in all publications are solely those of the individual author(s) and contributor(s) and not of MDPI and/or the editor(s). MDPI and/or the editor(s) disclaim responsibility for any injury to people or property resulting from any ideas, methods, instructions or products referred to in the content. |
© 2026 by the authors. Licensee MDPI, Basel, Switzerland. This article is an open access article distributed under the terms and conditions of the Creative Commons Attribution (CC BY) license (http://creativecommons.org/licenses/by/4.0/).
Copyright: This open access article is published under a Creative Commons CC BY 4.0 license, which permit the free download, distribution, and reuse, provided that the author and preprint are cited in any reuse.