

Submitted:
12 August 2026
Posted:
12 August 2026
You are already at the latest version
Abstract
Continuous glucose monitoring (CGM) has improved diabetes care, yet cost, wear burden, and reduced accuracy in the hypoglycemic range still motivate complementary, low-burden sensing. Consumer wearables that record electrocardiography (ECG), photoplethysmography (PPG), electrodermal activity (EDA), and related signals are widely available, and a growing literature maps them to glucose values, glycemic curves, or hypo-/hyperglycemia risk. Progress remains uneven: free-living signals are unstable, physiology-to-glucose mappings are indirect and non-deterministic, public multimodal datasets are small, evaluation protocols are heterogeneous, and cross-subject generalization is limited. Based on representative works in this field, this preprint contributes: (1) a three-task taxonomy (risk, value, curve) and how each aligns with wearable modalities; (2) a six-lineage evidence map with a qualitative exposure table of typical protocols and reporting gaps, treating CGM-only forecasting as a Task-A contrast baseline; (3) a synthesis of quality, uncertainty, and interpretability gaps plus a literature-derived minimal reporting checklist; and (4) an open-problem agenda. These deliverables clarify applicability and trust boundaries for wearable physiology as a glycemic decision aid under declared conditions, rather than as an undeclared CGM replacement.
Keywords:
wearable sensing
; continuous glucose monitoring
; hypoglycemia
; electrocardiography
; photoplethysmography
; multimodal fusion
; reproducibility
; signal quality
; uncertainty
; abstention
; trustworthiness
; reporting checklist
1. Introduction
A central goal of diabetes management is to track glycemic state on appropriate time scales so that hypoglycemia and clinically significant hyperglycemia can be recognized in time. CGM has made continuous observation feasible, yet semi-invasive sensors, consumable cost, adherence burden, and relatively larger errors in the hypoglycemic range remain practical constraints. In parallel, chest straps, smartwatches, and related wearables can record ECG, PPG, EDA, acceleration, and other physiological or behavioral signals at comparatively low burden. Pathophysiological studies suggest that glycemic excursions may be accompanied by changes in autonomic regulation, heart-rate variability (HRV), QT-related markers, and peripheral perfusion, which provides a mechanistic rationale for inferring glucose-related states from wearable physiology.
Over the past decade, the literature has expanded along multiple parallel threads: ECG-based hypoglycemia detection and glucose estimation; PPG- or smartphone-based noninvasive estimation; risk recognition from aggregated consumer-watch features; ECG–PPG/EDA multimodal fusion; and several public or semi-public datasets. In parallel, short-horizon glucose forecasting that relies only on CGM time series has developed a relatively mature ecosystem of benchmarks and challenges. The coexistence of these threads often blurs terminology: “glucose monitoring,” “noninvasive glucose measurement,” “hypoglycemia alerting,” and “curve forecasting” are frequently discussed as if they were a single problem, even though they imply different task definitions, evidence standards, and failure modes.
The core tension addressed here can be summarized as follows: devices are widespread and comparatively inexpensive, yet signals are unstable, physiology-to-glucose mappings are non-deterministic, data are fragmented, and evaluation is inconsistent. Under these conditions, the useful question is not whether any score can be fitted from all available channels, but which modalities, periods, and quality regimes still contain auditable glycemic information; whether systems should abstain when evidence is insufficient; and how far published results support cross-subject or cross-device extrapolation. Our contributions are:
- a task taxonomy for wearable physiology that separates hypo-/hyperglycemia risk, glucose value estimation, and glycemic curve extrapolation, and clarifies how each task typically aligns with wearable modalities (risk assistance primary, value estimation secondary, curve forecasting as a contrast boundary);
- a synthesis of representative advances organized by six research lineages, with CGM-only forecasting positioned as a Task-A contrast baseline rather than conflated with wearable physiology, and a qualitative evidence-exposure table (lineage × task × protocol × public waveforms × quality/abstention × negative controls);
- a discussion of recurring phenomena and four literature gaps related to signal quality, artifacts, and uncertainty: incomparable evaluation, quality not turned into decisions, sparse reporting of cross-domain failures, and explanations without negative controls, plus a literature-derived minimal reporting checklist for future empirical papers (Section 5.8);
- a list of open problems that subsequent empirical work can test along the decision chain in Section 6.
Under a unified problem frame, these contributions clarify the applicability boundary and trust boundary of wearable physiology for glucose-related prediction: assistive risk assessment is conditionally supported by published evidence, whereas replacement-grade value sensing and zero-shot cross-domain transfer remain upper-bound claims in the literature rather than settled practice.
To keep synthesis distinct from the empirical agenda in Section 6, we organize the review around three literature-level questions that published evidence can already partially answer:
- RQ1 (task narrative). On published evidence, is the most defensible primary narrative for wearable physiology assistive risk assessment, value estimation, or a stable incremental gain for curve forecasting?
- RQ2 (transferability). Is cross-subject / cross-device / cross-dataset reproducible evidence already strong enough to support deployment-facing narratives?
- RQ3 (quality as decision). Have signal quality and uncertainty been written into auditable decision rules (including abstention and coverage) rather than left as descriptive caveats?
Section 7 returns short answers to RQ1–RQ3; Section 6 lists open problems that still require new empirical protocols. Claims of “first ECG/PPG hypoglycemia detection” or “first multimodal fusion/personalization” are out of scope: those directions already have substantial prior art. This preprint organizes evidence boundaries and problem structure. Reading contract: this preprint delivers a taxonomy, an evidence map (including an exposure table), gap synthesis, a reporting checklist, and an open-problem agenda for subsequent empirical validation. The remainder of the paper is organized as follows. Section 2 defines scope, taxonomy, and the six-lineage guide. Section 3 states field failures, then reviews representative advances and the evidence-exposure table. Section 4 discusses data and reproducibility, including CGM-only contrast benchmarks. Section 5 addresses quality and uncertainty and closes with a minimal reporting checklist. Section 6 lists open problems along a decision chain. Section 7 concludes.
2. Scope and Task Taxonomy
2.1. Scope
Inclusion. Studies that take wearable or near-wearable ECG, PPG, EDA, skin temperature, acceleration, or aggregated consumer watch/band features as input, and that use finger-stick glucose, CGM, or clinical hypo-/hyperglycemic events as supervision or evaluation targets; related systematic reviews and public dataset descriptors; and, for contrast, classic CGM curve-forecasting datasets and benchmarks.
Exclusion or contrast-only mention. Optical spectroscopy / bench methods (e.g., Raman, near-infrared) whose main body is not everyday wearable physiological waveforms (ECG/PPG/EDA/ACC, etc.). Representative progress on that molecular-optical lineage includes in vivo Raman fingerprint observation [43], compact band-pass Raman point-of-care CGM exploration [44], vein-visualization-guided confocal Raman with heterogeneous ensemble learning [45], and multiple micro-spatially offset Raman (mμSORS) clinical noninvasive monitoring [46]; near-infrared work is likewise long surveyed with feasibility and limitation analyses [47,48]. These routes differ from the wearable-physiology indirect-mapping focus of this preprint and are not reviewed in depth below, cited here only to demarcate scope. We also exclude insulin-pump / automated insulin delivery (AID) control algorithms per se, and screening tables built primarily from synthetic or flattened feature corpora without retained waveform protocols (not used as primary evidence).
2.2. Task Taxonomy
We recommend partitioning “wearable × glucose” into three tasks and evaluating each on its own terms.
| Task | Meaning | Typical output | Common relation to wearables |
| C. Risk | Hypo-/hyperglycemia detection or alerting (optional lead time) | Class label or risk probability; optional lead time | Closest to ECG/watch literature; clinical narrative usually assistive alerting |
| B. Value | Continuous glucose estimation | mg/dL (or mmol/L) | Common in PPG/ECG regression; often reviewed as “replacement sensing” |
| A. Curve | Glycemic trajectory extrapolation | Forecasts at horizons such as 30/60 min | Dominated by CGM history; band aggregates often provide weak augmentation |
The tasks are not mutually exclusive, but they should not share a single success criterion. Risk studies should emphasize sensitivity, specificity, lead time, false-alarm cost, and metric bundles sensitive to rare events; value studies commonly report RMSE and Clarke/Parkes error grids; curve studies typically use horizon-specific error metrics. Translating a high risk-detection accuracy into a claim of “accurate noninvasive glucose measurement” misaligns evidence with assertion. Hypoglycemia is the primary narrative here; hyperglycemia often appears as a parallel validation line, and its modality pattern need not mirror hypoglycemia.
2.3. Modality Taxonomy
| Modality tier | Content | Representative threads |
| Raw / near-raw waveforms | High-rate ECG, PPG/BVP, EDA, etc. | D1NAMO [4], PhysioCGM [2], ECG–hypoglycemia methods [1] |
| Device-aggregated features | Heart rate, HRV summaries, GSR, steps, etc. | OhioT1DM band layer [13]; watch studies [6,12] |
| Behavior / context | Acceleration, sleep, activity logs | Activity context for interpreting ECG/HR changes; also entangled with motion artifacts [8,16] |
| Contrast: CGM only | Glucose time series (± meal/insulin events) | OhioT1DM [13], GlucoBench [14] |
2.4. Six Research Lineages (Reader’s Guide)
The three-task taxonomy (C/B/A) is orthogonal to the six method lineages below: the former constrains what is evaluated; the latter organizes where evidence comes from.
| Lineage | Example references | What the literature already shows | What remains largely unresolved |
| ① ECG hypoglycemia and personalization | [1,3,10,11,16,17,20,23,26,32,33,34,40] | Nocturnal / within-subject detection is feasible; HRV and QT provide mechanistic clues; personalization is often necessary | Free-living full-day performance, cross-subject generalization, shared rare-event metrics; whether hypo/hyper share the same information structure |
| ② PPG / smartphone glucose estimation | [8,18,19,27,29,30,35,36] | Learnable associations exist under constrained, calibrated, or population-specific settings; on-device implementations are feasible | Motion, skin tone, perfusion, contact pressure, frequent calibration, cross-device transfer |
| ③ Watch / band risk recognition | [5,6,12,15,25,31] | Low-burden risk recognition is feasible; wake/sleep feature contributions differ | Coarse features, vendor dependence, personalization, inconsistent metrics |
| ④ Multimodal fusion (incl. EDA/ACC) | [2,5,16,18,36,38] | Fusion can outperform a single modality under some protocols | Whether gains stably beat the strongest modality; whether gains arise from quality, activity shortcuts, or leakage |
| ⑤ Public data and reproducibility benchmarks | [2,4,13,14,38,42] | Waveform-level public research is now possible | Cohorts often remain ~O(10) subjects; large population/device/label heterogeneity; missing shared conventions |
| ⑥ Systematic / scoping reviews | [7,8,9,21,22,27,28,37] | Standardization, quality, uncertainty, reproducibility, and translation gaps are clearly articulated | Few studies convert these gaps into one comparable empirical protocol |
3. Representative Advances
Field failures that motivate the exposure table. Before the lineage review, four recurring failures of the published literature should be stated plainly: (i) many high-metric studies remain private or incompletely released, blocking external checks; (ii) risk alerting, value estimation, and curve forecasting are frequently conflated under one success narrative; (iii) segment-level accuracy is treated as sufficient even when continuous monitoring would produce false-alarm floods [49]; and (iv) explanations, when present, rarely include negative controls or abstention reasons. Table 1 makes these failures visible by lineage rather than only in prose.
- Table 1. Qualitative evidence-exposure summary across six research lineages in wearable physiology × glycemic assessment. Columns answer, for each lineage: primary task (C risk / B value / A curve), typical evaluation protocol, whether public raw waveforms are available, whether quality strata or abstention are routinely reported, and whether negative controls are used. Symbols: ● frequent in the curated representative works; ◐ occasional or partial; ○ rare or absent; , not applicable. “Negative controls” means acceleration-only baselines, ablation against the strongest single modality, or explicit activity-shortcut checks. Abbreviations: ECG = electrocardiography; PPG = photoplethysmography; EDA = electrodermal activity; ACC = acceleration; LOSO = leave-one-subject-out; L1 = raw/near-raw wearable physiology plus continuous glucose monitoring (CGM); Task-A = curve forecasting. Basis: qualitative synthesis of the same curated corpus as Figure 1 and Figure 2; not a PRISMA count and not a performance leaderboard. Inference boundary: light/empty cells highlight reporting and comparability gaps, a high within-subject offline score in one lineage cannot be read as deployment readiness in another.
Figure 1.
Field organization of wearable physiology for glycemic assessment (schematic synthesis of the curated literature, not a quantitative meta-analysis). Left: lineage ⑥ systematic/scoping reviews and lineage ⑤ public data / reproducibility. Center: method lineages ① electrocardiography (ECG) hypoglycemia and personalization; ② photoplethysmography (PPG) / smartphone value estimation; ③ consumer watch/band risk recognition; ④ multimodal fusion including electrodermal activity (EDA) and acceleration (ACC). Right: three evaluation tasks: C risk (assistive alerting), B value (continuous glucose estimation), A curve (trajectory forecasting), with continuous glucose monitoring (CGM)–only forecasting shown as a Task-A contrast boundary rather than the default wearable race track. Bracketed numbers are example reference IDs used in this preprint. Inference boundary: the map states how the field is organized; algorithm ranking and experimental performance lie outside its scope.
Figure 1.
Field organization of wearable physiology for glycemic assessment (schematic synthesis of the curated literature, not a quantitative meta-analysis). Left: lineage ⑥ systematic/scoping reviews and lineage ⑤ public data / reproducibility. Center: method lineages ① electrocardiography (ECG) hypoglycemia and personalization; ② photoplethysmography (PPG) / smartphone value estimation; ③ consumer watch/band risk recognition; ④ multimodal fusion including electrodermal activity (EDA) and acceleration (ACC). Right: three evaluation tasks: C risk (assistive alerting), B value (continuous glucose estimation), A curve (trajectory forecasting), with continuous glucose monitoring (CGM)–only forecasting shown as a Task-A contrast boundary rather than the default wearable race track. Bracketed numbers are example reference IDs used in this preprint. Inference boundary: the map states how the field is organized; algorithm ranking and experimental performance lie outside its scope.
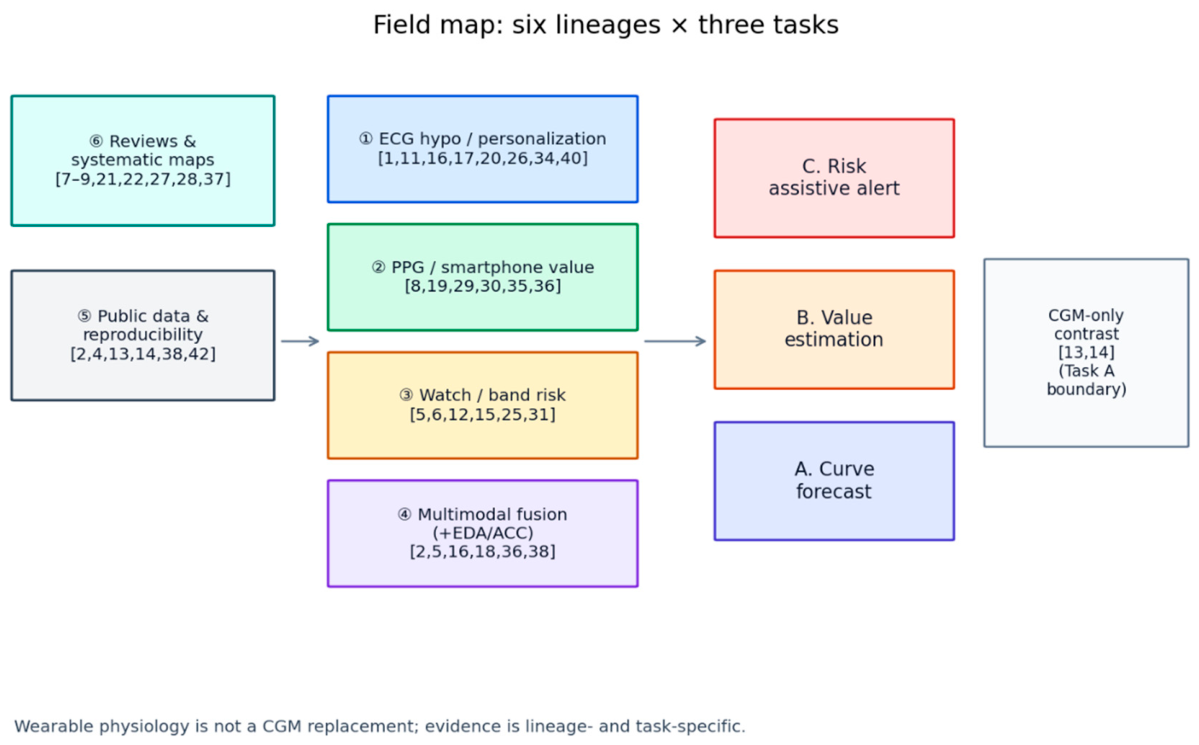
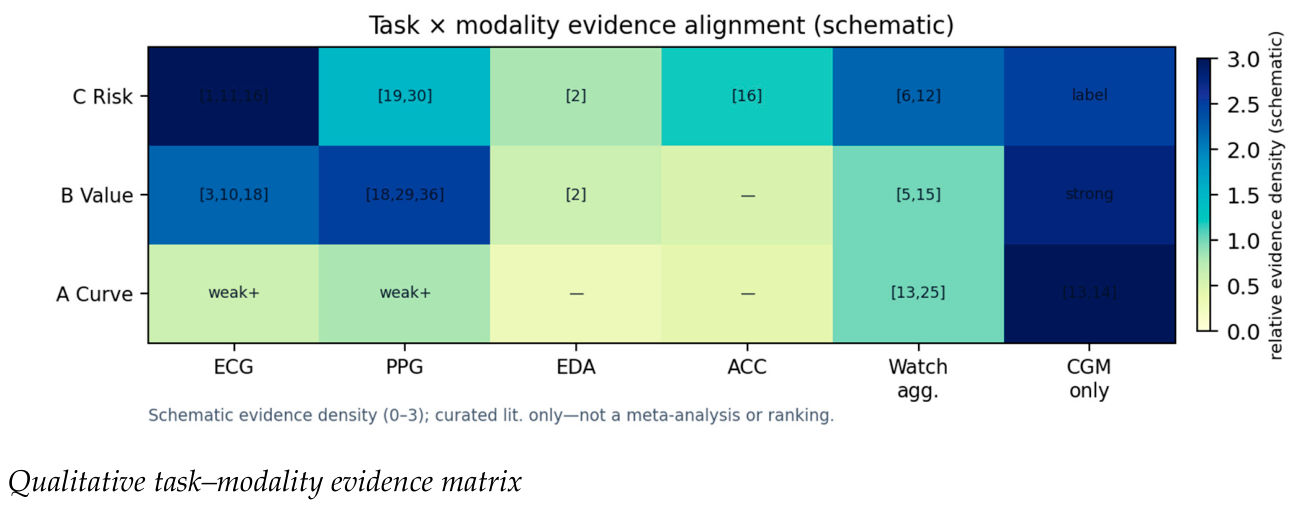
Figure 2.
Qualitative task × modality evidence alignment for wearable glycemic assessment. Rows: Task C (hypo-/hyperglycemia risk), Task B (glucose value estimation), Task A (glycemic curve forecasting). Columns: electrocardiography (ECG), photoplethysmography (PPG), electrodermal activity (EDA), acceleration (ACC), watch aggregated features, and continuous glucose monitoring (CGM) only. Cell color encodes relative published-evidence density on a schematic 0–3 scale (colorbar); cell text lists exemplar reference IDs from this preprint (or “weak+” / “,” when evidence is sparse). Basis: curated reading of representative works; no study-level pooling, no confidence intervals, and no algorithm ranking. Inference boundary: darker cells indicate denser published discussion under common protocols, not proven clinical superiority or deployable accuracy.
Figure 2.
Qualitative task × modality evidence alignment for wearable glycemic assessment. Rows: Task C (hypo-/hyperglycemia risk), Task B (glucose value estimation), Task A (glycemic curve forecasting). Columns: electrocardiography (ECG), photoplethysmography (PPG), electrodermal activity (EDA), acceleration (ACC), watch aggregated features, and continuous glucose monitoring (CGM) only. Cell color encodes relative published-evidence density on a schematic 0–3 scale (colorbar); cell text lists exemplar reference IDs from this preprint (or “weak+” / “,” when evidence is sparse). Basis: curated reading of representative works; no study-level pooling, no confidence intervals, and no algorithm ranking. Inference boundary: darker cells indicate denser published discussion under common protocols, not proven clinical superiority or deployable accuracy.
| Lineage | Primary task | Typical protocol | Public waveforms | Quality strata / abstention reported | Negative controls |
| ① ECG hypo. & personalization | C (B secondary) | Mostly within-subject / personalized; LOSO uncommon as primary | ◐ | ○ | ○ |
| ② PPG / smartphone estimation | B (C scattered) | Constrained, calibrated, or population-specific; often within-subject | ○–◐ | ○ | ○ |
| ③ Watch / band risk | C (screening parallel) | Personalized / within-subject; vendor features | ○ (aggregates, not raw) | ○ | ◐ |
| ④ Multimodal (+ EDA/ACC) | C / B | Mixed; some public multimodal cohorts | ● | ○ | ◐ |
| ⑤ Public data & reproducibility | Infrastructure / Task-A contrast | Resource release; CGM-only benchmarks more standardized | ● (wearable L1 still small) | ○ (wearable side) | , |
| ⑥ Systematic / scoping reviews | Synthesis | Narrative / scoping; few shared empirical protocols | , | Articulate gaps; seldom operationalized | Call for, rarely enforced |
3.1. Reviews and Evidence Maps (Lineage ⑥)
Systematic and scoping reviews have already mapped technical routes and translation gaps with useful clarity. On hypoglycemia detection and prediction, Diouri et al. [7] cover CGM algorithms, physiological-signal pathways, and deep-learning directions, while stressing that everyday usability remains a bottleneck. On PPG-based glucose sensing, Jiang et al. [8] discuss wavelength and form factor, motion artifacts, population differences, and missing data standards. Broader reviews of noninvasive glucose technologies and products [9], joint PPG/ECG analysis [21], wearable sensing with machine learning [22], and AI-based noninvasive monitoring [27,28] similarly conclude that feasibility reports are increasing, yet standardized validation and clinical deployment evidence remain insufficient. A recent ECG-focused review [37] further outlines the cardiac-signal lineage.
Synthesizing these review-level critiques yields four gaps that recur throughout this preprint:
- Incomparable evaluation: mixed task definitions, splits, and metrics make high numbers hard to compare [28];
- Sparse reporting of cross-domain failures: strong within-subject metrics are common; cross-subject / cross-device / cross-dataset evidence is thin;
- Explanations without negative controls: segment visualization or feature attribution exist, yet activity shortcuts and “why alert / abstain now” are not routine.
Overall, the field has moved from sporadic feasibility demonstrations to a stage in which roadmaps are relatively clear while standardization and translation lag.
3.2. ECG: Hypoglycemia Detection, Hyperglycemia Parallels, and Value Estimation (Lineage ①)
Among wearable physiological modalities, evidence linking ECG (including HRV, QT-related features, and raw ECG waveforms) to hypoglycemia is comparatively concentrated. Early engineering work explored hypoglycemia detection from ECG and wearable sensors [26,39,40,41]. Later studies combined HRV with CGM for hypoglycemia prediction and validation [20,34], clarifying detection versus lead-time prediction. Deep-learning approaches used wearable raw ECG for nocturnal hypoglycemia detection and showed that personalization is often necessary: cohort-level training often fails to overcome large inter-individual differences [1]. Beat-ensemble hypoglycemia prediction from ambulatory ECG–CGM recordings (CNN morphology + multi-beat aggregation; within-subject day-split evaluation) [11] and intermittent-ECG glucose regression [3] further show that, under within-subject or strongly personalized protocols, ECG can support both risk and value tasks, but the two protocols should not be compared as if they shared one evidence standard.
Hyperglycemia and dysglycemia screening form a parallel line: ECG with accelerometry for hypo- and hyperglycemia [16], multi-threshold personalized fusion [17], and ambulatory ECG screening / hyperglycemia identification [24,32,33] indicate that hyperglycemia-related tasks can also yield learnable signals, yet their best modality and period dependence need not mirror hypoglycemia. ECG-feature-based glucose estimation continues as well [10,23]. In summary, the ECG line supports three consensus impressions: mechanistic and engineering pathways are relatively aligned; personalization is frequently necessary; and night-time or higher-quality windows usually outperform full-day free-living averages. Rare-event evaluation (e.g., sensitivity at fixed specificity, or ranking metrics sensitive to prevalence) remains inconsistent across method papers.
3.3. PPG and Smartphones: Condition-Dependent Estimation (Lineage ②)
PPG and smartphone pipelines grow quickly because devices are accessible and form factors fit daily life. From early smartphone noninvasive explorations [35], through smartphone PPG with machine learning [19], to on-device deep learning and TinyML [29], and further to periodic calibration [30] and multi-view temporal modeling [36], studies repeatedly show that learnable associations can be observed under various settings. At the same time, motion artifacts, skin-tone and tissue optical differences, perfusion and contact pressure, and frequent calibration needs are recurrent themes in reviews and methods papers [8,27]. Spatiotemporal ECG–PPG fusion [18] is often narrated within PPG estimation, but belongs structurally to multimodal fusion (Section 3.5).
A useful distinction is that most PPG papers target value estimation (Task B), whereas risk-task evidence is more scattered. Representative PPG progress is better read as surfacing condition dependence than as establishing CGM replacement. Without declared calibration, population, and wear conditions, a single RMSE/MARD is hard to interpret.
3.4. Consumer Smartwatches and Fitness Bands (Lineage ③)
Consumer watches and bands mostly expose aggregated features such as heart rate, activity, and sleep. Hardware barriers are low and ecosystems are comparatively open. Proof-of-concept work has discussed digital biomarkers related to glycemic variability and HbA1c [5,15]. Personalized machine-learning studies in type 1 diabetes report differing feature importance in wake versus sleep and explore explainability tools such as SHAP [6]. Watch-based nocturnal hypoglycemia detection [12], clinically oriented wearable hypoglycemia identification [31], and early band-sensor machine-learning experiments in the Ohio ecosystem [25] jointly indicate that aggregated-feature routes are closer to real wear, yet information is coarse, vendor sensors iterate quickly, and feature definitions are often incomparable across studies. Screening/HbA1c threads [5,15] and hypoglycemia-alerting threads [6,12,31] should not share one success criterion; they complement, rather than replace, waveform-level research.
3.5. Multimodal Fusion, EDA, and Acceleration (Lineage ④)
Work that jointly uses chest-strap ECG and wrist PPG/EDA increased after public multimodal resources appeared. The PhysioCGM data descriptor reports multimodal hypoglycemia-detection illustrations and modality-strength differences (e.g., ECG relatively stronger and some EDA settings near chance) [2]. Wrist multimodal sensing with CGM also appears in the BIG IDEAs line [5,38]. On the methods side, spatiotemporal ECG–PPG fusion [18] and multi-view PPG cross-fusion [36] show that fusion can help under particular protocols. Whether cross-modal fusion stably outperforms the strongest single modality remains insufficiently evidenced, and systematic comparisons under signal-quality strata are largely missing.
EDA as a third channel historically and in modern multimodal settings is vulnerable to emotion, sweating, and temperature; it can appear weak when used alone for hypoglycemia [2]. Acceleration (ACC) can supply activity context that helps interpret ECG changes (for example, heart-rate rises without corresponding activity as a hyperglycemia clue) [16], yet the same channel can also inject glucose-irrelevant motion structure under free-living wear [8,16]. Fusion narratives therefore need to answer three questions together: Does fusion beat the strongest single modality? Do gains arise from quality improvement, activity shortcuts, or leakage? Under which quality/period regimes is fusion unhelpful or harmful?
4. Data Resources and Reproducibility (Lineage ⑤, with Task-A Contrast)
4.1. Public and Semi-Public Resources
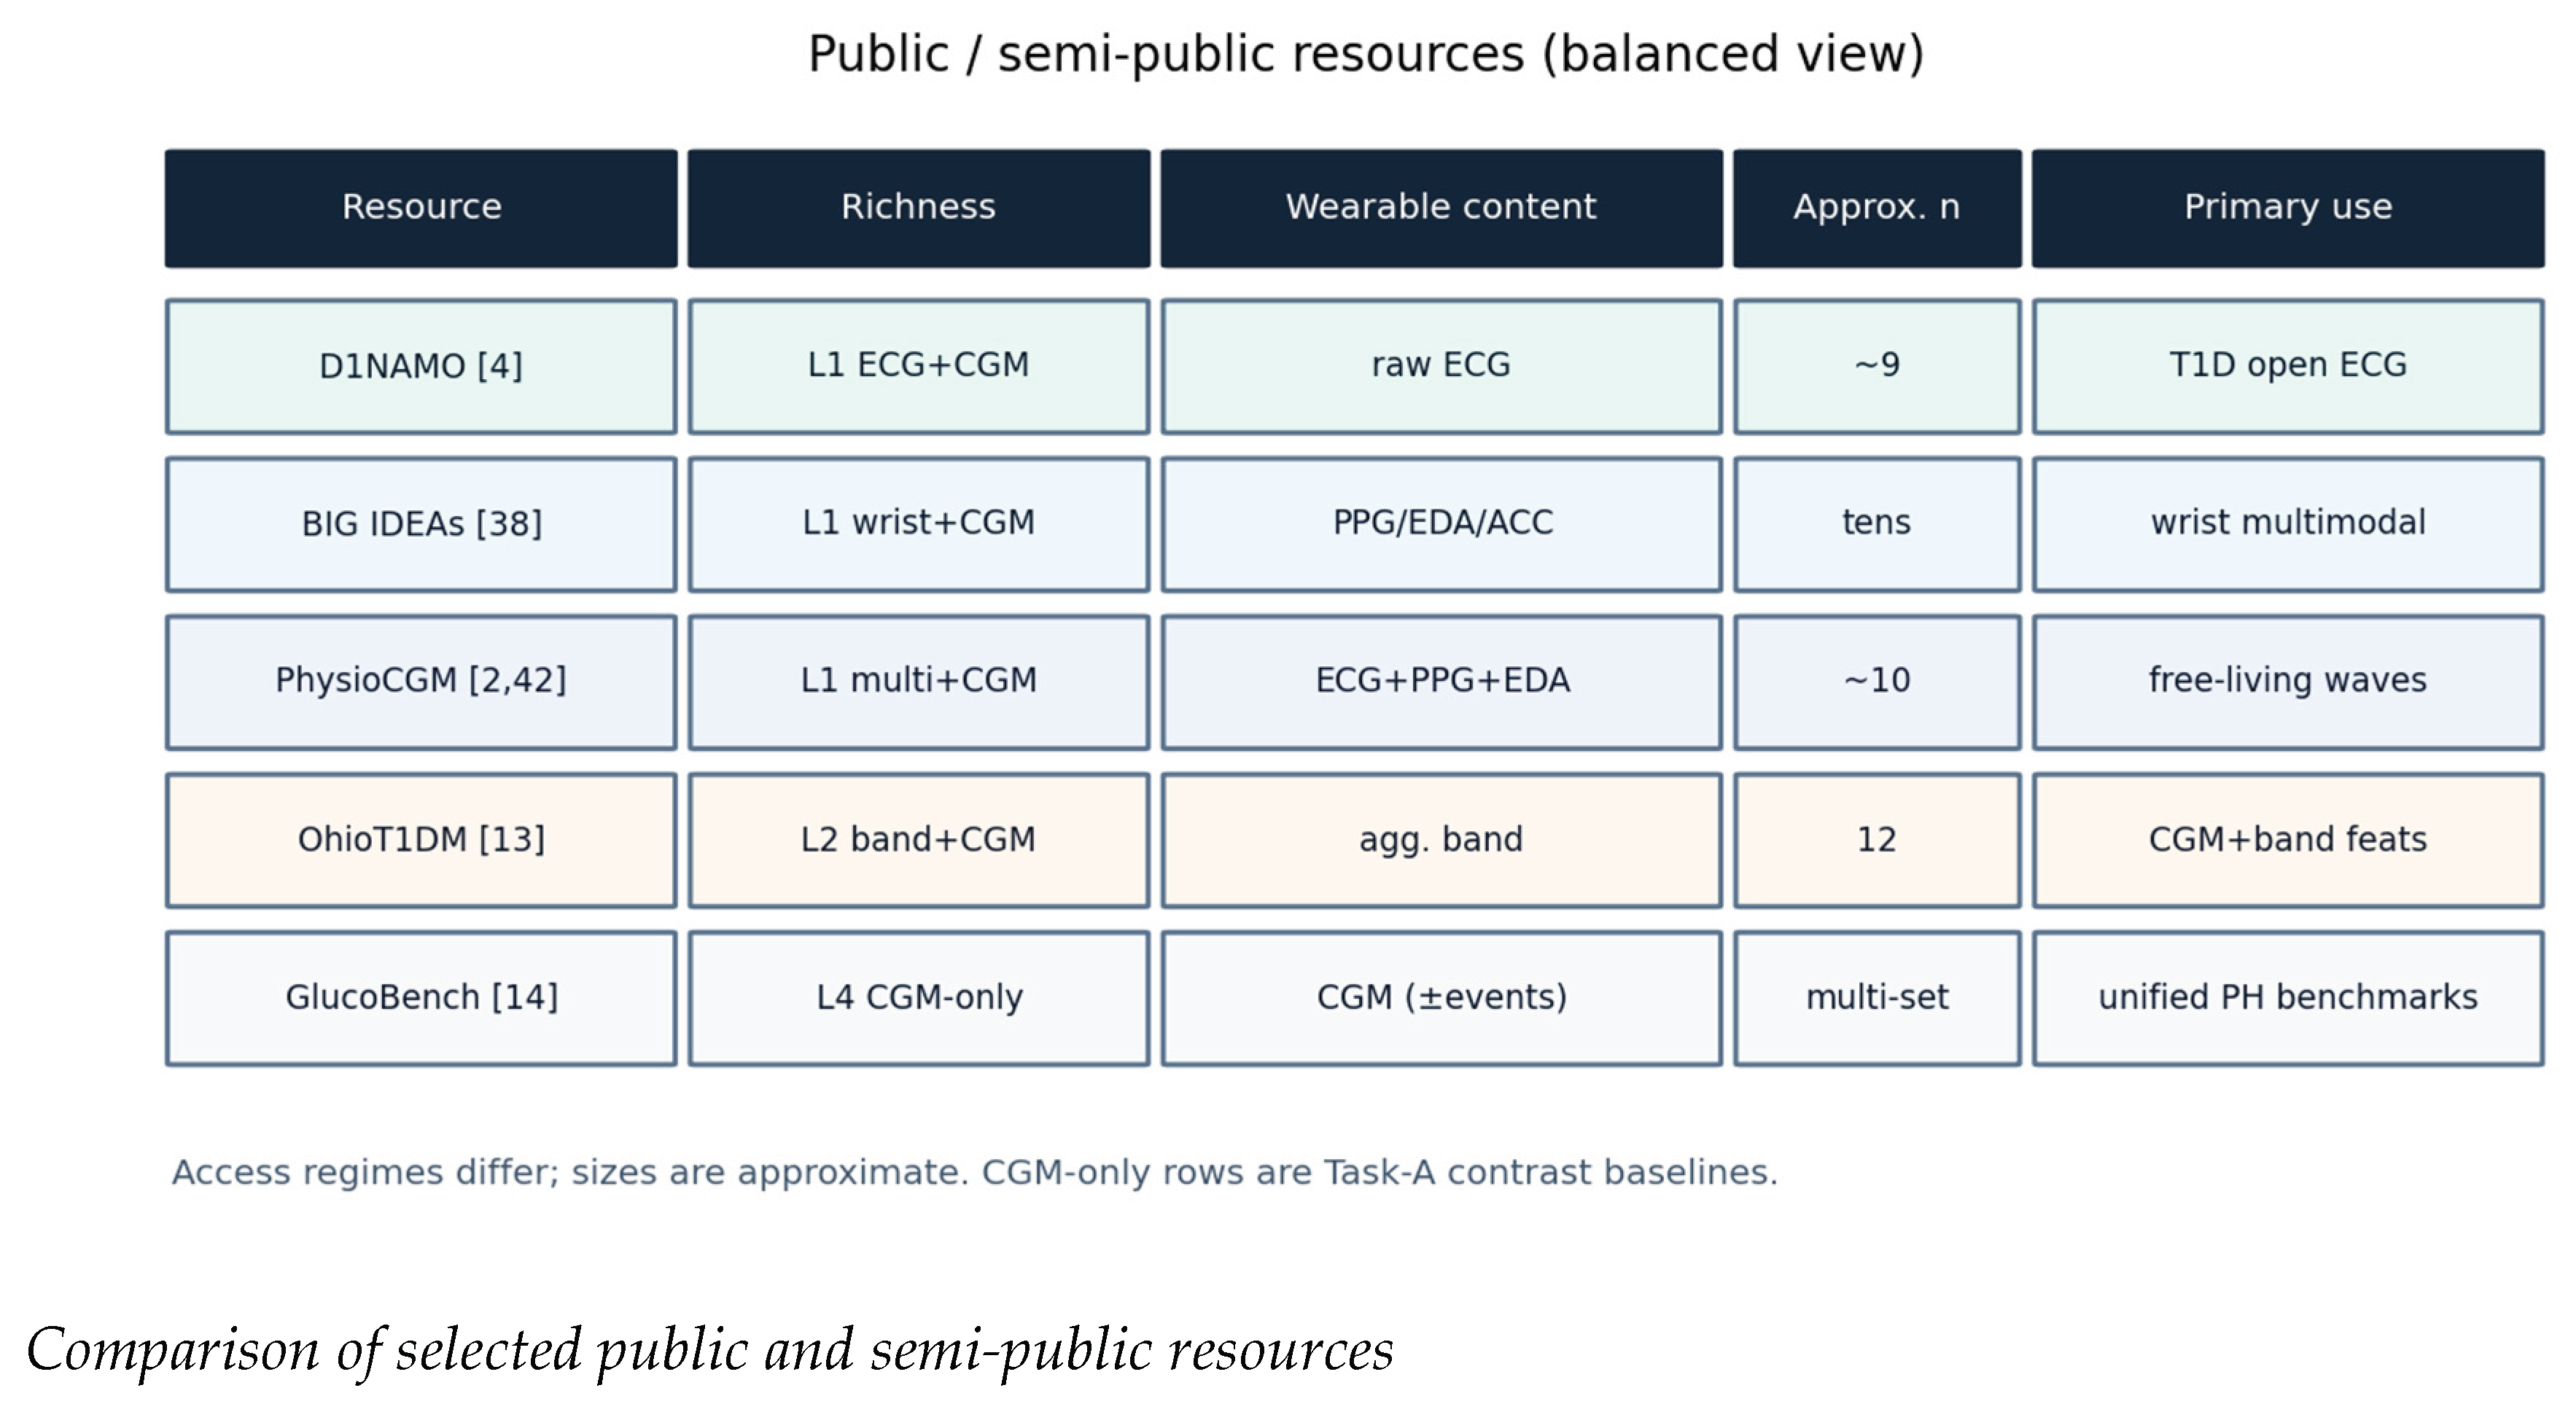
Recent public and semi-public resources make wearable-physiology × glucose research no longer entirely unreproducible. Earlier, D1NAMO released open ECG and glucose records [4]. BIG IDEAs combines wrist multimodal sensing with CGM and is hosted on PhysioNet [38]. PhysioCGM [2,42] further expands free-living multimodal recordings with synchronized raw waveforms and CGM. OhioT1DM, beyond its classic role in CGM forecasting, supplies aggregated band physiology [13]. On the CGM-only side, GlucoBench advances multi-dataset unified evaluation [14].
A practical division of labor is: D1NAMO emphasizes open chest-strap ECG; BIG IDEAs emphasizes wrist PPG/EDA/ACC; PhysioCGM emphasizes free-living multimodal raw waveforms. They are complementary rather than a single-center evidence base.
Figure 3.
Comparison of selected public or semi-public resources used for wearable physiology × glycemic research (illustrative, not exhaustive). Each row is one resource: D1NAMO [4], BIG IDEAs [38], PhysioCGM [2,42], OhioT1DM [13], and GlucoBench [14]. Columns: resource name; physiological richness tier (L1 = raw/near-raw wearable physiology plus continuous glucose monitoring (CGM); L2 = aggregated band physiology plus CGM; L4 = CGM only); wearable content; approximate cohort scale (subject count n or multi-set; order-of-magnitude estimates from data descriptors, not a re-census); and primary research use. Access regimes (open vs credentialed) differ and are not scored. Inference boundary: GlucoBench / CGM-only rows are Task-A contrast baselines for curve forecasting; wearable waveforms are not treated as interchangeable with CGM history. Model-performance metrics lie outside the figure’s scope.
Figure 3.
Comparison of selected public or semi-public resources used for wearable physiology × glycemic research (illustrative, not exhaustive). Each row is one resource: D1NAMO [4], BIG IDEAs [38], PhysioCGM [2,42], OhioT1DM [13], and GlucoBench [14]. Columns: resource name; physiological richness tier (L1 = raw/near-raw wearable physiology plus continuous glucose monitoring (CGM); L2 = aggregated band physiology plus CGM; L4 = CGM only); wearable content; approximate cohort scale (subject count n or multi-set; order-of-magnitude estimates from data descriptors, not a re-census); and primary research use. Access regimes (open vs credentialed) differ and are not scored. Inference boundary: GlucoBench / CGM-only rows are Task-A contrast baselines for curve forecasting; wearable waveforms are not treated as interchangeable with CGM history. Model-performance metrics lie outside the figure’s scope.
4.2. Task-A Contrast: CGM-Only Forecasting Benchmarks
The OhioT1DM challenge [13] and GlucoBench [14] show that short-horizon curve forecasting using glucose time series alone (optionally with meal/insulin events) already has a relatively mature data and benchmarking ecosystem. The implication for wearable physiology is clear: claims of “improved glucose prediction” must specify incremental value relative to this baseline; otherwise the work is easily read as repeating curve forecasting on weaker signals. Gains from band aggregates on PH30-style curve tasks are not always stable in the literature, supporting a primary wearable narrative on assistive risk (Task C), while treating curve increments as a separate Task-A claim that must be proven on its own terms.
4.3. Reproducibility Gaps
Despite these starting points, reproducibility remains constrained. First, public cohorts with raw ECG/PPG/EDA and long-horizon CGM often remain near the order of ten subjects, with limited coverage of age, skin tone, disease duration, complications, and diabetes type [2,4,38]. Second, many high-metric method papers do not release data or complete training protocols, impeding external validation; reviews repeatedly flag evidence grade and translation gaps [8,28]. Third, access regimes differ (fully open, credentialed access, and heterogeneous DUAs), raising reproduction cost. Fourth, communities lack shared conventions for preprocessing, quality filtering, and data splits; window-level random splits can introduce leakage, so conflicting conclusions on the same dataset are hard to adjudicate. GlucoBench’s unified benchmarking practice [14] shows, by contrast, how little comparable convention exists on the wearable-physiology side. Cross-dataset and cross-subject transfer as an evaluation practice remains far less common than within-subject feasibility reports.
4.4. A practical Stratification of Resources
For discussion, resources can be stratified by physiological richness: L1 raw/near-raw wearable physiology plus CGM (e.g., D1NAMO, PhysioCGM, BIG IDEAs); L2 aggregated band physiology plus CGM (e.g., OhioT1DM band layer); L3 activity-watch behavioral context plus CGM; L4 CGM only (plus pump/events); L5 secondary corpora of flattened features. This stratification helps avoid treating L2/L3/L5 evidence as if it provided raw multimodal waveforms.
5. Quality, Artifacts, and Uncertainty
The four gaps above concentrate here: instability is the default, yet quality is rarely written as a decision; inter-individual differences are repeatedly confirmed, yet failure modes are sparsely reported; explanations exist, yet negative controls and abstention reasons are uncommon.
5.1. Instability is the Default, not the Exception
Under free-living conditions, motion artifacts, loose wear, ambient light, electrode–skin contact changes, temperature, and sweating render wearable signals strongly nonstationary; PPG discussions are especially explicit [8], and EDA is likewise affected by sweating and temperature. Multimodal free-living descriptors report higher usable-segment or clean-beat rates at night than by day [2]; personalized nocturnal ECG detection is often studied within those higher-quality night windows [1]. Reporting only full-day average performance can hide the fact that many daytime windows are effectively unusable.
5.2. Continuous Monitoring: Coverage, Aggregation, and False-Alarm Realism
Beyond glycemic applications, evaluation practice for continuous wearable monitoring already shows why segment-level accuracy is an incomplete success criterion. Ding et al. [49] argue that cutting streams into short windows and reporting conventional classification metrics can mislead both users and innovators: real-world morphology drifts with activity and sleep, disease dynamics may be intermittent, subgroup performance is often hidden in cohort averages, and even a model with high segment accuracy can generate an unacceptable flood of false notifications when predictions fire every tens of seconds. Large consumer heart studies further illustrate a practical pattern: inference is often restricted to comparatively still or higher-quality periods, and notifications are issued only after temporal aggregation of multiple irregular detections, trading sensitivity for usable precision [49]. The implication for wearable glycemic assessment is direct: abstention, coverage, and event-level (or episode-level) false-alarm accounting are not optional decorations; they are part of what “working in continuous monitoring” means. A pipeline that looks strong on clean nocturnal segments but does not declare when it refuses to alert under daytime motion has not yet answered the deployment question.
5.3. Indirect Mapping, Label Noise, and “Relative Value”
Wearable physiology reflects glucose only indirectly and is entangled with activity, emotion, medication, and autonomic neuropathy [7,22]. When CGM provides supervision, label noise is itself larger in the hypoglycemic range, yielding a double uncertainty of “noisy labels training an indirect model.” Matching point-estimate accuracy against finger-stick or CGM as if they were deterministic ground truth is therefore often unfair. A more appropriate framing asks whether, under declared conditions, the system provides relatively valuable decision information (e.g., improved recall at an acceptable false-alarm level, or abstention when quality is insufficient) rather than claiming replacement sensing with a single MARD/RMSE.
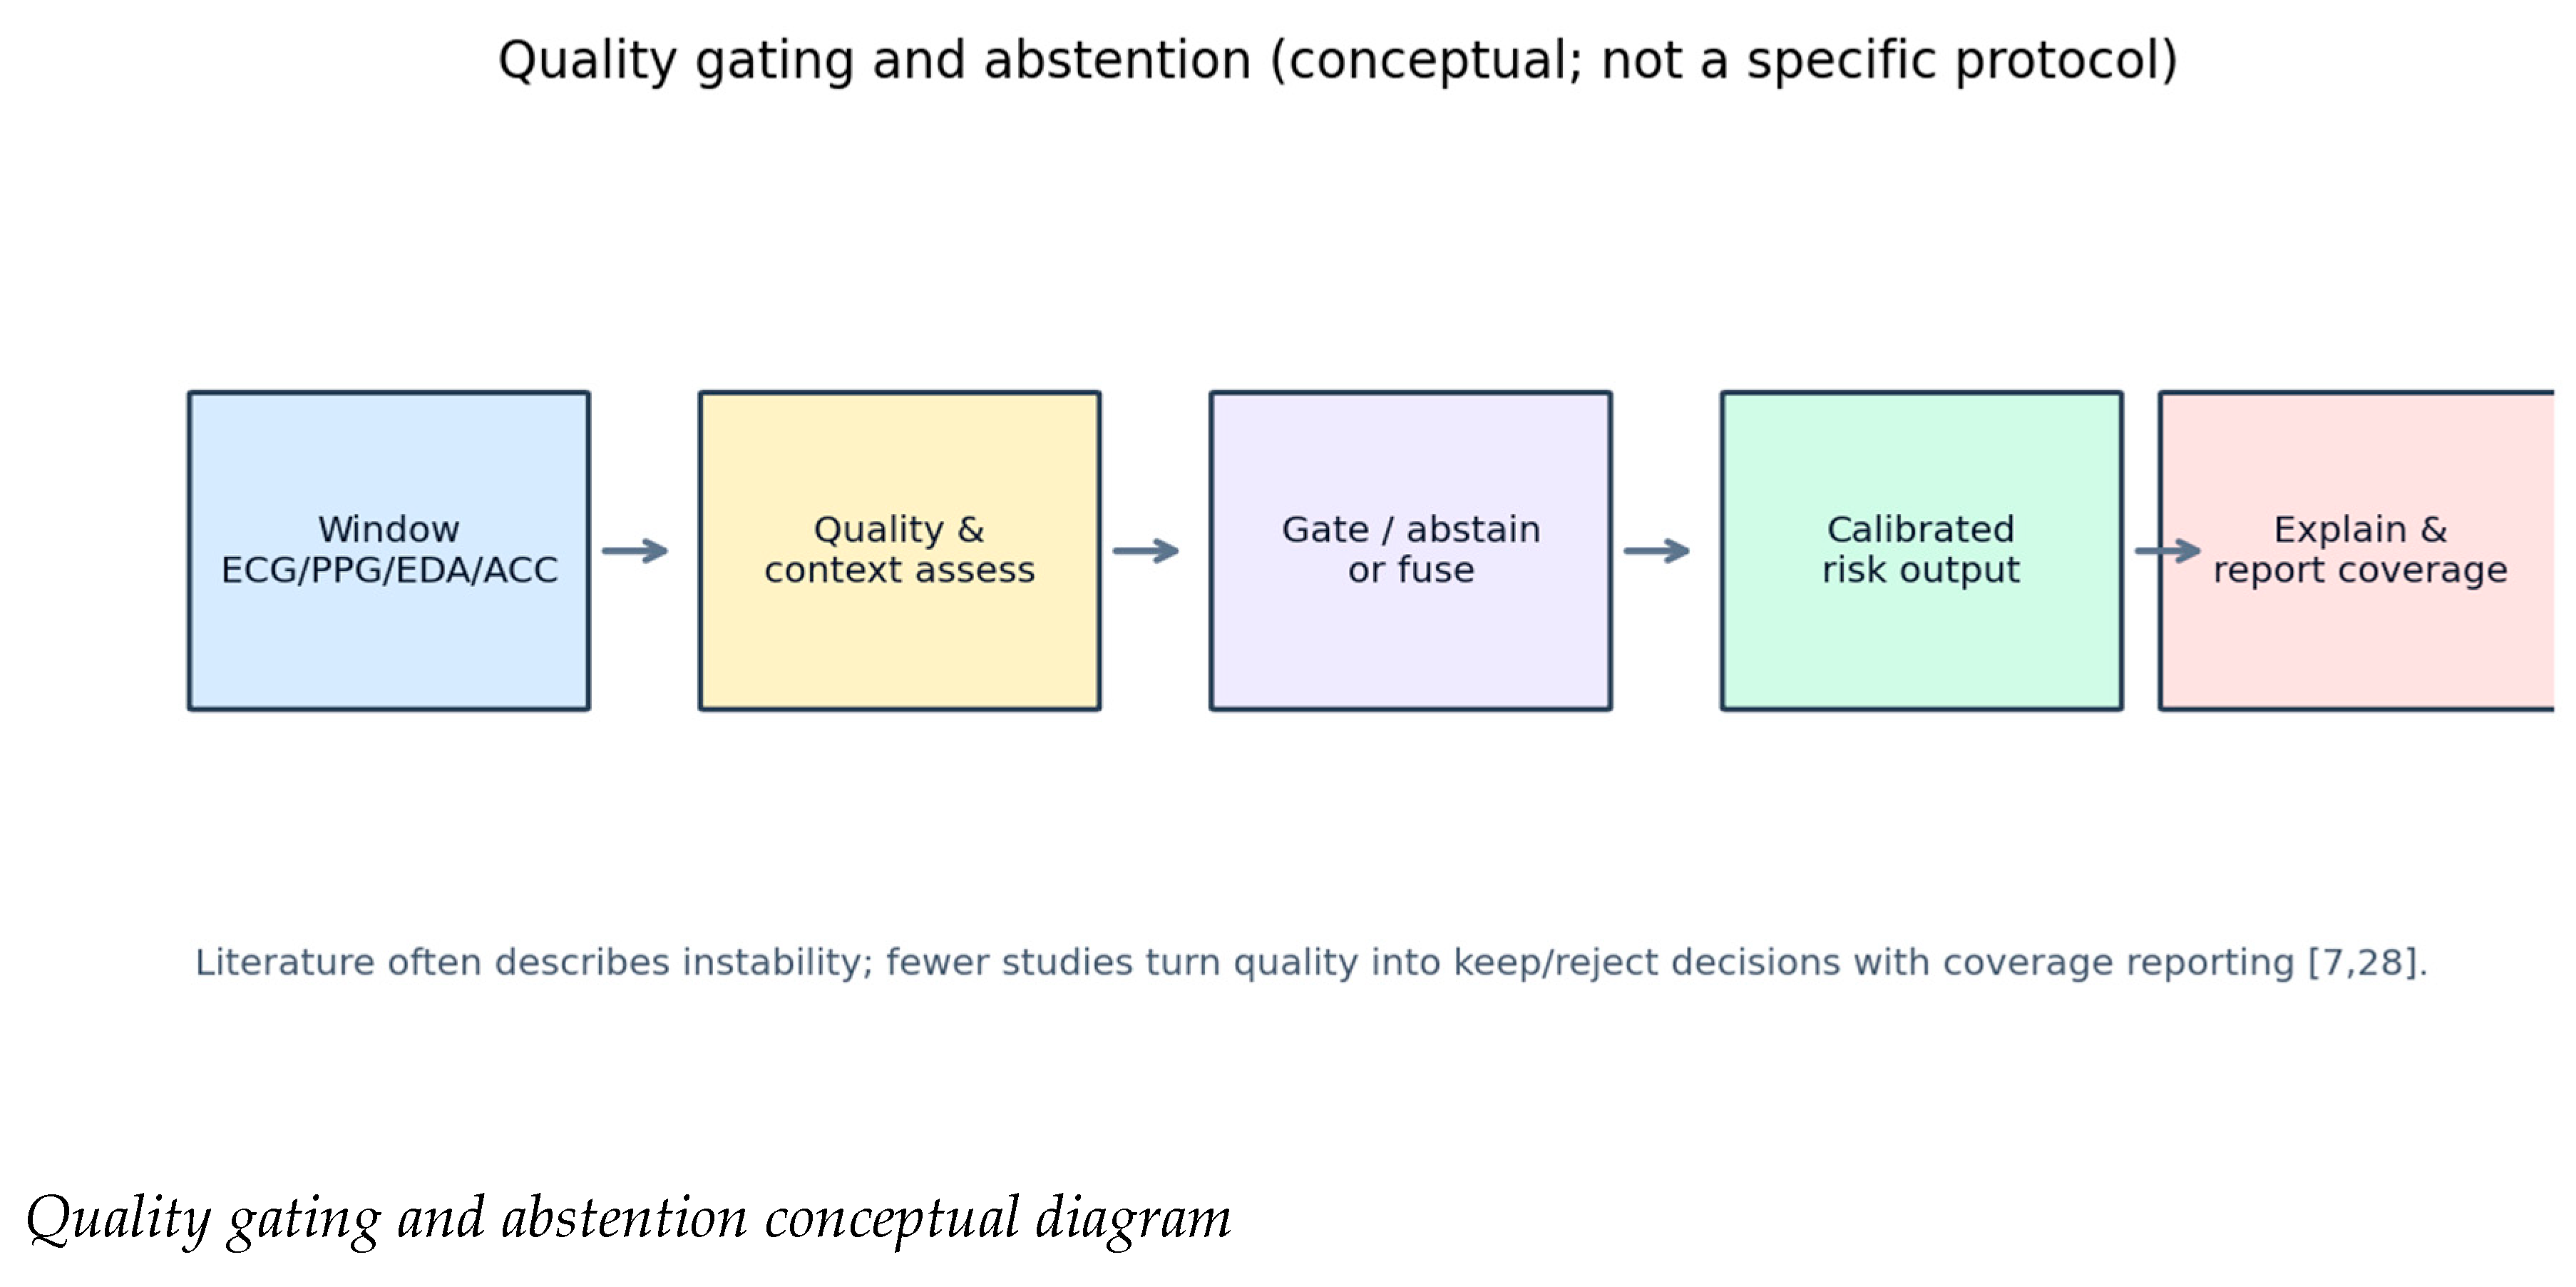
Figure 4.
Conceptual pathway linking signal quality to assistive glycemic decisions (field schematic, not an implemented algorithm). Left to right: (1) input window from electrocardiography (ECG), photoplethysmography (PPG), electrodermal activity (EDA), and/or acceleration (ACC); (2) quality and context assessment; (3) gate: discard, down-weight/defer, abstain, or fuse; (4) calibrated risk-oriented output when evidence is sufficient; (5) decision-level explanation plus coverage / uncertainty reporting. Motivation: published work often describes free-living instability, yet less often converts quality into keep/reject decisions with coverage metrics. Inference boundary: the figure proposes a reporting logic for future empirical papers; thresholds, model architectures, unpublished team protocols, and quantitative results lie outside its scope.
Figure 4.
Conceptual pathway linking signal quality to assistive glycemic decisions (field schematic, not an implemented algorithm). Left to right: (1) input window from electrocardiography (ECG), photoplethysmography (PPG), electrodermal activity (EDA), and/or acceleration (ACC); (2) quality and context assessment; (3) gate: discard, down-weight/defer, abstain, or fuse; (4) calibrated risk-oriented output when evidence is sufficient; (5) decision-level explanation plus coverage / uncertainty reporting. Motivation: published work often describes free-living instability, yet less often converts quality into keep/reject decisions with coverage metrics. Inference boundary: the figure proposes a reporting logic for future empirical papers; thresholds, model architectures, unpublished team protocols, and quantitative results lie outside its scope.
5.4. Personalization and Distribution Shift
Inter-individual differences are repeatedly confirmed in ECG and watch studies: patterns that work for one person can degrade sharply for another [1,6]. Personalization improves within-subject performance but raises cold-start, long-term drift, and scaled clinical-trial cost issues. Systematic evidence for cross-dataset transfer across devices, populations, and sampling protocols remains thin; the complementary roles of D1NAMO, BIG IDEAs, and PhysioCGM caution against assuming zero-shot transfer without declared modality and label definitions.
5.5. Evaluation and Protocol Heterogeneity
Task definitions, class imbalance, split protocols (including risk of window-level leakage), day/night and quality-stratified reporting, and clinically relevant thresholds lack shared conventions; scoping reviews have criticized this concentration of gaps [28]. Under rare hypoglycemia, Accuracy/AUROC alone can mask prevalence effects; the literature already suggests metric bundles better matched to assistive decisions. Multimodal fusion gains without ablation, negative controls (e.g., acceleration alone), and quality strata are hard to attribute to physiology rather than artifact shortcuts; modality-strength differences on public multimodal data [2] and ECG+ACC activity-context analyses [16] caution against assuming that fusion is default-better.
5.6. Interpretability and Clinical Trust
A gap remains between deep-model decisions and the clinical question “why alert now?” Although some work visualizes ECG segments [1] or attributes watch features [6], such practices are not yet routine; many methods still stop at post-hoc importance rankings or local heatmaps and do not answer decision-facing questions such as why an alert fires now, which modalities drive it, and whether the evidence is sufficient. For assistive decisions, false alarms and misses are asymmetric in cost: excess false alarms erode adherence and trust, while misses affect safety, so explanation should not be separated from uncertainty communication and abstention.
Clinical trust depends more on checkable reasons than on raising a single offline score. A minimal decision-level explanation set can be sketched as: physiological-direction consistency (e.g., heart-rate / HRV changes aligned with expected hypoglycemic physiology), counterfactual modality contribution, abstention reasons, and negative controls against activity shortcuts. Without these elements, even acceptable within-subject performance is hard to audit for assistive use, elements still sparsely required in published work, and community minima remain unsettled.
5.7. Engineering and Deployment Uncertainty
On-device TinyML [29], intermittent wear, packet loss, power budgets, and sensor generation changes make offline complete-record metrics hard to extrapolate to real deployment. Vendor watch-feature iteration further undermines cross-version comparability. Deployment constraints should enter evaluation design rather than appear only as a discussion afterthought.
5.8. A literature-Derived Minimal Reporting Checklist
Trustworthy medical AI and medical training-data quality discussions increasingly emphasize lifecycle documentation and fit-for-purpose data assessment [50,51]. Without introducing a separate consensus standard, we distill from the gaps above, and from continuous-monitoring evaluation arguments [49], a minimal reporting checklist for future empirical papers on wearable physiology × glycemic assessment. Items are intentionally actionable; authors need not adopt every item in one study, but should state which are addressed and which are deferred.
- Task definition: declare Task C / B / A (or a justified mix) and keep separate success criteria across tasks.
- Cohort and device card: population (diabetes type, age range, skin-tone/perfusion notes if relevant), device model/firmware or sensor generation, sampling rates, and wear location.
- Split protocol: subject- / day-aware splits; state how window-level leakage is avoided; report whether evaluation is within-subject, LOSO, or cross-dataset.
- Label construction: CGM vs finger-stick; hypo-/hyperglycemia thresholds; lead time if any; acknowledgment of larger CGM error in hypoglycemia when CGM is the supervisor.
- Quality definition: how invalid or low-quality windows are detected; day/night or activity strata if used.
- Abstention and coverage: rules for discard / defer / abstain; report coverage alongside detection or estimation metrics (not accuracy alone on the kept subset).
- Rare-event metric bundle: beyond Accuracy/AUROC (e.g., sensitivity at fixed specificity, AUPRC, or other prevalence-aware summaries appropriate to assistive alerting).
- Cross-domain failures: if claiming generalization, report cross-subject or cross-dataset results, including weak or failed transfers when observed.
- Modality ablation and negative controls: compare to the strongest single modality; include an ACC-only or activity-shortcut control when ACC or similar context is available.
- Decision-level explanation minimum: why alert now, which modalities drive the decision, and why abstain when declining, beyond post-hoc heatmaps alone.
- Task-A increment (if claimed): incremental value over a declared CGM-only (or glucose-history) baseline under the same protocol.
- Deployment constraints (if claimed): intermittent wear, packet loss, on-device limits, or sensor-generation drift; state whether offline complete-record metrics are the sole evidence.
This checklist is a literature-derived agenda tool, not a regulatory instrument. It operationalizes Table 1’s empty cells into reportable commitments for subsequent empirical work.
6. Open Problems
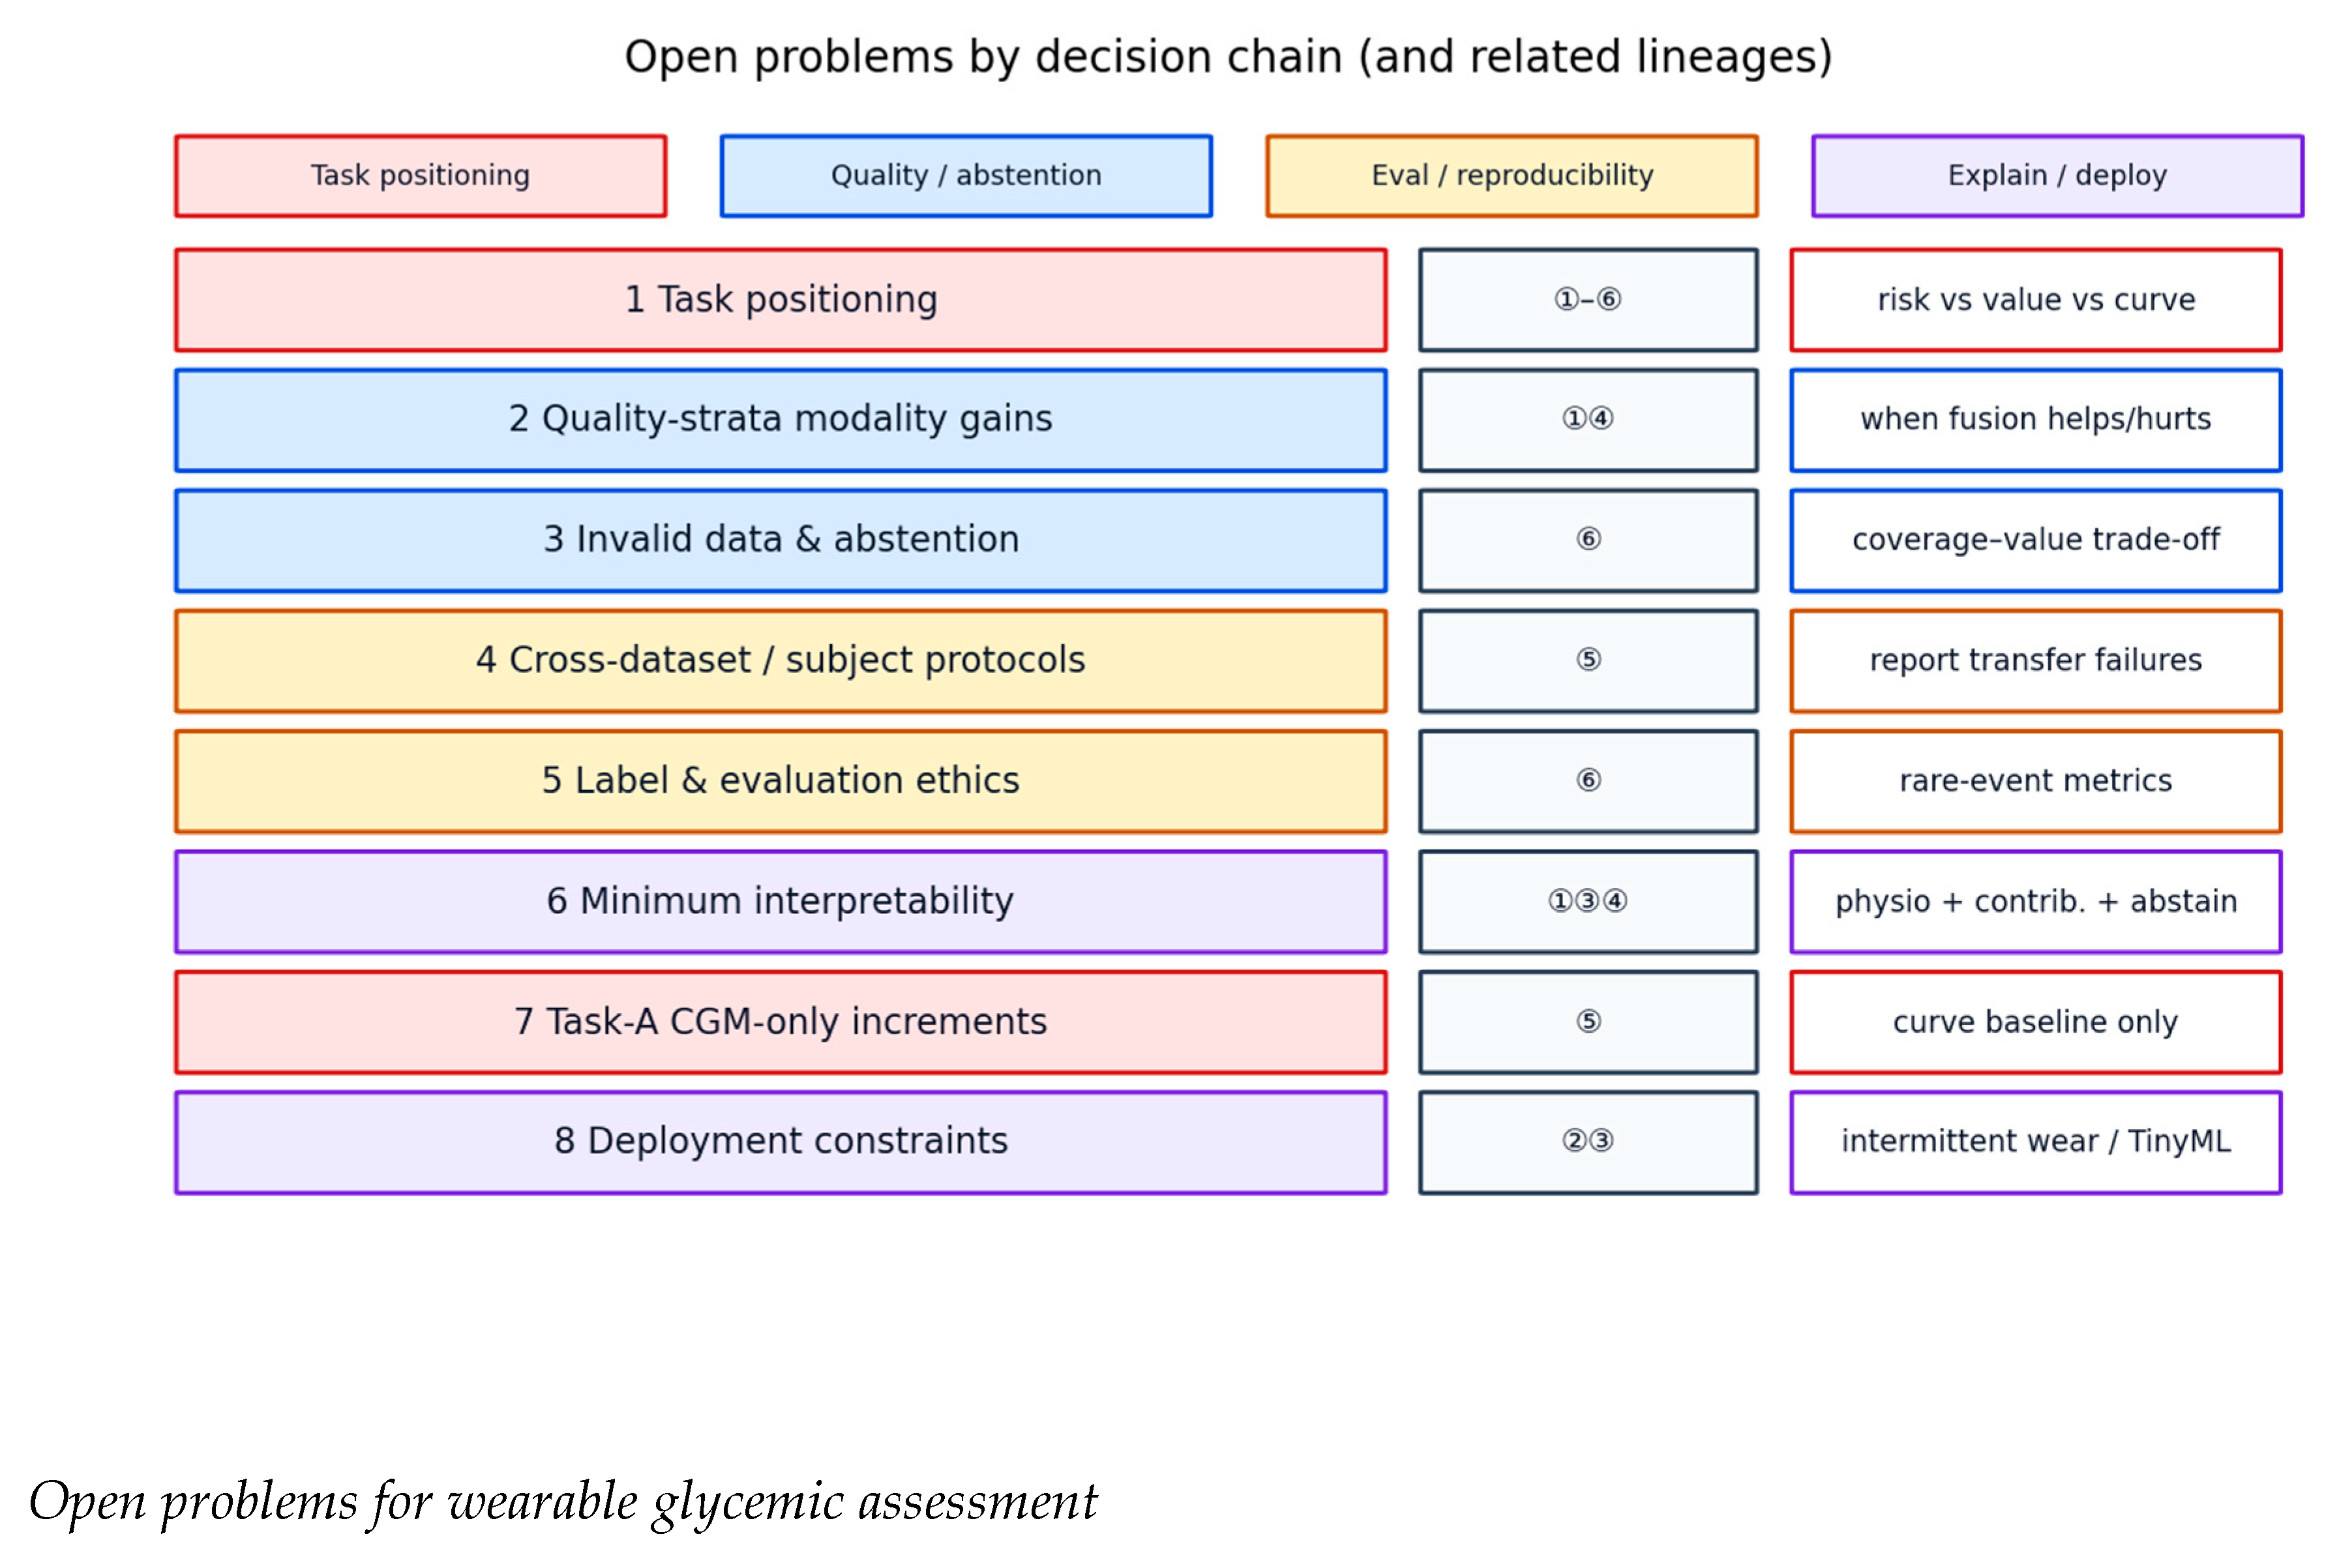
The following questions are distilled from the four gaps in Section 3, Section 4 and Section 5 and from the checklist in Section 5.8 as an agenda for empirical studies. They are grouped along a decision chain (task → quality/abstention → evaluation/reproducibility → explanation/deployment). Implementation-level solutions belong in subsequent papers; the questions below mark what remains open.
Figure 5.
Eight open problems that structure a near-term empirical agenda for wearable physiology as assistive glycemic risk assessment (not continuous glucose monitoring (CGM) replacement). Rows 1–8 keep numeric order; left boxes name each problem, middle boxes list related research lineages ①–⑥ (as in Figure 1), and right boxes give a short focus note. Row colors encode a decision-chain grouping (legend at top): task positioning (problems 1, 7); quality / abstention (2, 3); evaluation / reproducibility (4, 5); explanation / deployment (6, 8). Basis: synthesis of literature gaps in Section 3, Section 4 and Section 5 and the checklist in Section 5.8. Inference boundary: items are unanswered research questions for subsequent studies; experiments, metrics, and solved claims lie outside the figure’s scope.
Figure 5.
Eight open problems that structure a near-term empirical agenda for wearable physiology as assistive glycemic risk assessment (not continuous glucose monitoring (CGM) replacement). Rows 1–8 keep numeric order; left boxes name each problem, middle boxes list related research lineages ①–⑥ (as in Figure 1), and right boxes give a short focus note. Row colors encode a decision-chain grouping (legend at top): task positioning (problems 1, 7); quality / abstention (2, 3); evaluation / reproducibility (4, 5); explanation / deployment (6, 8). Basis: synthesis of literature gaps in Section 3, Section 4 and Section 5 and the checklist in Section 5.8. Inference boundary: items are unanswered research questions for subsequent studies; experiments, metrics, and solved claims lie outside the figure’s scope.
6.1. Task Positioning
- Task positioning. Are wearable physiological signals best cast as risk assistance, value estimation, or a stable gain term for curve forecasting? Do hypoglycemia and hyperglycemia share the same information structure, and under which populations and scenarios?
- Task A: incremental value over CGM-only baselines. On curve tasks, is the gain from aggregated band or waveform physiology over CGM history stable? If not, how should narratives return to risk tasks?
6.2. Quality and Abstention
- 3.
- Modality contribution under quality strata. How should incremental information from ECG, PPG, and EDA for risk/value tasks be quantified across quality levels and periods (e.g., day/night, activity intensity)? How should ACC be interpreted as a motion floor? When does fusion help, harm, or yield negative gains?
- 4.
- Invalid data and abstention. How should hard invalidity, quality down-weighting, and abstention be defined and reported? How should coverage–performance trade-offs be presented for clinical comparability?
6.3. Evaluation and Reproducibility
- 5.
- Cross-dataset and cross-subject reproducibility protocols. Given inconsistent devices, populations, and label definitions, which split, preprocessing, and reporting conventions suffice for repeatable comparison? Should zero-shot failures and weak recovery also be reported as primary evidence? How can public waveform-level data grow in scale and diversity?
- 6.
- Label and evaluation ethics. When CGM error is larger in hypoglycemia, how can inflated model performance be avoided? Which metric bundles better match assistive decision-making than replacement sensing?
6.4. Explanation and Deployment
- 7.
- Minimum interpretability standards. Beyond accuracy, which elements should a clinically checkable explanation include (physiological feature consistency, modality contribution, abstention reasons, negative controls, etc.)?
- 8.
- Performance under deployment constraints. How should intermittent wear, packet loss, power budgets, and sensor generation changes enter evaluation, rather than reporting only on offline complete recordings?
7. Conclusions
Wearable physiological sensing for glycemic assessment now forms a recognizable structure of six research lineages: ECG evidence is relatively concentrated on hypoglycemia-related tasks but depends on personalization and quality conditions; PPG/smartphone routes lower device barriers while exposing calibration and artifact issues; watch/band routes fit real wear yet remain coarse and vendor-dependent; multimodal fusion sometimes helps but lacks stable evidence under quality strata and negative controls; public data make reproducibility possible, yet scale and protocols remain immature; and systematic reviews already articulate gaps in standardization, quality, uncertainty, and translation. CGM-only forecasting should be treated as a Task-A contrast baseline, not the default race track for wearable physiology.
Short answers to the literature-level questions in Section 1 are as follows. RQ1: published evidence most consistently supports an assistive risk narrative, especially nocturnal or higher-quality windows with personalization, while value estimation remains condition-dependent and curve increments over CGM-only baselines are not a settled wearable claim (partially affirmative for risk assistance; not for replacement sensing). RQ2: within-subject feasibility is common, but cross-subject / cross-device / cross-dataset evidence is still thin and protocols are heterogeneous; deployment-facing transfer narratives are not yet warranted by the public literature (clearly insufficient). RQ3: artifacts and night-time usability are often described, yet quality-stratified reporting, abstention, and coverage–performance trade-offs are rarely treated as primary decision metrics; decision-level explanations with negative controls are likewise uncommon (largely unstandardized): Section 5.8 turns these gaps into a minimal reporting checklist rather than treating them as settled practice. These answers bound what synthesis can claim; Section 6 lists the empirical agenda that remains open.
The field’s basic tension is that devices are widespread and comparatively inexpensive, while signals are unstable, mappings are non-deterministic, data are fragmented, and evaluation is inconsistent. Progress that matters is not packaging unstable wearable signals as deterministic glucose readings, but identifying when, and which modalities and windows, remain trustworthy, abstaining when evidence is insufficient, and honestly reporting failure modes and applicability boundaries; clinical trust further requires decision-level interpretability, alerts and abstentions should come with checkable physiological and modality-based reasons, rather than post-hoc heatmaps or offline scores alone. By organizing the status quo along task taxonomy, six lineages, data and reproducibility, quality and uncertainty (including interpretability and clinical trust), and open problems, this preprint aims to clarify problem boundaries for subsequent empirical validation; methods and results belong in separate papers.
Acknowledgments
We thank maintainers of public datasets and open benchmarks for enabling reproducible research. This preprint involves no new human-subject data collection; secondary use of public data should follow each source’s terms.
Use of Artificial Intelligence
The manuscript was written by the authors. Qwen3.7 was used only for wording polish and grammar checks. The authors take full responsibility for the final text and verified that no AI-assisted edits altered scientific claims, citations, or figure content. No generative AI was used to create figures or to invent results.
Conflicts of Interest
The authors declare no conflicts of interest.
Data and Code Availability
References are listed at the end of this preprint. Primary data should be obtained from official hosts (e.g., PhysioCGM/figshare, PhysioNet, Zenodo, and journal data statements). No new experimental code package is released with this literature synthesis.
References
- Porumb, et al. Precision Medicine and Artificial Intelligence: A Pilot Study on Deep Learning for Hypoglycemic Events Detection based on ECG. In Scientific Reports; 2020. [Google Scholar] [CrossRef]
- Quamer, et al. A multimodal physiological dataset for non-invasive blood glucose estimation (PhysioCGM). In Scientific Data; 2025. [Google Scholar] [CrossRef] [PubMed]
- Tseng; Gutierrez-Osuna. ECGluFormer: glucose prediction from ECG via multi-loss, transformer-based aggregation. IEEE-EMBS Int. Conf. Biomed. Health Inform. (BHI) 2025. [Google Scholar] [CrossRef]
- Dubosson, et al. The open D1NAMO dataset: A multi-modal dataset for research on non-invasive type 1 diabetes management. In Informatics in Medicine Unlocked; 2018. [Google Scholar] [CrossRef]
- Bent, et al. Engineering digital biomarkers of interstitial glucose from noninvasive smartwatches. npj Digit. Med. 2021. [Google Scholar] [CrossRef] [PubMed]
- Mohamed, et al. Personalized machine learning models for noninvasive hypoglycemia detection in people with type 1 diabetes using a smartwatch. PLoS ONE 2025. [Google Scholar] [CrossRef] [PubMed]
- Diouri, et al. Hypoglycaemia detection and prediction techniques: A systematic review on the latest developments. Diabetes/Metabolism Res. Rev. 2021. [Google Scholar] [CrossRef] [PubMed]
- Jiang, et al. PPG-based glucose sensors: a review. Artif. Intell. Rev. 2025. [Google Scholar] [CrossRef]
- Di Filippo, et al. Non-Invasive Glucose Sensing Technologies and Products: A Comprehensive Review. In Sensors; 2023. [Google Scholar] [CrossRef] [PubMed]
- Arbi, Fellah; et al. Non-invasive method for blood glucose monitoring using ECG signal. Pol. J. Med. Phys. Eng. 2023. [Google Scholar] [CrossRef]
- Tseng, et al. Hypoglycemia Prediction in Type 1 Diabetes With Electrocardiography Beat Ensembles. J. Diabetes Sci. Technol. 2025. [Google Scholar] [CrossRef] [PubMed]
- Mendez, et al. Toward Detection of Nocturnal Hypoglycemia in People With Diabetes Using Consumer-Grade Smartwatches and a Machine Learning Approach. J. Diabetes Sci. Technol. 2025. [Google Scholar] [CrossRef] [PubMed]
- Marling; Bunescu. The OhioT1DM Dataset for Blood Glucose Level Prediction: Update 2020. Proceedings of the 5th International Workshop on Knowledge Discovery in Healthcare Data (KDH) co-located with ECAI 2020, CEUR Workshop Proceedings. 2020. Available online: https://www.ncbi.nlm.nih.gov/pmc/articles/PMC7881904/.
- Sergazinov, et al. GlucoBench: Curated List of Continuous Glucose Monitoring Datasets with Prediction Benchmarks. arXiv 2024. [Google Scholar] [CrossRef]
- Bent, et al. Non-invasive wearables for remote monitoring of HbA1c and glucose variability: proof of concept. BMJ Open Diabetes Res. Care 2021. [Google Scholar] [CrossRef] [PubMed]
- Dave, et al. Detection of Hypoglycemia and Hyperglycemia Using Noninvasive Wearable Sensors: ECGs and Accelerometry. J. Diabetes Sci. Technol. 2022. [Google Scholar] [CrossRef] [PubMed]
- Dave, et al. Hypoglycemia and hyperglycemia detection using ECG: A multi-threshold based personalized fusion model. Biomed. Signal Process. Control 2024. [Google Scholar] [CrossRef]
- Li, et al. Noninvasive Blood Glucose Monitoring Using Spatiotemporal ECG and PPG Feature Fusion. IEEE Trans. Neural Netw. Learn. Syst. 2023. [Google Scholar] [CrossRef] [PubMed]
- Zhang, et al. A Noninvasive Blood Glucose Monitoring System Based on Smartphone PPG Signal Processing and ML. IEEE Trans. Ind. Inform. 2020. [Google Scholar] [CrossRef]
- Cichosz, et al. A Novel Algorithm for Prediction and Detection of Hypoglycemia Based on CGM and HRV in T1D. J. Diabetes Sci. Technol. 2014. [Google Scholar] [CrossRef] [PubMed]
- Scire, et al. Diabetes Detection and Management through PPG and ECG Signals Analysis: A Systematic Review. In Sensors; 2022. [Google Scholar] [CrossRef] [PubMed]
- Alhaddad, et al. Sense and Learn: Recent Advances in Wearable Sensing and ML for Blood Glucose Monitoring. Front. Bioeng. Biotechnol. 2022. [Google Scholar] [CrossRef] [PubMed]
- Arbi, Fellah; et al. Blood glucose estimation based on ECG signal. In Physical and Engineering Sciences in Medicine; 2023. [Google Scholar] [CrossRef] [PubMed]
- Nguyen, et al. Neural network approach for non-invasive detection of hyperglycemia using ECG. Annual International Conference of the IEEE Engineering in Medicine and Biology Society (EMBC), 2014. [Google Scholar] [CrossRef] [PubMed]
- Marling, et al. Machine Learning Experiments with Noninvasive Sensors for Hypoglycemia Detection. IJCAI Workshop on Knowledge Discovery in Healthcare Data (KDHealth). 2016. Available online: https://webpages.charlotte.edu/rbunescu/data/ohiot1dm/pubs/ijcai16kdhealth.pdf.
- San, P. P.; Ling, S. H.; Soe, N. N.; Nguyen, H. T. A novel extreme learning machine for hypoglycemia detection. Annual International Conference of the IEEE Engineering in Medicine and Biology Society (EMBC), 2014. [Google Scholar] [CrossRef] [PubMed]
- Lombardi, et al. Photoplethysmography and Artificial Intelligence for Blood Glucose Level Estimation in Diabetic Patients: A Scoping Review. IEEE Access 2024. [Google Scholar] [CrossRef]
- Chan, et al. AI-Based Noninvasive Blood Glucose Monitoring: Scoping Review. JMIR Diabetes 2024. [Google Scholar] [CrossRef] [PubMed]
- Zeynali, et al. Non-invasive blood glucose monitoring using PPG signals with various deep learning models and implementation using TinyML. Sci. Rep. 2025. [Google Scholar] [CrossRef] [PubMed]
- Chu, et al. Improving non-invasive glucose estimation with monthly calibrated PPG and implicit HbA1c. Commun. Med. 2025. [Google Scholar] [CrossRef] [PubMed]
- Hu, et al. A smart wearable device-based model for identifying hypoglycemia in type 1 diabetes. Diabetes Res. Clin. Pract. 2025. [Google Scholar] [CrossRef]
- Cordeiro, et al. Utilization of Personalized ML to Screen for Dysglycemia from Ambulatory ECG. Biosensors 2023. [Google Scholar] [CrossRef] [PubMed]
- Cordeiro, et al. Hyperglycemia Identification Using ECG in Deep Learning Era. In Sensors; 2021. [Google Scholar] [CrossRef] [PubMed]
- Cichosz, et al. Validation of an Algorithm for Predicting Hypoglycemia From CGM and HRV Data. J. Diabetes Sci. Technol. 2019. [Google Scholar] [CrossRef] [PubMed]
- Gu, et al. SugarMate: Non-intrusive Blood Glucose Monitoring with Smartphones. In Proceedings of the ACM on Interactive, Mobile, Wearable and Ubiquitous Technologies, 2017. [Google Scholar] [CrossRef]
- Chen, et al. Multi-View Cross-Fusion Transformer for Non-Invasive Blood Glucose Measurement Using PPG. IEEE J. Biomed. Health Inform. 2024. [Google Scholar] [CrossRef] [PubMed]
- Zeng, et al. Advances in Electrocardiogram-Based Non-Invasive Blood Glucose Monitoring Technology. Diabetes Obes. Metab. 2025. [Google Scholar] [CrossRef] [PubMed]
- Cho, et al. BIG IDEAs Lab Glycemic Variability and Wearable Device Data. PhysioNet 2022. [Google Scholar] [CrossRef]
- Ling, et al. Non-invasive detection of hypoglycemic episodes in T1D using hybrid rough neural system. IEEE Congress on Evolutionary Computation (CEC), 2014. [Google Scholar] [CrossRef]
- San, et al. Block based neural network for hypoglycemia detection. Annual International Conference of the IEEE Engineering in Medicine and Biology Society (EMBC), 2011. [Google Scholar] [CrossRef] [PubMed]
- Ranvier, et al. “Detection of hypoglycemic events through wearable sensors,” Workshop / technical report, HES-SO. 2016. Available online: https://publications.hevs.ch/index.php/topics/single/163.
- Quamer, et al. PhysioCGM: a multimodal physiological dataset for non-invasive blood glucose estimation. figshare (Dataset) 2025. [Google Scholar] [CrossRef]
- Kang, J. W.; et al. Direct observation of glucose fingerprint using in vivo Raman spectroscopy. Sci. Adv. 2020, vol. 6(no. 4), eaay5206. [Google Scholar] [CrossRef] [PubMed]
- Bresci, a.; Kim, Y.; Jue, M.; et al. Band-Pass Raman Spectroscopy Unlocks Compact Point-of-Care Noninvasive Continuous Glucose Monitoring. Anal. Chem. 2025. [Google Scholar] [CrossRef] [PubMed]
- Yang, M.; Liu, M.; Wang, X.; et al. Noninvasive Blood Glucose Monitoring via Vein Visualization-Guided Confocal Raman Spectroscopy and Heterogeneous Ensemble Learning. ACS Photonics 2025. [Google Scholar] [CrossRef]
- Zhang, Y.; Zhang, L.; Wang, L.; et al. Subcutaneous depth-selective spectral imaging with mμSORS enables noninvasive glucose monitoring. Nat. Metab. 2025, vol. 7(no. 2), 421–433. [Google Scholar] [CrossRef] [PubMed]
- Hina, a.; Saadeh, W. Noninvasive Blood Glucose Monitoring Systems Using Near-Infrared Technology—A Review. Sensors 2022, vol. 22(no. 13), 4855. [Google Scholar] [CrossRef] [PubMed]
- Yadav, J.; Rani, A.; Singh, V.; et al. Prospects and limitations of non-invasive blood glucose monitoring using near-infrared spectroscopy. Biomed. Signal Process. Control 2015, vol. 18, 214–227. [Google Scholar] [CrossRef]
- Ding, C.; Guo, Z.; Rudin, C.; Xiao, R.; Nahab, F. B.; Hu, X. Reconsideration on evaluation of machine learning models in continuous monitoring using wearables. arXiv 2023. [Google Scholar] [CrossRef]
- Lekadir, K.; et al. FUTURE-AI: International consensus guideline for trustworthy and deployable artificial intelligence in healthcare. arXiv 2023. [Google Scholar] [CrossRef]
- Schwabe, D.; Becker, K.; Seyferth, M.; Klaß, A.; Schaeffter, T. The METRIC-framework for assessing data quality for trustworthy AI in medicine: a systematic review. arXiv 2024. [Google Scholar] [CrossRef]
Disclaimer/Publisher’s Note: The statements, opinions and data contained in all publications are solely those of the individual author(s) and contributor(s) and not of MDPI and/or the editor(s). MDPI and/or the editor(s) disclaim responsibility for any injury to people or property resulting from any ideas, methods, instructions or products referred to in the content. |
© 2026 by the authors. Licensee MDPI, Basel, Switzerland. This article is an open access article distributed under the terms and conditions of the Creative Commons Attribution (CC BY) license (http://creativecommons.org/licenses/by/4.0/).
Copyright: This open access article is published under a Creative Commons CC BY 4.0 license, which permit the free download, distribution, and reuse, provided that the author and preprint are cited in any reuse.