

Submitted:
10 August 2026
Posted:
11 August 2026
You are already at the latest version
Abstract
The peninsular India is an area of ~16,00,000 sq. km, bound by mountain or hill ranges. It comprises dominantly the Archean-Proterozoic terrain (APT) in the south, Deccan trap Volcanic Terrain (DVT) in the middle and, Mixed-Lithology Terrain (MLT) in the north. Almost all rivers of peninsular India originate in mountain ranges or high plateaus, rain-fed, drain continental rocks and flow westwards into the Arabian Sea or eastwards into the Bay of Bengal (Figure 1). River sediments are formed from weathering and erosion of continental rocks in their drainage basins. Since the drainage basins of the rivers cover the entire landmass of peninsular India, the average geochemical compositions of sediments in the rivers may reflect the average composition of the continental crust. Here, we highlight the differences in the average chemical composition of sediments in rivers along the east and west coast of India that drain dominantly similar geological terrains, update the geochemical composition of the Peninsular India Rivers Average Clay (PIRAC) based on the sediments from 104 rivers and, suggest that the composition of PIRAC serves as reference sediment for the Indian sub-continent.
We found that the major elements in river sediments are variably affected by the intensity of weathering, with depleted mobile elements and enriched immobile elements. On an average, the clays from the east coast rivers are enriched with Si, Ti, Fe, Mg and Mn, and Na and depleted with Ca and P relative to those of the west coast rivers. PIRAC showed more depleted Si, Mg, Ca, Na and K and enriched Ti, Fe, Mn and P relative to the Post Archean average Australian Shale (PAAS). Weathering indices suggest that the sediments are extremely weathered in the southern peninsular India and, strong to moderately weathered in the central and northern peninsular India. The average total trace element content (∑TE) of the clays was much higher for the east coast rivers than that of west coast. The ∑TE of PIRAC was lower than in PAAS. The PAAS-normalised trace elements of PIRAC showed high transition trace elements (∑TTE) and low high-field strength elements (∑HFSE) and large-ion lithophile elements (∑LILE). The average rare earth element content (∑REE) of the clays increased from APT to MLT for the east coast rivers but decreased in the west coast rivers. The ∑REE of PIRAC was higher than in upper continental crust (UCC) but lower than in PAAS. The PAAS-normalised REE of PIRAC showed MREE- and HREE- enriched and LREE- depleted pattern, with positive Ce and Eu anomalies. PIRAC is significantly enriched with mafic component dominated material despite Archean-Proterozoic rocks are abundantly wide spread in the peninsular India. The intensity of chemical weathering and, erosion and transportation of easily eroded mafic rocks relative to that of felsic rocks resulted in deposition of mafic component-dominated material at the lower reaches of almost all rivers. Since the composition of PIRAC is significantly different from that of UCC/PAAS and other reference sediments, PIRAC serves as the most suitable reference sediment for the Indian subcontinent.
Keywords:
river sediments
; clay
; peninsular India
; felsic rocks
; rare earth elements
; weathering
1. Introduction
- Physiographic features, rivers and climate of peninsular India
The peninsular India is an inverted triangular landmass, bound by the Western Ghats in the west, the Eastern Ghats (EG) in the east, the Aravali mountain ranges in the northwest and, Vindhyan and Satpura hill ranges in the northeast ([1]; Figure 1). Almost all rivers originate in mountain or hill ranges or high plateaus, drain continental rocks and flow westwards into the Arabian Sea or eastwards into the Bay of Bengal. Although humid, tropical climate dominantly prevails over India, semi-arid conditions in the central and southcentral peninsular India and arid conditions over its northwestern section have been reported [2]. The rivers receive abundant rainfall and runoff, especially during the monsoon months [3]. About 75% of India’s total rainfall comes during the southwest monsoon (June-September) and rest during the northeast monsoon (November to February). The average annual rainfall in India is ~ 1250 mm, but it has great spatial variations, as low as 500 mm in the central part of peninsular India. The Western Ghats (WG) is a prominent geographic feature, stretch at ~ 1,600 km along the west coast of India, with high relief and steep slope in its western flank and gentle slope in its eastern flank. It receives more than 3000 mm rainfall. Numerous west flowing rivers, originating from WG are small and narrow and, transport their sediment-laden water into the Arabian Sea. Besides, the Narmada and Tapti Rivers (major) originate from the Amarkantak plateau, and Satpura range, respectively and flow westwards into the Arabian Sea. The Sabarmati River originates in the Aravalli range, while the Mahi River originates in the Vindhyan range, but both drain into the Arabian Sea. Several east flowing rivers also originate in the western India. For example, the Cauvery, Krishna and Godavari (major rivers) originate in the Western Ghats. The Ponnaiyar, Palar and Pennar Rivers originate in the west (Nandi hill ranges). The Mahanadi, Brahmani, Baitarani and Subarnarekha originate in the highlands or plateaus of Chhattisgarh. The Nagavali and Vamsadhara Rivers originate in the Eastern Ghats. Importantly, all these rivers drain different geological terrains, flow eastwards and bring their sediment load to the Bay of Bengal. The west- and east- flowing rivers account for ~ 23% and 77% of India’s total drainage area, respectively. In other words, the drainage basins of the rivers cover almost the entire landmass of peninsular India, approximately an area of 16,00,000 km2 [1]. The average geochemical composition of sediments in the east and west flowing rivers should ideally serves as reference sediment for the continental crust of the Indian sub-continent.
The rivers draining peninsular India are rain-fed and their sediments are formed from weathering and erosion of continental rocks in their drainage basins. The geochemistry of the sediments is affected by several factors, namely, source rocks, climate, topographic relief, intensity of physical and chemical weathering, loss to hydrosphere, element solubility, size sorting during transportation and deposition and pollution [4,5,6,7,8,9,10,11,12,13,14]. Numerous studies have indicated that the major and trace element composition of the crustal sediments vary widely relative to that of reference sediments, Upper continental crust (UCC; [15,16]) and Post Archean average Australian Shale (PAAS; [17,18]) and, therefore do not reliably indicate crustal composition [19]. On the other hand, rare earth elements (REE) are less fractionated and transferred near quantitatively into the sediments during erosion and sedimentation [20]. Therefore, it was thought that the average REE composition of the sediments is widely accepted to reflect the composition of the UCC and PAAS [21,22]. Subsequent studies, however, indicated REE of the sediments are affected by several factors, including source rocks, grain size, mineralogy and heavy minerals [23,24,25,26,27,28,29,30]. Moreover, the REE composition of the sediments from certain environments can deviate considerably from that of UCC and PAAS. By now, the geochemical compositions of reference sediments from different sub-continents and large rivers of the World are available. These include North American Shale Composite (NASC– [31]), European Shale (ES– [32]), Mud of Queensland (MUQ– [33]), East China Post-Archean Shale (ECPAS– [34]), composition of the Average Suspended Sediments of World Rivers (ASSWR– [35]) and REE composition of World River Average Clay (WRAC– [36]). Fine-grained sediments provide clues on the provenance and composition of the continental crust [37,38,39,40]. Keeping this in view, Sai Babu et al. [29,41] published geochemical composition of the clay fraction (< 4 µm size) of bottom sediments from 14 major and medium rivers along the east coast of India and reported the composition of peninsular India rivers average clay for the Indian sub-continent [42]. Several others [43,44,45,46] also published papers on the geochemistry of river sediments. Numerous rivers drain the western margin of India and discharge their sediment load into Arabian Sea and, there is a lack of data on the geochemical composition of bottom sediments from these rivers. Recently, Sai Babu et al. [30,47,48,49] reported geochemical composition of the clay fraction (< 4 µm size) of bottom sediments from 90 rivers along the west coast of India. There is a need to integrate the geochemical data of the bottom sediments in rivers along the east and west coast of India. In this paper we used the entire data set of Sai Babu et al. [29,30,40,41,47,48,49] to (a) highlight the differences in the geochemical composition of sediments in the rivers that drain similar geological terrains along the east and west coast of India, (b) update the geochemical composition of Peninsular India Rivers Average Clay (PIRAC) based on the sediments from 104 rivers and, (c) suggest PIRAC serves as the most suitable reference sediment for the Indian sub-continent.
2. Geology of the Drainage Basins
The peninsular India comprises three dominant lithological terrains latitudinally, the Archean-Proterozoic terrain (APT) in the south, Deccan Traps volcanic terrain (DVT) followed by Archean-Proterozoic rocks in the centre and, mixed-lithology terrain (MLT) in the north (Figure 1). The Archean-Proterozoic terrain (APT) comprises the Archean (pyroxene granulites and biotite-hornblende gneisses, granodiorite, diorite, and pegmatites, principally granitic intrusives into metamorphic schists) and Precambrian (granites, charnockites, and gneisses) rocks [50]. A thick lateritic cover occurs on basement rocks. The Nagavali and Vamsadhara Rivers drain the Precambrian khondalite (garnet-sillimanite gneiss) of the Eastern Ghats mobile belt. The Godavari and Krishna, central peninsular India rivers largely drain through Deccan Trap volcanic terrain (DVT) in the upper reaches, followed by Archean granites and gneisses, Precambrian charnockite / khondalite rocks and deltaic sediments in the middle and lower reaches [51,52]. The mixed-lithology terrain (MLT) in the north consists of igneous rocks and Late Archaean ore deposits of oxides and sulfides (Singhbhum formations) in the upper reaches, lateritic, yellow, and red soils and deltaic soils in the lower reaches [53]. Precambrian rocks (granites, gneisses, khondalites), and sedimentary sequences ranging from Cretaceous to Holocene are also present in the drainage area. The Mahanadi, Brahmani and Subarnarekha Rivers drain through MLT. The lower basin of the Brahmani River also receives contributions from high-grade metamorphic rocks of the Eastern Ghats Mobile Belt and younger Gondwana sedimentary formations. Consequently, the Brahmani sediments integrate material derived from Archean granitoids, banded iron formations, metasedimentary rocks, and recycled sedimentary units [54]. Bhattacharya et al. [55] reported high ilmenite, rutile, zirconium, and rare earth minerals in its drainage basin. Indeed, the rivers along the west coast of India drain similar geological terrains but transport their sediment loads westwards into the Arabian Sea. One should note that the east flowing rivers are medium and major rivers draining source rocks on a gentle slope, experience various climatic zones and their sediments have long transportation and reworking histories. Whereas, the west flowing rivers are minor and medium rivers (except Narmada and Tapti), experience heavy rainfall and drain a few rock types exhibiting high relief and steep slope and their sediments are expected to represent weathering environment typical of their basins. Here, we have compiled the geochemical composition of the clay fraction (< 4 µm) of sediments deposited at the lower reaches of 104 rivers and compared the differences in their geochemical composition in rivers draining similar geological terrains along the east and west coast of India.
3. Material and Methods
Bottom sediments were collected at the lower reaches of 14 rivers along the east coast of India and 90 rivers along the west coast of India (Figure 1). The clay (< 4 µm size) fraction of the sediment was separated and dried. The geochemical composition of the clay fraction was determined, following standard procedures, detailed in Sai Babu et al. [29,30,41,42,47,48,49]. As the drainage basins of the rivers cover the entire landmass of peninsular India, measuring an area of approximately 16,00,000 km2 [1], we believe that the average geochemical composition of the clay fraction of sediments from these rivers, referred to here as Peninsular India Rivers Average Clay (PIRAC), would serve as a reference sediment for the Indian sub-continent. Using the geochemical data set, published in different papers by Sai Babu et al. [29,30,41,42,47,48,49], we have systematically brought out the differences in average sediment composition of the rivers draining similar geological terrains along the east and west coast of India, compared the geochemical composition of PIRAC with other reference sediments and suggested that PIRAC serves as a reference sediment for the peninsular India.
4. Results
4.1. Distribution of Major Elements
Table 1 shows the major element data in the clay fraction of river sediments draining APT, DVT and MLT. Figure 2 shows the PAAS-normalized average distribution of major elements in the clays from each terrain, in the clays from the rivers of the east and west coast of India and, in the clays from all rivers (PIRAC). In general, mobile elements (Si, Ca, Mg and K) were depleted and immobile elements (Al, Fe, Ti and P) enriched relative to that of PAAS in every terrain. Relatively high SiO2, Al2O3, Fe2O3, MnO, MgO, Na2O and K2O and low TiO2, CaO and P2O5 were characteristic of the clays from the east coast rivers compared to that of west coast rivers (Figure 2). The PAAS normalised PIRAC showed depleted Si, Ca and K, enriched Ti, Fe, Mn, Mg, Na and P and similar Al content. The UCC normalised PIRAC showed enriched Ti, Al, Fe, Mn and P and depleted Si, Ca, MG, Na and K (Figure 2). The average SiO2/Al2O3 ratio of the clays for APT, DVT and MLT was 1.95, 2.54 and 3.29, respectively for the west coast rivers and, 2.72, 3.06 and 2.69 for the east coast rivers. The SiO2/Al2O3 was significantly low for PIRAC (2.29) compared to UCC (4.33) and PAAS (3.32). The average TiO2 content was high in DVT, followed by MLT and least in APT clays (Table 1). The average Al2O3/TiO2 was high for APT (18.59) and significantly low for DVT (12.35) and MLT (12.37). The Al2O3/TiO2 was much lower for PIRAC (14.61) than in UCC (24.29) and PAAS (18.9).
Table 1. Major element content (%) of the clay (<4 μm) fraction of sediments in the rivers of the east coast and west coast of India.
The Chemical index of alteration (CIA) is used to measure the intensity of weathering [56]. The average CIA values of the clays ranged from 69.5 to 86.7 for the east coast rivers and, from 61.78 to 96.6 for the west coast rivers. The ternary diagram A-CN-K (Al2O3–(CaO+Na2O)–K2O) integrated with CIA values (Figure 3A) shows that the clays from the west coast rivers followed a systematic shift from APT to MLT, with APT samples plot close to apex A, DVT samples plot slightly away from apex A and, MLT samples plot much away from apex A and on either side of the line separating strong and intermediate weathering. The clays from the east coast rivers showed strong weathering for APT and strong to intermediate weathering for DVT and MLT. The clays from all rivers (PIRAC) showed samples plot almost parallel to A-CN axis, extending from intermediate weathering to strong weathering. CIA showed positive correlation with Al2O3 and TiO2 and negative correlation with FeO, MgO, K2O and CaO (Figure 4)
The Plagioclase index of alteration (PIA) highlights the depletion of plagioclase, which typically weathers more rapidly than K-feldspar. It is used to quantify the degree of weathering of plagioclase feldspar [57,58,59,60,61]. The PIA values extend from 68 to 94 for the clays from west coast rivers and, from 75 to 90 for the clays from east coast rivers (Table 1). The ternary diagram ((A-K)-C-N), (CaO–Na2O–(Al2O3–K2O) integrated with PIA values (Figure 3B) showed a systematic decrease from APT to DVT and then to MLT for the west coast rivers and the values plot parallel to C-(A-K) axis. For the east coast rivers, high PIA values correspond to APT and MLT and, low values to DVT. PIA values plot parallel to N-(A-K) axis (Figure 3B).
The A-CNK-FM diagram is used to evaluate the weathering trends and position of the sample on the plot reveals geological history during weathering [62,63]. Virtually all samples plot away from apex CNK in this diagram (Figure 3C). The clays from the west coast rivers, especially from APT and DVT plot parallel to A-FM line and more towards apex A. The clays from MLT plot slightly away from A-FM line and more towards PAAS value (Figure 3C). The clays from east coast rivers plot slightly away from A-FM line and more towards PAAS value (Figure 3C).
The Index of chemical variability (ICV) evaluates the maturity of sediments. The ICV values >1 indicate immature sediments and, values <1 indicate mature sediments [6]. The average ICV values for APT, DVT and MLT were 0.98, 1.08 and 1.31, respectively for the west coast rivers (Table 1). It ranges from 0.96 to 1.43 for east coast rivers, with high values corresponding to DVT and low values for MLT. Figure 3D shows the plot of ICV values against CIA indicating the inverse relationship between maturity and weathering intensity in the sediments from all terrains. ICV values increase from APT to MLT suggesting mature and intensely weathered sediments from APT to moderate intensity of weathering for DVT and immature and moderately weathered sediments from MLT samples of the west coast.
4.2. Distribution of Trace Elements
Table 2 shows trace element (TE) data in the clay fraction of sediments in rivers draining APT, DVT and MLT. The average total trace element content (∑TE) was high for APT (2203 µg/g), decreased to 1626 µg/g for DVT and then to 1318 µg/g for MLT for the east coast rivers. It was highest for DVT (1625 µg/g) followed by MLT (1597 µg/g and least for APT (1370 µg/g) for the west coast rivers, (Table 2). The average ∑TE of clays from all rivers (PIRAC: 1515 µm/g) was much lower than in UCC (1650.87 µm/g) and PAAS (1807.1 µm/g). Figure 5 shows the PAAS-normalized average trace element (TE) distribution in the clays from each terrain, in the clays from the east coast and west coast rivers and, in the clays from all rivers (PIRAC). Is showed enriched transition trace element (TTE), slightly depleted high-field strength elements (HFSE) and much depleted large-ion lithophile elements (LILE) for the clays from all terrains of the west coast rivers. The average trace elements distribution was at variance for the clays from the east coast rivers (Figure 5). Among TTE, Cu, Zn and Pb contents were much higher and Sc, V, Cr, Co and Ni were either close to, or slightly enriched relative to PAAS. Among HFSE, Zr, Hf, Ta and Nb were much depleted and Th, Ga and U were slightly depleted or close to PAAS. LILE (Rb, Sr, Ba, Cs) were much lower than in PAAS in all terrains. The PAAS normalized trace elements distribution of PIRAC (Figure 5) showed enriched TTE, slightly depleted HFSE and much depleted LILE. The UCC normalised PIRAC showed enriched TTE and, HFSE and LILE close to UCC (Figure 5).
4.3. Distribution of Rare Earth Elements (REE)
Table 3 shows REE data in the clay fraction of sediments in the rivers draining APT, DVT and MLT. The average total rare earth element (∑REE) content of the clays increased from APT (184 µg/g) to DVT (195.5 µg/g) and then to MLT (231 µg/g) in the east coast rivers but, decreased from APT (180 µg/g) to DVT (162 µg/g) and then to MLT (142.6 µg/g) in the west coast rivers. The average ∑REE content of all rivers (PIRAC: 173.2 µg/g) was higher than in UCC (148.96 µg/g) but lower than in PAAS (208.6 µg/g). Figure 6 shows the PAAS-normalized average REE distribution in the clays from each terrain, in the clays from the east coast and west coast rivers and, in the clays from all rivers (PIRAC). It showed different REE patterns for the clays from APT in the east and west coast rivers (Figure 6). The LREE- depleted and MREE- and HREE- enriched pattern was characteristic of the east coast rivers, while the west coast rivers showed LREE- enriched and MREE- and HREE- depleted pattern. The average REE patterns of the clays in the rivers draining DVT were similar for the east and west coast rivers and, exhibit LREE depleted and MREE and HREE enriched patterns. The average REE pattern for the clays from MLT showed MREE- and HREE-enriched with slightly depleted LREE for the east coast rivers and, LREE depleted and MREE and HREE enriched pattern for the west coast rivers. The PAAS normalised average REE of the clays from all rivers (PIRAC) showed MREE and HREE-enriched and LREE- depleted patterns with positive Ce and Eu anomalies.
5. Discussion
The chemical composition of the river sediments largely depends on the nature of source rocks, intensity of chemical weathering and sorting during transport and deposition. Pollution in the rivers and diagenesis also affect the elemental content of the sediment. The humid, tropical climate dominantly prevails over peninsular India. Heavy monsoonal rainfall under tropical climate favours percolation of rainwater through source rocks causing increase in the intensity of chemical weathering, leading to the alteration of minerals in source rocks. Intense chemical weathering causes quick solution of mobile elements like Ca, Mg, Na and K and enrichment of immobile elements (Al, Fe and Ti) in the sediments.
5.1. Major Elements and Intensity of Weathering
Positive correlation of CIA with Al2O3 and TiO2 and negative correlation of CIA with Fe2O3, MgO, K2O and CaO (Figure 4) suggests that the intensity of weathering played a major role in the depletion of mobile elements and enrichment of immobile elements in the clays. Low and variable SiO2/Al2O3 of our samples compared to that in UCC and PAAS (Table 1) also suggest varied intensity of chemical weathering from south to north in the river clays of Peninsular India. Much lower average SiO2/Al2O3 for the clays from APT (1.95) and DVT (2.54) of the west coast rivers resembles laterite soils (1.33 to 2.22; [64]), suggesting advanced chemical weathering or lateritic weathering. The average SiO2/Al2O3 for APT (2.72) and MLT (2.69) clays of the east coast rivers also suggest intense or strong chemical weathering. Relatively high SiO2/Al2O3 for DVT clays (3.06) from the east coast rivers and, MLT clays (3.29) from the west coast rivers (but lower than in UCC and PAAS) suggest non-lateritic, moderate intensity of chemical weathering. The low average SiO2/Al2O3 of PIRAC (2.29) compared to UCC and PAAS suggest that the continental crust of peninsular India, in general, experienced advanced to intense chemical weathering. The intensity of chemical weathering is well illustrated in (A-CN-K), and ((A-K)-C-N) ternary diagrams (Figure 3A,B). For example, plotting of CIA and PIA values close to apex A for the clays from the west coast rivers draining APT and DVT suggest strong chemical weathering and high degree of plagioclase weathering. A gradual shift in the intensity of weathering is also displayed in these diagrams, where CIA and PIA values plot away, and much away from apex A both in the west and east flowing rivers, indicating lateritic to strong weathering in APT, strong to intermediate weathering in DVT and intermediate weathering in MLT. The A-CNK-FM diagrams (Figure 3C) also display the trend in the intensity of weathering. For example, plotting of all samples away from apex CNK indicates that the mobile elements (Ca, Na and K) are leached away suggesting advanced chemical weathering. The clays from APT and DVT plot parallel to A-FM line and more towards apex A in this diagram (Figure 3C), implying enrichment of Al and to some extent Fe and/or Mg. This indicates relative enrichment of aluminous (gibbsite, kaolinite) and ferruginous (hematite and goethite) minerals in highly weathered soils like laterites. The presence of goethite and gibbsite in the APT clays from the west coast rivers also argue in favour of lateritic weathering [47]. The clays from MLT plot slightly away from A-FM line and more towards PAAS value, indicating loss of Fe and/or Mg in the soils. Relatively high SiO2, TiO2, Fe2O3, MgO, MnO and Na2O and, low CaO and P2O5 in the clays from east coast rivers compared to those of west coast rivers upon PAAS normalisation suggest prolonged chemical weathering on a gentle slope and long transportation history lead to the solution of plagioclase feldspar and formation of mature sediments rich in quartz and oxides of Fe, Mn and Ti.
5.2. Controls of Source Rocks and Weathering in Trace Elements Distribution
Trace elements chemistry is controlled largely by source rocks and intensity of weathering [65]. Trace elements with high solubilities are fractionated rapidly during sedimentary processing and, elements with low solubilities are incorporated in secondary minerals such as clays or oxy-hydroxides [19,66,67]. Trace elements usually associate with fine-grained clays and heavy minerals in the sediments. High average ∑TE corresponds to the clays from APT and DVT terrains of the east coast of India. Here, the average ∑TE values are higher than in PAAS, suggesting trace elements contribution from different sources. High ∑TE is largely due to very high Cu, Zn and Pb in all terrains (Figure 5). They are pollution associated elements usually adsorb onto clay minerals and oxyhydroxides of Fe and Mn. The ores of Fe–Mn and Cr oxides and Cu, Zn and Pb sulphides have been reported in the Singhbhum craton [68,69,70], corresponding to the mixed lithology terrain (MLT). In view of the above, Saibabu et al. [41] interpreted that the high Cu, Zn and Pb in the clays of the east coast rivers is due to anthropogenic pollution in southeast Indian rivers and, erosion of sulfide minerals and ore deposits from the hinterland in the northeast Indian rivers.
Depleted Zr, Hf, Ta and Nb relative to PAAS is also characteristic of the clays from east coast rivers draining all terrains (Figure 5). The Zr, Hf, Ta and Nb are high-field strength elements (HFSE), usually associate with heavy minerals, which largely confine to the coarser fractions of the sediment. The sediments of the east coast rivers experienced long transportation and recycling history. The depleted Zr, HF, Ta and Nb in the east coast rivers may be because, heavy minerals containing these trace metals have settled much before in the river course, rather than transported to and deposited at the lower reaches of the rivers. The slightly lower or similar values of Th, Ga and U as that of PAAS may be due to the adsorbtion of Th and Ga on to clays and U contents influenced by ore material [71,72].
On the other hand, average ∑TE increased from APT to DVT and then MLT in the west coast rivers (Table 2). Here, increasing ∑TE corresponds to decreasing CIA. In general, the Archean- Proterozoic rocks contain relatively low trace element and high REE content compared to the Deccan Trap volcanic rocks. Therefore, increasing ∑TE from APT to DVT may be related to source rocks and intensity of weathering. Fe and Ti minerals such as magnetite, rutile and ilmenite (abundant in Deccan Traps) may have contributed high trace element content in DVT. Heavy rainfall on the steep slopes of the Western Ghats may have favoured release of trace elements from the parent rocks and are carried away quickly before being incorporated in clay minerals. Relatively high ∑TE, low CIA values and high Index of chemical variability (ICV) for MLT clays of the west coast suggest that these are immature clays experienced moderate weathering. Indeed, the rocks from MLT are volumetrically Deccan Traps, despite Proterozoic rocks and alluvial sediments are exposed in the drainage basins of the rivers (Figure 1). Semi-arid climate prevails over this region. High ∑TE content in MLT could be due to the dominance of Deccan Trap material, which weather far more easily and quickly than the granitic and gneissic rocks. The large-ion lithophile elements (Rb, Sr, Ba and Cs) are much depleted in the clays from all terrains of the east and west coast rivers, suggesting leaching of these elements to solution because of the intense chemical weathering. PAAS normalised trace element distribution of PIRAC showed high TTE and low HFSE and LILE, indicating dominance of mafic component material in the sediments.
5.3. Controls of Rare Earth Elements
Our studies on the ∑REE of river sediments in major, medium and minor rivers of the east and west coast of India indicates that ∑REE is not dependent on the size of the drainage basin or the amount of detrital material supplied by rivers but depends on mineral composition of the clays [30,41]. REE from various sources contribution from heavy minerals, (monazite, apatite), ore deposits, REE associated with mica and K-feldspar, REE associated with clay mineral lattice, adsorbed onto secondary weathering products such as clays and Fe-Mn oxy hydroxides, phosphate and lateritic debris have been proposed [30,41,48].
Contrasting distribution of ∑REE and ∑TE (high ∑REE coinciding with low ∑TE) also suggests ∑REE is related to the mineral composition in the terrain. Near similar average ∑REE values for the clays from APT in the rivers of the east (184 µg/g) and west coast (180 µg/g) (Table 3) suggest mineral composition of the terrain is an important factor determining ∑REE. As we move from south to north along the east coast of India, the rivers draining DVT consists of dominant Deccan Traps followed by felsic granites and high-grade metamorphic rocks, khondalites (garnet-sillimanite gneiss) of the Eastern Ghat mobile belt (rich in Fe-Mn ores). The rivers draining MLT consists of Archean ore deposits of Fe-Mn and Cr oxides and Cu, Zn and Pb sulfides followed by Precambrian felsic granites and charnockites. The increasing ƩREE in DVT and MLT could be due to increasing REE contribution from felsic granites and Fe-Mn oxide ores and sulfide ores [41]. On the west coast, high ƩREE correlate with Th and P2O5 in the clays from APT, indicating heavy minerals (monazite and apatite) contributed REE [30,48]. On the other hand, strong correlation of ƩREEs with Al2O3 and Fe2O3 and moderate correlation with MnO, K2O, P2O5 and TiO2 in the clays from DVT indicates that most of the REE reside in the clay mineral lattice while a small part is adsorbed onto the surfaces of secondary weathering products such as Mn–Fe oxy-hydroxides and phosphate minerals [48].
PAAS normalised REE patterns: The MREE-enrichment, characteristic of clays from all terrains (Figure 6), has been attributed to the influence of (a) intense chemical weathering on source rocks in a tropical climate [73], (b) weathering of phosphate minerals in the drainage basin [41,74], and (c) analysis of clay fraction, which usually show high MREE and HREE enrichment compared to the bulk sediment [36].
The REE patterns of the clays from Archean-Proterozoic terrain (APT) showed LREE enrichment over HREE in the west coast rivers and, HREE enrichment over LREE in the east coast rivers (Figure 6). Advanced to intense chemical weathering is characteristic of the clays from APT. REEs fractionate during chemical weathering. Since LREE are less mobile than HREE, more LREE are retained with the weathering residue, and HREE is carried away as complexions. The laterite profiles indeed exhibit stronger REE fractionation with LREE-enrichment over HREE [75]. The hinterland rocks are dominantly felsic in the southern peninsular India, which contribute to the LREE enriched and HREE-depleted REE patterns. Therefore, LREE-enriched pattern in the west coast rivers draining APT is in agreement with the source rocks and lateritic weathering.
The HREE enrichment over LREE in the clays from APT in the east coast rivers is an average of the clays from six rivers. The near equal proportions of LREE and HREE in the clays of Cauvery and Pennar rivers may be due to admixture of clays from different sources upon long transportation. It is likely that the weathering products from mafic rocks (basic and ultrabasic intrusions and garnetiferous gneisses) are admixed with those from the primary felsic rocks, resulting in flat REE pattern. The Ponnaiyar and Palar rivers are small and drain mono (felsic) lithology rocks and therefore show LREE-enriched and HREE depleted pattern. The Nagavali and Vamsadhara Rivers drain khondalites (garnet-sillimanite gneiss) of the Eastern Ghats mobile belt that contain Fe-Mn ores. HREE enrichment is characteristic of both Fe-Mn ores and garnets [76,77]. The LREE depleted and HREE enriched REE pattern is an average pattern of six rivers, implying an overall enrichment of mafic component in these clays.
The average clays from DVT exhibit HREE-enriched and LREE depleted REE pattern with positive Ce and Eu anomalies, both in the east and west coast rivers (Figure 6). The LREE-depleted and HREE-enriched pattern with positive Eu anomaly has been reported in the sediments derived from volcanic rocks [22,36,78]. However, positive Ce anomaly is not a characteristic of volcanic rocks. In other words, DVT clays contain high proportions of mafic component -dominated material derived from Deccan Traps with some material from felsic granites.
The average clay from MLT exhibits slightly enriched HREE over LREE in the east coast rivers and, MREE and HREE-enriched and LREE depleted pattern in the west coast rivers. The clays from Archean ore deposits (Fe, Mn and Cr oxides) are admixed with Precambrian granitic metamorphic rocks in the east coast resulting in a mixed REE pattern with slight enrichment of HREE over LREE. On the other hand, Deccan Trap dominated material is dominant in the clays from MLT of the west coast rivers, resulting HREE- enriched and LREE- depleted REE pattern.
The PAAS normalised REE of PIRAC is characterized by MREE- and HREE enriched and LREE-depleted pattern, with Ce and Eu anomaly (Figure 6). Since PIRAC composition is an average composition of clays from 104 rivers draining peninsular India, it is indeed an admixture of dominant mafic component material with some contribution from felsic source material. The dominance of mafic/felsic component in the sediments has also been verified from standard plots and element-to-element ratios. For example, the plot of Al2O3 and TiO2 values in the clays of all rivers on the binary diagram of Bhatia [79] shows that most of the samples fall in the intermediate region between felsic and mafic provenance, with a few samples falling in the felsic provenance (Figure 7A). Similarly, the plot of TiO2, MgO and Fe2O3 values of our samples in the TiO2 versus Fe2O3 + MgO diagram of Bhatia [79] indicates that the samples from all terrains plot more towards basalts, suggesting dominance of the mafic component (Figure 7B). Felsic rocks are enriched with Th, whereas the basic igneous rocks are enriched with Sc. The plot of Th and Sc from the clays of all rivers on the Th vs. Sc diagram of Cullers [80] (Figure 7C) indicates a few samples plot in the felsic region and all other samples extend from intermediate region between felsic and mafic to mafic region. Similarly, the samples extend from granodiorite to basaltic region in the Th/Sc vs. Sc diagram (Figure 7D). Sai Babu et al [29,47,49] showed several ratio-ratio plots of trace elements to understand the dominance of mafic or felsic component in the sediments and reported dominance of mafic component in the large number of river samples, both from the east and west coast of India.
Ternary diagrams using trace metals are also helpful to distinguish the dominant trend of the source components in the sediments. In the La-Th-Sc diagram of Bhatia and Crook [81] the samples plot from granodiorite to more towards basalts (Figure 8A). Figure 8B shows the plot of V, Ni and Thx10 data in the ternary diagram [82]. All samples plot in the region between felsic and mafic rocks and more towards mafic rocks. Figure 8C shows the plot of Zr, Cr and Ga values in the ternary diagram [83]. All samples plot parallel to the Cr-Zr axis and extend from sedimentary rocks to Basic rocks, with few samples extending towards Cr. Most of the samples are clustered in the region of basic rocks, implying dominance of mafic material. The dominance of mafic component in the sediments from Indian rivers has been reported earlier [29,42,45,49,84] and, interpreted that that the crystalline felsic components weathered from granitic terrain deposited more closely to the source and finer mafic component, easily weathered from source rocks is transported farther from source and settled at the lower reaches of the rivers.
5.4. The Geochemical Composition of PIRAC
The PAAS normalised major, trace and rare earth element distribution of PIRAC shows low Si, Ca and K, high Fe, Mn, Mg, Na, Ti and P and near similar Al content (Figure 2), high transition trace elements (TTE), low high field strength elements (HFSE) and large-ion lithophile elements (LILE) (Figure 5) and, MREE- and HREE-enriched and LREE depleted pattern with positive Ce and Eu anomalies (Figure 6). The PAAS normalised REE pattern of PIRAC is different from that of upper continental crust (UCC) [15,16], East China Post Archean Shale (ECPAS) [34], World Rivers Average Clay (WRAC) [36], which show LREE-enriched and HREE-depleted REE pattern (Figure 9A). The REE pattern of PIRAC resembles that of European shale (ES) [32] and Mud of Queensland (MUQ) [33] and North American Shale Composite (NASC) [31] except in the absence of significant Ce anomaly in ES and MUQ (Figure 9A). The sediments from the large rivers of the World result from efficient mixing of various provenance components from the upper crust [37,39,85]. The PAAS normalised REE pattern of the sediments from World’s large tropical rivers shows LREE enriched and MREE and HREE depleted pattern, similar to that of the UCC but different from PIRAC (Figure 9B). Although the Archaean and Precambrian metamorphic crust is widely scattered and voluminously abundant in the drainage basins of several rivers, the MREE and HREE-enriched and LREE depleted REE pattern of PIRAC suggest dominance of mafic component dominated material at the lower reaches of several rivers. It implies the lithology (vulnerability for easy erosion), intensity of weathering and size sorting during transportation controlled the geochemical characteristic of the sediments deposited at the lower reaches of rivers. Indeed, the geochemical composition of PIRAC significantly different from other reference sediments and will serve as the most suitable reference sediment for the sediments of Peninsular India.
6. Conclusions
The rivers of peninsular India originate in the mountain / hill ranges or high plateaus, drain continental rocks and bring sediment load either to the Bay of Bengal or Arabian Sea. The geochemical compositions of the clay fraction of sediments from 104 rivers along the east and west coast of India were examined to understand their regional variations and peninsular India as a whole (PIRAC).
- Mobile elements are depleted and immobile elements are enriched relative to the PAAS in the clays of all rivers. The average clays from the east coast rivers showed higher Si, Al, Fe, Mn, Mg, Na and K and lower Ti, Ca and P than those in the west coast rivers.
- Trace elements showed higher transition trace elements, lower high-field strength elements (∑HFSE) and large-ion lithophile elements (∑LILE), relative to PAAS. Elements such as Zr, Hf. Ta and Nb are much lower in the east coast rivers than those in the west coast.
- The average total REE content is much higher in the east coast rivers than in the west coast rivers.
- The PAAS normalised REE of PIRAC showed LREE- depleted, MREE- and HREE-enriched pattern with positive Ce and Eu anomalies.
- PIRAC is more mafic in composition. It is also verified from the binary and ternary diagrams using major and trace elements.
- The intensity of chemical weathering and, erosion and transportation of easily eroded mafic rocks relative to that of felsic rocks resulted in deposition of mafic component-dominated material at the lower reaches of almost all rivers.
- The composition of PIRAC is significantly different from UCC/PAAS and other reference sediments.
- The geochemical composition of PIRAC serves as the most suitable reference sediment for the peninsular India.
Author Contributions
Conceptualization, V.P.R. and S.S.B.; methodology, S.S.B., V.P.R. and M.R.M.; software, S.S.B. and M.R.M.; validation, S.S.B., V.P.R. and M.R.M.; formal analysis, S.S.B., M.R.M. and V.P.R.; investigation, S.S.B., V.P.R. and M.R.M.; resources, V.P.R. S.S.B. and M.R.M.; data curation, S.S.B., V.P.R. and M.R.M.; writing—original draft preparation, V.P.R. S.S.B.and M.R.M.; writing-review and editing, V.P.R., S.S.B.and M.R.M.; visualization, V.P.R., S.S.B. and M.R.M.; supervision, V.P.R. S.S.B.and M.R.M. All authors have read and agreed to the published version of the manuscript.
Funding
This work was carried out under the project “INSA-Senior Scientist funded by the Indian National Science Academy, New Delhi”.
Data Availability Statement
The research data utilized in this study is given in the form of tables.
Acknowledgments
The authors thank the Vice-chancellor, VFSTR, Vignan’s University and Director CSIR-NGRI for their encouragement. This work was carried out for the project awarded to VP Rao under the ‘INSA-Senior Scientist’ program by the Indian National Science Academy, New Delhi and, during the faculty position of Sk. Sai Babu at K.S.R.M. College of Engineering. We acknowledge the organizations for their financial support.
Conflicts of Interest
The authors declare no conflict of interest.
References
- Alam, S.; Sama, A.K.; Prudhvi Raju, K.N. Is ‘Peninsular India’ a geographic expression? Ann. Natl. Assoc. Geogr. India 2022, 42, 198–206. [Google Scholar] [CrossRef]
- Kumar, Y. Climatic conditions of India. Int. J. Lead. Res. Publ. 2025, 6, IJLRP25011238. [Google Scholar]
- Dey, P.; Mujumdar, P.P. On the uniformity of rainfall distribution over India. J. Hydrol. 2019, 578, 124017. [Google Scholar] [CrossRef]
- Pettijohn, F.J.; Potter, P.E.; Siever, R. Sand and Sandstone; Springer-Verlag: New York, NY, USA, 1972. [Google Scholar]
- McLennan, S.M.; Hemming, S.; McDaniel, D.K.; Hanson, G.N. Geochemical approaches to sedimentation, provenance, and tectonics. In Processes Controlling the Composition of Clastic Sediments; Johnsson, M.J., Basu, A., Eds.; Geological Society of America Special Paper 284; GSA: Boulder, CO, USA, 1993; pp. 21–40. [Google Scholar]
- Cox, R.; Lowe, D.R.; Cullers, R.L. The influence of sediment recycling and basement composition on evolution of mudrock chemistry in the southwestern United States. Geochim. Cosmochim. Acta 1995, 59, 2919–2940. [Google Scholar] [CrossRef]
- Borges, J.B.; Huh, Y.; Moon, S.; Noh, H. Provenance and weathering control on river bed sediments of the eastern Tibetan Plateau and the Russian Far East. Chem. Geol. 2008, 254, 52–72. [Google Scholar] [CrossRef]
- Garzanti, E.; Andó, S.; France-Lanord, C.; Censi, P.; Vignola, P.; Galy, V.; Lupker, M. Mineralogical and chemical variability of fluvial sediments 2. Suspended-load silt (Ganga–Brahmaputra, Bangladesh). Earth Planet. Sci. Lett. 2011, 302, 107–120. [Google Scholar] [CrossRef]
- Liu, Z.; Colin, C.; Huang, W.; Le, K.P.; Tong, S.; Chen, Z.; Trentesaux, A. Climatic and tectonic controls on weathering in south China and Indochina Peninsula: Clay mineralogical and geochemical investigations from the Pearl, Red, and Mekong drainage basins. Geochem. Geophys. Geosyst. 2007, 8, Q05005. [Google Scholar] [CrossRef]
- Liu, Z.; Wang, H.; Hantoro, S.W.; Sathiamurthy, E.; Colin, C.; Zhao, Y.; Li, J. Climatic and tectonic controls on chemical weathering in tropical Southeast Asia (Malay Peninsula, Borneo, and Sumatra). Chem. Geol. 2011, 291, 1–12. [Google Scholar] [CrossRef]
- Babechuk, M.G.; Widdowson, M.; Kamber, B.S. Quantifying chemical weathering intensity and trace element release from two contrasting basalt profiles, Deccan Traps, India. Chem. Geol. 2014, 363, 56–75. [Google Scholar] [CrossRef]
- Absar, N.; Sreenivas, B. Petrology and geochemistry of greywackes of the 1.6 Ga Middle Aravalli Supergroup, northwest India: Evidence for active margin processes. Int. Geol. Rev. 2015, 57, 134–158. [Google Scholar] [CrossRef]
- Rashid, S.A.; Ahmad, S.; Singh, S.K.; Absar, N. Elemental and Sr–Nd isotopic geochemistry of Mesoproterozoic sedimentary successions from NE Lesser Himalaya, northern India: Implications for Proterozoic climate and tectonics. J. Asian Earth Sci. 2018, 163, 235–248. [Google Scholar] [CrossRef]
- Babechuk, M.; Fedo, C. Analysis of chemical weathering trends across three compositional dimensions: Applications to modern and ancient mafic-rock weathering profiles. Can. J. Earth Sci. 2022. [Google Scholar] [CrossRef]
- Taylor, S.R.; McLennan, S.M. Composition and evolution of the continental crust: Constraints from sedimentary rocks. In Encyclopedia of Physical Science and Technology, 3rd ed.; Meyers, R.A., Ed.; Academic Press: San Diego, CA, USA, 2001; pp. 697–719. [Google Scholar]
- Rudnick, R.L.; Gao, S. Composition of the continental crust. In Treatise on Geochemistry, Vol. 3: The Crust; Rudnick, R.L., Ed.; Elsevier-Pergamon: Oxford, UK, 2003; pp. 1–64. [Google Scholar]
- Nance, W.B.; Taylor, S.R. Rare earth element patterns and crustal evolution-I. Australian post-Archean sedimentary rocks. Geochim. Cosmochim. Acta 1976, 40, 1539–1551. [Google Scholar] [CrossRef]
- Pourmand, A.; Dauphas, N.; Ireland, T.J. A novel extraction chromatography and MC-ICP-MS technique for rapid analysis of REE, Sc and Y: Revising CI-chondrite and Post-Archean Australian Shale (PAAS) abundances. Chem. Geol. 2012, 291, 38–54. [Google Scholar] [CrossRef]
- Taylor, S.R.; McLennan, S.M. The Continental Crust: Its Composition and Evolution; Blackwell Scientific Publications: Palo Alto, CA, USA; Malden, MA, USA, 1985; p. 312. [Google Scholar]
- McLennan, S.M. Rare earth elements in sedimentary rocks: Influence of provenance and sedimentary processes. Rev. Mineral. 1989, 21, 169–200. [Google Scholar] [CrossRef]
- Martins, M.V.A.; Rocha, F. Rare earth elements as fingerprints of differentiated sediment sources in the Ria de Aveiro (Portugal). J. Sediment. Environ. 2016, 1, 17–42. [Google Scholar] [CrossRef]
- Goldstein, S.J.; Jacobsen, S.B. Rare earth elements in river waters. Earth Planet. Sci. Lett. 1988, 89, 35–47. [Google Scholar] [CrossRef]
- Elderfield, H.; Upstill-Goddard, R.; Sholkovitz, E.R. The rare earth elements in rivers, estuaries, and coastal seas and their significance to the composition of ocean waters. Geochim. Cosmochim. Acta 1990, 54, 971–991. [Google Scholar] [CrossRef]
- Sharma, A.; Rajamani, V. Weathering of gneissic rocks in the upper reaches ofCauvery River, South India: Implications to neo-tectonics of the region. Chem. Geol. 2000, 166, 203–223. [Google Scholar] [CrossRef]
- Yang, S.Y.; Jung, H.S.; Choi, M.S.; Li, C.X. The rare earth element compositions of the Changjiang (Yangtze) and Huanghe (Yellow) river sediments. Earth Planet. Sci. Lett. 2002, 201, 407–419. [Google Scholar] [CrossRef]
- Shynu, R.; Rao, V.P.; Kessarkar, P.M.; Rao, T.G. Rare earth elements in suspended and bottom sediments of the Mandovi estuary, central west coast of India: Influence of mining. Estuar. Coast. Shelf Sci. 2011, 94, 355–368. [Google Scholar] [CrossRef]
- Cavalcante, F.; Belviso, C.; Piccarreta, G.; Fiore, S. Grain-size control on the rare earth elements distribution in the late diagenesis of Cretaceous shales from the southern Apennines (Italy). J. Chem. 2014, 2014, 841747. [Google Scholar] [CrossRef]
- Su, N.; Yang, S.; Guo, Y.; Yue, W.; Wang, K.; Yin, P.; Huang, K. Revisit of REE fractionation during chemical weathering and river sediment transport. Geochem. Geophys. Geosyst. 2017, 18, 935–955. [Google Scholar] [CrossRef]
- Babu, S.S.; Ramana, R.V.; Rao, V.P.; Ram Mohan, M.; Sawant, S.; Satyasree, N.; Keshav Krishna, A. Rare earth elements of sediments in rivers and estuaries of the east coast of India. Curr. Sci. 2021, 120, 519–537. [Google Scholar] [CrossRef]
- Babu, S.S.; Rao, V.P.; Rammohan, M. Controls on the distribution and fractionation of rare earth elements in recent sediments from the rivers along the west coast of India. Environ. Earth Sci. 2024, 83, 547. [Google Scholar] [CrossRef]
- Gromet, L.P.; Dymek, R.F.; Haskin, L.A.; Korotev, R.L. The “North American shale composite”: Its compilation, major and trace element characteristics. Geochim. Cosmochim. Acta 1984, 48, 2469–2482. [Google Scholar] [CrossRef]
- Haskin, L.A.; Haskin, M.A. Rare earths in European shales: A redetermination. Science 1966, 154, 507–509. [Google Scholar] [CrossRef]
- Kamber, B.S.; Greig, A.; Collerson, K.D. A new estimate for the composition of weathered young upper continental crust from alluvial sediments, Queensland, Australia. Geochim. Cosmochim. Acta 2005, 69, 1041–1058. [Google Scholar] [CrossRef]
- Gao, S.; Luo, T.C.; Zhang, B.R.; Zhang, H.F.; Han, Y.W.; Hu, Y.K.; Zhao, Z.D. Chemical composition of the continental crust as revealed by studies in East China. Geochim. Cosmochim. Acta 1998, 62, 1959–1975. [Google Scholar] [CrossRef]
- Viers, J.; Dupré, B.; Gaillardet, J. Chemical composition of suspended sediments in World Rivers: New insights from a new database. Sci. Total Environ. 2009, 407, 853–868. [Google Scholar] [CrossRef] [PubMed]
- Bayon, G.; Toucanne, S.; Skonieczny, C.; André, L.; Bermell, S.; Cheron, S.; Dennielou, B.; Etoubleau, J.; Freslon, N.; Gauchery, T.; Germain, Y.; Jorry, S.J.; Ménot, G.; Monin, L.; Ponzevera, E.; Rouget, M.L.; Tachikawa, K.; Barrat, J.A. Rare earth elements and neodymium isotopes in world river sediments revisited. Geochim. Cosmochim. Acta 2015, 170, 17–38. [Google Scholar] [CrossRef]
- Cullers, R.L.; Chaudhury, S.; Kilbane, N.; Koch, R. Rare earths in size fractions and sedimentary rocks of Pennysylvanian-Permian age from the mid-continent of the USA. Geochim. Cosmochim. Acta 1979, 43, 1285–1301. [Google Scholar] [CrossRef]
- McLennan, S.M.; Hemming, S.; McDaniel, D.K.; Hanson, G.N. Geochemical approaches to sedimentation, provenance and tectonics. In Processes Controlling the Composition of Clastic Sediments; Johnsson, J.M., Basu, A., Eds.; Geological Society of America: Boulder, CO, USA, 1993; Volume 284, pp. 1–21. [Google Scholar]
- McLennan, S.M. Relationships between the trace element composition of sedimentary rocks and upper continental crust. Geochem. Geophys. Geosyst. 2001, 2, 2000GC000109. [Google Scholar] [CrossRef]
- Condie, K.C. Earth as an Evolving Planetary System; Elsevier Academic Press: Amsterdam, The Netherlands, 2005; p. 447 pp. [Google Scholar]
- Babu, S.S.; Ramana, R.V.; Rao, V.P.; Ram Mohan, M.; Satyasree, N. Mineralogy and geochemistry of the sediments in rivers along the east coast of India: Inferences on weathering and provenance. J. Earth Syst. Sci. 2021, 130, 60. [Google Scholar] [CrossRef]
- Babu, S.S.; Ramana, R.V.; Rao, V.P.; Ram Mohan, M.; Krishna, A.K.; Sawant, S.; Satyasree, N. Composition of the Peninsular India Rivers Average Clay (PIRAC): A reference sediment composition for the upper crust from Peninsular India. J. Earth Syst. Sci. 2020, 129, 39. [Google Scholar] [CrossRef]
- Singh, P.; Rajamani, V. REE geochemistry of recent clastic sediments from the Kaveri Flood plains, southern India: Implication to source area weathering and sedimentary processes. Geochim. Cosmochim. Acta 2001, 65, 3093–3108. [Google Scholar] [CrossRef]
- Sensarma, S.; Rajamani, V.; Tripathi, J.K. Petrography and geochemical characteristics of the sediments of the small River Hemavati, southern India: Implications for provenance and weathering processes. Sediment. Geol. 2008, 205, 111–125. [Google Scholar] [CrossRef]
- Rajamani, V.; Tripathi, J.K.; Malviya, V.P. Weathering of lower crustal rocks in the Kaveri River catchment, southern India: Implications to sediment geochemistry. Chem. Geol. 2009, 265, 410–419. [Google Scholar] [CrossRef]
- Sharma, A.; Sensarma, S.; Kumar, K.; Khanna, P.P.; Saini, N.K. Mineralogy and geochemistry of the Mahi River sediments in tectonically active western India: Implications for Deccan large igneous province source, weathering and mobility of elements in a semi-arid climate. Geochim. Cosmochim. Acta 2013, 104, 63–83. [Google Scholar] [CrossRef]
- Babu, S.S.; Prajith, A.; Rao, V.P.; Rammohan, M.; Ramana, R.V.; Satyasree, N.S. Composition of river sediments from Kerala, southwest India: Inferences on lateritic weathering. J. Earth Syst. Sci. 2023, 132, 150. [Google Scholar] [CrossRef]
- Babu, S.S.; Prajith, A.; Rao, V.P.; Rammohan, M.; Ramana, R.V.; Satyasree, N. Sources of rare earths and prospects for a viable REE deposit in river sediments of Kerala, Southwest India. Curr. Sci. 2024, 126, 345–359. [Google Scholar] [CrossRef]
- Babu, S.S.; Purnachandra Rao, V.; Mohan, M.R. Clay Mineralogy and Major and Trace Element Geochemistry of Recent Sediments in Rivers Along the West Coast of India: Implications for Provenance and Chemical Weathering. Minerals 2025, 15, 43. [Google Scholar] [CrossRef]
- Krishnan, M.S. Geology of India and Burma, 6th ed.; CBS Publishers: Delhi, India, 1982. [Google Scholar]
- Ramesh, R.; Subramanian, V.; Van Grieken, R.; Van’t Dack, L. The elemental chemistry of sediments in the Krishna River basin, India. Chem. Geol. 1989, 74, 331–341. [Google Scholar] [CrossRef]
- Subramanian, V. The sediment load of Indian rivers. An update. In Erosion and Sediment Yield: Global and Regional Perspectives; IAHS Publication No. 236; Walling, D.E., Webb, B.W., Eds.; International Association of Hydrological Sciences (IAHS): Wallingford, UK, 1996; pp. 183–190. [Google Scholar]
- Ray, S.B.; Mohanti, M.; Somayajulu, B.L.K. Suspended matter, major cations and dissolved silicon in the estuarine waters of the Mahanadi River, India. J. Hydrol. 1984, 69, 183–196. [Google Scholar] [CrossRef]
- Dash, N.; Nayak, B.; Mohapatra, B.K. The supergene Mn-minerals in Gangpur Group, Eastern India and their genesis. J. Geol. Soc. India 2020, 96, 337–348. [Google Scholar] [CrossRef]
- Bhattacharya, S.; Chaudhary, A.K.; Basei, M. Original nature and source of khondalites in the Eastern Ghats Province, India. In Palaeoproterozoic of India; Mazumder, R., Saha, D., Eds.; Geological Society, London, Special Publications; Geological Society of London: London, UK, 2012; Volume 365, pp. 147–159. [Google Scholar]
- Nesbitt, H.W.; Young, G.M. Prediction of some weathering trends of plutonic and volcanic rocks based on thermodynamic and kinetic considerations. Geochim. Cosmochim. Acta 1984, 48, 1523–1534. [Google Scholar] [CrossRef]
- Nesbitt, H.W.; Young, G.M. Early Proterozoic climates and plate motions inferred from major element chemistry of lutites. Nature 1982, 299, 715–717. [Google Scholar] [CrossRef]
- Fedo, C.M.; Nesbitt, H.W.; Young, G.M. Unravelling the effects of potassium metasomatism in sedimentary rocks and paleosols, with implications for paleoweathering conditions and provenance. Geology 1995, 23, 921–924. [Google Scholar]
- Fedo, C.M.; Eriksson, K.A.; Krogstad, E.J. Geochemistry of shales from the Archaean (~3.0 Ga) Buhwa Greenstone Belt, Zimbabwe: Implications for provenance and source-area weathering. Geochim. Cosmochim. Acta 1996, 60, 1751–1763. [Google Scholar] [CrossRef]
- Hassan, S.; Ishiga, H.; Roser, B.P.; Dozen, K.; Naka, T. Geochemistry of Permian–Triassic shales in the Salt Range, Pakistan: Implications for provenance and tectonism at the Gondwana margin. Chem. Geol. 1999, 158, 293–314. [Google Scholar] [CrossRef]
- Hofmann, A.; Bolhar, R.; Dirks, P.; Jelsma, H. The geochemistry of Archaean shales derived from mafic volcanic sequences, Belingwe Greenstone Belt, Zimbabwe: Provenance, source area unroofing and submarine versus subaerial weathering. Geochim. Cosmochim. Acta 2003, 67, 421–440. [Google Scholar] [CrossRef]
- Nesbitt, H.W.; Young, G.M. Formation and diagenesis of weathering profiles. J. Geol. 1989, 97, 129–147. [Google Scholar] [CrossRef]
- Nesbitt, H.W.; Young, G.M.; McLennan, S.M.; Keays, R.R. Effects of chemical weathering and sorting on the petrogenesis of siliciclastic sediments, with implications for provenance studies. J. Geol. 1996, 104, 525–542. [Google Scholar] [CrossRef]
- Narayanaswamy, S. Geological Significance of Laterites of Kerala with Special Reference to Laterite Gold Occurrence in Nilambur Valley. In Earth System Science and Natural Resource Management; Ravindra Kumar, G.R., Ed.; Centre for Earth Science Studies (CESS): Thiruvananthapuram, India, 2004. [Google Scholar]
- Zhao, J.; Zheng, Y.F. The intensity of chemical weathering: Geochemical constraints from marine detrital sediments of Triassic age in South China. Chem. Geol. 2015, 391, 111–122. [Google Scholar] [CrossRef]
- Roddaz, M.; Viers, J.; Brusset, S.; Baby, P.; Boucayrand, C.; Hérail, G. Controls on weathering and provenance in the Amazonian foreland basin: Insights from major and trace element geochemistry of Northern Bolivian Amazon sediments. Am. J. Sci. 2006, 306, 257–289. [Google Scholar]
- He, M.; Zheng, H.; Clift, P.D.; Tada, R.; Wu, W.; Luo, C. Geochemistry of fine-grained sediments in the Yangtze River and the implications for provenance and chemical weathering in East Asia. Prog. Earth Planet. Sci. 2015, 2, 32. [Google Scholar] [CrossRef]
- Konhauser, K.O.; Powell, M.A.; Fyfe, W.S.; Longstaffe, F.J.; Tripathy, S. Trace element chemistry of major rivers in Orissa State, India. Environ. Geol. 1997, 29, 132–141. [Google Scholar] [CrossRef]
- Moriyama, T.; Panigrahi, M.K.; Pandit, D.; Watanabe, Y. Rare earth element enrichment in Late Archean manganese deposits from the Iron Ore Group, East India. Resour. Geol. 2008, 58, 402–413. [Google Scholar] [CrossRef]
- Giri, S.; Singh, A.K.; Tewary, B.K. Source and distribution of metals in bed sediments of the Subarnarekha River, India. Environ. Earth Sci. 2013, 70, 3381–3392. [Google Scholar] [CrossRef]
- Viers, J.; Dupré, B.; Raun, J.J.; Deberdt, S.; Angeletti, B.; Ngoupa, J.N.; Michard, A. Major and trace element abundances, and strontium isotopes in the Nyong basin rivers (Cameroon): Constraints on chemical weathering processes and elements transport mechanisms in humid tropical environments. Chem. Geol. 2000, 169, 211–241. [Google Scholar] [CrossRef]
- Abedini, A.; Calagari, A.A.; Mikaeili, K. Geochemical characteristics of laterites: The Ailibaltalu Deposit, Iran. Bull. Miner. Res. Explor. 2014, 148, 69–84. [Google Scholar] [CrossRef]
- Nesbitt, H.W.; Markovics, G. Weathering of granodioritic crust, long-term storage of elements in weathering profiles, and petrogenesis of siliciclastic sediments. Geochim. Cosmochim. Acta 1997, 61, 1653–1670. [Google Scholar] [CrossRef]
- Hannigan, R.E.; Sholkovitz, E.R. The development of middle rare earth element enrichments in freshwaters: Weathering of phosphate minerals. Chem. Geol. 2001, 175, 495–508. [Google Scholar] [CrossRef]
- Braun, J.J.; Pagel, M.; Herbillon, A.; Rosin, C. Mobilization and redistribution of REEs and thorium in a syenitic lateritic profile: A mass balance study. Geochim. Cosmochim. Acta 1993, 57, 4419–4434. [Google Scholar] [CrossRef]
- Pracejus, B.; Bolton, B.R.; Frakes, L.A.; Abbott, M. Rare-earth element geochemistry of supergene manganese deposits from Groote Eylandt, Northern Territory, Australia. Ore Geol. Rev. 1990, 5, 293–314. [Google Scholar] [CrossRef]
- Singh, V.K.; Sahoo, R.K. Occurrence of manganese mineralization in Rayavalasa and Tudi villages of Eastern Ghat Mobile Belts, Andhra Pradesh. Int. J. Res. Publ. Rev. 2022, 3(11), 2924–2933. [Google Scholar] [CrossRef]
- Ross, G.R.; Guevara, S.R.; Arribére, M.A. Rare earth geochemistry in sediments of the Upper Manso River Basin, Río Negro, Argentina. Earth Planet. Sci. Lett. 1995, 133, 47–57. [Google Scholar] [CrossRef]
- Bhatia, M.R. Plate tectonics and geochemical composition of sandstones. J. Geol. 1983, 91, 611–627. [Google Scholar] [CrossRef]
- Cullers, R.L. The controls on the major and trace element variation of shales, siltstones, and sandstones of Pennsylvanian-Permian age from uplifted continental blocks in Colorado to platform sediment in Kansas, USA. Geochim. Cosmochim. Acta 1994, 58, 4955–4972. [Google Scholar] [CrossRef]
- Bhatia, M.R.; Crook, K.A.W. Trace element characteristics of graywackes and tectonic setting discrimination of sedimentary basins. Contrib. Mineral. Petrol. 1986, 92, 181–193. [Google Scholar] [CrossRef]
- Bracciali, L.; Marroni, M.; Pandol, B.L.; Rocchi, S.; Arribas, J.; Critelli, S.; Johnsson, M.J. Geochemistry and petrography ofWestern Tethys Cretaceous sedimentary covers (Corsica and Northern Apennines): From source areas to configuration of margins. Geol. Soc. Am. Spec. Pap. 2007, 420, 73–93. [Google Scholar]
- Balasubramaniam, K.S.; Surendra, M.; Kumar, T.V. Genesis of certain bauxite profiles from India. Chem. Geol. 1987, 60, 227–235. [Google Scholar] [CrossRef]
- Gurumurthy, G.P. Geochemical split among the suspended and mud sediments in the Nethravati River: insights to compositional similarity of peninsular gneiss and the Deccan Basalt Derived sediments, and its implications on tracing the provenance in the Indian Ocean. Geochem Geophys Geosyst 2024, 25, e2024GC011642. [Google Scholar] [CrossRef]
- Bhatia, M.R. Rare earth element geochemistry of Australian Paleozoic graywackes and mudrocks: Provenance and tectonic control. Sediment. Geol. 1985, 45, 97–113. [Google Scholar] [CrossRef]
- GSI, Geological Map of India. In Geological Survey of India, 7th edn; Bangalore, 1998.
- Nesbitt, H.W.; Young, G.M. Early Proterozoic climates and plate motions inferred from major element chemistry of lutites. Nature 1982, 299, 715–717. [Google Scholar] [CrossRef]
- Roser, B.P.; Korsch, R.J. Provenance signatures of sandstone-mudstone suites determined using discriminant function analysis of major-element data. Chem. Geol. 1988, 67, 119–139. [Google Scholar] [CrossRef]
- Cullers, R. The geochemistry of shales, siltstones and sandstones of Pennsylvanian–Permian age, Colorado, USA: Implications for provenance and metamorphic studies. Lithos 2000, 51, 181–203. [Google Scholar] [CrossRef]
- Taylor, S.R.; McLennan, S.M. The Continental Crust: Its Composition and Evolution; Blackwell Scientific Publications: Palo Alto, CA, USA; Malden, MA, USA, 1985; p. 312. [Google Scholar]
Figure 1.
The Geological Map of India. The area bound by red line denotes Peninsular India. Sediment sample locations in the rivers are indicated by dots (with numbers) along the east and west coast of India. The name of the river is also given. Physiographic features surrounding peninsular India are also shown. Insert map shows the drainage network of the rivers in the peninsular India (modified after GSI, [86]).
Figure 1.
The Geological Map of India. The area bound by red line denotes Peninsular India. Sediment sample locations in the rivers are indicated by dots (with numbers) along the east and west coast of India. The name of the river is also given. Physiographic features surrounding peninsular India are also shown. Insert map shows the drainage network of the rivers in the peninsular India (modified after GSI, [86]).
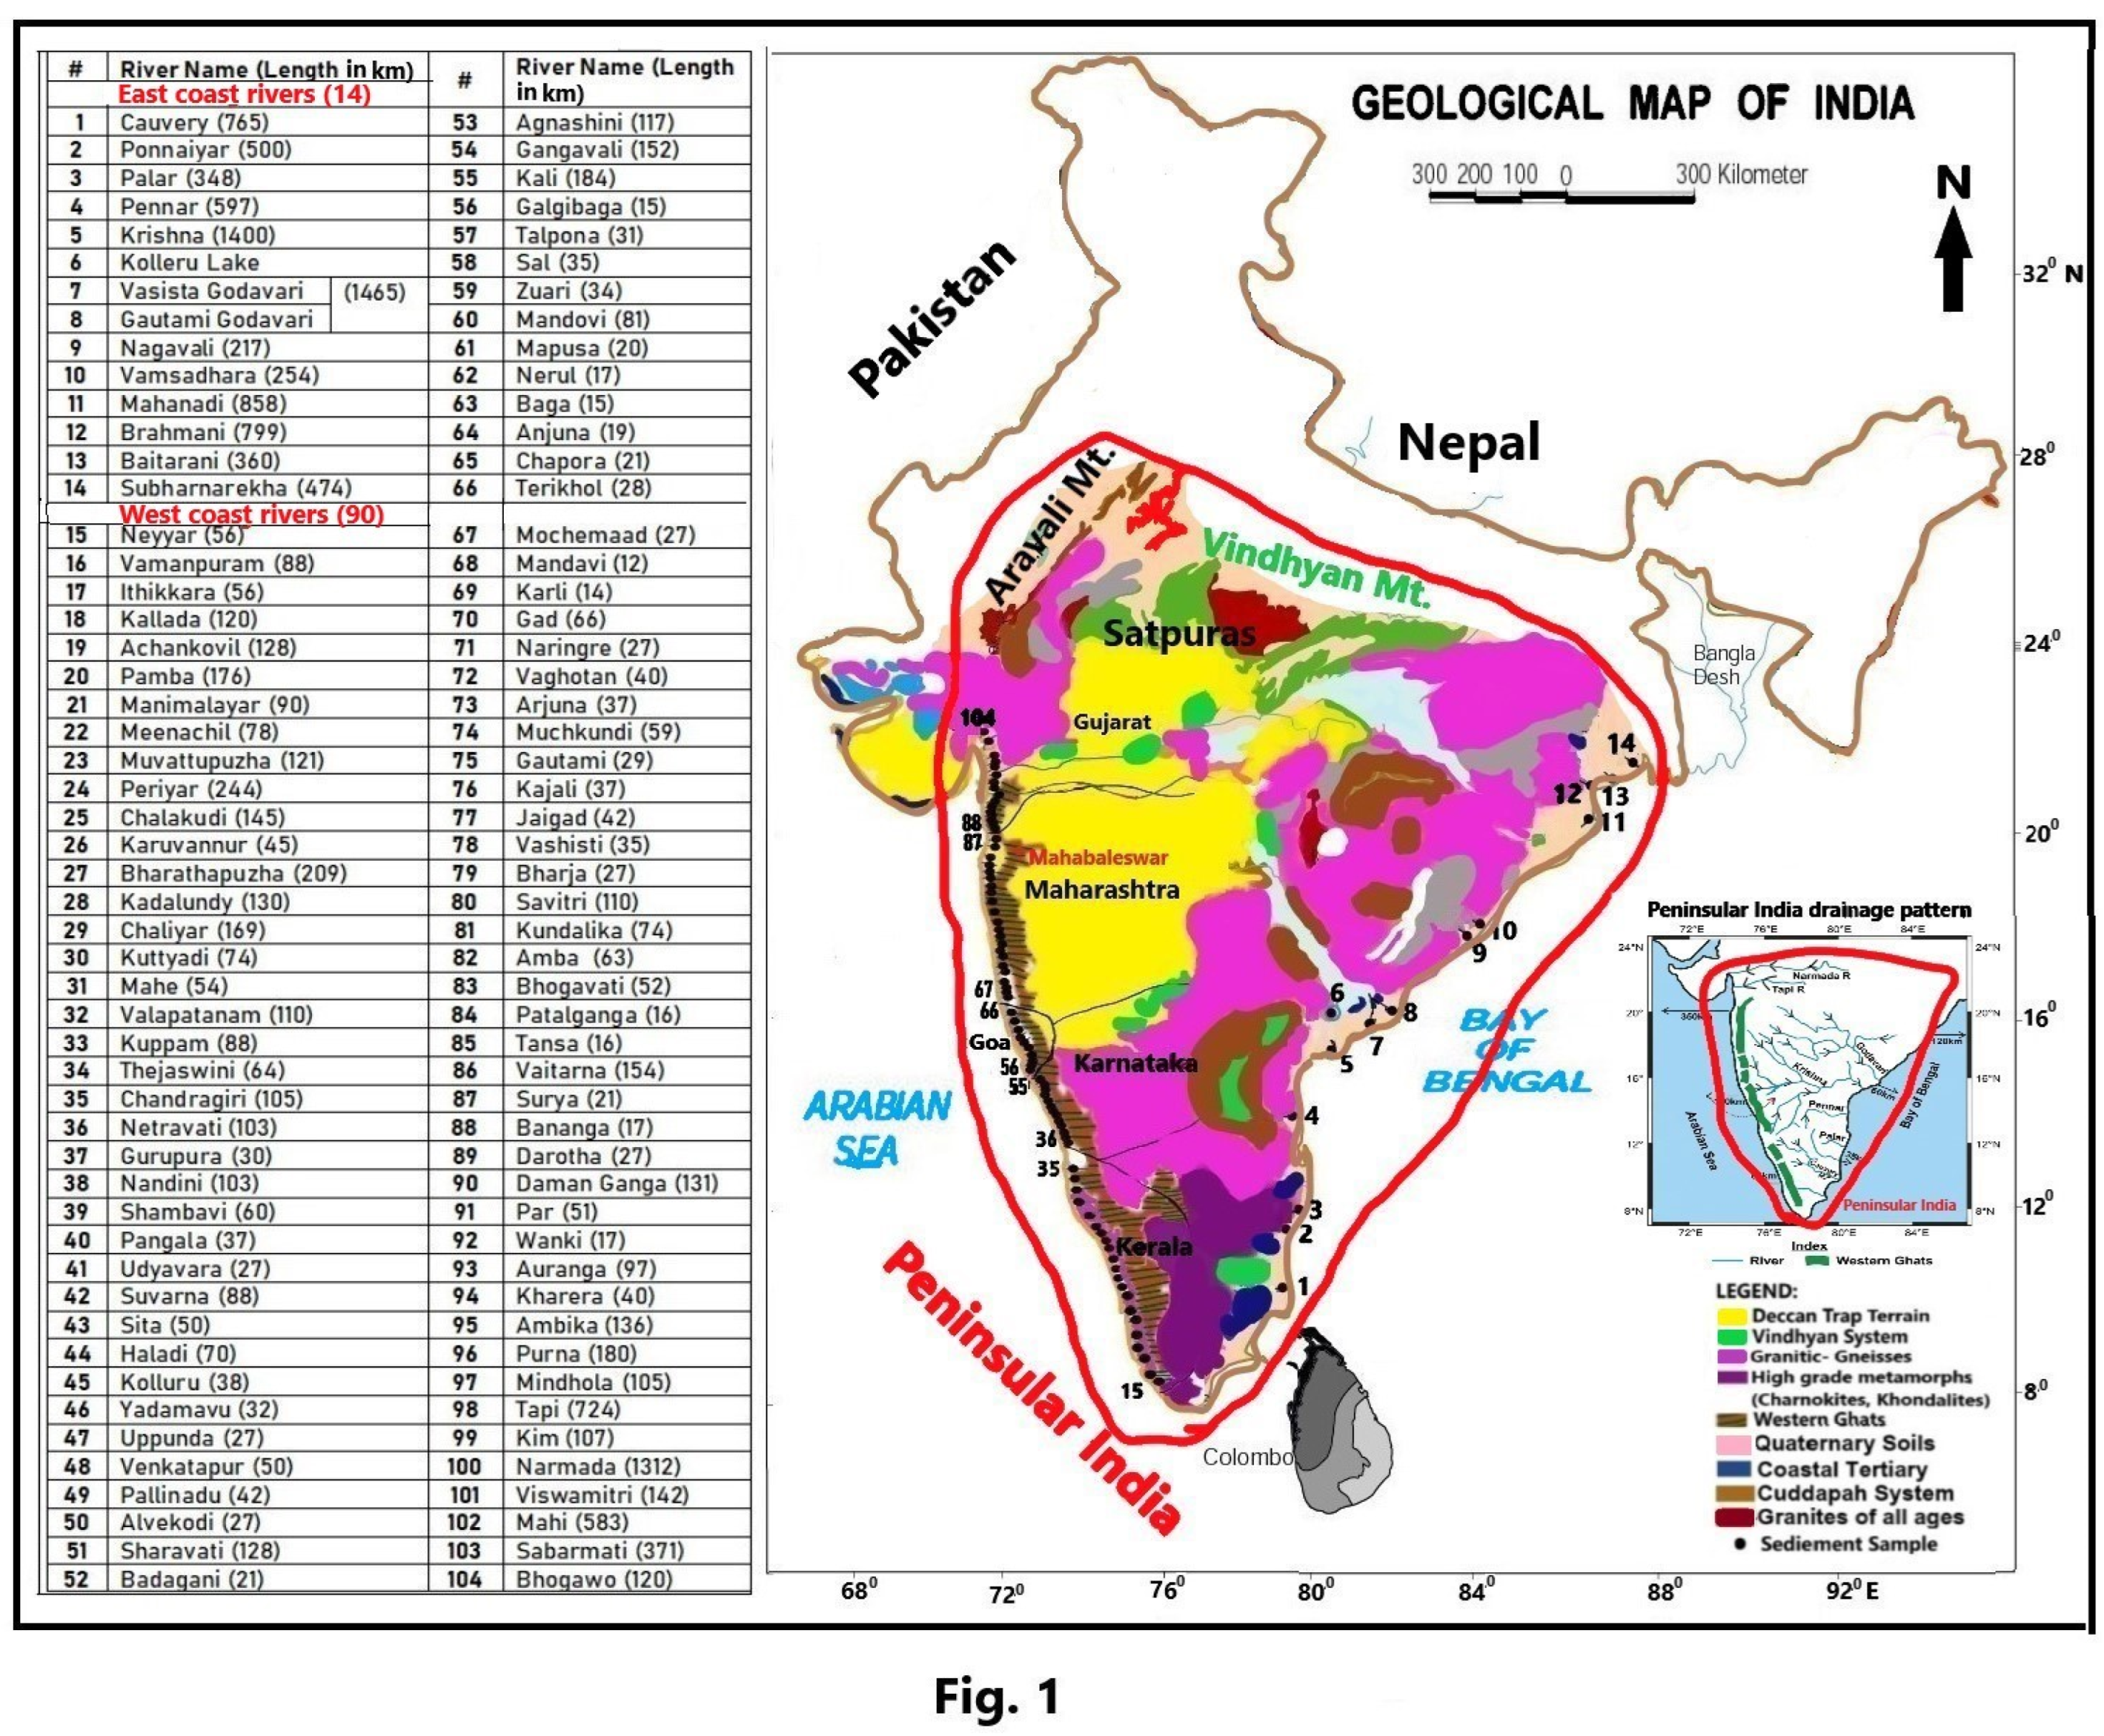
Figure 2.
PAAS-normalized average major element distribution in the clays from each terrain, in the clays from the rivers of the east and coast of India and, in the clays of all rivers (PIRAC). UCC normalized PIRAC is also shown.
Figure 2.
PAAS-normalized average major element distribution in the clays from each terrain, in the clays from the rivers of the east and coast of India and, in the clays of all rivers (PIRAC). UCC normalized PIRAC is also shown.
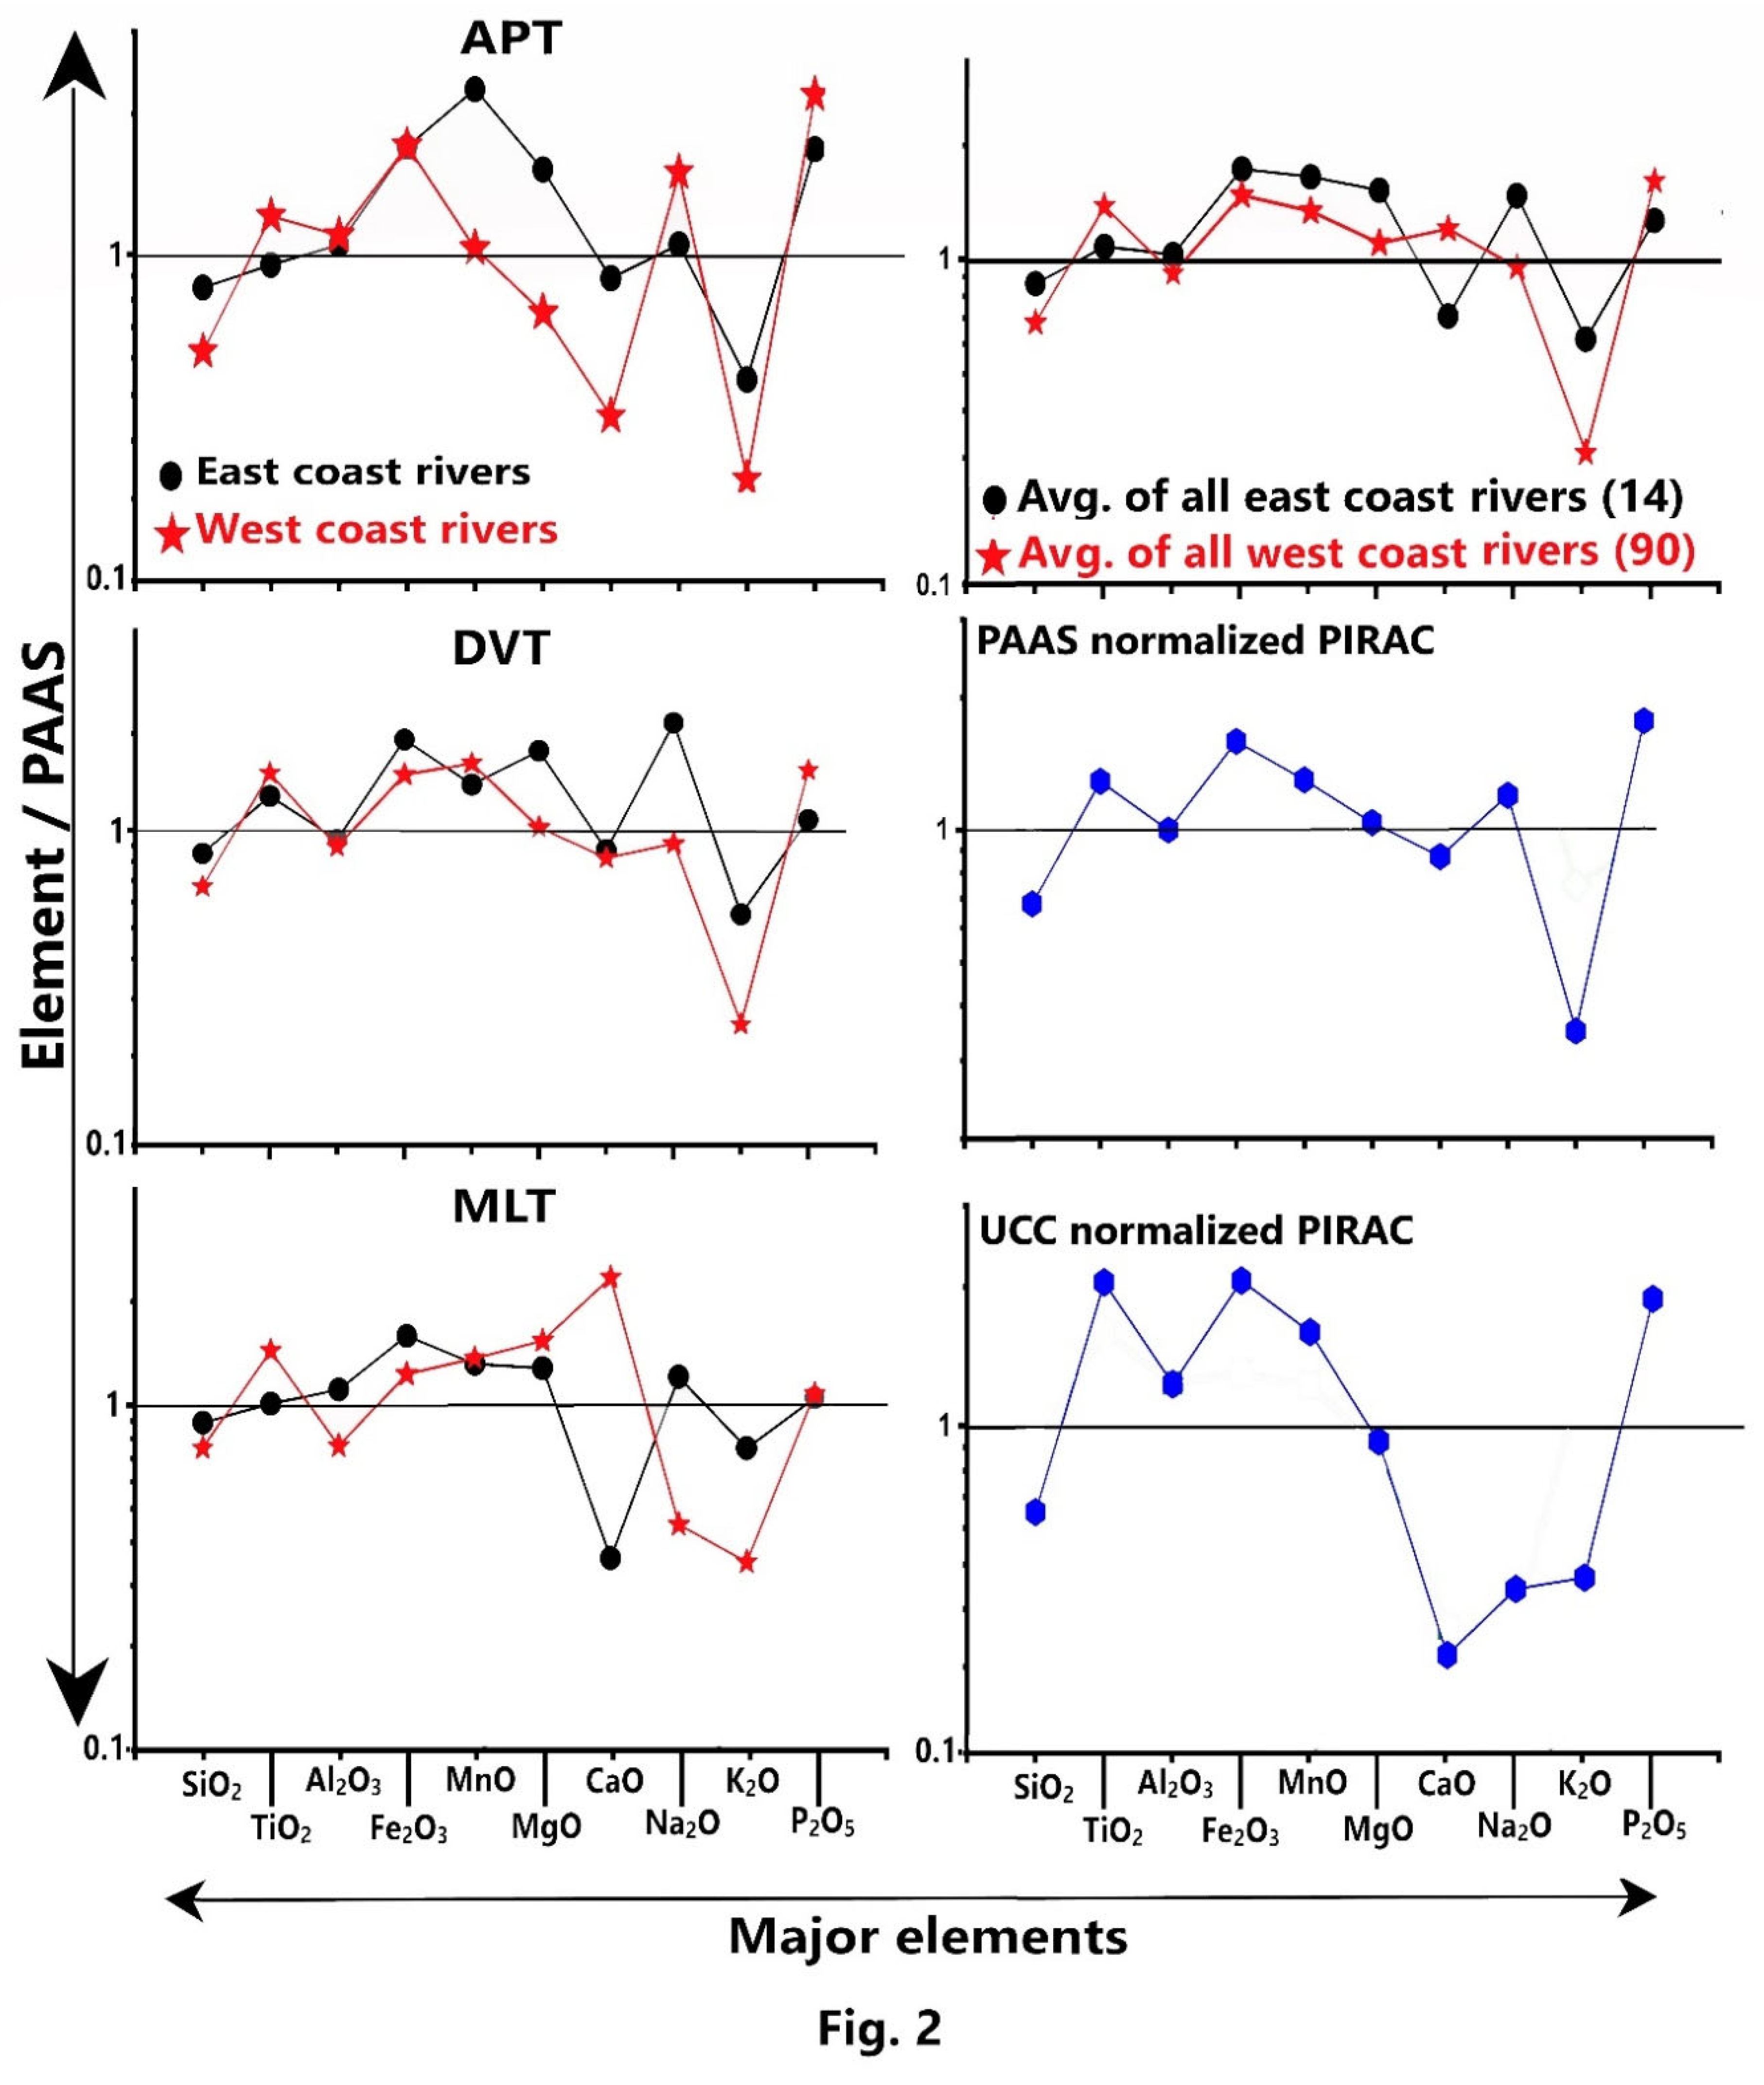
Figure 3.
Ternary weathering diagrams showing: (A) the Chemical Index of Alteration, calculated as CIA = [Al₂O₃/(Al₂O₃ + CaO* + Na₂O + K₂O)] × 100 [87]; (B) the Plagioclase Index of Alteration, calculated as PIA = [(Al₂O₃ − K₂O)/(Al₂O₃ + CaO* + Na₂O − K₂O)] × 100 [58] (C) the A–CNK–FM diagram [Al₂O₃–(CaO + Na₂O + K₂O)–(Fe₂O₃ + MgO)] [62,63] and (D) the relationship between the Chemical Index of Alteration (CIA) and the Index of Chemical Variability, where ICV = (Fe₂O₃ + K₂O + Na₂O + CaO + MgO + MnO + TiO₂)/Al₂O₃ [6].
Figure 3.
Ternary weathering diagrams showing: (A) the Chemical Index of Alteration, calculated as CIA = [Al₂O₃/(Al₂O₃ + CaO* + Na₂O + K₂O)] × 100 [87]; (B) the Plagioclase Index of Alteration, calculated as PIA = [(Al₂O₃ − K₂O)/(Al₂O₃ + CaO* + Na₂O − K₂O)] × 100 [58] (C) the A–CNK–FM diagram [Al₂O₃–(CaO + Na₂O + K₂O)–(Fe₂O₃ + MgO)] [62,63] and (D) the relationship between the Chemical Index of Alteration (CIA) and the Index of Chemical Variability, where ICV = (Fe₂O₃ + K₂O + Na₂O + CaO + MgO + MnO + TiO₂)/Al₂O₃ [6].
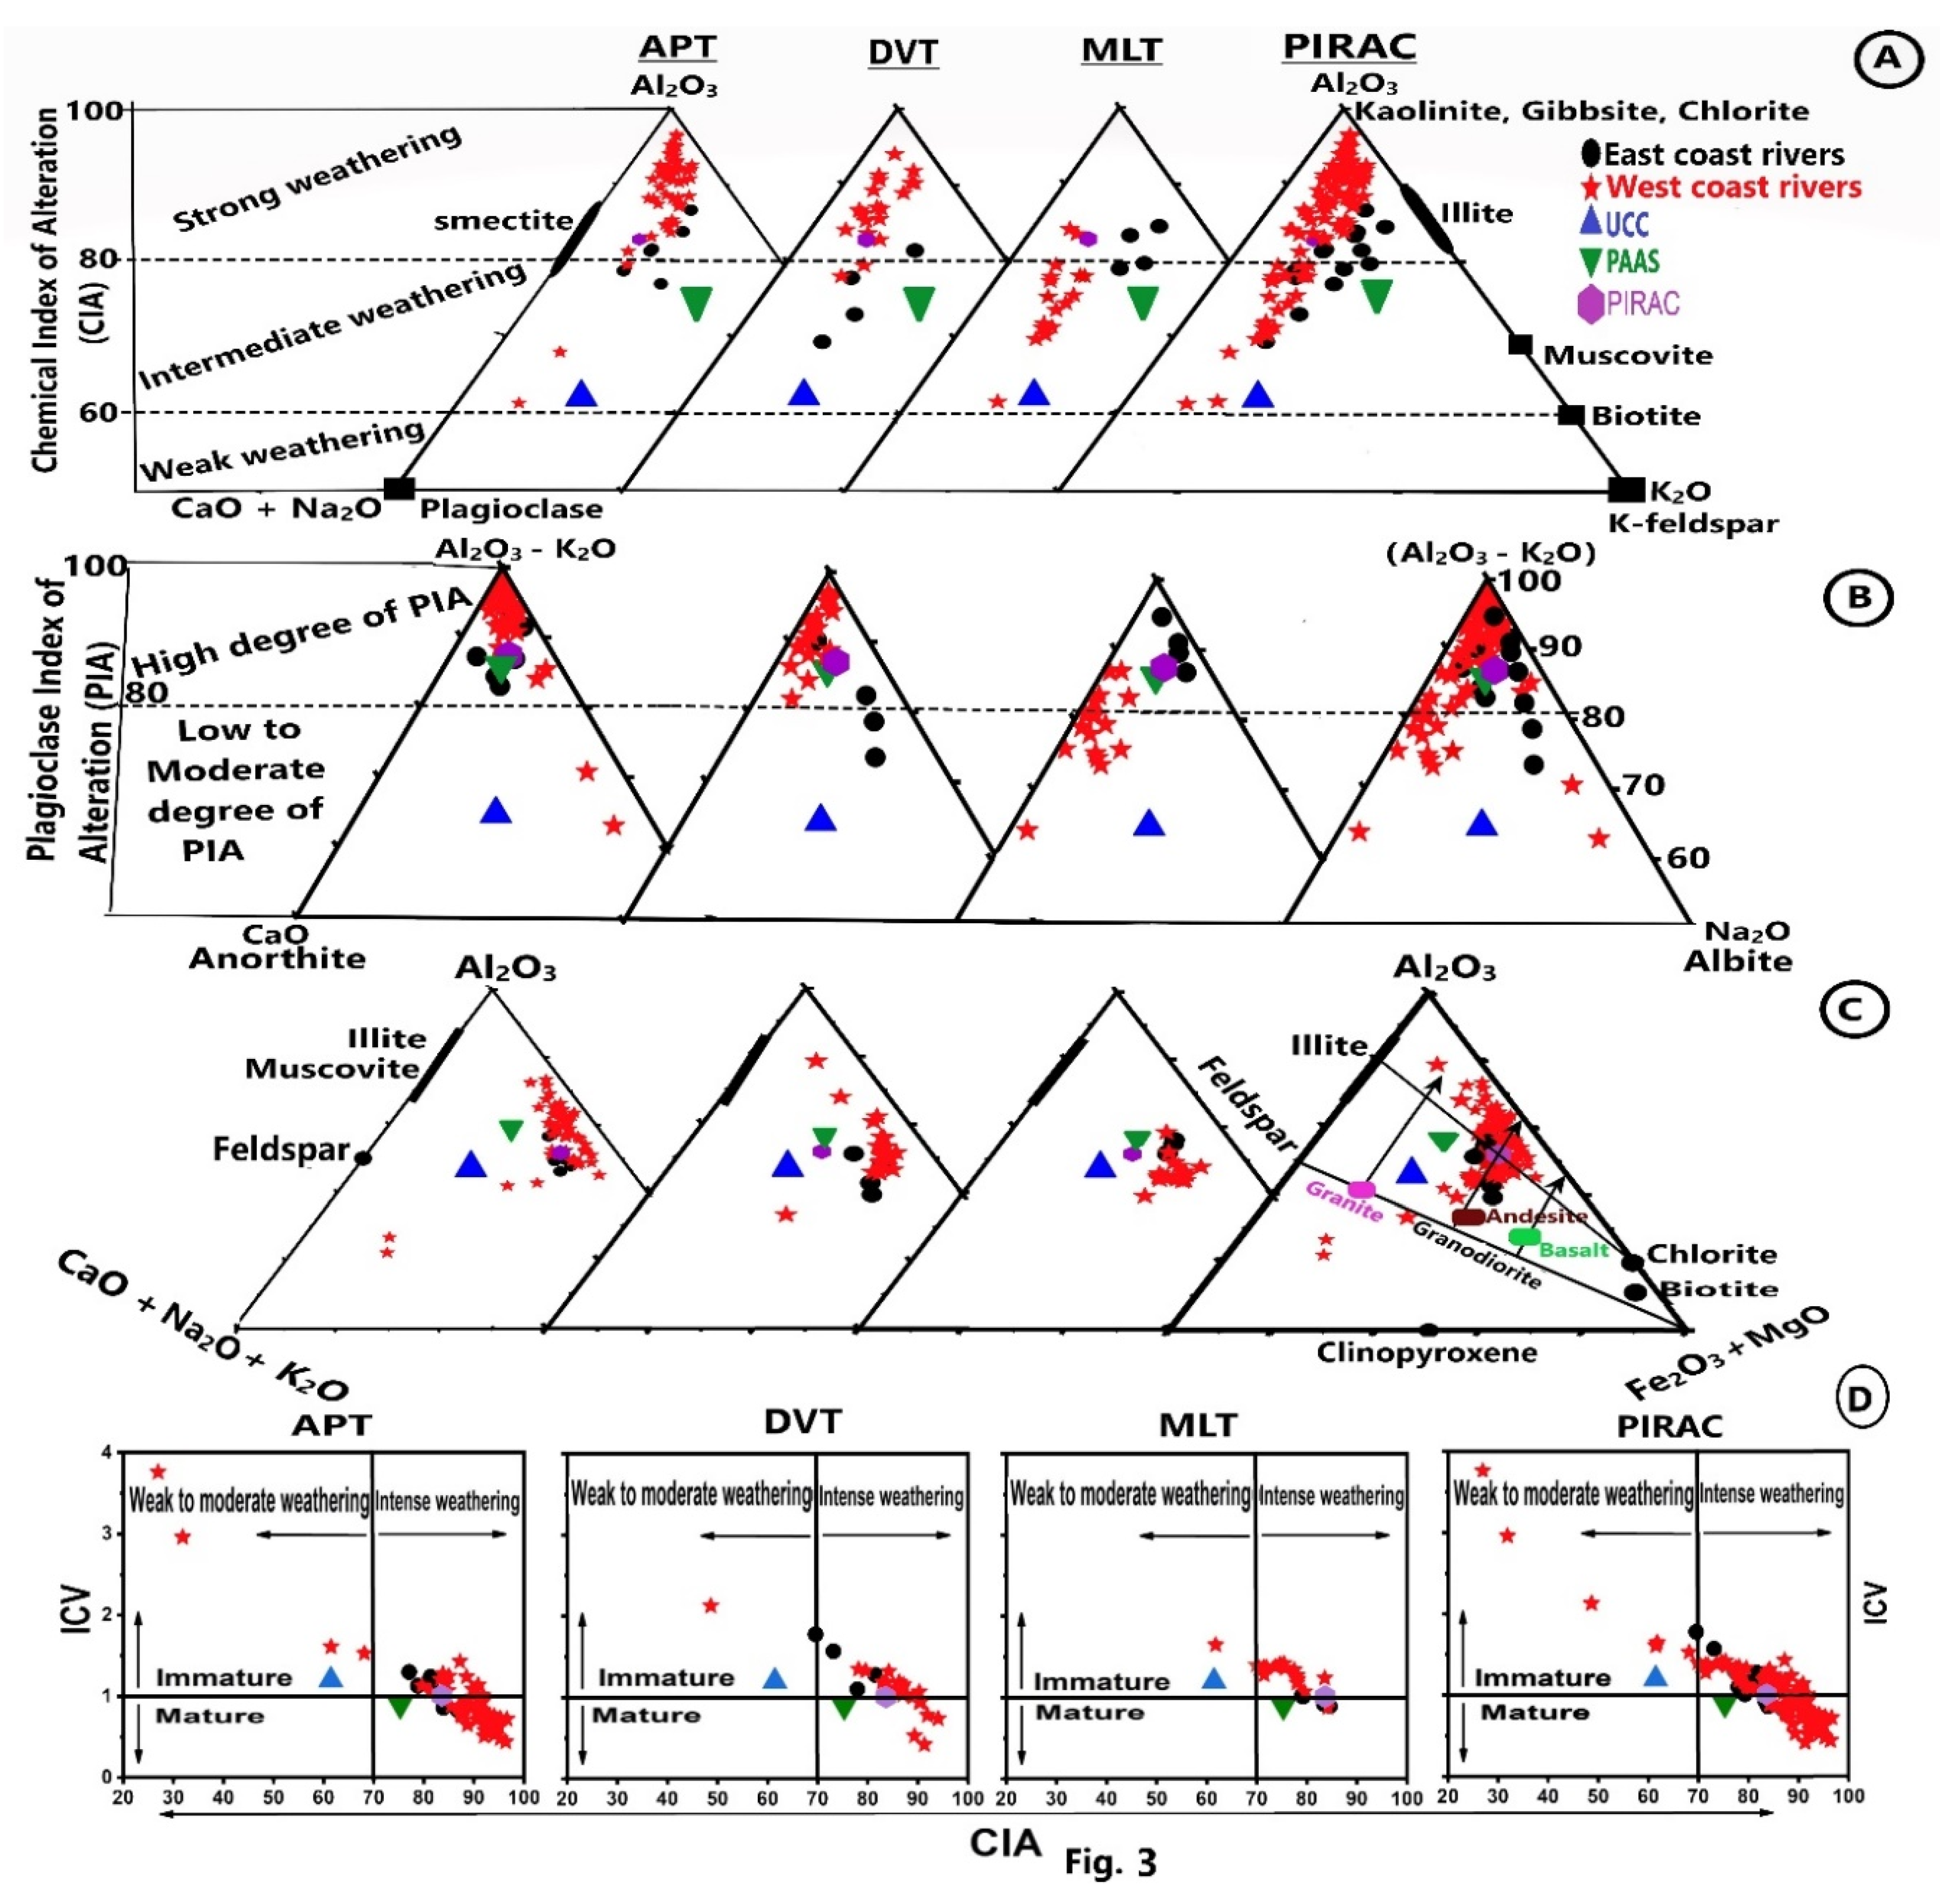
Figure 4.
Correlation plots showing the relationships between CIA and Al₂O₃, Fe₂O₃, TiO₂, MgO, and K₂O.
Figure 4.
Correlation plots showing the relationships between CIA and Al₂O₃, Fe₂O₃, TiO₂, MgO, and K₂O.
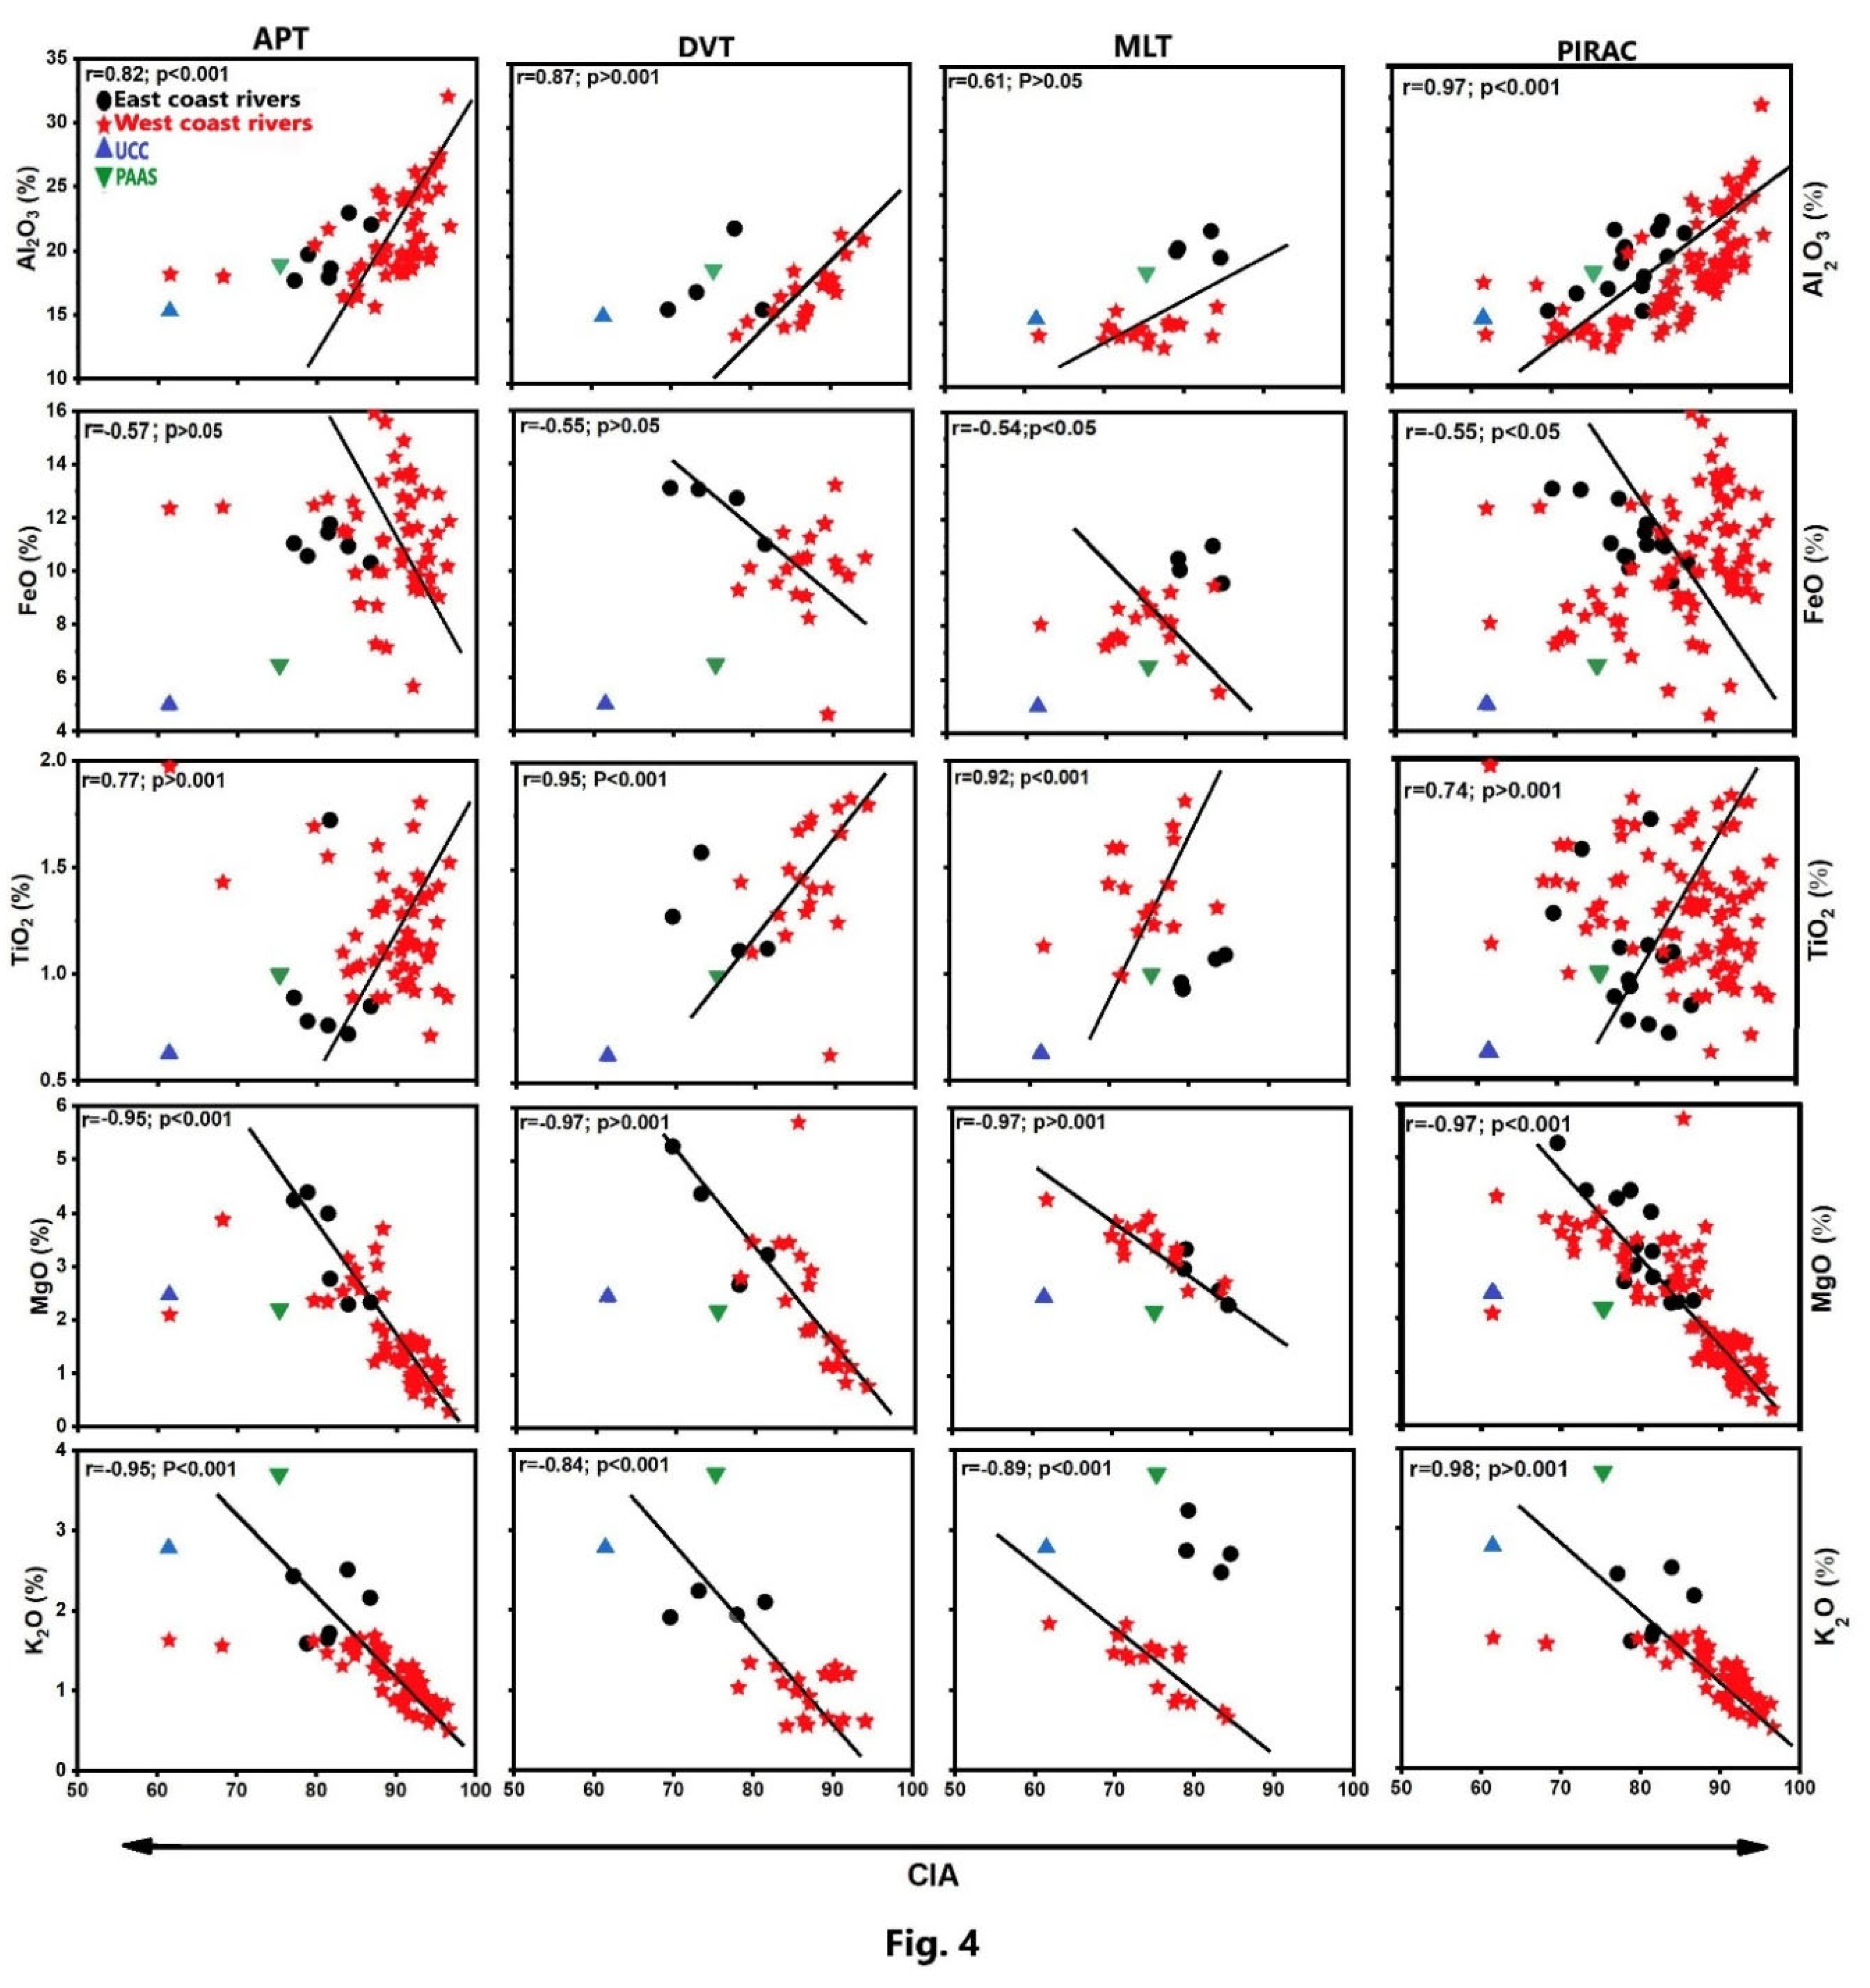
Figure 5.
PAAS-normalized average trace-element (TE) distribution in the clays from each terrain, in the clays from the rivers of the east and coast of India and, in the clays of all rivers (PIRAC). UCC normalized PIRAC is also shown.
Figure 5.
PAAS-normalized average trace-element (TE) distribution in the clays from each terrain, in the clays from the rivers of the east and coast of India and, in the clays of all rivers (PIRAC). UCC normalized PIRAC is also shown.
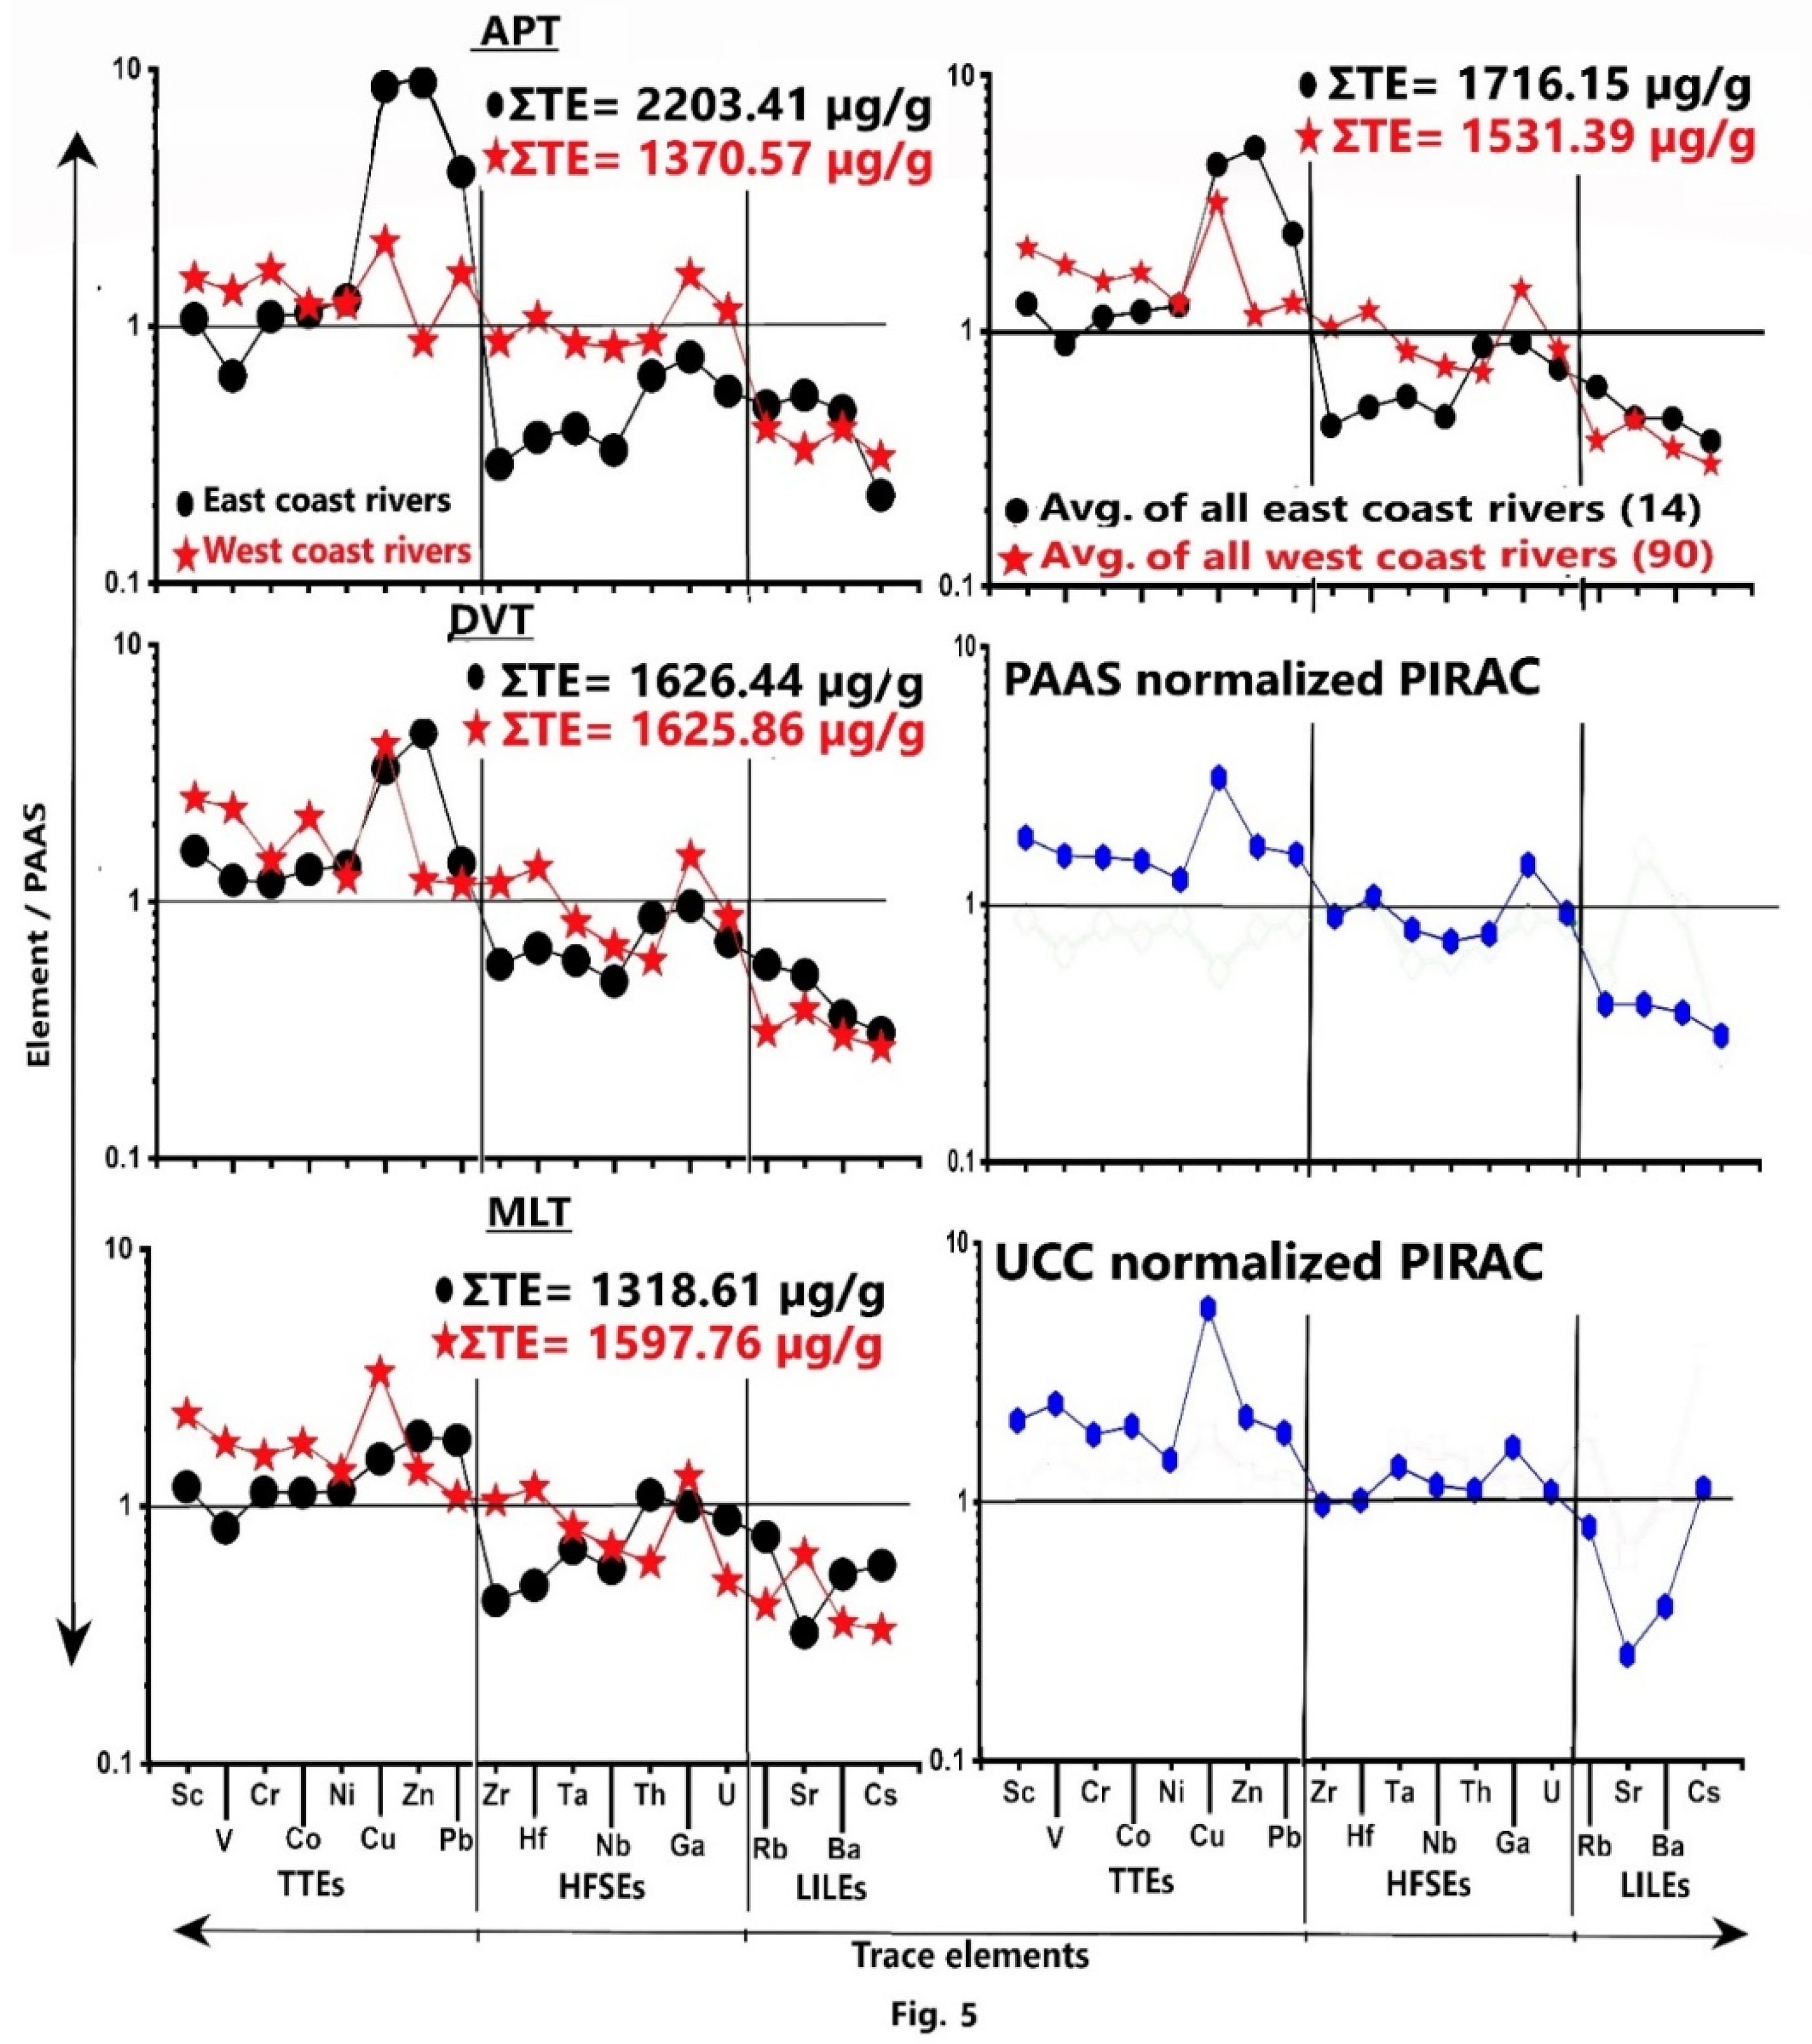
Figure 6.
PAAS-normalized average rare earth element (REE) distribution in the clays from each terrain, in the clays from the rivers of the east and coast of India and, in the clays of all rivers (PIRAC). UCC normalized PIRAC is also shown.
Figure 6.
PAAS-normalized average rare earth element (REE) distribution in the clays from each terrain, in the clays from the rivers of the east and coast of India and, in the clays of all rivers (PIRAC). UCC normalized PIRAC is also shown.
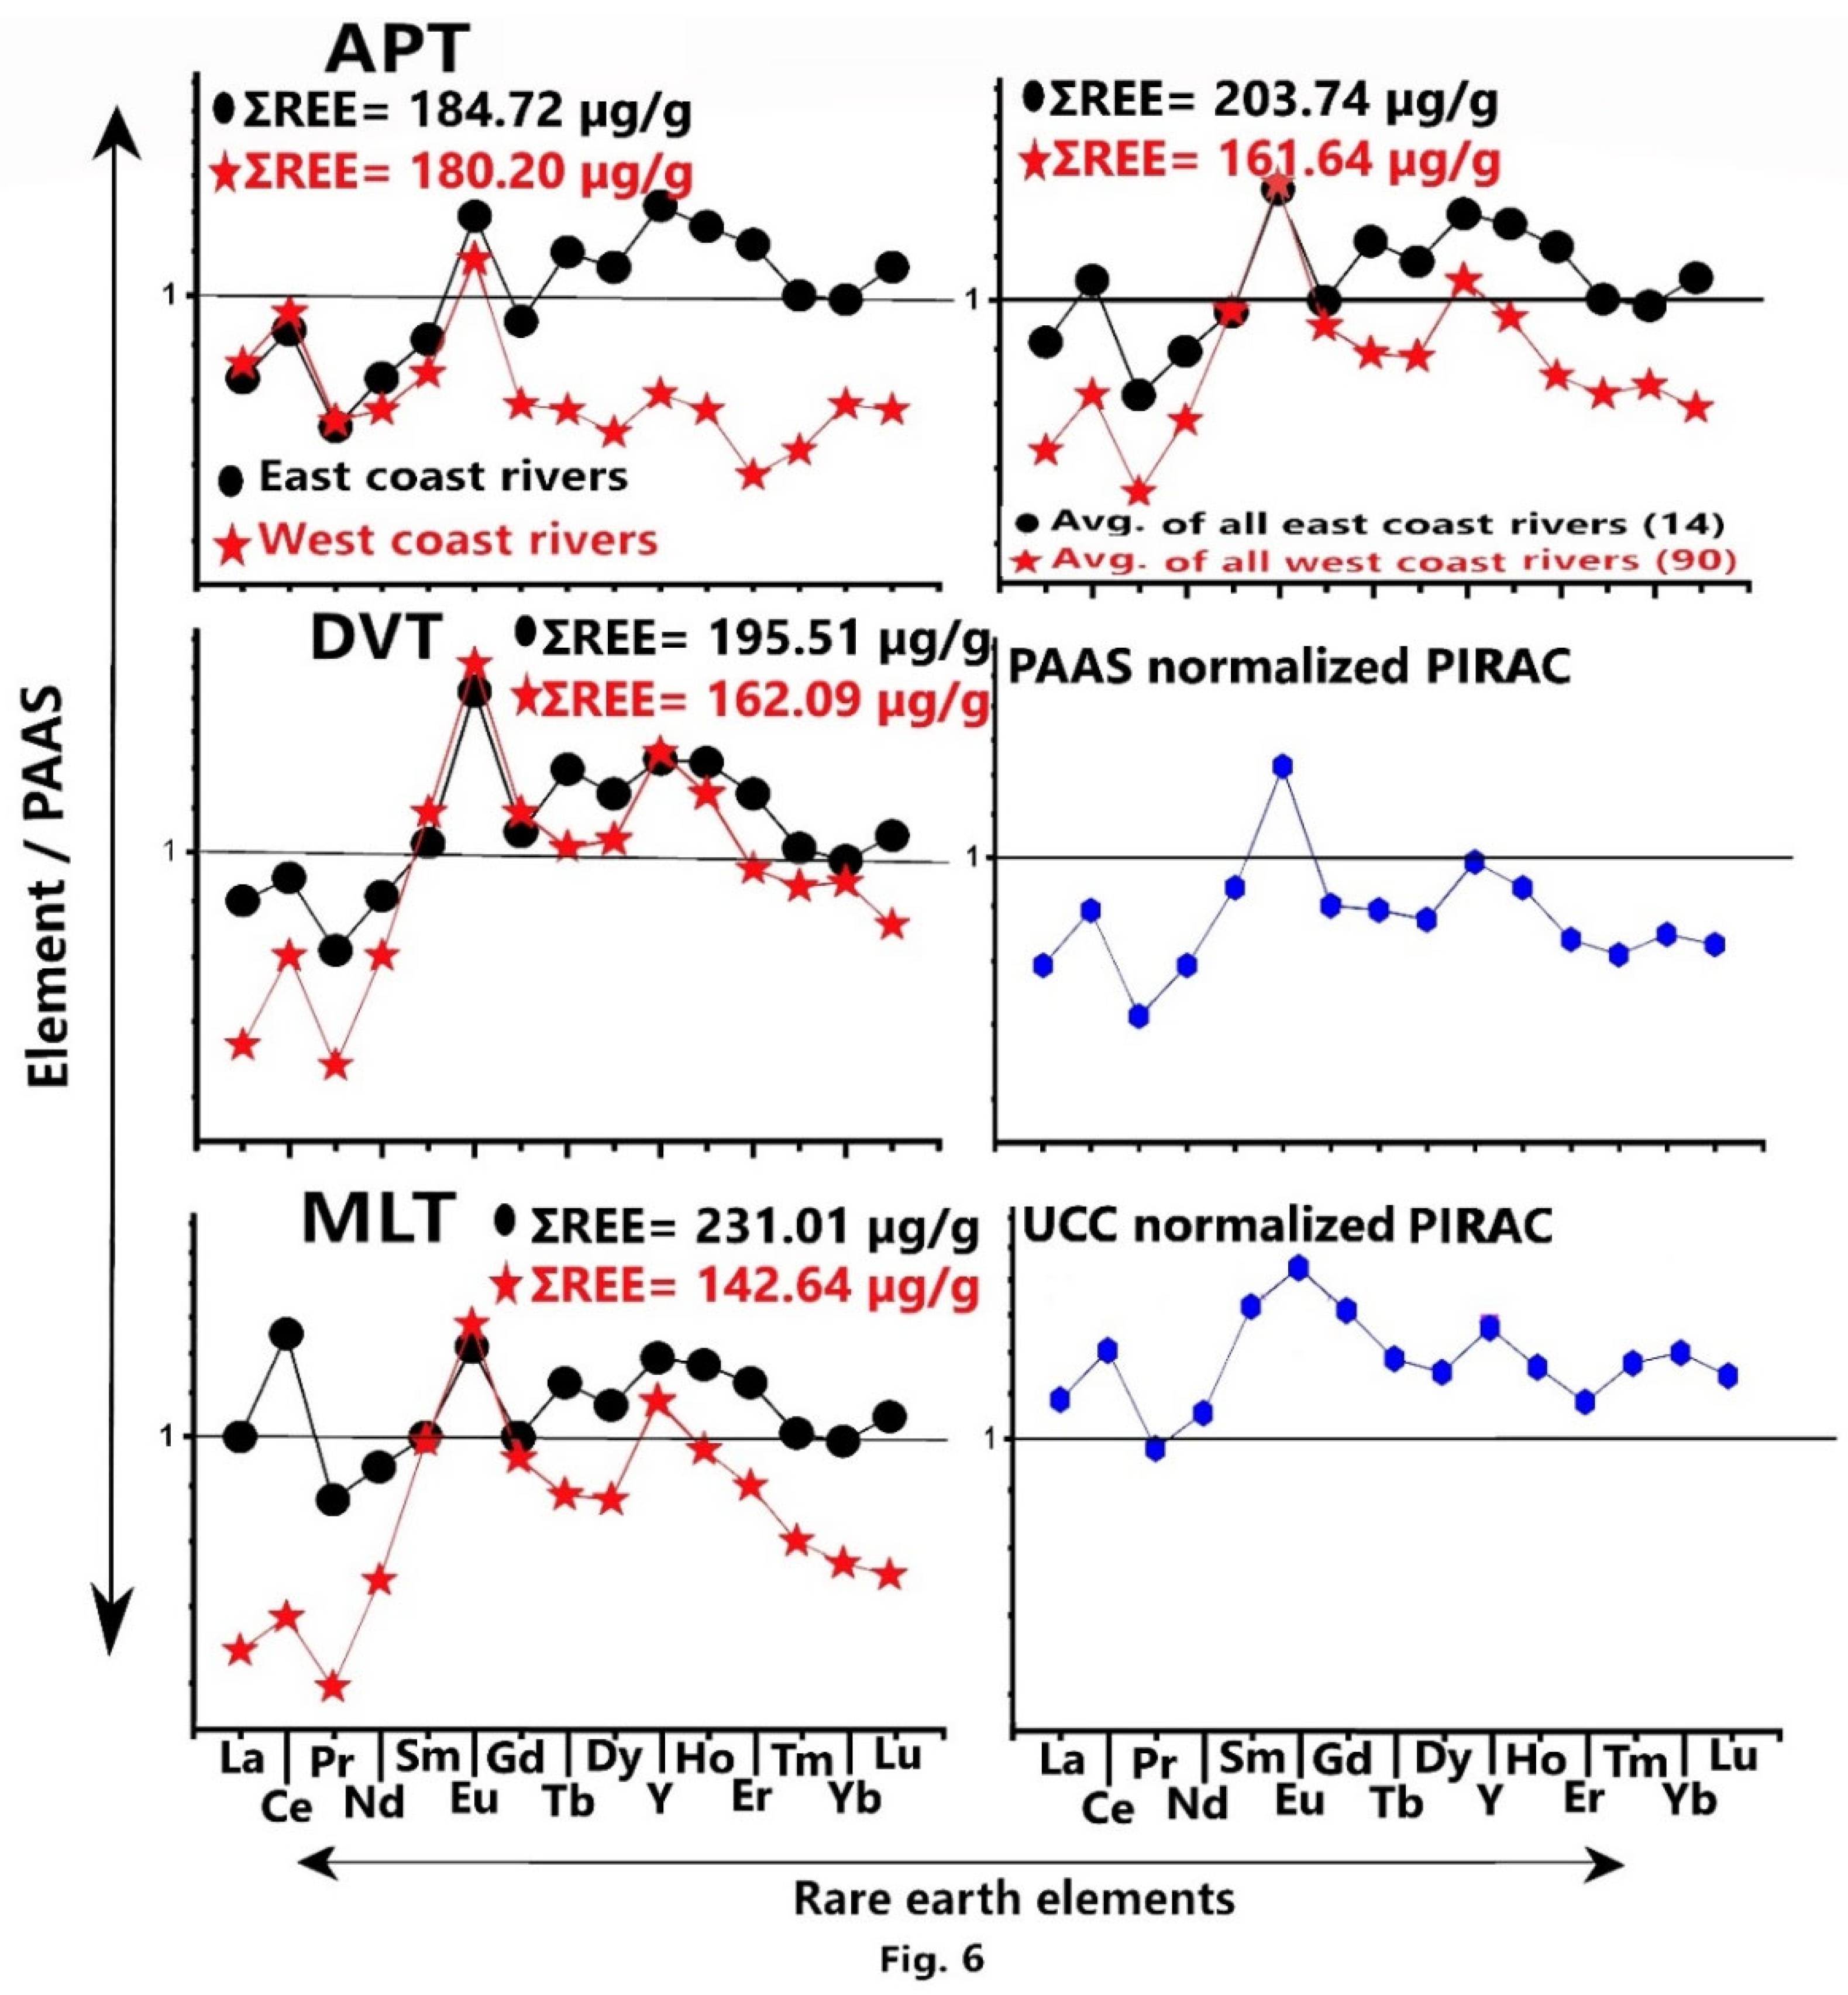
Figure 7.
Geochemical provenance discrimination diagrams for the clay fractions of sediments in all the rivers. (A) Al₂O₃ versus TiO₂, with felsic, intermediate, and mafic provenance field [12,79]; (B) (Fe₂O₃ + MgO) versus TiO₂ [79]; (C) Sc versus Th [80]; and (D) Sc versus Th/Sc [40,88].
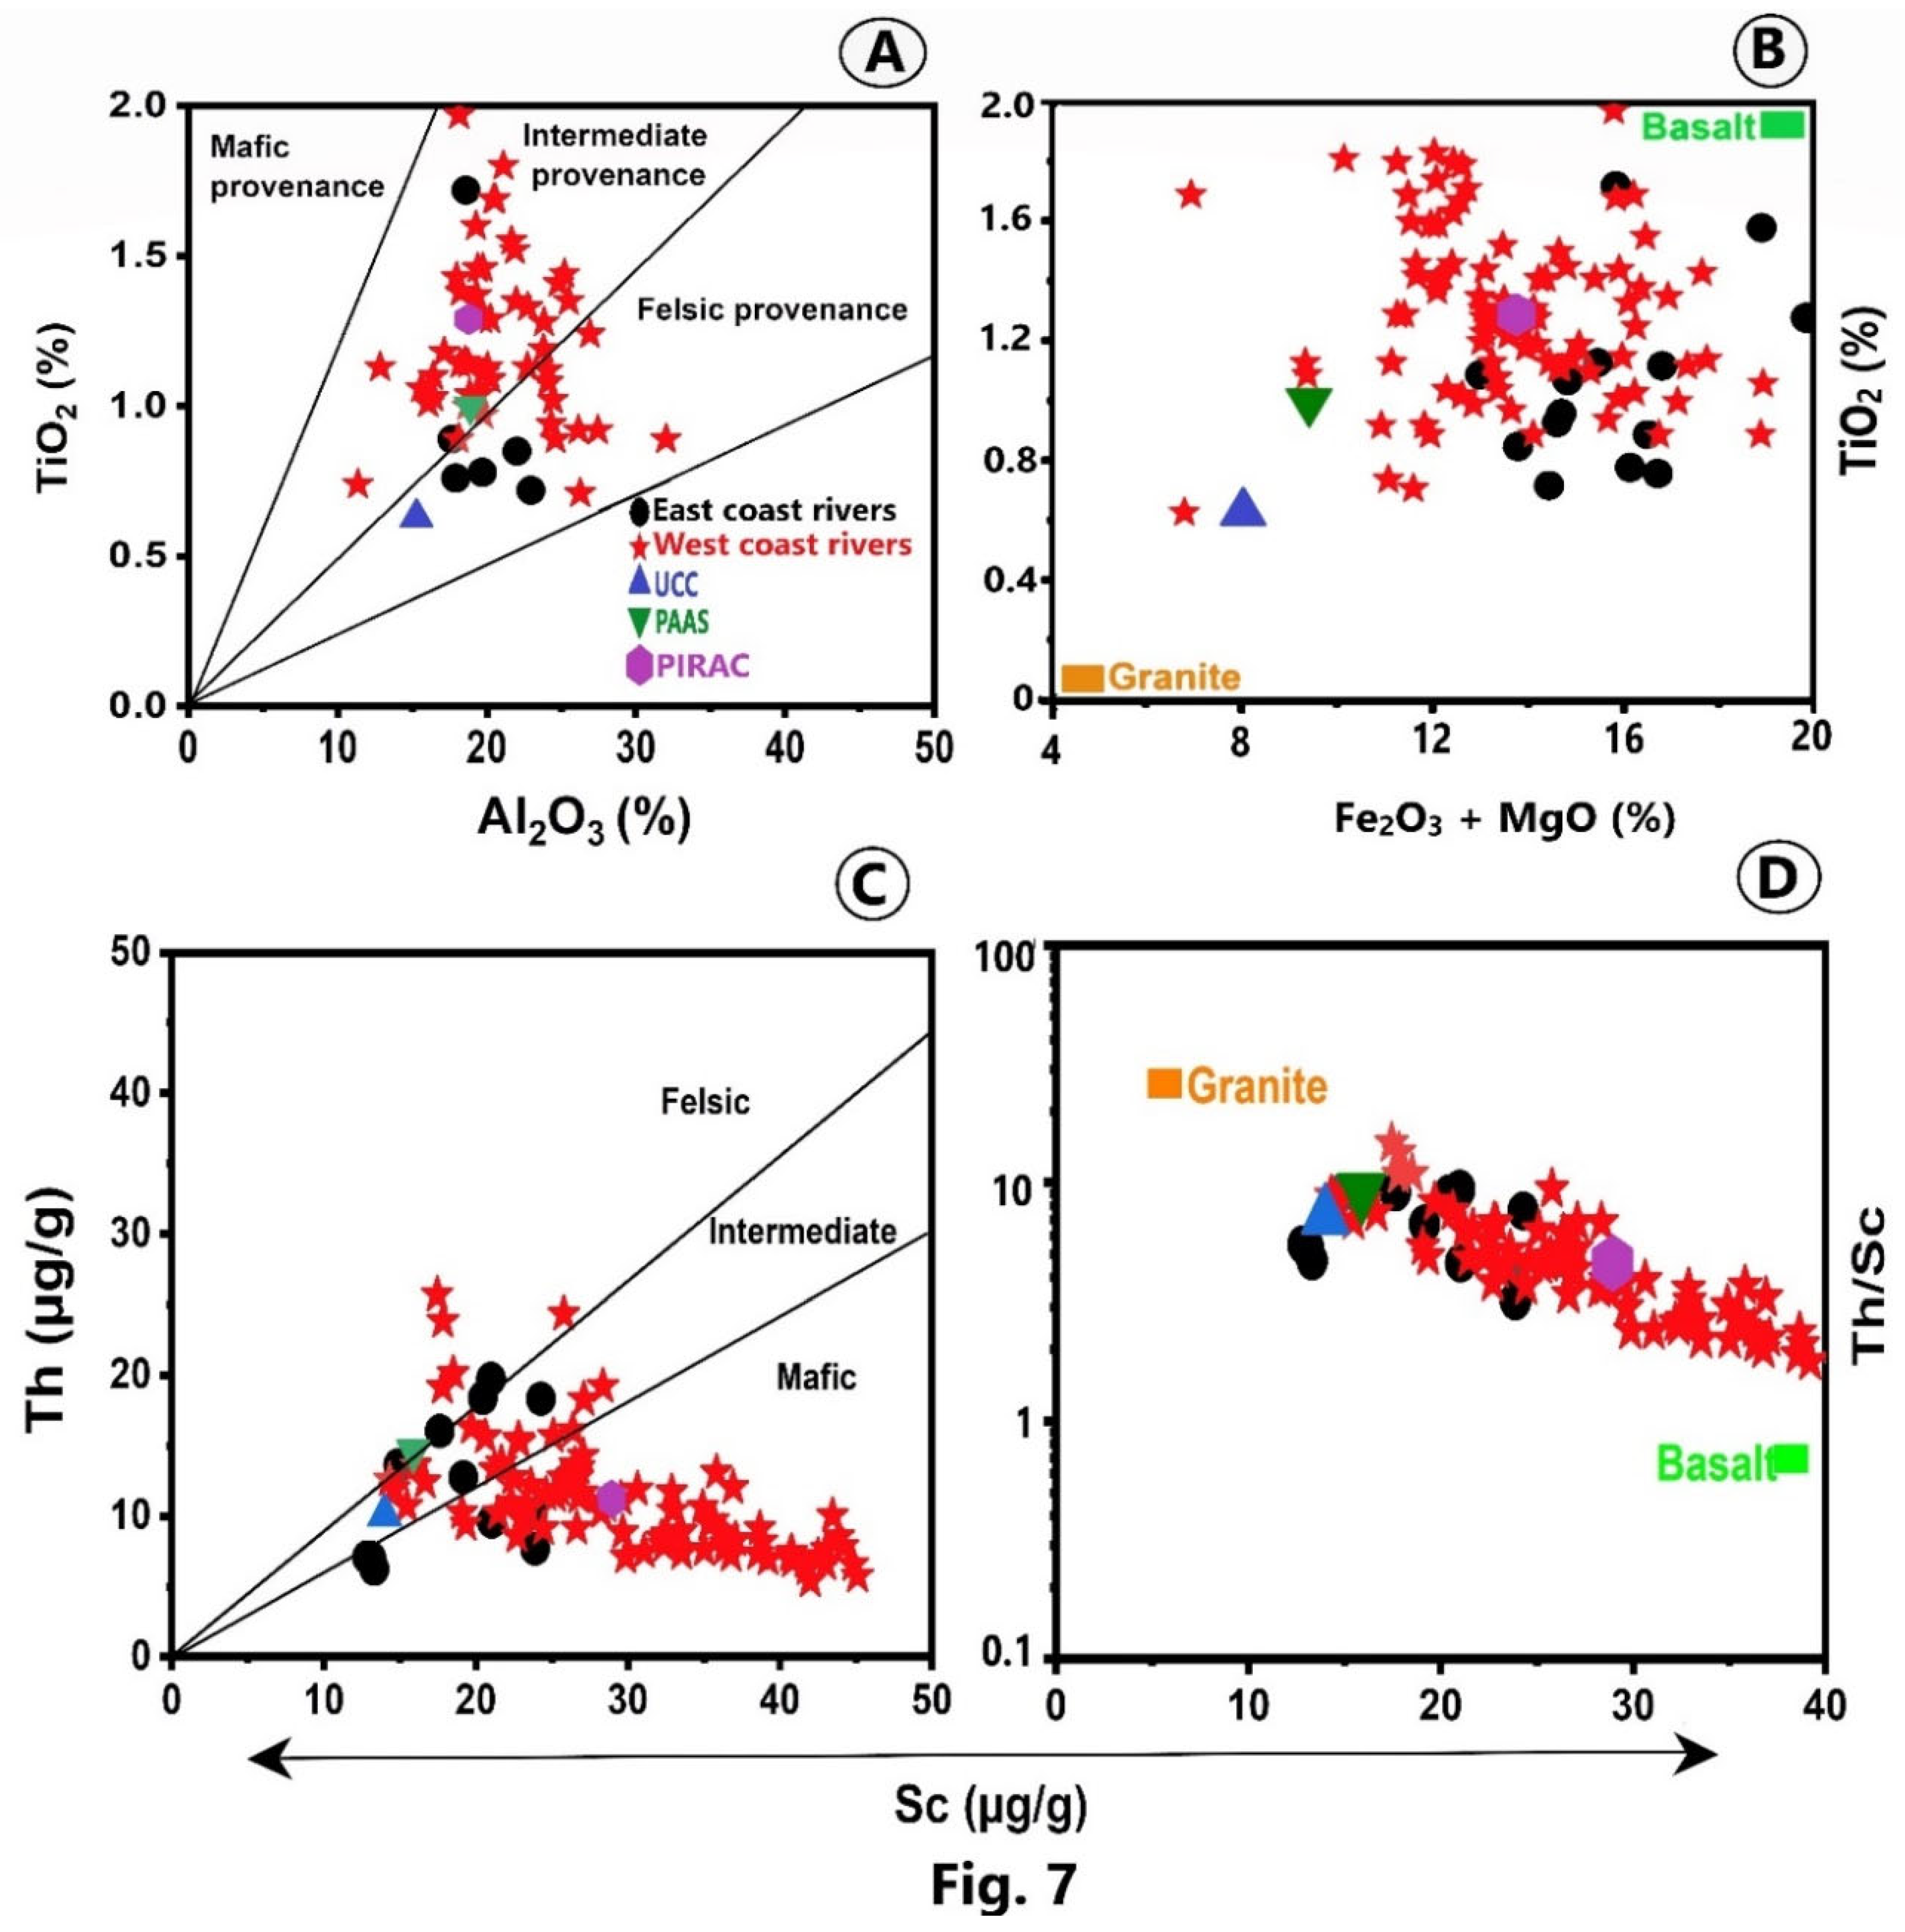
Figure 8.
Ternary diagrams of trace-elements used for provenance discrimination: (A) La–Th–Sc [79,82]; (B) V–Ni–Th × 10 [82] and (C) Zr–Cr–Ga [83].
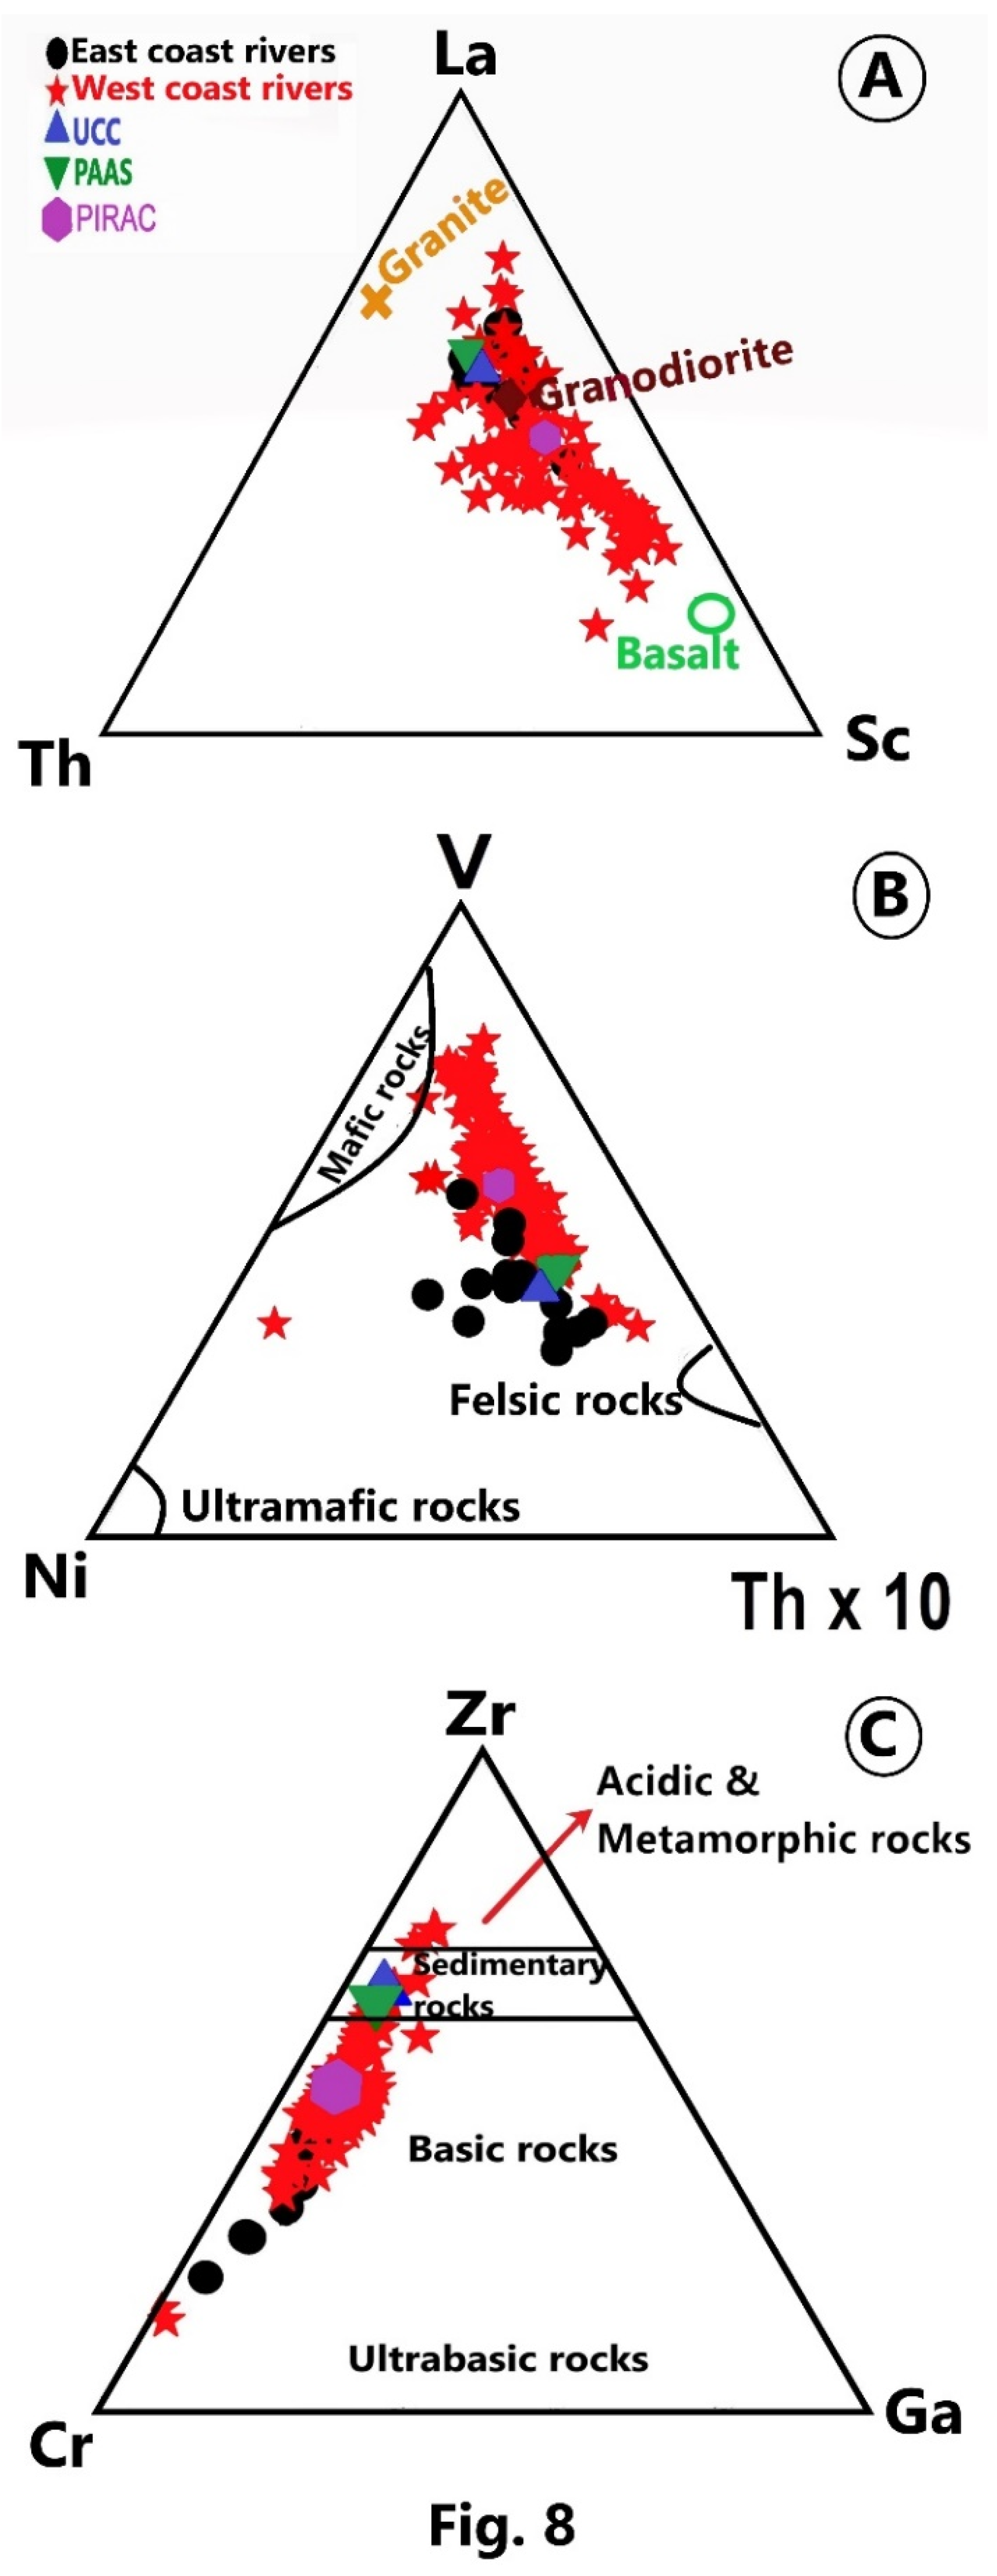
Figure 9.
(A) PAAS-normalized REE of PIRAC together with Upper Continental Crust (UCC), European Shale (ES), Mud of Queensland (MUQ), North American Shale Composite (NASC), and East China Post-Archean Shale (ECPAS). (B) PAAS-normalized REE patterns of PIRAC together with that of the clays from large tropical rivers of the world (Amazon, Nile, Mississippi, and Yangtze). REE data for the Amazon, Nile, Mississippi, and Yangtze rivers are from Bayon et al. [36].
Figure 9.
(A) PAAS-normalized REE of PIRAC together with Upper Continental Crust (UCC), European Shale (ES), Mud of Queensland (MUQ), North American Shale Composite (NASC), and East China Post-Archean Shale (ECPAS). (B) PAAS-normalized REE patterns of PIRAC together with that of the clays from large tropical rivers of the world (Amazon, Nile, Mississippi, and Yangtze). REE data for the Amazon, Nile, Mississippi, and Yangtze rivers are from Bayon et al. [36].
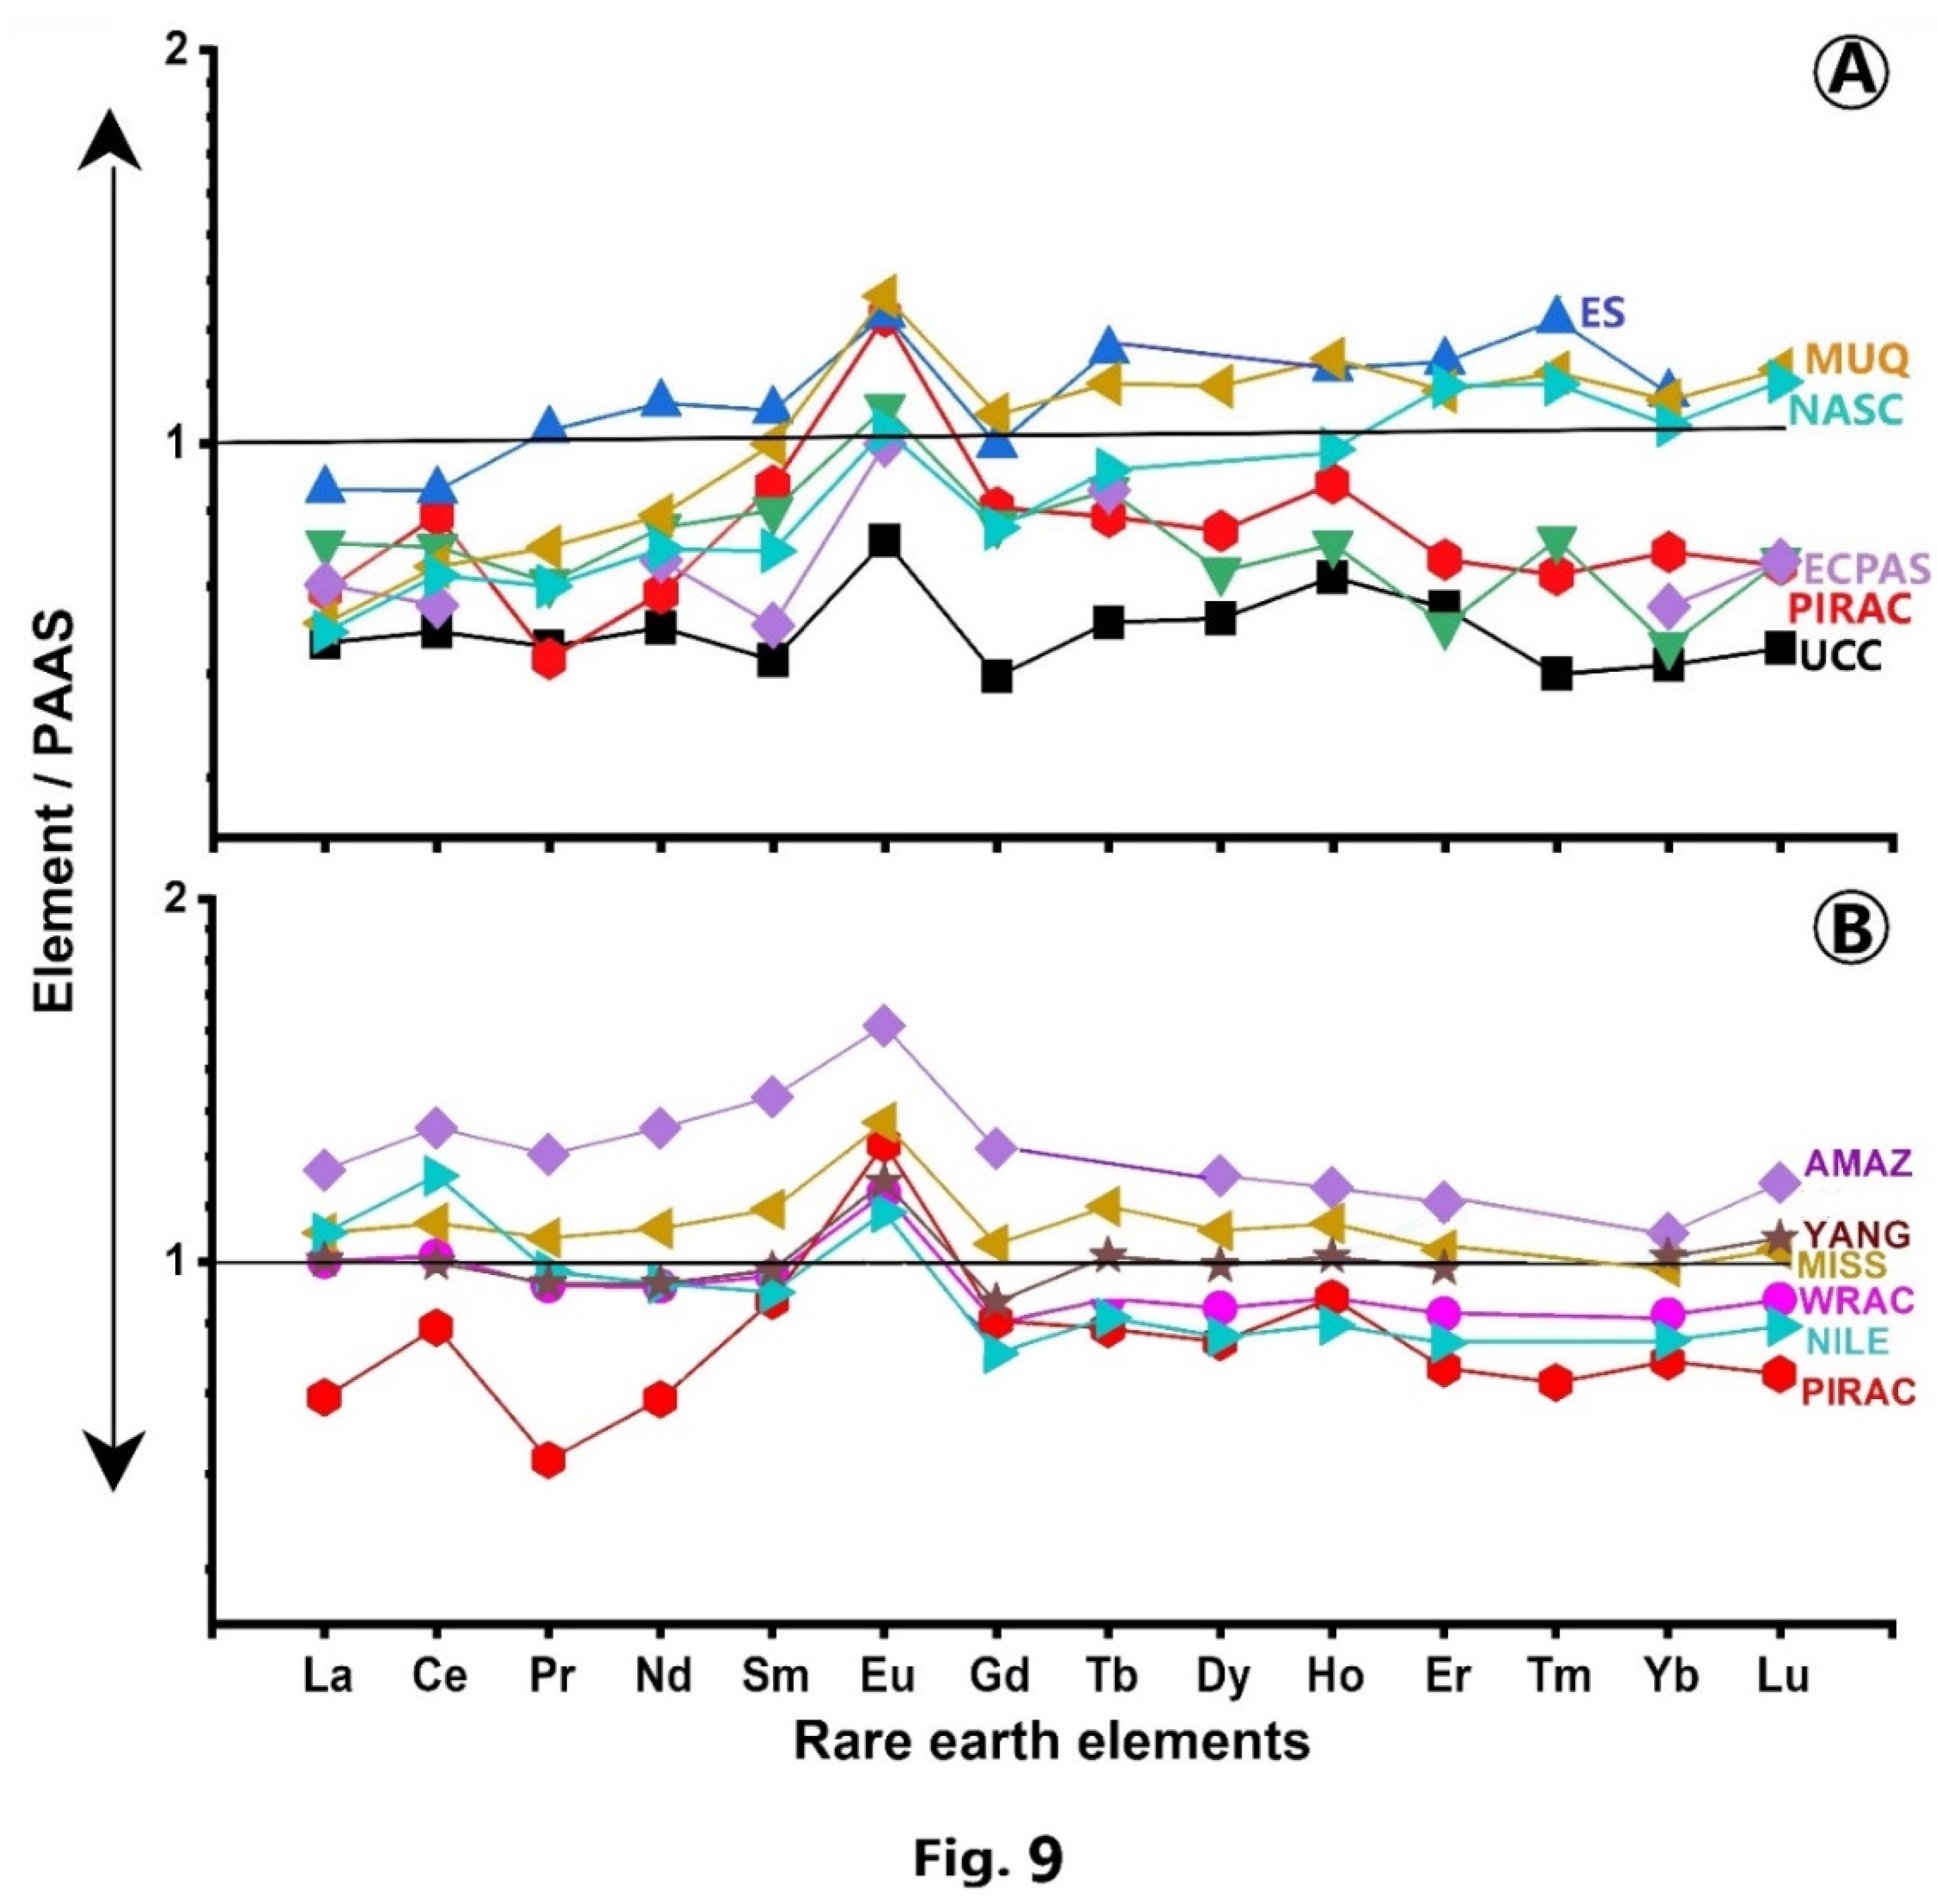

Table 1.
Major element content (%) of the clay (<4 μm) fraction of sediments in the rivers of the east coast and west coast of India.
Table 1.
Major element content (%) of the clay (<4 μm) fraction of sediments in the rivers of the east coast and west coast of India.
| East coast rivers draining APT (6) | Rivers | SiO2 | Al2O3 | Fe2O3 | FeO | MnO | CaO | MgO | K2O | Na2O | TiO2 | P2O5 | SiO2/Al2O3 | Al2O3/TiO2 | CIA | PIA | ICV |
| Range | 52.35-55.96 | 17.68-22.95 | 11.46-13.07 | 10.31-11.76 | 0.11-0.58 | 0.36-1.91 | 2.29-4.39 | 1.59-2.51 | 0.64-1.80 | 0.72-1.72 | 0.18-0.55 | 2.32-3.17 | 10.82-31.74 | 77.10-86.73 | 83.02-94.26 | 0.83-1.30 | |
| Avg. | 53.42 | 19.82 | 12.24 | 11.01 | 0.25 | 1.16 | 3.34 | 2.01 | 1.26 | 0.95 | 0.27 | 2.72 | 22.85 | 81.59 | 87.90s | 1.09 | |
| STD (±) | 1.32 | 2.21 | 0.60 | 0.54 | 0.18 | 0.70 | 0.98 | 0.41 | 0.45 | 0.38 | 0.14 | 0.32 | 7.04 | 3.46 | 4.27 | 0.20 | |
| West coast rivers draining APT (52) | Range | 29.01-52.33 | 11.37-32.01 | 6.32-17.71 | 5.69-15.94 | 0.02-0.58 | 0.11-2.96 | 0.29-3.87 | 0.51-2.88 | 0.06-25.28 | 0.71-1.97 | 0.10-0.83 | 1.05-2.91 | 9.23-37.04 | 79.64-96.60 | 73.35-94.35 | 0.44-3.76 |
| Avg. | 38.89 | 20.82 | 12.34 | 11.10 | 0.11 | 0.59 | 1.65 | 1.21 | 1.80 | 1.21 | 0.35 | 1.95 | 18.10 | 86.85 | 81.81 | 0.98 | |
| STD (±) | 5.11 | 3.82 | 2.42 | 2.18 | 0.10 | 0.44 | 0.85 | 0.44 | 4.79 | 0.27 | 0.15 | 0.47 | 5.77 | 13.17 | 13.95 | 0.55 | |
| APT (58) | Range | 29.01-55.96 | 11.37-32.01 | 6.32-17.71 | 5.69-15.94 | 0.02-0.58 | 0.11-2.96 | 0.29-4.39 | 0.51-2.88 | 0.06-25.28 | 0.71-1.97 | 0.10-0.83 | 1.05-3.17 | 9.23-37.04 | 77.10-96.60 | 73.35-94.35 | 0.44-3.76 |
| Avg. | 40.39 | 20.71 | 12.33 | 11.09 | 0.13 | 0.65 | 1.83 | 1.29 | 1.75 | 1.18 | 0.34 | 2.03 | 18.59 | 86.30 | 82.44 | 0.99 | |
| STD (±) | 6.59 | 3.68 | 2.30 | 2.07 | 0.11 | 0.49 | 1.00 | 0.50 | 4.54 | 0.29 | 0.15 | 0.52 | 6.02 | 12.61 | 13.39 | 0.53 | |
| East coast rivers draining DVT (4) | Range | 51.70-54.56 | 15.81-22.16 | 12.21-14.55 | 10.99-13.09 | 0.13-0.19 | 0.98-1.46 | 2.69-4.39 | 1.91-2.24 | 0.51-3.55 | 1.12-1.58 | 0.12-0.23 | 2.33-3.45 | 10.89-19.76 | 69.58-81.49 | 73.52-90.23 | 1.10-1.78 |
| Avg. | 53.15 | 17.75 | 13.85 | 12.46 | 0.15 | 1.13 | 3.90 | 2.05 | 2.59 | 1.28 | 0.17 | 3.06 | 14.26 | 75.54 | 81.19 | 1.43 | |
| STD (±) | 19.95 | 9.79 | 5.75 | 5.18 | 0.01 | 0.11 | 0.53 | 0.48 | 1.69 | 0.52 | 0.11 | 0.88 | 7.33 | 42.39 | 39.70 | 0.26 | |
| West coast rivers draining DVT (21) | Range | 28.32-51.21 | 13.71-21.65 | 3.13-14.67 | 2.82-13.20 | 0.07-0.44 | 0.26-2.10 | 0.79-5.72 | 0.55-1.34 | 0.12-13.22 | 0.63-2.98 | 0.06-0.54 | 1.87-3.32 | 7.27-29.27 | 78.14-94.06 | 72.31-91.36 | 0.42-2.13 |
| Avg. | 42.28 | 16.90 | 10.75 | 9.67 | 0.18 | 1.07 | 2.23 | 0.91 | 1.09 | 1.51 | 0.25 | 2.54 | 11.98 | 85.19 | 80.59 | 1.08 | |
| STD (±) | 4.74 | 2.28 | 2.51 | 2.26 | 0.10 | 0.53 | 1.20 | 0.29 | 2.79 | 0.44 | 0.10 | 0.42 | 4.33 | 9.25 | 9.28 | 0.34 | |
| DVT (25) | Range | 28.32-54.56 | 13.71-22.16 | 3.13-14.67 | 2.82-13.20 | 0.07-0.44 | 0.26-2.10 | 0.79-5.72 | 0.55-2.24 | 0.12-13.22 | 0.63-2.98 | 0.06-0.54 | 1.87-3.45 | 7.27-29.27 | 69.58-94.06 | 72.31-91.36 | 0.42-2.13 |
| Avg. | 44.01 | 17.03 | 11.24 | 10.12 | 0.17 | 1.08 | 2.50 | 1.09 | 1.33 | 1.48 | 0.23 | 2.62 | 12.35 | 83.64 | 80.69 | 1.14 | |
| STD (±) | 5.97 | 2.36 | 2.60 | 2.34 | 0.09 | 0.49 | 1.33 | 0.50 | 2.66 | 0.42 | 0.10 | 0.46 | 4.27 | 9.37 | 8.83 | 0.35 | |
| East coast rivers draining MLT (4) | Range | 53.19-58.21 | 20.10-22.18 | 10.6-12.24 | 9.61-11.01 | 0.07-0.18 | 0.36-0.62 | 2.32-3.37 | 2.47-3.24 | 0.61-2.10 | 0.93-1.09 | 0.16-0.17 | 2.39-2.89 | 18.36-22.45 | 79.04-84.56 | 86.78-94.73 | 0.89-1.03 |
| Avg. | 56.16 | 20.93 | 11.47 | 10.32 | 0.15 | 0.47 | 2.82 | 2.79 | 1.46 | 1.01 | 0.17 | 2.69 | 20.77 | 81.56 | 90.52 | 0.96 | |
| STD (±) | 2.13 | 0.89 | 0.66 | 0.60 | 0.05 | 0.12 | 0.46 | 0.32 | 0.62 | 0.08 | 0.01 | 0.21 | 1.75 | 2.83 | 3.31 | 0.07 | |
| West coast rivers draining MLT (17) | Range | 42.88-50.36 | 13.04-16.24 | 6.13-10.57 | 5.52-9.51 | 0.10-0.24 | 1.65-6.38 | 2.51-4.29 | 0.66-1.83 | 0.18-1.31 | 0.99-2.20 | 0.11-0.36 | 2.71-3.77 | 7.38-16.10 | 69.91-84.18 | 62.26-80.77 | 0.88-1.65 |
| Avg. | 47.35 | 14.43 | 8.91 | 8.02 | 0.15 | 3.05 | 3.39 | 1.29 | 0.54 | 1.44 | 0.17 | 3.29 | 10.39 | 75.01 | 68.39 | 1.31 | |
| STD (±) | 2.50 | 0.86 | 1.10 | 0.99 | 0.03 | 1.06 | 0.49 | 0.38 | 0.36 | 0.29 | 0.07 | 0.29 | 2.06 | 5.43 | 6.70 | 0.17 | |
| MLT (21) | Range | 42.88-58.21 | 13.04-22.18 | 6.13-12.24 | 5.52-11.01 | 0.07-0.24 | 0.36-6.38 | 2.32-4.29 | 0.66-3.24 | 0.18-2.10 | 0.93-2.20 | 0.11-0.36 | 2.39-3.77 | 7.38-22.45 | 69.91-84.56 | 62.26-94.73 | 0.88-1.65 |
| Avg. | 49.03 | 15.67 | 9.40 | 8.45 | 0.15 | 2.56 | 3.28 | 1.58 | 0.71 | 1.36 | 0.17 | 3.18 | 12.37 | 76.26 | 72.60 | 1.24 | |
| STD (±) | 4.27 | 2.75 | 1.45 | 1.30 | 0.03 | 1.41 | 0.52 | 0.70 | 0.55 | 0.31 | 0.07 | 0.37 | 4.62 | 5.63 | 10.81 | 0.20 | |
| PIRAC (104) | Over all range | 28.32-58.21 | 11.37-32.01 | 3.13-17.71 | 2.82-15.94 | 0.02-0.58 | 0.11-6.38 | 0.29-5.72 | 0.51-3.24 | 0.06-25.28 | 0.63-2.98 | 0.06-0.83 | 1.05-3.77 | 7.27-37.04 | 69.58-96.60 | 62.26-94.73 | 0.42-3.76 |
| Over all avg. | 43.01 | 18.81 | 11.48 | 10.33 | 0.14 | 1.14 | 2.28 | 1.30 | 1.44 | 1.29 | 0.28 | 2.29 | 14.61 | 83.64 | 80.03 | 1.07 | |
| Over all STD (±) | 1.20 | 0.68 | 0.60 | 0.54 | 0.04 | 0.53 | 0.40 | 0.12 | 2.00 | 0.07 | 0.04 | 0.08 | 0.93 | 3.49 | 2.29 | 0.16 | |
| Reference Sediments | UCC | 66.20 | 15.30 | 5.57 | 5.01 | 0.09 | 3.57 | 2.47 | 2.78 | 3.25 | 0.63 | 0.15 | 4.33 | 24.29 | 61.44 | 50.28 | 1.20 |
| PAAS | 62.80 | 18.90 | 7.22 | 6.50 | 0.11 | 1.30 | 2.20 | 3.70 | 1.20 | 1.00 | 0.16 | 3.32 | 18.90 | 75.29 | 60.56 | 0.89 |
CIA: Chemical Index of Alteration [57]; PIA: Plagioclase Index of Alteration [58]; ICV: Index of Chemical Variability [6,89]; APT: Archean–Proterozoic Terrain (this study); DVT: Deccan trap Volcanic Terrain (this study); MLT: Mixed Lithology Terrain (this study); PIRAC: Peninsular India River Average Clay (this study); UCC: Upper Continental Crust [16]; PAAS: Post-Archean average Australian Shale [18].
Table 2.
Trace element content (μg/g) of the clay fraction (<4 μm) of sediments in the rivers of the east coast and west coast of India.
Table 2.
Trace element content (μg/g) of the clay fraction (<4 μm) of sediments in the rivers of the east coast and west coast of India.
| East coast rivers draining APT (6) | Rivers | Sc | V | Cr | Co | Ni | Cu | Zn | Pb | ∑TTE | Zr | Hf | Ta | Nb | Th | Ga | U | ∑HFSE | Rb | Sr | Ba | Cs | ∑LILE | ∑TE |
| Range | 12.85-23.79 | 71.72-119.76 | 100.03-168.92 | 19.28-38.89 | 1.87-84.93 | 137.37-1068.14 | 274.03-1519.56 | 38.34-163.19 | 803.74-3003.92 | 45.16-102.34 | 1.37-2.97 | 0.45-0.94 | 4.76-9.02 | 6.25-16.04 | 11.87-18.30 | 1.34-2.75 | 73.30-151.62 | 47.69-124.64 | 68.41-172.29 | 189.59-439.51 | 1.51-6.41 | 344.65-595.68 | 1494.10-3542.98 | |
| Avg. | 16.96 | 96.37 | 119.49 | 25.98 | 69.68 | 429.06 | 776.62 | 79.89 | 1614.06 | 60.60 | 1.83 | 0.61 | 6.25 | 9.36 | 15.22 | 1.74 | 95.60 | 78.61 | 108.57 | 303.30 | 3.28 | 493.75 | 2203.41 | |
| STD (±) | 4.66 | 16.14 | 25.08 | 6.74 | 8.85 | 355.00 | 466.29 | 52.80 | 797.87 | 21.47 | 0.58 | 0.18 | 1.57 | 3.62 | 3.01 | 0.53 | 29.79 | 32.91 | 37.91 | 89.50 | 2.01 | 84.57 | 747.30 | |
| West coast rivers draining APT (52) | Range | 14.31-36.60 | 111.23-347.62 | 82.78-897.43 | 11.40-55.13 | 42.60-129.46 | 29.21-231.78 | 29.81-195.44 | 12.15-88.87 | 459.84-1605.29 | 106.62-393.67 | 3.65-10.59 | 0.74-2.39 | 11-26.54 | 7.10-25.70 | 23.87-39.11 | 1.54-7.62 | 175.31-474.78 | 31.91-91.32 | 29.47-160.75 | 104.13-805.44 | 2.40-7.33 | 168.83-1030.55 | 991.58-2027.72 |
| Avg. | 24.47 | 205.86 | 182.28 | 27.88 | 66.90 | 106.50 | 74.21 | 32.27 | 720.37 | 182.54 | 5.39 | 1.29 | 15.72 | 12.82 | 31.75 | 3.59 | 253.10 | 64.44 | 65.91 | 261.40 | 4.61 | 396.36 | 1370.57 | |
| STD (±) | 5.37 | 55.03 | 110.18 | 9.50 | 15.70 | 45.14 | 31.88 | 12.63 | 184.95 | 56.01 | 1.35 | 0.38 | 3.18 | 4.07 | 4.29 | 1.42 | 58.60 | 15.63 | 24.39 | 163.37 | 1.39 | 184.46 | 192.98 | |
| APT (58) | Range | 12.85-36.60 | 71.72-347.62 | 82.78-897.43 | 11.40-55.13 | 42.60-129.46 | 29.21-1068.14 | 29.81-1519.56 | 12.15-163.19 | 459.84-3003.92 | 45.16-393.67 | 1.37-10.59 | 0.45-2.39 | 4.76-26.54 | 6.25-25.70 | 11.87-39.11 | 1.34-7.62 | 73.30-474.78 | 31.91-124.64 | 29.47-172.29 | 104.13-805.44 | 1.51-7.33 | 168.83-1030.55 | 991.58-3542.98 |
| Avg. | 23.69 | 194.53 | 175.78 | 27.68 | 67.19 | 139.87 | 146.88 | 37.20 | 812.82 | 169.93 | 5.02 | 1.22 | 14.74 | 12.46 | 30.04 | 3.40 | 236.81 | 65.91 | 70.32 | 265.73 | 4.48 | 406.44 | 1456.73 | |
| STD (±) | 5.75 | 62.16 | 106.25 | 9.23 | 15.10 | 150.66 | 257.96 | 24.52 | 402.27 | 65.20 | 1.69 | 0.42 | 4.21 | 4.14 | 6.56 | 1.47 | 74.10 | 18.23 | 28.81 | 157.32 | 1.50 | 178.79 | 384.41 | |
| East coast rivers draining DVT (4) | Range | 23.89-26.25 | 156.52-201.09 | 117.10-142.33 | 26.27-33.86 | 72.84-77.17 | 71.48-228.60 | 324.38-467.08 | 17.38-47.34 | 869.88-1101.33 | 110.91-129.76 | 3.11-3.66 | 0.74-1.09 | 7.20-11.24 | 7.70-18.34 | 16.52-20.69 | 1.74-2.90 | 156.24-177.61 | 68.56-106.35 | 75.41-124.79 | 130.67-325.64 | 3.72-5.44 | 301.89-549.25 | 1528.03-1818.88 |
| Avg. | 25.09 | 181.88 | 130.78 | 30.58 | 75.46 | 164.54 | 387.30 | 28.19 | 1023.80 | 119.43 | 3.30 | 0.88 | 9.33 | 12.76 | 19.26 | 2.17 | 167.12 | 91.86 | 103.64 | 235.32 | 4.71 | 435.52 | 1626.44 | |
| STD (±) | 1.17 | 18.60 | 11.33 | 3.15 | 1.89 | 70.05 | 59.92 | 13.15 | 104.47 | 7.78 | 0.25 | 0.16 | 1.67 | 4.35 | 1.94 | 0.52 | 16.67 | 16.35 | 21.64 | 87.04 | 0.72 | 115.09 | 133.09 | |
| West coast rivers draining DVT (21) | Range | 26.37-58.58 | 194.68-465.37 | 86.19-267.99 | 27.04-70.84 | 53.67-104.42 | 133.71-275.27 | 64.06-192.93 | 8.60-39.25 | 701.90-1290.95 | 158.73-321.44 | 4.32-9.14 | 0.90-1.71 | 9.00-18.22 | 5.40-18.30 | 23.35-45.46 | 1-5.90 | 225.35-402.31 | 26.92-92.18 | 42.27-217.87 | 128.84-362.78 | 1.67-7.82 | 230.14-464.08 | 1361.72-1981.02 |
| Avg. | 40.15 | 343.61 | 159.77 | 48.83 | 67.89 | 204.18 | 102.43 | 23.46 | 990.31 | 248.78 | 6.80 | 1.25 | 12.77 | 8.65 | 30.10 | 2.69 | 311.04 | 49.72 | 75.98 | 193.89 | 4.01 | 323.61 | 1625.86 | |
| STD (±) | 8.21 | 75.77 | 46.99 | 12.27 | 12.02 | 47.94 | 32.05 | 8.44 | 133.75 | 45.46 | 1.23 | 0.25 | 2.94 | 3.33 | 4.77 | 1.38 | 49.59 | 19.26 | 39.00 | 59.51 | 1.82 | 62.83 | 164.40 | |
| DVT (25) | Range | 23.89-58.58 | 156.52-465.37 | 86.19-267.99 | 26.27-70.84 | 53.67-104.42 | 71.48-275.27 | 64.06-467.08 | 8.60-47.34 | 701.90-1290.95 | 110.91-321.44 | 3.11-9.14 | 0.74-1.71 | 7.20-18.22 | 5.40-18.34 | 16.52-45.46 | 1-5.90 | 156.24-402.31 | 26.92-106.35 | 42.27-217.87 | 128.84-362.78 | 1.67-7.82 | 230.14-549.25 | 1361.72-1981.02 |
| Avg. | 37.74 | 317.73 | 155.13 | 45.91 | 69.10 | 197.84 | 148.01 | 24.22 | 995.67 | 228.09 | 6.24 | 1.19 | 12.22 | 9.31 | 28.36 | 2.61 | 288.01 | 56.46 | 80.41 | 200.52 | 4.12 | 341.51 | 1625.96 | |
| STD (±) | 9.39 | 92.13 | 44.43 | 13.16 | 11.35 | 52.43 | 112.54 | 9.17 | 128.17 | 63.81 | 1.73 | 0.27 | 3.03 | 3.74 | 5.99 | 1.29 | 70.41 | 24.32 | 37.85 | 64.33 | 1.70 | 81.85 | 157.28 | |
| East coast rivers draining MLT (4) | Range | 14.89-20.99 | 94.87-141.72 | 101.38-142.52 | 19.58-40.87 | 58.12-70.21 | 57.27-104.42 | 113.83-199.89 | 32.91-40.76 | 595.89-662.38 | 65.94-103.96 | 1.79-2.83 | 0.75-1.14 | 7.96-12.54 | 12.77-19.76 | 15.79-21.89 | 1.97-3.56 | 107.82-165.19 | 99.79-139.21 | 47.38-78.51 | 257.20-549.52 | 8.10-9.58 | 440.41-705.59 | 1168.26-1484.84 |
| Avg. | 18.88 | 123.11 | 124.79 | 25.90 | 63.05 | 76.29 | 159.28 | 36.17 | 627.45 | 90.02 | 2.46 | 1.03 | 10.86 | 16.13 | 19.94 | 2.76 | 143.20 | 121.77 | 64.28 | 353.09 | 8.82 | 547.96 | 1318.61 | |
| STD (±) | 2.77 | 20.43 | 18.91 | 10.07 | 5.85 | 19.99 | 40.45 | 3.45 | 27.61 | 16.60 | 0.46 | 0.19 | 2.04 | 3.46 | 2.81 | 0.67 | 24.72 | 18.84 | 13.03 | 134.97 | 0.61 | 114.13 | 129.57 | |
| West coast rivers draining MLT (17) | Range | 27.05-43.05 | 164.99-424.37 | 105.93-968.39 | 28.29-91.34 | 42.41-536.77 | 110.88-391.21 | 52.22-697.89 | 11.17-77.11 | 590.30-3112.0 | 182.27-270.61 | 4.95-7.04 | 0.97-1.58 | 11.19-15.16 | 6.82-14.28 | 23.01-30.96 | 1.14-2.44 | 238.53-334.34 | 41.54-101.18 | 83.44-374.89 | 163.61-382.99 | 3.45-8.56 | 347.13-698.85 | 1249.82-3734.38 |
| Avg. | 36.24 | 264.24 | 172.99 | 40.26 | 75.47 | 165.34 | 117.30 | 21.67 | 893.51 | 221.23 | 5.90 | 1.22 | 13.05 | 8.73 | 25.96 | 1.58 | 277.69 | 65.38 | 129.26 | 225.60 | 5.02 | 425.26 | 1597.76 | |
| STD (±) | 3.93 | 73.68 | 205.49 | 13.68 | 118.93 | 66.20 | 151.43 | 15.57 | 580.95 | 22.51 | 0.58 | 0.16 | 1.09 | 1.77 | 1.94 | 0.33 | 24.01 | 15.48 | 65.98 | 56.85 | 1.20 | 106.92 | 565.46 | |
| MLT (21) | Range | 14.89-43.05 | 94.87-424.37 | 101.38-968.39 | 19.58-91.34 | 42.41-536.77 | 57.27-391.21 | 52.22-697.89 | 11.17-77.11 | 590.30-3112.70 | 65.94-270.61 | 1.79-7.04 | 0.75-1.58 | 7.96-15.16 | 6.82-19.76 | 15.79-30.96 | 1.14-3.56 | 107.82-334.34 | 41.54-139.21 | 47.38-374.89 | 163.61-549.52 | 3.45-9.58 | 347.13-705.59 | 1168.26-3734.38 |
| Avg. | 32.93 | 237.35 | 163.81 | 37.53 | 73.10 | 148.38 | 125.30 | 24.43 | 842.84 | 196.24 | 5.25 | 1.19 | 12.64 | 10.14 | 24.82 | 1.81 | 252.07 | 76.12 | 116.88 | 249.88 | 5.74 | 448.63 | 1544.58 | |
| STD (±) | 7.89 | 87.35 | 184.96 | 14.08 | 106.52 | 69.64 | 137.39 | 15.16 | 530.64 | 56.87 | 1.49 | 0.18 | 1.54 | 3.63 | 3.17 | 0.62 | 59.00 | 27.56 | 64.74 | 89.16 | 1.88 | 116.35 | 520.51 | |
| PIRAC (104) | Over all range | 12.85-58.58 | 71.72-465.37 | 82.78-968.39 | 11.40-91.34 | 42.41-536.77 | 29.21-1068.14 | 29.81-1519.56 | 8.60-163.19 | 459.84-3112.70 | 45.16-393.67 | 1.37-10.59 | 0.45-2.39 | 4.76-26.54 | 5.40-25.0 | 11.87-45.46 | 1.14-7.62 | 73.30-474.78 | 26.92-139.21 | 29.47-374.89 | 128.84-805.44 | 1.51-9.58 | 168.83-1030.55 | 991.58-3542.98 |
| Over all avg. | 28.94 | 232.79 | 168.40 | 34.05 | 68.84 | 155.52 | 142.79 | 31.50 | 862.84 | 189.22 | 5.36 | 1.21 | 13.71 | 11.24 | 28.58 | 2.89 | 252.20 | 65.70 | 82.15 | 246.86 | 4.65 | 399.35 | 1515.15 | |
| Over all STD (±) | 1.83 | 16.11 | 70.43 | 2.58 | 53.90 | 52.45 | 77.78 | 7.74 | 353.69 | 4.46 | 0.13 | 0.12 | 1.34 | 0.27 | 1.81 | 0.45 | 67.83 | 4.74 | 18.69 | 48.14 | 0.19 | 126.66 | 183.51 | |
| Reference Sediments | UCC | 14.00 | 97.00 | 92.30 | 17.30 | 47.30 | 27.70 | 67.00 | 17.00 | 379.60 | 193.00 | 5.26 | 0.88 | 11.80 | 10.10 | 17.50 | 2.63 | 241.17 | 82.00 | 320.00 | 624.00 | 4.10 | 1030.10 | 1650.87 |
| PAAS | 15.89 | 150.00 | 110.00 | 23.00 | 55.00 | 50.00 | 85.00 | 20.00 | 508.89 | 210.00 | 5.00 | 1.50 | 19.00 | 14.60 | 20.00 | 3.10 | 273.20 | 160.00 | 200.00 | 650.00 | 15.00 | 1025.00 | 1807.09 |
Table 3.
Rare earth element content (μg/g) of the clay fraction (<4 μm) of sediments in the rivers of the east coast and west coast of India.
Table 3.
Rare earth element content (μg/g) of the clay fraction (<4 μm) of sediments in the rivers of the east coast and west coast of India.
| East coast rivers draining APT (6) | Rivers | La | Ce | Pr | Nd | Sm | Eu | Gd | Tb | Dy | Y | Ho | Er | Tm | Yb | Lu | ∑REE |
| Range | 29.71-45.41 | 65.09-105.38 | 6.13-9.42 | 25.02-39.53 | 4.76-8.58 | 1.17-2.04 | 3.84-8.95 | 0.59-1.65 | 3.19-9.90 | 18.48-60.49 | 0.67-2.21 | 1.82-6.28 | 0.23-0.82 | 1.56-5.42 | 0.24-0.84 | 144.02-246.43 | |
| Avg. | 36.71 | 81.31 | 7.45 | 30.62 | 6.20 | 1.46 | 5.71 | 0.99 | 5.70 | 33.76 | 1.24 | 3.47 | 0.45 | 2.98 | 0.46 | 184.72 | |
| STD (±) | 5.61 | 15.37 | 1.20 | 5.14 | 1.34 | 0.31 | 1.95 | 0.43 | 2.78 | 17.37 | 0.63 | 1.84 | 0.24 | 1.58 | 0.24 | 36.04 | |
| West coast rivers draining APT (52) | Range | 8.04-95.77 | 29.50-179.62 | 1.36-21.94 | 5.80-78.96 | 1.34-13.80 | 0.30-3.34 | 1.10-10.46 | 0.17-1.43 | 1.29-7.04 | 8.57-32.17 | 0.32-1.30 | 0.75-3.50 | 0.16-0.47 | 1.24-3.34 | 0.14-0.55 | 51.80-421.07 |
| Avg. | 37.98 | 84.62 | 7.48 | 28.22 | 5.69 | 1.32 | 4.63 | 0.68 | 3.85 | 21.51 | 0.80 | 1.99 | 0.31 | 2.31 | 0.33 | 180.20 | |
| STD (±) | 20.32 | 32.32 | 4.52 | 15.02 | 2.47 | 0.60 | 2.03 | 0.31 | 1.47 | 6.12 | 0.25 | 0.84 | 0.09 | 0.56 | 0.11 | 78.69 | |
| APT (58) | Range | 8.04-95.77 | 29.50-179.62 | 1.36-21.94 | 5.80-78.96 | 1.34-13.80 | 0.30-3.34 | 1.10-10.46 | 0.17-1.65 | 1.29-9.90 | 8.57-60.49 | 0.32-2.21 | 0.75-6.28 | 0.16-0.82 | 1.24-5.42 | 0.14-0.84 | 51.80-421.07 |
| Avg. | 37.85 | 84.28 | 7.47 | 28.47 | 5.74 | 1.34 | 4.74 | 0.71 | 4.04 | 22.78 | 0.85 | 2.14 | 0.33 | 2.38 | 0.34 | 180.67 | |
| STD (±) | 19.29 | 30.92 | 4.29 | 14.31 | 2.38 | 0.57 | 2.03 | 0.34 | 1.72 | 8.61 | 0.33 | 1.06 | 0.12 | 0.73 | 0.13 | 75.21 | |
| East coast rivers draining DVT (4) | Range | 23.34-63.18 | 54.83-126.78 | 5.31-11.93 | 23.26-48.01 | 5.19-9.44 | 1.45-2.26 | 4.96-8.38 | 0.86-1.39 | 4.83-7.73 | 27.39-44.29 | 1.03-1.64 | 2.82-4.42 | 0.36-0.56 | 2.38-3.58 | 0.36-0.55 | 130.98-289.85 |
| Avg. | 39.46 | 83.34 | 8.05 | 33.65 | 7.02 | 1.78 | 6.35 | 1.08 | 6.09 | 34.17 | 1.30 | 3.54 | 0.45 | 2.95 | 0.45 | 195.51 | |
| STD (±) | 16.97 | 30.91 | 2.82 | 10.55 | 1.84 | 0.36 | 1.50 | 0.23 | 1.26 | 7.64 | 0.26 | 0.68 | 0.08 | 0.52 | 0.08 | 67.95 | |
| West coast rivers draining DVT (21) | Range | 20.09-46.22 | 45.04-127.80 | 4.32-9.00 | 19.19-41.57 | 4.84-10.43 | 1.10-2.78 | 3.67-9.88 | 0.51-1.36 | 3.25-8.28 | 20.65-54.55 | 0.71-1.85 | 1.46-4.93 | 0.26-0.62 | 2.05-3.92 | 0.24-0.54 | 114.18-244.20 |
| Avg. | 28.20 | 68.63 | 6.04 | 29.00 | 7.60 | 1.91 | 6.62 | 0.90 | 5.47 | 34.76 | 1.21 | 2.95 | 0.41 | 2.80 | 0.36 | 162.09 | |
| STD (±) | 6.90 | 19.88 | 1.23 | 5.75 | 1.56 | 0.46 | 1.66 | 0.22 | 1.31 | 8.95 | 0.29 | 1.00 | 0.09 | 0.47 | 0.07 | 32.55 | |
| DVT (25) | Range | 20.09-63.18 | 45.04-127.80 | 4.32-11.93 | 19.19-48.01 | 4.84-10.43 | 1.10-2.78 | 3.67-9.88 | 0.51-1.39 | 3.25-8.28 | 20.65-54.55 | 0.71-1.85 | 1.46-4.93 | 0.26-0.62 | 2.05-3.92 | 0.24-0.55 | 114.18-289.85 |
| Avg. | 30.00 | 70.99 | 6.36 | 29.74 | 7.51 | 1.89 | 6.58 | 0.93 | 5.57 | 34.67 | 1.22 | 3.04 | 0.42 | 2.83 | 0.37 | 167.43 | |
| STD (±) | 9.66 | 21.89 | 1.68 | 6.67 | 1.58 | 0.44 | 1.61 | 0.23 | 1.30 | 8.61 | 0.28 | 0.97 | 0.09 | 0.47 | 0.08 | 40.20 | |
| East coast rivers draining MLT (4) | Range | 34.96-57.54 | 73.69-160.24 | 7.08-11.26 | 25.99-45.28 | 4.82-8.95 | 1.10-1.93 | 4.37-7.81 | 0.73-1.33 | 4.46-7.41 | 26.74-42.96 | 1.01-1.61 | 2.75-4.47 | 0.35-0.57 | 2.28-3.70 | 0.34-0.55 | 169.03-270.65 |
| Avg. | 44.61 | 113.26 | 8.71 | 34.66 | 6.85 | 1.50 | 6.05 | 1.01 | 5.74 | 33.09 | 1.25 | 3.49 | 0.45 | 2.99 | 0.45 | 231.01 | |
| STD (±) | 10.52 | 36.29 | 2.12 | 8.93 | 1.87 | 0.38 | 1.56 | 0.27 | 1.40 | 7.59 | 0.29 | 0.78 | 0.09 | 0.59 | 0.09 | 44.42 | |
| West coast rivers draining MLT (17) | Range | 20.98-35.59 | 47.12-71.31 | 4.63-6.77 | 22.27-29.97 | 6.04-7.47 | 1.33-1.79 | 5.10-6.31 | 0.68-0.84 | 4.07-5.01 | 26.26-32.46 | 0.90-1.11 | 2.45-2.97 | 0.32-0.38 | 2.01-2.39 | 0.28-0.33 | 118.54-167.96 |
| Avg. | 26.78 | 57.51 | 5.62 | 26.51 | 6.85 | 1.59 | 5.76 | 0.77 | 4.60 | 29.64 | 1.01 | 2.74 | 0.35 | 2.23 | 0.31 | 142.64 | |
| STD (±) | 3.70 | 5.57 | 0.56 | 2.23 | 0.45 | 0.14 | 0.42 | 0.06 | 0.33 | 2.19 | 0.07 | 0.19 | 0.02 | 0.14 | 0.02 | 12.50 | |
| MLT (21) | Range | 20.98-57.54 | 47.12-160.24 | 4.63-11.26 | 22.27-45.28 | 4.82-8.95 | 1.10-1.93 | 4.37-7.81 | 0.68-1.33 | 4.07-7.41 | 26.26-42.96 | 0.90-1.61 | 2.45-4.47 | 0.32-0.57 | 2.01-3.70 | 0.28-0.55 | 118.54-270.65 |
| Avg. | 30.17 | 68.13 | 6.21 | 28.06 | 6.85 | 1.57 | 5.82 | 0.82 | 4.81 | 30.30 | 1.06 | 2.88 | 0.37 | 2.38 | 0.34 | 159.47 | |
| STD (±) | 8.89 | 26.94 | 1.57 | 5.17 | 0.83 | 0.20 | 0.72 | 0.15 | 0.77 | 3.80 | 0.16 | 0.46 | 0.06 | 0.40 | 0.07 | 41.05 | |
| PIRAC (104) | Over all range | 8.04-95.77 | 29.50-179.62 | 1.36-21.94 | 5.80-78.96 | 1.34-13.80 | 0.30-3.34 | 1.10-10.46 | 0.17-1.65 | 1.29-9.90 | 8.57-60.49 | 0.32-2.21 | 0.75-6.28 | 0.16-0.82 | 1.24-5.42 | 0.14-0.84 | 51.80-421.07 |
| Over all avg. | 34.41 | 77.82 | 6.95 | 28.69 | 6.39 | 1.52 | 5.40 | 0.78 | 4.56 | 27.15 | 0.98 | 2.51 | 0.36 | 2.49 | 0.35 | 173.21 | |
| Over all STD (±) | 5.80 | 4.53 | 1.54 | 4.90 | 0.77 | 0.19 | 0.67 | 0.09 | 0.47 | 2.78 | 0.09 | 0.33 | 0.03 | 0.18 | 0.04 | 19.97 | |
| Reference Sediments | UCC | 31.40 | 63.40 | 7.10 | 27.00 | 4.70 | 1.02 | 4.01 | 0.65 | 3.91 | 21.00 | 0.83 | 2.30 | 0.30 | 2.04 | 0.30 | 148.96 |
| PAAS | 44.56 | 88.25 | 10.15 | 37.32 | 6.88 | 1.21 | 6.04 | 0.89 | 5.32 | 27.31 | 1.05 | 3.07 | 0.45 | 3.01 | 0.43 | 208.63 |
LREE-La to Nd; MREE-Sm to Ho; HREE-Er to Lu [90]; APT: Archean–Proterozoic Terrain (this study); DVT: Deccan trap Volcanic Terrain (this study); MLT: Mixed Lithology Terrain (this study); PIRAC: Peninsular India River Average Clay (this study); UCC: Upper Continental Crust [16]; PAAS: Post-Archean average Australian Shale [18].
Disclaimer/Publisher’s Note: The statements, opinions and data contained in all publications are solely those of the individual author(s) and contributor(s) and not of MDPI and/or the editor(s). MDPI and/or the editor(s) disclaim responsibility for any injury to people or property resulting from any ideas, methods, instructions or products referred to in the content. |
© 2026 by the authors. Licensee MDPI, Basel, Switzerland. This article is an open access article distributed under the terms and conditions of the Creative Commons Attribution (CC BY) license (http://creativecommons.org/licenses/by/4.0/).
Copyright: This open access article is published under a Creative Commons CC BY 4.0 license, which permit the free download, distribution, and reuse, provided that the author and preprint are cited in any reuse.