

Submitted:
09 August 2026
Posted:
11 August 2026
You are already at the latest version
Abstract
The current research aims to examine the impact of fluctuations in global financial market volatility, geopolitical risk, the energy transition, and global macroeconomic and structural control variables on crude oil prices in the modern global energy economy. The study uses annual time series data from 1990 to 2024 from international databases such as World Bank, the International Energy Agency (IEA), the Federal Reserve Economic Data (FRED), OPEC, and the Geopolitical Risk (GPR) Index database to estimate short- and long run relationships between the variables using the Autoregressive Distributed Lag (ARDL) and Error Correction Model (ECM) approaches, with FMOLS deployed for sensitivity analysis and robustness checks. The results indicate that financial market volatility can statistically reduce crude oil prices both in the short and long runs, affirming the global financial cycle theory. However, geopolitical risk is shown to have an insignificant effect on crude prices in the short and long runs. Furthermore, the energy transition has an increasing effect on crude oil prices in the short run. Geopolitical risk weakly alters the effect of global financial market volatility, but significantly shifts the energy transition from a reducing effect to an increasing one, with a threshold of 133.05. Regarding the control variables, OPEC allocation policy, global inflation, and the real GDP growth rate contribute to lowering crude oil prices, while changes in crude oil supply, oil future prices, urban population growth rate, and the U.S. index have an increasing effect on crude oil prices. The study suggests that better supervision of financial markets, international peace and global stability efforts, faster investments in renewable energies, and more comprehensive energy policy frameworks are needed to make energy markets more stable.
Keywords:
crude oil prices
; global financial market risk
; geopolitical risk
; energy transition
; ARDL model
; renewable energy
; oil market dynamics
1. Introduction
Traditional determinants of oil prices since 1973 have hinged primarily on disruptions in oil supply and demand, but oil price dynamics are becoming more complex with the emergence of renewable energy technologies, global financial market operations, and geopolitical risk factors (Esmaelli et al., 2024). Oil prices do not only respond to the traditional drivers (such as physical market fundamentals, including global demand conditions, oil production, oil inventories, refinery capacity utilization, and OPEC production quotas), but are now more intricately influenced by the interplay of structural, geopolitical, financial, and economic factors (Hamilton, 2020). In classical energy economics, changes in oil prices were mainly described in terms of the mechanisms of the oil supply-demand equilibrium, such that growth in demand for oil in the world economy was driven by greater activity, while reductions in supply or production resulted in higher prices. More than ever before, globalization and financialization of commodity markets have greatly altered the processes by which oil prices are set. Beyond oil prices responding to physical supply-demand dynamics, global financial market dynamics, speculative trading, geopolitical instability, exchange rates, technological advancements, and the dynamics of the energy transition are becoming critical drivers of crude oil price movements (Kilian & Zhou, 2022). Besides, crude oil has become more vulnerable to investor sentiment, risk perceptions, and global macroeconomic uncertainty as commodity and global financial markets grow ever tighter.
Therefore, contemporary oil pricing is a multidimensional phenomenon shaped by the dynamics of the physical, financial, and structural energy transition markets. The motivation for the study arises from the need to assess the growing importance of global financial market dynamics, geopolitical risk, and energy transition imperatives beyond the traditional drivers of oil supply-demand equilibrium, OPEC production policies, urban population growth rate, and global economic growth rate; although their effects are still being expressed through the oil demand-supply channel, more knowledge is provided as regards the factors that change the demand and the supply of crude oil in the global market.
Global financial market volatility, characterized by fluctuations in stocks, foreign exchange, credit supply, and interest rates, affects investments in the energy sector. The effect can be positive or negative. When financing is available for the development of oil fields and extraction technology, future oil supply increases, thereby compressing oil prices. However, when funding is reduced due to liquidity constraints, a contractionary or restrictive monetary stance, and reduced global investor optimism, energy investments may suffer funding shortfalls, leading to reduced ability to grow crude oil production and culminating in increases in oil prices, holding other factors constant (Le et al., 2025). Also, oil prices are now shaped by speculative trading through commodity futures, leading to a situation where futures prices correlate highly with spot crude oil prices (Basak & Pavlova, 2016). Remarkably, oil prices are now more volatile due to financial market volatility, investor sentiment, and global risk conditions, as crude oil is increasingly traded as a financial asset via derivatives markets and commodity index funds, as well as speculation (Antonakakis et al., 2018).
Furthermore, geopolitical risks related to conflicts, financial and economic sanctions, terrorist attacks, and political uncertainty in key oil-producing areas constitute serious problems for global supply security and investment decisions and aggravate uncertainty-related premiums in the global oil market (Caldara & Iacoviello, 2022; Bouri et al., 2023). The effect of geopolitical risk on oil prices could be very significant through major conflicts, where the global supply chain is significantly disrupted, and sanctions can escalate oil supply risk, leading to increases in crude oil prices. Additionally, the global energy transition towards renewable energy and decarbonization is gradually reshaping long-term expectations and investment in fossil fuels (IEA, 2023; Sadorsky, 2021). The International Renewable Energy Agency [IRENA] and CPI (2025) note that investments in renewable energy reached US$807 billion in 2024 compared with US$427 billion in 2015, although the annual growth rate momentum slowed in 2024 with a 7.3% annual increase as against a 32% growth rate recorded in 2023, and 17% in 2015. The global organization further highlights the challenges associated with renewable energy policy reversal under the Trump Administration, with the roll-back of energy transition-linked fiscal incentives, although the slowdown effect of the deliberate policy change in the U.S. is being counterbalanced by public policy support and investments in China and Europe. However, public financial support, through subsidies, capital investments, and public finance, for fossil fuels (coal, oil, and gas) is still growing, partly due to Europe’s effort to secure alternative oil and gas supplies away from Russia in the wake of the Ukraine conflict.
At the conceptual and theoretical levels, global financial market volatility, geopolitical risk, and energy transition could influence crude oil price determination. At the empirical level, few studies in this area have focused on individual or disaggregated linkages of these factors, while the current study considers the combined effects of the factors (Basak & Pavlova, 2016; Bouri et al., 2023; Caldara & Iacoviello, 2022; Esmaelli et al., 2024; Gkillas et al., 2022; Mukhtarov, 2024; Tang & Xiong, 2012), without considering them together. Furthermore, many studies have relied on linear, static models of oil markets, which may not adequately capture the more complex, nonlinear, and interconnected nature of today’s oil markets (Balcilar et al., 2017; Kilian & Zhou, 2022). Therefore, this study attempts to close this empirical gap by examining how global financial market volatility, geopolitical risk, and the energy transition have shaped crude oil prices over time, expanding knowledge in this area.
Hence, this study makes some significant contributions. First, this study investigates the short-run and the long-run effects of global financial market volatility, geopolitical risk, and the energy transition on crude oil prices, providing empirical evidence for theoretical postulations, policy formulation, and macroeconomic management. Second, this study provides a comprehensive framework to provide a combination of global financial market risk, geopolitical risk, energy transition indicators, and macroeconomic risk elements to explain the determination of the price of crude oil, in light of these recent global tensions, a combination of elements that is not captured in earlier studies. The study provides insight into the contemporary dynamics of oil prices within an increasingly complex, transitioning global energy economy by jointly examining these factors. Third, this study examines the effect of global financial market volatility, geopolitical risk, and energy transition on two major crude oil price benchmarks, Brent and West Texas Intermediate (WTI), providing robustness and depth, and determining whether these global financial, structural, and macroeconomic variables impact these crude oil benchmarks in similar ways.
Furthermore, this study’s justification lies in the need to unravel a wide range of significant factors that can explain crude oil price movements, as oil prices have been highly volatile in global energy markets over the years, creating shocks to the fiscal budgets of oil-producing countries and exacerbating macroeconomic fragility in many importing countries (Albaity & Mustafa, 2018; Salem et al., 2022; Yilmazkuday, 2024). Oil price movements influence monetary policy, economic activity, and financing, and they continue to puzzle economists, researchers, and policymakers, as fluctuations affect oil exporters, consumers, global economies, and industrial sectors (Gkillas et al., 2022; Qian et al., 2022). Also, the control of energy sources, such as crude oil, creates a geostrategic advantage (Khan & Khurshid, 2025). Therefore, understanding the short- and long-term effects of covariates, such as global financial market volatility, geopolitical risk, the energy transition, and other structural and external factors, on oil prices will aid entrepreneurs, governments, policymakers, and market participants in decision-making, strategic planning, policy interventions, and risk management.
The paper is structured as follows: Section 1 introduces the study and provides its background. Section 2 reviews existing theories and empirical studies. Section 3 presents the data and the econometric strategy employed in the study. Section 4 presents the empirical findings and discussion, while Section 5 presents the conclusion, the study’s policy implications, its limitations, and directions for future research.
2. Literature Review
2.1. Theoretical Framework
This study reviews five (5) theories that provide the plank upon which the empirical investigation is anchored. These theories are the classical supply-demand equilibrium theory, the cartel theory, the global financial cycle theory, the geopolitical risk pricing theory, and the energy transition hypothesis. Theory of crude oil price determination has traditionally been explained based on supply–demand equilibrium, which assumes that the price of crude oil in the world market is influenced by production, consumption, inventories, and the level of economic activity. Hamilton (2020) noted that oil price volatility is still largely driven by fluctuations in oil demand and supply disruptions. Likewise, Kilian (2022) states that changes in global economic growth, industrial activity, and energy demand have a major impact on oil market dynamics. Oil demand can be influenced by global GDP growth, industrial manufacturing activity levels, and macro-structural shifts, such as decarbonization drives and the adoption of electric vehicles. Oil supply, on the other hand, is influenced by new oil discoveries, extraction technology innovations, drilling schedules, and rapid declines in strategic reserves of countries (Arezki et al., 2017). The cartel theory explains that global petroleum supply does not operate in a purely competitive market; instead, it is influenced by economic theories of oligopoly and collusive cartels. is also an important factor in determining oil prices, especially regarding the activities of the Organization of the Petroleum Exporting Countries (OPEC). OPEC regulates oil prices by coordinating production quotas and adjusting supply to keep prices stable and maximize revenue for its members (Smith, 2020). OPEC’s (or OPEC+) actions to reduce or increase production can have a substantial impact on global oil supply and prices.
Equally relevant to this study is the global financial theory. The theory explains that financial cycles, often defined by fluctuations in credit and property prices, amplify macroeconomic volatility and precipitate vulnerabilities to crises, especially through co-movements between credit and asset prices. The theory also posits that peaks in the financial cycle often precede financial crises, underscoring their role as early indicators of systemic fragility (N’Goran, 2026). Where there are no required and proactive macroprudential interventions in place, the financial cycle effect on the macroeconomy can be through two channels: 1) the financial accelerator, in which credit booms amplify real economic activity; and 2) procyclicality, where rising appetite for risk during upswings weakens systemic resilience. The modern oil market has become increasingly financialized, with the theory that global financial market conditions are now driving crude oil prices. As commodity markets become increasingly intertwined with financial markets, commodity pricing has evolved into a financial asset class that includes futures contracts, derivatives, and institutional investment (Tang & Xiong, 2012). As a result, the volatility of financial markets, investor optimism, and macroeconomic uncertainty increasingly influence oil price dynamics (Basak & Pavlova, 2016). This implies that a boom in credit supply can spur upstream investments, leading to an increase in crude oil supply and a price compression, whereas a fall in credit supply or a shift in investments to renewable energy sources can affect future crude oil production growth.
The geopolitical risk pricing theory, which argues that wars, sanctions, political instability, and international conflicts create uncertainty premiums in oil markets. Geopolitical tensions can lead to expectations of supply interruptions and volatility in oil markets (Caldara & Iacoviello, 2022), as major oil-producing regions are geopolitically sensitive. Recent geopolitical events, such as the Russia-Ukraine conflict and tensions in the Middle East, reflect the positive relationship between geopolitical uncertainty and crude oil price volatility (Bouri et al., 2023). Geopolitical risks can also affect macroeconomic variables through loss of human life, destruction of critical infrastructure, diversion of resources to military spending, reduced investments in socio-economic development, and heightened precautionary behavior among economic agents. Therefore, entrepreneurs, market participants, and central bank officials view geopolitical risks as major determinants of corporate investment decisions, expected risk premiums, asset prices, and stock market dynamics (Caldara & Iacoviello, 2022; Han et al., 2026). Geopolitical risks can lead to severe macroeconomic outcomes, such as reductions in capital stock, unemployment, stock market volatility, capital-flow retrenchment and reversals, global supply chain disruptions, increased frictional costs in international trade, and a high probability of an economic downturn (Kotcharin & Maneenop, 2020). Additionally, geopolitical risk can trigger volatility in global financial markets, disrupt global supply chains, alter international trade, and reconfigure investment flows, posing serious concerns for entrepreneurs, global investors, policymakers, and international organizations (Banerjee et al., 2024). Geopolitical risk has been linked with a high cost of capital in emerging markets, arising from widened information asymmetry between lenders and borrowers, and higher risk premium demands (Han et al., 2026). Therefore, geopolitical risk, which has become a major source of global economic uncertainty, can complicate the effect of global financial market volatility on global crude oil prices, creating a double-whammy scenario.
Finally, the energy transition hypothesis links the global transition to renewable energy and lower-carbon systems to oil prices through shifts in long-term demand expectations, changes in technology, market economies, and socio-economic considerations. Energy markets are slowly transitioning to integrate increasing amounts of renewable energy technologies, decarbonization policies, and ESG finance, thereby reducing future reliance on fossil fuels (Apergis & Payne, 2020). The increase in renewable energy puts structural pressure on long-term oil demand and pricing dynamics (Sadorsky, 2021). Esmaelli et al. (2024) further note that the demand for renewable energy can be influenced by oil demand and supply shocks, remarking that supply-side shocks can increase interest in renewable energy technologies, whereas global demand-side shocks may reduce the attractiveness of renewable energy due to lower oil prices. Additionally, changes in geopolitical factors can influence the effect of renewable energy on crude oil prices.
Taken together, these theories imply that the majority of the present-day determination of crude oil prices is driven by standard supply-and-demand fundamentals, global financial market conditions, geopolitical risk, and structural dynamics of the energy transition.
2.2. Empirical Review and Hypotheses Development
2.2.1. Global Financial Market Volatility and Crude Oil Prices
Oil prices can be affected by global financial market risk through several channels. First, uncertainty in global financial markets influences investor confidence in future economic activity and energy demand. Second, changes in interest rates and exchange rates change the cost of oil production and oil trade. Third, liquidity shocks and speculation in the oil market, using commodity futures, can cause oil price volatility to exceed the dictates of the physical market fundamentals (Basak & Pavlova, 2016). Empirical evidence indicates that oil prices have positive spillover effects on equity, bond, and foreign exchange markets, especially during the global financial crisis and periods of macroeconomic uncertainty (Bouri et al., 2021). Rising financial uncertainty often leads to changes in investors’ risk appetite, portfolio rebalancing, and speculative trading, which may further contribute to oil price volatility. Bouri et al. (2023) suggest that global economic uncertainty and financial stress have emerged as key drivers of volatility spillovers into energy markets. Likewise, Antonakakis et al. (2018) discovered robust dynamic linkages between oil prices and financial markets during periods of geopolitical and economic stress. This indicates an increasing importance of financial market conditions for crude oil prices beyond the traditional supply-and-demand fundamentals. Global financial market conditions are increasingly affecting crude oil prices through the financialization of commodity markets. The price of crude oil is increasingly traded as a financial product through futures markets, commodity index funds, and derivatives markets, and is thus highly sensitive to investor sentiment, financial volatility, and macroeconomic uncertainty (Tang & Xiong, 2012). Oil prices are frequently affected by instability in financial markets, which can trigger speculation, portfolio rebalancing, and liquidity shocks. Empirical evidence indicates that periods of heightened financial volatility significantly affect oil price volatility and the oil price regime (Bouri et al., 2023).
Tang and Xiong (2012) studied the financialization of commodity markets and the effect of commodity index investment on commodity price movements. The study employed futures market data and econometric analysis to conclude that increased financial investment in commodity markets increased the correlation among commodity prices, such as crude oil. The authors concluded that financialization has greatly enhanced the dependence of oil prices on financial markets and their speculative activity. Basak and Pavlova (2016) discussed the financialization of the commodity market and its effect on the price dynamics. The research employed a theoretical financialization model to examine the role of institutional investors, hedge funds, and financial market actors and how this led to a shift in commodity markets, particularly crude oil markets. The results showed that financial investment flows significantly affect commodity price volatility and that oil prices are more sensitive to investor sentiment and oil portfolio behavior. The study found that crude oil is increasingly becoming a financial asset rather than just a physical good. Kilian and Zhou (2022) applied advanced time-series econometric methods and structural decomposition models to study the impact of speculative trading, macroeconomic variables, and financial conditions on crude oil price dynamics. The study also revealed that physical supply and demand factors, as well as financial factors, macroeconomic uncertainty, and speculative trading, are becoming more important in determining modern oil price movements. The study found that modern oil pricing systems need broader, more comprehensive analytical tools that encompass financial market dynamics and the uncertainty inherent in the pricing process. The study, however, focused on macroeconomic and speculative factors and was somewhat light on the structural consequences of the energy transition and the use of renewable energy in oil markets. Le et al. (2025) examined the effect of geopolitical risk, economic uncertainty, and the market volatility index on energy price and oil price volatility. The study found that global financial market volatility has a negative effect on oil prices, while geopolitical risk has a positive effect on global oil prices, whereas economic policy uncertainty has a weak effect. Geopolitical risk, economic policy uncertainty, and global financial market volatility also significantly influence oil price volatility, with a stronger long-term tendency than short-term persistence.
Based on this theoretical and empirical relationship, the first null hypothesis of the study is stated below:
H01.Global financial marketvolatility has no significant effect on crude oil prices.
2.2.2. Geopolitical Risk and Crude Oil Prices
Recent geopolitical events, such as the Russia-Ukraine conflict, sanctions on Russia and Iran, and unrest in the Middle East, have sparked renewed interest in geopolitical risk in the global energy market. The events underscore the growing significance of geopolitical issues in oil price formation, energy security planning, and macroeconomic policy formulation (Li et al., 2023; Su et al., 2025). Geopolitical risk is well understood to be a key factor in global oil market activity, as oil is produced and transported from politically sensitive areas. Wars, terrorism, sanctions, and diplomatic conflicts are examples of geopolitical tensions and threats that often contribute to uncertainty about future oil supply and elevated risk premiums in global oil markets (Caldara & Iacoviello, 2022). Bouri et al. (2023) argue that geopolitical uncertainty has two channels of impact on oil prices: a physical channel of supply disruption and a financial channel of expectations. Investors tend to respond to geopolitical tensions by taking on more speculative positions in oil markets, as they worry about oil shortages or rising energy insecurity.
In their study, Caldara and Iacoviello (2022) created the Geopolitical Risk (GPR) Index and analyzed the macroeconomic implications of geopolitical tensions on global markets. The study quantified geopolitical risks stemming from war, terror, military conflict, and diplomacy using text-based analysis of newspaper articles. Their results revealed that geopolitical risk has a significant impact on oil prices, investment activity, and financial market performance by inducing uncertainty premiums and market volatility. The study found that geopolitical uncertainty is a significant factor in global macroeconomic and commodity market dynamics. Gkillas et al. (2022) investigated the influence of oil demand and supply, geopolitical risk, and economic agents’ expectations, using monthly data from January 2001 to December 2019, and found that geopolitical risk has a significant impact on oil price movements. Salem et al. (2022), using daily series from 2 January 2003 to 24 May 2021 and applying the ARDL and non-linear ARDL (NARDL) models, found that economic policy uncertainty negatively affects oil prices through a reduction in oil demand. Yilmazkuday (2024) found that, based on monthly data from 1996 m1 to 2022 m10, a unit shock to geopolitical risk leads to about a 1.13-unit increase in global energy uncertainty in the long run, while also positively affecting domestic energy prices.
Based on this empirical review, the second null hypothesis of the study is stated as follows:
H02.Geopolitical risk has no significant effect on crude oil prices.
2.2.3. Energy Transition and Crude Oil Prices
The escalating climate change threats, as evidenced by rising sea levels, devastating flash floods, environmental degradation and pollution, heat waves, and other extreme weather conditions, have spurred interest in renewable energy and a general call to roll back investments in fossil fuel energy sources, such as oil. Fossil fuels remain crucial to the global economy, but they contribute to over 70% of global carbon emissions (Su et al., 2025). Renewable energy, which is more environmentally friendly and carbon-neutral, uses biomass, hydropower, solar, geothermal, and wind to produce electricity for various uses (Esmaelli et al., 2024). Therefore, there are several links between renewable energy and oil prices. The first channel is the substitution effect of renewable energy. Global shifts towards green energy and climate mandates are reducing reliance on fossil fuels in transportation and electricity generation, thereby lowering demand for crude oil and depressing prices. Greater investments in renewable energy, electric vehicles, decarbonization strategies, and green technologies could further reduce reliance on crude oil, thereby affecting oil market dynamics (IEA, 2023). Second, climate policies and environmental laws discourage long-term investments in high-carbon-intensity energy infrastructure, thereby reducing future crude oil production. In a situation that could reduce future crude oil supply and where green energy sources fall short of meeting the required energy demand, crude oil prices could increase. Thirdly, investor preference for Environmental, Social, and Governance (ESG)-compliant assets could lead to a decline in financing of oil exploration and production (E&P) activities (Apergis & Payne, 2020). Despite this, the energy transition and oil prices remain complex and in flux. The demand for oil could decline in the longer term as renewable energy grows, but demand for fossil fuels is likely to be robust in the short term because of high dependence on fossil fuels for domestic consumption and as a source of electricity production for manufacturing and industrial activities. However, some researchers have suggested that the investment shortfall in fossil fuel production could lead to temporary shortages and rising oil prices during the transition period (IEA, 2023).
Some empirical studies have examined the link between the energy transition and crude oil price determination. Sadorsky (2021) concludes that long-term growth in renewable energy and technological advancements have negative effects on oil prices because they reduce future growth in fossil fuel demand. But oil markets could also experience short-term volatility due to supply changes during a transition. In their study, Apergis and Payne (2020) examined the effect of renewable energy adoption on oil prices and energy market dynamics, focusing on panel cointegration and causality analyses across several economies. It was found that there is a long-run relationship between the rise in renewable energy and the fall in oil price dependency. The study found that the development of renewable energy has significant implications for future oil demand and energy market stability. In a reverse empirical study, Esmaeili et al. (2024) found that oil price shocks are key drivers of renewable energy consumption due to soaring oil prices. Although oil-specific demand shocks, such as the 1979 Iranian Revolution and the 2028 Global Financial Crisis, initially reduce the attractiveness of renewable energy, they later lead to an increase in its consumption. Similarly, Mukhtarov (2024) found that oil price and carbon emission footprint are associated with an increase in renewable energy consumption, due to the cost advantage of renewable energy, which increases as oil prices escalate. Mbarek (2026) found that oil price volatility is negatively related to renewable energy consumption, indicating that increased oil market volatility may weaken renewable energy transition efforts in Gulf Cooperation Council (GCC) countries.
Based on this relationship, the third null hypothesis of the study is as follows:
H03.Energy transition has no significant effect on crude oil prices.
2.2.4. Interaction Effect of Global Financial Market Risk and Geopolitical Risk on Crude Oil Prices
The dynamics of crude oil pricing have been markedly altered in recent years due to the growing integration of commodity markets with global financial systems, rising geopolitical tensions, and the rapid shift towards cleaner energy systems (Kilian & Zhou, 2022). Basak and Pavlova (2016) argue that the growing link between financial markets and oil prices is the result of the emergence of futures contracts, derivatives markets, exchange-traded funds (ETFs), and commodity index investments. Consequently, changes in the stock market, interest rates, exchange rates, credit availability, and investor confidence can have a strong effect on crude oil prices.
There is a growing body of literature suggesting that crude oil prices are highly interconnected and potentially nonlinear, with effects that are often highly interconnected and potentially nonlinear. Kilian and Zhou (2022) contend that today’s oil price dynamics result from the interplay among macroeconomic uncertainty, speculative trading, geopolitical events, and structural shifts in energy markets. Likewise, Bouri et al. (2023) note that the current dynamics of oil price determination extend beyond physical market fundamentals to include financial, geopolitical, and sustainability considerations. The global financial market risk conceptually affects crude oil prices through financialization and speculation, as well as volatility spillover channels. Geopolitical risk affects oil prices through uncertainty premiums in the global financial market, expectations of supply disruptions, and concerns about energy security. Long-term changes in demand, renewable energy substitution, and investment shifts resulting from the transition to sustainability affect oil prices. It is therefore possible to consider the process of crude oil price determination as the result of interactions among financial systems and geopolitical structures.
Antonakakis et al. (2018) analyzed the dynamic linkages between global oil price and global stock markets during times of geopolitical and economic insecurity using global time-series data. A time-varying parameter vector autoregression (TVP-VAR) model was used to examine spillover effects among oil prices, stock market returns, and uncertainty indicators. The results showed that oil prices had high volatility spillovers to financial markets, particularly during geopolitical tensions or financial crises. It was concluded that, with the growing integration between commodity and financial markets, crude oil prices are now being affected by financial market conditions. The study also contributed significantly to the financialization literature, but it focused primarily on how oil prices affect stock markets and did not broaden its structural scope by integrating the renewable energy transition or long-term decarbonization dynamics. Derbali (2026) examined the dynamic interdependence between geopolitical instability and financial market volatility, using data from 2000 to 2024; geopolitical tensions increase financial market volatility, causing risk premium escalations for bonds and stocks.
Based on the foregoing, the fourth and the fifth hypotheses of the study are stated below:
H04.Global financial market riskand geopolitical riskdo not have a significant effect on crude oil priceswhen introduced in the same regression model.
H05. Geopolitical risk does not significantly alter the effect of global financial market volatility on crude oil prices.
2.2.5. Interaction Effect of Geopolitical Risk and Energy Transition on Crude Oil Price Determination
Geopolitical risk and energy transition combine to form a multidimensional oil pricing mechanism that is uncertain, volatile, and structurally transforming. Similarly, geopolitical tensions could drive energy transition policies as countries aim to lessen their reliance on volatile fossil fuel supply chains. At the same time, the dynamics of the energy transition can shift market reactions to geopolitical developments and financial crises by influencing the outlook for future oil demand. In a world dominated by global climate change pressures, geopolitical volatility, and financial market uncertainty, the dynamics of crude oil markets are becoming more complex (Baker et al., 2021). In recent times, the military conflict between Russia and Ukraine has threatened Europe’s energy security by disrupting gas supply to Europe in retaliation for various economic sanction packages, leading to the EU scaling up energy investment of approximately 300 billion euros in renewable energy sources to achieve energy independence in the EU (He et al., 2025).
Geopolitical shocks can amplify the dynamics of the energy transition on crude oil prices (Gu et al., 2024). For instance, Wang et al. (2023) found that geopolitical risks can promote energy transition, measured by renewable energy consumption and energy production, with the geopolitical risks on energy transition further amplified by improved financial incentives, energy efficiency level, and government governance capacity. Hunjra et al. (2024), using the CS-ARDL technique on 2000-2021 data from 21 countries, found that heightened geopolitical risk has both short- and long-term positive effects on carbon emissions and the ecological footprint due to the destruction and degradation of ecological assets, as well as supply-side disruptions. He et al. (2025) concluded that geopolitical risk is a driver of renewable energy transition, with lower oil rents, lower levels of openness, and higher levels of technological innovation being the preconditions for geopolitical risk to drive renewable energy transition. Khan and Khurshid (2025) found that geopolitical issues, energy security concerns, and competition for rare earths significantly impact renewable energy due to technical advancements, growing global economic activity, and soaring fossil fuel prices. The findings by Zhang et al. (2025) indicate that geopolitical risk significantly hinders energy transition in low-income countries in the short term, whereas it does not have a significant impact in the long term, both in low-income and high-income countries. The findings also indicate that the impact of geopolitical risks on renewable energy transition is more pronounced in countries that are more ecologically disadvantaged and more dependent on foreign countries for energy.
Therefore, the study presents its sixth hypothesis as follows:
H06. Geopolitical risk does not significantly alter the effect of energy transition on crude oil prices.
2.3. Summary of Empirical Gap
From the empirical review, existing studies have focused more on the individual effects of global financial market volatility, geopolitical risk, and energy transition on crude oil prices. However, studies that have examined the separate and interaction effects of these global financial, geopolitical, and global structural factors in one study are sparse. Also, the existing studies on the effects of global financial market volatility, geopolitical risk, and energy transition on crude oil prices are recent and show divergence and inconsistencies in the empirical findings. Furthermore, many existing studies in this area did not explore existing theories to explain the links between global financial market volatility, geopolitical risk, energy transition, and crude oil prices. Therefore, this study attempts to fill these identified gaps.
3. Data and Empirical Methodology
3.1. Research Design
The time-series longitudinal research design is employed to investigate the interlinkages among global financial market volatility, geopolitical risk, the energy transition, and crude oil pricing. The longitudinal research design is appropriate because it enables the empirical examination of the dynamic relationships among macroeconomic, financial, geopolitical, and energy-related variables over time using a quantitative research strategy and econometric estimation techniques suitable for longitudinal data analysis (Creswell & Creswell, 2018; Gujarati & Porter, 2009; Wooldridge, 2020; Brooks, 2019).
3.2. Data
The study is based solely on secondary data sourced from reputable international databases and institutional repositories. The annual time-series data from 1990 to 2024 yield 35 observations per variable. The start and end years are influenced by data availability. The start year of 1990 is because the Chicago Board Options Exchange Volatility Index (CBOE VIX), a proxy for global financial market volatility, became available on the Federal Reserve Bank of St. Louis’ website starting in 1990. The end year, which is 2024, is dictated by the fact that many of the control variables have only been updated up to 2024. The data are annual time-series observations of crude oil prices, global indicators of financial market risk, geopolitical risk indicators, indicators of renewable energy transition, and selected variables for macroeconomic control. The sources of the data are presented in Table 1.
Top of Form
3.3. Theoretical Framework and Model Specification
Theoretical Framework
The study examines determinants of crude oil prices using a multivariate model that includes global financial market volatility, geopolitical risk, energy transition, and macroeconomic control variables. Therefore, this study is anchored on several theories, ranging from the classical supply-demand equilibrium framework, the cartel theory, the global financial cycle theory, the geopolitical risk pricing theory, and the energy transition hypothesis. As reviewed in the theoretical foundation session, these theories posit that global financial market volatility, geopolitical risk, energy transition, and structural demand and supply conditions can influence crude oil prices.
To empirically examine the effect of global financial market volatility, geopolitical risk, and energy transition on crude oil prices, this study adopts the model used by Salem et al. (2022), with some modifications to incorporate these factors. The inclusion of these factors creates a more holistic picture of the forces influencing current crude oil prices amid growing financial market connectivity, increasing geopolitical risk, and global energy transition pressures.
The functional relationship is given below.
The general econometric model is therefore expressed as:
Where crude oil price is subsequently represented by Brent crude oil price (BRECOP) and West Texas Intermediate crude oil price (WTICOP); is the Global Financial Market Volatility; is the Geopolitical Risk; is the Renewable Energy; is the OPEC Crude Oil Allocation; is the Global Real GDP Growth Rate; is the Global Inflation Rate; is changes in crude oil supply; is changes in crude oil demand; is gold prices; is the crude oil futures price; is the urban population growth rate; is the U.S. Dollar Index; is the constant term (the intercept); β1–β12 are the regression coefficients to be estimated; t is the time-series dimension; and ε is the stochastic error term.
Model Specification
Six models are estimated in this study to address multicollinearity in the linear regression models and to examine the effect of individual explanatory variables in separate models so as not to combine global financial market volatility, geopolitical risk, and energy transition in a single model, as doing so would introduce multicollinearity issues. Models 1-4 are linear, with multicollinearity avoided, whereas Models 5-6 are interaction (non-linear) regression specifications.
Model 1
This examines the effect of global financial market volatility on oil price benchmarks, represented by Brent and WTI crude oil prices, in the presence of identified control variables. The specification for Model 1 is as follows:
Model 2
This examines the effect of geopolitical risk on oil price benchmarks, represented by Brent and WTI crude oil prices, in the presence of identified control variables. The specification for Model 2 is as follows:
Model 3
This examines the effect of energy transition on oil price benchmarks, represented by Brent and WTI crude oil prices, in the presence of identified control variables. The specification for Model 3 is as follows:
Model 4
This examines the effect of global financial market volatility and geopolitical risk on oil price benchmarks, represented by Brent and WTI crude oil prices, in the presence of identified control variables and in the same model. The specification for Model 4 is as follows:
Model 5
This is a non-linear model that examines the interaction effect of global financial market volatility and geopolitical risk on oil price benchmarks, represented by Brent and WTI crude oil prices, in the presence of identified control variables. The specification for Model 5 is as follows:
Model 6
This is a non-linear model that examines the interaction effect of geopolitical risk and energy transition on oil price benchmarks, represented by Brent and WTI crude oil prices, in the presence of identified control variables. The specification for Model 6 is as follows:
In line with the approach employed in prior studies (Andreasen & Valenzuela, 2016; Asongu, 2025; Nchofoung et al., 2021), the interactive equations 7(a), 7(b), 8(a), and 8(b) can be transformed into a non-linear framework as shown below:
Where is the coefficient of the variable associated with the direct effect, is the coefficient of the moderating variables.
Then, differentiating each of Equations (9), (10), (11), and (12) with respect to global financial market volatility and energy transition, we have Equations (13), (14), (15), and (16).
Where is the partial derivative operator. In Equations (24), (25), and (26), a unit change in the dependent variables (BRECOP and WTICOP) as a result of variation in global financial market volatility or energy transition, as the case may be, is dependent on the signs and the coefficients of and , which respectively represent the unconditional and interactive or conditional effects. If both coefficients have opposing signs and are significant, corresponding thresholds can be estimated. If both coefficients have the same sign, synergistic effects exist, and if at least one of them is non-significant, threshold or net effect calculations are not applicable (Asongu, 2025; Nchofoung et al., 2021). The net effect can be computed as follows:
Where is the magnitude of the indirect effect of GFMV or REN, is the average (mean value) of the moderating variable (GPR).
Besides, from Equations (13), (14), (15), and (16), corresponding thresholds can be computed using the formulas below, as done by Asongu (2025) and Eozenou (2008).
However, Asongu (2025) notes that two points need clarification when computing the thresholds. First, the signs of the coefficients of the main independent variables (GFMV) and energy transition (REN), and the interaction terms (GFMV*GPR) and (REN*GPR), respectively, should have opposing signs and be significant. The second point is that, for the thresholds to have economic meaning and policy relevance, they should be within the critical minimum and maximum limits of the moderating variables disclosed in the summary statistics.
3.4. Measurement of Variables
3.4.1. Dependent Variables
The study’s dependent variable is the crude oil price. Crude oil remains a global commodity and a critical factor of production that economies worldwide need for various economic activities, and it is intricately linked to countries’ strategies, world politics, and power (Gkillas et al., 2022; Kilian, 2014). The crude oil price is the amount at which a barrel (42 U.S. gallons or 35 UK gallons) of oil is sold on the global energy market. There are different variants of crude oil prices. The major benchmark crude oil prices are Brent and West Texas Intermediate (WTI), which underpin many global crude oil trades. The Brent and the West Texas Intermediate (WTI) crude oil prices are used worldwide as reference prices for international energy transactions. Brent crude is indicative of the European and global seaborne oil markets, while WTI is more indicative of the North American oil markets. The two benchmarks are very sensitive to geopolitical events, financial market uncertainty, and shifts in global energy demand outlook (Arezki et al., 2022). Crude oil prices have significant impacts on national development, global competitiveness, and macroeconomic outcomes. High oil prices correlate with higher prices of goods and services for importing countries, resulting in elevated inflation, which can lead to slower economic growth, although the fiscal revenues of exporting countries are enhanced (Gkillas et al., 2022). Lebrand et al. (2024) note that oil price shocks can lead to deterioration in the current account balance. Brent crude oil prices have been used in studies such as this previously (Esmaeili et al., 2024; Gkillas et al., 2022; Oyadeyi, 2025). Similarly, the WTI crude oil price has been used in prior studies (Albaity & Mustafa, 2018; Drachal, 2016; Li et al., 2023; Salem et al., 2022).
3.4.2. Independent Variables
Global Financial Market Volatility
Global financial market volatility is the uncertainty and instability associated with fluctuations in international financial markets, including stock, foreign exchange, and interest rate markets, as well as liquidity conditions and investment flows. Volatility indices, credit spreads, financial uncertainty indicators, and changes in investor risk appetite are examples of manifestations of financial market risk (Antonakakis et al., 2018). Global financial market volatility now plays an important role in commodity market dynamics, especially in crude oil markets, with increasing global financial market integration. Crude oil is no longer merely a physical product; it has become a financial commodity included in diversified investment portfolios (Tang & Xiong, 2012). This change has made oil prices more vulnerable to speculative buying and selling, portfolio rebalancing, hedge fund trading, and global macroeconomic factors. In times of financial turbulence, investors tend to pull out of commodity markets due to heightened risk aversion, which can cause oil prices to drop sharply and increase volatility. The global financial market volatility is proxied by the Chicago Board Options Exchange Volatility Index (VIX). VIX, also known as the Fear Index, measures the expected market volatility based on the portfolio of options trades on the U.S. S&P 500, indicating market sentiment and reflecting investors’ expectations of 30-day volatility for the S&P 500 (Kuepper et al., 2025; Le et al., 2025). When the index is below 20, it indicates a relatively low expected market risk. When it is between 20 and 30, it indicates elevated market nervousness, arising from changes in central bank policies or geopolitical headlines. When the index is above 30, it implies severe market stress, elevated systemic fragility, and large and rapid fluctuations across equity portfolios (Kuepper et al., 2025). The CBOE VIX has been used in prior studies (Antonakakis et al., 2018; Derbali, 2026; Le et al., 2025).
Geopolitical Risk
Geopolitical risk is the risk of an unwanted political event occurring or worsening that impacts international relations, economic stability, or global security. These can include wars, terrorism, sanctions, military conflict, political instability, diplomatic tensions, territorial expansionism, and strategic competition between states (Caldara & Iacoviello, 2022). In simpler terms, geopolitical risk relates to conflicts, political instability, trade disputes, and regulatory uncertainties in countries (Su et al., 2025). The geopolitical concentration of oil reserves in politically sensitive regions has made geopolitical risk a key factor in global commodity markets, especially in crude oil markets. Geopolitical disturbances, which can disrupt production, transportation, and supply chains, are common in oil-producing regions such as the Middle East, Russia, North Africa, and parts of Latin America. This means geopolitical events usually increase uncertainty about future oil supply availability, leading to the formation of oil price risk premiums (Bouri et al., 2023). For instance, a price disruption in major oil-producing countries can trigger an immediate price spike due to fears of shortages or sanctions. Geopolitical risk and oil prices are closely linked, both directly and indirectly. Geopolitical risk (GPR) is represented by the Geopolitical Risk Index. The new Geopolitical Risk Index, normalized to 100 and introduced in 1985, is computed by counting adverse geopolitical events and associated threats automatically, with global dimension and repercussions, sourced each month from 10 newspapers: the Chicago Tribune, the Daily Telegraph, the Financial Times, the Globe and Mall, the Guardian, the Los Angeles Times, the New York Times, USA Today, the Wall Street, and the Washington Post. The GPR index is computed from two components: geopolitical threats (war threats, peace threats, military buildups, nuclear threats, and terrorist threats), and geopolitical acts (beginning of war, escalation of war, and terrorist acts) (Caldara & Iacoviello, 2022). The historical average of the index is typically normalized to a value of 100. Therefore, an index value close to 100 represents a baseline level of global political background noise, whereas a significant jump above 100 indicates a dramatic concentration of media focus on active crises. Figure 1 shows fluctuations in geopolitical risk over the 1900-2020 period, with the geopolitical risk index spiking post-World War II during periods of global tensions and regional conflicts, such as the Gulf War, September 11, and the Iraq War, among other major events.
Energy Transition
Energy transition refers to the long-term shift in the structure of energy systems from fossil fuels to cleaner, renewable, and low-carbon energy sources (Xu et al., 2024). The transition is fuelled by concerns about climate change, technological innovation, environmental sustainability, carbon-reduction commitments, and international agreements such as the Paris Climate Accord (IEA, 2023). To address the current global reliance on fossil fuels, renewable energy technologies are being considered as alternatives, such as solar, wind, hydroelectric, biomass, and hydrogen. The energy transition has significant consequences for crude oil markets, including its impact on long-term demand forecasts, investment trends, and energy consumption profiles. Governments and corporations continue to intensify their decarbonization efforts, so there is a risk of downward pressure on oil prices over time if future oil demand growth is reduced (Sadorsky, 2021). This shift is further strengthened by the development of electric vehicles, improvements in energy efficiency, carbon pricing, and green finance measures. The energy transition is proxied in this study by renewable energy consumption, defined as the share of renewable energy in total electricity production. Renewable energy consumption has been used in similar prior studies (Hunjra et al., 2024; Mukhtarov, 2024; Sadorsky, 2021).
3.4.3. Control Variables
The study’s control variables comprise OPEC crude oil allocation (OCOA), global real GDP growth rate (GRGDPGR), global inflation rate (GINF), changes in crude oil supply (CCOS), changes in crude oil demand (CCOD), gold price (GOLP), crude oil futures price (CROFP), urban population growth rate (UPGR), and the U.S. dollar index (USDI). The OPEC production policy can either increase or lower crude oil prices. The OPEC crude oil allocation has been used before (Smith, 2020). The global real GDP growth rate indicates the level of global economic growth and productivity, which are driven by crude oil supply. Therefore, a positive relationship is expected between the global real GDP growth rate and crude oil prices. This variable has been used in similar prior studies (Dogan et al., 2021; Kilian & Zhou, 2022). The global inflation rate is another control variable utilized in the study. Global inflation can increase crude oil prices through its effect on production costs, whereas it can negatively impact crude oil prices through its reducing effect on economic activity, which leads to a reduction in oil demand. The global inflation rate has been used in past studies (Mbarek, 2026; Hunjra et al., 2024). Changes in crude oil supply can either have a negative or positive effect on crude oil prices. A reduction in crude oil supply can lead to an increase in crude oil prices, and vice versa. Conversely, A reduction in crude oil demand can lead to a decrease in crude oil prices, and vice versa. Changes in crude oil supply and changes in crude oil demand have been used in similar studies in the past (Arezki et al., 2024). The urban population growth rate is expected to have a positive association with oil prices. According to Dogan et al. (2021), the world population has doubled since the 1970s, while global GDP has increased fourfold, leading to an increasing demand for natural resources to support socio-economic activities and a high standard of living. This has been used as a control variable in the past (Byaro & Mmbaga, 2022).
The other control is the gold price. The prices of oil and gold tend to fluctuate symmetrically (Salem et al., 2022). The link between gold and oil prices is explained by the fact that higher oil prices increase production and transport costs, which can precipitate inflation; gold prices often rise alongside crude oil prices as gold often serves as an inflation hedge during periods of elevated inflation. Crude oil future price, which is an example of a commodity futures price, is also utilized as a control variable in the study. Crude oil futures price is the amount agreed today for oil to be delivered in physical quantities or net cash settlement through a synthetic financial instrument. Financial speculation using oil futures has been identified as a major driver of the real spot crude oil prices (Kilian, 2014). Therefore, spot crude oil prices and oil futures prices are expected to move together in the same direction. The U.S. dollar index measures the U.S. dollar’s strength against the six (6) major global currencies, weighted according to their global popularity and relevance: Euro (57.6%), Japanese Yen (13.6%), British Pound (11.9%), Canadian Dollar (9.1%), Swedish Krona (4.2%), and Swiss Franc (3.6%). Therefore, if the USDI goes up, say 120, it means the U.S. dollar is getting stronger in value compared to other currencies by 20%, and similarly, an index value of 80 indicates a fall of 20 from its initial value, implying a 20% depreciation in strength relative to the other currencies. Investors and traders use the USDI to gauge the economic health of the U.S economy and its implications for prices, import and export demand, and the state of the economy. They also use it for foreign exchange speculation and currency risk hedging through USDX futures, options, exchange-traded funds (ETFs), and mutual funds (Chen et al., 2025; Salem et al., 2022). The summary of the description, measurement, economic rationale, and other details for the research variables is presented in Table 1.
3.5. Estimation Techniques
The study employs several econometric methods suitable for time-series analysis to ensure methodological rigor and robustness. To understand the distributional properties of the variables (mean, median, standard deviation, minimum, maximum, skewness, and kurtosis), descriptive statistics are first calculated, and correlation analysis is performed to see how the variables are related in terms of both strength and direction, as well as to detect possible multicollinearity issues (Gujarati & Porter, 2009; Wooldridge, 2020). The Variance Inflation Factor (VIF) test was conducted to confirm the existence of multicollinearity in a dataset. Since the macroeconomic and financial time-series data might be non-stationary, the study uses the Augmented Dickey-Fuller (ADF) and Phillips-Perron (PP) unit root tests to assess the order of integration of the variables (Dickey & Fuller, 1979; Phillips & Perron, 1988). The PP unit root test has the advantage of addressing structural changes in unit roots (Nasreen & Anwar, 2017). After that, the ARDL model developed by Pesaran et al. (2001) due to its suitability for the variables that are integrated at the I(0) and I(1) orders, as well as its ability to estimate short-run and long-run dynamics simultaneously in small sample environments. After the cointegration diagnosis, an Error Correction Model (ECM) is estimated to measure the speed of convergence from short-run disequilibrium to long-run equilibrium (Engle & Granger, 1987). ARDL technique has been used in similar studies in the past (Nasreen & Anwar, 2017; Salem et al., 2022). Nonetheless, the Fully Modified Ordinary Least Squares (FMOLS) was deployed for robustness check and sensitivity analysis. The FMOLS technique is considered potent and effective in addressing small-sample issues, endogeneity-induced reverse causality, and serial correlation (Shahzad et al., 2014). The FMOLS technique has been used in similar prior studies (Ali et al., 2025; Shahzad et al., 2014).
3.5.1. The ARDL Bound Testing Approach to Cointegration
The Autoregressive Distributed Lag (ARDL) approach to cointegration testing, introduced by Pesaran and Smith (1995) and modified by Pesaran et al. (2001), is used to examine the long-run equilibrium relationship between crude oil prices, global financial market volatility, geopolitical risk, energy transition, and the control variables of the study. This technique has several advantages. First, this technique is relevant when the variables are integrated of I(0), I(1), or mixed order of integration, I(0)/I(1). Second, the ARDL model with the appropriate lags helps to address serial correlation and endogeneity problems. Third, both long-run and short-run coefficients can be estimated simultaneously with the ARDL technique. Finally, the ARDL technique performs more efficiently than the Engle-Granger or Johansen cointegration techniques in small sample sizes (Fuinhas et al., 2019; Nasreen & Anwar, 2017; Salem et al., 2022). The ARDL procedure starts with conducting the bounds test for the null hypothesis of no cointegration. Pesaran et al. (2001) advised two sets of critical bounds called the lower critical bound and the upper critical bound for confirmation of a cointegrating relationship. The lower critical bound assumes that all variables are I(0), and the upper critical bound assumes that all variables are I(1). The calculated F-statistics are compared with the critical values. If the calculated F-statistics exceed the upper critical value, the null hypothesis of no cointegrated relationship will be rejected. However, if the calculated F-statistics are lower than the lower critical value, the null hypothesis of no cointegration will not be rejected. If the calculated F-statistics fall between the lower and the upper bounds, the results are considered inconclusive (Nasreen & Anwar, 2017; Salem et al., 2022; Sankaran et al., 2019; Zheng et al., 2020). Once bounds testing confirms the existence of cointegration between the research variables, the long-run and short-run coefficients are estimated (Nasreen & Anwar, 2017; Shahzad et al., 2014).
The specific ARDL model for this study is expressed as follows:
represent the white noise error term, the short-run coefficients, and the long-run coefficients, respectively, while is the first difference operator and denotes the time period. As stated earlier, p, q1, …, …., q12 are the respective numbers of lags of the dependent variable (BRECOP) and the lags of the twelve (12) explanatory variables (GFMV, GRP, REN, LOGOCOA, GRGDPGR, GINF, CCOS, CCOD, GOLP, CROFP, UPGR and USDI).
If the variables are cointegrated, the conditional long-run model is derived from the reduced form equation (9) when the series in first differences are jointly equal to zero (i.e., BRECOP = GFMV = GRP = REN = LOGOCOA = GRGDPGR = GINF = CCOS = CCOD = GOLP = CROFP = UPGR = USDI = 0).
The calculation of these estimated long-run coefficients is given by:
Finally, if a long-run relation is found, an error-correction representation exists, and it is estimated from the following reduced-form equation.
where φ is the coefficient of the error-correction term, . φ is expected to have a negative sign, which indicates that the variables revert to their long equilibrium levels in the event of deviation from the short-run equilibrium levels.
The specification for WTI Crude Oil Price follows the same pattern as:
represent white noise error term, the short-run coefficients, and the long-run coefficients, respectively, while is the first difference operator and denotes the time period. As stated earlier, p, q1, …,…, q12 are the respective numbers of lags of the dependent variable (WTICOP) and the lags of the twelve (12) explanatory variables (GFMV, GRP, REN, LOGOCOA, GRGDPGR, GINF, CCOS, CCOD, GOLP, CROFP, UPGR and USDI).
Should there be cointegration among the variables, the conditional long-run model is derived from the reduced-form equation (12) when the series in first differences are jointly equal to zero (i.e., WTICOP = GFMV = GRP = REN = LOGOCOA = GRGDPGR = GINF = CCOS = CCOD = GOLP = CROFP = UPGR = USDI = 0).
Finally, if a long-run relation can be obtained, an error correction representation exists, and it is estimated from the following reduced form equation:
where φ is the coefficient of the error-correction term, . φ is expected to have a negative sign, which indicates that the variables revert to their long equilibrium levels in the event of deviation from the short-run equilibrium levels.
Several post-estimation diagnostic tests were carried out, such as the Breusch-Godfrey LM test for serial correlation (Breusch & Godfrey, 1981); the White test for heteroskedasticity (Breusch & Pagan, 1979); and the CUSUM/CUSUMSQ test was applied to assess the stability of the ARDL model (Breusch & Pagan, 1979; Nasreen & Anwar, 2017).
4. Empirical Results and Discussion
4.1. Descriptive Statistics and Correlation Analysis
Descriptive Statistics
The average Brent crude oil price was US$52.92 per barrel, higher than the median of US$52.37, with a standard deviation of US$32.22. The minimum price of Brent was US$12.72, and the maximum price was US$111.97, suggesting significant price swings over the sample period. The skewness of Brent crude oil price was 0.410, indicating a slightly longer and fatter right tail, implying more lower values and a few high outliers; the kurtosis was 1.850, which is below the normal kurtosis value of 3, indicating that the distribution is platykurtic, showing a lighter tail and flatter peak and implying fewer or less extreme outliers. The average WTI crude oil price was US$51.06 per barrel, higher than the median of US$48.71, with a standard deviation of US$28.57, with minimum and maximum values of US$14.35 and US$99.56, respectively, depicting a lower range of US$85.21 compared with the US$99.25 for the Brent price, suggesting higher variability and spread in the Brent crude oil price than that of the WTI crude oil price. The higher variability and fluctuation of the Brent crude oil price is further confirmed by the coefficient of variation, with the Brent crude oil price having a coefficient of variation of 60.9%, compared with the WTI crude oil price’s coefficient of variation of 55.95%. The skewness of the WTI crude oil price was 0.320, indicating a slightly longer and fatter right tail, implying more lower values and a few high outliers; the kurtosis was 1.700, which is below the normal kurtosis value of 3, indicating that the distribution is platykurtic, implying fewer or less extreme outliers. The average global financial market volatility is 19.47, with values ranging from 11.09 to 32.69. This means there are more tranquil and turbulent global financial events during the period. The skewness of the global financial market volatility was 0.590, indicating a longer and fatter right tail, implying more lower values and a few high outliers as well as frequent small reductions but fewer massive upticks. The kurtosis was 2.340, which is below the normal kurtosis value of 3, indicating that the distribution is platykurtic and has fewer extreme outliers than the normal distribution. Geopolitical risk also varied: the mean was 102.12, the minimum was 50.91, and the maximum was 176.30, with a standard deviation of 30.660, a range value of 125.390, and a coefficient of variation of 30.024%. The positive skewness of geopolitical risk indicates that extreme geopolitical events happened during the sample period, further confirmed by the average geopolitical risk index being higher than the median geopolitical risk index of 98.550. The kurtosis of 3.070 is approximately 3.0, indicating a mesokurtic distribution. The renewable energy share averaged 21.66%, with a minimum of 17.87% and a maximum of 31.66%. Its positive skewness is relatively high, signifying that the adoption of renewable energy increased more rapidly in later years of the sample. This confirms the importance of the energy transition as a structural determinant of crude oil price behavior. However, the kurtosis of 3.270 is approximately 3.0, indicating a mesokurtic distribution. The global real GDP increased by an average of 3.41% and fell as low as -2.80% during significant global downturns. The skewness was -1.570, indicating a negative skewness associated with a longer left tail, confirming higher values than the mean and a few low outliers. A kurtosis of 7.960 indicates a leptokurtic distribution, characterized by a heavier tail and a sharper peak, implying a higher probability of extreme outliers. The descriptive statistics of other variables are presented in Table 2. Notably, none of the variables have standard deviations that exceed the maximum values, confirming the absence of idiosyncratic extreme outliers in the dataset. The graphical trend analysis of the research variables is depicted in Figure 2.
Table 2. Summary of Descriptive Statistics.
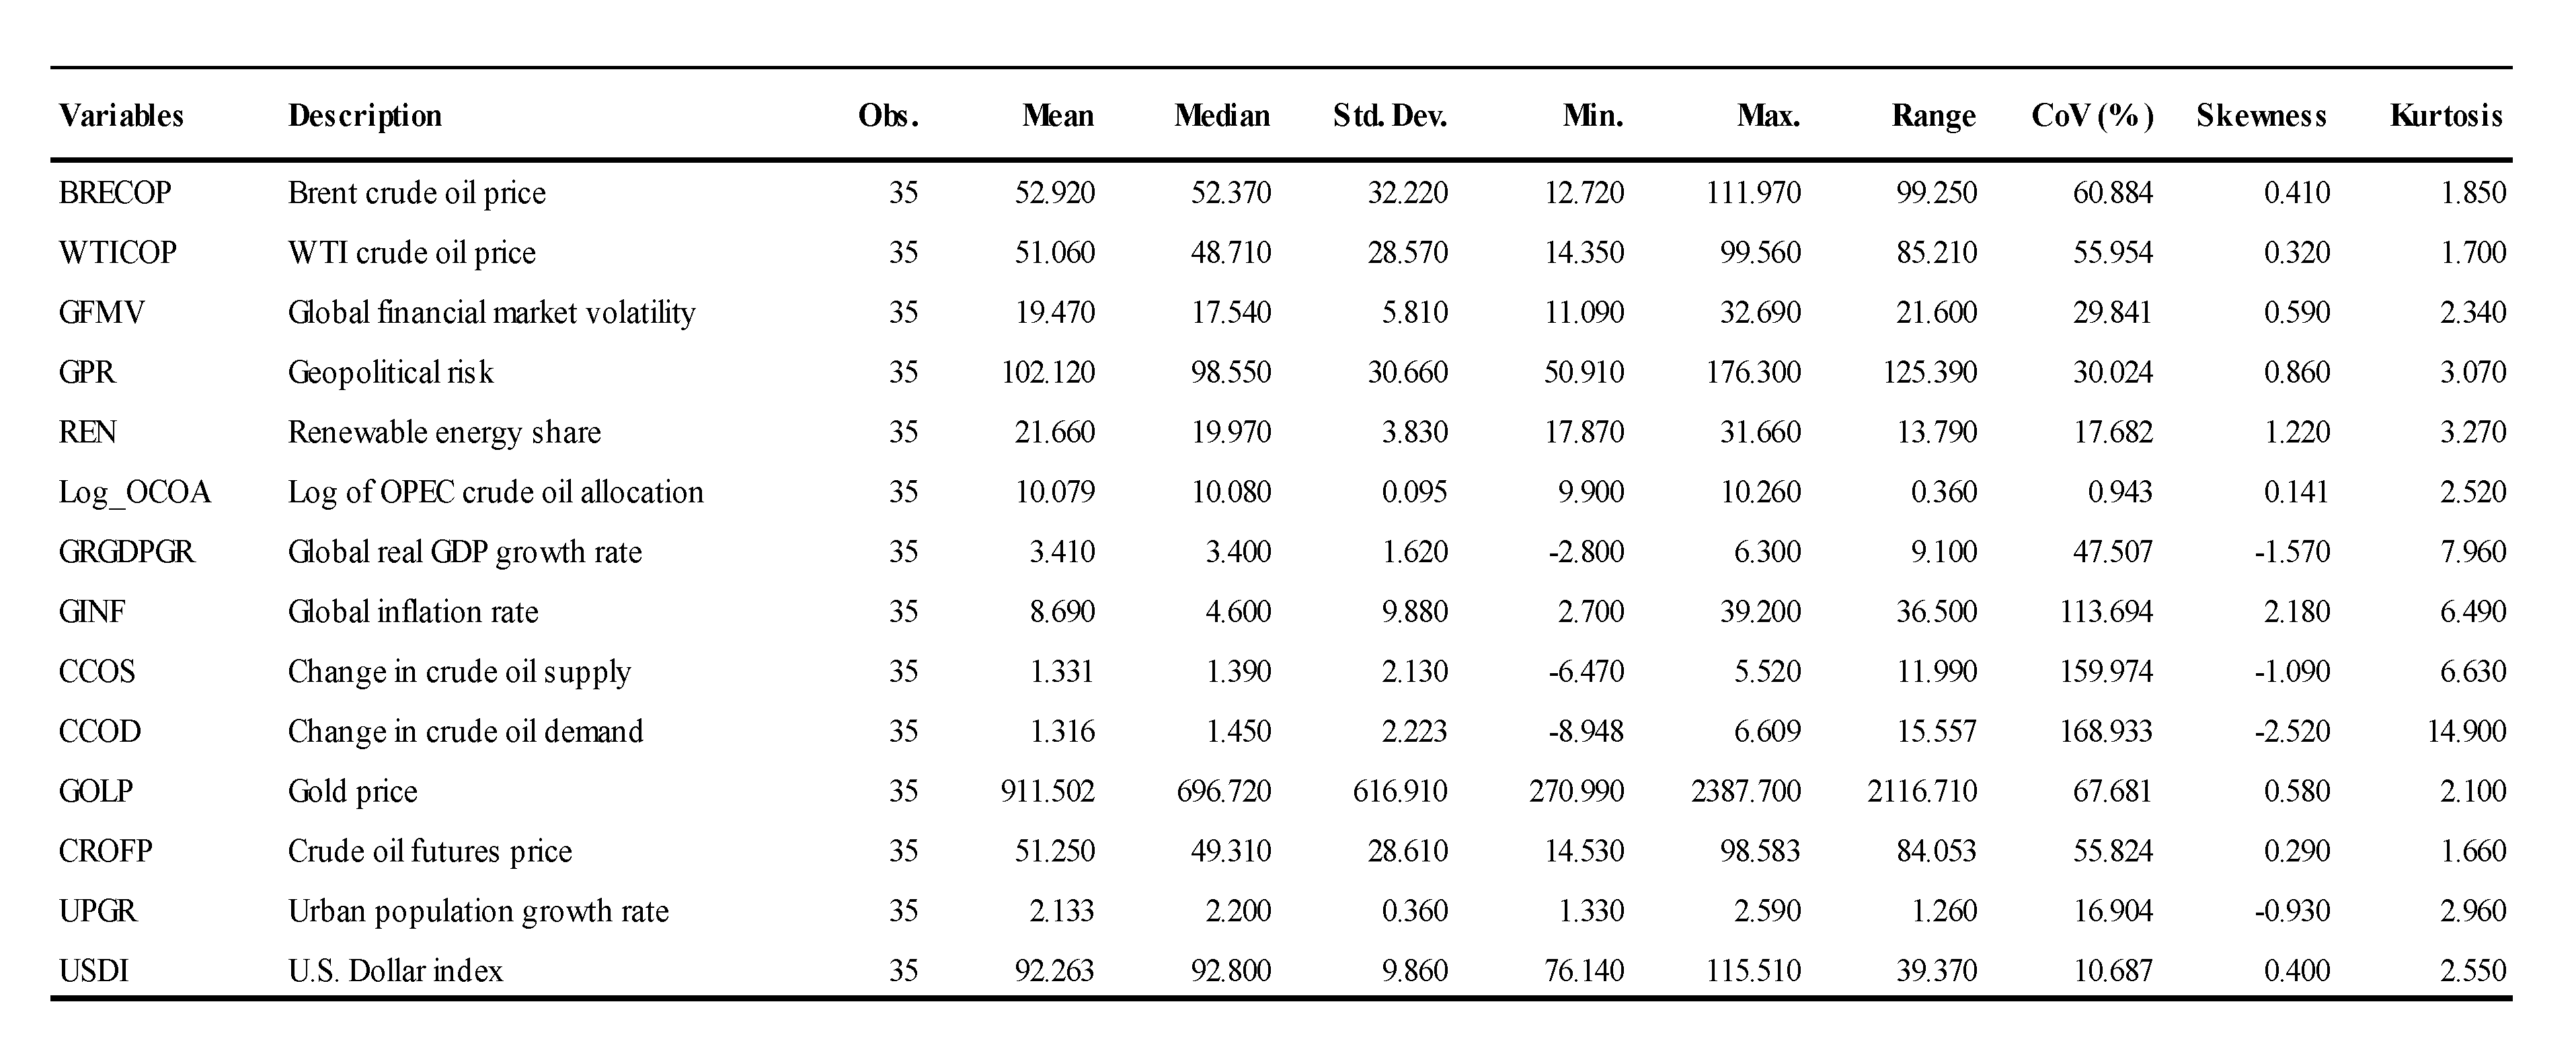
Source: Authors’ compilation (2026) with Stata 18.
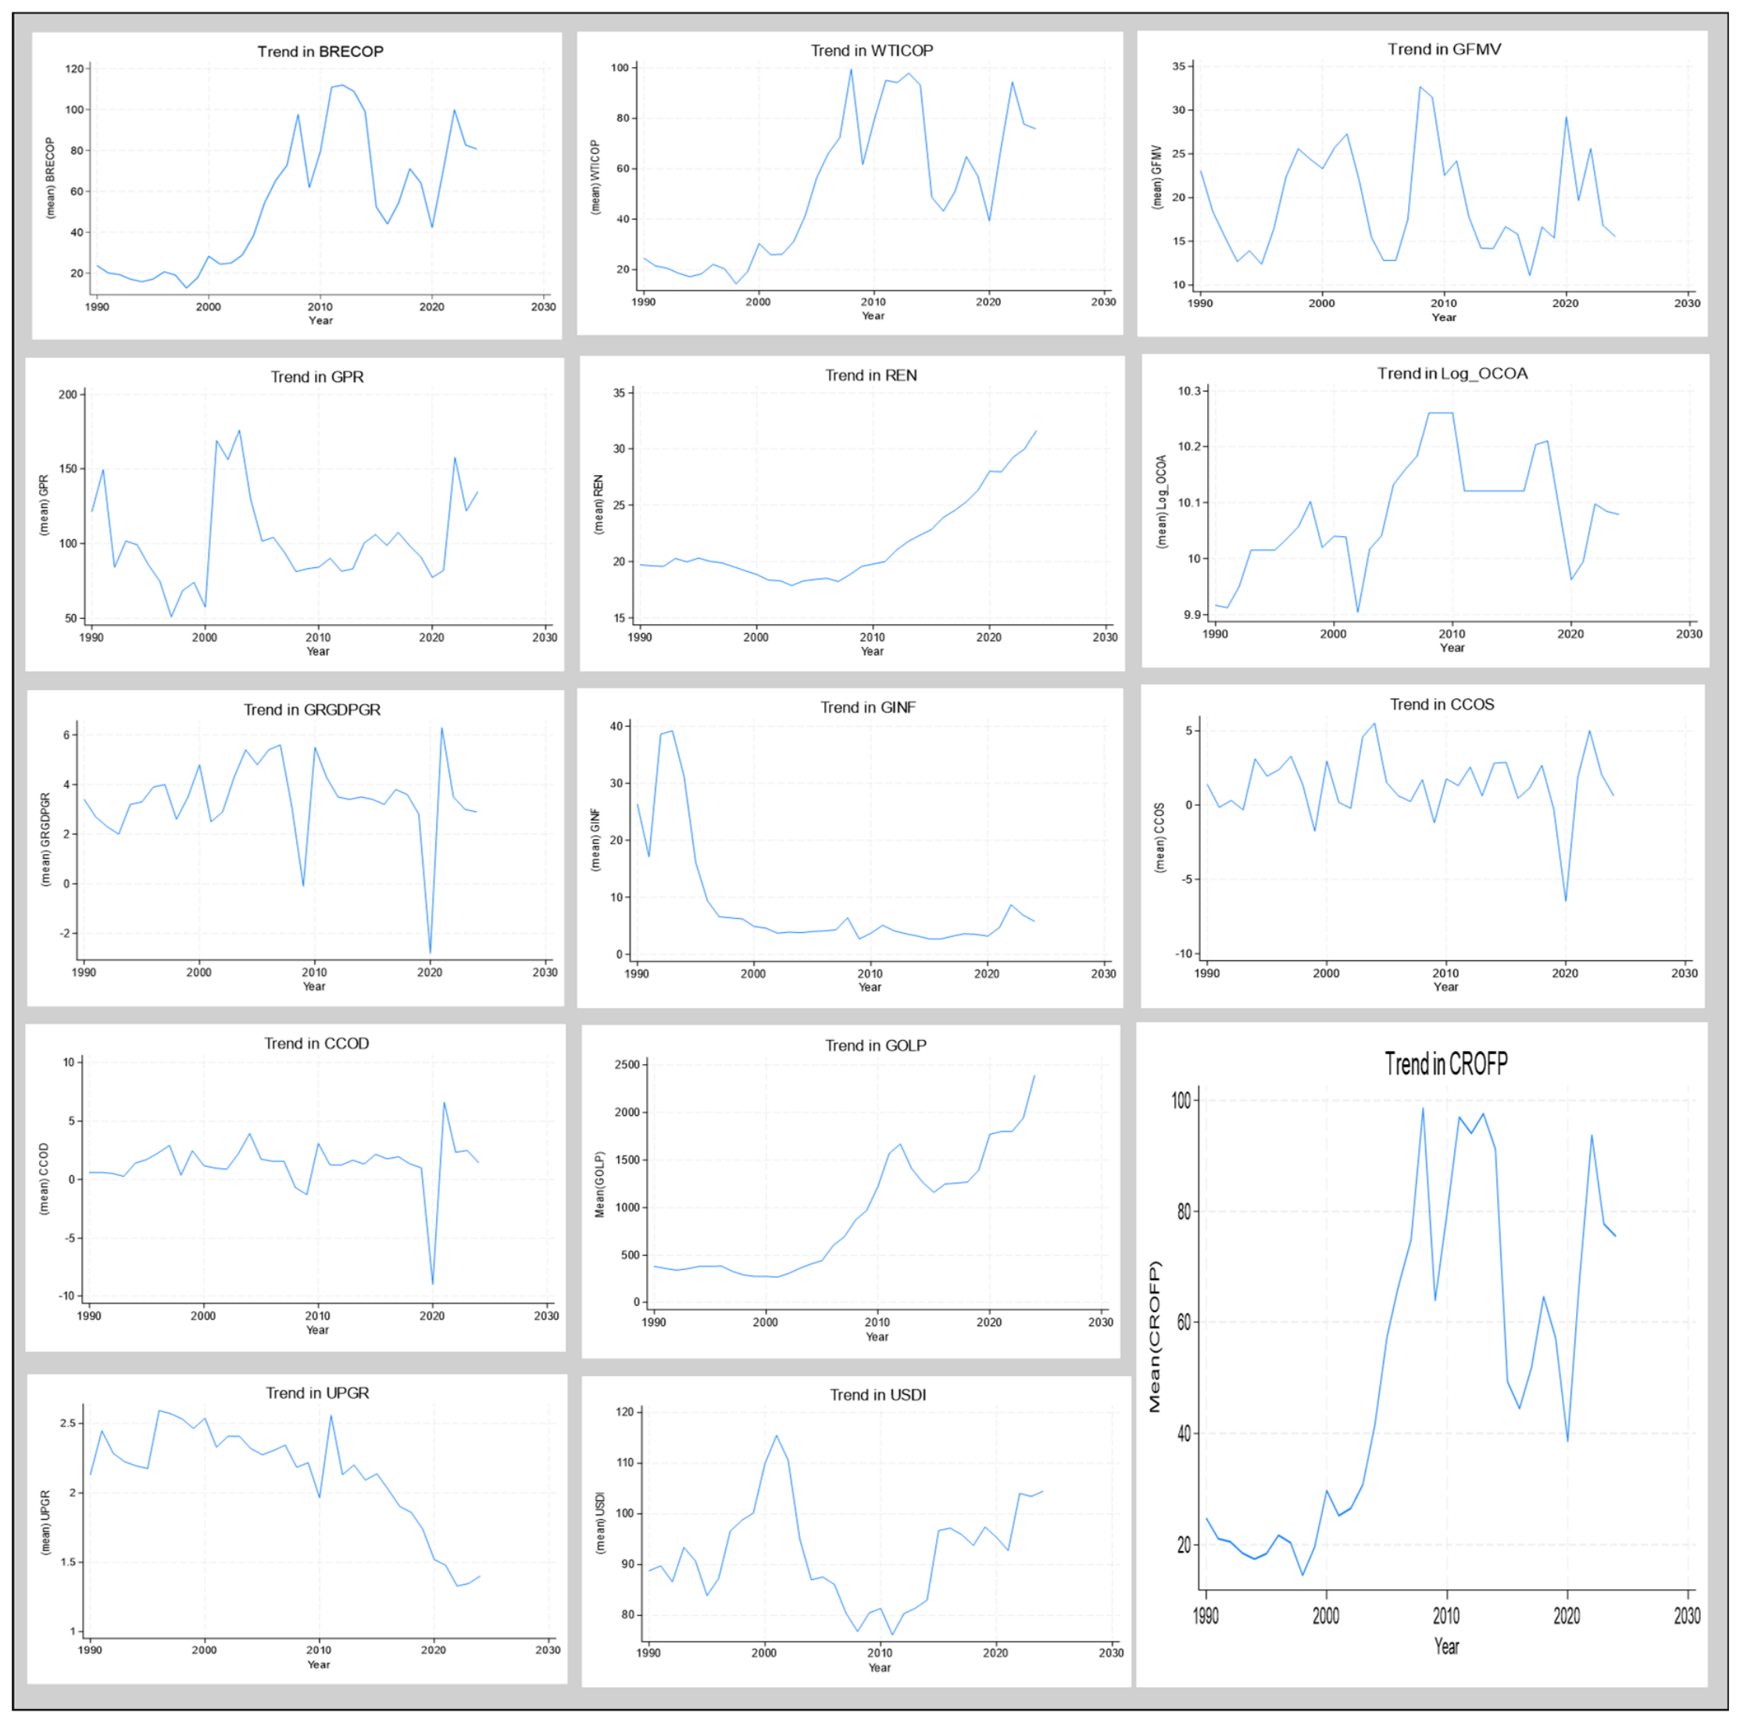
Figure 2.
Trends in research variables.Source: Author’s computation from Stata (2026).
Correlation Analysis and Multicollinearity
The correlation matrix highlights some key associations between crude oil prices, financial market conditions, geopolitical risk, energy transition indicators, and other variables. First, Brent and WTI crude oil prices are strongly correlated (r=0.994), meaning they are closely associated and respond to global market conditions in similar ways. This verifies the validity of the robustness criterion, namely WTI crude oil prices, for the study. Global financial market volatility and oil prices (Brent and WTI crude oil) have weak positive linear associations, with r=0.011 and r=0.032, respectively, indicating that global financial market volatility may influence oil prices through more dynamic or nonlinear channels than through strong direct contemporaneous relationships. Brent and WTI also show weak negative correlations with geopolitical risk of -0.038 and -0.024, respectively, suggesting that geopolitical risk and crude prices tend to move in opposite directions. Moderate positive correlations were observed between the share of renewable energy in electricity production and both Brent (r=0.396) and WTI prices (r=0.372), suggesting that the energy transition and fossil fuel markets remain intertwined. The correlation of OPEC crude oil allocation with both Brent and WTI prices is very high and positive, r=0.607 and 0.639, respectively, highlighting the relevance of OPEC’s oil supply decisions. The global real GDP growth rate displays weak correlation with Brent and WTI prices, r=0.173 and 0.201, respectively. For global inflation, there are negative relationships with both Brent (r = -0.456) and WTI (r = -0.465), suggesting that global inflation and oil prices move in opposite directions. Changes in crude oil supply and changes in crude oil demand both have a weakly positive correlation with oil prices. Gold prices show a strong positive association with oil prices, indicating that gold and oil prices swing in the same direction. Similarly, crude oil futures prices have strong positive associations with Brent and WTI prices, r = 0.993 and 0.9995, respectively. The urban population growth rate has a moderate negative association with oil prices. Moreover, the dollar index shows moderate negative correlations with both Brent (r = -0.395) and WTI (r = -0.402) prices, further reinforcing the inverse relationship between dollar appreciation and crude oil prices for oil priced in dollars.
Importantly, the explanatory variables are not highly correlated with each other, as the correlation coefficients among the explanatory variables are generally below the conventional 0.80 threshold for multicollinearity risk. Nevertheless, gold prices have a strong positive correlation with renewable energy (r=0.849) and a strong negative correlation with urban population growth rate. Due to the high correlation with two explanatory variables, gold prices were excluded from the regression model to prevent multicollinearity. As predicted, when gold prices were included in the model for multicollinearity testing, a very high variance inflation factor (VIF) was observed, justifying their exclusion from the linear regression models. Also, changes in crude oil demand (CCOD) have a strong positive correlation with the global real GDP growth rate (r = 0.861) but are retained because no multicollinearity is indicated. The multicollinearity test results in Appendix 1 show a variance inflation factor (VIF) of less than 10, indicating absence of multicollinearity in the models, except for Models 5, 6, 11, and 12, which are interaction models and have VIFs exceeding the threshold of 10. When the VIF exceeds 10, multicollinearity is considered present (Sanli & Arslan, 2025). Nevertheless, Brambor et al. (2006) clarify that multicollinearity should not be a concern in an interaction effect model since the standard errors correctly capture this fact. The scholars further note that, for these models, the conditional or net effects of the interaction terms are interpreted. Eozenou (2008) further notes that interaction terms often introduce multicollinearity, leading to inflated variances of the estimated coefficients, although multicollinearity would only influence the precision of the estimator, not its consistency property. The scholar further submits that although multicollinearity could inflate variances, the resulting parameter estimates are conservative.

Table 3.
Correlation Matrix.
| Variables | BRECOP | WTICOP | GFMV | GPR | REN | Log_OCOA | GRGDPGR | GINF | CCOS | CCOD | GOLP | CROFP | UPGR | USDI |
| BRECOP | 1.000 | |||||||||||||
| WTICOP | 0.994 | 1.000 | ||||||||||||
| GFMV | 0.011 | 0.032 | 1.000 | |||||||||||
| GPR | -0.038 | -0.024 | 0.005 | 1.000 | ||||||||||
| REN | 0.396 | 0.372 | -0.123 | 0.079 | 1.000 | |||||||||
| Log_OCOA | 0.607 | 0.639 | 0.027 | -0.279 | 0.036 | 1.000 | ||||||||
| GRGDPGR | 0.173 | 0.201 | -0.368 | 0.020 | -0.234 | 0.187 | 1.000 | |||||||
| GINF | -0.456 | -0.465 | -0.244 | 0.002 | -0.171 | -0.478 | -0.169 | 1.000 | ||||||
| CCOS | 0.133 | 0.149 | -0.250 | 0.198 | -0.108 | 0.148 | 0.672 | -0.033 | 1.000 | |||||
| CCOD | 0.084 | 0.098 | -0.390 | 0.105 | -0.052 | 0.085 | 0.861 | -0.076 | 0.706 | 1.000 | ||||
| GOLP | 0.770 | 0.741 | -0.035 | 0.002 | 0.849 | 0.333 | -0.126 | -0.378 | -0.092 | -0.052 | 1.000 | |||
| CROFP | 0.993 | 0.9995 | 0.032 | -0.029 | 0.365 | 0.648 | 0.206 | -0.467 | 0.143 | 0.102 | 0.739 | 1.000 | ||
| UPGR | -0.445 | -0.446 | 0.081 | -0.185 | -0.916 | -0.109 | 0.196 | 0.119 | 0.097 | 0.062 | -0.812 | 0.439 | 1.000 | |
| USDI | -0.395 | -0.402 | 0.139 | 0.388 | 0.309 | -0.396 | -0.144 | -0.093 | -0.044 | 0.024 | -0.043 | 0.410 | -0.209 | 1.000 |
Source: Authors’ compilation (2026) with Stata 18.
4.2. Pre-Model Estimation Tests
4.2.1. Unit Root Test Results
First, the stationarity of the time series was examined using the Augmented Dickey-Fuller (ADF) and Phillips-Perron (PP) unit root tests. The unit root test results are presented in Table 4. Stationarity tests are crucial because they confirm whether a variable has a stable mean and constant variance over time so as to ensure statistical model stability, prevent spurious regressions, foster reliable forecasting, and validate many econometric model estimation assumptions. Only GRGDPGR, CCOS, and CCOD are stationary in levels, indicating that these variables have a stable mean and constant variance in their original forms without needing any mathematical transformations like differencing or detrending, while the other variables become stationary after first differencing. Overall, the variables are of mixed order of integration. However, GOLP is integrated of order 2 (I(2)) and was therefore excluded from the regression models. This mixed order of integration satisfies the key requirement for applying the ARDL framework of Pesaran et al. (2001).
4.3. Baseline Empirical Regression Models
Short-run ARDL Estimates
Six (6) baselines were estimated to test the study’s hypotheses using the ARDL technique for each of Brent and WTI crude oil prices, leading to 12 models in total. Models 1 and 7 examine the effect of global financial market volatility on Brent and WTI crude oil prices, respectively. Models 2 and 8 examine the effect of geopolitical risk on Brent and WTI crude oil prices, respectively. Models 3 and 9 examine the effect of energy transition on Brent and WTI crude oil prices, respectively. Models 4 and 10 examine the effect of both global financial market volatility and geopolitical risk on Brent and WTI crude oil prices, respectively. Models 5 and 11 estimate the interaction effect of global financial market volatility and geopolitical risk on Brent and WTI crude oil prices, respectively, while Models 6 and 12 estimate the interaction effect of geopolitical risk and the energy transition on Brent and WTI crude oil prices, respectively. The short-run ARDL estimates are presented in Table 5. The estimates show that the coefficients of the lagged values of Brent crude oil price are positive and significant in Models 1-6, implying that the current value of Brent crude oil price is positively influenced by its past values. However, the coefficients of the lagged values of WTI crude oil price are negative in Models 7-12, although it is only significant in Model 7. This indicates that the current WTI crude oil price is weakly and negatively determined by its past value.
Table 5. Short-run ARDL Estimates.
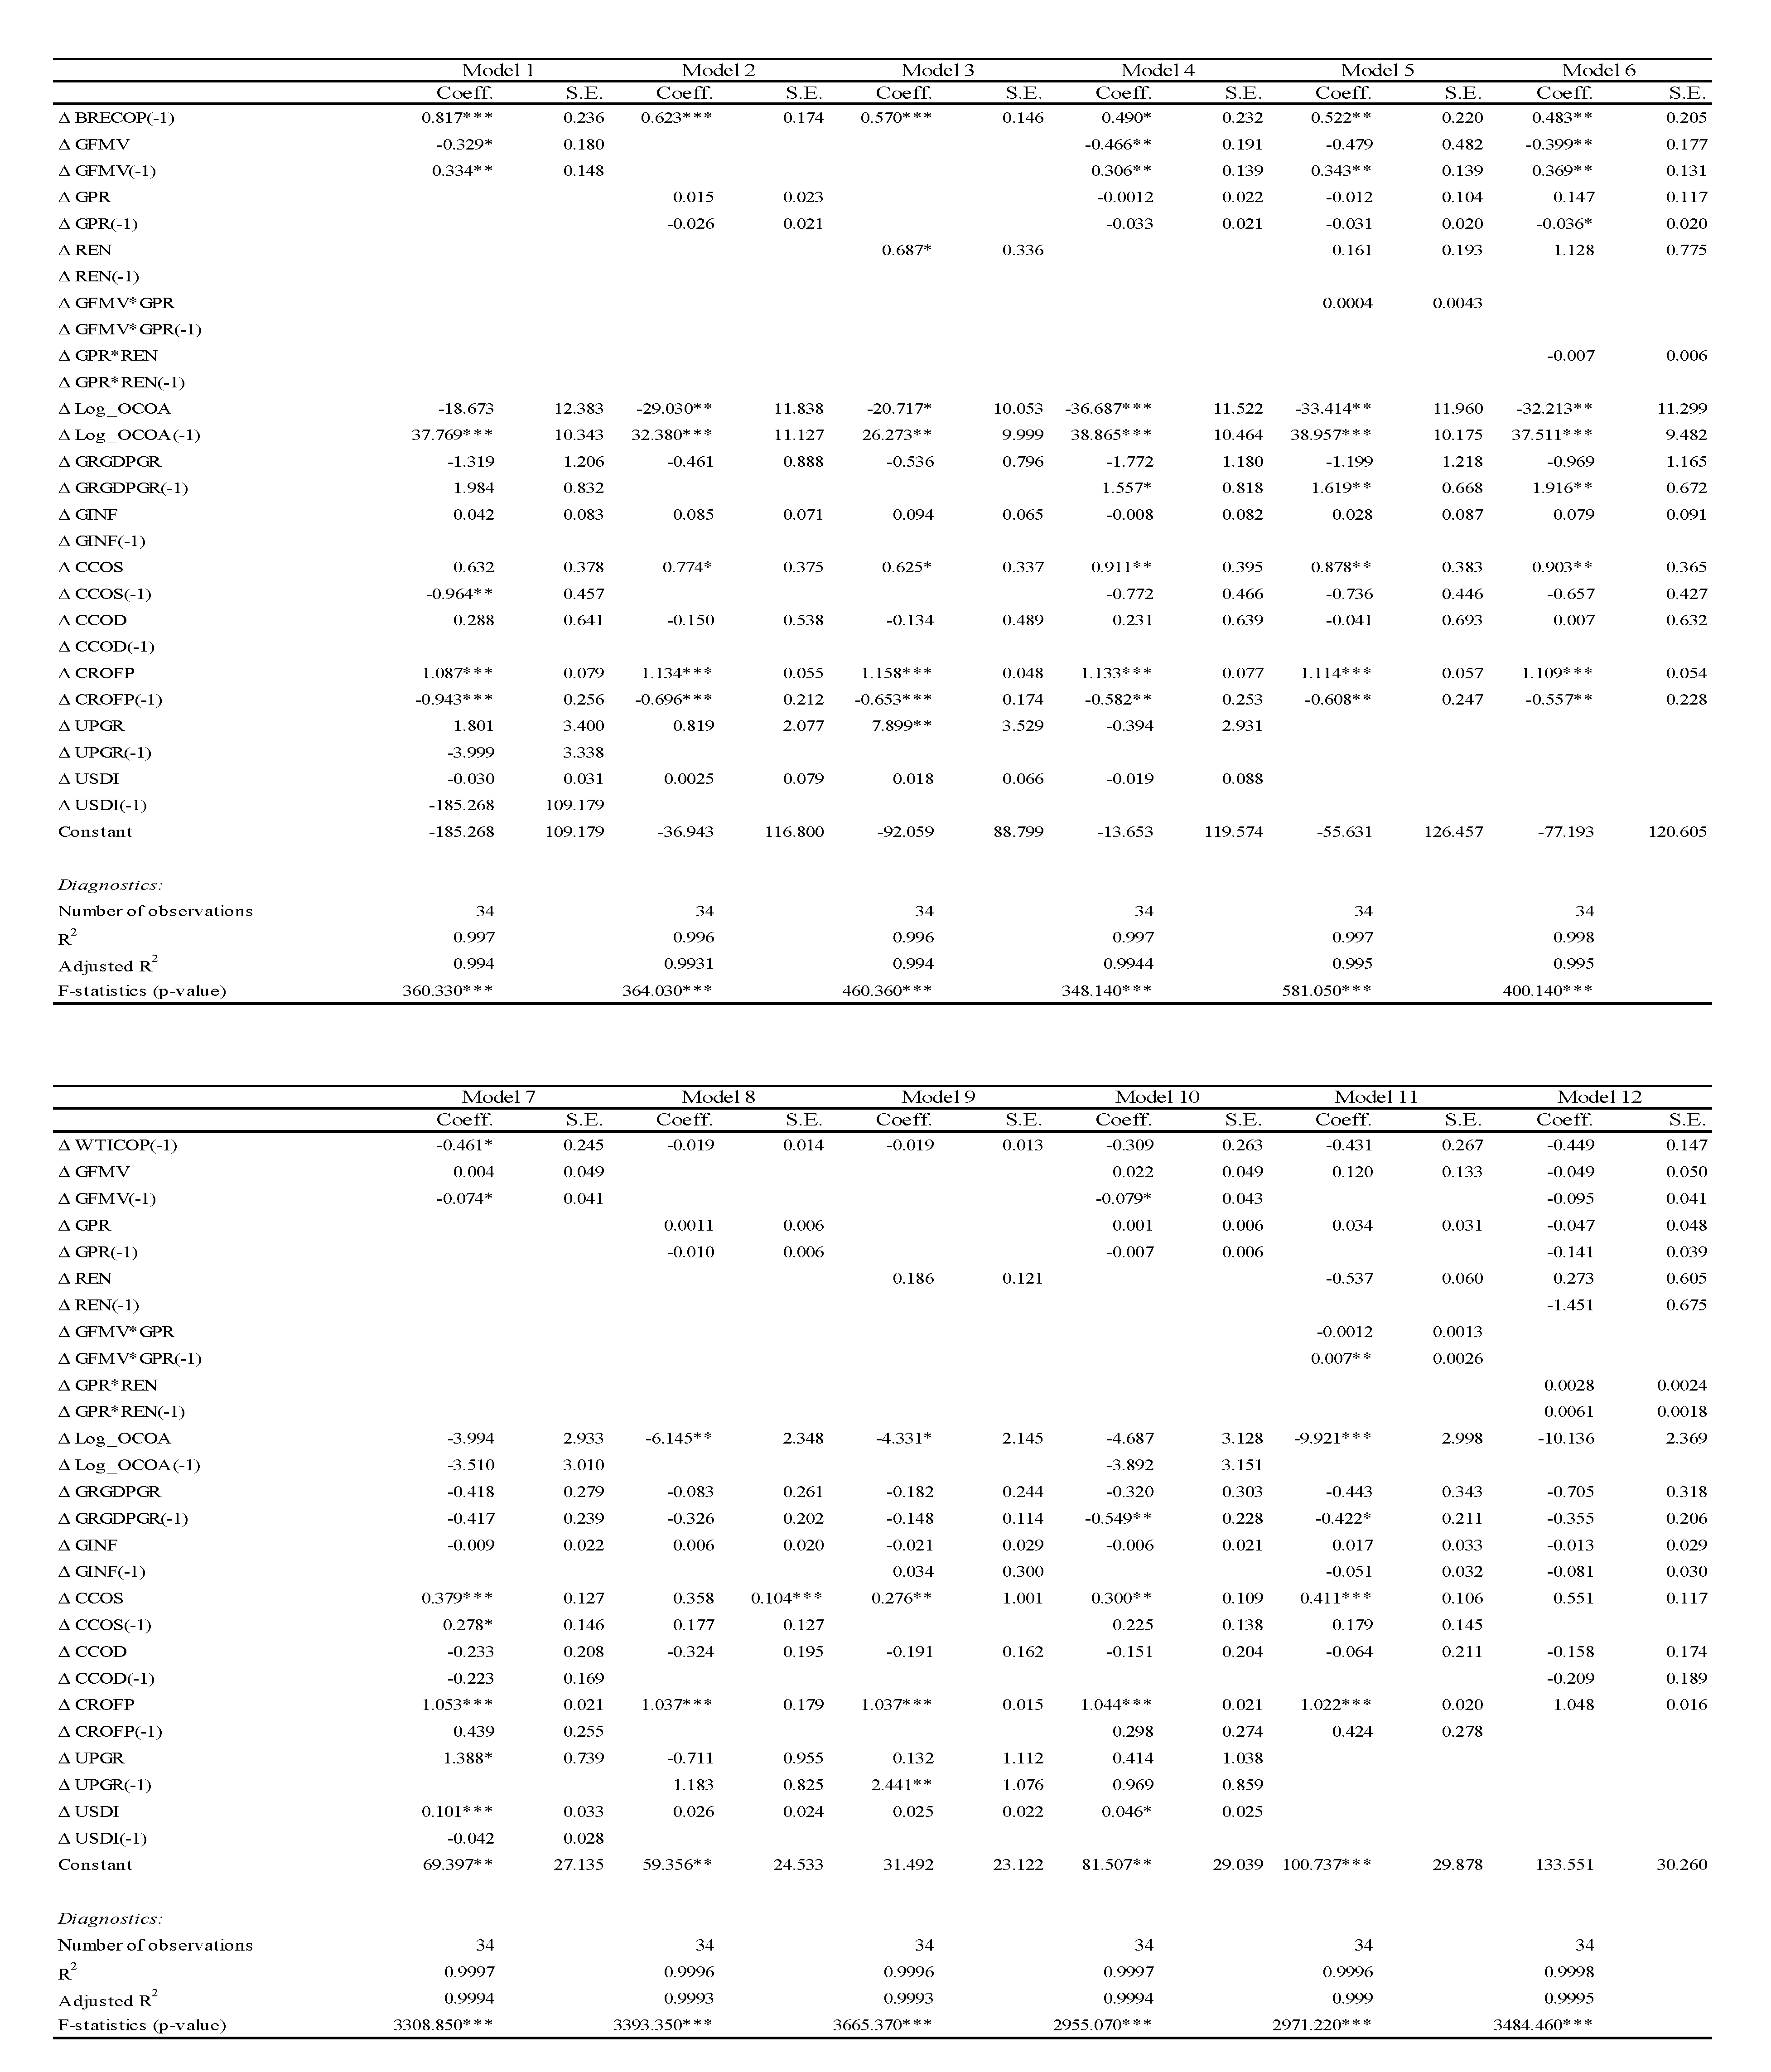
Source: Authors’ compilation (2026) with Stata 18. Note: Standard errors in parentheses; ***, **, * denote 1%; 5% significant levels respectively.
Also, the current value of global financial market volatility (-0.074) has a negative and significant effect on Brent crude oil price, while its lagged value (0.334) has a significant positive association with Brent crude oil price. Conversely, the current value of global financial market volatility (0.004) has an insignificant positive effect on WTI crude oil price, while its lagged value (-0.074) has a significant positive association with WTI crude oil price. Geopolitical risk shows a positive but insignificant link with Brent and WTI crude oil prices, while its lagged value displays insignificant negative coefficients with Brent and WTI crude oil prices. Energy transition displays a significant positive effect on Brent crude oil price (0.687), but an insignificant positive effect on WTI crude oil price (0.186). When global financial market volatility and geopolitical risk were utilized in the same model, global financial market volatility (-0.466) has a significant and negative coefficient, while its lagged value (0.306) has a significant positive coefficient, whereas the lagged and the current values of geopolitical risk have insignificant negative coefficients, as shown in Model 4. In the corresponding WTI estimates in Model 10, global financial market volatility insignificantly increases WTI crude oil price, while its lagged value is significantly negatively related to WTI crude oil price. The effect of geopolitical risk mirrors the results in Model 8. In the interaction models in Models 5, 6, 11, and 12, there is no strong evidence that geopolitical risk significantly alters the effects of global financial market volatility and the energy transition in the short run.
For the short-run estimates, the control variables give valuable information as well. The OPEC crude oil allocation, expressed in logarithmic form, generally has a significant negative association with Brent and WTI crude oil prices, although its lagged values are positively associated with Brent crude oil price. The global real GDP growth rate shows an insignificant negative relationship with Brent and WTI crude oil prices. The global inflation rate is largely positively but insignificantly related to Brent and WTI crude oil prices. Changes in crude oil supply (ΔCCOS) have a significant and positive effect on Brent and WTI crude oil prices, whereas changes in demand have a weak negative association with Brent and WTI crude oil prices. Crude oil futures prices have a significant positive relationship with Brent and WTI crude oil prices at a 1% level. Changes in urban population growth rate emerged as a key driver of increased Brent and WTI crude oil prices. Finally, the U.S. dollar index’s link is insignificant, but the sign of its coefficient is sensitive to the variables utilized. However, the U.S. dollar index displayed positive and significant coefficients with WTI crude oil price in Models 7 and 10.
In terms of the model’s overall efficacy, the R2 and adjusted R2 values are above 99% in all 12 short-run ARDL models, indicating that the explanatory variables are potent in capturing variation in Brent and WTI crude oil prices. Also, the P-values of the F-statistics in all the models are statistically significant at a 1% level, confirming the model’s goodness of fit.
Long-run ARDL Estimates
Table 6 contains the long-run ARDL estimates. After confirming the mixed orders of integration of the variables, the study used the ARDL Bounds Testing approach of Pesaran et al. (2001) to investigate the existence of a long-run relationship between the variables, which are crude oil prices, financial market volatility, geopolitical risk, energy transition, and the selected control variables. The ARDL Bounds test results are shown in Table 7. From the ARDL Bounds Test results, the values of the calculated F-statistics are lower than the lower critical values in Models 1-5, while they fall between the lower and upper critical values in Model 6. Usually, when cointegration cannot be inferred, only short-run dynamics would be estimated. However, estimation can still be carried out with reliance on the outcome of ECM sign and significance. Since negative and significant ECMs attest to convergence back to equilibrium (cointegration) in the event of a shock in the short run, this can become a plausible argument for estimating both short-run and long-run ARDL (Kenteci, 2009; Box-Steffensmeier et al., 2015).
Table 6. Long-run ARDL Estimates.
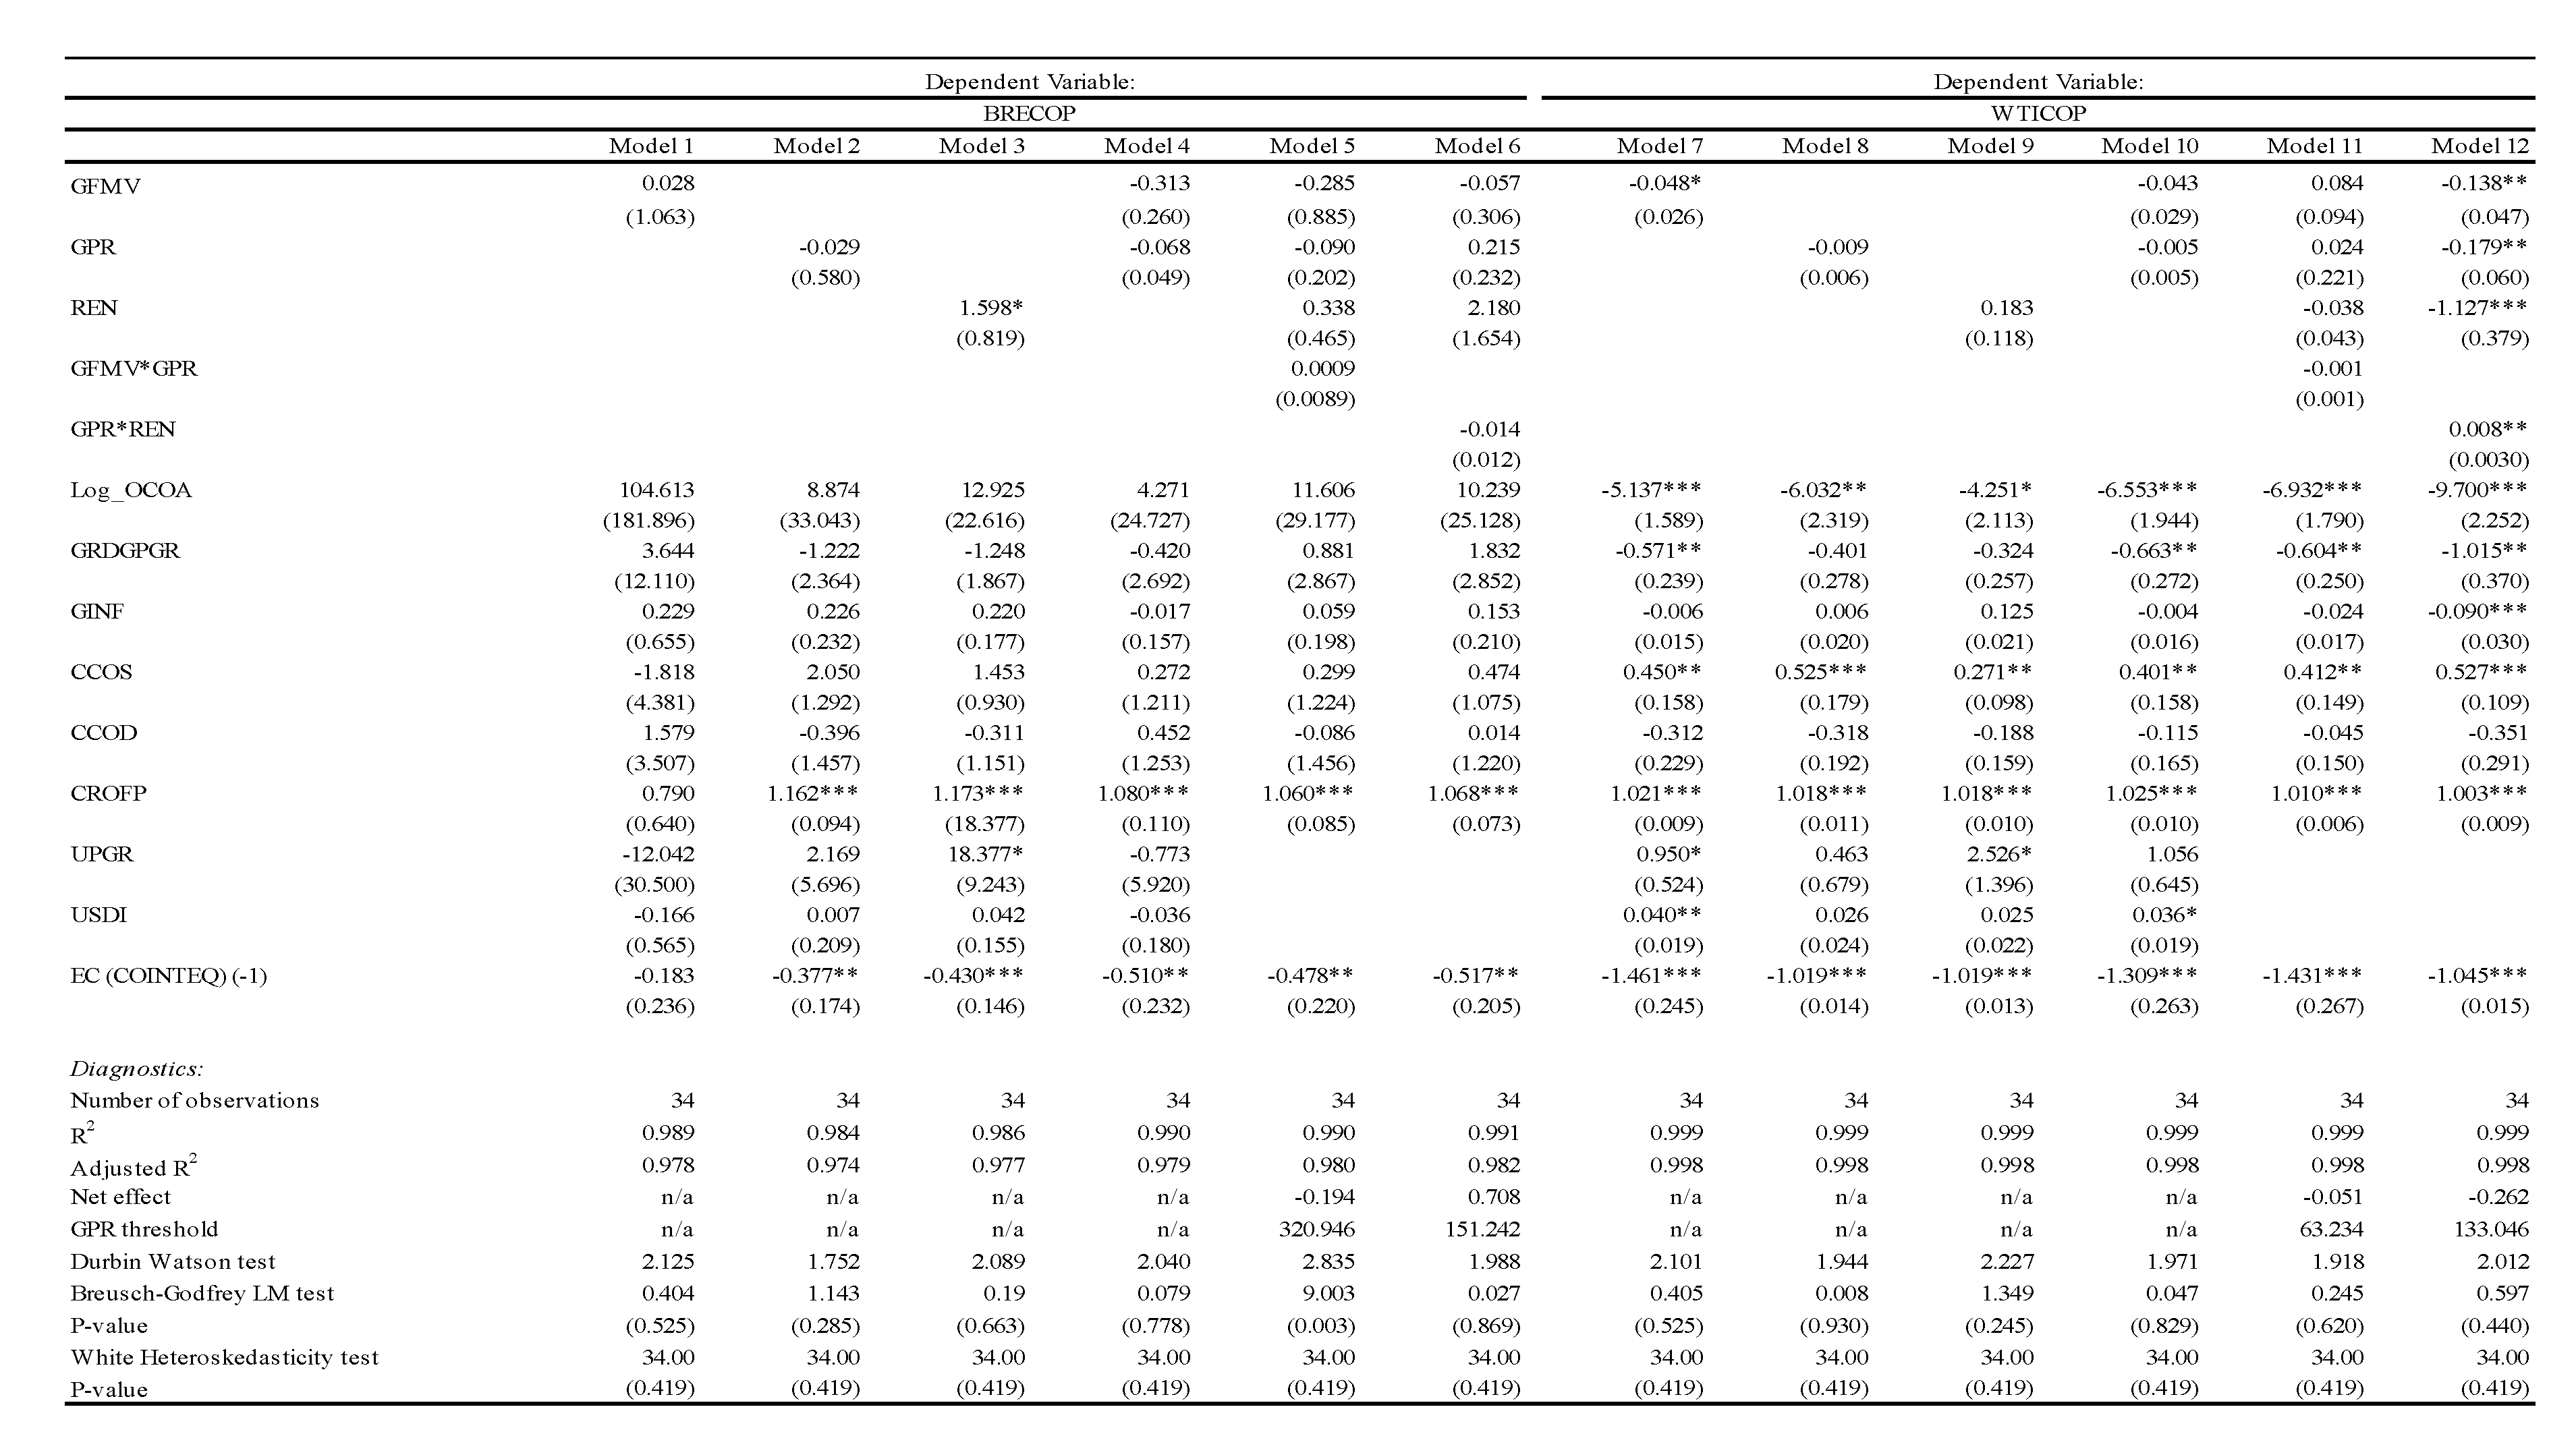
Source: Authors’ compilation (2026) with Stata 18. Note: Standard errors in parentheses; ***, **, * denote 1%; 5% significant levels respectively.
Table 7. ARDL Bounds Test Results.
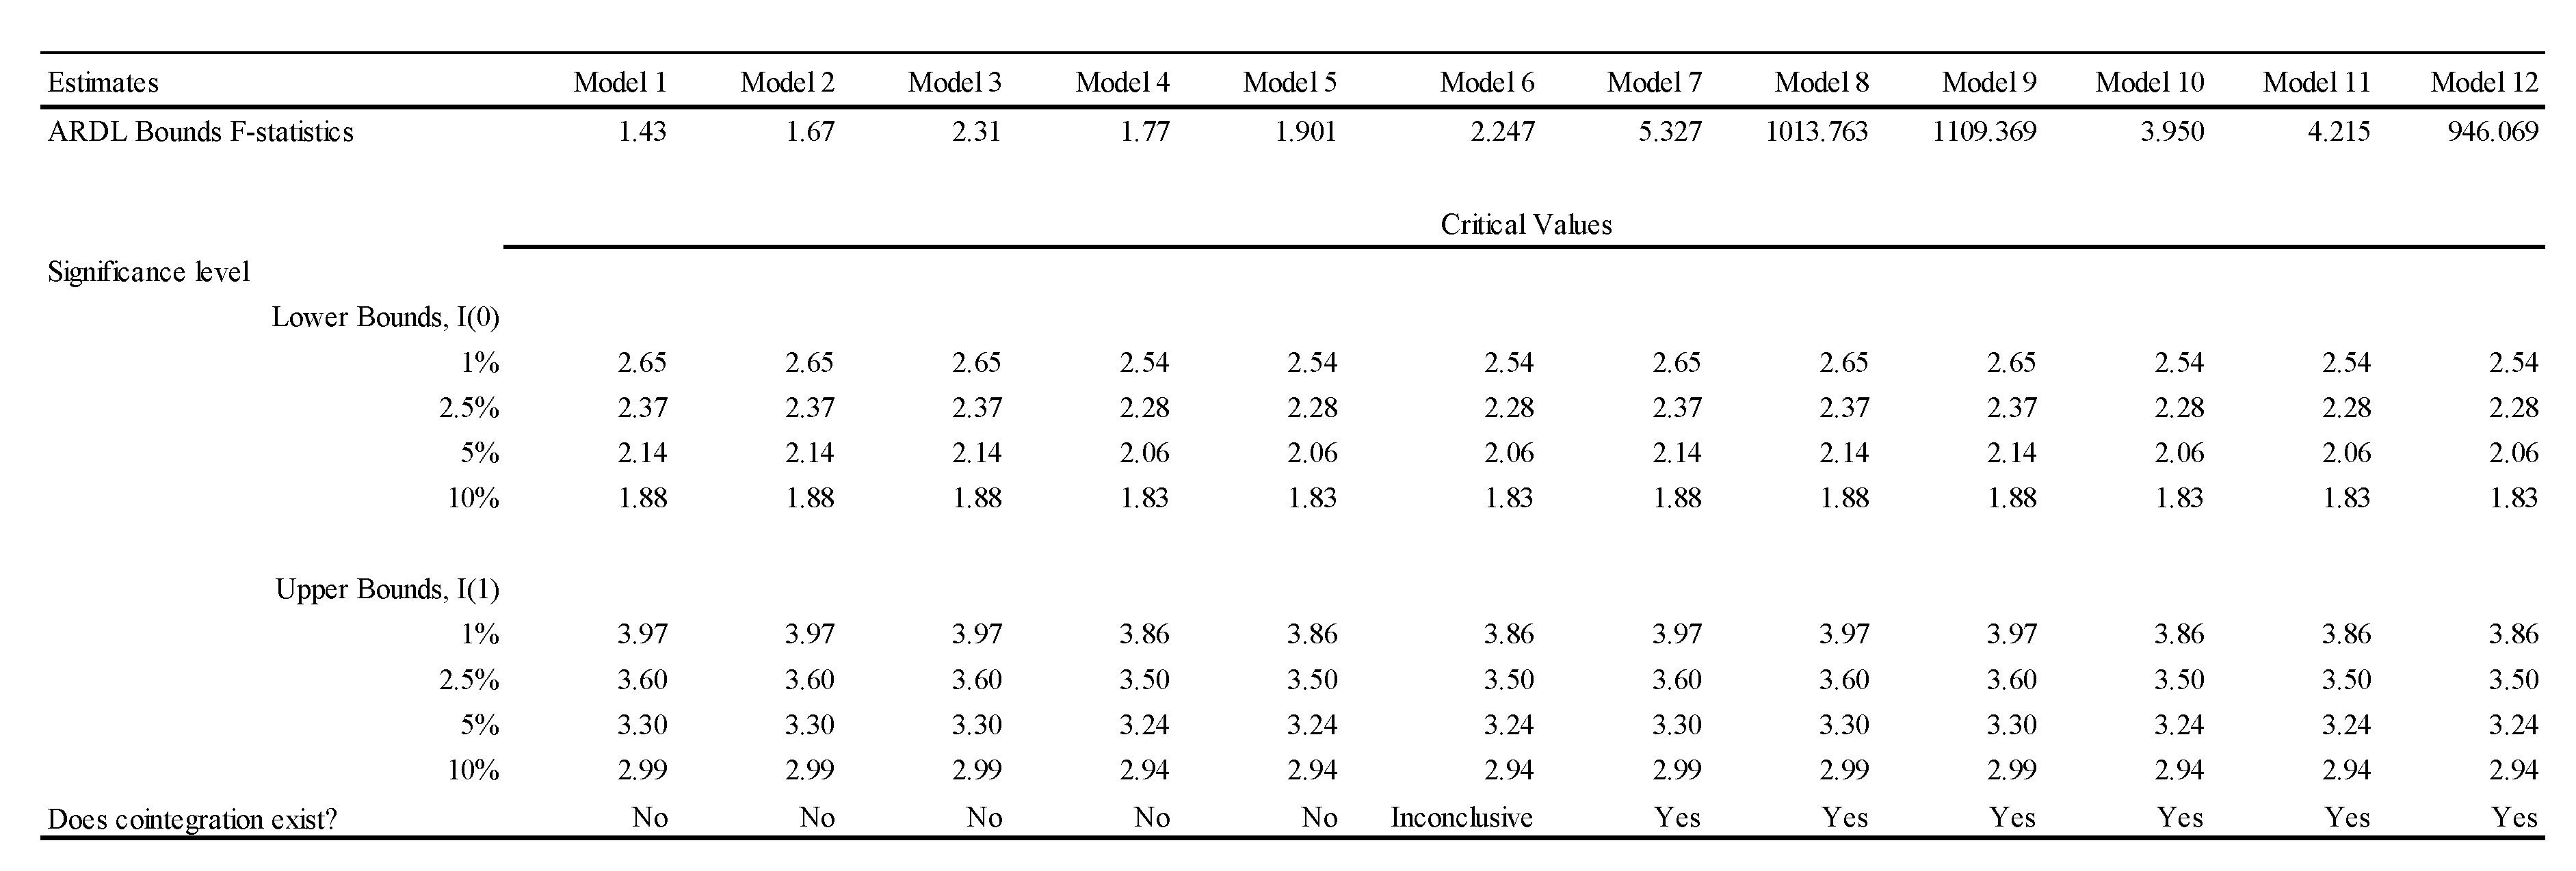
Source: Authors’ compilation (2026) with Stata 18.
Therefore, the null hypothesis of no cointegration relationship is not rejected for Models 1-5, while the cointegration test for Model 6 is inconclusive. Nonetheless, the calculated F-statistics exceed the upper critical values in Models 7-12 at a 1% significance level, indicating a statistically significant long-run equilibrium relationship among crude oil price, global financial market volatility, geopolitical risk, the energy transition, and the chosen control variables. Therefore, the null hypothesis of no cointegration is rejected. Cointegration suggests that, while there may be short-run movements in the global oil market, there is long-run convergence. This finding also supports estimating the Error Correction Model (ECM), which captures the rate of adjustment from short-run disequilibrium to long-run equilibrium. Overall, the ARDL Bounds Test supports the structural relationship between crude oil price determination and financial market conditions, geopolitical uncertainty, energy transition dynamics, and global macroeconomic fundamentals. Based on these results, long-run estimates for WTI crude oil prices in Models 7-12 are relied on more for interpretation, hypothesis testing, and long-run effect analysis.
The results in Model 7 show that global financial market volatility (-0.048) has a significant negative coefficient on WTI crude oil price at the 10% level. This means that a unit change in global financial market volatility leads to a 0.048-unit reduction in WTI crude oil price. Therefore, the first null hypothesis of no significant effect of global financial market volatility on crude oil prices is rejected. The results in Model 8 indicate that geopolitical risk (-0.009) has an insignificant and negative coefficient on WTI crude oil price. Therefore, there is no sufficient statistical evidence to reject the second null hypothesis of no significant relationship between geopolitical risk and crude oil prices. Similarly, the results in Model 9 indicate that energy transition has an insignificant and positive effect on WTI crude oil price. Therefore, there is insufficient statistical evidence to reject the third null hypothesis of no significant relationship between the energy transition and crude oil prices. When global financial market volatility and geopolitical risk are combined in the same regression model, as shown in Model 10, both variables display non-significant and negative coefficients. Therefore, the fourth null hypothesis of no significant effect on crude oil when global financial market and geopolitical risk are introduced in the same model cannot be rejected. Figure 3 presents the graphical analysis of the relationships between global financial market volatility, geopolitical risk, energy transition, and crude oil prices, confirming the results indicated in the econometric models.
For the interaction model in Model 11, the coefficient of the interaction term (-0.001) of global financial market volatility and geopolitical risk (GFMV*GPR) is non-significant and negative, while the coefficients of global financial market volatility (0.084) and geopolitical risk (0.024) are non-significant and positive. Therefore, geopolitical risk has weak power to alter the effect of global financial market volatility from positive to negative. This result leads to non-rejection of the fifth null hypothesis that geopolitical risk does not significantly alter the effect of global financial market volatility on crude oil price. However, the interaction regression results in Model 12 show that geopolitical risk (-0.179) and energy transition (-1.127) have significantly negative coefficients, at 5% and 1% levels, respectively. The coefficient of the interaction term (0.008) of geopolitical risk and energy transition (GPR*REN) is positive and statistically significant at a 5% level. This result indicates that geopolitical risk can significantly shift the reducing effect of energy transition to an increasing one. Hence, this result leads to the rejection of the sixth null hypothesis that geopolitical risk does not significantly alter the effect of the energy transition on crude oil price.
Regarding the control variables, the OPEC crude oil allocation has a reducing effect on WTI crude oil price consistently across the models. The global real GDP growth rate has a decreasing effect on WTI crude oil price. Global inflation is shown to have an insignificant decreasing or increasing effect on WTI crude oil price, depending on the variables utilized in the models. Changes in crude oil supply and crude oil futures prices consistently have a significant increasing effect on the WTI crude oil price across the estimated models. Changes in crude oil demand have an insignificant lowering effect on the WTI crude oil price, whereas the urban population growth rate and the U.S. dollar index have a positive relationship with the WTI crude oil price.
Additionally, the coefficients of the error correction or cointegration terms in Models 7-12 are negative and statistically significant, conforming to expectations regarding the reversion of short-term disequilibrium to long-term equilibrium at the calculated convergence or adjustment speed rates. Some model diagnostic statistics are also reported. The Durbin-Watson (approximately 2.0) and Breusch-Pagan LM tests, with P-values>0.10, confirm the absence of serial correlation. The White heteroskedasticity test results with P-values>0.10 indicate that no heteroskedasticity is present. The cumulative sum of recursive residuals (CUSUM) tests are also reported. The CUSUM graphs in Appendix II show that the residual values, indicated by the blue lines, fall between the critical boundaries at the 5% level of significance, confirming model stability. The stability tests further confirm that there are no structural breaks in the model. Also, the R2 and adjusted R2 values are above 99% in all 12 short-run ARDL models, indicating that the explanatory variables are potent in capturing variation in Brent and WTI crude oil prices. Also, the P-values of the F-statistics in all the models are statistically significant at a 1% level, confirming the model’s goodness of fit. Based on the diagnostic and stability test results, it can be concluded that the estimated ARDL models are appropriately specified and steady.
4.3.4. Explaining the Conditional and Net Effects of Global Financial Market Volatility and Energy Transition Further
To provide a clearer perspective on the interaction effect of global financial market volatility and geopolitical risk on crude oil prices, on the one hand, and the interaction effect of energy transition and geopolitical risk on crude oil prices, on the other hand, the conditions for affirming the interaction effect are further explicated. The conditions for the interaction effect are only met in Model 12 of Table 6, where the signs of the coefficient of the primary independent variable (REN) and the interaction terms of energy transition and geopolitical risk (REN*GPR) are of opposing nature and are statistically significant. Therefore, for the WTI model, the net effect of energy transition on WTI crude oil price, contingent on geopolitical risk, is negative or ([-1.127] + [0.008 x 102.120] = -0.262). Here, -1.127 is the direct effect of the energy transition on WTI crude oil price, while 0.008 represents the conditional, or indirect, effect of the interaction between energy transition and geopolitical risk. 102.120 is the average value of the moderating variable, which is geopolitical risk. Therefore, the minimum geopolitical risk threshold required to alter the unconditional effect of energy transition from negative to positive is 133.05 (gross), as shown in Table 6, which is plausible and statistically meaningful because it falls between the minimum value (50.910) and the maximum value (176.300) of geopolitical risk estimated in the summary statistics. Therefore, this threshold of 133.05 implies that when the geopolitical risk index reaches 133.05, the negative effect of the energy transition on WTI crude oil price will become positive.
4.3.5. Robustness Check Using WTI Crude Oil Price
The FMOLS technique was deployed to estimate alternative model parameters to assess the robustness of the baseline empirical results and their sensitivity to the estimation approach. As with the ARDL technique, 6 models were estimated using Brent crude oil price (Models 1-6) and another 6 using WTI crude oil price (Models 7-12), giving a total of 12 models. The FMOLS estimates show greater statistical significance for the effects of global financial market volatility and geopolitical risk, and their interaction terms, on Brent and WTI crude oil prices. From the FMOLS estimates, which are long-run ones, global financial market volatility (-0.312) and geopolitical risk (-0.044) display negative and significant coefficients with Brent crude oil price, whereas the energy transition (1.041) has a significant and positive coefficient with Brent crude oil price. Also, for the interaction models, the coefficients of global financial market volatility (-0.315) and geopolitical risk (-0.208) are negative and significant, while the coefficient of their interaction term (0.008) is positive and significant, indicating that geopolitical risk can alter the effect of global financial market volatility from a negative to a positive effect on Brent crude oil price. For the second interaction model, in Model 6, the coefficients of geopolitical risk (0.219) and energy transition (2.221) are positive and significant, while the coefficient of their interaction term (-0.012) is negative and significant, indicating that geopolitical risk can alter the effect of energy transition from a positive to a negative effect on Brent crude oil price. The FMOLS estimates for WTI crude oil price (Models 7-12) align with the ARDL long-run estimates, although the FMOLS technique did not find a significant effect of the interaction between geopolitical risk and the energy transition, as the ARDL model did.
Regarding the control variables, the reducing effect of OPEC crude oil allocation on WTI crude oil price and changes in crude oil demand (CCOD) is robust. Also, the increasing effect of changes in crude oil supply and crude oil futures prices on WTI crude oil price is consistent with the ARDL long-run estimates, confirming robustness in the empirical linkages between these variables. Furthermore, the estimated FMOLS models display high R2 and adjusted R2 values above 98%, indicating that the explanatory variables are potent in capturing variation in crude oil prices.
Table 8. FMOLS Results.
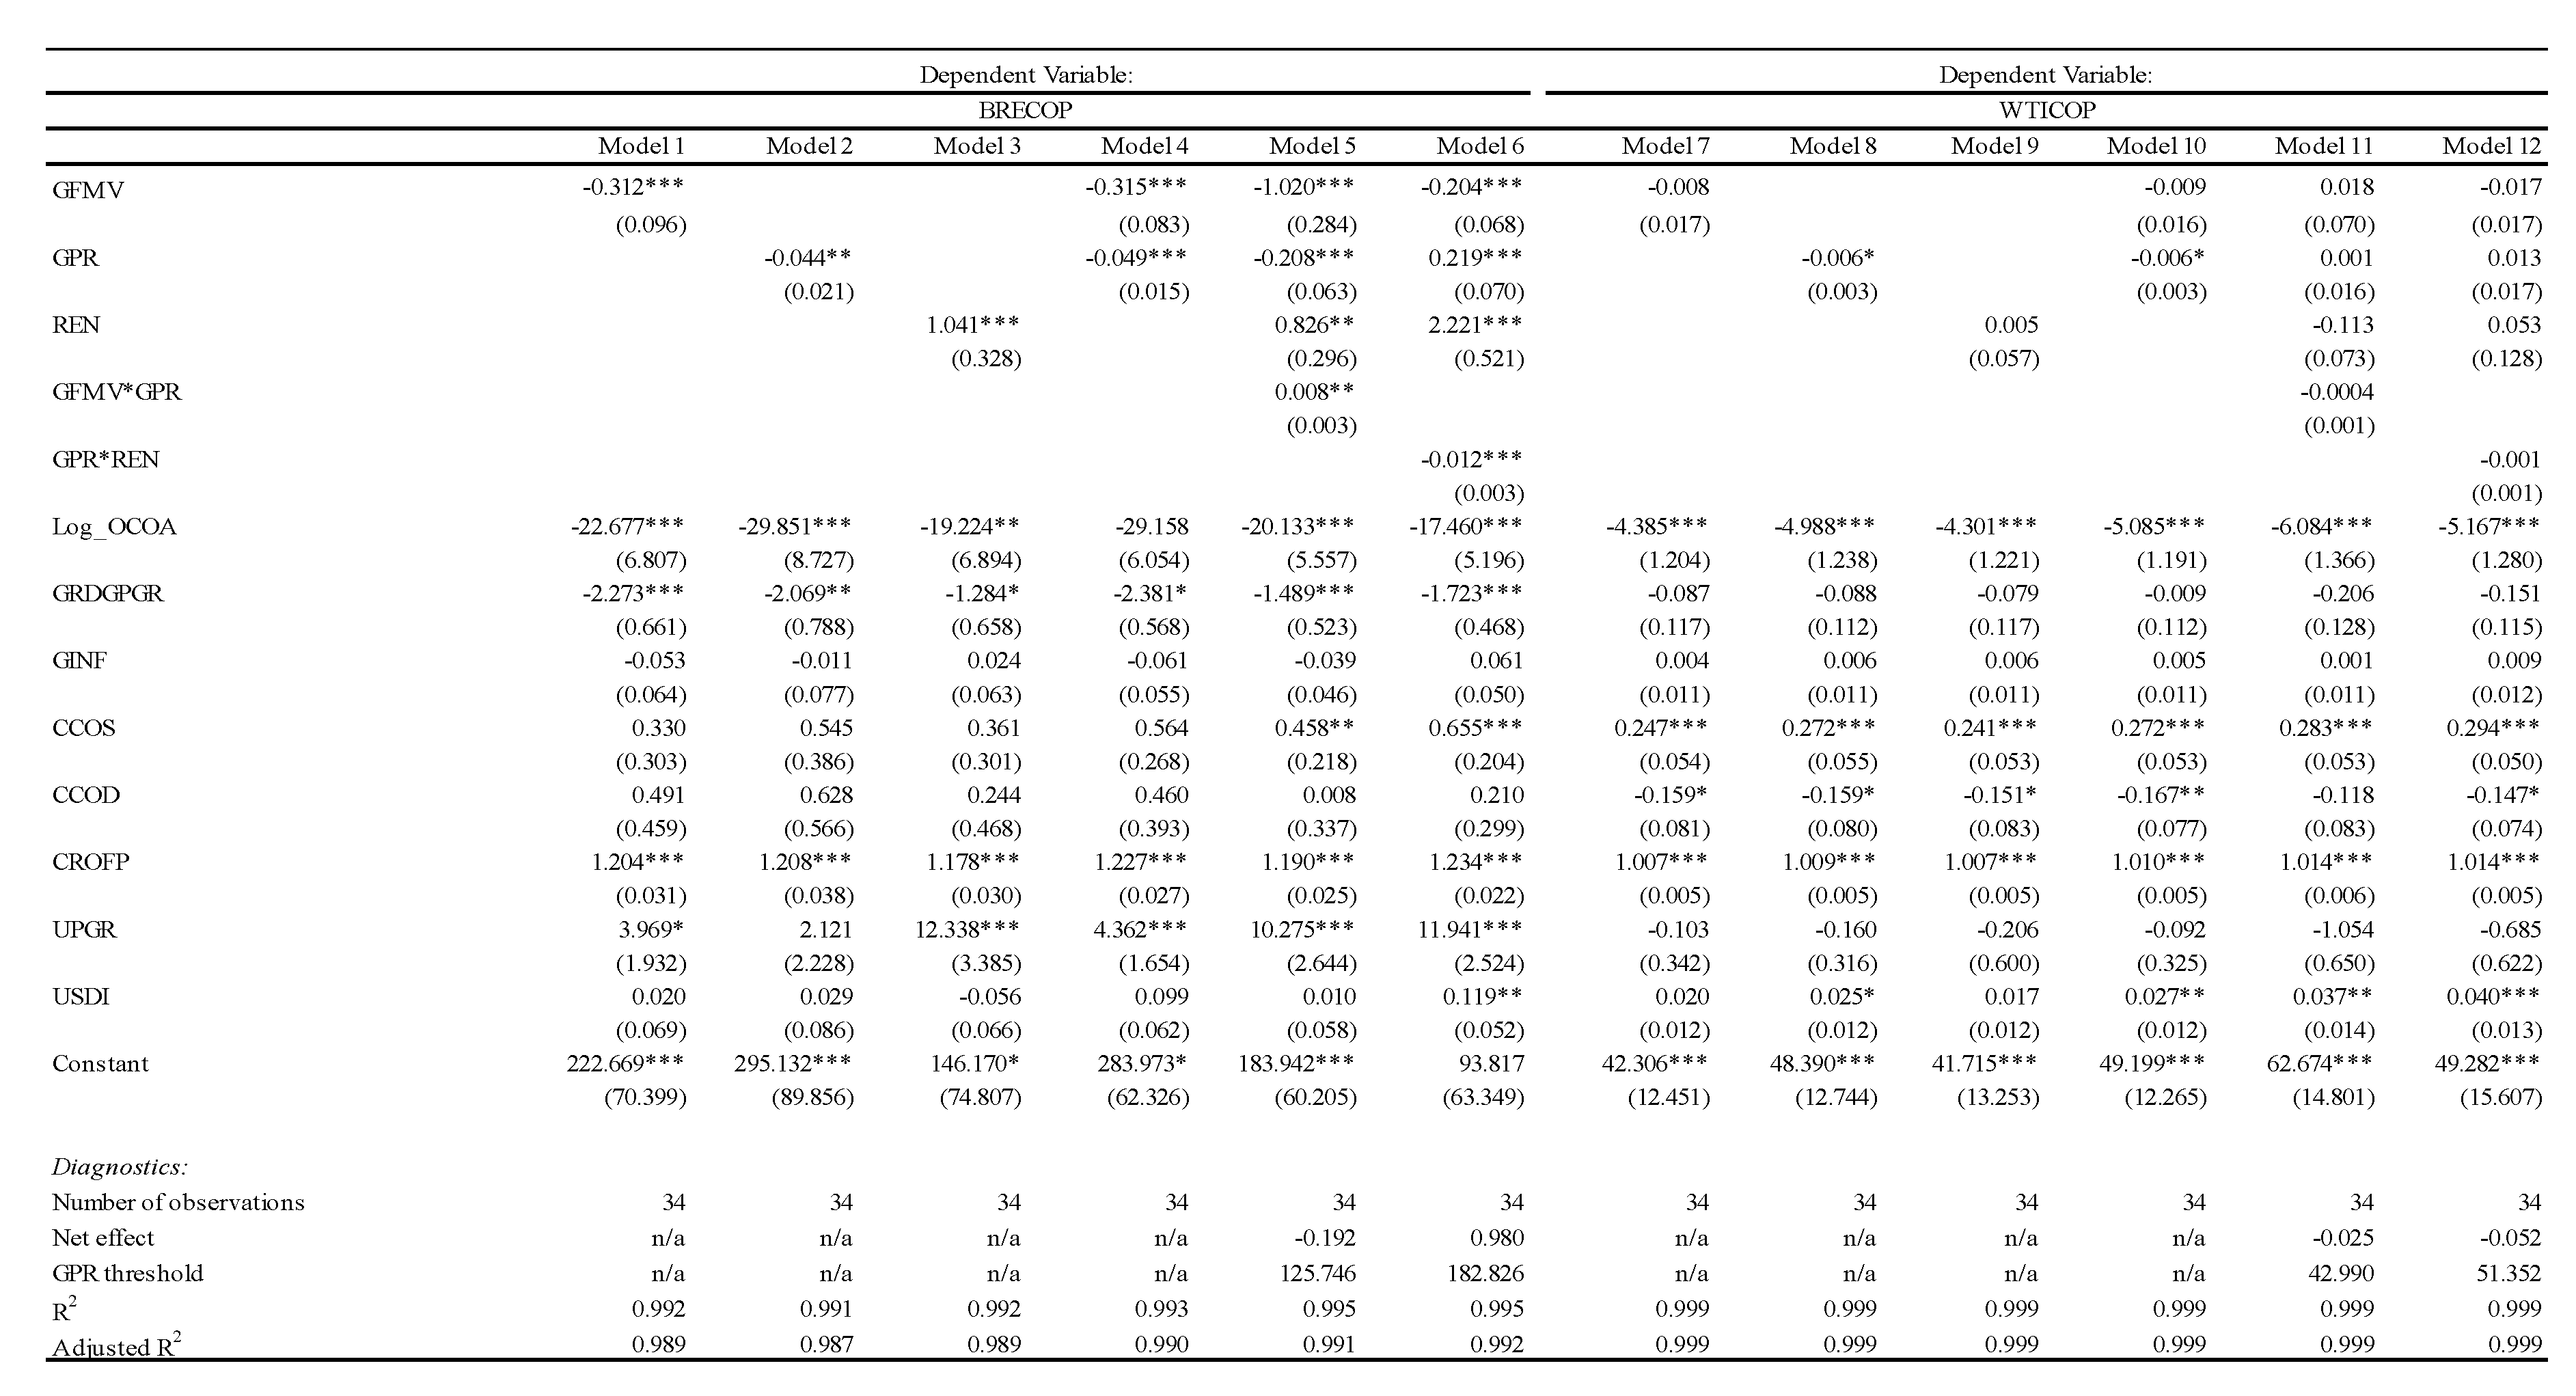
Source: Authors’ compilation (2026) with Stata 18. Note: Standard errors in parentheses; ***, **, * denote 1%; 5% significant levels respectively.
4.4. Discussion of the Findings
The results of this study show that global financial market volatility contributes to a reduction in Brent crude oil price in the short run and WTI crude oil price in the long run. This means that greater uncertainty in global financial markets leads to reduced Brent and WTI crude oil prices. This finding supports global financial cycle theory, in which crude oil prices respond to shifts in investor sentiment, speculative activity, and credit supply. A plausible reason could be relative global financial market stability, as indicated by the global financial market volatility index being below 20 on average, ensuring the availability of capital for increased investment in crude oil production and increased supply. Thus, the null hypothesis that volatility in global financial markets has no effect on the determination of crude oil prices is rejected, with the conclusion that global financial market volatility can significantly contribute to a reduction in crude oil prices, both in the short term and the long term. These findings are consistent with those of Le et al. (2025), but at variance with the findings by Tang and Xiong (2012), Antonakakis et al. (2018), and Bouri et al. (2023), who found that global financial market volatility corresponds with increased crude oil prices.
The direct effect of geopolitical risk on crude oil prices is negligibly positive on Brent and WTI crude oil prices in the short run. However, it has an insignificant reducing effect on WTI crude oil price in the long term, negating the geopolitical risk pricing theory. Thus, there is no strong evidence to reject the null hypothesis that geopolitical risk has no effect on crude oil prices, with the conclusion that global financial market volatility can significantly affect crude oil prices. This result is at odds with Caldara and Iacoviello (2022), who found that the uncertainty premium and market volatility channels were both significant contributors of geopolitical risk to oil prices. The findings also diverge from Bouri, Demirer, Gupta and Pierdzioch (2023), who conclude that geopolitical risk is an important determinant of oil price volatility, especially in times of greater uncertainty and extreme market conditions. The difference might be explained by methodological variations, as most previous research used high-frequency econometric methods that could account for short-term geopolitical events and asymmetric market reactions. Another contrast is the use of annual data in the present study within a linear ARDL framework, which may not adequately reflect the episodic and nonlinear nature of geopolitical transmission mechanisms in oil markets. The insignificant effect may have been due to the relatively low geopolitical risk levels before the recent Russia-Ukraine War, Israel’s military operations in Gaza, and the Iran-U.S. military confrontation, which continues to threaten the smooth operations in the Strait of Hormuz. The average GPR index for the study period is 102.12, whereas the current geopolitical events have increased the index to over 180.00, reflecting global supply chain disruption, elevated energy security risk, global financial fragility, and global macroeconomic vulnerability that these escalated geopolitical events pose. The theoretical and practical expectations are that elevated geopolitical risk should have an escalating effect on crude oil prices due to its ability to disrupt global crude oil supply.
Furthermore, the results suggest that the energy transition has a significant positive effect on Brent crude oil prices in the short run, but its positive effect on WTI crude oil prices is not strong in the long run, although it has a significant reducing effect on WTI crude oil prices in the interaction regression model. Thus, the null hypothesis that the energy transition has no effect on crude oil prices cannot be rejected. Hence, this result does not support the energy transition hypothesis, which predicts that a structural shift in energy sources toward renewable energy will reduce crude oil demand. However, this finding could reflect slow momentum in renewable energy investments, which has made it difficult to increase the proportion of renewable energy in the energy supply mix, with global economic activity still being driven largely by crude oil and other forms of fossil fuels. The share of renewable energy in the energy mix is, on average, around 21.66%, based on the estimated summary statistics. These findings diverge from those by Apergis and Payne (2020) and Sadorsky (2021).
Additionally, there is no strong evidence that geopolitical risk alters the effect of global financial market volatility and the energy transition on Brent and WTI crude oil prices in the short run. Similarly, geopolitical risk shows a weak ability to shift the effect of global financial market volatility from positive to negative, and the conditions for confirming the interaction effect are not met. However, there is enough statistical evidence that geopolitical risk can alter the effect of the energy transition on WTI crude oil prices from a reducing one to an increasing one, producing a geopolitical threshold of 133.05, the point at which it switches the effect of the energy transition from a reducing one to an increasing one. The result could be explained by the fact that increasing geopolitical risk hinders investments and technological transfers for renewable energy production, making reliance and dependence on crude oil inevitable, pushing up crude oil prices. Thus, the null hypothesis that geopolitical risk cannot significantly alter the effect of global financial market volatility on crude oil prices cannot be rejected. Nevertheless, the null hypothesis that geopolitical risk cannot significantly alter the effect of energy transition on crude oil prices is rejected. Nevertheless, the FMOLS estimates for WTI crude oil price align with the ARDL long-run estimates, although the FMOLS technique did not find a significant effect of the interaction between geopolitical risk and the energy transition, as the ARDL model did.
The study also reveals that OPEC crude oil allocation, global inflation, and the real GDP growth rate are significantly and negatively associated with WTI crude oil in the long run. These findings align with those of Kilian and Zhou (2022), who find that, in addition to traditional demand fundamentals, global economic activity growth, general price levels in the global economy, and OPEC production policies can influence crude oil prices. Conversely, changes in crude oil supply, crude oil futures prices, urban population growth rate, and the U.S. dollar index are positively associated with WTI crude oil price. However, changes in crude oil demand are weakly related to reductions in WTI crude oil price. Therefore, the classical supply-demand equilibrium framework is affirmed with respect to changes in crude oil supply. Notwithstanding, some of the results discussed above are sensitive to estimation techniques. These results are robust to the alternative estimation technique using the FMOLS.
5. Conclusion, Policy Implications, and Suggestions for Future Studies
5.1. Conclusion
This study examines the impact of global financial market volatility, geopolitical risk, the energy transition, and global macroeconomic and structural factors on crude oil prices. The ARDL Bounds integration test and estimation technique were used to analyze the 1990-2024 data, assembled from reliable sources. The ARDL Bounds test confirms a long-run cointegration relationship in WTI models, while indicating that only a short-run relationship exists in the Brent models. Therefore, the long-run results are discussed for WTI models, while the Brent model results and discussions are restricted to the short run only. The FMOLS technique was also used for sensitivity analysis.
The results showed that financial market volatility has a significant negative impact on Brent crude oil prices in the short term and on WTI crude oil prices in the long run, implying that global financial market volatility has a reducing effect on crude oil prices and affirming the global financial cycle theory. The study also found that geopolitical risk has a weak increasing effect on Brent and WTI crude oil prices in the short term, but an insignificant reducing effect on the WTI crude oil price in the long term, possibly due to the lower level of geopolitical risk before the recent Russia-Ukraine War and US-Iran military confrontation. This finding negates the geopolitical risk pricing theory. This is because elevated geopolitical risk is expected to have an escalating effect on crude oil prices due to its ability to disrupt global crude oil supply. The energy transition shows a significant positive short-term effect on Brent crude oil price and a weak long-term increasing effect in the linear regression model, but exhibits a hindering effect on WTI crude oil price in the long run in the interaction model. This finding suggests that energy transition investments have not been able to weaken fossil fuel consumption, negating the energy transition hypothesis. Furthermore, the interaction regression models show that geopolitical risk is weak in altering the effect of global financial market volatility on crude oil prices. However, strong evidence indicates that geopolitical risk can alter the effect of the energy transition on crude oil prices.
Regarding the control variables, factors such as OPEC crude oil allocation, global inflation, and the real GDP growth rate are significantly and negatively associated with WTI crude oil in the short run and in the long run. The negative association between these control variables and crude oil prices indicates that they have a reducing effect on crude oil prices. However, changes in crude oil supply, crude oil futures prices, urban population growth rate, and the U.S. dollar index are positively related to crude oil prices in the short run and in the long run, implying these variables can contribute to increases in crude oil prices. Many of these results are robust to, and less sensitive to, the FMOLS, the alternative estimation technique utilized in the study. Therefore, the significant effect of OPEC crude oil allocation and changes in crude oil supply on crude oil prices affirm the supply-demand equilibrium framework and cartel theory, which explain that crude oil production control and demand management can influence movements in crude oil prices.
5.2. Policy Implications
The results of the study have significant policy implications for governments, financial regulators, energy policymakers, oil exporting economies, and global investors. First, global financial market volatility is negatively correlated with crude oil prices due to relative market stability and reduced turbulence, as indicated by the average VIX. Therefore, more robust macroprudential regulation and financial market monitoring should be implemented to mitigate heavily disruptive speculative activities and prevent volatility in global commodity markets. Also, there is a need for effective communication of central bank policy orientation to the financial market to model monetary policy risks effectively. Second, global governance institutions should be strengthened to promote international peace and global stability, reduce the risk premiums associated with escalated geopolitical risk, and control risks related to global supply chain disruption, global inflation escalation, and global economic activity slowdown. Third, energy transition dynamics have significant policy implications, particularly for accelerating investment in renewable energy infrastructure, clean technologies, and sustainable energy systems while ensuring a gradual and stable transition with the least possible disruptions in energy markets to optimize crude oil prices. Fourth, oil-intensive economies must strengthen their economic diversification programs to reduce sensitivity to oil price shocks driven by global financial instability, exchange rate fluctuations, and long-term decarbonization pressures. Fifth, oil-exporting countries should continue to monitor global economic growth and inflation, assess their impact on energy market sustainability, and craft their macroeconomic management strategy. Sixth, OPEC should continue to reassess global oil demand to design its crude oil production strategy to support its oil-exporting members. Seventh, global financial market rules and regulations need to be strengthened to ensure that speculative trading through crude oil futures does not artificially distort oil prices in the energy market, as crude oil futures prices significantly influence both Brent and WTI crude oil prices in the short and long runs. Finally, oil-exporting countries should continue to monitor U.S. interest rates, strong economic growth, and macroeconomic stability for effective macroeconomic policy management. This is important because higher interest rates or monetary policy normalization in the U.S., stronger economic growth, and improved macroeconomic stability that strengthens the U.S. safe-haven status increase the value of the U.S. dollar against other major global currencies. A stronger U.S. dollar is inversely proportional to crude oil prices through investment reallocation to dollar-denominated assets by global investors who trade in currencies and commodities at the same time, and through the economic growth slowdown effect of a higher interest rate.
5.3. Limitations of the Study and Suggested Areas for Further Study
The limitation of this study is the use of annual time-series data, which may not fully capture high-frequency volatility and the rapid market reactions to geopolitical shocks and financial disturbances in the global oil market. A small sample size can also restrict the estimation of more complicated dynamic models and/or nonlinear relationships. Furthermore, the ARDL framework works best with linear relationships and may not capture asymmetric, regime-dependent, or structural break relationships involved in crude oil price behavior during times of crisis, war, pandemic, or major energy transition shifts. Moreover, the study largely emphasizes overall global metrics and might not capture regional variation in energy transition policies, geopolitical conflicts, or oil market configurations. Higher-frequency data (quarterly, monthly, or daily) are needed for some of the associated control variables in future studies to better capture short-run oil price volatility and geopolitical transmission effects. Future studies may utilize nonlinear econometric models, such as nonlinear ARDL, Markov switching models, quantile regression, and wavelet analysis, to explore asymmetric and regime-dependent relationships among financial market risk, geopolitical uncertainty, the energy transition, and crude oil prices. Further, empirical results on the effects of geopolitical risk and the energy transition are counterintuitive, probably due to the periods covered in the study. Therefore, future studies should re-examine these relationships for the expected confirmatory effect of geopolitical risk and the energy transition on crude oil prices, especially as the drive towards renewable energy investments intensifies.
Corresponding Author: Josua O. Oluwafemi Akinyemi is a PhD holder in Management (Corporate and International Finance) from the Pan-Atlantic University in Lagos, Nigeria. He graduated with a first-class Honors Degree in Accounting from the University of Lagos in 2005 and holds a master’s degree in accounting with distinction from the same university. He is a member of several local and international professional associations. He is a fellow of the Institute of Chartered Accountants of Nigeria (ICAN) and the Chartered Institute of Taxation of Nigeria (CITN). He is a CFA Charterholder with the CFA Institute in the USA and an Advanced Financial Modeler (AFM) holder with the Financial Modeling Institute in Canada. His research interests and focus comprise corporate finance, fiscal policy and public finance, development finance, accounting, and strategic management. He has published peer-reviewed research articles in several reputable journals. He is currently an alumnus of Pan-Atlantic University and the Group Financial Controller at Pan Ocean Newcross Group in Lagos, Nigeria. Festus Olatunbode Ashogbon is a faculty member and researcher at the Department of Economics, School of Social Sciences, Christopher University, Mowe, Nigeria. He holds a BSc in Economics from Ekiti State University (formerly Ondo State University), an MSc in Economics from the University of Lagos, and a PhD degree in Economics from Babcock University, Ilishan-Remo, Nigeria. He is a fellow of the Chartered Institute of Stockbrokers and served on the institute’s investigating panel for eight years. He previously worked with Mayfield Investments Limited, Dynamic Portfolios Limited, and Forthright Securities and Investments Limited, and retired after ten years, during which he served as managing director/chief executive for six years. His research specialties span econometrics, macroeconomics, microeconomics, development economics, capital markets, energy economics, and corporate finance. He has published several peer-reviewed articles and hosted hundreds of seminars on data analysis and interpretation using econometrics and statistical tools for master’s and doctoral candidates.
Funding
The author affirms that no funding was obtained for this study.
Data Availability Statement
The data used in this study are available on reasonable request. However, some of these data are available at https://osf.io/3bfu9/files/osfstorage.
Conflicts of Interest
The author does not have conflicts of interest to disclose.
Appendix I
Multicollinearity Test Results
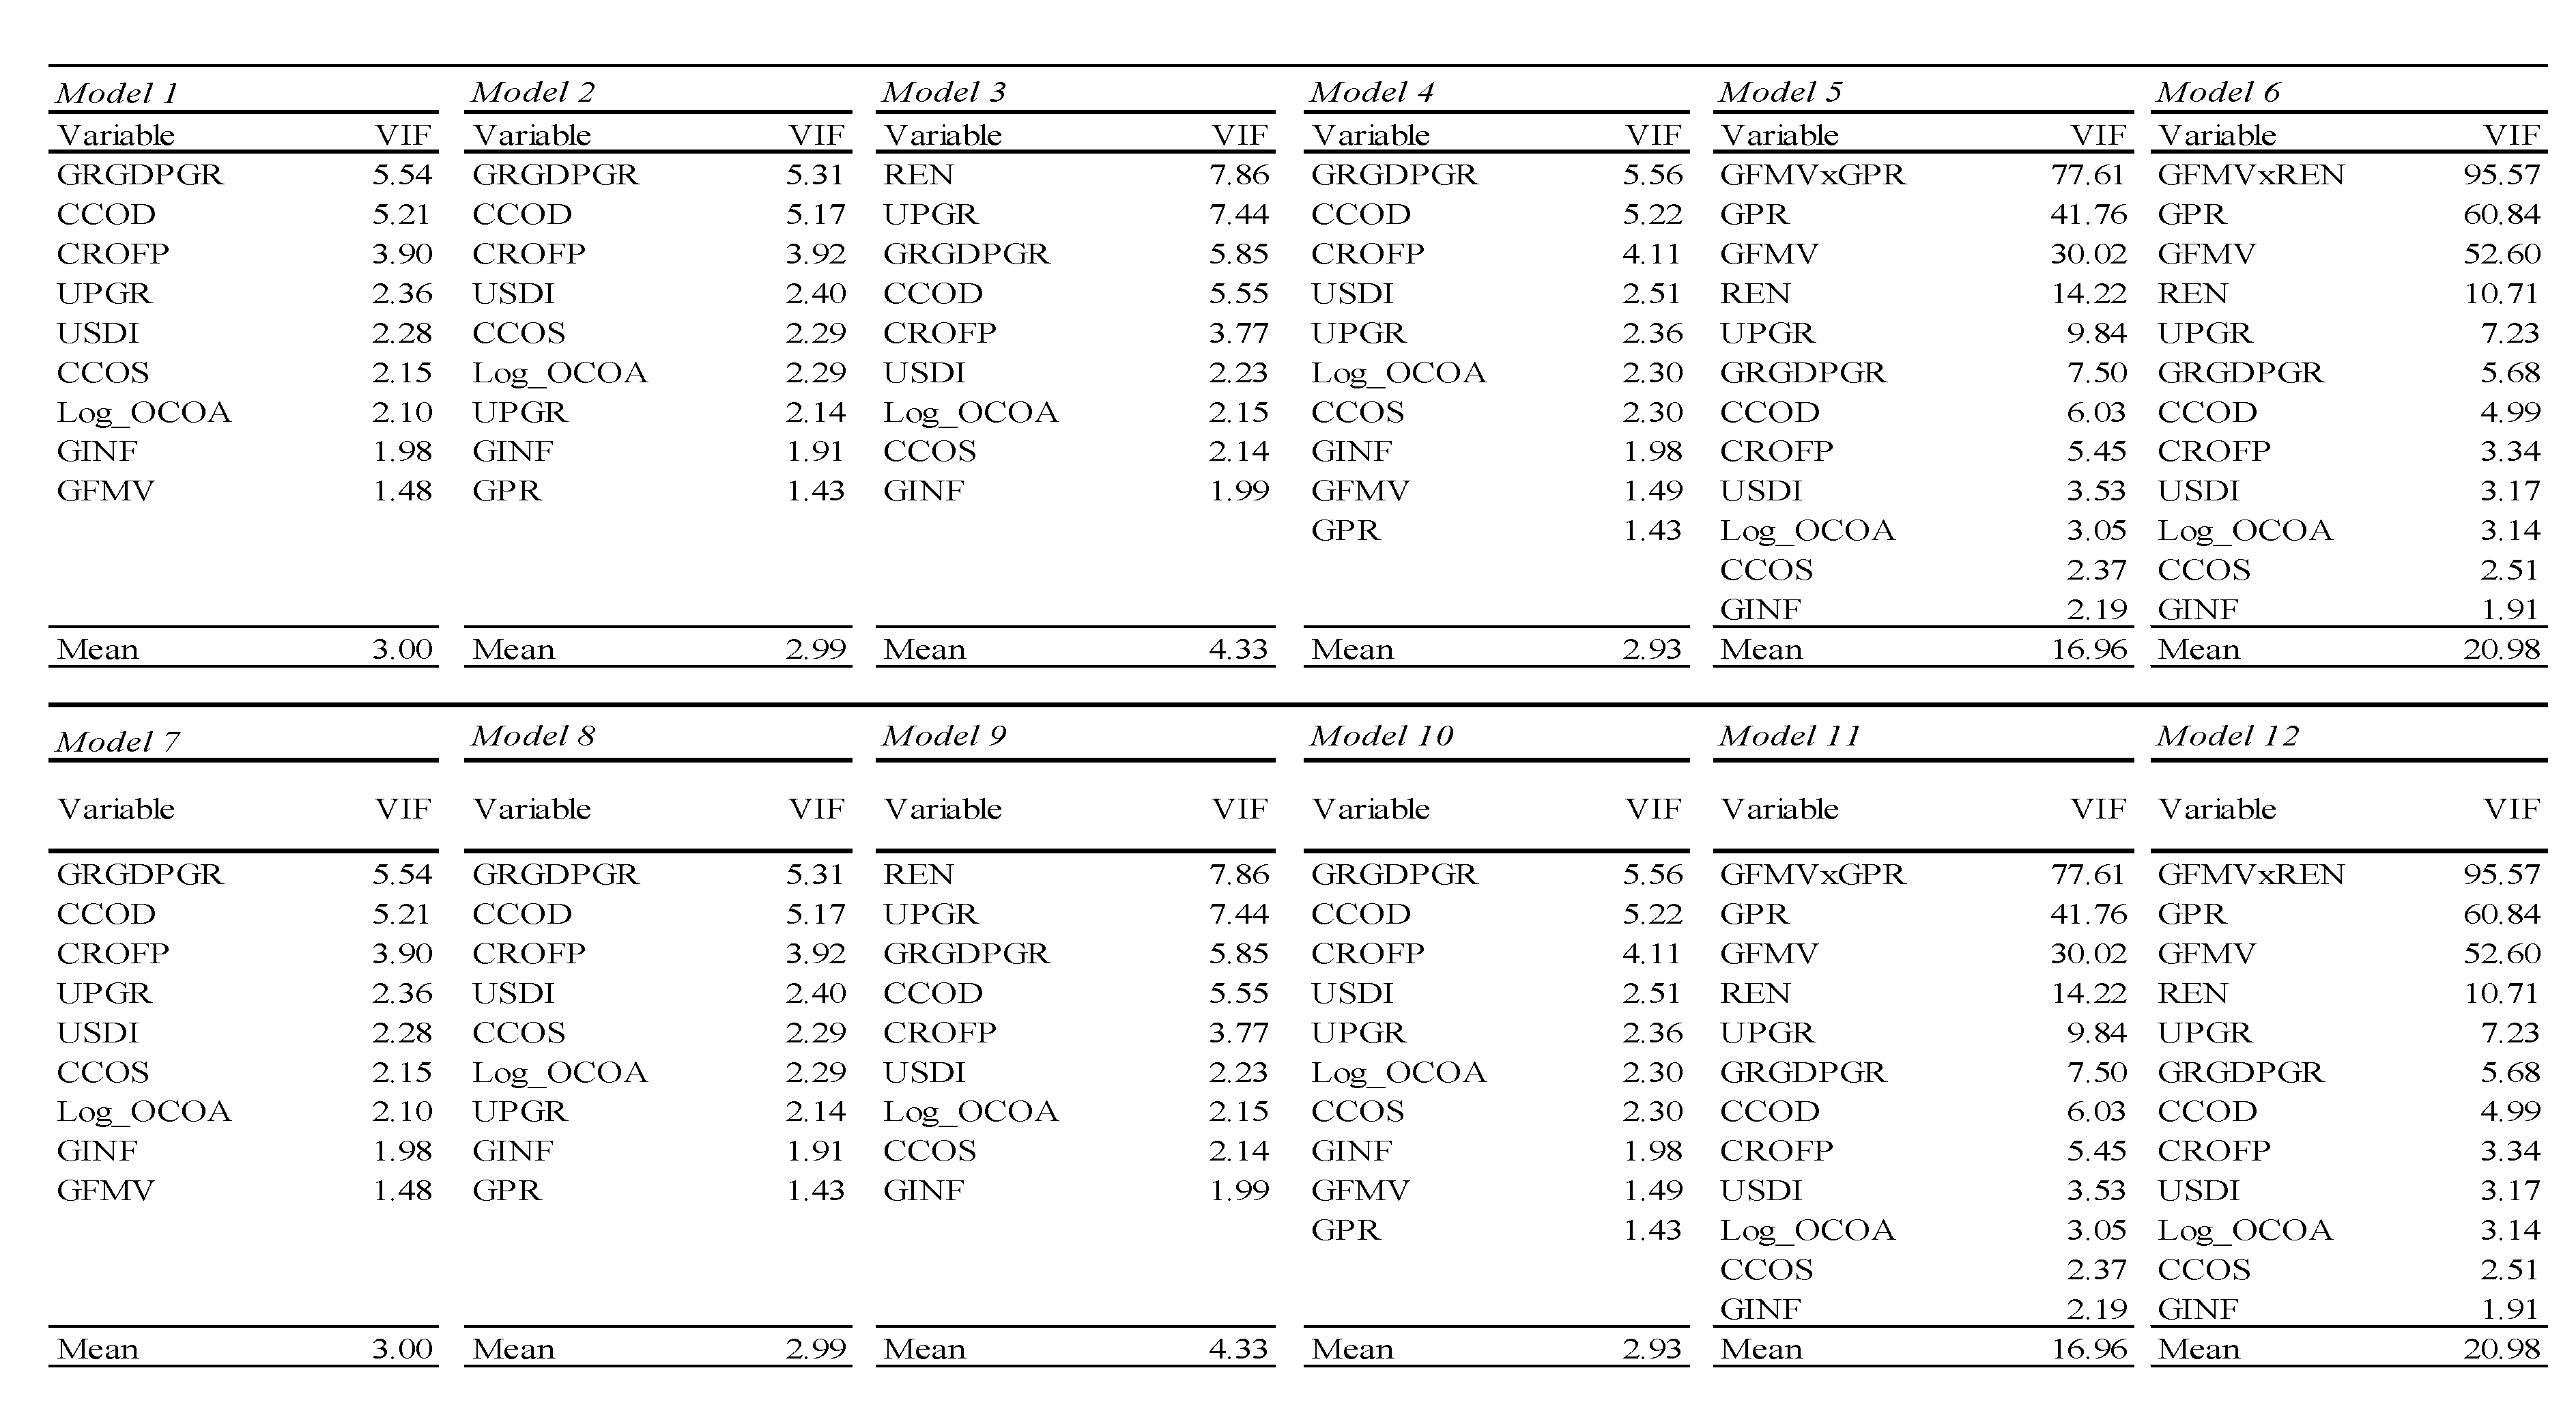
Source: Authors’ compilation (2026) with Stata 18.
Appendix II
ARDL Model Stability Graphs
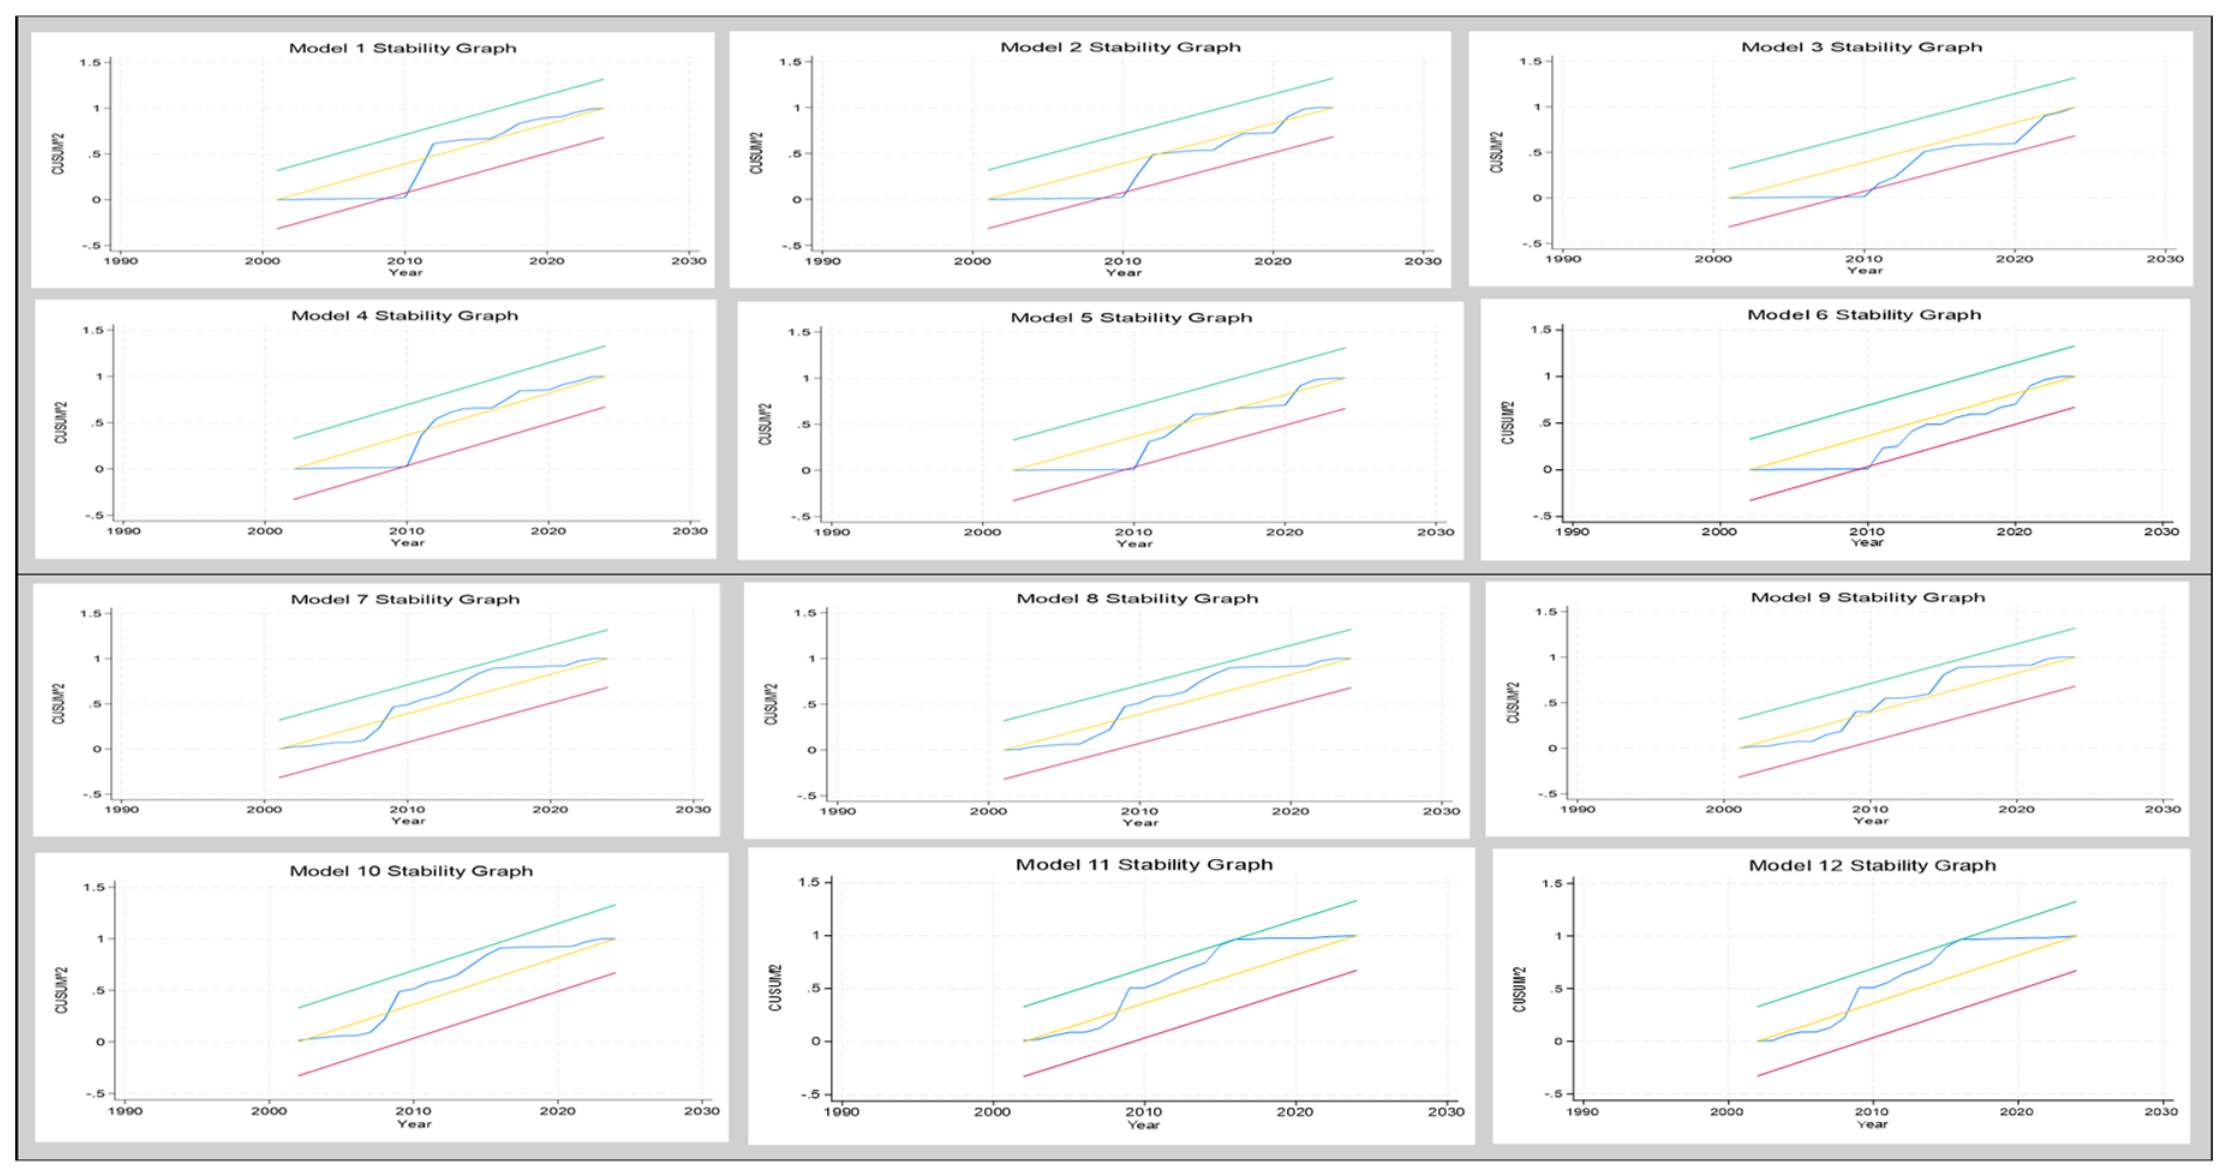
Source: Authors’ compilation (2026) with Stata 18.
References
- Akinyemi, J. O. O.; Owolabi, A. Modeling equity risk premium in emerging and developing economies: Do financial globalization and financial sector development have explanatory power? Cogent Econ. Financ. 2026, 14(1), 2602354. [Google Scholar] [CrossRef]
- Albaity, M.; Mustafa, H. International and macroeconomic determinants of oil price: Evidence from Gulf Cooperation Council Countries. Int. J. Energy Econ. Policy 2018, 8(1), 69–81. [Google Scholar]
- Ali, M.; Samour, A.; Soomro, S. A.; Khalid, W.; Tursoy, T. A step towards a sustainable environment in top-10 nuclear energy consumer countries: The role of financial globalization and nuclear energy. Nucl. Eng. Technol. 2025, 57(1), 103142. [Google Scholar] [CrossRef]
- Andreasen, E.; Valenzuela, P. Financial openness, domestic financial development and credit ratings. Financ. Res. Lett. 2016, 16, 11–18. [Google Scholar] [CrossRef]
- Antonakakis, N.; Chatziantoniou, I.; Filis, G. Oil price shocks and stock markets: Dynamic connectedness under the prism of recent geopolitical and economic unrest. Int. Rev. Financ. Anal. 50 2018, 1–26. [Google Scholar]
- Apergis, N.; Payne, J. E. Renewable energy and oil prices. Energy Econ. 86 2020, 104680. [Google Scholar]
- Arezki, R.; Fan, R. Y.; Nguyen, H. Oil prices and the global economy in the post-pandemic era. Energy Econ. 108 2022, 105908. [Google Scholar]
- Asongu, S. Sector formalization, gender inclusive Economics education and inequality in Chad. Int. J. Soc. Econ. 2025, 1–18. [Google Scholar] [CrossRef]
- Baker, S. R.; Bloom, N.; Davis, S. J.; Sammon, M. What triggers stock market jumps? J. Financ. Econ. 2021, 144(1), 1–35. [Google Scholar]
- Balcilar, M.; Gupta, R.; Wohar, M. E. Common cycles and common trends in the stock and oil markets: Evidence from more than 150 years of data. Energy Econ. 61 2017, 72–86. [Google Scholar] [CrossRef]
- Banerjee, A. K.; Sensoy, A.; Goodell, J. W. Volatility connectedness between geopolitical risk and financial markets: Insights from pandemic and military crisis periods. Int. Rev. Econ. Financ. 2024, 96, 103740. [Google Scholar] [CrossRef]
- Basak, S.; Pavlova, A. A model of financialization of commodities. J. Financ. 2016, 71(4), 1511–1556. [Google Scholar] [CrossRef]
- Bouri, E.; Demirer, R.; Gupta, R.; Pierdzioch, C. Geopolitical risks and oil prices: The role of economic uncertainty. Energy Econ. 117 2023, 106430. [Google Scholar]
- Bouri, E.; Gupta, R.; Tiwari, A. K.; Roubaud, D. Does geopolitical risks predict oil prices? Evidence from quantile-based approaches. Energy Econ. 95 2021, 105109. [Google Scholar]
- Box-Steffensmeier, J. M.; Freeman, J. R.; Hitt, M. P.; Pevehouse, J. C. W. Time Series Analysis for the Social Sciences, 1st ed.; Cambridge University Press, 2014. [Google Scholar] [CrossRef]
- Brambor, T.; Clark, W. R.; Golder, M. Understanding interaction models: Improving empirical analyses. Political Anal. 2006, 14(1), 63–82. [Google Scholar] [CrossRef]
- Breusch, T. S.; Pagan, A. R. A simple test for heteroskedasticity and random coefficient variation. Econometrica 1979, 47(5), 1287–1294. [Google Scholar] [CrossRef]
- Brooks, C. Introductory econometrics for finance, 4th ed.; Cambridge University Press, 2019. [Google Scholar]
- Byaro, M.; Mmbaga, N. F. What’s new in the drivers of electricity access in sub-Saharan Africa? Sci. Afr. 2022, 18, e01414. [Google Scholar] [CrossRef]
- Caldara, D.; Iacoviello, M. Measuring geopolitical risk. Am. Econ. Rev. 2022, 112(4), 1194–1225. [Google Scholar] [CrossRef]
- Chen, J.; Catalano, T. J.; Schmitt, K. R. Understanding the U.S. Dollar Index (USDX) andtradingtips. 2025. Available online: https://www.investopedia.com/terms/u/usdx.asp.
- Creswell, J. W.; Creswell, J. D. Research design: Qualitative, quantitative, and mixed methods approaches, 5th ed.; Sage Publications, 2018. [Google Scholar]
- Derbali, A. M. S. Dynamic Interdependence Between the Bond Market, Crude Oil Price, Geopolitical Instability and Financial Volatility. Rev. Bus. Econ. Stud. 2026, 14(2), 59–84. [Google Scholar] [CrossRef]
- Dickey, D. A.; Fuller, W. A. Distribution of the estimators for autoregressive time series with a unit root. J. Am. Stat. Assoc. 1979, 74(366), 427–431. [Google Scholar] [CrossRef]
- Dogan, E.; Majeed, M. T.; Luni, T. Analyzing the impacts of geopolitical risk and economic uncertainty on natural resources rents. Resour. Policy 2021, 72, 102056. [Google Scholar] [CrossRef]
- Drachal, K. Forecasting spot oil price in a dynamic model averaging framework—Have the determinants changed over time? Energy Econ. 2016, 60, 35–46. [Google Scholar] [CrossRef]
- Engle, R. F.; Granger, C. W. J. Cointegration and error correction: Representation, estimation, and testing. Econometrica 1987, 55(2), 251–276. [Google Scholar] [CrossRef]
- Eozenou, P. 2008. Financial integration and macroeconomic volatility: Does financial development matter? (MPRA Paper No. 12738). Available online: https://mpra.ub.uni-muenchen.de/12738/1/MPRA_paper_12738.pdf.
- Esmaeili, P.; Rafei, M.; Salari, M.; Balsalobre-Lorente, D. From oil surges to renewable shifts: Unveiling the dynamic impact of supply and demand shocks in global crude oil market on U.S. clean energy trends. Energy Policy 2024, 192, 114252. [Google Scholar] [CrossRef]
- Fuinhas, J. A.; Marques, A. C.; Lopes, C. The Impact of Financial Development and Globalisation on Economic Growth: Evidence from a Macro Panel of Ten Countries. Asian Econ. Financ. Rev. 2019, 9(3), 366–388. [Google Scholar] [CrossRef]
- Gkillas, K.; Manickavasagam, J.; Visalakshmi, S. Effects of fundamentals, geopolitical risk and expectations factors on crude oil prices. Resour. Policy 2022, 78, 102887. [Google Scholar] [CrossRef]
- Gu, Qinen; Li, Shaofang; Tian, Sihua; Wang, Yuyouting. Impact of climate risk on energy market risk spillover: Evidence from dynamic heterogeneous network analysis. In Energy Economics; Elsevier, 2024; vol. 137(C). [Google Scholar]
- Gujarati, D. N.; Porter, D. C. Basic econometrics, 5th ed.; McGraw-Hill Education, 2009. [Google Scholar]
- Hamilton, J. D. Causes and consequences of the oil shock. In Brookings Papers; 2009. [Google Scholar]
- Hamilton, J. D. Oil price shocks; NBER Working Paper No. 27011; 2020. [Google Scholar]
- Han, L.; Ning, D.; Xin, S. Geopolitical risk and economic growth: Evidence from ASEAN countries. Financ. Res. Lett. 2026, 88, 109102. [Google Scholar] [CrossRef]
- He, Z.-W.; Lee, C.-C.; Sharma, S. S. The impact of geopolitical risks on the renewable energy transition. Energy Econ. 2025, 143, 108278. [Google Scholar] [CrossRef]
- Hunjra, A. I.; Azam, M.; Verhoeven, P.; Taskin, D.; Dai, J. The impact of geopolitical risk, institutional governance and green finance on attaining net-zero carbon emission. J. Environ. Manag. 2024, 359, 120927. [Google Scholar] [CrossRef] [PubMed]
- IEA. World Energy Outlook 2023; International Energy Agency, 2023; Available online: https://www.iea.org/reports/world-energy-outlook-2023.
- IRENA, C.P.I. Global landscape of energy transition finance 2025; International Renewable Energy Agency, 2025; pp. 1–137. Available online: https://www.irena.org/Publications/2025/Nov/Global-landscape-of-energy-transition-finance-2025.
- Ketenci, N. 2009. The ARDL approach to cointegration analysis of tourism demand in Turkey: with Greece as the substitution destination (MPRA Paper No. 86602). Available online: https://mpra.ub.uni-muenchen.de/86602/1/MPRA_paper_86602.pdf.
- Khan, K.; Khurshid, A. Does Geopolitics Impede or Facilitate the Global Transition to Renewable Energy? In A Green Vision Towards a Renewable Energy Future; Oncel, S. S., Ed.; Springer Nature Switzerland, 2025; pp. 119–141. [Google Scholar] [CrossRef]
- Kilian, L. Oil Price Shocks: Causes and Consequences. Annu. Rev. Resour. Econ. 2014, 6(1), 133–154. [Google Scholar] [CrossRef]
- Kilian, L. Understanding the estimation of oil demand and oil supply elasticities. Energy Econ. 107 2022, 105844. [Google Scholar]
- Kilian, L.; Zhou, X. Oil prices, speculative trading, and commodity market dynamics. J. Appl. Econom. 2022, 37(3), 404–421. [Google Scholar]
- Kotcharin, S.; Maneenop, S. Geopolitical risk and shipping firms’ capital structure decisions in Belt and Road Initiative countries. Int. J. Logist. Res. Appl. 2020, 23(6), 544–560. [Google Scholar] [CrossRef]
- Kuepper, J.; Silberstein, S.; Petrick, B. Understanding the CBOE Volatility Index (VIX) in Investing. 2025. Available online: https://www.investopedia.com/terms/v/vix.asp.
- Le, M. T.; Le, H. M. H.; Nguyen, H. Q.; Pham, L. N. N. Geopolitical Risk, Economic Uncertainty, and Market Volatility Index Impact on Energy Price. 1st Int. Conf. Smart Manag. Ind. Logist. Eng. (SMILE 2025) 2025, 36. [Google Scholar] [CrossRef]
- Li, X.; Umar, M.; Zhu, C.-B.; Oprean-Stan, C. Can geopolitical risk stably predict crude oil prices? A multi-dimensional perspective. Resour. Policy 2023, 85, 103785. [Google Scholar] [CrossRef]
- Mbarek, B. N. Oil-Price Volatility and Renewable-Energy Transition in the Gulf Cooperation Council Countries: Does Financial Development Mitigate Energy Transition Risk? Energies 2026, 19(12), 2780. [Google Scholar] [CrossRef]
- Mukhtarov, S. Oil prices and the renewable energy transition: Empirical evidence from China. Util. Policy 2024, 91, 101840. [Google Scholar] [CrossRef]
- Nasreen, S.; Anwar, S. Financial stability and the role of economic and financial integration in South Asia: Evidence from time-series data. Singap. Econ. Rev. 2020, 65(02), 303–333. [Google Scholar] [CrossRef]
- Nchofoung, T.; Asongu, S.; S. Tchamyou, V. The political implication of women and industrialisation in Africa. SSRN Electron. J. 2021. [Google Scholar] [CrossRef]
- N’Goran, M. Measuring financial stability and comparing financial risk monitoring indicators. Int. Econ. 2026, 185, 100681. [Google Scholar] [CrossRef]
- Oyadeyi, O. O. Modelling economic policy uncertainty—Examining the effects of oil prices, global and domestic economic policy uncertainty on firm stability in Nigeria. Afr. Dev. Rev. 2025, 37(2), e70012. [Google Scholar] [CrossRef]
- Pesaran, M. H.; Shin, Y.; Smith, R. J. Bounds testing approaches to the analysis of level relationships. J. Appl. Econom. 2001, 16(3), 289–326. [Google Scholar] [CrossRef]
- Phillips, P. C. B.; Perron, P. Testing for a unit root in time series regression. Biometrika 1988, 75(2), 335–346. [Google Scholar] [CrossRef]
- Qian, L.; Zeng, Q.; Li, T. Geopolitical risk and oil price volatility: Evidence from Markov-switching model. Int. Rev. Econ. Financ. 2022, 81, 29–38. [Google Scholar] [CrossRef]
- Sadorsky, P. Renewable energy consumption, technological innovation, and oil prices. Energy Econ. 101 2021, 105411. [Google Scholar]
- Salem, B. L.; Nouira, R.; Jeguirim, K.; Rault, C. The determinants of crude oil prices: Evidence from ARDL and nonlinear ARDL approaches. Resour. Policy 2022, 79, 103085. [Google Scholar] [CrossRef]
- Sankaran, A.; Kumar, S.; K, A.; Das, M. Estimating the causal relationship between electricity consumption and industrial output: ARDL bounds and Toda-Yamamoto approaches for ten late industrialized countries. Heliyon 2019, 5(6), e01904. [Google Scholar] [CrossRef] [PubMed]
- Sanli, D.; Arslan, R. Testing convergence hypothesis for EU countries: A heterogenous panel data approach. J. Econ. Adm. Sci. 2025, 41(2), 635–657. [Google Scholar] [CrossRef]
- Shahzad, S. J. H.; Rehman, M. U.; Hurr, M.; Zakaria, M. Do Economic and Financial Development Increase Carbon Emission in Pakistan: Empirical Analysis through ARDL Cointegration and VECM Causality; Munich Personal RePEc Archive, 2014; pp. 1–24. Available online: https://mpra.ub.uni-muenchen.de/60310/.
- Smith, J. L. OPEC and the economics of oil supply. Energy J. 2020, 41(4), 1–22. [Google Scholar] [CrossRef]
- Su, X.; Razi, U.; Zhao, S.; Li, W.; Gu, X.; Yan, J. Geopolitical risk and energy markets in China. Int. Rev. Financ. Anal. 2025, 103, 104187. [Google Scholar] [CrossRef]
- Tang, K.; Xiong, W. Index investment and financialization of commodities. Financ. Anal. Journal. 2012. [Google Scholar] [CrossRef]
- Wang, S.; Wang, J.; Wang, W. Do geopolitical risks facilitate the global energy transition? Evidence from 39 countries in the world. Resour. Policy 2023, 85, 103952. [Google Scholar] [CrossRef]
- Wooldridge, J. M. Introductory econometrics: A modern approach, 7th ed.; Cengage Learning, 2020. [Google Scholar]
- Xu, J.; Liu, Q.; Wider, W.; Zhang, S.; Fauzi, M. A.; Jiang, L.; Udang, L. N.; An, Z. Research landscape of energy transition and green finance: A bibliometric analysis. Heliyon 2024, 10(3), e24783. [Google Scholar] [CrossRef] [PubMed]
- Yilmazkuday, H. International Spillover Effects of Geopolitical Risks on Economic Growth. SSRN Electron. J. 2024. [Google Scholar] [CrossRef]
- Zhang, Z.; Zhao, M.; Zhang, X.; Huang, Z.; Feng, Y. What is the causal relationship among geopolitical risk, financial development, and energy transition ? Evidence from 25 OECD countries. Int. Rev. Financ. Anal. 2025, 104, 104288. [Google Scholar] [CrossRef]
- Zheng, C.; Bhowmik, P. K.; Sarker, N. Industry-Specific and Macroeconomic Determinants of Non-Performing Loans: A Comparative Analysis of ARDL and VECM. Sustainability 2020, 12(1), 325. [Google Scholar] [CrossRef]
Figure 1.
Historical geopolitical risk index. Source: Caldara & Iacoviello (2022) from https://www.policyuncertainty.com/gpr.html.
Figure 1.
Historical geopolitical risk index. Source: Caldara & Iacoviello (2022) from https://www.policyuncertainty.com/gpr.html.
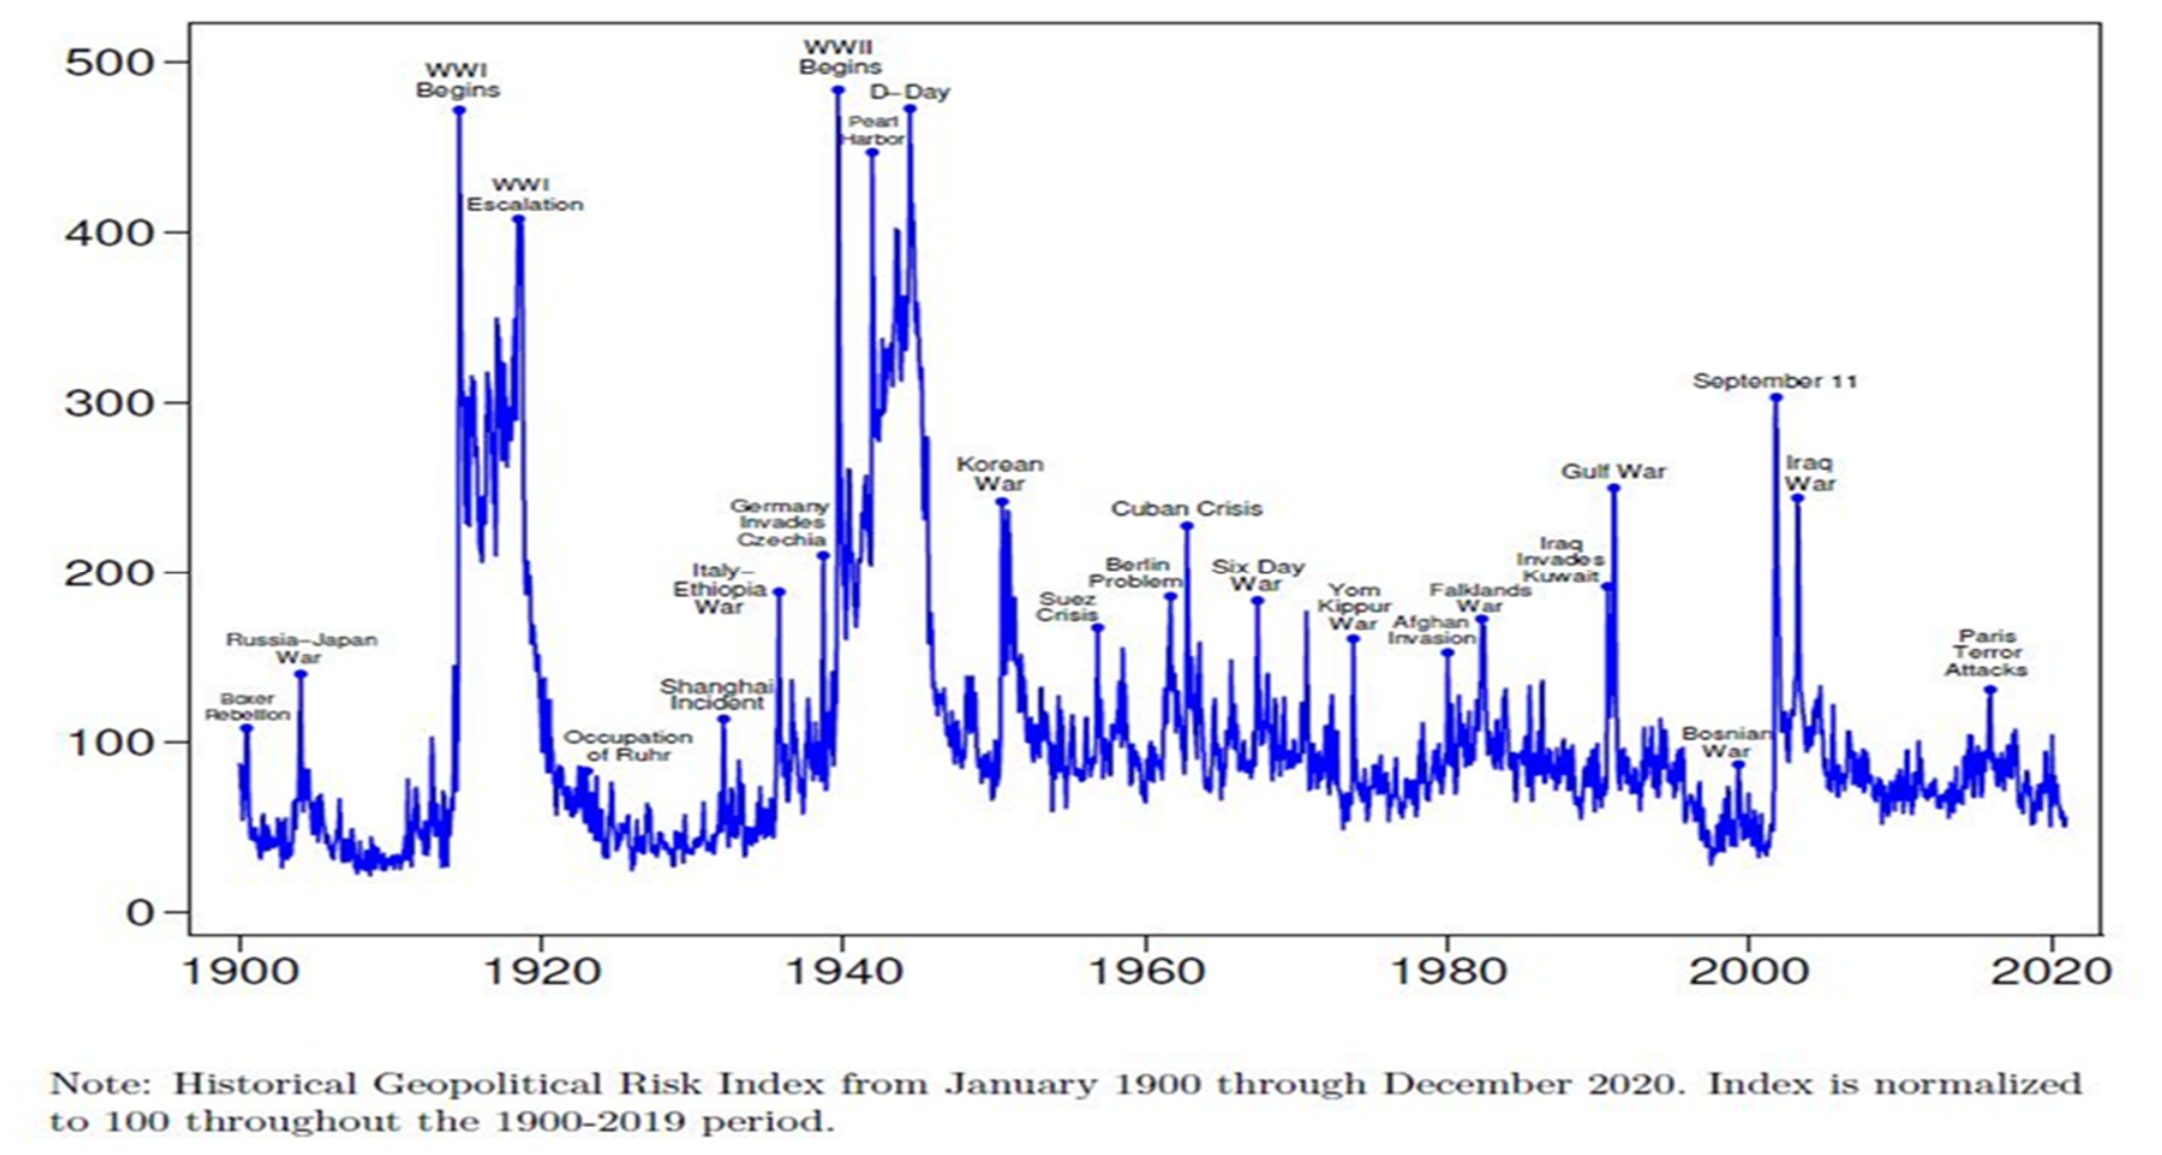
Figure 3.
Graphical representations of the relationship between crude oil price benchmarks and the main independent variables. Source: Author’s computation from Stata (2026).
Figure 3.
Graphical representations of the relationship between crude oil price benchmarks and the main independent variables. Source: Author’s computation from Stata (2026).
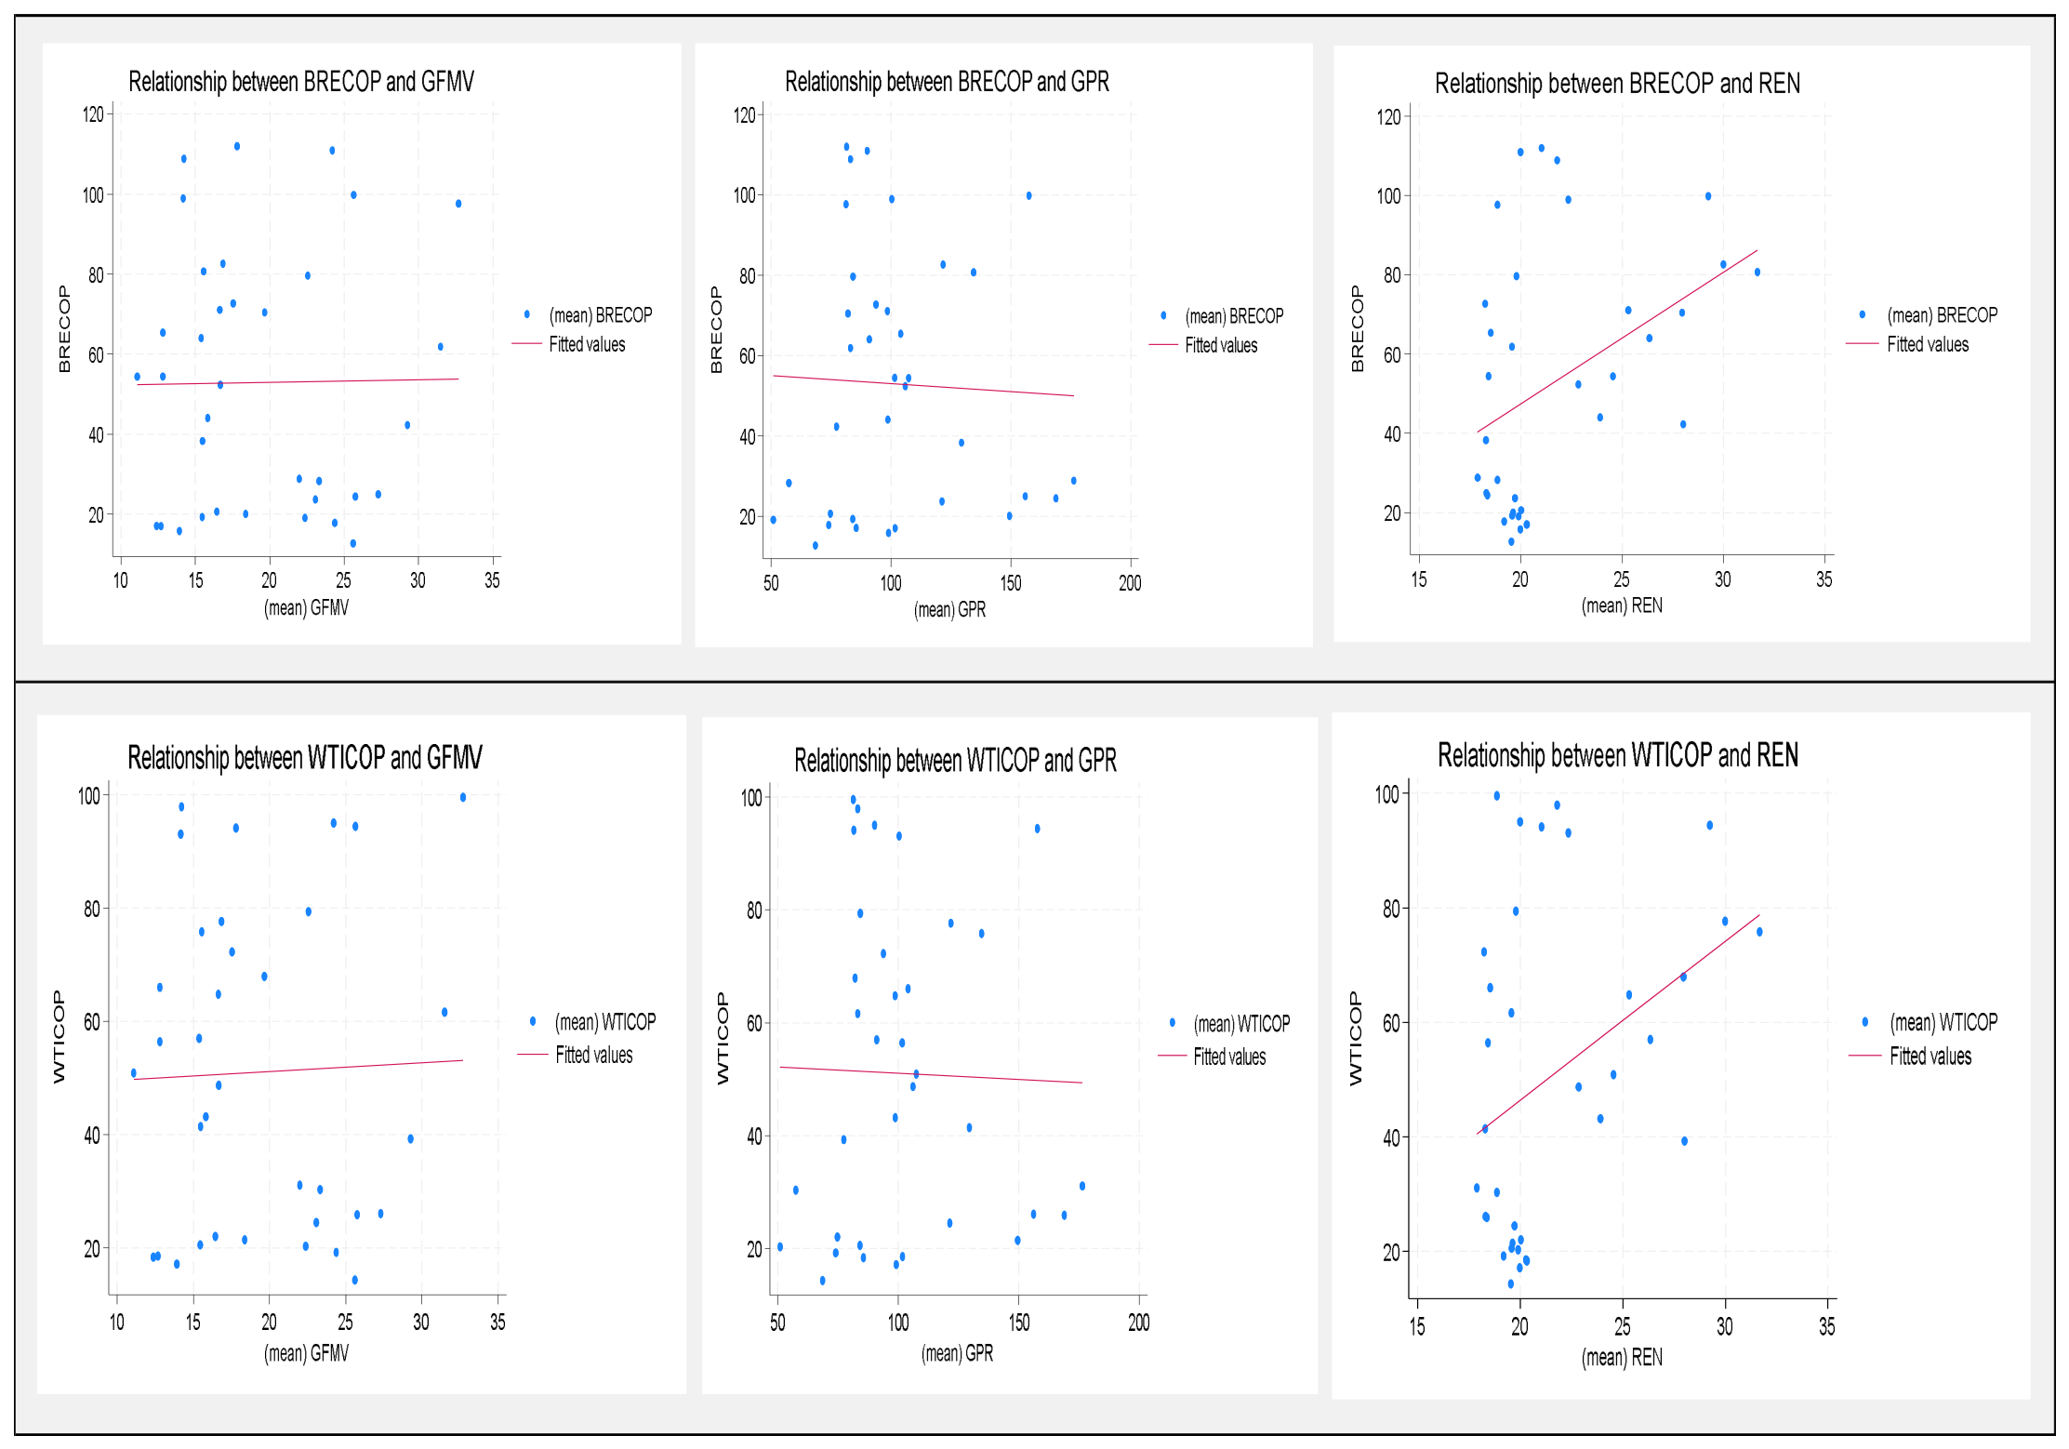
Table 1.
Summary of Variable Measurement and Data Sources.
| Variable | Variable | Description | Measurement | Expected Sign | Economic Rationale | Data Source | Justification |
| BRECOP | Brent crude oil price | Dependent variable | Brent crude oil price (US$/barrel) | — | Brent and WTI crude oil prices are globally recognized benchmark indicators widely used in energy economics and oil market studies to capture international crude oil price dynamics. | World Bank Commodity Price Data | Gkillas et al. (2022); Kilian & Zhou (2022); Oyadeyi (2025). |
| WTICOP | WTI crude oil price | Dependent variable | WTI crude oil price (US$/barrel) | — | Brent and WTI crude oil prices are globally recognized benchmark indicators widely used in energy economics and oil market studies to capture international crude oil price dynamics. |
World Bank Commodity Price Data | Drachal (2016); Kilian & Zhou (2022); Salem et al. (2022) |
| GFMV | Global financial market volatility | Global financial volatility | CBOE VIX | Negative | Financial market risk captures global market volatility and investor uncertainty, which significantly influence oil price movements through financialization and speculative trading channels. | Federal Reserve Bank of St. Louis | Antonakakis et al. (2018); Derbali (2026) |
| GPR | Geopolitical risk | Geopolitical uncertainty | Geopolitical Risk Index | Positive | Geopolitical tensions such as wars, sanctions, terrorism, and political instability often create uncertainty premiums and supply disruption concerns that increase oil prices. | Caldara & Iacoviello (2022) | Caldara & Iacoviello (2022); Gkillas (2016); Han et al. (2026) |
| ENT | Energy transition | Renewable energy penetration | Renewable energy share (%) | Negative | Increasing renewable energy adoption reduces long-term dependence on fossil fuels and weakens expectations for future crude oil demand, thereby exerting downward pressure on oil prices. | Enerdata | Hunjra et al. (2024); Mukhtarov (2024); Sadorsky (2021). |
| OCOA | OPEC crude oil allocation | Oil market supply condition | OPEC production quota/output | Positive | OPEC production decisions significantly influence global oil supply conditions and market pricing dynamics due to the organization’s strategic role in world oil markets. | OPEC | Smith (2020). |
| GRGDPGR | The global real GDP growth rate | Global economic activity | Annual GDP growth rate | Positive | Higher global economic growth increases industrial production, transportation demand, and overall energy consumption, thereby increasing crude oil demand and prices. | IMF | Dogan et al. (2021); Kilian & Zhou (2022) |
| GINF | Global inflation rate | Macroeconomic pressure | Global inflation rate | Ambiguous | Inflation may increase oil prices through rising production costs and commodity hedging demand, but high inflation may also weaken economic activity and reduce energy demand. | IMF | Hunjra et al. (2024); Mbarek (2026) |
| CCOD |
Change in crude oil demand |
Global oil demand | Annual percentage change in crude oil production |
Positive/ Negative | A reduction in oil demand due to negative revisions to global economic prospects can lead to a fall in oil prices, while an uptick in global economic prospects supports oil price increases. |
OPEC | Arezki et al. (2017) |
| CCOS |
Change in crude oil supply |
Global oil supply | Annual percentage change in crude oil supply |
Positive/ Negative | Oil supply disruptions due to armed conflict, global supply chain disruptions, or disruptions to maritime activity can increase oil prices, whereas new discoveries, improved production technologies, and increased supply by oil producers can lower oil prices. |
IEA | Arezki et al. (2017) |
| UPGR |
Urban population growth rate |
Social demographics | Annual percentage change in urban population | Positive | An increase in urban population leads to increased demand for electricity for manufacturing, commercial, and domestic uses | World Bank WDI | Byaro & Mmbaga (2022) |
| GOLP |
Gold price | Reserves asset | Price per ounce in U.S. $ | Positive | The prices of oil and gold tend to rise and fall together. | World Bank Commodity Price Data |
Salem et al. (2022) |
| CROFP |
Crude oil futures price | Crude oil trade speculation |
Oil futures price expressed in U.S.$ per barrel. |
Positive | Speculation in crude oil futures is a key driver of crude oil prices. | Investing.com | Kilian (2014); Salem et al. (2022) |
| USDI | U.S. dollar index | Dollar strength | U.S. dollar’s performance against a basket of six major global currencies | Negative | Since crude oil is denominated in U.S. dollars, dollar appreciation increases oil costs for non-dollar economies and may reduce global oil demand, thereby exerting downward pressure on prices | Investing.com | Kilian & Zhou (2022); Salem et al. (2022) |
Source: Author’s Computation (2026).
Table 4.
Summary of Unit Root Test Results.
| Level | 1st Difference | Order of Integration | |||
| Variables | ADF | PP | ADF | PP | |
| BRECOP | -2.241 | -2.281 | -5.294*** | -5.302*** | I(1) |
| WTICOP | -2.332 | -2.332 | -5.910*** | -6.035*** | I(1) |
| GFMV | -3.034 | -3.163* | -6.235*** | -6.278*** | I(1) |
| GPR | -3.159 | -3.203* | -7.343*** | -7.597*** | I(1) |
| REN | 1.126 | 1.266 | -5.964*** | -5.977*** | I(1) |
| Log_OCOA | -2.254 | -2.282 | -5.380*** | -5.383*** | I(1) |
| GRGDPGR | -5.955*** | -5.985*** | -9.156*** | -13.292*** | I(0) |
| GINF | -2.008 | -1.961 | -5.495*** | -5.495*** | I(1) |
| TRO | -2.034 | -1.749 | -6.437*** | -7.133*** | I(1) |
| CCOS | -5.024*** | -4.969*** | -7.004*** | -8.766*** | I(0) |
| CCOD | -7.078*** | -7.397*** | -10.569*** | -14.909*** | I(0) |
| GOLP | -1.114 | -1.465 | -3.004 | -2.775 | I(2) |
| CROFP | -2.211 | -2.227 | -5.674*** | -5.745*** | I(1) |
| UPGR | -2.836 | -2.731 | -10.200*** | -11.439*** | I(1) |
| USDI | -1.525 | -1.781 | -4.515*** | -4.438*** | I(1) |
Source: Authors’ compilation (2026) with Stata 18. Note: Standard errors in parentheses; ***, **, * denote 1%; 5% significant levels respectively.
Disclaimer/Publisher’s Note: The statements, opinions and data contained in all publications are solely those of the individual author(s) and contributor(s) and not of MDPI and/or the editor(s). MDPI and/or the editor(s) disclaim responsibility for any injury to people or property resulting from any ideas, methods, instructions or products referred to in the content. |
© 2026 by the authors. Licensee MDPI, Basel, Switzerland. This article is an open access article distributed under the terms and conditions of the Creative Commons Attribution (CC BY) license.
Copyright: This open access article is published under a Creative Commons CC BY 4.0 license, which permit the free download, distribution, and reuse, provided that the author and preprint are cited in any reuse.