

Submitted:
08 August 2026
Posted:
10 August 2026
You are already at the latest version
Abstract
Gastroesophageal reflux disease (GERD) is one of the most commonly diagnosed gastrointestinal disorders. Moreover, symptoms of GERD may be confused with symptoms of some cardiovascular diseases. This paper presents an analysis of cough sounds recorded from a volunteer who suffers from GERD. The samples were collected at five different occasions, during which the proband showed different severity of GERD symptoms. The samples are analysed using the following popular signal analysis methods: short-time Fourier transform, total harmonic distortion, Hilbert transform, power spectrum and continuous wavelet transform. The results show that differentiation between different symptom loads of GERD by the sound of cough alone is possible after an appropriate cough waveform transformation.
Keywords:
GERD
; wave pattern
; wave analysis
; reflux
1. Introduction to GERD and Cough Analysis
The rapid progress in medicine allows us to diagnose and treat diseases that were untreatable decades ago. An example of such a disease is gastroesophageal reflux disease (GERD), caused by regurgitation of stomach contents to the esophagus or to the oral cavity. The disease is triggered by weakening, excessive relaxation or congenital defect of the lower oesophageal sphincter [1]. Experts estimate that in the United States of America the prevalence of GERD can amount to 20% of the population (that makes roughly 60 million affected people in the USA alone) [24]. Main symptoms of GERD include frequent heartburn and regurgitation. Other symptoms may differ (depending on the patient) but the most common are: epigastric or chest pain, nausea, dry cough and wheezing, tooth erosions; GERD can sometimes cause asthma and laryngitis as well [24]. Furthermore, a single patient can experience different degrees of intensity of the symptoms, depending on, e.g., diet or medications used [2]. On top of that, chest pain and nausea are symptoms of both GERD and myocardial infarction (MI) [3]. Chest pain in MI can radiate into the upper abdomen, mimicking symptoms of heartburn [4]. Due to a different natural course of both diseases and the fact that MI is an acute, potentially life-threatening emergency requiring immediate specialist treatment, we wish to stress the importance of distinguishing MI from GERD. Diverse treatments for GERD are available, which involve change of lifestyle, medications (e.g., antacids, H2 blockers, proton pump inhibitors (PPIs), prokinetics, antibiotics) or surgery (fundoplication, endoscopic sewing and radiofrequency) [1].
There is currently no research on cough sound analysis in GERD, despite ongoing research on cough sound analysis in other diseases. Most studies related to the analysis of cough sound apply to asthma, pneumonia and other respiratory diseases [5,6,7,14,15] or touch the topic of cough sound differentiation [16,17]. Noteworthy studies about GERD have been performed by M. Lachowska et al. [18]. Their research presents a comparison of voice quality in patients with GERD-related dysphonia or chronic cough. No significant differences in cough between patients suffering from dysphonia and chronic cough are reported, although GERD caused significant voice disorders in both groups. Other studies about GERD performed by Rosen et al. [19] addressed the comparison of cough detection methods for intra-oesophageal pressure recording (IEPR) and acoustic cough recording (ACR). Both methods proved to be evenly sensitive, nonetheless ACR having an advantage of being a non-invasive method. Sensitivity of ACR relative to IEPR is 93%. Analysis of human cough sounds inspired the development of similar research in case of animals [20]. Following the above-mentioned papers, this manuscript presents novel research on cough sound analysis focused on patients suffering from GERD.
Human cough sound is a non-stationary signal, which is generally analysed using time-frequency methods. Therefore, we use the following methods: short-time Fourier transform (STFT), total harmonic distortion (THD), Hilbert transform (HT), power spectrum (PS) and continuous wavelet transform (CWT). CWT has already been used to analyse cough sounds [5,6,7]. STFT is the basis for the analysis of the signals in cases of differentiating between cough sound and speech and yields 100% of sensitivity and 95% specificity [8]. PS analysis made possible differentiating sounds of voluntary cough before and after methacholine inhalation [9]. HT achieves an average detection rate of ECG signals of 99.87% [10]. Moreover, THD is used in the analysis of signals in power systems [11,12,13].
2. Materials and Methods
2.1. Data Acquisition
Cough sounds used in this analysis come from a volunteer suffering from GERD (one of the Authors). The volunteer has been officially diagnosed with GERD. Recorded samples were collected through ACR (acoustic cough recording, a non-invasive procedure) at five stages of disease. Each time the data was collected the patient communicated different degrees of symptoms intensity rating: ranging from total lack of symptoms to highly intensified symptoms. In order to quantify the degree of symptomatology the volunteer was asked to fill in the GERD-HRQL questionnaire [25] each time when the recording was taken. A single 4.5 s cough sound representing each stage of symptoms was then selected from the recordings. Figure 1 presents unmodified waveform recordings.
2.2. Short-Time Fourier Transform
The discrete Fourier transform (DFT) assumes that all signals can be represented by a weighted sum of sines and cosines. A signal is converted from its original domain into a proper representation in the frequency domain. STFT computes the DFT from a sequence. The main advantage of STFT over DFT is reduced complexity of computing through dividing the signal into shorter segments of equal length. Throughout the study we tested four different time parameters for STFT and decided to use the Hamming window with a length of 0.1125 s and hop value of 0.05625 s.
2.3. Total Harmonic Distortion
THD is used as a measure to characterize the linearity of an amplifier. THD value represents the ratio of the sum of powers of all harmonic components to the power of the fundamental frequency. We use the following formula to calculate THD:
where hn is the value of the n-th harmonic.
Distortion factor (DF) represents the percentage value of THD. Formula for calculating the value of DF is as follows:
𝐷𝐹 = 𝑇𝐻𝐷 × 100%.
Only the first six harmonics are taken into account in this study, since the higher order harmonics have a negligible influence on the value of THD.
2.4. Hilbert Transform
HT is used to extend a signal into the complex plane, in such a way that it meets the Cauchy-Riemann equations. The imaginary part of the transformed signal is a version of the original signal with a 90° phase shift. To perform HT for a signal u(t) we use Eq. 3. The transformed signal has the same amplitude and frequency as the original signal, yet also includes phase information, which depends on the real signal phase.
2.5. Power Spectrum
Power of a signal represents the signal’s energy per unit of time. As a result of the power spectrum (PS), the distribution of the square of fast Fourier transform magnitude values as a function of frequency is obtained. It is often used to compute which frequencies contain the signal’s power. In the paper we use the integral of the PS function calculated through the trapezoidal rule and Simpson’s rule.
2.6. Continuous Wavelet Transforms
Continuous wavelet transforms (CWT) is used to analyse changes of frequency content of a function over time and can characterize singularities in signal analysis. The wavelet analysis is similar to STFT analysis, but instead of the window function, the signal is multiplied with a wavelet. A function of two variables, which are called wavelet coefficients, is obtained during a comparison of the original signal and the wavelet considered. The comparison is performed for various values of scale and position of the wavelet.
Different wavelet families can be selected depending on features of a signal. The most commonly used families of wavelets include: Daubechies, Biorthogonal, Coiflet, Gaussian and Symlet. Examples from the families of wavelets are presented in Figure 2. We test the following wavelets in the paper: Biorthogonal 3.5, Complex Gaussian 8, Complex Morlet 1, Coiflet 3, Daubechies 3, Discrete Meyer, Frequency B-Spline 2-0.5-1, Gaussian 8, Haar, Mexican hat, Meyer, Morlet, Reverse Biorthogonal 1.5, Shannon 1 and Symlet 4. We use CWT with the level of decomposition of 1024, because until around the 300th the wavelet coefficients were not stable.
We use two measures to compare different wavelets. The first measure calculates the average value of the sum of wavelet coefficients for all decomposition levels. The second measure is based on counting the dispersion of wavelets representing the recordings in which GERD symptoms occurred with wavelets representing lack of symptoms. Dispersion is measured for decomposition level of 1024. The measuring methods used are summarized in Figure 3 and Figure 4.
Matlab software was used to calculate the CWT.
3. Results and Discussion
The study is divided into five parts, each for all analysis methods considered. In the first part, we test the STFT. STFT representation of the signals is presented in Figure 5. An observable difference in frequency bands occurs for the recording with lack of symptoms and recordings with symptoms. In the recording with lack of symptoms the frequency amplitude does not exceed 1.6 MHz, where in recordings with symptoms it ranges from 7 MHz to 9 MHz. Another significant difference can be observed in the construction of the signals. Lack of symptoms’ signal is characterized with low frequency and higher frequency peaks. Other signals are more homogeneous. The disadvantage of this method is the inability to distinguish between the severity of symptoms. Only the difference between the lack of symptoms and the presence of symptoms can be observed.
The results of DF analysis are as follows: 5.3495% for lack of symptoms, 0.7909% for minor symptoms, 0.4524% for medium symptoms, 0.7474% for severe symptoms and 0.7956% for highly intensified symptoms. As in STFT, the difference between lack of symptoms and cases with symptoms is visible. DF value for the lack of symptoms is higher than for the others. The lowest DF value is obtained for medium symptoms. Values for minor symptoms, severe symptoms and highly intensified symptoms are similar. Results of applying the HT on the recordings are presented in Figure 6. There is a significant difference between lack of symptoms and cases with symptoms. Amplitudes of the signals transformed are more than two times higher than in the original signals. Results of PS integration are presented in Table 1. Both methods used to calculate the integral yield similar results. The result obtained for the lack of symptoms is about four times smaller than for the others. Except for the highly intensified symptoms, a gradual increase in the PS value between successive stages of symptoms is visible. In the preliminary research we used the measures above mentioned to select wavelets best suited for the task. The results of both measures are shown in Table 2 and Table 3. The best results are achieved using the Daubechies 3 and Reverse Biorthogonal 1.5 wavelets, and thus those wavelets are used onwards.Sums of wavelet coefficients for the Daubechies 3 and Reverse Biorthogonal 1.5 wavelets are depicted in Figure 7. An increase in the sum of wavelet coefficients with an increase in severity of symptoms of GERD is visible for almost all wavelets tested. Sums of wavelet coefficients are distributed evenly for all cases.
4. Summary, Conclusions, Future Directions
The paper presents a novel approach to cough sound analysis for people who suffer from gastroesophageal reflux disease. We analyse cough sound indicating a range of symptoms. To decide whether there is any visible differentiation between intensity of the symptoms we use the following methods: short-time Fourier transform, total harmonic distortion, Hilbert transform, power spectrum and continuous wavelet transform. All methods tested allow for a distinction of recordings representing lack of symptoms from recordings representing symptoms of GERD. Furthermore, the continuous wavelet transform allows us to distinguish between the severity of the symptoms. The assessment of severity of GERD symptoms is subjective. Factors, such as current mood, may affect the assessment of symptoms by a patient. Nonetheless, the results show a visible differentiation of the sounds analysed and suggest an approach for automated assessment of GERD symptoms through cough analysis.
Funding
This research received no external funding.
Author contributions
Conceptualization – K.M. Data curation – K.M., G.R., A.P. Formal analysis & Investigation Methodology K.M., G.R. Project administration G.R., M.C.; Resources, Software & Supervision K.M., A.P., Validation – K.M., A.P., Visualization – A.P., Writing – original draft K.M., A.P., G.R., M.C.; Writing – review and editing G.R., M.C. All Authors have read and approved the published version of the manuscript.
Institutional Review Board Statement
not applicable
Informed Consent Statement
the Author-volunteer signed an explicit written consent form for participation in this study where the right of obtaining and analysing cough samples was granted. The consent form can be provided on demand.
Data availability statement
Basic data generated during working on the manuscript are available within it. Other data can be provided on demand. In order to obtain them, please contact grzegorz.redlarski@pg.edu.pl
Use of Artificial Intelligence
The Authors declare that no artificial intelligence was used to generate or prepare this manuscript.
Conflicts of Interest
The Authors declare no conflicts of interests.
List of Abbreviations
| GERD | Gastro-Esophageal Reflux Disease |
| PPI | Proton Pump Inhibitor |
| MI | Myocardial Infarction |
| IEPR | Intra-Esophageal Pressure Recording |
| ACR | Acoustic Cough Recording |
| STFT | Short-Time Fourier Transform |
| THD | Total Harmonic Distortion |
| HT | Hilbert Transform |
| PS | Power Spectrum |
| CWT | Continuous Wavelet Transformation |
| GERD-HRQL | Gastroesophageal Reflux Disease Health-Related Quality of Life |
| DFT | Discrete Fourier Transform |
| DF | Distortion Factor |
| ECG | Electrocardiography |
References
- National Institute of Diabetes and Digestive and Kidney Diseases. Gastroesophageal reflux (GER) and gastroesophageal reflux disease (GERD) in adults. Natl. Dig. Dis. Inf. Clear. 2013. [Google Scholar] [CrossRef]
- Armstrong, D. Gastroesophageal reflux disease. Curr. Opin. Pharmacol. 2005, vol. 5(no. 6), 589–595. [Google Scholar] [CrossRef] [PubMed]
- Jaffe, S. Third Universal Definition of Myocardial Infarction. Clin. Biochem. 2013, vol. 46(no. 1–2), 1–4. [Google Scholar] [CrossRef] [PubMed]
- Van De Werf, F.; Bax, J.; Betriu, A.; Blomstrom-Lundqvist, C.; Crea, F.; Falk, V.; Filippatos, G.; Fox, K.; Huber, K.; Kastrati, A.; Rosengren, A.; Steg, P. G.; Tubaro, M.; Verheugt, F.; Weidinger, F.; Weis, M.; Vahanian, A.; Camm, J.; De Caterina, R.; Dean, V.; Dickstein, K.; Funck-Brentano, C.; Hellemans, I.; Kristensen, S. D.; McGregor, K.; Sechtem, U.; Silber, S.; Tendera, M.; Widimsky, P.; Zamorano, J. L.; Aguirre, F. V.; Al-Attar, N.; Alegria, E.; Andreotti, F.; Benzer, W.; Breithardt, O.; Danchin, N.; Di Mario, C.; Dudek, D.; Gulba, D.; Halvorsen, S.; Kaufmann, P.; Kornowski, R.; Lip, G. Y. H.; Rutten, F. Management of acute myocardial infarction in patients presenting with persistent ST-segment elevation. Eur. Heart J. 2008, vol. 29(no. 23), 2909–2945. [Google Scholar] [CrossRef] [PubMed]
- Kosasih, K.; Abeyratne, U. R.; Swarnkar, V. High Frequency Analysis of Cough Sounds in Pediatric Patients with Respiratory Diseases; 2012; pp. 5654–5657. [Google Scholar]
- Kosasih, K.; Abeyratne, U. R.; Swarnkar, V.; Triasih, R. Wavelet Augmented Cough Analysis for Rapid Childhood Pneumonia Diagnosis. IEEE Trans. Biomed. Eng. 2015, vol. 62(no. 4), 1185–1194. [Google Scholar] [CrossRef] [PubMed]
- Knocikova, J.; Korpas, J.; Vrabec, M.; Javorka, M. Wavelet analysis of voluntary cough sound in patients with respiratory diseases. J. Physiol. Pharmacol. 2008, vol. 59, no. SUPPL. 6, 331–340. [Google Scholar]
- Martinek, J.; Tatar, M.; Javorka, M. Distinction between voluntary cough sound and Speech in volunteers by spectral and complexity analysis. J. Physiol. Pharmacol. 2008, vol. 59, no. SUPPL. 6, 433–440. [Google Scholar]
- Thorpe, W.; Kurver, M.; King, G.; Salome, C. “Acoustic analysis of cough,”. ANZIIS 2001-Proc. 7th Aust. New Zeal. Intell. Inf. Syst. Conf. 2001, no. November, 391–394. [Google Scholar] [CrossRef]
- Benitez, D.; Gaydecki, P. a.; Zaidi, a.; Fitzpatrick, a. P. The use of the Hilbert transform in ECG signal analysis. Comput. Biol. Med. 2001, vol. 31(no. 5), 399–406. [Google Scholar] [CrossRef] [PubMed]
- Tan, M. T.; Chang, J. S.; Chua, H. C.; Gwee, B. H. An Investigation into the Parameters Affecting Total Harmonic Distortion in Low-Voltage Low-Power Class-D Amplifiers. IEEE Trans. Circuits Syst. I Fundam. Theory Appl. 2003, vol. 50(no. 10), 1304–1315. [Google Scholar] [CrossRef]
- Sansen, W. Distortion in elementary transistor circuits. IEEE Trans. Circuits Syst. II Analog Digit. Signal Process. 1999, vol. 46(no. 3), 315–325. [Google Scholar] [CrossRef] [PubMed]
- Aiello, M.; Cataliotti, A.; Favuzza, S.; Graditi, G. Theoretical and experimental comparison of total harmonic distortion factors for the evaluation of harmonic and interharmonic pollution of grid- connected photovoltaic systems. IEEE Trans. Power Deliv. 2006, vol. 21(no. 3), 1390–1397. [Google Scholar] [CrossRef]
- Al-Khassaweneh, M.; Bani Abdelrahman, R. A signal processing approach for the diagnosis of asthma from cough sounds. J. Med. Eng. Technol. 2013, vol. 37(no. 3), 165–71. [Google Scholar] [CrossRef] [PubMed]
- Abeyratne, U. R.; Swarnkar, V.; Setyati, A.; Triasih, R. Cough sound analysis can rapidly diagnose childhood pneumonia. Ann. Biomed. Eng. 2013, vol. 41(no. 11), 2448–2462. [Google Scholar] [CrossRef] [PubMed]
- Walke, S. A.; Thool, V. R. Differentiating Nature of Cough Sounds in Time Domain Analysis. [CrossRef]
- International Conference on Industrial Instrumentation and Control (ICIC). 2015; pp. 1022–1026.
- Chatrzarrin, H.; Arcelus, A.; Goubran, R.; Knoefel, F. Feature extraction for the differentiation of dry and wet cough sounds. MeMeA 2011 - 2011 IEEE Int. Symp. Med. Meas. Appl. Proc., 2011. [Google Scholar]
- Domeracka-Kołodziej; Grabczak, E. M.; Dąbrowska, M.; Arcimowicz, M.; Lachowska, M.; Osuch- Wójcikiewicz, E.; Niemczyk, K. Comparison of voice quality in patients with GERD-related dysphonia or chronic cough. Otolaryngol. Pol. 2013, vol. 8, 1–7. [Google Scholar]
- Rosen, R.; Amirault, J.; Heinz, N.; Litman, H.; Khatwa, U. The sensitivity of acoustic cough recording relative to intraesophageal pressure recording and patient report during reflux testing. Neurogastroenterol. Motil. 2014, vol. 26(no. 11), 1635–1641. [Google Scholar] [CrossRef] [PubMed]
- Ferrari, S.; Silva, M.; Guarino, M.; Aerts, J. M.; Berckmans, D. Cough sound analysis to identify respiratory infection in pigs. Comput. Electron. Agric. 2008, vol. 64(no. 2), 318–325. [Google Scholar] [CrossRef]
- Jones, E.; Oliphant, T.; Peterson, P.; Others. “SciPy: Open-source scientific tools for Python,” 2001. Available online: http://www.scipy.org. (accessed on 04-Aug-2016).
- van der Walt, G.; Colbert, Stefan; Chris, S.; Varoquaux. The NumPy Array: A Structure for Efficient Numerical Computation. Comput. Sci. Eng. 2011, vol. 13, 22–30. [Google Scholar] [CrossRef]
- Hunter, J. D. Matplotlib: A 2D graphics environment. Comput. Sci. Eng. 2007, vol. 9(no. 3), 99–104. [Google Scholar] [CrossRef]
- Shaqran, Tariq M; et al. Epidemiology, Causes, and Management of Gastro-esophageal Reflux Disease: A Systematic Review. Cureus 2023, vol. 15, 10 e47420. [Google Scholar] [CrossRef]
- Velanovich, V. The development of the GERD-HRQL symptom severity instrument. Dis. Esophagus 2007, 20(2), 130–134. [Google Scholar] [CrossRef] [PubMed]
Figure 1.
Examples of original waveforms of cough sounds, each representing one of five states. a: Lack of symptoms. b: Minor symptoms. c: Medium symptoms. d: Severe symptoms. e: Highly intensified symptoms.
Figure 1.
Examples of original waveforms of cough sounds, each representing one of five states. a: Lack of symptoms. b: Minor symptoms. c: Medium symptoms. d: Severe symptoms. e: Highly intensified symptoms.
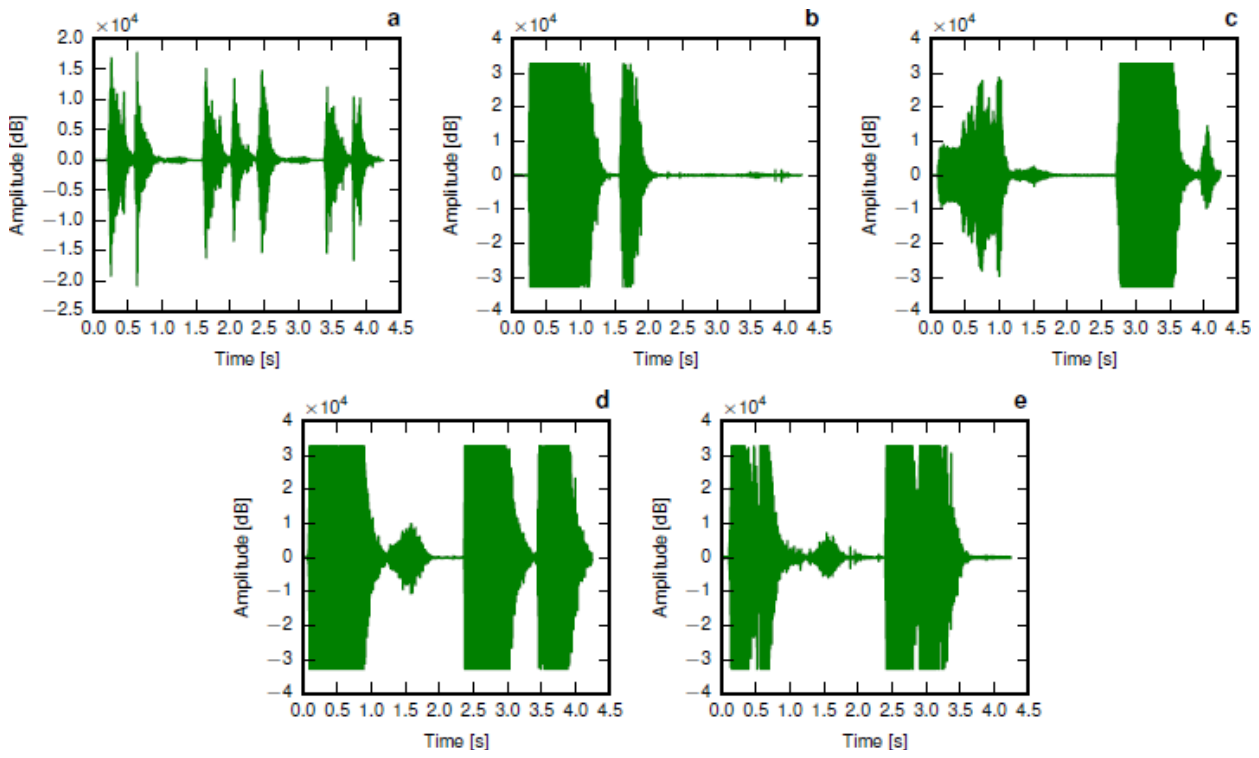
Figure 2.
Representatives of selected wavelet families. a: Biorthogonal 3.5. b: Coiflet 3. c: Complex Morlet 1. d: Daubechies 3. e: Complex Gaussian 8. f: Symlet 4.
Figure 2.
Representatives of selected wavelet families. a: Biorthogonal 3.5. b: Coiflet 3. c: Complex Morlet 1. d: Daubechies 3. e: Complex Gaussian 8. f: Symlet 4.
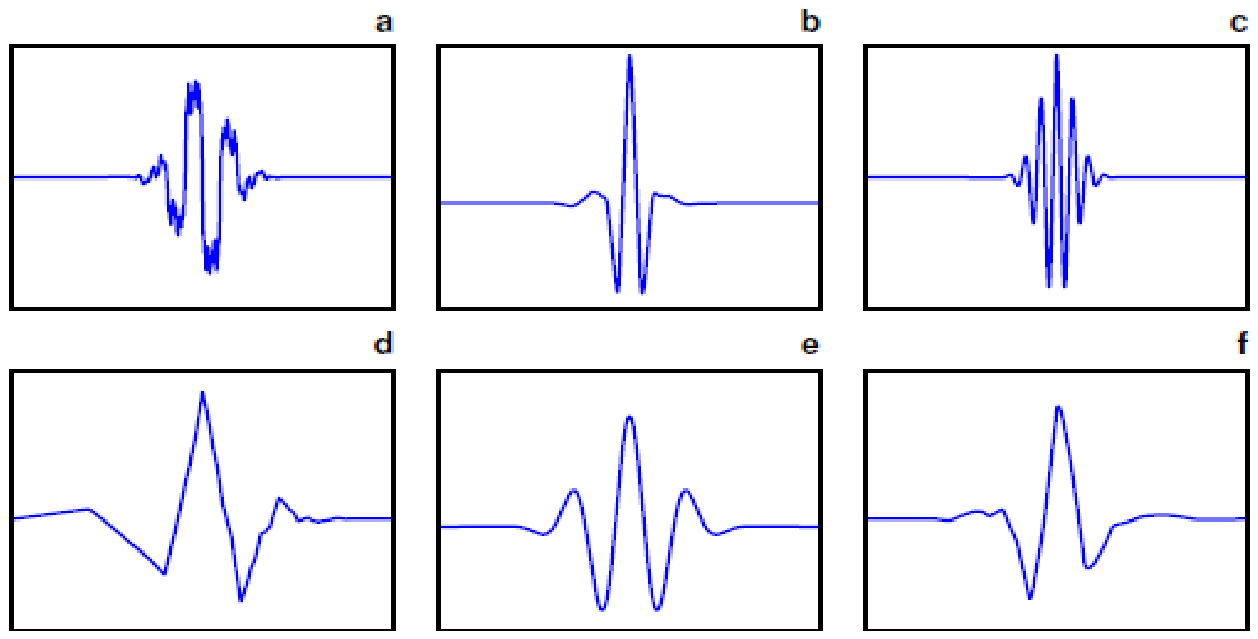
Figure 3.
Calculation of average values of sums of wavelet coefficients for all health states considered. a: Sum of wavelet coefficients for all decomposition levels. b: Mean values calculated from the sums of wavelet coefficients.
Figure 3.
Calculation of average values of sums of wavelet coefficients for all health states considered. a: Sum of wavelet coefficients for all decomposition levels. b: Mean values calculated from the sums of wavelet coefficients.
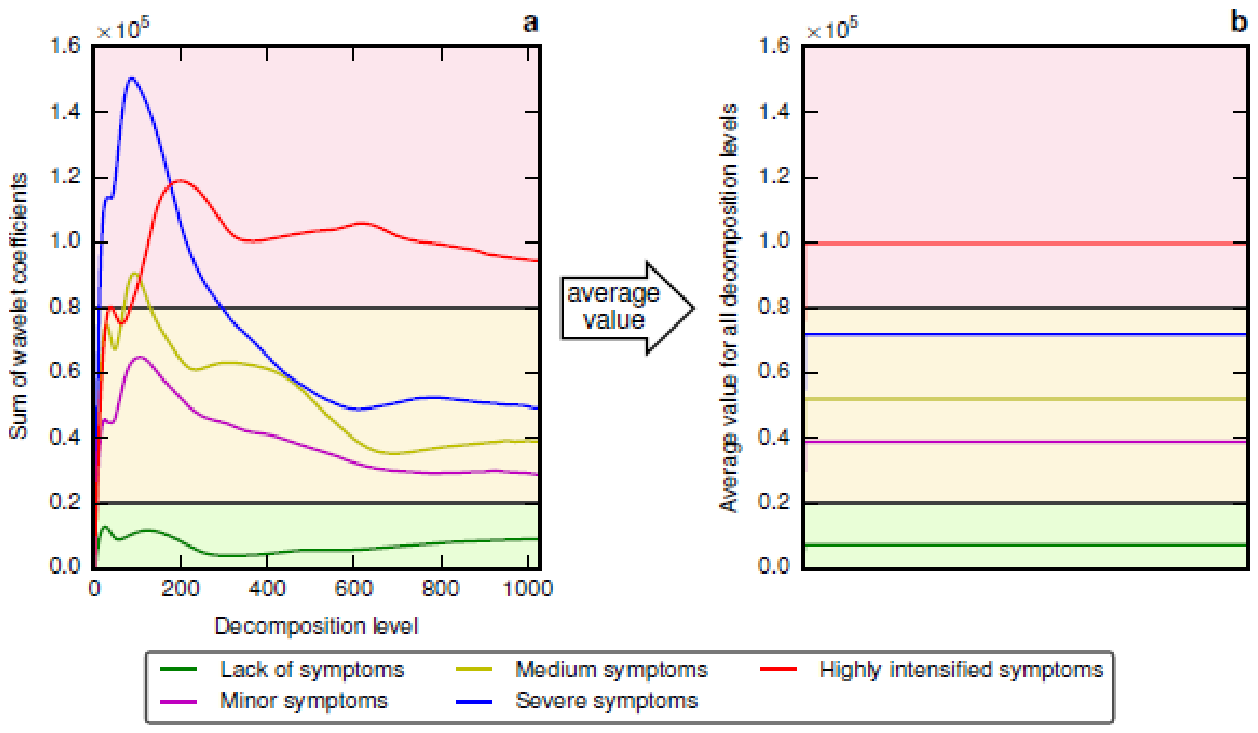
Figure 4.
Calculation of intervals between the wavelet coefficients measures the lack of symptoms and all the other representatives of states considered.
Figure 4.
Calculation of intervals between the wavelet coefficients measures the lack of symptoms and all the other representatives of states considered.
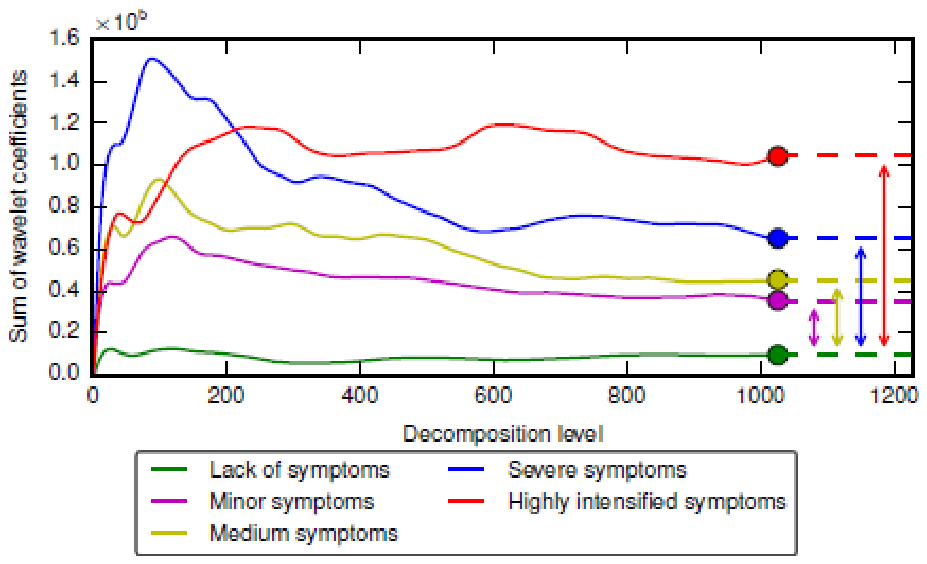
Figure 5.
Examples of short-time Fourier transformations of given cough waveforms for all states considered. a: Lack of symptoms. b: Minor symptoms. c: Medium symptoms. d: Severe symptoms. e: Highly intensified symptoms.
Figure 5.
Examples of short-time Fourier transformations of given cough waveforms for all states considered. a: Lack of symptoms. b: Minor symptoms. c: Medium symptoms. d: Severe symptoms. e: Highly intensified symptoms.
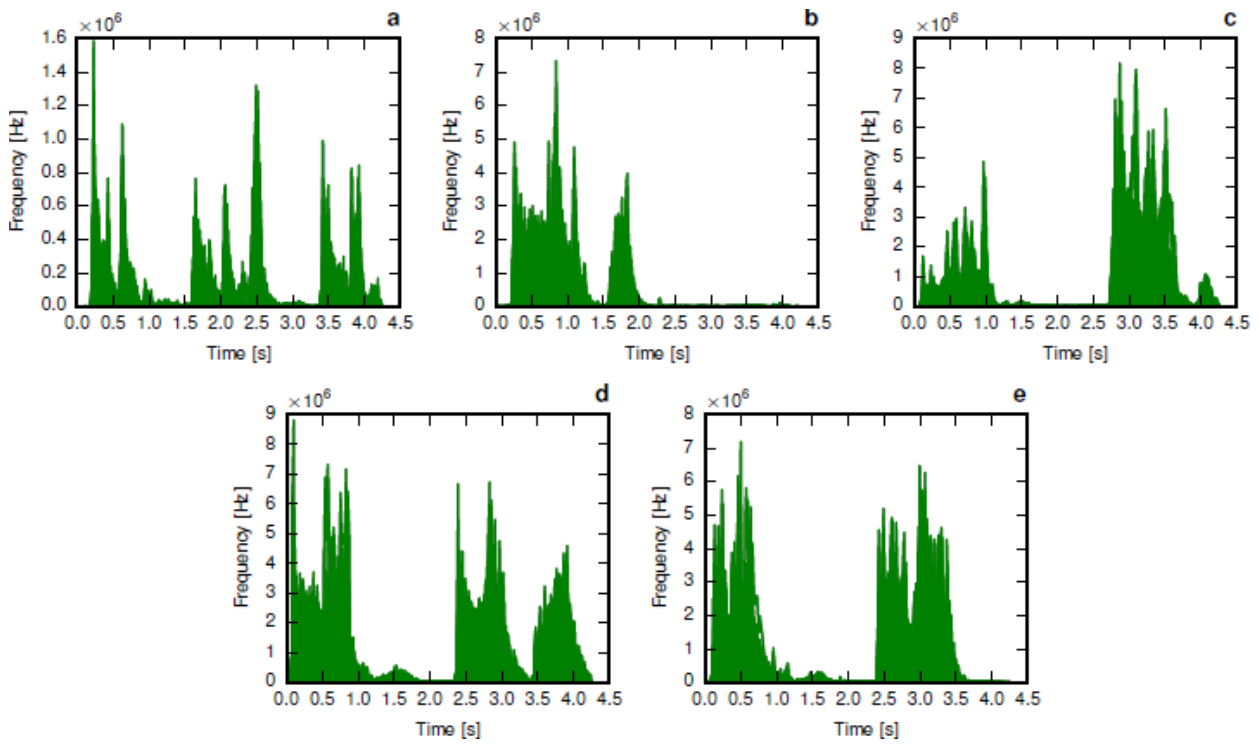
Figure 6.
Comparison of the original cough waveforms (in green) with their Hilbert transformations (in red) for all health states considered. a: Lack of symptoms. b: Minor symptoms. c: Medium symptoms. d: Severe symptoms. e: Highly intensified symptoms.
Figure 6.
Comparison of the original cough waveforms (in green) with their Hilbert transformations (in red) for all health states considered. a: Lack of symptoms. b: Minor symptoms. c: Medium symptoms. d: Severe symptoms. e: Highly intensified symptoms.
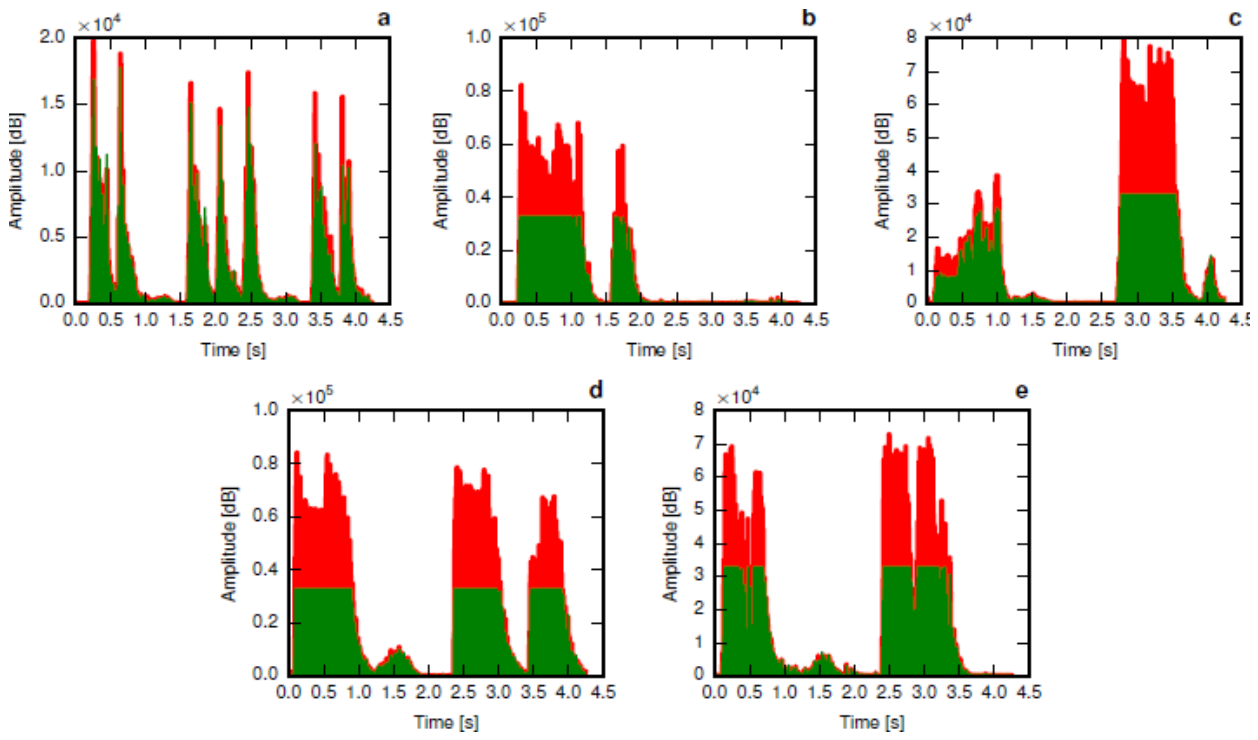
Figure 7.
Sums of wavelet coefficients for all health states considered. a: Analysis made with the Daubechies 3 wavelet. b: Analysis made with the Reverse Biorthogonal 1.5 wavelet.
Figure 7.
Sums of wavelet coefficients for all health states considered. a: Analysis made with the Daubechies 3 wavelet. b: Analysis made with the Reverse Biorthogonal 1.5 wavelet.
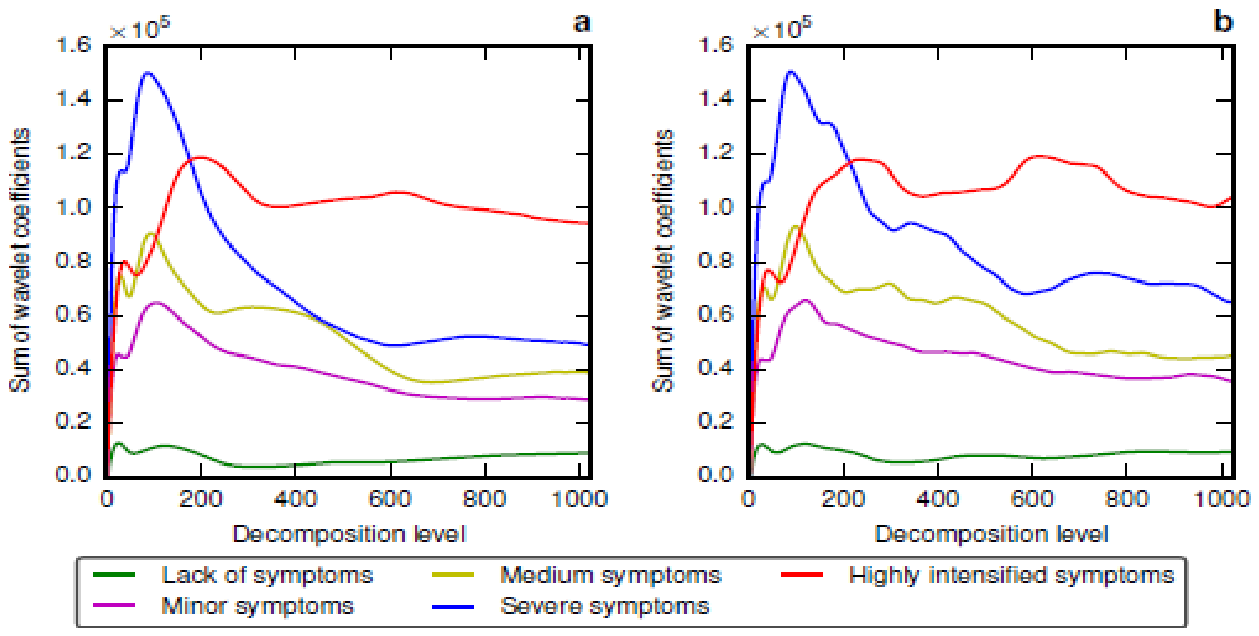

Table 1.
The values obtained by integration of power spectrum function.
| Lack of symptoms | Minor symptoms | Medium symptoms | Severe symptoms | Highly intensified symptoms |
|
| Trapezoidal rule | 347,302.96 | 11,034,899.14 | 13,451,544.89 | 24,593,171.12 | 15,001,762.70 |
| Simpson’s rule | 347,302.95 | 11,034,899.11 | 13,451,544.77 | 24,593,169.71 | 15,001,761.51 |
Table 2.
Average value of the sum of wavelet coefficients for all decomposition levels.
| Lack of symptoms | Minor symptoms | Medium symptoms | Severe symptoms | Highly intensified symptoms |
|
| Biorthogonal 3.5 | 14,407.60 | 83,839.80 | 107,813.12 | 163,588.42 | 199,112.52 |
| Complex Gaussian 8 | 8,410.95 | 54,241.78 | 62,840.33 | 94,083.09 | 119,133.34 |
| Complex Morlet 1 | 5,566.02 | 37,855.23 | 43,039.37 | 69,178.38 | 74,701.51 |
| Coiflet 3 | 6,856.71 | 37,683.18 | 50,914.90 | 68,587.59 | 98,471.72 |
| Daubechies 3 | 7,195.81 | 38,952.06 | 52,046.45 | 71,863.63 | 99,808.23 |
| Discrete Meyer | 6,784.06 | 37,020.55 | 49,837.95 | 67,202.22 | 99,269.58 |
| Frequency B-Spline 2-0.5-1 | 25,105.66 | 122,973.45 | 146,928.67 | 233,635.04 | 200,969.67 |
| Gaussian 8 | 7,883.24 | 47,910.50 | 55,781.46 | 82,588.37 | 106,601.25 |
| Haar | 8,414.62 | 42,575.92 | 56,205.00 | 84,805.03 | 101,728.09 |
| Mexican hat | 22,629.54 | 114,661.83 | 139,662.13 | 216,412.74 | 172,727.71 |
| Meyer | 9,459.42 | 58,036.79 | 67,134.56 | 105,246.43 | 118,800.05 |
| Morlet | 8,665.63 | 54,639.56 | 62,615.06 | 99,255.61 | 111,964.46 |
| Reverse Biorthogonal 1.5 | 8,484.38 | 44,734.60 | 59,067.28 | 88,644.54 | 105,042.42 |
| Shannon 1 | 22,629.54 | 114,661.83 | 139,662.13 | 216,412.74 | 172,727.71 |
| Symlet 4 | 7,008.44 | 38,298.48 | 51,466.96 | 70,150.27 | 98,899.28 |
Table 3.
Dispersion of wavelets representing the recordings on which GERD symptoms occurred with wavelets representing lack of symptoms.
Table 3.
Dispersion of wavelets representing the recordings on which GERD symptoms occurred with wavelets representing lack of symptoms.
| Minor symptoms | Medium symptoms | Severe symptoms | Highly intensified symptoms |
|
| Biorthogonal 3.5 | 52,632.04 | 67,217.45 | 102,504.94 | 177,068.46 |
| Complex Gaussian 8 | 43,938.08 | 57,294.74 | 87,606.18 | 128,187.12 |
| Complex Morlet 1 | 22,866.27 | 30,475.69 | 63,793.16 | 100,081.07 |
| Coiflet 3 | 18,855.78 | 31,357.54 | 38,161.80 | 85,985.86 |
| Daubechies 3 | 19,713.46 | 29,996.63 | 39,967.80 | 85,385.98 |
| Discrete Meyer | 19,931.35 | 33,332.79 | 39,310.69 | 87,495.02 |
| Frequency B-Spline 2-0.5-1 | 125,323.55 | 124,302.83 | 312,947.62 | 237,321.78 |
| Gaussian 8 | 38,804.47 | 46,155.19 | 76,193.90 | 117,801.17 |
| Haar | 24,199.85 | 33,904.66 | 54,436.48 | 89,733.35 |
| Mexican hat | 112,184.61 | 116,263.71 | 250,143.92 | 229,900.38 |
| Meyer | 40,074.19 | 52,157.16 | 111,374.98 | 141,103.82 |
| Morlet | 39,354.83 | 53,229.23 | 106,396.83 | 137,980.44 |
| Reverse Biorthogonal 1.5 Shannon 1 Symlet 4 |
26,062.09 112,184.61 19,156.90 |
36,054.56 116,263.71 30,704.55 |
55,667.86 250,143.92 38,734.72 |
94,920.49 229,900.38 86,178.83 |
Disclaimer/Publisher’s Note: The statements, opinions and data contained in all publications are solely those of the individual author(s) and contributor(s) and not of MDPI and/or the editor(s). MDPI and/or the editor(s) disclaim responsibility for any injury to people or property resulting from any ideas, methods, instructions or products referred to in the content. |
© 2026 by the authors. Licensee MDPI, Basel, Switzerland. This article is an open access article distributed under the terms and conditions of the Creative Commons Attribution (CC BY) license (http://creativecommons.org/licenses/by/4.0/).
Copyright: This open access article is published under a Creative Commons CC BY 4.0 license, which permit the free download, distribution, and reuse, provided that the author and preprint are cited in any reuse.