
Submitted:
05 August 2026
Posted:
06 August 2026
You are already at the latest version
Abstract
Research on environmental, social and governance performance often asks whether ESG improves firm value and whether profitability or reporting quality transmits that effect. This study shows that the usual linear formulation can conceal the economically relevant pattern. We analyze 1,759 firm year observations for 358 companies listed on the Ho Chi Minh Stock Exchange from 2020 to 2024. The conventional linear model produces only a weak positive ESG coefficient for Tobin's Q and no significant ESG effect on return on assets or absolute discretionary accruals. Standard linear mediation therefore finds no profitability or earnings quality channel. Quadratic models tell a different story. Firm value follows a statistically validated U shape: the ESG coefficient is negative, the squared term is positive, the turning point is 0.335, and the Lind and Mehlum test rejects monotonicity. Profitability displays a closely aligned U shape with a turning point of 0.382. Earnings management exhibits a weaker inverse U, peaking near 0.385, which implies that reporting quality is lowest at intermediate ESG levels. The valuation threshold remains visible in both the 2020 to 2021 and 2022 to 2024 subsamples. Random effects estimates preserve the curvature, whereas firm fixed effects lose precision because most identifying variation is cross sectional. Dynamic system GMM retains the expected signs but does not identify the nonlinear terms precisely. The evidence supports a transition from symbolic to substantive ESG: early engagement may impose costs and invite skepticism, while stronger commitment is associated with higher profitability, better earnings quality and higher market value.
Keywords:
ESG performance
; firm value
; profitability
; earnings management
; earnings quality
; threshold effect
; U shape
; Vietnam
1. Introduction
Environmental, social and governance performance has become an important input into corporate valuation, risk assessment and capital allocation. Investors increasingly use ESG information to judge whether a company is prepared for regulatory change, stakeholder pressure and long horizon operational risk. Firms respond by expanding sustainability disclosure, adopting environmental targets and strengthening governance systems. Yet the empirical literature continues to disagree about whether these activities increase firm value, reduce it or have no observable effect. Reviews generally report a positive average association, but they also document substantial heterogeneity across countries, industries, measures and econometric designs (Friede et al. 2015; Gillan et al. 2021).
One reason for the disagreement is that the dominant empirical model assumes a straight line. Under that specification, each additional unit of ESG is assumed to have the same valuation effect regardless of whether a firm is moving from almost no engagement to a minimal program or from a mature program to sector leadership. This assumption is demanding. Initial ESG investment can create disclosure, compliance and organizational costs before capabilities are sufficiently developed to generate benefits. Limited engagement may also be interpreted as symbolic or opportunistic, especially where sustainability reporting is voluntary and verification is weak. Once ESG commitment becomes credible and integrated with operations, stakeholder trust, resource efficiency and access to capital may begin to outweigh the initial costs. These competing forces naturally imply a threshold rather than a constant slope.
The threshold question also changes how financial channels should be studied. A standard mediation design asks whether ESG has a linear effect on profitability or earnings quality and whether those variables subsequently affect firm value. If the true first stage is curved, the average linear coefficient can be close to zero even when the underlying relationship is economically strong. A negative slope below a threshold and a positive slope above it cancel when summarized by one coefficient. The failure of a linear mediation model may therefore indicate misspecification rather than the absence of a financial mechanism.
Vietnam is a useful setting for examining this possibility. The Ho Chi Minh Stock Exchange contains firms with widely different levels of sustainability engagement, while ESG disclosure and rating practices remain less standardized than in mature markets. The market also experienced a major shift during the COVID-19 period, when risk awareness, retail participation and attention to corporate resilience changed sharply. Recent Vietnamese evidence suggests that ESG information can affect share prices and financial risk, but the strength and direction of the relationship vary across measures and samples (Ha et al. 2024; La Soa et al. 2024). A threshold approach is therefore particularly relevant.
This paper compares two empirical narratives using the same panel of 358 HOSE listed firms and 1,759 firm year observations from 2020 to 2024. The first is the received linear mediation view. It estimates the relation from ESG to Tobin's Q, from ESG to return on assets, from ESG to absolute discretionary accruals, and then from the proposed mediators to firm value. The second is a nonlinear threshold view. It adds squared ESG terms to the value, profitability and earnings management equations and validates each curve through boundary slopes and interior turning points.
The contrast is striking. In the linear models, ESG is only marginally associated with Tobin's Q and is unrelated to either profitability or earnings management. The standard mediation interpretation is therefore that no financial channel exists. In the quadratic models, firm value follows a strong U shape with an interior minimum at an ESG score of 0.335. Profitability follows a similar U shape with a minimum at 0.382. Absolute discretionary accruals follow a weaker inverse U with a maximum at 0.385. The three extrema are economically close. Firms appear to pass through a common transition region in which ESG costs and reporting concerns are greatest; beyond that region, profitability rises, earnings management falls and firm value improves.
The study makes four contributions. First, it demonstrates that the apparent failure of ESG mediation can arise because the first stage is modeled linearly. Second, it connects the valuation threshold to aligned patterns in operating profitability and accounting quality rather than treating the U shape as a purely statistical result. Third, it adds evidence from a frontier market where symbolic and substantive sustainability may be easier for investors to distinguish at higher levels of commitment. Fourth, it reports the limits of the evidence directly: the curvature is strong in pooled and random effects models, but firm fixed effects provide little identification because ESG changes slowly within firms, and system GMM preserves the signs without precise nonlinear estimates.
The remainder of the paper is organized as follows. Section 2 develops the theoretical framework and hypotheses. Section 3 describes the sample, variables and empirical models. Section 4 presents the descriptive evidence, compares the linear and nonlinear results, examines the aligned thresholds and reports robustness tests. Section 5 concludes with implications and limitations.
2. Literature Review and Hypothesis Development
2.1. ESG Performance and Firm Value
Stakeholder theory argues that firms create value by maintaining productive relationships with employees, customers, suppliers, communities and regulators (Freeman 1984). ESG engagement can reduce conflict costs, improve reputation and protect access to important resources. Signaling theory adds that credible sustainability activities convey information about managerial quality, risk control and long term orientation to outside investors (Spence 1973). Legitimacy theory emphasizes the value of meeting social expectations, while the resource based view treats environmental and governance capabilities as difficult to imitate organizational assets (Suchman 1995; Barney 1991; Russo and Fouts 1997).
These perspectives predict a positive valuation effect, and many studies support that expectation. Environmental disclosure is associated with higher firm value in several settings (Gerged et al. 2021). Strong sustainability systems can generate durable organizational advantages (Eccles et al. 2014), and ESG performance has been linked to lower risk and greater resilience during crisis periods (Albuquerque et al. 2020; Broadstock et al. 2021; Ding et al. 2021). Vietnamese evidence also indicates that overall ESG and environmental disclosure can be reflected in stock prices (Ha et al. 2024).
The positive view is not universal. Agency theory warns that managers may pursue visible social or environmental projects for personal reputation or political benefits, even when the projects do not maximize shareholder value (Jensen and Meckling 1976; Benabou and Tirole 2010). ESG scores can also be noisy because rating agencies differ in scope, measurement and weighting (Berg et al. 2022). These concerns imply that the market may not reward all ESG effort equally.
2.2. From Symbolic to Substantive ESG
A threshold can emerge when the costs of early ESG engagement arrive before its benefits. Establishing reporting systems, collecting data, redesigning processes and complying with stakeholder expectations require resources. At low levels of engagement, these activities may be too limited to change operating performance or risk exposure. Investors may observe the costs but remain unconvinced about the benefits. Weak programs can also attract greenwashing concerns because they generate communication without a commensurate change in business practice.
As commitment deepens, a different set of mechanisms becomes dominant. Sustainability objectives can become embedded in capital budgeting, supply chain management, employee incentives and internal controls. These practices may improve resource efficiency, reduce regulatory and reputational risk, and create a more credible signal. Barnett and Salomon (2012) describe a related U shaped pattern in which firms that do a little are penalized while firms with stronger social performance are rewarded. Nollet et al. (2016) also find nonlinear ESG effects, while Trumpp and Guenther (2017), Pekovic et al. (2018) and Lahouel et al. (2020) show that the direction of curvature depends on context and the performance measure.
A valid U shape requires more than a positive squared coefficient. The estimated minimum must lie inside the observed range, the slope must be negative at the lower boundary and positive at the upper boundary, and the two arms must be statistically distinguishable from monotonicity (Lind and Mehlum 2010; Haans et al. 2016). This study applies those criteria directly.
2.3. Profitability as a Threshold Channel
Profitability is the most direct operating route from ESG to firm value. Sustainable process improvements can lower energy and material costs, improve employee retention and support product differentiation. Strong governance can reduce waste and discipline investment. These effects should eventually appear in return on assets, which summarizes how efficiently the firm converts its asset base into earnings. The market can then capitalize the expected improvement into Tobin's Q.
The timing of the benefits is central. At low ESG levels, implementation costs can reduce current profitability. Training, reporting, certification and environmental investment may be expensed before the resulting capabilities become productive. Once ESG is sufficiently integrated, the sign can reverse. A linear profitability equation averages the early negative and later positive effects and can incorrectly suggest no relation. Zhou et al. (2022) emphasize financial performance as a transmission mechanism, but the possibility that this first stage is nonlinear has received less attention.
2.4. Earnings Management and Reporting Quality
Earnings quality provides a second possible connection between ESG and valuation. Firms with stronger ethical commitments and monitoring systems may be less willing or less able to manipulate reported performance. Lower discretionary accruals can increase the credibility of financial information and reduce information risk. Studies in Europe and other markets often find that environmental or ESG performance is associated with lower earnings management (Velte 2021; Borralho et al. 2022; Liu et al. 2025).
The relation can nevertheless be nonmonotonic. Early ESG adoption may increase the pressure to present a successful sustainability narrative before economic benefits materialize. Managers can face incentives to smooth or inflate short term results while the firm is incurring transition costs. At higher levels of commitment, better internal controls, external scrutiny and a stronger ethical culture can reduce those incentives. Absolute discretionary accruals may therefore rise at low to intermediate ESG levels and fall after the firm becomes substantively engaged. Since higher absolute accruals indicate more earnings management, this pattern appears as an inverse U in the earnings management variable and a U shape in earnings quality.
2.5. Hypotheses
Hypothesis H1.
A conventional linear ESG model understates the relationship between ESG performance and firm value.
Hypothesis H2.
ESG performance has a U shaped relationship with firm value, with an interior minimum inside the observed ESG range.
Hypothesis H3.
ESG performance has a U shaped relationship with profitability, and the profitability turning point is close to the valuation threshold.
Hypothesis H4.
ESG performance has an inverse U shaped relationship with absolute discretionary accruals, so earnings management is highest at an intermediate ESG level.
Hypothesis H5.
The U shaped ESG and firm value relationship remains observable during the COVID period and after 2021.
3. Data and Methodology
3.1. Sample and Data
The sample contains companies listed on the Ho Chi Minh Stock Exchange from 2020 to 2024. Observations were retained when the variables required for the valuation, profitability, earnings management and control models were available. The final unbalanced panel contains 358 firms and 1,759 firm year observations. Firms contribute between one and five annual observations, with an average of 4.9.
The data file provides the firm identifier, fiscal year, Tobin's Q, a composite ESG score, absolute discretionary accruals, return on assets, leverage, firm size, sales growth, the cash ratio and an Altman type Z score. Variables were winsorized at the 1st and 99th percentiles before estimation. The Z score is used descriptively as an indicator of financial condition but is not included in the main equations because it is mechanically related to several accounting controls.
3.2. Variable Measurement

Table 1.
Variable definitions.
| Construct | Code | Measurement |
|---|---|---|
| Firm value | Q | Tobin's Q, measured as the market value of the firm relative to its asset base |
| ESG performance | ESG | Composite environmental, social and governance score scaled between 0 and 1 |
| Quadratic ESG | ESG2 | Square of the composite ESG score |
| Profitability | ROA | Net income relative to total assets |
| Earnings management | EM | Absolute discretionary accruals; higher values indicate lower earnings quality |
| Leverage | LEV | Total liabilities relative to total assets |
| Firm size | SIZE | Natural logarithm of total assets |
| Growth | GROWTH | Annual sales growth rate |
| Liquidity | CASHR | Cash and cash equivalents relative to total assets |
| Financial condition | Z | Altman type financial health score, used in descriptive analysis |
Notes: The variables in the estimation file were winsorized at the 1st and 99th percentiles. EM is expressed as an absolute value, so a larger number represents more accrual based earnings management.
3.3. Empirical Models
The analysis begins with the conventional linear framework. Equation (1) relates ESG to firm value after controlling for profitability, leverage, size, growth, liquidity and year effects. Equations (2) and (3) use ROA and EM as dependent variables to test the proposed first stage of linear mediation. Equation (4) adds both proposed mediators to the value equation.
Q_it = alpha + beta ESG_it + gamma Controls_it + Year_t + epsilon_it.
ROA_it = alpha + a ESG_it + gamma Controls_it + Year_t + epsilon_it.
EM_it = alpha + d ESG_it + gamma Controls_it + Year_t + epsilon_it.
Q_it = alpha + c ESG_it + b1 ROA_it + b2 EM_it + gamma Controls_it + Year_t + epsilon_it.
The threshold specification replaces the constant ESG slope with a quadratic function. The same functional form is estimated for Q, ROA and EM:
where Y is alternatively Tobin's Q, ROA or absolute discretionary accruals. The turning point is calculated as minus beta1 divided by two beta2. For Q and ROA, a U shape requires beta1 below zero, beta2 above zero and a turning point within the sample. For EM, an inverse U requires beta1 above zero and beta2 below zero. All pooled models include year fixed effects and standard errors clustered by firm, following the panel inference guidance of Petersen (2009) and Cameron and Miller (2015).
Y_it = alpha + beta1 ESG_it + beta2 ESG_it squared + gamma Controls_it + Year_t + epsilon_it,
3.4. Shape Validation and Robustness
The presence of a squared term is not sufficient to establish a threshold. We therefore calculate the marginal ESG slope at the observed lower and upper bounds and use the cluster robust covariance matrix to obtain delta method standard errors. For the firm value equation, the formal Sasabuchi and Lind and Mehlum test is also reported. A U shape is supported when the lower bound slope is negative, the upper bound slope is positive and the joint test rejects a monotonic or inverse U relationship.
Robustness is evaluated with firm fixed effects, random effects and a two step dynamic system GMM model. The fixed effects model identifies the relationship from changes within the same firm and is demanding because ESG scores move slowly over the five year horizon. The random effects model combines within and between firm information. System GMM includes a lagged dependent variable and treats ESG and ESG squared as potentially endogenous, using collapsed lag instruments to limit instrument proliferation (Arellano and Bover 1995; Blundell and Bond 1998; Roodman 2009). The GMM diagnostics include the Arellano Bond AR(2) test and the Hansen test of overidentifying restrictions.
4. Results
4.1. Descriptive Statistics and Correlations
Table 2.
Descriptive statistics.
| Variable | N | Mean | SD | Minimum | Maximum |
|---|---|---|---|---|---|
| Tobin's Q | 1,759 | 1.219 | 0.605 | 0.384 | 4.011 |
| ESG | 1,759 | 0.525 | 0.231 | 0.039 | 0.948 |
| EM | 1,759 | 0.083 | 0.092 | 0.001 | 0.536 |
| ROA | 1,759 | 0.056 | 0.068 | -0.109 | 0.353 |
| LEV | 1,759 | 0.460 | 0.214 | 0.040 | 0.910 |
| SIZE | 1,759 | 28.619 | 1.499 | 25.456 | 34.360 |
| GROWTH | 1,759 | 0.088 | 0.217 | -0.360 | 1.032 |
| CASHR | 1,759 | 0.075 | 0.073 | 0.001 | 0.361 |
| Z score | 1,759 | 3.517 | 4.003 | -0.288 | 25.483 |
Notes: Statistics are calculated from the full estimation sample. The sample includes 358 firms observed from 2020 to 2024.
Table 3.
Pearson correlation matrix.
| Q | ESG | EM | ROA | LEV | SIZE | GROWTH | Z | |
|---|---|---|---|---|---|---|---|---|
| Q | 1.000 | |||||||
| ESG | 0.062 | 1.000 | ||||||
| EM | -0.074 | -0.036 | 1.000 | |||||
| ROA | 0.534 | 0.036 | -0.014 | 1.000 | ||||
| LEV | -0.135 | -0.091 | -0.006 | -0.432 | 1.000 | |||
| SIZE | 0.103 | -0.048 | -0.121 | -0.113 | 0.396 | 1.000 | ||
| GROWTH | -0.018 | -0.121 | 0.311 | 0.133 | 0.130 | 0.131 | 1.000 | |
| Z | 0.514 | 0.086 | 0.020 | 0.558 | -0.606 | -0.293 | -0.080 | 1.000 |
Notes: The matrix reports unadjusted pairwise correlations. In the Stata output, correlations with an absolute p value below 0.05 are marked significant. Q is positively correlated with ESG, ROA, size and the Z score, and negatively correlated with EM and leverage.
Tobin's Q averages 1.219, indicating that the market values the average firm modestly above its recorded asset base. ESG has a mean of 0.525 and a wide range from 0.039 to 0.948, which provides the cross sectional variation needed to identify an interior threshold. ROA averages 5.6 percent. Absolute discretionary accruals average 0.083, with a maximum of 0.536 after winsorization.
The simple correlations are informative but do not reveal the nonlinear pattern. ESG is positively correlated with Q at 0.062, but its correlation with ROA is only 0.036 and its correlation with EM is minus 0.036. ROA is strongly related to Q, while EM is negatively related to Q. The weak unconditional ESG correlations are consistent with opposing slopes on different sides of a threshold.
4.2. The Linear Mediation Model
Table 4 reproduces the conventional conclusion. ESG has a positive but only marginal association with firm value: the coefficient is 0.142 and the p value is 0.097. ROA is a strong positive predictor of Q, but ESG does not predict ROA. The ESG coefficient in the profitability equation is 0.004 with a p value of 0.726. ESG also does not predict absolute discretionary accruals; the coefficient is minus 0.003 with a p value of 0.812. When ROA and EM are added to the value equation, the ESG coefficient is essentially unchanged. EM itself is not associated with Q after the controls are included.
A linear Baron and Kenny interpretation would therefore reject both proposed mediation channels. That interpretation is statistically correct for the specified linear equations, but it is incomplete because it assumes the first stage has a constant sign. The next results show that both the profitability and earnings management first stages are curved.
4.3. The Firm Value Threshold
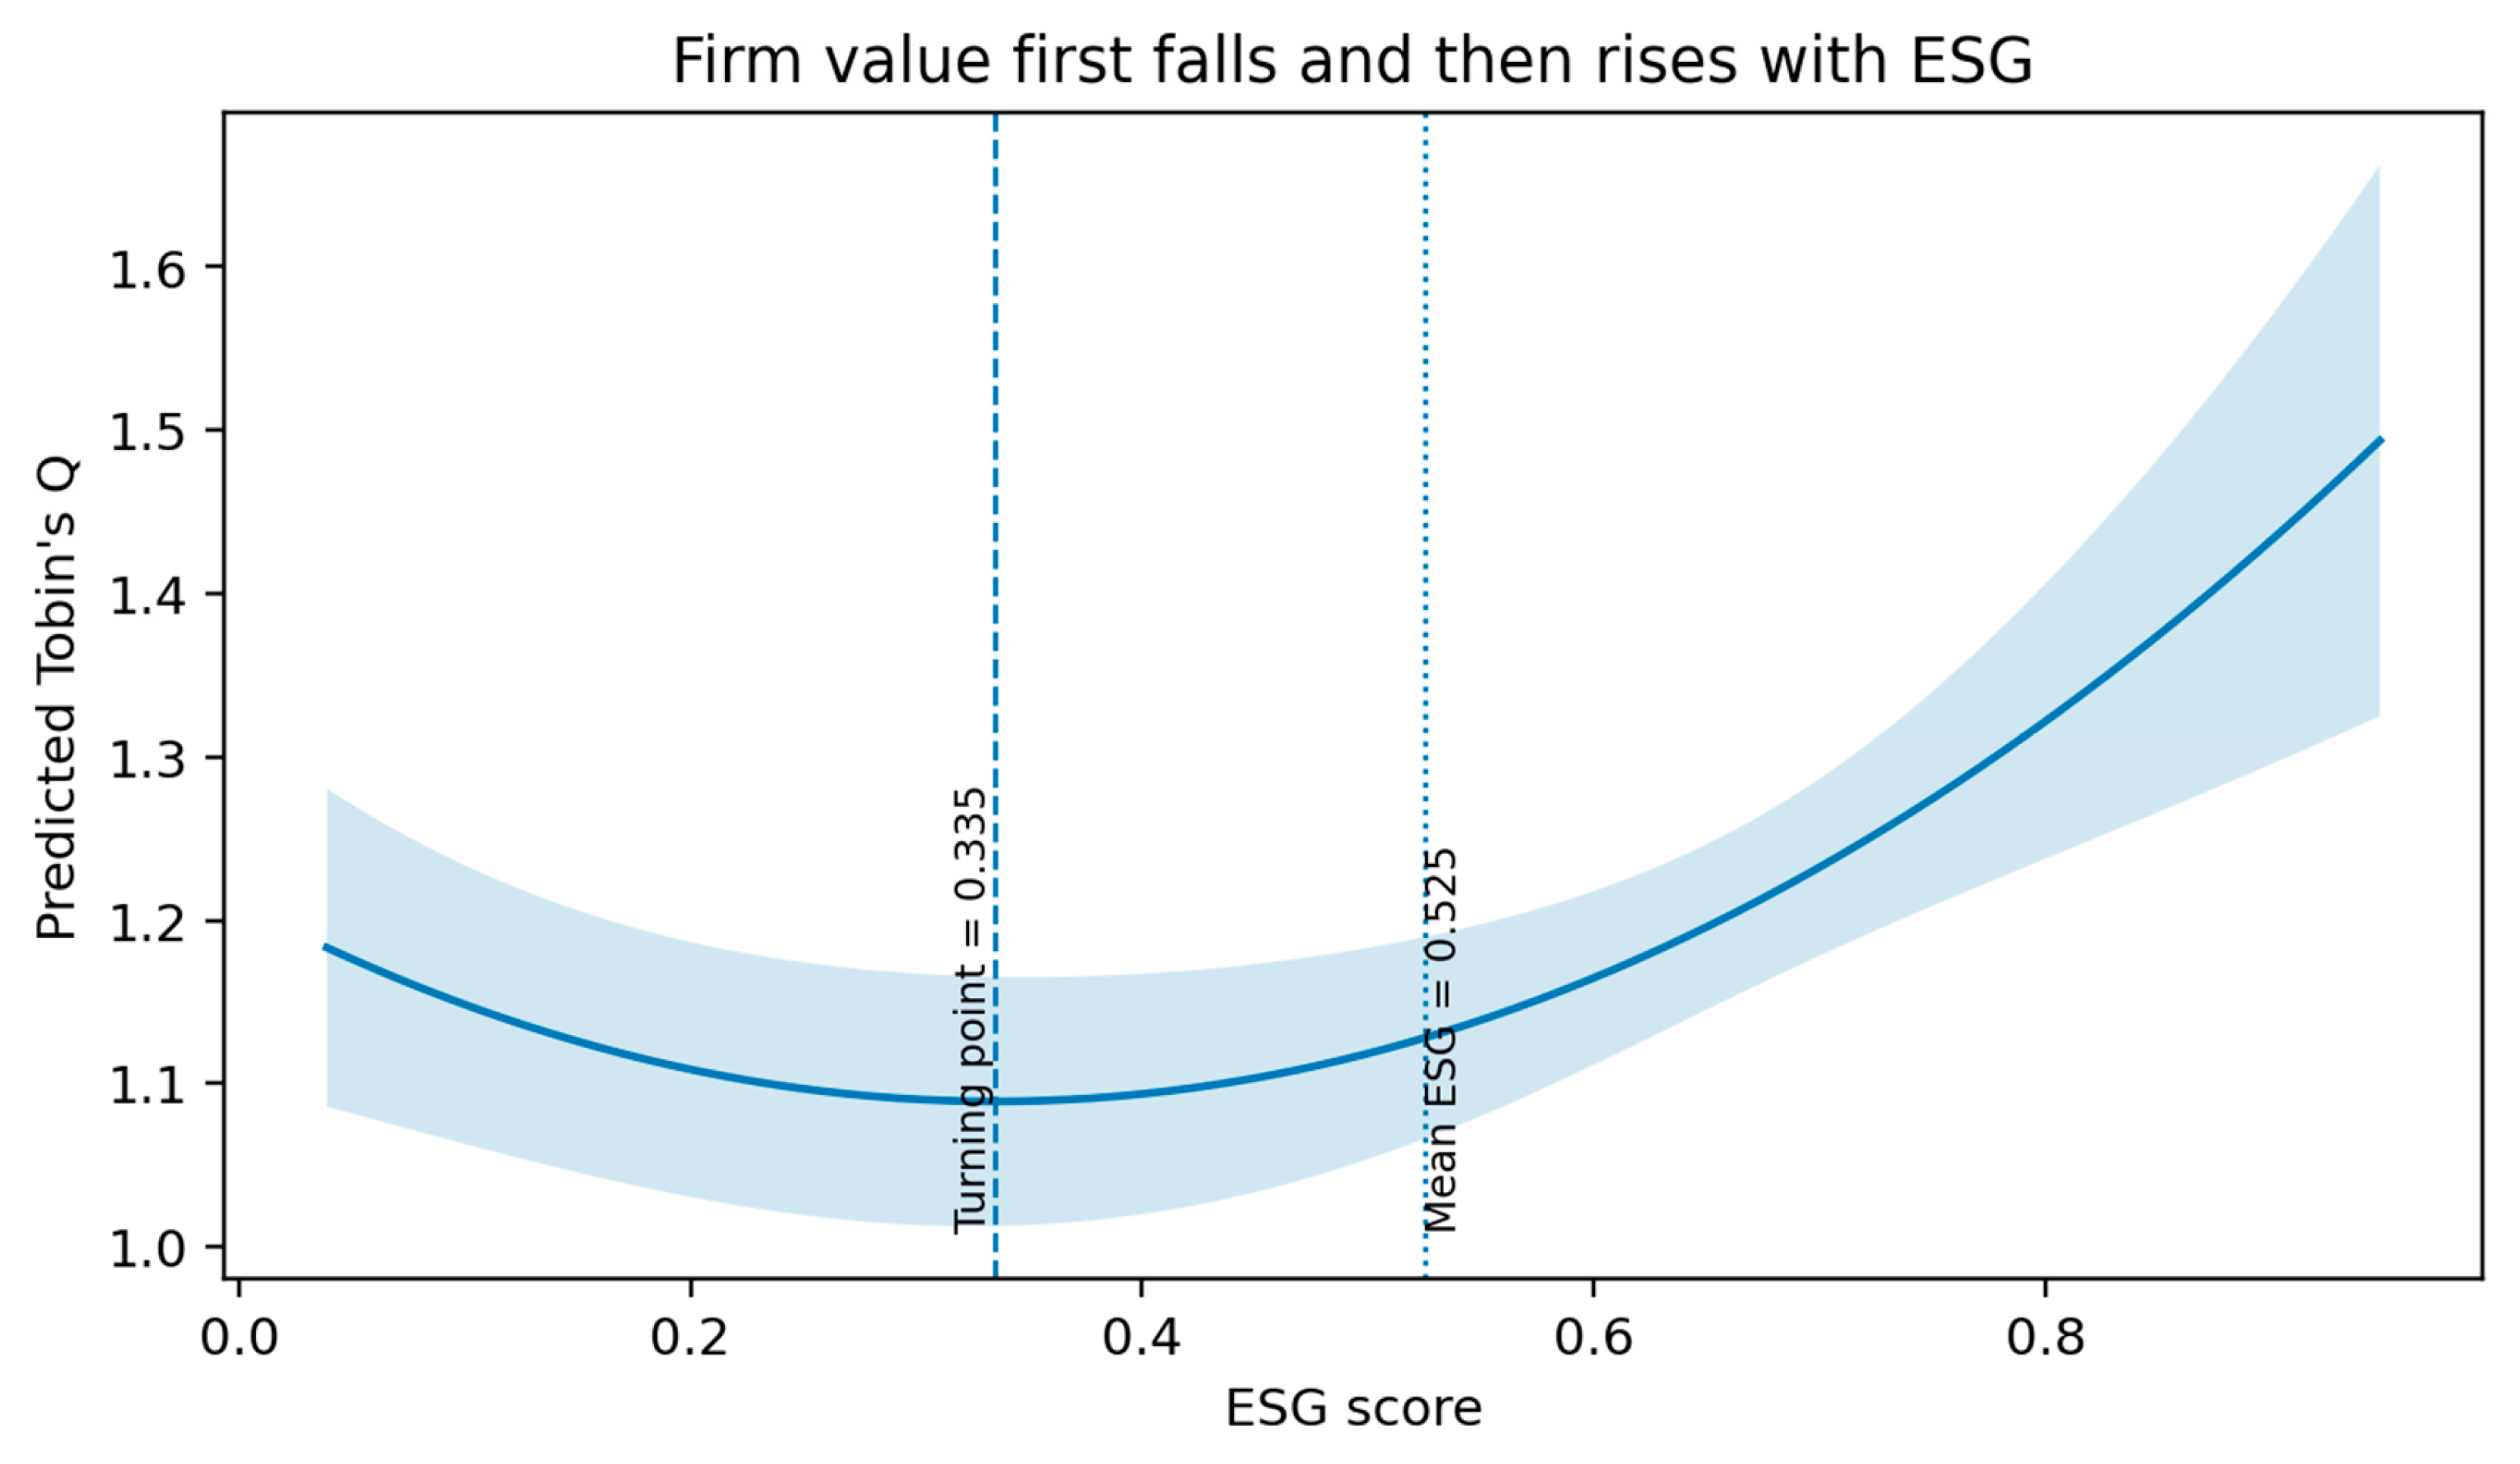
The quadratic value equation reverses the message of the linear model. The linear ESG coefficient is minus 0.721 and significant at the 1 percent level, while the squared term is 1.076 and significant at the 1 percent level. The implied minimum is 0.335. This point lies well inside the observed ESG range of 0.039 to 0.948. About 15 percent of the sample observations lie below the valuation threshold and 85 percent lie above it.
The formal U test confirms that the result is not simply positive curvature outside the data. At the lower ESG boundary, the marginal slope is minus 0.637 and statistically negative. At the upper boundary, the slope is 1.320 and statistically positive. The overall Lind and Mehlum test has a p value of 0.00465. H2 is therefore supported.
The economic interpretation is that early ESG engagement is associated with lower value. Moving from the bottom of the score range toward approximately 0.335 reduces predicted Tobin's Q. Beyond that point, the slope becomes positive and grows as ESG rises. Since the sample mean is 0.525, the typical observation lies on the value creating side of the curve, but firms near the transition region can still experience a valuation penalty.
Figure 1.
Predicted firm value across the ESG distribution. The solid curve is based on the quadratic value model with controls fixed at their sample means and year set to 2024. The dashed vertical line marks the estimated minimum, and the dotted line marks mean ESG. The shaded region is the 95 percent confidence band.
Figure 1.
Predicted firm value across the ESG distribution. The solid curve is based on the quadratic value model with controls fixed at their sample means and year set to 2024. The dashed vertical line marks the estimated minimum, and the dotted line marks mean ESG. The shaded region is the 95 percent confidence band.
4.4. The Aligned Profitability Threshold
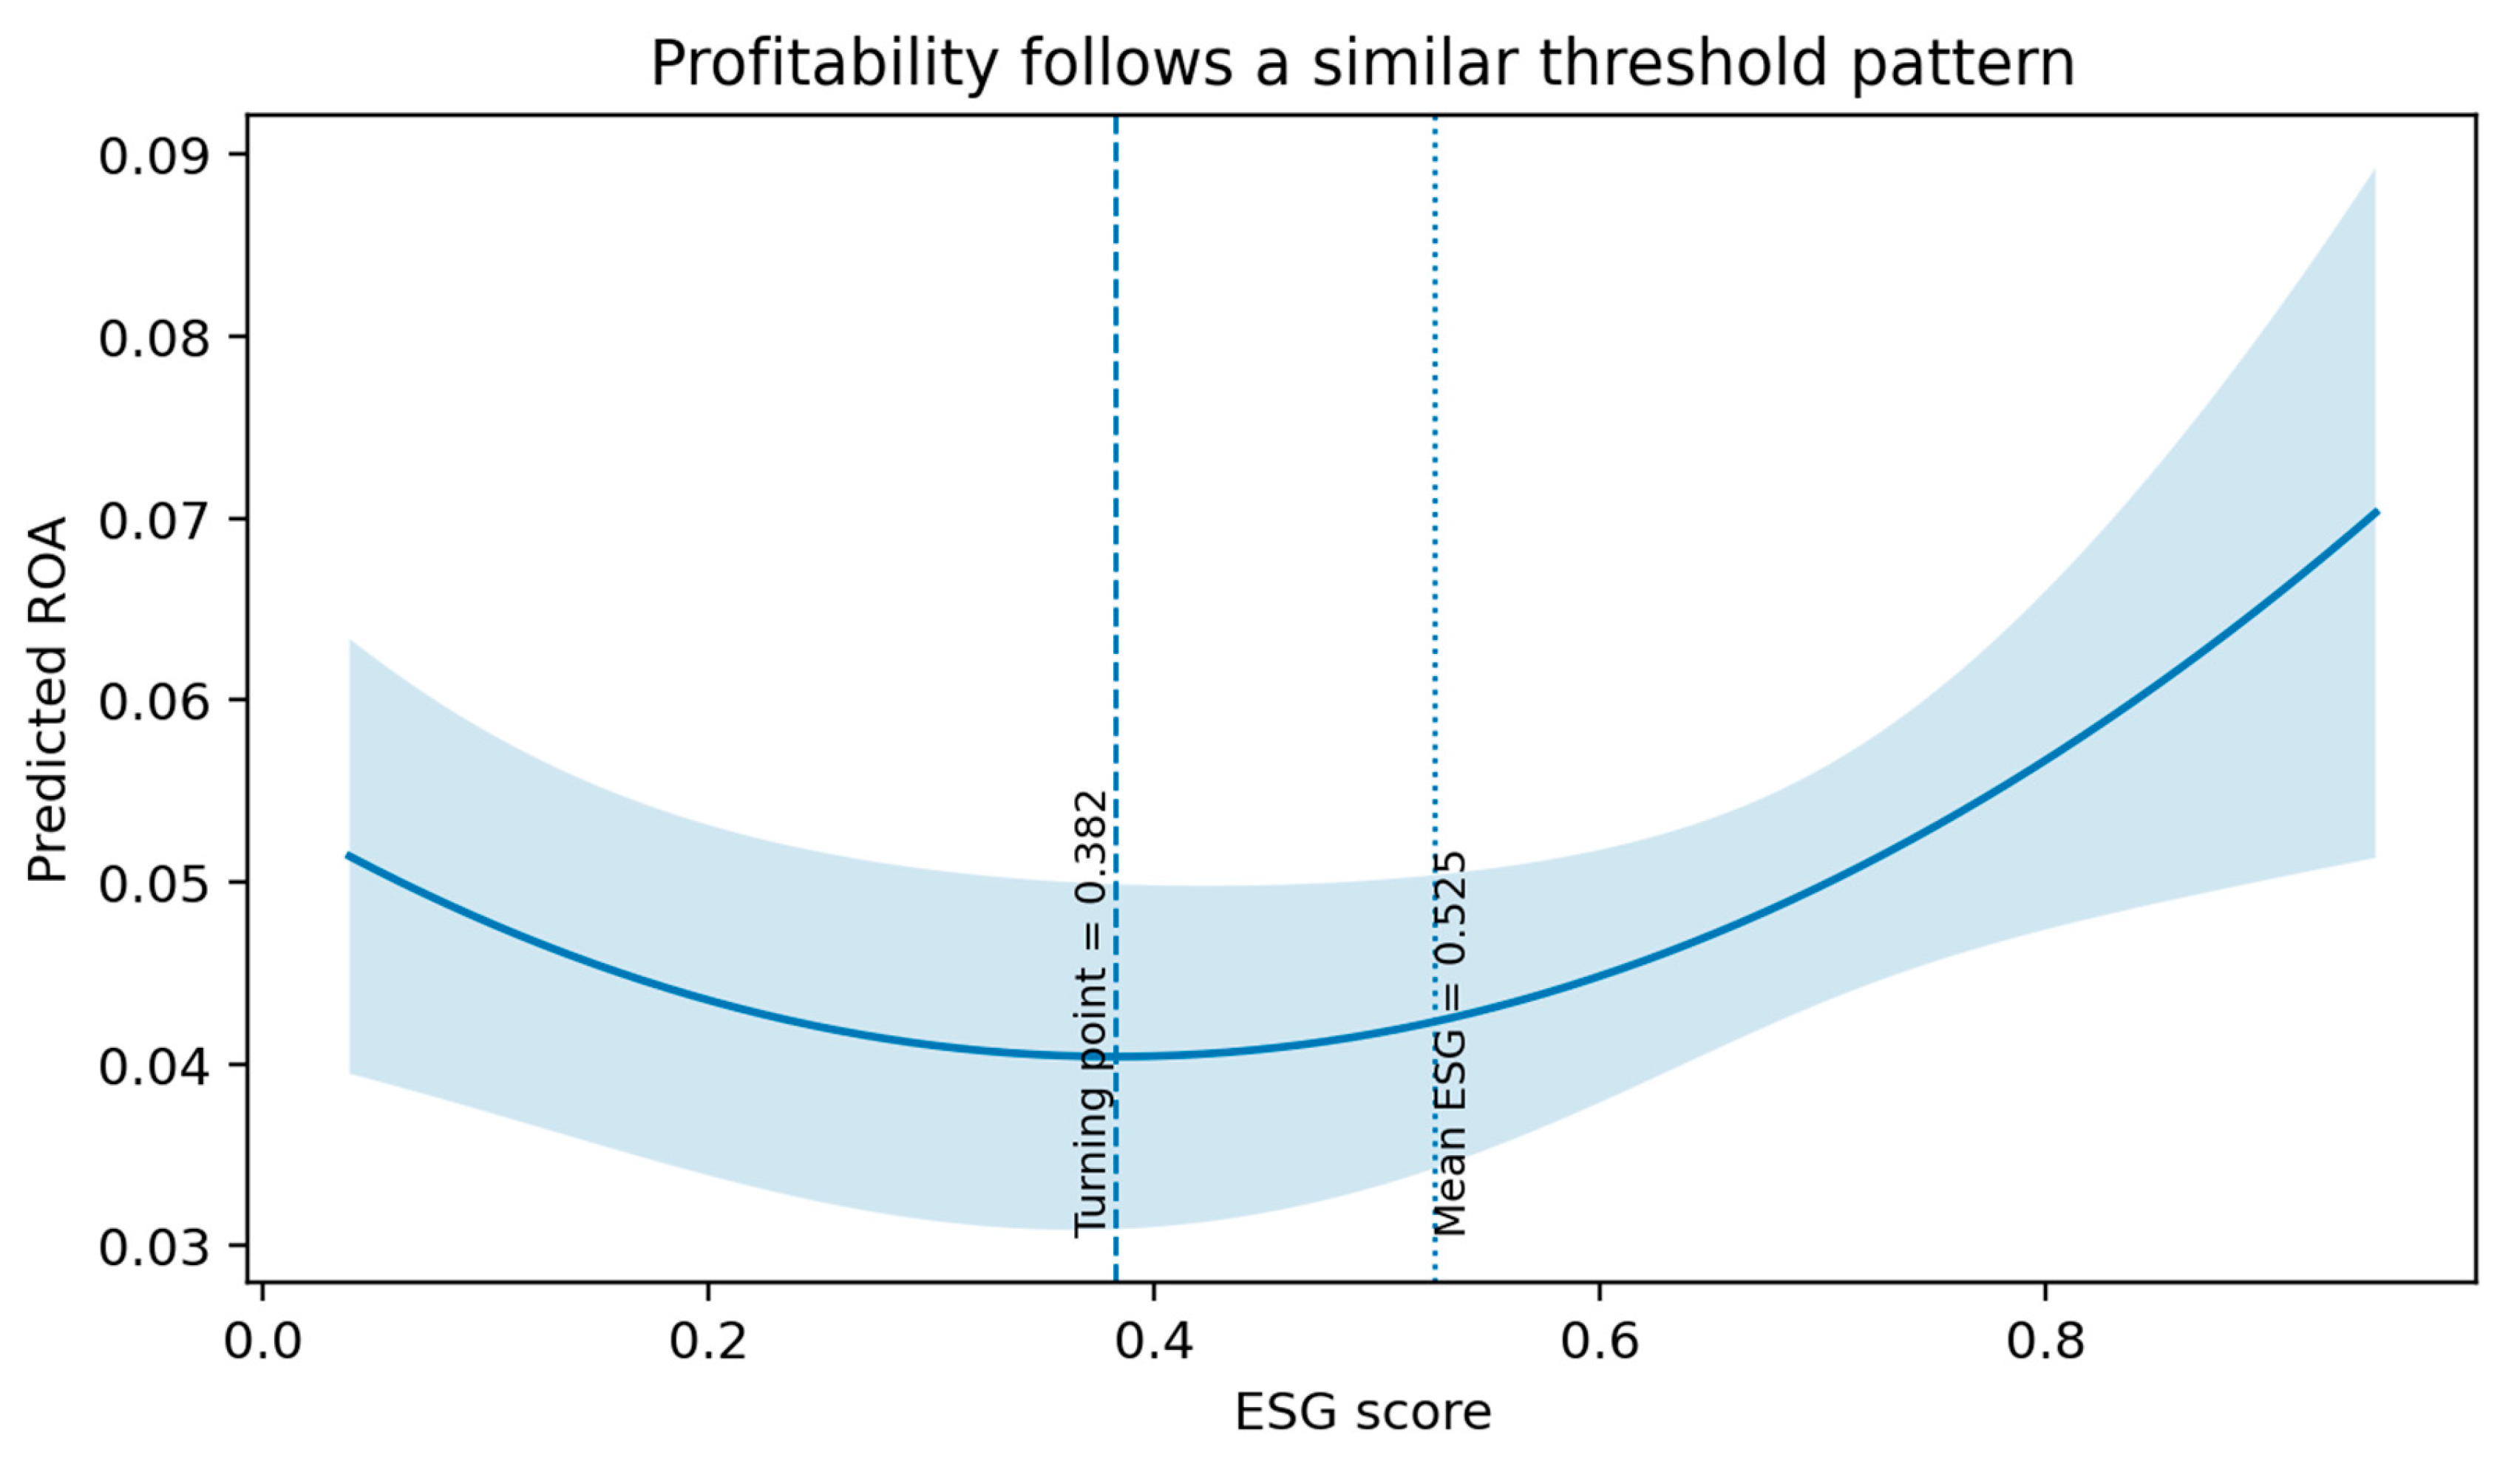
Column 2 of Table 5 shows that ROA has its own U shaped relationship with ESG. The linear coefficient is minus 0.071 and the squared term is 0.093; both are significant at the 5 percent level. The minimum occurs at an ESG score of 0.382, with a 95 percent delta method interval from approximately 0.276 to 0.489. The slope is negative at the lower sample boundary and positive at the upper boundary. H3 is supported.
The profitability minimum is only 0.047 ESG units above the valuation minimum. This close alignment helps explain why a linear first stage appears absent. Below the threshold, ESG is associated with lower ROA, consistent with transition costs. Above the threshold, ESG is associated with higher ROA, consistent with efficiency, stakeholder and capability benefits. When those opposing regions are averaged, the linear coefficient is nearly zero.
ROA is strongly valued by the market in every value equation. Its coefficient in the nonlinear Q model is 5.350 with a t statistic of 8.92. This does not establish causal mediation because ROA may be endogenous and the direct ESG curvature remains after ROA is included. It nevertheless provides channel consistent evidence: the operating outcome that investors value most begins to improve at almost the same ESG level at which Tobin's Q turns upward.
Figure 2.
Predicted profitability across the ESG distribution. The estimated minimum is 0.382, close to the firm value threshold. Controls are fixed at their sample means and year is set to 2024.
Figure 2.
Predicted profitability across the ESG distribution. The estimated minimum is 0.382, close to the firm value threshold. Controls are fixed at their sample means and year is set to 2024.
4.5. Earnings Management Peaks near the Same Transition
The earnings management equation provides a complementary but weaker pattern. ESG enters positively and ESG squared enters negatively. The squared term is significant at the 5 percent level, while the linear term is significant at the 10 percent level. The implied maximum is 0.385. Absolute discretionary accruals therefore rise as firms move from very low ESG toward the middle of the distribution and decline after the transition point.
The boundary evidence is asymmetric. The lower bound slope is positive but only marginally significant, whereas the upper bound slope is negative and significant at the 5 percent level. H4 receives qualified support. The evidence is strong that earnings management declines at high ESG levels, but less precise on the initial increase among low ESG firms.
The location of the maximum is economically important. It is nearly identical to the profitability minimum and only 0.050 above the firm value minimum. The pattern is consistent with a symbolic to substantive transition. Firms near the middle of the ESG distribution may face the highest pressure to demonstrate financial success while still bearing implementation costs, and that combination can coincide with more discretionary accruals. Once ESG becomes more deeply embedded, reporting quality improves. EM does not significantly predict Q in the controlled value equation, so the analysis does not identify earnings management as a direct valuation mediator. It is better interpreted as a parallel governance outcome that helps characterize the transition region.
Figure 3.
Predicted absolute discretionary accruals across the ESG distribution. Higher values indicate more earnings management and lower earnings quality. The maximum is estimated at 0.385.
Figure 3.
Predicted absolute discretionary accruals across the ESG distribution. Higher values indicate more earnings management and lower earnings quality. The maximum is estimated at 0.385.
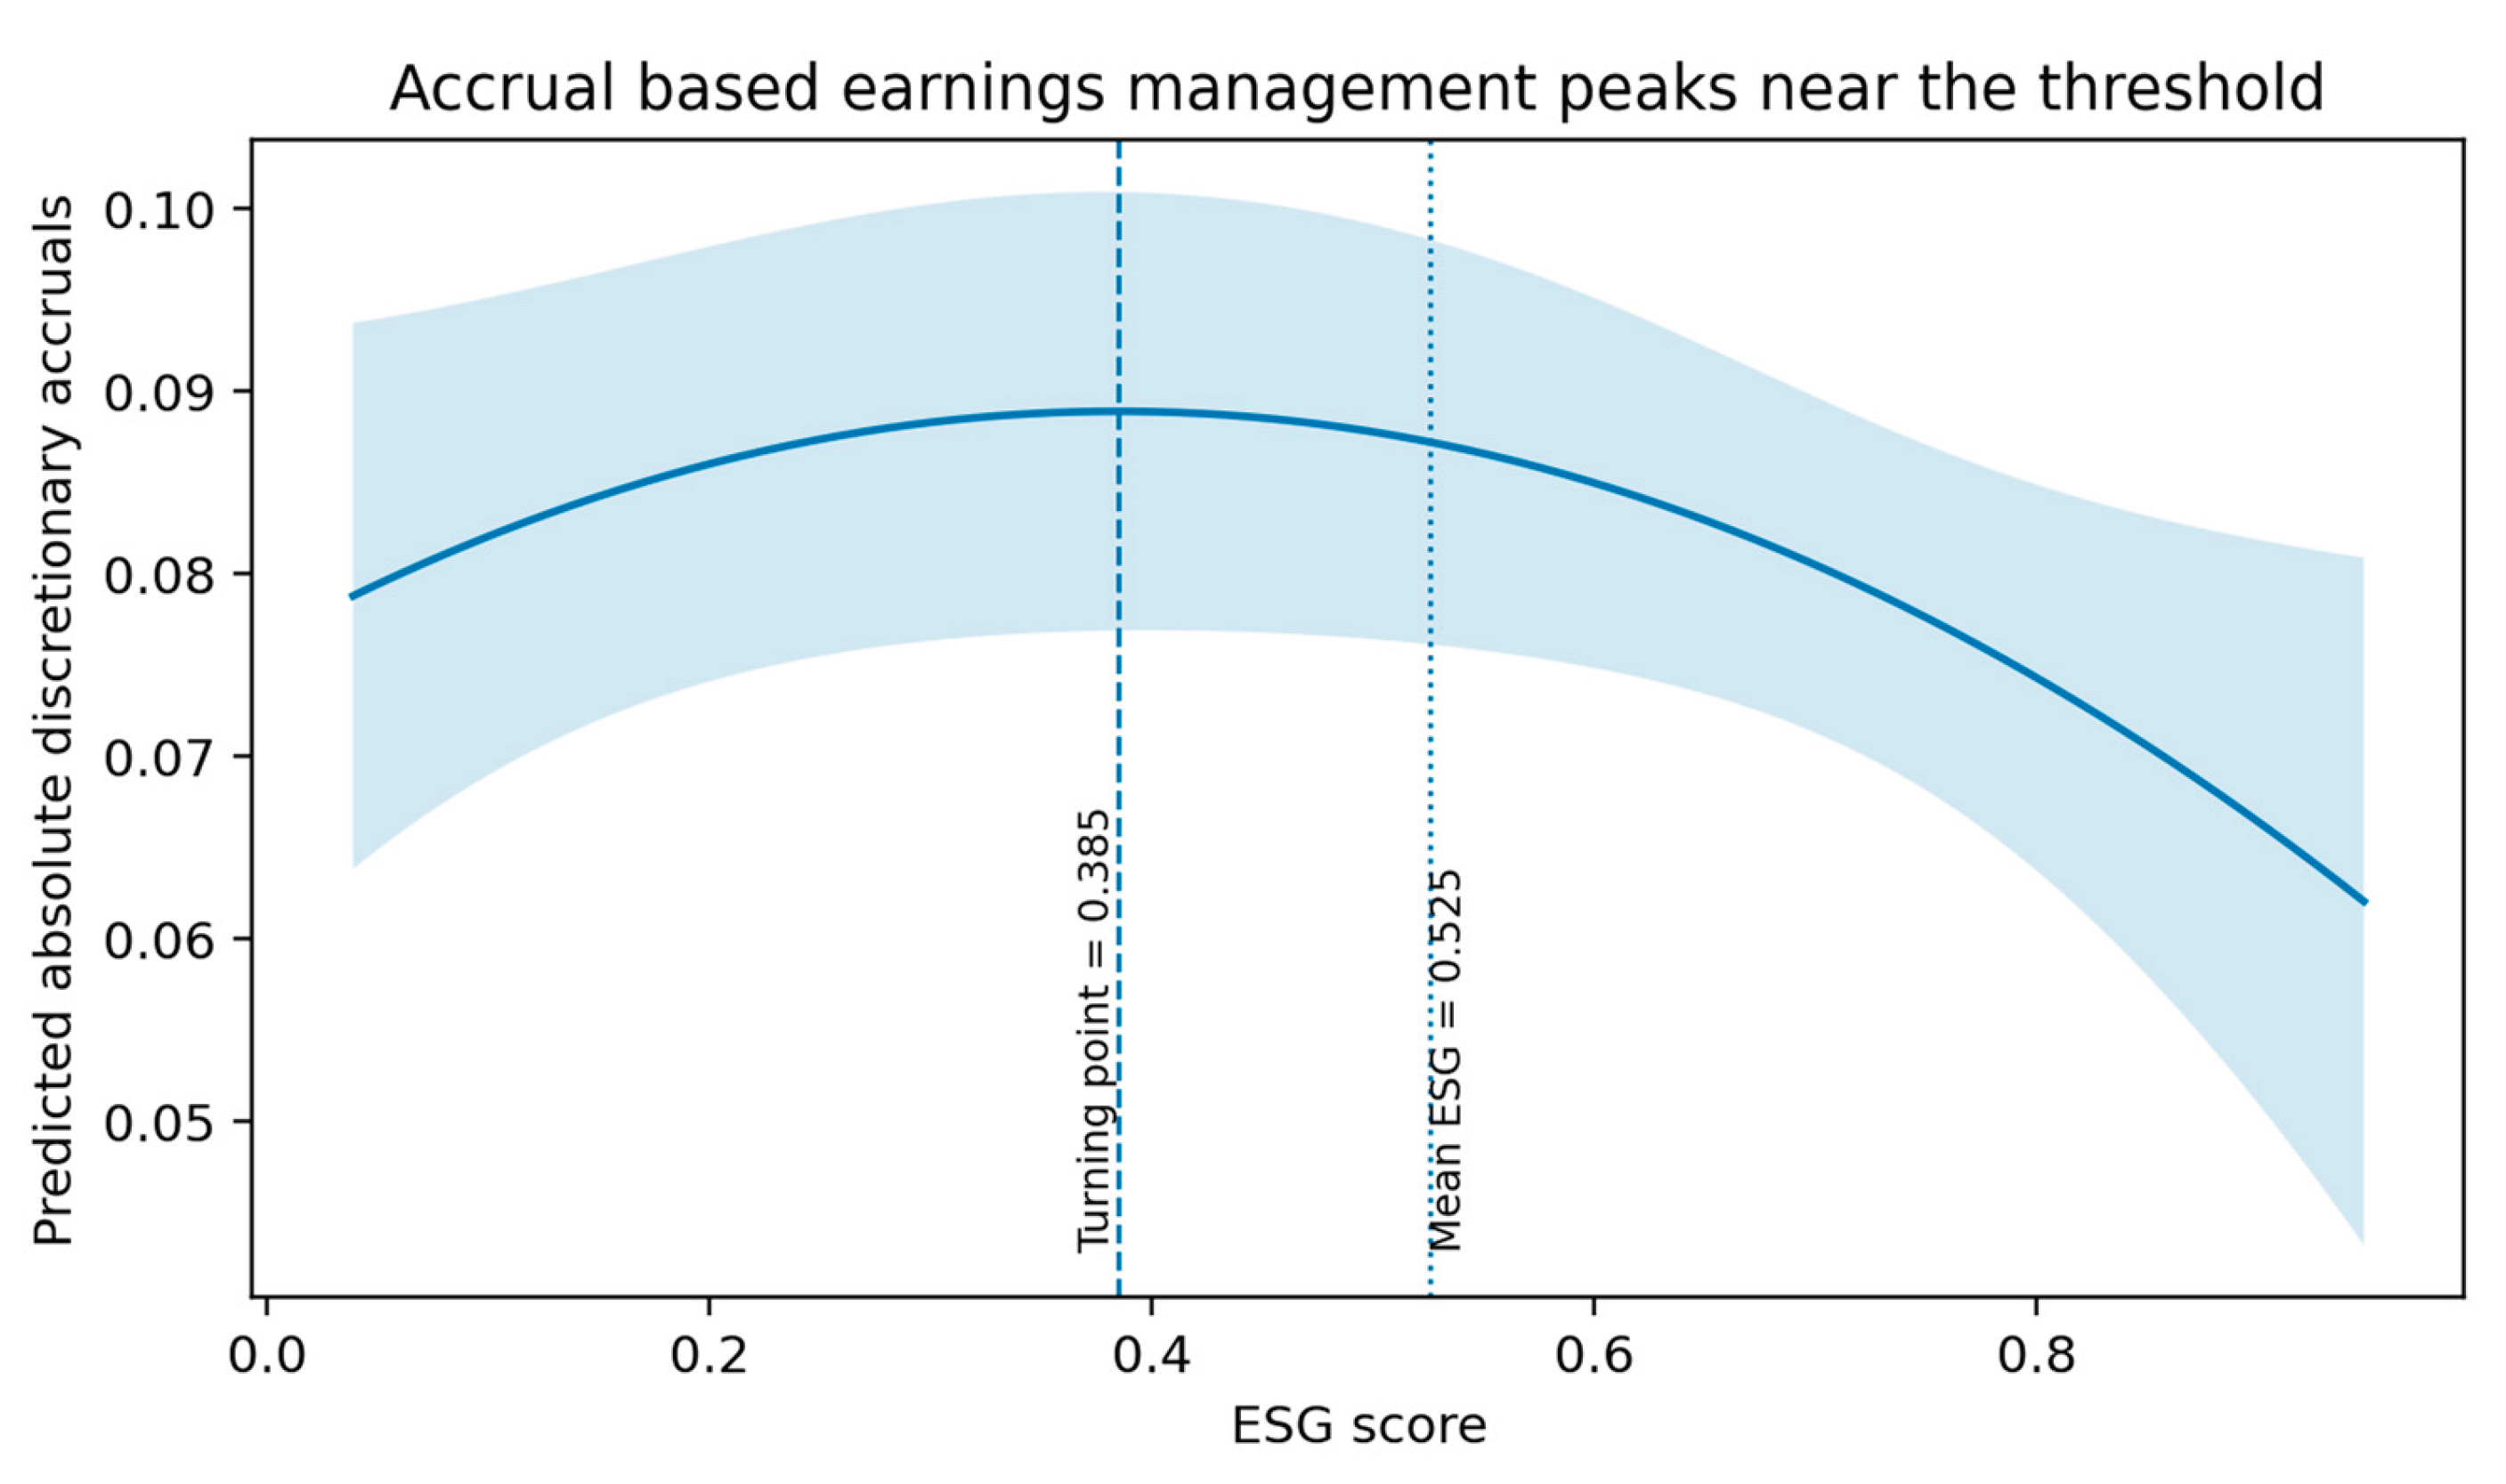
Table 6.
Turning points and boundary slopes.
| Outcome | Shape | Turning point | 95% interval | Slope at low ESG | Slope at high ESG | Conclusion |
|---|---|---|---|---|---|---|
| Firm value Q | U | 0.335 | [0.252, 0.418] | -0.637 (-2.62) | 1.320 (3.52) | Supported |
| Profitability ROA | U | 0.382 | [0.276, 0.489] | -0.064 (-2.11) | 0.106 (2.38) | Supported |
| Earnings management EM | Inverse U | 0.385 | [0.245, 0.524] | 0.058 (1.64) | -0.095 (-2.08) | Qualified |
Notes: t statistics are in parentheses. Turning point intervals use the delta method and cluster robust covariance matrix. For Q, the formal Lind and Mehlum U test has p = 0.00465.
4.6. COVID and Post COVID Subsamples
Table 7.
ESG thresholds during and after the COVID period.
| Variable | 2020 to 2021 | 2022 to 2024 |
|---|---|---|
| ESG | -0.923** (-2.43) | -0.622** (-2.33) |
| ESG squared | 1.434*** (2.91) | 0.910*** (2.93) |
| ROA | 4.248*** (5.33) | 6.192*** (10.81) |
| LEV | -0.212 (-1.21) | 0.503*** (5.01) |
| SIZE | 0.081*** (3.88) | 0.055*** (3.97) |
| GROWTH | -0.335*** (-3.83) | -0.264*** (-3.68) |
| CASHR | 0.088 (0.27) | -0.347 (-1.42) |
| Turning point | 0.322 | 0.342 |
| R squared | 0.333 | 0.443 |
| N | 702 | 1,057 |
Notes: Pooled OLS with year fixed effects and firm clustered standard errors. Cluster robust t statistics are in parentheses. *** p < 0.01, ** p < 0.05, * p < 0.10.
The U shape is not confined to one period. During 2020 and 2021, ESG enters negatively and ESG squared enters positively, with a turning point of 0.322. In the 2022 to 2024 subsample, the corresponding turning point is 0.342. Both sets of linear and quadratic coefficients are significant, and both subsamples have negative lower bound slopes and positive upper bound slopes.
The relative stability of the turning point is notable because market conditions changed substantially across the two periods. The average valuation level shifted, as shown by the year effects, but the ESG commitment required to move onto the positive arm changed only modestly. H5 is supported. The result suggests that the symbolic to substantive transition is not solely a pandemic anomaly.
4.7. Robustness and Endogeneity
Table 8.
Robustness models for the ESG valuation threshold.
| Variable | Firm fixed effects | Random effects | Two step system GMM |
|---|---|---|---|
| Lagged Q | 0.620 (1.36) | ||
| ESG | 0.099 (0.13) | -0.447* (-1.76) | -1.019 (-1.05) |
| ESG squared | -0.095 (-0.14) | 0.630** (2.27) | 0.962 (0.95) |
| ROA | 0.760** (2.36) | 2.209*** (5.51) | 1.702 (0.69) |
| LEV | 0.279 (1.64) | -0.073 (-0.64) | 0.123 (0.88) |
| SIZE | -0.304*** (-6.41) | 0.043** (2.38) | 0.018 (0.62) |
| GROWTH | -0.010 (-0.23) | -0.154*** (-3.72) | -0.288*** (-4.00) |
| CASHR | 0.098 (0.48) | 0.156 (0.77) | 0.001 (0.00) |
| N / groups | 1,759 / 358 | 1,759 / 358 | 1,398 / 356 |
| AR(2) p value | 0.511 | ||
| Hansen p value | 0.093 |
Notes: The fixed effects and random effects models include year effects and firm clustered standard errors. GMM uses corrected two step standard errors, collapsed lag instruments and year effects. *** p < 0.01, ** p < 0.05, * p < 0.10.
The random effects model preserves the expected curvature. ESG is negative at the 10 percent level and ESG squared is positive at the 5 percent level. The smaller coefficients relative to pooled OLS are consistent with partial adjustment for unobserved firm heterogeneity.
The firm fixed effects model does not identify the threshold. Both ESG terms are near zero and imprecise. This does not prove that the pooled threshold is spurious. The sample covers only five years, and ESG scores change slowly within firms. Fixed effects discard the cross sectional level variation that separates weak, intermediate and highly committed firms. The result therefore shows an identification limitation: the threshold is primarily a between firm pattern in this sample.
Dynamic system GMM also retains a negative ESG coefficient and a positive squared coefficient, but neither is significant. The AR(2) p value is 0.511, and the Hansen p value is 0.093, which does not reject the instrument set at the 5 percent level. The corrected standard errors are large, and the covariance matrix warning indicates that the nonlinear instruments are weak. The GMM evidence is therefore directional rather than confirmatory. The paper does not claim a causal threshold.
4.8. Discussion
The main finding is not simply that ESG and firm value form a U shape. The more informative result is that three corporate outcomes change direction in a narrow ESG interval. Tobin's Q reaches its minimum near 0.335, ROA near 0.382 and earnings management its maximum near 0.385. This alignment provides an economic interpretation for the valuation curve. The market begins to reward ESG at approximately the point where profitability stops deteriorating and accounting quality begins to improve.
The evidence reconciles apparently inconsistent findings in the literature. A study that estimates only a linear average can find a weak or insignificant ESG effect because it pools firms on opposite sides of the threshold. A study concentrated among larger or better disclosing firms can find a positive effect because most observations lie on the upper arm. A study of early adopters can find a negative relation because costs arrive before benefits. Differences in sample composition can therefore generate different signs even when the underlying curve is similar.
The results also refine the distinction between symbolic and substantive ESG. Symbolic activity is not directly observed in the data, so the term should not be read as a definitive classification of individual firms. It describes a mechanism consistent with the aggregate pattern. Low to intermediate ESG scores can represent programs that are visible enough to create costs and expectations but not sufficiently developed to produce operating benefits or strong monitoring. Higher scores are more likely to reflect deeper integration. Future work should test this interpretation with direct measures of assurance, capital expenditure, governance processes and disclosure quality.
For managers, the findings imply that incremental ESG investment may not yield immediate market rewards. Firms that begin the transition should plan for a period in which costs are visible before benefits emerge. Stopping near the middle can be particularly unattractive. For investors, the ESG score should not be treated as a constant premium. Its marginal meaning depends on the firm's position relative to the threshold and on whether improvements are supported by profitability and reporting quality. For regulators, standardized disclosure and external assurance can shorten the period in which investors cannot distinguish symbolic from substantive commitment.
Table 9.
Summary of hypothesis tests.
| Hypothesis | Statement | Result |
|---|---|---|
| H1 | A linear ESG model understates the relationship | Supported |
| H2 | ESG and firm value are U shaped | Supported |
| H3 | ESG and profitability are U shaped with aligned thresholds | Supported |
| H4 | Earnings management is inverse U shaped | Qualified support |
| H5 | The value threshold persists across periods | Supported |
Notes: Qualified support for H4 reflects a significant negative squared term and significant upper boundary decline, but only marginal evidence for the lower boundary increase.
5. Conclusions
This study examines why conventional ESG mediation models can fail to detect an economically meaningful relationship. Using 1,759 observations for 358 HOSE listed firms from 2020 to 2024, the linear models show only a weak ESG association with Tobin's Q and no ESG association with profitability or absolute discretionary accruals. On that basis, neither profitability nor earnings quality appears to transmit the ESG effect.
The quadratic evidence changes the conclusion. Firm value follows a formally validated U shape with a minimum at 0.335. Profitability follows a U shape with a minimum at 0.382. Earnings management follows a weaker inverse U with a maximum at 0.385. The alignment of the three points suggests that ESG begins to create market value when it becomes strong enough to improve operating profitability and reduce discretionary reporting behavior. Linear models miss this transition because they average negative and positive slopes.
The findings have practical implications. Firms should not assume that minimal ESG activity will be rewarded. Early implementation can impose costs and create expectations before benefits materialize. A credible strategy requires enough organizational depth to move beyond the transition region. Investors should interpret ESG jointly with operating and reporting outcomes rather than applying a constant valuation premium. Regulators can improve price discovery by standardizing disclosure and encouraging assurance, which can make substantive commitment easier to identify.
The limitations are important. The primary threshold is estimated from pooled and random effects variation and is not identified by firm fixed effects over the short panel. System GMM preserves the signs but does not estimate them precisely. The ESG score is composite and does not distinguish disclosure from actual performance. Absolute discretionary accruals capture only one dimension of earnings management. The analysis also lacks industry codes and external instruments. Future research should use longer panels, pillar level scores, assurance indicators, direct green investment measures, alternative earnings quality proxies and quasi experimental regulatory changes. These extensions can determine whether the aligned thresholds are causal and whether they vary across industries or ownership structures.
Author Contributions
Conceptualization, N.T.P. and H.L.T.T.; methodology, H.L.T.T.; software, H.L.T.T.; validation, N.T.P.; formal analysis, H.L.T.T.; investigation, N.T.P. and H.L.T.T.; data curation, H.L.T.T.; writing - original draft preparation, H.L.T.T.; writing - review and editing, N.T.P. and H.L.T.T.; visualization, H.L.T.T.; supervision, N.T.P.; project administration, N.T.P. All authors have read and agreed to the published version of the manuscript.
Funding
This research received no external funding. A related institutional funding application is currently under review by the University of Economics Ho Chi Minh City. Since formal approval has not yet been granted, no grant number has been assigned.
Institutional Review Board Statement
Not applicable.
Informed Consent Statement
Not applicable.
Data Availability Statement
The data supporting the findings may be made available by the corresponding author upon reasonable request, subject to restrictions associated with the underlying sources.
Conflicts of Interest
The authors declare no conflict of interest.
References
- Albuquerque, Rui; Koskinen, Yrjo; Yang, Shuai; Zhang, Chendi. Resiliency of environmental and social stocks: An analysis of the exogenous COVID-19 market crash. Rev. Corp. Financ. Stud. 2020, 9, 593–621. [Google Scholar] [CrossRef] [PubMed]
- Arellano, Manuel; Bover, Olympia. Another look at the instrumental variable estimation of error-components models. J. Econom. 1995, 68, 29–51. [Google Scholar] [CrossRef]
- Barnett, Michael L.; Salomon, Robert M. Does it pay to be really good? Addressing the shape of the relationship between social and financial performance. Strateg. Manag. J. 2012, 33, 1304–1320. [Google Scholar] [CrossRef]
- Barney, Jay. Firm resources and sustained competitive advantage. J. Manag. 1991, 17, 99–120. [Google Scholar] [CrossRef]
- Baron, Reuben M.; Kenny, David A. The moderator-mediator variable distinction in social psychological research: Conceptual, strategic, and statistical considerations. J. Personal. Soc. Psychol. 1986, 51, 1173–1182. [Google Scholar] [CrossRef] [PubMed]
- Benabou, Roland; Tirole, Jean. Individual and corporate social responsibility. Economica 2010, 77, 1–19. [Google Scholar] [CrossRef]
- Berg, Florian; Kolbel, Julian F.; Rigobon, Roberto. Aggregate confusion: The divergence of ESG ratings. Rev. Financ. 2022, 26, 1315–1344. [Google Scholar] [CrossRef]
- Blundell, Richard; Bond, Stephen. Initial conditions and moment restrictions in dynamic panel data models. J. Econom. 1998, 87, 115–143. [Google Scholar] [CrossRef]
- Borralho, Joao Miguel; Hernandez-Linares, Remedios; Gallardo-Vazquez, Dolores; Choban de Sousa Paiva, Inna. Environmental, social and governance disclosure's impacts on earnings management: Family versus non-family firms. J. Clean. Prod. 2022, 379, 134603. [Google Scholar] [CrossRef]
- Broadstock, David C.; Chan, Kalok; Cheng, Louis T. W.; Wang, Xiaowei. The role of ESG performance during times of financial crisis: Evidence from COVID-19 in China. Financ. Res. Lett. 2021, 38, 101716. [Google Scholar] [CrossRef] [PubMed]
- Cameron, A. Colin; Miller, Douglas L. A practitioner's guide to cluster-robust inference. J. Hum. Resour. 2015, 50, 317–372. [Google Scholar] [CrossRef]
- Dechow, Patricia M.; Sloan, Richard G.; Sweeney, Amy P. Detecting earnings management. Account. Rev. 1995, 70, 193–225. [Google Scholar] [CrossRef]
- Ding, Wenzhi; Levine, Ross; Lin, Chen; Xie, Wensi. Corporate immunity to the COVID-19 pandemic. J. Financ. Econ. 2021, 141, 802–830. [Google Scholar] [CrossRef] [PubMed]
- Eccles, Robert G.; Ioannou, Ioannis; Serafeim, George. The impact of corporate sustainability on organizational processes and performance. Manag. Sci. 2014, 60, 2835–2857. [Google Scholar] [CrossRef]
- Fatemi, Ali; Glaum, Martin; Kaiser, Stefanie. ESG performance and firm value: The moderating role of disclosure. Glob. Financ. J. 2018, 38, 45–64. [Google Scholar] [CrossRef]
- Ferrell, Allen; Liang, Hao; Renneboog, Luc. Socially responsible firms. J. Financ. Econ. 2016, 122, 585–606. [Google Scholar] [CrossRef]
- Flammer, Caroline. Does corporate social responsibility lead to superior financial performance? A regression discontinuity approach. Manag. Sci. 2015, 61, 2549–2568. [Google Scholar] [CrossRef]
- Freeman, R. Edward. Strategic Management: A Stakeholder Approach; Pitman: Boston, 1984. [Google Scholar]
- Friede, Gunnar; Busch, Timo; Bassen, Alexander. ESG and financial performance: Aggregated evidence from more than 2000 empirical studies. J. Sustain. Financ. Invest. 2015, 5, 210–233. [Google Scholar] [CrossRef]
- Gerged, Ali Meftah; Beddewela, Eshani; Cowton, Christopher J. Is corporate environmental disclosure associated with firm value? A multicountry study of Gulf Cooperation Council firms. Bus. Strategy Environ. 2021, 30, 185–203. [Google Scholar]
- Gillan, Stuart L.; Koch, Andrew; Starks, Laura T. Firms and social responsibility: A review of ESG and CSR research in corporate finance. J. Corp. Financ. 2021, 66, 101889. [Google Scholar] [CrossRef]
- Ha, Nguyen T. T.; Nguyen, T. C.; Ho, N. T. B. The impact of environmental, social and governance disclosure on stock prices: Empirical research in Vietnam. Heliyon 2024, 10, e38757. [Google Scholar] [CrossRef] [PubMed]
- Haans, Richard F. J.; Pieters, Constant; He, Zi-Lin. Thinking about U: Theorizing and testing U- and inverted U-shaped relationships in strategy research. Strateg. Manag. J. 2016, 37, 1177–1195. [Google Scholar]
- Healy, Paul M.; Wahlen, James M. A review of the earnings management literature and its implications for standard setting. Account. Horiz. 1999, 13, 365–383. [Google Scholar] [CrossRef]
- Jensen, Michael C.; Meckling, William H. Theory of the firm: Managerial behavior, agency costs and ownership structure. J. Financ. Econ. 1976, 3, 305–360. [Google Scholar] [CrossRef]
- Kothari, S. P.; Leone, Andrew J.; Wasley, Charles E. Performance matched discretionary accrual measures. J. Account. Econ. 2005, 39, 163–197. [Google Scholar] [CrossRef]
- Kruger, Philipp. Corporate goodness and shareholder wealth. J. Financ. Econ. 2015, 115, 304–329. [Google Scholar] [CrossRef]
- Lahouel, Bilel Ben; Bruna, Maria Giuseppina; Ben Zaied, Younes. The curvilinear relationship between environmental performance and financial performance: An investigation of listed French firms using panel smooth transition model. Financ. Res. Lett. 2020, 35, 101455. [Google Scholar] [CrossRef]
- La Soa, Nguyen; Duy, Do Duc; Hang, Tran Thi Thanh; Ha, Nguyen Dieu. The impact of environmental accounting information disclosure on financial risk: The case of listed companies in the Vietnam stock market. J. Risk Financ. Manag. 2024, 17, 62. [Google Scholar] [CrossRef]
- Lind, Jo Thori; Mehlum, Halvor. With or without U? The appropriate test for a U-shaped relationship. Oxf. Bull. Econ. Stat. 2010, 72, 109–118. [Google Scholar] [CrossRef]
- Liu, Junjun; Yu, Xiao; Hu, Jiangxin; Ma, Jiangshui. The impact of ESG performance on earnings management from a long-term perspective: Evidence from China. Corp. Soc. Responsib. Environ. Manag. 2025, 32, 7510–7527. [Google Scholar] [CrossRef]
- Nollet, Joscha; Filis, George; Mitrokostas, Evangelos. Corporate social responsibility and financial performance: A non-linear and disaggregated approach. Econ. Model. 2016, 52, 400–407. [Google Scholar] [CrossRef]
- Orlitzky, Marc; Schmidt, Frank L.; Rynes, Sara L. Corporate social and financial performance: A meta-analysis. Organ. Stud. 2003, 24, 403–441. [Google Scholar] [CrossRef]
- Pekovic, Sanja; Grolleau, Gilles; Mzoughi, Naoufel. Environmental investments: Too much of a good thing? Int. J. Prod. Econ. 2018, 197, 297–302. [Google Scholar] [CrossRef]
- Petersen, Mitchell A. Estimating standard errors in finance panel data sets: Comparing approaches. Rev. Financ. Stud. 2009, 22, 435–480. [Google Scholar] [CrossRef]
- Preacher, Kristopher J.; Hayes, Andrew F. Asymptotic and resampling strategies for assessing and comparing indirect effects in multiple mediator models. Behav. Res. Methods 2008, 40, 879–891. [Google Scholar] [CrossRef] [PubMed]
- Roodman, David. How to do xtabond2: An introduction to difference and system GMM in Stata. Stata J. 2009, 9, 86–136. [Google Scholar] [CrossRef]
- Russo, Michael V.; Fouts, Paul A. A resource-based perspective on corporate environmental performance and profitability. Acad. Manag. J. 1997, 40, 534–559. [Google Scholar] [CrossRef] [PubMed]
- Servaes, Henri; Tamayo, Ane. The impact of corporate social responsibility on firm value: The role of customer awareness. Manag. Sci. 2013, 59, 1045–1061. [Google Scholar] [CrossRef]
- Spence, Michael. Job market signaling. Q. J. Econ. 1973, 87, 355–374. [Google Scholar] [CrossRef]
- Suchman, Mark C. Managing legitimacy: Strategic and institutional approaches. Acad. Manag. Rev. 1995, 20, 571–610. [Google Scholar] [CrossRef]
- Takahashi, Hidenori; Yamada, Kazuo. When the Japanese stock market meets COVID-19: Impact of ownership, China and US exposure, and ESG channels. Int. Rev. Financ. Anal. 2021, 74, 101670. [Google Scholar] [CrossRef]
- Trumpp, Christoph; Guenther, Thomas. Too little or too much? Exploring U-shaped relationships between corporate environmental performance and corporate financial performance. Bus. Strategy Environ. 2017, 26, 49–68. [Google Scholar] [CrossRef]
- Velte, Patrick. Environmental performance, carbon performance and earnings management: Empirical evidence for the European capital market. Corp. Soc. Responsib. Environ. Manag. 2021, 28, 42–53. [Google Scholar] [CrossRef]
- Wintoki, M. Babajide; Linck, James S.; Netter, Jeffry M. Endogeneity and the dynamics of internal corporate governance. J. Financ. Econ. 2012, 105, 581–606. [Google Scholar] [CrossRef]
- Zhou, Guangyou; Liu, Lian; Luo, Sumei. Sustainable development, ESG performance and company market value: Mediating effect of financial performance. Bus. Strategy Environ. 2022, 31, 3371–3387. [Google Scholar] [CrossRef]
Table 4.
Linear ESG models and proposed mediation channels.
| Variable | (1) Q | (2) ROA | (3) EM | (4) Q with mediators |
|---|---|---|---|---|
| ESG | 0.142* (1.66) | 0.004 (0.35) | -0.003 (-0.24) | 0.143* (1.66) |
| ROA | 5.446*** (9.31) | 5.454*** (9.30) | ||
| EM | 0.058 (0.40) | |||
| LEV | 0.213* (1.81) | -0.143*** (-10.11) | 0.011 (0.80) | 0.213* (1.81) |
| SIZE | 0.066*** (4.37) | 0.003* (1.71) | -0.011*** (-6.28) | 0.067*** (4.37) |
| GROWTH | -0.305*** (-5.18) | 0.053*** (6.56) | 0.138*** (8.29) | -0.314*** (-4.84) |
| CASHR | -0.156 (-0.67) | 0.170*** (6.08) | 0.027 (0.64) | -0.159 (-0.69) |
| R squared | 0.374 | 0.266 | 0.131 | 0.374 |
| N | 1,759 | 1,759 | 1,759 | 1,759 |
Notes: Pooled OLS with year fixed effects and standard errors clustered by firm. Cluster robust t statistics are in parentheses. *** p < 0.01, ** p < 0.05, * p < 0.10.
Table 5.
Nonlinear ESG models for firm value, profitability and earnings management.
| Variable | (1) Q | (2) ROA | (3) EM | (4) Q with ROA and EM |
|---|---|---|---|---|
| ESG | -0.721*** (-2.69) | -0.071** (-2.14) | 0.065* (1.68) | -0.726*** (-2.72) |
| ESG squared | 1.076*** (3.30) | 0.093** (2.36) | -0.085** (-1.97) | 1.083*** (3.32) |
| ROA | 5.350*** (8.92) | 5.362*** (8.92) | ||
| EM | 0.092 (0.66) | |||
| LEV | 0.211* (1.82) | -0.142*** (-10.11) | 0.010 (0.72) | 0.212* (1.83) |
| SIZE | 0.065*** (4.44) | 0.003* (1.69) | -0.011*** (-6.23) | 0.066*** (4.46) |
| GROWTH | -0.316*** (-5.35) | 0.052*** (6.52) | 0.140*** (8.37) | -0.329*** (-5.08) |
| CASHR | -0.118 (-0.51) | 0.172*** (6.17) | 0.025 (0.60) | -0.122 (-0.52) |
| R squared | 0.384 | 0.272 | 0.134 | 0.384 |
| N | 1,759 | 1,759 | 1,759 | 1,759 |
Notes: Pooled OLS with year fixed effects and standard errors clustered by firm. Cluster robust t statistics are in parentheses. *** p < 0.01, ** p < 0.05, * p < 0.10.
Disclaimer/Publisher’s Note: The statements, opinions and data contained in all publications are solely those of the individual author(s) and contributor(s) and not of MDPI and/or the editor(s). MDPI and/or the editor(s) disclaim responsibility for any injury to people or property resulting from any ideas, methods, instructions or products referred to in the content. |
© 2026 by the authors. Licensee MDPI, Basel, Switzerland. This article is an open access article distributed under the terms and conditions of the Creative Commons Attribution (CC BY) license (http://creativecommons.org/licenses/by/4.0/).
Copyright: This open access article is published under a Creative Commons CC BY 4.0 license, which permit the free download, distribution, and reuse, provided that the author and preprint are cited in any reuse.


