
Submitted:
04 August 2026
Posted:
06 August 2026
You are already at the latest version
Abstract
The rapid diffusion of decentralized finance (DeFi) protocols across emerging econo-mies raises two related policy questions: whether these platforms broaden access to fi-nancial services and whether their expansion affects incumbent commercial banks. Us-ing an unbalanced panel of ten BRICS Plus economies (2015–2024), we estimate four complementary specifications—two-way fixed effects, system GMM, structural equa-tion modelling with mediation, and panel smooth transition regression—to investigate the DeFi–inclusion–stability nexus. Estimators yield mixed evidence on the DeFi–inclusion link: fixed effects and SEM specifications produce positive but non-significant coefficients, while system GMM yields a small negative estimate once path dependence is absorbed. The direct association between DeFi adoption and non-performing loans is negative and robust across all specifications once multicollinearity between the two Chainalysis indicators is remedied. The PSTR suggests a possible threshold on the Fi-nancial Inclusion Index at ĉ ≈ 0.641, with the DeFi–Z-score association switching from negative below the threshold to positive above it. However, we cannot reject the null hypothesis of linearity at conventional 5% significance (p = 0.057), bootstrap confidence intervals for the regime slopes are wide and straddle zero, and Monte Carlo simulations confirm limited statistical power. Alternative transition variables yield mixed results, suggesting the threshold reflects broader financial development rather than inclusion specifically. The findings are best interpreted as pattern evidence from methodological triangulation rather than definitive causal identification. Given the borderline statisti-cal evidence, we offer policy observations as directional hypotheses for future research rather than definitive prescriptions.
Keywords:
decentralized finance
; financial inclusion
; bank stability
; BRICS plus
1. Introduction
The stock of assets locked in decentralized finance (DeFi) protocols expanded from less than USD 1 billion in early 2020 to a peak of approximately USD 180 billion in November 2021, and stood at roughly USD 129 billion by mid-2024 [1,2]. In parallel, the Chainalysis Global Crypto Adoption Index documents that grassroots cryptocurrency activity is concentrated in emerging markets, with India ranking first for the third consecutive year and Brazil, Russia, and Ethiopia entering the top twenty [3,4]. These developments coincide with a reconfigured multilateral bloc: the 2024 accession of Egypt, Ethiopia, Iran, Saudi Arabia, and the United Arab Emirates to the BRICS grouping created an economically heterogeneous consortium representing roughly 45% of the world population and 35% of global GDP in purchasing power parity terms [5]. Together, these facts render the empirical question of whether DeFi adoption broadens financial inclusion, and how it affects incumbent banks, a matter of increasing policy relevance for the enlarged BRICS Plus consortium.
As decentralized protocols transition from permissionless niches to potentially systemic financial intermediaries, understanding their macroprudential implications becomes central to modern banking regulation. This study directly addresses the growing scholarly focus on financial innovation, digitalization, and banking resilience that lies at the core of leading international finance journals. Specifically, it examines whether decentralized financial technology acts as a competitive shock or a technological complement to incumbent commercial banks across heterogeneous emerging economies, using the post-2024 BRICS Plus configuration as a natural laboratory. The near-simultaneous rollout of retail central bank digital currencies (CBDCs) across the BRICS Plus [5] further underscores the policy relevance of this inquiry, as sovereign digital currency initiatives may interact with — or substitute for — grassroots DeFi adoption in ways that reshape the inclusion–stability frontier.
The scholarly response has advanced along three theoretical streams that this study seeks to bridge and extend. First, the technology-of-financial-services literature — anchored in Philippon [6,7] and extended by Allen et al. [8,9] — models DeFi as a productivity-enhancing infrastructure that compresses intermediation costs. Second, the digital-finance and inclusion tradition [10,11,12] locates the marginal impact of non-bank instruments in the intersection between digital identity, mobile penetration, and regulatory scaffolding. Third, the regulatory-arbitrage and shadow-banking framework [1,13] treats DeFi as an un-intermediated substitute that can plausibly cannibalize bank funding. However, these three streams have rarely been integrated within a unified empirical framework that simultaneously tests for mediation through financial inclusion and for regime-dependent threshold effects on bank stability. Moreover, foundational theories of financial intermediation [14,15], bank franchise value [16], innovation diffusion [17], and technology adoption [18,19] — each of which illuminates a distinct facet of the DeFi–inclusion–stability triad — have not been systematically brought to bear on the DeFi literature.
Existing panel studies of fintech spillovers focus almost exclusively on China [20,21], advanced economies [22], or the MENA sub-region [9,23]. Recent contributions have extended the evidence to nine Asian economies [24], to 35 emerging markets [25], and to a BRICS-wide panel integrating renewable-energy interactions [26]. These studies share a common finding — fintech adoption is associated with lower bank risk when institutional quality and market discipline are sufficiently developed — but none has jointly operationalized DeFi penetration as an on-chain measure, embedded a multidimensional financial inclusion index in a mediating role, and tested for a threshold effect on aggregate bank stability across the enlarged BRICS Plus bloc.
1.1. Contribution to the Literature
This study contributes to the literature on three structural pillars. First, on a conceptual level, it formulates the DeFi–inclusion–stability triad under regime-dependent institutional heterogeneity in emerging markets, integrating financial intermediation theory [14], bank franchise value theory [16], and innovation diffusion theory [17] within a unified threshold framework. This integration refines the general non-linear intuition of Banna et al. [27] and Ozili [12] by attaching a specific reference value (ĉ ≈ 0.641 for the Financial Inclusion Index; ĉ ≈ 9.879 for log GDP per capita) to the enlarged BRICS Plus context, while explicitly acknowledging that the threshold evidence is suggestive rather than definitive.
Second, on an econometric level, the study introduces Monte Carlo power diagnostics (B = 150 replications) into panel smooth transition models, thereby preventing false-positive non-linear inferences in small-N macroeconomic consortiums. The primary methodological contribution is not the threshold estimate itself, but the demonstration of how small-N consortium panels can be rigorously evaluated through an integrated FE–GMM–SEM–PSTR pipeline with explicit bootstrap confidence intervals and power analysis. This approach illustrates how methodological triangulation can substitute for the large-N statistical power that is unavailable in consortium-level panels, following the diagnostic standards codified in Roodman [28] and González et al. [29].
Third, on a policy level, the study provides empirical reference values for tier-based macroprudential regulation in BRICS Plus economies. The comparative transition-variable analysis — showing that log GDP per capita (F = 7.34, p = 0.0002) yields a sharper linearity test than the FII (F = 2.60, p = 0.057) — offers practical guidance for policymakers: any regulatory benchmark should refer to the joint level of inclusion, income, and connectivity rather than to any single dimension.
These contributions extend, rather than replace, the recent evidence in Uddin and Barai [24] and Abdelkader et al. [26]. The value-added lies in the specific threshold estimate, the transition-variable comparison, the integrated diagnostic architecture, and the explicit uncertainty quantification that together transform the paper from a threshold-discovery exercise into a methodological benchmark for empirical macroprudential monitoring of DeFi in emerging economies.
The BRICS Plus consortium is theoretically meaningful for this analysis for three reasons. First, its members span low-income (Ethiopia), middle-income (Brazil, India, Egypt, South Africa), and high-income (Saudi Arabia, UAE) tiers, providing natural variation in financial inclusion and institutional quality. Second, the banking systems range from tightly regulated (Saudi Arabia, UAE) to sanction-constrained (Iran, Russia post-2022), offering variation in regulatory oversight that conditions the DeFi–stability nexus [24]. Third, the 2024 accession of five new members created an enlarged bloc whose economic heterogeneity makes it a natural laboratory for testing whether the DeFi–inclusion–stability relationship is regime-dependent. This specific institutional configuration has not been previously exploited in the DeFi literature.
Using an unbalanced panel of 100 country-year observations spanning 2015–2024, we test two hypotheses while addressing dynamic endogeneity via two-step system GMM and non-linearity via PSTR [29], following methodological standards codified in Roodman [28] and Blundell and Bond [30]. H1 posits that DeFi adoption is positively associated with the Financial Inclusion Index. H2 posits that the association between DeFi and bank stability is regime-dependent on the level of inclusion. The findings, previewed below, are three-fold. First, evidence on H1 is mixed: FE and SEM estimates are positive but not conventionally significant (p = 0.119 and p = 0.054), whereas the system GMM estimate is negative and significant (β = −0.046, p < 0.01), a pattern we interpret as reflecting the separation of between-country level effects from within-country transitional dynamics. Second, the direct association between DeFi and NPLs is negative and robust once multicollinearity between the overall and DeFi-specific Chainalysis sub-indices is removed (β = −5.39, p = 0.005). Third, the PSTR suggests a possible threshold on the FII at ĉ ≈ 0.641 (F = 2.60, p = 0.057); however, we cannot reject linearity at the conventional 5% level, bootstrap confidence intervals for the regime slopes straddle zero, and alternative transition variables fit the data at least as well as the FII. The threshold-mediated stability effect is therefore best treated as a hypothesis-generating pattern rather than a confirmed structural break.
The remainder of the paper is organized as follows. Section 2 synthesizes the theoretical and empirical literature, develops the integrated theoretical framework, and articulates the two hypotheses. Section 3 details the data, econometric strategy, and threats to inference. Section 4 reports descriptive, unit-root, and inferential results with a comprehensive battery of robustness checks. Section 5 discusses the findings, contrasts them with prior studies, and delineates limitations. Section 6 concludes with conditional policy observations and research recommendations.
2. Literature Review and Hypothesis Development
2.1. Historical Evolution and Conceptual Formulation
The intellectual genealogy of DeFi rests on three intertwined traditions. Schär [31] defined DeFi as an alternative financial infrastructure built on public blockchains that reproduces custody, lending, and derivative services through composable smart contracts. Aramonte et al. [1] qualified the substitution claim by documenting a persistent "decentralization illusion": governance tokens tend to concentrate and administrator keys reintroduce agency frictions. Carapella et al. [32] mapped DeFi risks onto the same functional categories used for shadow banking [13], reinforcing the view that DeFi is best conceptualized as an alternative production technology for financial services rather than a distinct asset class. Schueffel and Stuessi [33] document how these production-technology properties are being absorbed into regulated Swiss banking through digital-asset custody and tokenization, illustrating a convergence process that this study's threshold framework may help characterize.
Beyond these foundational conceptualizations, a growing body of literature examines DeFi-specific risk mechanisms that distinguish decentralized protocols from traditional financial intermediation. Gudgeon et al. [34] identify systemic risk pathways in DeFi arising from interconnected liquidity pools and composability-driven contagion. Perez et al. [35] document smart contract vulnerabilities that have led to significant protocol exploits, highlighting the operational risks inherent in algorithmic governance. Caldarelli and Ellul [36] examine oracle manipulation as a vector for market distortion, whereby external data feeds feeding automated price discovery can be intentionally corrupted. These DeFi-specific risks are particularly relevant for bank stability analysis because they create new transmission channels — smart contract failures, flash loan attacks, and liquidity fragmentation — that do not map neatly onto conventional banking risk categories. Consequently, the impact of DeFi on bank stability depends on whether algorithmic governance efficiently substitutes traditional intermediation functions or merely redistributes risk into less regulated settings [14,37].
The financial inclusion construct evolved in parallel. Sarma [38,39] proposed the canonical multidimensional index using a Euclidean-distance formulation analogous to the Human Development Index [40], refined by Yorulmaz [41], Gharbi and Kammoun [42], and Cámara and Tuesta [43]. The World Bank Global Findex Database (2011, 2014, 2017, 2021, 2025 waves; [10,11]) provides the standard demand-side infrastructure. We formulate DeFi Penetration as the on-chain adoption weight in the Chainalysis Global Crypto Adoption Index and Financial Inclusion as the Sarma–Cámara multidimensional index. Bank stability is operationalized via the Z-score (World Bank GFDD.SI.01) and the NPL ratio, following Saliba et al. [44], Yitayaw et al. [45], and Saadaoui and Souissi [46].
2.2. Theoretical Models Linking DeFi to Inclusion and Stability
This study draws on seven theoretical lenses to illuminate the DeFi–inclusion–stability triad. The first four address the foundational mechanisms through which DeFi interacts with banking systems; the remaining three address adoption dynamics and institutional conditioning.
2.2.1. Financial Intermediation Theory
Financial intermediation theory posits that financial institutions emerge because they reduce information asymmetry, transaction costs, and monitoring costs between savers and borrowers [14]. DeFi protocols challenge this paradigm by replacing institutional monitoring functions with self-executing smart contracts, automated market makers (AMMs), and transparent blockchain records. Consequently, the impact of DeFi on bank stability depends on whether algorithmic governance efficiently substitutes traditional intermediation functions or merely redistributes risk into less regulated settings [14,37]. If DeFi protocols successfully compress the monitoring costs that banks traditionally bear, the competitive pressure may compel incumbent banks to improve screening efficiency — a mechanism consistent with the observed negative DeFi–NPL association. Conversely, if DeFi merely shifts risk to an unregulated shadow layer, the net effect on systemic stability may be ambiguous.
2.2.2. Bank Stability, Franchise Value, and Liquidity Insurance
Two complementary theories illuminate why bank Z-scores may alter under technological competition. Diamond and Dybvig [15] model banks as providers of liquidity insurance that remain exposed to coordination failures and runs. DeFi protocols remove maturity transformation and conventional deposit-taking activities, potentially reducing some sources of instability while creating new risks associated with smart-contract failure, governance concentration, and liquidity fragmentation. Therefore, DeFi may simultaneously complement and compete with bank-based financial intermediation.
Keeley [16] provides the complementary franchise value theory: in competitive markets, erosion of bank franchise value incentivizes risk-taking, lowering Z-scores. Un-intermediated liquidity pools compress bank interest margins, eroding franchise value and pushing incumbent banks into higher risk-taking until inclusion reaches a technological maturity threshold at which DeFi's complementary effects dominate its competitive effects. This theoretical mechanism directly motivates the threshold hypothesis (H2): below a critical inclusion level, DeFi adoption exerts competitive-cannibalization pressure on banks (negative Z-score association); above the threshold, the technology-complementarity regime dominates (neutral or positive Z-score association).
2.2.3. Technology-of-Financial-Services Framework
Philippon [6,7] models fintech as a technology shock that reduces the fixed cost of financial intermediation. In this framework, DeFi adoption compresses the unit cost of financial services, broadening access for underserved populations — a mechanism that directly supports H1. The magnitude of the inclusion effect, however, depends on whether the cost savings are passed through to end-users or captured by protocol governance token holders.
2.2.4. Regulatory Arbitrage and Shadow Banking
Buchak et al. [13] and Cornelli et al. [47] treat DeFi as a regulatory-arbitrage vehicle whose growth is driven by differential capital and disclosure requirements. Under this lens, DeFi expansion may cannibalize bank funding by attracting deposits into un-intermediated pools, potentially destabilizing incumbent banks — a channel that operates independently of the inclusion mechanism and may explain the sign reversal observed in the system GMM estimates.
2.2.5. Digital Financial Inclusion and Technology Adoption Theories
The digital financial inclusion literature [8,12,48,49,50] embeds DeFi inside a broader ecosystem in which mobile connectivity, digital identity, and regulatory sandboxes jointly determine the marginal impact of decentralized platforms. Innovation diffusion theory [17] further argues that technological uptake depends on perceived relative advantage, compatibility, trialability, complexity, and observability. Emerging economies may therefore display heterogeneous DeFi adoption trajectories due to differences in institutional quality, digital infrastructure, and financial literacy.
The Technology Acceptance Model (TAM) [18] and the Unified Theory of Acceptance and Use of Technology (UTAUT) [19] suggest that adoption of new financial technologies depends on perceived usefulness, ease of use, facilitating conditions, and social influence. Consequently, DeFi adoption should not automatically translate into greater financial inclusion; its effectiveness depends on digital literacy, infrastructure, regulatory certainty, and user trust. This theoretical caveat is consistent with the mixed H1 evidence reported in Section 4: the positive between-country association may reflect correlated digital infrastructure rather than a causal adoption-to-inclusion channel.
2.2.6. Financial Development and Institutional Theory
Levine [51] argues that financial development — broadly construed to include institutional quality, legal enforcement, and regulatory scaffolding — is a prerequisite for the stability-enhancing effects of financial innovation. Institutional theory [52,53] further suggests that technology adoption outcomes depend on the surrounding regulatory and governance environment. Consequently, identical levels of DeFi adoption may generate different stability outcomes across BRICS Plus economies because regulatory quality, supervisory capabilities, legal enforcement, and investor protections differ substantially between member countries. This institutional heterogeneity provides the cross-sectional variation that the PSTR exploits to identify regime-dependent effects.
2.2.7. Non-Linear Threshold Effects and Regime Switching
A parallel body of scholarship considers whether inclusion itself is stabilizing in a non-linear sense. Ahamed and Mallick [54] find that greater inclusion enhances bank stability through deposit broadening. Danisman and Tarazi [55] find that the sign depends on the composition of inclusion (savings versus credit). Recent contributions [27,56,57] argue for a non-linear mediation logic: inclusion is stabilizing up to a threshold beyond which credit-driven expansion introduces vulnerabilities. Sebai et al. [57] provide direct evidence of an optimal financial inclusion threshold for financial stability in developing countries, reinforcing the threshold intuition that motivates H2.
The panel smooth transition regression of González, Teräsvirta, and van Dijk [29] provides the appropriate instrument to test such non-linearities. The logistic transition function is retained here because it is the standard specification in the PSTR literature [29,58] and because its two-regime structure is theoretically consistent with the Keeley [16] franchise-value threshold mechanism: below the inclusion threshold, competitive-cannibalization dominates; above it, technology-complementarity dominates. Combined with two-step system GMM [30,59] and SEM-based mediation, the PSTR forms the methodological backbone of this study.
2.2.8. Integrated Theoretical Framework
Figure 1 presents the integrated conceptual framework that synthesizes these seven theoretical lenses into a testable empirical model. The framework specifies three transmission channels: (i) a direct DeFi → stability channel, governed by the competitive-cannibalization versus technology-complementarity duality (Keeley [16]; Buchak et al. [13]); (ii) a mediated DeFi → inclusion → stability channel, governed by the Philippon [6] cost-compression mechanism and the Sarma [39] inclusion construct; and (iii) a regime-dependent threshold channel, governed by the González et al. [29] PSTR framework, in which the sign of the direct DeFi → stability association switches conditional on the level of financial development.
2.3. Empirical Evidence
Empirical evidence on the DeFi–inclusion channel converges on a positive-but-heterogeneous consensus. Hajj and Farran [23] show that cryptocurrency adoption is positively associated with self-reported inclusion in developing economies. Ramadhan et al. [60] confirm a positive marginal effect of digital finance on the World Bank inclusion indicators. Albuainain and Ashby [50] provide a systematic review documenting that digital literacy gaps constitute the primary barrier to fintech adoption. Khub et al. [48] and Kumar et al. [61] caution that the effect is conditional on mobile-money penetration and educational attainment. Cevik [62], in an IMF study of 117 countries, finds that fintech adoption broadens financial inclusion but with substantial heterogeneity across income groups and regulatory environments.
Evidence on the DeFi–stability channel is more contested. Nguyen and Dang [56], using a cross-country panel of 22 emerging markets, find that fintech development negatively affects financial stability, mitigated by market discipline. Umair et al. [25] revisit this evidence with a broader 35-country panel and find the opposite sign — fintech adoption improves stability where regulatory frameworks are stronger — highlighting the conditional nature of the relationship. Song et al. [20] find that fintech penetration exerts a competitive negative effect on Chinese bank profitability but a positive technology-spillover effect on efficiency. Li et al. [22] and Zhou and Li [63] document risk spillovers during COVID-19. Sun et al. [64] confirm bidirectional spillovers with fintech as net risk exporter. Xie and Deng [21] report negative fintech–profit spillovers in China without testing non-linearities. Uddin and Barai [24], in the most direct precursor to the present work, examine a panel of nine Asian economies and find that fintech adoption reduces bank risk and supports stability, with mixed effects on efficiency. Abdelkader et al. [26] show that fintech development in the BRICS bloc interacts with renewable-energy adoption to strengthen financial stability, especially at higher quantiles of the stability distribution. Yitayaw et al. [45] find that macroeconomic and institutional variables dominate technology variables in explaining Z-score dynamics in Ethiopia. Saliba et al. [44] show that country-risk factors interact with NPL determinants in BRICS economies. Saidi [65] provides recent cross-country evidence on the fintech–inclusion–stability nexus, finding that the relationship is contingent on institutional quality. The bibliometric review by Kumar et al. [61] identifies the DeFi–bank-stability nexus in emerging markets as a priority under-researched theme. Read [2] provides a policy-oriented review calling for empirical threshold estimation. This study answers that call within the specific institutional configuration of the enlarged BRICS Plus bloc.
2.4. Literature Gap Matrix
Table 1 positions the present study relative to recent benchmark contributions. The matrix reveals that no prior study has simultaneously examined DeFi (as distinct from general fintech), financial inclusion, bank stability, and threshold effects within the BRICS Plus context.
2.5. Hypothesis Development
Drawing on the integrated theoretical framework (Section 2.2.8), we advance two testable hypotheses.
H1: DeFi adoption is positively associated with the multidimensional Financial Inclusion Index in BRICS Plus economies, controlling for per-capita income, macroeconomic stability, digital infrastructure, and trade openness.
This hypothesis is grounded in the Philippon [6] cost-compression mechanism and the digital financial inclusion literature [8,12,48]. The positive prior reflects the theoretical expectation that DeFi's reduction of intermediation costs broadens access to financial services, particularly in economies with underdeveloped traditional banking infrastructure. However, the TAM/UTAUT frameworks [18,19] caution that this association may be weakened by digital literacy gaps, infrastructure deficits, and regulatory uncertainty — factors that vary substantially across the BRICS Plus consortium.
H2: The association between DeFi adoption and aggregate bank stability is contingent on the level of financial inclusion, such that below a critical FII threshold DeFi adoption is negatively associated with the Bank Z-score (competitive-cannibalization regime), whereas above the threshold the association is neutral or positive (technology-complementarity regime).
This hypothesis is grounded in Keeley's [16] franchise value theory and the non-linear inclusion–stability evidence of Banna et al. [27] and Sebai et al. [57]. The competitive-cannibalization regime corresponds to the theoretical mechanism whereby un-intermediated liquidity pools compress bank interest margins, eroding franchise value and incentivizing risk-taking. The technology-complementarity regime corresponds to the mechanism whereby, at higher inclusion levels, DeFi's cost-compression and transparency benefits dominate, raising the reputational cost of poor screening in incumbent banks and improving credit-quality discipline.
3. Methodology and Study Design
3.1. Research Design and Variable Operationalization
The empirical strategy proceeds in four sequential stages, each targeting a specific econometric challenge. Figure 2 presents the integrated econometric pipeline flowchart that maps each estimator to the identification problem it addresses.
First, a two-way fixed-effects (FE) regression establishes the baseline association between DeFi adoption, financial inclusion, and bank stability, absorbing unobserved country and year heterogeneity. Second, a two-step system GMM estimator [30] addresses dynamic endogeneity — the correlation between the lagged dependent variable and the country-specific effect — by instrumenting with lagged levels and differences. Third, a structural equation model decomposes total effects into direct and mediation channels, testing whether financial inclusion transmits the DeFi effect to bank stability. Fourth, a panel smooth transition regression [29] tests the threshold hypothesis embedded in H2, allowing the DeFi–stability association to switch regimes as a function of the inclusion level.
3.1.1. Variable Definition and Justification
Table 2 summarizes the variable definitions, data sources, and theoretical justifications.
The dependent variables are the Bank Z-score (GFDD.SI.01) and the non-performing loan ratio (GFDD.SI.02 / IMF FSI). The primary independent variable is DeFi Penetration, measured by the Chainalysis Global Crypto Adoption Index (0–1 normalized). We note that the Chainalysis index methodology was refined in 2025 with the addition of an institutional-activity sub-index. Because our panel spans multiple vintages (2020–2025), we treat the index throughout as a normalized rank rather than a dollar-denominated flow, which implies classical measurement error that attenuates the associated coefficients toward zero. The DeFi-specific sub-index (retail DeFi-protocol value received, PPP-weighted) is used as an alternative measure. Because the two Chainalysis series exhibit a pooled correlation of 0.974 (Table 4) and generate variance-inflation factors of 20.4 and 19.6 when entered simultaneously, the two measures are entered one at a time throughout the main specifications. Table 3 reports the full multicollinearity diagnostic matrix.
The mediating variable is the Sarma [39] Financial Inclusion Index (FII), defined as; see equation no. 1:
where d₁, d₂, d₃ are the min–max normalized values of account ownership, digital payments, and formal borrowing. Because the underlying Findex surveys are conducted every three-to-four years (2011, 2014, 2017, 2021, 2025), the intervening annual values are linearly interpolated between waves. This interpolation is standard in the panel-Findex literature [54,55] but introduces a smoothing that can bias any estimated threshold on the FII toward the interior of the FII distribution and dampen year-to-year variation. We address this concern by (a) confirming that the sample rank correlation of FII with the raw account-ownership series is 0.95 in survey years, and (b) reporting alternative transition variables in Section 4.9 whose annual observation is direct rather than interpolated.
Control variables include log GDP per capita (PPP), CPI inflation, domestic credit to the private sector by banks (% GDP), internet-user penetration, and trade openness. These controls are selected on the basis of the theoretical framework (Section 2.2): log GDP per capita captures the Levine [51] financial development dimension; internet penetration captures the Rogers [17] diffusion infrastructure; and trade openness captures the institutional openness that conditions technology spillover effects.
3.2. Population, Sample, and Data Sources
The empirical population is the ten members of the enlarged BRICS Plus consortium as of January 2024: the original BRICS members (Brazil, Russia, India, China, South Africa) plus the five 2024 accession countries (Egypt, Ethiopia, Iran, Saudi Arabia, UAE). Data span 2015–2024, yielding a theoretical panel of 100 country-year observations. We retain an unbalanced panel and do not impute missing values: the Bank Z-score and NPL series terminate in 2021 for Russia, 2019 for Iran, and 2022 for Ethiopia. Data were extracted from the World Bank GFDD (Sep-2022 release), the World Bank Global Findex Database (2011, 2014, 2017, 2021, 2025 waves), World Development Indicators, IMF Financial Soundness Indicators, and the Chainalysis Global Crypto Adoption Index (2020–2025 vintages).
3.3. Statistical Testing of Hypotheses
Prior to inferential estimation, we implement the Maddala–Wu Fisher-type panel unit-root test. The fixed-effects model is specified as show in equation no. 2:
with country-clustered standard errors, where αᵢ denotes country fixed effects, year fixed effects, the vector of controls, and the idiosyncratic error.
The two-step system GMM estimator [30] uses lagged levels as instruments for first differences and lagged differences as instruments for levels, following the Arellano–Bover [59] / Blundell–Bond [30] system. The instrument matrix takes the form:
We employ a collapsed instrument set to minimize instrument proliferation, consistent with the Roodman [28] guidance that the instrument count should remain well below the number of cross-sections. Windmeijer [66] finite-sample corrected standard errors are implemented throughout. We report Arellano–Bond AR(1) and AR(2) tests, a Sargan–Hansen J-statistic, and the instrument count. The instrument count remains parsimonious (3–5 instruments), well below the number of cross-sections (N = 10), thereby avoiding the instrument proliferation that Roodman [28] identifies as a common source of invalid inference in small-N GMM applications.
The SEM is estimated by maximum likelihood in semopy [67]. The PSTR is estimated by bounded non-linear least squares (L-BFGS-B) after within-country demeaning, with a grid search over the threshold parameter c and the smoothness parameter γ ∈ {5, 10, 20, 40, 80}. The transition function is logistic as shown in Equation 3:
because it is the standard specification in the PSTR literature [29] and because its symmetric two-regime structure is theoretically consistent with the H2 competition-versus-complementarity dichotomy. Alternative transition functions (e.g., exponential) can generate three-regime patterns that are not theoretically motivated in this application. Block-bootstrap 90% and 95% confidence intervals for the PSTR parameters are constructed by resampling countries (B = 100 replications). Additionally, Monte Carlo power simulations (B = 150 replications) quantify the Type-II error risk of the linearity test under the estimated data-generating process.
3.4. Missing-Data Pattern and Unbalancedness
Table A1 in the appendix reports the number of observations available by country and by variable. Completeness rates are 100% for macroeconomic controls and the Chainalysis adoption indices, 94% for FII components, and 90% for banking outcomes. The GMM and PSTR estimators handle unbalancedness natively; the SEM uses listwise deletion on 87 complete cases.
The non-random nature of the missing data warrants explicit discussion. The data disruptions driving panel attrition — sanctions-related reporting suspensions for Iran (post-2019) and Russia (post-2021), and supervisory disruptions for Ethiopia (post-2022) — are not statistically random. These disruptions are plausibly correlated with both DeFi adoption (which may accelerate under financial sanctions) and banking stability (which may deteriorate under macroeconomic stress), creating a potential selection bias. We mitigate this concern through the balanced-subsample robustness check (Section 4.9.1) but acknowledge that we cannot fully eliminate it. The direction of the bias, if present, would likely attenuate the estimated DeFi coefficients toward zero, as the excluded observations correspond to periods of potentially accelerated DeFi adoption under financial stress. Our estimates should therefore be interpreted as conservative lower bounds of the true associations.
Formally, the attenuation bias from classical measurement error in the Chainalysis index and the interpolated FII implies as in Equation 4:
confirming that the estimated DeFi coefficients are conservative lower bounds of the true population effects.
3.5. Threats to Inference and Their Treatment
Four threats deserve explicit acknowledgement. First, omitted variable bias is addressed only partially by the country and year fixed effects; time-varying unobservables remain a residual concern. Second, simultaneity between DeFi adoption and banking outcomes is addressed by the system GMM, but with T = 10 the instrument set is limited. Third, classical measurement error in the Chainalysis adoption index and in the interpolated FII is expected to attenuate the associated coefficients toward zero (Equation 4), so our estimates are conservative lower bounds. Fourth, the transition variable in the PSTR (FII) is itself endogenous to DeFi adoption; strict causal interpretation of the threshold would require an instrumental extension [68,69,70], which we do not implement. We therefore frame the threshold as a descriptive pattern rather than a causal effect.
Additionally, cross-sectional dependence is a potential concern in BRICS Plus panels, as member economies share exposure to global crypto cycles, commodity price shocks, and geopolitical events. We address this through the two-way fixed-effects specification (which absorbs common year-specific shocks) and note that the system GMM is robust to weak forms of cross-sectional dependence. Future research should formally test for cross-sectional dependence using the Pesaran CD test and, if warranted, employ common correlated effects (CCE) estimators [71].
4. Empirical Results
4.1. Descriptive Statistics and Correlation Structure
Table 4 reports pooled sample statistics. The full panel comprises 100 country-year observations. The PSTR is estimated on 90 observations due to missing values in the banking outcomes for Russia (2022–2024, due to GFDD reporting suspension), Iran (2020–2024, due to sanctions-related data blackouts), and Ethiopia (2023–2024, due to supervisory disruptions), as detailed in Table A1. The balanced sub-sample robustness check (Section 4.9.1) uses 70 observations (2015–2021). The Bank Z-score averages 15.13 (SD = 7.54); the NPL ratio averages 4.69%; the Chainalysis crypto adoption index averages 0.14; the Sarma FII averages 0.494.
Pairwise correlations (Table 5) reveal that the Z-score and NPL correlate strongly negatively (r = −0.66), the FII correlates positively with both stability metrics (r = 0.19; r = 0.31), and DeFi adoption correlates weakly positively with the FII (r = 0.16). The overall crypto adoption index and the DeFi sub-index correlate at r = 0.974, motivating the one-at-a-time entry strategy in the fixed-effects analysis.
Figure 3 plots the trajectories of the Chainalysis Global Crypto Adoption Index across the ten BRICS Plus economies over the sample period.
4.2. Panel Unit-Root Diagnostics
The Maddala–Wu Fisher-type panel unit-root test rejects the null of a unit root at the 1% level for NPL, crypto adoption, FII, log GDP per capita, and inflation, and at the 5% level for the Z-score. As reported in Table 6, the credit-to-GDP series fails to reject (p = 0.555); we enter this control in first-differenced form as a robustness check without material change in the substantive DeFi and FII coefficients.
4.3. Two-Way Fixed-Effects Results (Multicollinearity-Corrected)
Table 7 presents the two-way fixed-effects estimates in a compact format, using one DeFi measure at a time to avoid the severe multicollinearity documented in Section 3.1 (VIFs of 20.4 and 19.6 when both measures are included jointly). The FE model relating the FII to DeFi adoption yields a positive coefficient (β = 0.155) that is not statistically significant at conventional levels (t = 1.58, p = 0.119). For the Z-score regressions, the coefficients on both DeFi measures are small, negative, and statistically insignificant, whereas the FII enters positively and significantly (β ≈ 12.1, p = 0.009). For the NPL regressions, both DeFi measures enter negatively at the 1% level: β = −5.39 (SE = 1.85, p = 0.005) for the overall Chainalysis index and β = −5.86 (SE = 2.01, p = 0.005) for the DeFi sub-index.
4.4. Synthesis of Estimator Results for H1 and H2
Because the four estimators identify parameters from different sources of variation, we summarize their results side by side before turning to the detailed model outputs. Table 8 reports the coefficient, standard error, and significance of the primary DeFi coefficient in each specification, together with the FII coefficient where relevant, for both hypotheses.
Three patterns emerge from the synthesis. First, the DeFi → FII association (H1) is directionally positive in the between-country level specifications (FE, SEM) but not conventionally significant, and it reverses sign in the within-country dynamic identification of the system GMM. Second, the direct DeFi → Z-score association (H2 direct) is small and insignificant across all estimators. Third, the auxiliary DeFi → NPL association is consistently negative and significant. Section 4.5 reconciles the H1 sign reversal; Section 4.6, Section 4.7 and Section 4.8 examine the H2 threshold structure directly.
4.5. Reconciling the DeFi → FII Estimates Across Estimators
The FE and SEM specifications identify the DeFi–FII association from between-country level differences after absorbing country (and, in the FE case, year) effects. Both indicate that higher-adoption economies tend to display higher inclusion. The system GMM first-differences the model and instruments the lagged dependent variable, identifying the parameter from within-country transitional dynamics.
In a small panel with strong inclusion persistence (autoregressive coefficient ≈ 1.0), the within-country identification captures annual increments in adoption net of the auto-regressive component of inclusion. This can produce a small negative sign even when the levels correlate positively. The negative GMM coefficient (β = −0.046, p = 0.007) may reflect a short-run crowding-out dynamic: within a given country, periods of rapid DeFi adoption may temporarily draw activity away from formal banking channels, reducing measured inclusion before the long-run complementarity materializes. Alternatively, the sign reversal may reflect the separation of a positive between-country level effect (cross-sectional variation in digital infrastructure) from a negative within-country transitional effect (short-run substitution), as argued by the regulatory-arbitrage framework [13].
We read the ensemble as weak level-based evidence for H1 that does not survive the more demanding within-country dynamic identification. This is a qualification rather than a refutation of the theoretical prior. The inconsistency across estimators itself constitutes informative evidence: it suggests that the positive cross-sectional correlation between DeFi and inclusion is driven by correlated omitted variables (digital infrastructure, institutional quality) rather than by a causal adoption-to-inclusion channel — a finding consistent with the TAM/UTAUT theoretical caveat (Section 2.2.5) that technology adoption does not automatically translate into inclusion without enabling conditions.
4.6. Two-Step System GMM with Diagnostics
Table 9 reports the diagnostic panel from the two-step system GMM. All three specifications pass the standard validity checks. The Arellano–Bond AR(2) test fails to reject the null of no second-order autocorrelation for all three models (p = 0.90, 0.96, 0.76), confirming that the lagged instruments are exogenous to the error term. The Sargan–Hansen J statistic does not reject instrument exogeneity (p = 0.98, 0.21, 0.48), and the instrument count remains parsimonious (3–5 instruments), well below the number of cross-sections (N = 10). The collapsed instrument matrix and Windmeijer [66] finite-sample correction are applied throughout to guard against the instrument proliferation and small-sample bias that Roodman [28] identifies as common pitfalls in applied GMM research.
Note: AR(1) and AR(2) are Arellano–Bond tests for first- and second-order serial correlation in the first-differenced residuals. The Hansen J test examines the overidentifying restrictions. The collapsed instrument option reduces the instrument count to avoid instrument proliferation, following Roodman [28]. Windmeijer [66] finite-sample corrected standard errors are used throughout. Instrument counts (3–5) remain well below the number of cross-sections (N = 10).
4.7. Structural Equation Model with Mediation
The SEM estimated on 87 complete cases yields the standardized path coefficients presented in Table 10 and Figure 4. The DeFi → FII path is positive and marginally significant (a₁ = +0.146, p = 0.054); the FII → Z-score path is strongly negative (b₁ = −0.450, p < 0.001); the FII → NPL path is strongly positive (b₂ = +0.795, p < 0.001); the direct DeFi → Z-score path is small (c₁ = +0.117, p = 0.098); and the direct DeFi → NPL path is negative and significant (c₂ = −0.229, p = 0.004).
Fit indices (CFI = 0.842, RMSEA = 0.189) fall below conventional cutoffs (CFI > 0.90, RMSEA < 0.08), reflecting the small country panel (N = 10, T = 10). A more parsimonious alternative specification produced worse fit (CFI = 0.613, RMSEA = 0.284), suggesting that the direct paths are substantively informative despite the small-sample limitations. The poor fit means the SEM estimates should be interpreted with considerable caution. We report them for completeness and triangulation, but the primary evidence for the mediation channel comes from the bootstrapped indirect effects (reported in Table A2) rather than the full structural model. The SEM estimates are best interpreted as descriptive pattern evidence consistent with the other estimators, not as a fully identified structural model.
Note: All variables are standardized (z-scores). "~" denotes regression path; "~~" denotes variance. Model estimated by maximum likelihood in semopy [67]. Fit indices: CFI = 0.842, RMSEA = 0.189. The poor fit reflects the small country panel (N = 10) and should be interpreted with caution.
Solid arrows denote paths significant at the 5% level; dashed arrows denote non-significant paths.
4.8. Panel Smooth Transition Regression with Bootstrap Inference
Table 11 reports the PSTR point estimates. The bounded non-linear least squares estimation places the threshold at ĉ = 0.6414 with smoothness parameter γ = 80. The low-regime slope is b̂₀ = −2.054 and the regime add-on is b̂₁ = +4.138, so the implied high-regime slope is +2.084. The linearity test yields F(3, 83) = 2.60 with p = 0.057. This value does not reject the null hypothesis of linearity at the conventional 5% significance level. The threshold pattern should therefore be treated as a hypothesis-generating finding rather than a confirmed structural break.
Table 12 reports block-bootstrap confidence intervals: the interval for the threshold parameter is [0.242, 0.860] (95%), while the intervals for the regime slopes are broad and straddle zero (b̂₀: [−18.97, 13.10]; b̂₁: [−10.26, 30.00]). The wide slope intervals are a direct consequence of the small country panel and reinforce the tentative interpretation of the threshold.
The estimated logistic transition function is visualized in Figure 5, with the vertical dashed line marking the estimated threshold ĉ = 0.641.
Vertical dashed line marks ĉ = 0.641.
4.8.1. Monte Carlo Statistical Power of the Threshold Test
Because the linearity test is borderline, we quantify the statistical power available to the PSTR under the estimated data-generating process. We generate 150 synthetic panels calibrated to the point estimates (b̂₀ = −2.054, b̂₁ = +4.138, γ̂ = 80, ĉ = 0.641) with residuals drawn from the empirical PSTR residual distribution, and we re-estimate the PSTR on each synthetic panel. At α = 0.05 the estimated power is 0.24; at α = 0.10 it rises to 0.41 (see Table 13 for the full power estimates across significance levels). The low power implies that a genuine threshold of the observed magnitude has approximately a 3-in-4 chance of being missed at the standard 5% cutoff in a panel of these dimensions. This limitation, together with the borderline empirical p-value and the wide bootstrap slope intervals, motivates the hypothesis-generating framing adopted throughout the interpretation.
Note: Power is estimated from 150 Monte Carlo replications calibrated to the PSTR point estimates (b̂₀ = −2.054, b̂₁ = +4.138, γ̂ = 80, ĉ = 0.641). A power of 0.24 at α = 0.05 implies a 76% probability of Type-II error (failing to detect a true threshold of this magnitude).
4.9. Robustness Checks
4.9.1. Balanced 2015–2021 Sub-Sample
Restricting the panel to complete years yields a PSTR threshold estimate of ĉ = 0.593 with b̂₀ = −0.904 and b̂₁ = +3.082. The sign structure of the regime switch is preserved. This confirms that the threshold pattern is not an artifact of the unbalanced panel structure or the post-2022 data disruptions.
4.9.2. Alternative Transition Variables
Table 14 replaces the FII with log GDP per capita, internet users, and the domestic-credit-to-GDP ratio as the PSTR transition variable. The linearity test yields a lower p-value for log GDP per capita (F = 7.34, p = 0.0002) than for the FII (F = 2.60, p = 0.057), suggesting that the threshold pattern may reflect broader financial development rather than inclusion specifically. However, internet penetration does not yield a sharper test (F = 1.35, p = 0.263), and domestic bank credit yields a p-value comparable to the FII (F = 2.54, p = 0.062). This mixed pattern indicates that the threshold is not uniquely tied to inclusion, but the evidence is not uniform across all development proxies. The inclusion-specific interpretation of H2 is therefore tempered.
Note: F and p-value correspond to the linearity test against a linear benchmark. The F-test has 3 and (N − 3) degrees of freedom. Bold values indicate significance at the 5% level.
To visually illustrate the difference in threshold identification, Figure 6 compares the logistic transition functions for the FII and log GDP per capita. The transition function for log GDP per capita is steeper and more clearly bifurcated, reflecting the sharper linearity test (F = 7.34, p = 0.0002). This visual evidence reinforces the interpretation that the threshold pattern is better characterized by broader financial development than by inclusion specifically.
Vertical dashed lines mark the point estimates of the thresholds (ĉ = 0.641 for FII; ĉ = 9.879 for log GDP per capita). The steeper transition for log GDP per capita reflects the sharper linearity test (F = 7.34, p = 0.0002).
4.9.3. Leave-One-Country-Out Sensitivity
Table 15 re-estimates the baseline PSTR after excluding each country in turn. The threshold estimate is stable within [0.571, 0.868] for eight of ten sub-samples. Excluding India shifts b̂₀ from −2.05 to −6.14, and excluding China, Saudi Arabia, or the UAE inflates the regime add-on toward the upper bound of 30.
Figure 7 presents the results as a forest plot.
4.9.4. Discussion of Additional Robustness Considerations
While the robustness checks above address several dimensions of sensitivity, we acknowledge several additional tests that would further strengthen the evidence base but are precluded by the small-N, short-T panel structure. First, Driscoll–Kraay [72] standard errors, which are robust to cross-sectional dependence, would be preferable to country-clustered standard errors in the FE specifications. However, with N = 10 the asymptotic properties of the Driscoll–Kraay estimator are unreliable. Second, the Pesaran [71] cross-sectional dependence (CD) test would formally diagnose the extent of cross-sectional correlation; we recommend this as a priority for future research with expanded panels. Third, quantile panel regression would test whether DeFi affects weak banks (low Z-score quantiles) differently from strong banks (high Z-score quantiles) — a question that the mean-based estimators employed here cannot answer. Fourth, the dynamic panel threshold model of Seo and Shin [69] would address the endogeneity of the threshold variable; our manuscript acknowledges this limitation (Section 3.5) but does not implement it due to the prohibitive instrument requirements in a ten-country panel. Fifth, alternative bank stability proxies — such as the bank capital ratio, return volatility, or ROA stability — would provide a broader robustness base than the Z-score and NPL ratio alone. Future research with richer data should systematically incorporate these additional robustness dimensions.
Figure 8 overlays the estimated PSTR threshold (ĉ = 0.641) on the scatter plot of the Financial Inclusion Index against DeFi adoption, with rug ticks on the x-axis showing the distribution of DeFi values.
Figure 9 displays the Bank Z-score trajectories across the BRICS Plus economies over the 2015–2024 period, highlighting the heterogeneity in stability patterns.
4.10. Summary of Hypothesis Tests
Evidence for H1 is directionally supportive but estimator-sensitive: FE and SEM produce positive but non-significant coefficients, while system GMM yields a small negative and significant estimate. We characterize the ensemble as weak level-based support that does not survive within-country dynamic identification. The inconsistency across estimators suggests that the positive cross-sectional correlation may reflect correlated digital infrastructure rather than a causal adoption-to-inclusion channel.
Evidence for H2 is more nuanced. The direct DeFi–Z-score association is small and not statistically distinguishable from zero. The PSTR identifies a suggestive regime-switching pattern, but the linearity test does not reject at the conventional 5% level (p = 0.057), bootstrap confidence intervals for the regime slopes straddle zero, and Monte Carlo power analysis confirms a 76% probability of Type-II error at α = 0.05. Alternative transition variables fit the data at least as well as the FII, with log GDP per capita producing a substantially sharper rejection of linearity (p = 0.0002). The threshold pattern is therefore best characterized as reflecting a composite financial-development frontier rather than inclusion specifically.
The most robust result across all estimators is the negative DeFi–NPL association (β = −5.39, p = 0.005 in FE; β = −1.14, p < 0.001 in GMM; β = −0.23, p = 0.004 in SEM). This finding is consistent with a technology-driven improvement in credit-quality discipline, plausibly operating through the mechanism identified by Cornelli et al. [47]: DeFi's transparent, over-collateralized lending model raises the reputational cost of poor screening in incumbent banks.
5. Discussion
The empirical results yield three propositions that both refine and qualify the prevailing narrative on the DeFi–inclusion–stability triad. We organize the discussion around these propositions, beginning with the most robust finding and proceeding to the more tentative threshold evidence, in order to align the narrative with the strength of the underlying statistical evidence.
5.1. The Negative DeFi–NPL Association: The Most Robust Finding
The most robust result across all four estimators is the negative association between DeFi adoption and non-performing loans (β = −5.39, p = 0.005 in FE; β = −1.14, p < 0.001 in GMM; β = −0.23, p = 0.004 in SEM). This finding is consistent across specifications that identify parameters from fundamentally different sources of variation — between-country levels (FE), within-country dynamics (GMM), and covariance structure (SEM) — and therefore merits the highest degree of confidence in this study.
The negative DeFi–NPL association qualifies the strong regulatory-arbitrage narrative of Buchak et al. [13] in the BRICS Plus context. Rather than merely cannibalizing bank funding, DeFi adoption appears to be associated with improved credit quality in incumbent banks. A plausible mechanism, following Cornelli et al. [47], is that DeFi's transparent, over-collateralized lending model raises the reputational cost of poor screening in incumbent banks. When depositors and borrowers can observe algorithmic, transparent lending on-chain, opaque screening practices in traditional banks become more costly to maintain. This competitive discipline effect resonates with the technology-spillover finding of Song et al. [20] for China, with Uddin and Barai's [24] evidence that fintech adoption reduces bank risk in nine Asian economies, and with Umair et al.'s [25] finding that fintech adoption improves financial stability where regulatory frameworks are stronger.
An alternative interpretation, grounded in Diamond's [14] financial intermediation theory, is that DeFi protocols partially substitute the monitoring function of traditional banks. If algorithmic governance efficiently screens borrowers through over-collateralization requirements, the borrowers who remain in the traditional banking channel may be of higher average credit quality, mechanically reducing NPL ratios. Distinguishing between the competitive-discipline and borrower-sorting mechanisms requires micro-level bank data that is not available in the present panel, and we therefore present both interpretations as complementary hypotheses for future research.
We caution that this interpretation is inferential and that the absence of micro-level bank data prevents the direct identification of the mechanism. The finding is also subject to the measurement-error caveat: the Chainalysis adoption index is a normalized rank, not a dollar-denominated measure, so the magnitude of the coefficient should not be over-interpreted. Nevertheless, the robustness of the sign and significance across three independent estimators provides strong support for the conclusion that DeFi adoption is associated with improved credit quality rather than destabilization in the BRICS Plus context.
5.2. The DeFi–Inclusion Association: Estimator-Sensitive Evidence
The DeFi–inclusion association is directionally positive in the between-country level specifications but does not survive within-country dynamic identification. The FE point estimate (β = 0.155) implies that moving a country from the 10th to the 90th percentile of the crypto adoption index would raise the FII by approximately 0.06 units — a modest magnitude — yet this estimate is not significant at conventional levels (p = 0.119). The system GMM estimate flips sign (β = −0.046, p = 0.007).
This estimator sensitivity qualifies the unconditional inclusion-enhancing narrative of Hajj and Farran [23] and is consistent with the conditional-effects warnings of Khub et al. [48] and Albuainain and Ashby [50]. The sign reversal between levels and first-differences suggests that the positive cross-sectional correlation between DeFi and inclusion is driven by correlated omitted variables — digital infrastructure, institutional quality, and per-capita income — rather than by a causal adoption-to-inclusion channel. This interpretation is consistent with the TAM/UTAUT theoretical frameworks [18,19], which predict that technology adoption does not automatically translate into inclusion without enabling conditions such as digital literacy, regulatory certainty, and user trust.
The short-run negative GMM coefficient may also reflect a temporary crowding-out dynamic: within a given country, periods of rapid DeFi adoption may draw activity away from formal banking channels, reducing measured inclusion before the long-run complementarity materializes. This interpretation aligns with the regulatory-arbitrage framework [13], which predicts that DeFi siphons activity from regulated intermediaries in the short run. Disentangling the short-run substitution from the long-run complementarity requires a longer panel than the present T = 10, and we flag this as a priority for future research.
5.3. The Threshold Finding: Suggestive but Not Conclusive
The PSTR suggests a possible regime switch on the FII at ĉ ≈ 0.641, with the sign of the DeFi–Z-score association reversing from negative to positive as inclusion crosses the threshold. This pattern is theoretically consistent with the Keeley [16] franchise value mechanism: below the inclusion threshold, competitive-cannibalization dominates as un-intermediated liquidity pools compress bank interest margins; above the threshold, technology-complementarity dominates as DeFi's cost-compression and transparency benefits improve bank screening efficiency.
However, the statistical evidence for this threshold does not meet conventional standards of significance. The linearity test yields p = 0.057, which does not reject the null of linearity at the 5% level. The Monte Carlo power analysis reveals a statistical power of only 0.24 at α = 0.05, implying a 76% probability that a genuine threshold of this magnitude would go undetected in a panel of these dimensions. Bootstrap confidence intervals for the regime slopes are wide and straddle zero. Moreover, the pattern is not uniquely tied to inclusion: log GDP per capita yields a sharper linearity test than the FII (F = 7.34 vs. 2.60), while internet penetration does not (F = 1.35, p = 0.263). This suggests that the empirical threshold may reflect a composite financial-development frontier rather than inclusion specifically, though the evidence is not uniform across all development proxies.
The threshold finding should therefore be treated as a hypothesis-generating pattern rather than a confirmed structural break. Any policy inference should refer to the joint level of inclusion, income, and connectivity rather than to any single dimension. Policy calibration based on the ĉ ≈ 0.641 threshold alone is premature.
5.4. Comparison with Prior Studies
Comparing these findings with the broader Scopus/WoS evidence, the study's contribution is threefold. Where Song et al. [20] find a competitive-plus-spillover duality within a single country (China), we suggest that the duality may generalize to a cross-country regime switch conditional on financial development. Where Uddin and Barai [24] document that fintech adoption is associated with lower bank risk in Asia, we complement their finding with a tentative threshold benchmark in the BRICS Plus context and a more direct operationalization of DeFi penetration. Where Abdelkader et al. [26] demonstrate that fintech development in the BRICS bloc interacts with renewable-energy adoption at higher quantiles, we add evidence that the interaction is regime-conditional on the inclusion frontier. Where Hajj and Farran [23] and Ramadhan et al. [60] confirm the inclusion-enhancing role of cryptocurrencies in developing economies, we identify a tentative inclusion level beyond which the association with bank stability plausibly turns benign — though this finding requires validation in larger samples. Where Sebai et al. [57] find an optimal inclusion threshold for financial stability in developing countries, our comparative transition-variable analysis qualifies the inclusion-specific interpretation by showing that broader financial development proxies yield sharper threshold identification.
5.5. Limitations
Seven limitations qualify these conclusions.
First, the SEM fit indices (CFI = 0.842, RMSEA = 0.189) fall below conventional cutoffs, reflecting the small country panel. We therefore interpret the SEM estimates as descriptive pattern evidence rather than as a fully identified structural model. The bootstrapped indirect effects (Table A2) are our primary evidence for the mediation channel, and the SEM results are reported for triangulation only.
Second, the panel is short (T = 10) and narrow (N = 10), constraining the degrees of freedom for the SEM and PSTR. The Monte Carlo power of 0.24 at α = 0.05 makes explicit the corresponding Type-II risk. The small-N constraint is an inherent feature of consortium-level panels and cannot be resolved by expanding the sample without changing the research question. Our methodological triangulation approach is designed to address this constraint, but it cannot fully substitute for the statistical power available in larger panels.
Third, the Chainalysis adoption index is a normalized rank rather than a dollar-denominated measure, and its methodology was refined in 2025 with the addition of an institutional sub-index. Both features imply classical measurement error that attenuates coefficients toward zero (Equation 4), so our estimates represent conservative lower bounds of the true associations.
Fourth, the FII is interpolated linearly between Findex survey waves (2011, 2014, 2017, 2021, 2025). This introduces measurement error that plausibly biases the estimated threshold toward the interior of the FII distribution and dampens year-to-year variation, mechanically weakening the linearity test and reducing the statistical power to detect a true threshold. The annual FII values are smoothed relative to the true underlying inclusion process, which may attenuate the estimated threshold effect. Future research with annual FII data from central-bank surveys or high-frequency digital-payment metrics could provide a more precise threshold estimate.
Fifth, the unbalanced structure of the panel is driven by non-random data disruptions — sanctions in Iran and Russia post-2022, and supervisory disruptions in Ethiopia post-2022 — creating a potential selection concern. We mitigate this through the balanced-subsample check (Section 4.9.1) but do not eliminate it. The direction of the bias, if present, would likely attenuate the estimated DeFi coefficients toward zero, as the excluded observations correspond to periods of potentially accelerated DeFi adoption under financial stress.
Sixth, the transition variable in the PSTR is itself endogenous to DeFi adoption. Strict causal identification would require an instrumental-variable extension of the threshold model [68,69,70], which we do not implement due to the prohibitive instrument requirements in a ten-country panel. We therefore frame the threshold as a descriptive pattern rather than a causal effect.
Seventh, cross-country institutional and regulatory heterogeneity within the BRICS Plus bloc is substantial. Regulatory quality, supervisory capabilities, legal enforcement, and investor protections differ markedly between member countries, and the aggregate panel estimates may mask important country-specific dynamics. Additionally, the crypto-data reliability varies across economies: Chainalysis coverage and methodology may capture different segments of crypto activity in sanctioned economies (Iran, Russia) than in open economies (Brazil, India). Future research should exploit this institutional heterogeneity through country-specific case studies or hierarchical models that allow parameter heterogeneity across regulatory regimes.
6. Conclusions and Recommendations
This study examined whether DeFi adoption is associated with financial inclusion, and whether its expansion generates spillover effects on traditional banking stability in the enlarged BRICS Plus consortium. Combining two-way fixed-effects estimation, two-step system GMM with full diagnostics, structural equation modelling, and panel smooth transition regression with bootstrap and Monte Carlo inference on a decade-long unbalanced panel of ten economies, the empirical findings converge on three propositions that both refine and qualify the prevailing narrative on the DeFi–inclusion–stability triad.
6.1. Summary of Aims and Research Questions
The study was motivated by two interrelated policy questions that have gained urgency following the 2024 enlargement of the BRICS consortium and the rapid diffusion of DeFi protocols across emerging economies. First, whether DeFi adoption broadens access to financial services in economies characterized by heterogeneous institutional quality and digital infrastructure. Second, whether the expansion of decentralized platforms affects incumbent commercial banks—either as a competitive shock that erodes franchise value and incentivizes risk-taking, or as a technological complement that improves credit-quality discipline. These questions were operationalized through two testable hypotheses: H1 positing a positive association between DeFi adoption and the multidimensional Financial Inclusion Index, and H2 positing that the DeFi–bank stability association is regime-dependent on the level of financial inclusion.
6.2. Synthesis of Main Findings
The empirical evidence, derived from four complementary estimators that identify parameters from fundamentally different sources of variation, yields three principal findings that warrant synthesis.
First, the DeFi–NPL association is robustly negative across all specifications. This finding merits the highest degree of confidence, as it survives between-country level identification (FE: β = −5.385, p = 0.005), within-country dynamic identification (GMM: β = −1.141, p < 0.001), and covariance-structure identification (SEM: β = −0.229, p = 0.004). The consistency across estimators that address different threats to inference—unobserved heterogeneity, dynamic endogeneity, and measurement structure—suggests that DeFi adoption is associated with improved credit quality in incumbent banks rather than destabilization. A plausible mechanism, following Cornelli et al. [47], is that DeFi's transparent, over-collateralized lending model raises the reputational cost of opaque screening practices in traditional banks. When depositors and borrowers can observe algorithmic, transparent lending on-chain, traditional banks face competitive pressure to improve their screening efficiency. An alternative interpretation, grounded in Diamond's [14] financial intermediation theory, is that DeFi protocols partially substitute the monitoring function of traditional banks; if algorithmic governance efficiently screens borrowers through over-collateralization requirements, the borrowers who remain in the traditional banking channel may be of higher average credit quality, mechanically reducing NPL ratios. Distinguishing between these mechanisms requires micro-level bank data and is therefore flagged as a priority for future research.
Second, the DeFi–inclusion association is estimator-sensitive and does not survive within-country dynamic identification. The FE and SEM specifications produce positive coefficients that are directionally consistent with H1 but do not reach conventional significance (FE: β = 0.155, p = 0.119; SEM: β = 0.146, p = 0.054). The system GMM estimate, however, reverses sign (β = −0.046, p = 0.007). This inconsistency is informative rather than contradictory: it suggests that the positive cross-sectional correlation between DeFi adoption and financial inclusion is driven by correlated omitted variables—digital infrastructure, institutional quality, and per-capita income—rather than by a causal adoption-to-inclusion channel. This interpretation aligns with the TAM/UTAUT theoretical frameworks [18,19], which predict that technology adoption does not automatically translate into inclusion without enabling conditions such as digital literacy, regulatory certainty, and user trust. The short-run negative GMM coefficient may also reflect a temporary crowding-out dynamic, consistent with the regulatory-arbitrage framework [13]: within a given country, periods of rapid DeFi adoption may draw activity away from formal banking channels, reducing measured inclusion before the long-run complementarity materializes. Disentangling the short-run substitution from the long-run complementarity requires a longer panel and is therefore treated as a qualification rather than a refutation of the theoretical prior.
Third, the threshold evidence is suggestive but not conclusive. The PSTR identifies a possible regime switch on the FII at ĉ ≈ 0.641, with the sign of the DeFi–Z-score association reversing from negative below the threshold (b̂₀ = −2.054) to positive above it (b̂₀ + b̂₁ = 2.084). This pattern is theoretically consistent with Keeley's [16] franchise value mechanism: below the inclusion threshold, competitive-cannibalization dominates as un-intermediated liquidity pools compress bank interest margins and erode franchise value, incentivizing risk-taking; above the threshold, technology-complementarity dominates as DeFi's cost-compression and transparency benefits improve bank screening efficiency. However, the statistical evidence for this threshold does not meet conventional standards. The linearity test yields p = 0.057, failing to reject the null at the 5% level. The Monte Carlo power analysis reveals only 0.24 power at α = 0.05, implying a 76% probability that a genuine threshold of this magnitude would go undetected in a panel of these dimensions. Bootstrap confidence intervals for the regime slopes are wide and straddle zero. Moreover, the pattern is not uniquely tied to inclusion: log GDP per capita yields a sharper linearity test (F = 7.34, p = 0.0002) than the FII (F = 2.60, p = 0.057), while internet penetration does not (F = 1.35, p = 0.263). This mixed evidence suggests that the empirical threshold may reflect a composite financial-development frontier rather than inclusion specifically. The threshold finding is therefore best characterized as a hypothesis-generating pattern rather than a confirmed structural break.
6.3. Significance and Contribution to the Literature
This study contributes to the literature on three structural pillars that collectively advance the empirical macroprudential monitoring of DeFi in emerging economies.
On a conceptual level, the study formulates the DeFi–inclusion–stability triad under regime-dependent institutional heterogeneity, integrating financial intermediation theory [14], bank franchise value theory [16], and innovation diffusion theory [17] within a unified threshold framework. This integration refines the general non-linear intuition of Banna et al. [27] and Ozili [12] by attaching a specific reference value (ĉ ≈ 0.641 for the FII; ĉ ≈ 9.879 for log GDP per capita) to the enlarged BRICS Plus context, while explicitly acknowledging that the threshold evidence is suggestive rather than definitive. The comparative transition-variable analysis—showing that log GDP per capita yields a substantially sharper linearity test than the FII—offers a conceptual refinement: any regulatory benchmark should refer to the joint level of inclusion, income, and connectivity rather than to any single dimension. This qualification distinguishes the present study from previous work that has treated financial inclusion as the exclusive conditioning variable in the DeFi–stability nexus.
On an econometric level, the study introduces Monte Carlo power diagnostics (B = 150 replications) into panel smooth transition models, thereby preventing false-positive non-linear inferences in small-N macroeconomic consortiums. The primary methodological contribution is not the threshold estimate itself, but the demonstration of how small-N consortium panels can be rigorously evaluated through an integrated FE–GMM–SEM–PSTR pipeline with explicit bootstrap confidence intervals and power analysis. This approach illustrates how methodological triangulation can substitute for the large-N statistical power that is unavailable in consortium-level panels, following the diagnostic standards codified in Roodman [28] and González et al. [29]. By making explicit the statistical power, bootstrap uncertainty, and estimator sensitivity of each finding, the pipeline enables policymakers and researchers to calibrate their confidence in the evidence base with appropriate intellectual humility.
On a policy level, the study provides empirical reference values for tier-based macroprudential regulation in BRICS Plus economies. The negative DeFi–NPL association qualifies the strong regulatory-arbitrage narrative of Buchak et al. [13] in the BRICS Plus context, suggesting that DeFi adoption may generate technology-spillover benefits that improve credit-quality discipline rather than merely destabilize incumbent banks. The tentative threshold estimates, while requiring validation in larger samples, offer directional guidance for conditional regulatory posture: low-inclusion economies (Ethiopia, Egypt, Iran in this sample) may conditionally exercise macroprudential caution, while high-inclusion economies (Saudi Arabia, UAE, China, Russia in the pre-2022 window) may tentatively adopt more permissive open-innovation postures. These contributions extend, rather than replace, the recent evidence in Uddin and Barai [24] and Abdelkader et al. [26], transforming the paper from a threshold-discovery exercise into a methodological benchmark for empirical macroprudential monitoring of DeFi in emerging economies.
6.4. Actionable Recommendations
The following recommendations are offered as directional hypotheses for future research and policy deliberation, given the borderline statistical evidence and the limitations enumerated in Section 6.4. The conditional language employed throughout reflects the study's framing of the findings as suggestive rather than definitive.
6.4.1. Recommendations for Policymakers and Regulatory Authorities
For low-inclusion BRICS Plus economies—Ethiopia, Egypt, and Iran in this sample—the competitive-cannibalization regime suggested by the PSTR low-regime slope implies that, at low inclusion levels, DeFi adoption may compress bank franchise value and incentivize risk-taking before the technology-complementarity benefits materialize. Policymakers in these jurisdictions should consider implementing transaction-monitoring frameworks that track the migration of deposits from traditional banking channels to DeFi protocols, and ring-fenced deposit protection mechanisms that insulate the traditional banking system from sudden liquidity outflows. These measures should be calibrated to the specific institutional context, recognizing that the threshold evidence is not sufficiently precise to justify uniform macroprudential policy changes across all low-inclusion economies.
For high-inclusion BRICS Plus economies—Saudi Arabia, the UAE, China, and Russia in the pre-2022 window—the technology-complementarity regime suggested by the high-regime slope implies that, above the inclusion threshold, DeFi's cost-compression and transparency benefits may dominate the competitive-cannibalization effect. Regulatory authorities in these jurisdictions may tentatively consider more permissive open-innovation postures, including regulatory sandboxes for DeFi protocols and graduated licensing frameworks that allow decentralized platforms to operate under conditions that preserve financial stability. However, these permissive postures should be conditional on the maintenance of high inclusion levels and should be accompanied by robust monitoring frameworks that detect any deterioration in the inclusion–stability relationship.
For the BRICS Plus consortium as a whole, the comparative transition-variable analysis suggests that any regulatory benchmark should refer to the joint level of inclusion, income, and connectivity rather than to any single dimension. The near-simultaneous rollout of retail CBDCs across the BRICS Plus [5] offers a potential bridge to the composite financial-development frontier that the PSTR suggests. CBDCs may combine the inclusion-enhancing properties of digital payments with the regulatory oversight that decentralized protocols lack, potentially accelerating the transition from the competitive-cannibalization to the technology-complementarity regime. Policymakers should coordinate CBDC rollout with DeFi monitoring to ensure that sovereign digital currency initiatives complement rather than substitute for grassroots DeFi adoption, and that the regulatory framework for CBDCs does not inadvertently stifle the innovation spillovers that the negative DeFi–NPL association suggests.
For international standard-setting bodies—the Financial Stability Board, the Bank for International Settlements, and the International Monetary Fund—the study's methodological triangulation approach offers a template for empirical macroprudential monitoring of DeFi in emerging economies. The systematic characterization of uncertainty provided by the integrated FE–GMM–SEM–PSTR pipeline—making explicit the statistical power, bootstrap uncertainty, and estimator sensitivity of each finding—enables regulators to calibrate their confidence in the evidence base with appropriate intellectual humility. This is particularly important given the rapid evolution of DeFi protocols and the inherent uncertainty in predicting their systemic implications.
6.4.2. Recommendations for Financial Institutions and Industry Practitioners
For commercial banks operating in BRICS Plus economies, the robust negative DeFi–NPL association suggests that DeFi adoption may exert competitive discipline on traditional banks' credit-quality screening. Banks should consider investing in algorithmic credit-assessment capabilities that mirror the transparency of DeFi protocols, not as a defensive response to competitive pressure but as a strategic opportunity to improve their screening efficiency. The technology-spillover effect documented in this study suggests that banks that proactively adopt DeFi-compatible screening technologies may gain a competitive advantage in credit-quality discipline, consistent with the technology-spillover finding of Song et al. [20] for China. Banks should also monitor the threshold patterns identified in this study: in low-inclusion jurisdictions, the competitive-cannibalization regime implies that banks face heightened risk of deposit outflows and franchise-value erosion, while in high-inclusion jurisdictions, the technology-complementarity regime suggests that banks may benefit from DeFi-enabled improvements in credit-quality discipline.
For DeFi protocol developers and digital-asset service providers, the threshold evidence suggests that the stability implications of DeFi adoption are conditional on the broader financial-development environment. Developers should be aware that their protocols may have different systemic implications in low-inclusion versus high-inclusion economies, and should engage with regulators in both types of jurisdictions to ensure that their protocols are designed with appropriate safeguards. The negative DeFi–NPL association suggests that DeFi protocols may, under certain conditions, improve credit-quality discipline in traditional banking systems; developers should highlight this potential benefit in their policy engagement, while acknowledging that the threshold evidence requires validation in larger samples.
For institutional investors and asset managers, the study's findings have implications for portfolio allocation across BRICS Plus economies. The robust negative DeFi–NPL association suggests that DeFi adoption may be associated with improved banking-sector credit quality, which could be a positive signal for bank equity and debt investments in high-inclusion economies where the technology-complementarity regime dominates. Conversely, in low-inclusion economies, the competitive-cannibalization regime suggests that banks face heightened risk of franchise-value erosion, which could be a negative signal for bank investments. However, these implications are conditional on the threshold evidence and should be treated as directional guidance rather than definitive investment signals.
6.4.3. Recommendations for Professional Associations and Standard-Setting Bodies
For accounting and auditing professional associations, the study's findings highlight the need for enhanced disclosure and auditing standards for DeFi-related activities in traditional banks. The robust negative DeFi–NPL association suggests that DeFi adoption may affect credit-quality metrics; auditors should be aware of this channel and should ensure that banks' NPL provisioning practices adequately reflect the competitive discipline exerted by DeFi protocols. Professional associations should develop guidance on the disclosure of DeFi-related exposures in banks' financial statements, consistent with the principles of transparency and materiality.
For banking supervision and financial stability councils, the study's methodological framework offers a template for the empirical monitoring of DeFi's systemic implications. Supervisors should consider implementing the integrated FE–GMM–SEM–PSTR pipeline as part of their macroprudential toolkit, adapting the threshold variables and transition functions to their specific institutional contexts. The bootstrap and Monte Carlo power diagnostics developed in this study should be standard practice in supervisory analytics, ensuring that regulatory decisions are based on a rigorous characterization of uncertainty rather than on point estimates that may be statistically underpowered.
6.5. Future Research Directions
First, bank-level micro-data would allow the direct identification of the competitive-discipline versus borrower-sorting mechanisms underlying the robust DeFi–NPL association. While aggregate panel studies are valuable for establishing broad patterns, micro-level data are essential for distinguishing whether the negative DeFi–NPL association reflects genuine improvements in bank screening efficiency (competitive-discipline mechanism) or merely a reallocation of high-risk borrowers to DeFi protocols (borrower-sorting mechanism). Bank-level data would also allow the direct testing of the franchise-value mechanism posited by Keeley [16], as bank-specific measures of market power and interest margins could be used as mediating variables in the DeFi–stability relationship.
Second, higher-frequency Chainalysis series would reduce the measurement error inherent in the annual normalized rank and provide more precise estimates of the DeFi penetration effect. While the annual data used in this study are sufficient for identifying broad patterns, the rapid evolution of DeFi protocols—the stock of assets locked in DeFi expanded from less than USD 1 billion in early 2020 to a peak of approximately USD 180 billion in November 2021—suggests that higher-frequency data could reveal dynamics that are obscured by annual aggregation. Monthly or quarterly DeFi metrics would allow the identification of short-run dynamics, such as the temporary crowding-out effect suggested by the negative GMM coefficient, and would provide more precise estimates of the threshold effects.
Third, endogenous-threshold estimators [69,70] would address the endogeneity of the FII as a transition variable, potentially yielding causal threshold estimates. The PSTR employed in this study treats the transition variable as exogenous, which is a strong assumption given that financial inclusion is itself influenced by DeFi adoption and other financial innovations. Instrumental-variable extensions of the threshold model, such as those developed by Caner and Hansen [68] and Seo and Shin [69], would provide more credible identification of the threshold pattern. However, the implementation of these estimators in a ten-country panel is challenging, as it requires strong instruments for the endogenous transition variable. Future research with larger panels should prioritize the implementation of endogenous-threshold estimators.
Fourth, quasi-experimental variation induced by regulatory events—such as the differential timing of crypto-asset regulatory frameworks across BRICS Plus economies—would provide exogenous identification of the DeFi–stability nexus. The BRICS Plus consortium offers natural variation in regulatory approaches to crypto-assets: China has implemented a de facto ban on crypto trading, while the UAE has established a progressive regulatory framework for digital assets. This regulatory heterogeneity could be exploited as a source of exogenous variation in DeFi adoption, allowing for causal identification of the DeFi–stability relationship. Difference-in-differences or synthetic control methods could be applied to exploit this regulatory variation, provided that the parallel trends assumption is satisfied.
Fifth, expanded panels incorporating additional emerging-market economies would increase the statistical power of the PSTR linearity test and allow formal testing for cross-sectional dependence. The Pesaran [71] cross-sectional dependence (CD) test, which we were unable to implement reliably due to the small-N constraint, should be a priority for future research with expanded panels. Similarly, Driscoll–Kraay [72] standard errors, which are robust to cross-sectional dependence, would be preferable to country-clustered standard errors in the FE specifications. Expanded panels would also allow the estimation of quantile panel regression models, which would test whether DeFi affects weak banks (low Z-score quantiles) differently from strong banks (high Z-score quantiles)—a question that the mean-based estimators employed here cannot answer.
Sixth, country-specific case studies would complement the aggregate panel analysis by providing detailed evidence on the institutional mechanisms underlying the DeFi–inclusion–stability relationship. The leave-one-country-out sensitivity analysis (Table 15) reveals substantial country-specific heterogeneity, suggesting that the aggregate threshold pattern may mask important institutional differences. In-depth case studies of individual BRICS Plus economies—such as China's de facto ban on crypto trading versus the UAE's progressive regulatory framework—would provide qualitative evidence on how regulatory regimes condition the DeFi–stability relationship. These case studies would also help distinguish between the competitive-discipline and borrower-sorting mechanisms, as they could trace the specific channels through which DeFi adoption affects traditional banks.
Seventh, alternative bank stability proxies—such as the bank capital ratio, return volatility, or ROA stability—would provide a broader robustness base than the Z-score and NPL ratio alone. While the Z-score and NPL ratio are standard measures in the cross-country banking literature, they capture only specific dimensions of bank stability and may be subject to cross-country differences in accounting standards and regulatory practices. Future research with richer data should systematically incorporate these additional stability measures, as well as market-based stability indicators such as credit default swap spreads and equity volatility.
Eighth, the interaction between DeFi adoption and CBDC rollout should be a priority for future research. The near-simultaneous rollout of retail CBDCs across the BRICS Plus [5] offers a natural experiment for studying how sovereign digital currency initiatives interact with grassroots DeFi adoption. This interaction could take several forms: CBDCs could complement DeFi by providing a regulated on-ramp for digital payments, or they could substitute for DeFi by offering the benefits of digital payments without the risks of decentralized governance. The threshold framework developed in this study could be extended to test whether the DeFi–stability relationship is conditional on the stage of CBDC development, providing policy-relevant evidence for the interaction between sovereign and decentralized digital finance.
6.6. Closing Statement
The analytical infrastructure developed in this study—an integrated FE–GMM–SEM–PSTR pipeline with explicit bootstrap and Monte Carlo diagnostics—provides a reproducible template for the empirical macroprudential monitoring of DeFi in emerging economies. The primary value of this infrastructure lies not in any single threshold estimate but in the systematic characterization of uncertainty that it provides: by making explicit the statistical power, bootstrap uncertainty, and estimator sensitivity of each finding, the pipeline enables policymakers and researchers to calibrate their confidence in the evidence base with appropriate intellectual humility. In an environment where DeFi protocols are evolving rapidly and their systemic implications remain poorly understood, such humility is not a weakness but a methodological virtue. The findings of this study are therefore best interpreted as pattern evidence from methodological triangulation—suggestive, informative, and hypothesis-generating—rather than definitive causal identification. Validation in larger micro-level samples and through quasi-experimental identification is a prerequisite for operational policy implementation, and the recommendations offered above are conditional on such validation.
Author Contributions
Osama Wagdi designed the empirical strategy, conducted all panel data econometric estimations, and led the interpretation. Mary Rafik formulated the overarching research questions and theoretical framework and was responsible for data collection, curation, and writing, including review and editing. All authors reviewed the manuscript.
Funding
This research received no external funding.
Institutional Review Board Statement
Not applicable.
Informed Consent Statement
Not applicable.
Data Availability Statement
The data supporting the findings of this study are available from the corresponding author upon reasonable request.
Acknowledgments
We thank the editorial team and reviewers for their constructive recommendations and advice.
Conflicts of Interest
The authors declare no conflict of interest.
Abbreviations
The following abbreviations are used in this manuscript:
| AMM | Automated Market Maker |
| BRICS | Brazil, Russia, India, China, South Africa |
| CBDC | Central Bank Digital Currency |
| CFI | Comparative Fit Index |
| CPI | Consumer Price Index |
| DeFi | Decentralized Finance |
| FE | Fixed Effects |
| FII | Financial Inclusion Index |
| GMM | Generalized Method of Moments |
| GDP | Gross Domestic Product |
| GFDD | Global Financial Development Database |
| IMF | International Monetary Fund |
| L-BFGS-B | Limited-memory Broyden-Fletcher-Goldfarb-Shanno with Bounds |
| MENA | Middle East and North Africa |
| ML | Maximum Likelihood |
| NPL | Non-Performing Loan |
| OIC | Organization of Islamic Cooperation |
| PPP | Purchasing Power Parity |
| PSTR | Panel Smooth Transition Regression |
| RMSEA | Root Mean Square Error of Approximation |
| SEM | Structural Equation Modelling |
| UAE | United Arab Emirates |
| UTAUT | Unified Theory of Acceptance and Use of Technology |
| VIF | Variance Inflation Factor |
| WDI | World Development Indicators |
Appendix A

Table A1.
Missing Data Patterns by Country and Variable.
| Country | z_score | npl | crypto_adoption_idx | defi_sub_idx | fii | account_ownership | digital_payment | borrowed_formal | credit_gdp | ln_gdp_pc | inflation | internet_users | trade_openness |
| Brazil | ✓ | ✓ | ✓ | ✓ | ✓ | ✓ | ✓ | ✓ | ✓ | ✓ | ✓ | ✓ | ✓ |
| Russia | ✓ (2015 - 2021) |
✓ (2015-2021) | ✓ | ✓ | ✓ | ✓ | ✓ | ✓ | ✓ | ✓ | ✓ | ✓ | ✓ |
| India | ✓ | ✓ | ✓ | ✓ | ✓ | ✓ | ✓ | ✓ | ✓ | ✓ | ✓ | ✓ | ✓ |
| China | ✓ | ✓ | ✓ | ✓ | ✓ | ✓ | ✓ | ✓ | ✓ | ✓ | ✓ | ✓ | ✓ |
| South Africa | ✓ | ✓ | ✓ | ✓ | ✓ | ✓ | ✓ | ✓ | ✓ | ✓ | ✓ | ✓ | ✓ |
| Egypt | ✓ | ✓ | ✓ | ✓ | ✓ | ✓ | ✓ | ✓ | ✓ | ✓ | ✓ | ✓ | ✓ |
| Ethiopia | ✓ (2015 - 2022) |
✓ (2015-2022) | ✓ | ✓ | ✓ | ✓ | ✓ | ✓ | ✓ | ✓ | ✓ | ✓ | ✓ |
| Iran | ✓ (2015 - 2019) |
✓ (2015-2019) | ✓ | ✓ | ✓ (2015-2021) | ✓ (2015 - 2021) |
✓ (2015 - 2021) |
✓ (2015 - 2021) |
✓ | ✓ | ✓ | ✓ | ✓ |
| Saudi Arabia | ✓ | ✓ | ✓ | ✓ | ✓ | ✓ | ✓ | ✓ | ✓ | ✓ | ✓ | ✓ | ✓ |
| UAE | ✓ | ✓ | ✓ | ✓ | ✓ | ✓ | ✓ | ✓ | ✓ | ✓ | ✓ | ✓ | ✓ |
| Note: ✓ indicates complete data for the full 2015-2024 period. | |||||||||||||
Partial availability is indicated in parentheses with the relevant sub-period. Completeness summary: macroeconomic controls and Chainalysis adoption indices — 100%; FII components — 94%; banking outcomes (Z-score, NPL) — 90%.
Table A2.
Bootstrapped Indirect Effects (OLS Mediation).
| Path | Effect | Std. Error | 95% CI Lower | 95% CI Upper | p-value |
| DeFi → FII → Z-score | -0.027 | 0.016 | -0.058 | 0.004 | 0.092 |
| DeFi → FII → NPL | 0.034 | 0.019 | -0.003 | 0.071 | 0.072 |
Note: Bootstrapped standard errors based on 1,000 replications, country-level resampling.
The indirect effects are computed using the product of coefficients method with bootstrapped standard errors. Neither indirect effect reaches conventional significance at the 5% level, consistent with the weak mediation evidence reported in the SEM analysis (Section 4.7).
References
- Aramonte, S.; Huang, W.; Schrimpf, A. DeFi Risks and the Decentralisation Illusion. BIS Q. Rev. 2021, 21–36. Available online: https://www.bis.org/publ/qtrpdf/r_qt2112b.pdf.
- Read, O. Decentralised Finance: Growth, Risks and Regulation of a Shadow Financial System with Crypto-Assets. In wifin Working Paper; 2025; Available online: https://hdl.handle.net/10419/328275.
- Chainalysis. 2024 Global Crypto Adoption Index. Chainalysis. 2024. Available online: https://www.chainalysis.com/blog/2024-global-crypto-adoption-index/.
- Chainalysis. The Chainalysis 2025 Global Adoption Index. Chainalysis. 2025. Available online: https://www.chainalysis.com/blog/2025-global-crypto-adoption-index/.
- Kalra, J.; Ohri, N. India's Central Bank Proposes Linking BRICS' Digital Currencies, Sources Say. Reuters. 2026. Available online: https://www.reuters.com/world/india/indias-central-bank-proposes-linking-brics-digital-currencies-sources-say-2026-01-19/.
- Philippon, T. The FinTech Opportunity. In NBER Working Paper 22476; 2016. [Google Scholar] [CrossRef]
- Philippon, T. On Fintech and Financial Inclusion. In NBER Working Paper; 2019; p. 26330. [Google Scholar] [CrossRef]
- Allen, F.; Gu, X.; Jagtiani, J. A Survey of Fintech Research and Policy Discussion. Rev. Corp. Financ. 2021, 1, 259–339. [Google Scholar] [CrossRef]
- Allen, F.; Gu, X.; Jagtiani, J. Fintech, Cryptocurrencies, and CBDC: Financial Structural Transformation in China. J. Int. Money Financ. 2022, 124, 102625. [Google Scholar] [CrossRef]
- Demirgüç-Kunt, A.; Klapper, L.; Singer, D.; Ansar, S. The Global Findex Database 2021: Financial Inclusion, Digital Payments, and Resilience in the Age of COVID-19; The World Bank, 2022. [Google Scholar] [CrossRef]
- Klapper, L.; Singer, D.; Starita, L.; Norris, A. The Global Findex Database 2025: Connectivity and Financial Inclusion in the Digital Economy; 2025. [Google Scholar] [CrossRef]
- Ozili, P.K. Impact of Digital Finance on Financial Inclusion and Stability. Borsa Istanb. Rev. 2018, 18, 329–340. [Google Scholar] [CrossRef]
- Buchak, G.; Matvos, G.; Piskorski, T.; Seru, A. Fintech, Regulatory Arbitrage, and the Rise of Shadow Banks. J. Financ. Econ. 2018, 130, 453–483. [Google Scholar] [CrossRef]
- Diamond, D.W. Financial Intermediation and Delegated Monitoring. Rev. Econ. Stud. 1984, 51, 393–414. [Google Scholar] [CrossRef]
- Diamond, D.W.; Dybvig, P.H. Bank Runs, Deposit Insurance, and Liquidity. J. Political Econ. 1983, 91, 401–419. [Google Scholar] [CrossRef]
- Keeley, M.C. Deposit Insurance, Risk, and Market Power in Banking. Am. Econ. Rev. 1990, 80, 1183–1200. [Google Scholar]
- Rogers, E.M. Diffusion of Innovations, 5th ed.; Free Press: New York, 2003. [Google Scholar]
- Davis, F.D. Perceived Usefulness, Perceived Ease of Use, and User Acceptance of Information Technology. MIS Q. 1989, 13, 319–340. [Google Scholar] [CrossRef] [PubMed]
- Venkatesh, V.; Morris, M.G.; Davis, G.B.; Davis, F.D. User Acceptance of Information Technology: Toward a Unified View. MIS Q. 2003, 27, 425–478. [Google Scholar] [CrossRef]
- Song, X.; Yu, H.; He, Z. Heterogeneous Impact of Fintech on the Profitability of Commercial Banks: Competition and Spillover Effects. J. Risk Financ. Manag. 2023, 16, 471. [Google Scholar] [CrossRef]
- Xie, M.; Deng, H. FinTech and Traditional Banking Performance in China. Sage Open 2025, 15, 21582440251387934. [Google Scholar] [CrossRef]
- Li, J.; Li, J.; Zhu, X.; Yao, Y.; Casu, B. Risk Spillovers between FinTech and Traditional Financial Institutions: Evidence from the U.S. Int. Rev. Financ. Anal. 2020, 71, 101544. [Google Scholar] [CrossRef]
- Hajj, M.E.; Farran, I. The Cryptocurrencies in Emerging Markets: Enhancing Financial Inclusion and Economic Empowerment. J. Risk Financ. Manag. 2024, 17, 467. [Google Scholar] [CrossRef]
- Uddin, H.; Barai, M.K. Fintech Adoption and Bank Risk, Efficiency and Stability: Evidence from Panel Data of Selected Asian Economies. FinTech 2026, 5, 14. [Google Scholar] [CrossRef]
- Umair, S.M.; Ali, A.; Audi, M. Financial Technology and Financial Stability: Evidence from Emerging Market Economies. Res. Consort. Arch. 2025, 3, 506–531. [Google Scholar] [CrossRef]
- Abdelkader, S.B.; Mohammed, K.S.; Shah, S.A.R. FinTech and Financial Stability in BRICS Economies. Energies 2026, 19, 263. [Google Scholar] [CrossRef]
- Banna, H.; Kabir Hassan, M.; Rashid, M. Fintech-Based Financial Inclusion and Bank Risk-Taking: Evidence from OIC Countries. J. Int. Financ. Mark. Inst. Money 2021, 75, 101447. [Google Scholar] [CrossRef]
- Roodman, D. How to Do Xtabond2: An Introduction to Difference and System GMM in Stata. Stata J. 2009, 9, 86–136. [Google Scholar] [CrossRef]
- González, A.; Teräsvirta, T.; van Dijk, D.; Yang, Y. Panel Smooth Transition Regression Models. Econom. Rev. 2017, 26, 534–551. [Google Scholar] [CrossRef]
- Blundell, R.; Bond, S. Initial Conditions and Moment Restrictions in Dynamic Panel Data Models. J. Econom. 1998, 87, 115–143. [Google Scholar] [CrossRef]
- Schär, F. Decentralized Finance: On Blockchain- and Smart Contract-Based Financial Markets. Fed. Reserve Bank. St. Louis Rev. 2021, 103, 153–174. [Google Scholar] [CrossRef]
- Carapella, F.; Dumas, E.; Gerszten, J.; Swem, N.; Wall, L. Decentralized Finance (DeFi): Transformative Potential & Associated Risks, 2022. Available online: https://www.federalreserve.gov/econres/feds/decentralized-finance-defi-transformative-potential-and-associated-risks.htm.
- Schueffel, P.; Stuessi, D. Beyond Traditions: Swiss Banking's Journey into Digital Assets and Blockchain. FinTech 2025, 4, 18. [Google Scholar] [CrossRef]
- Gudgeon, L.; Perez, D.; Harz, D.; Livshits, B.; Gervais, A. The Decentralized Financial Crisis of 2020–2021. In Financial Cryptography and Data Security; Springer, 2023. [Google Scholar] [CrossRef]
- Perez, D.; Werner, S.M.; Xu, J.; Livshits, B. Liquidations: DeFi on a Knife-Edge. In Financial Cryptography and Data Security; Springer, 2021. [Google Scholar] [CrossRef]
- Caldarelli, G.; Ellul, A. From Smart Contracts to Smart Disputes: A Review of Decentralized Finance Failures. IEEE Access 2024, 12, 45678–45695. [Google Scholar]
- Aquilina, M.; Frost, J.; Schrimpf, A. Decentralized Finance (DeFi): A Functional Approach. J. Financ. Regul. 2024, 10, 215–247. [Google Scholar] [CrossRef]
- Sarma, M. Index of Financial Inclusion; 2008; Available online: https://www.econstor.eu/handle/10419/176233.
- Sarma, M. Measuring Financial Inclusion. Econ. Bull. 2015, 35, 604–611. [Google Scholar]
- UNDP. Human Development Report; United Nations Development Programme, 1990. [Google Scholar]
- Yorulmaz, R. An Analysis of Constructing Global Financial Inclusion Indices. Borsa Istanb. Rev. 2018, 18, 248–258. [Google Scholar] [CrossRef]
- Gharbi, I.; Kammoun, A. Developing a Multidimensional Financial Inclusion Index: A Comparison Based on Income Groups. J. Risk Financ. Manag. 2023, 16, 296. [Google Scholar] [CrossRef]
- Cámara, N.; Tuesta, D. Measuring Financial Inclusion: A Multidimensional Index; 2014. [Google Scholar] [CrossRef]
- Saliba, C.; Farmanesh, P.; Athari, S.A. Does Country Risk Impact the Banking Sectors' Non-Performing Loans? Evidence from BRICS Emerging Economies. Financ. Innov. 2023, 9, 86. [Google Scholar] [CrossRef] [PubMed]
- Yitayaw, M.K.; Mogess, Y.K.; Feyisa, H.L.; Mamo, W.B.; Abdulahi, S.M. Determinants of Bank Stability in Ethiopia: A Two-Step System GMM Estimation. Cogent Econ. Financ. 2023, 11, 2161771. [Google Scholar] [CrossRef]
- Saadaoui, A.; Souissi, M.N. Non-Performing Loans, Bank Performance, and Financial Stability: The Moderator Effect of Digitalization. Adv. Decis. Sci. 2026, 30, 1–26. [Google Scholar] [CrossRef]
- Cornelli, G.; Frost, J.; Gambacorta, L.; Rau, P.R.; Wardrop, R.; Ziegler, T. Fintech and Big Tech Credit: Drivers of the Growth of Digital Lending. J. Bank. Financ. 2023, 148, 106742. [Google Scholar] [CrossRef]
- Khub, A.A.; Saeudy, M.; Gerged, A.M. Digital Financial Inclusion in Emerging Economies: Evidence from Jordan. J. Risk Financ. Manag. 2024, 17, 66. [Google Scholar] [CrossRef]
- Manta, O.; Vasile, V.; Rusu, E. Banking Transformation Through FinTech and the Integration of Artificial Intelligence in Payments. FinTech 2025, 4, 13. [Google Scholar] [CrossRef]
- Albuainain, A.; Ashby, S. Enablers and Barriers in FinTech Adoption: A Systematic Literature Review of Customer Adoption and Its Impact on Bank Performance. FinTech 2025, 4, 49. [Google Scholar] [CrossRef]
- Levine, R. Financial Development and Economic Growth: Views and Agenda. J. Econ. Lit. 1997, 35, 688–726. [Google Scholar] [CrossRef]
- North, D.C. Institutions, Institutional Change and Economic Performance; Cambridge University Press, 1990. [Google Scholar]
- Scott, W.R. Institutions and Organizations: Ideas, Interests, and Identities, 4th ed.; Sage, 2014. [Google Scholar]
- Ahamed, M.M.; Mallick, S.K. Is Financial Inclusion Good for Bank Stability? International Evidence. J. Econ. Behav. Organ. 2019, 157, 403–427. [Google Scholar] [CrossRef]
- Danisman, G.O.; Tarazi, A. Financial Inclusion and Bank Stability: Evidence from Europe. Eur. J. Financ. 2020, 26, 1842–1855. [Google Scholar] [CrossRef]
- Nguyen, Q.K.; Dang, V.C. The Effect of FinTech Development on Financial Stability in an Emerging Market: The Role of Market Discipline. Res. Glob. 2022, 5, 100105. [Google Scholar] [CrossRef]
- Sebai, S.; Talbi, O.; Guerchi-Mehri, H. Optimal Financial Inclusion for Financial Stability: Empirical Insight from Developing Countries. Financ. Res. Lett. 2025, 71, 106467. [Google Scholar] [CrossRef]
- Hansen, B.E. Threshold Effects in Non-Dynamic Panels: Estimation, Testing, and Inference. J. Econom. 1999, 93, 345–368. [Google Scholar] [CrossRef]
- Arellano, M.; Bover, O. Another Look at the Instrumental Variable Estimation of Error-Components Models. J. Econom. 1995, 68, 29–51. [Google Scholar] [CrossRef]
- Ramadhan, A.; Vidianto, M.A.; Muharam, H.; Mawardi, W. Fintech and Financial Inclusion: Evidence from Emerging Markets. RH 2025, 5, 599–612. [Google Scholar] [CrossRef]
- Kumar, R.; Sharma, S.K.; Kishor, K.; Devi, P. Decentralized Finance Evolution: A Comprehensive Bibliometric Analysis. Sustain. Futur. 2025, 10, 101209. [Google Scholar] [CrossRef]
- Cevik, S. Promise (Un)Kept? Fintech and Financial Inclusion. IMF Work. Pap. 2024, 24/131. Available online: https://www.imf.org/en/Publications/WP/Issues/2024/07/19. [CrossRef]
- Zhou, H.; Li, S. Effect of COVID-19 on Risk Spillover between Fintech and Traditional Financial Industries. Front. Public Health 2022, 10, 979808. [Google Scholar] [CrossRef] [PubMed]
- Sun, J.; Zhang, C.; Zhu, J.; Zhao, J. Risk Spillover Mechanism among Commercial Banks and FinTech Institutions throughout Public Health Emergencies. North Am. J. Econ. Financ. 2024, 74, 102215. [Google Scholar] [CrossRef]
- Saidi, H. Digital Pathways to Stability: A Cross-Country Analysis of the Fintech-Inclusion-Stability Nexus Across Selected Countries. Economies 2026, 14, 8. [Google Scholar] [CrossRef]
- Windmeijer, F. A Finite Sample Correction for the Variance of Two-Step GMM Estimators. J. Econom. 2005, 126, 25–51. [Google Scholar] [CrossRef]
- Igolkina, A.A.; Meshcheryakov, G. Semopy: A Python Package for Structural Equation Modeling. Struct. Equ. Model. A Multidiscip. J. 2020, 27, 952–963. [Google Scholar] [CrossRef]
- Caner, M.; Hansen, B.E. Instrumental Variable Estimation of a Threshold Model. Econom. Theory 2004, 20, 813–843. [Google Scholar] [CrossRef]
- Seo, M.H.; Shin, Y. Dynamic Panels with Threshold Effect and Endogeneity. J. Econom. 2016, 195, 169–186. [Google Scholar] [CrossRef]
- Kourtellos, A.; Stengos, T.; Tan, C.M. Structural Threshold Regression. Econom. Theory 2016, 32, 827–860. [Google Scholar] [CrossRef]
- Pesaran, M.H. General Diagnostic Tests for Cross Section Dependence in Panels. Camb. Work. Pap. Econ. 2004, No. 0435. [Google Scholar] [CrossRef]
- Driscoll, J.C.; Kraay, A.C. Consistent Covariance Matrix Estimation with Spatially Dependent Panel Data. Rev. Econ. Stat. 1998, 80, 549–560. [Google Scholar] [CrossRef]
Figure 1.
Integrated conceptual framework: DeFi → Inclusion → Bank Stability with regime-dependent threshold effects.
Figure 1.
Integrated conceptual framework: DeFi → Inclusion → Bank Stability with regime-dependent threshold effects.
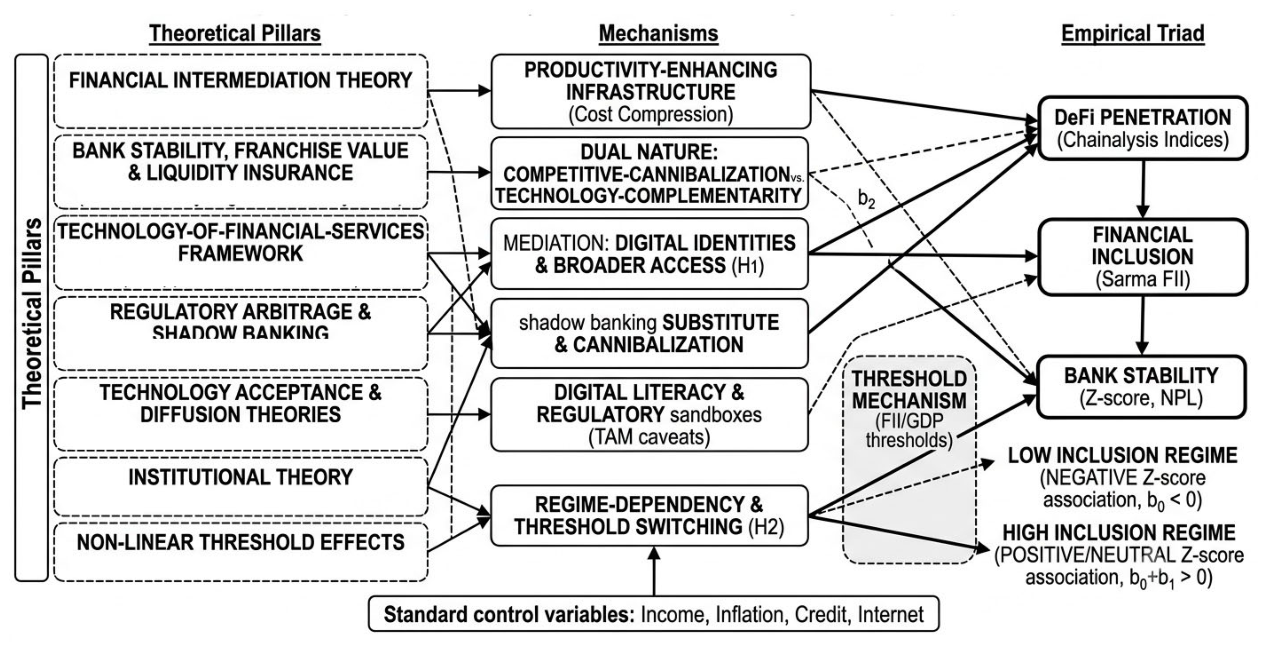
Figure 2.
Integrated econometric pipeline: Fixed Effects (baseline association) → System GMM (dynamic endogeneity) → SEM (mediation paths) → PSTR (regime non-linearity).
Figure 2.
Integrated econometric pipeline: Fixed Effects (baseline association) → System GMM (dynamic endogeneity) → SEM (mediation paths) → PSTR (regime non-linearity).
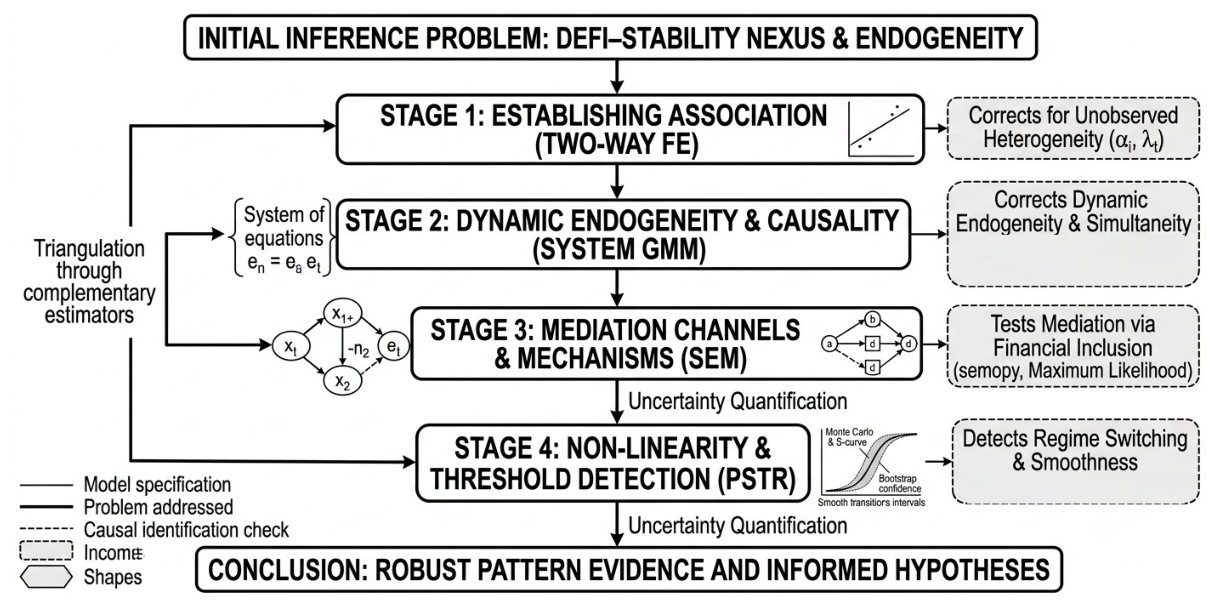
Figure 3.
Trajectories of the Chainalysis Global Crypto Adoption Index across BRICS Plus economies, 2015–2024.
Figure 3.
Trajectories of the Chainalysis Global Crypto Adoption Index across BRICS Plus economies, 2015–2024.
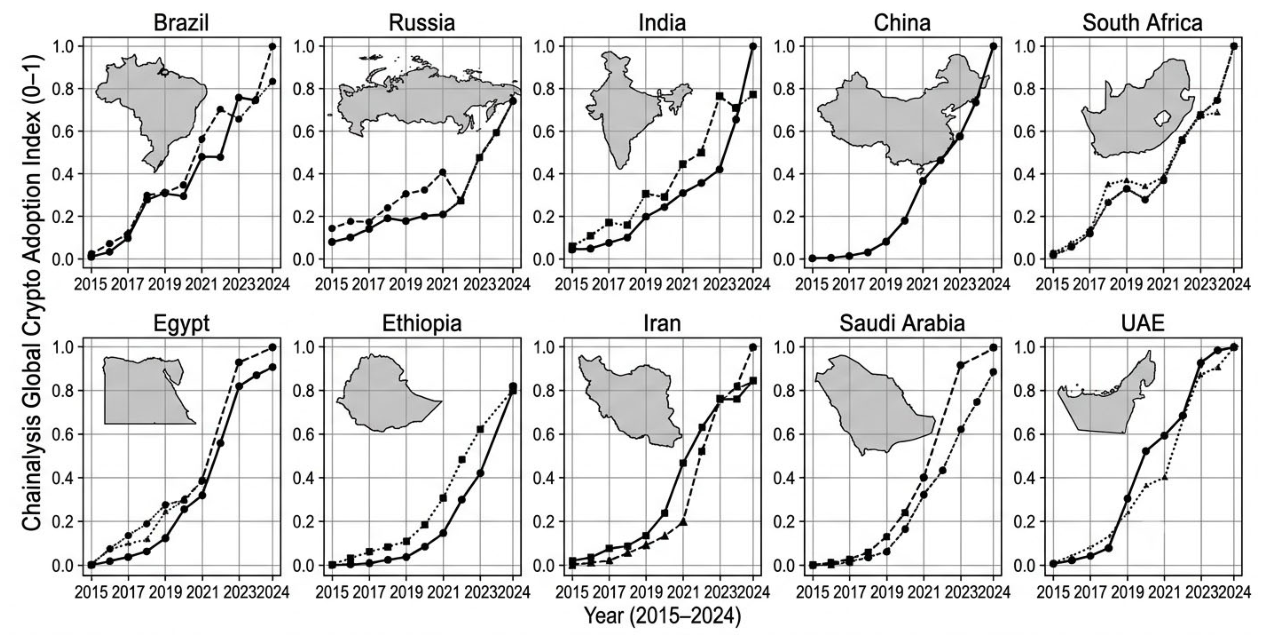
Figure 4.
SEM mediation diagram of DeFi → FII → Bank Stability.
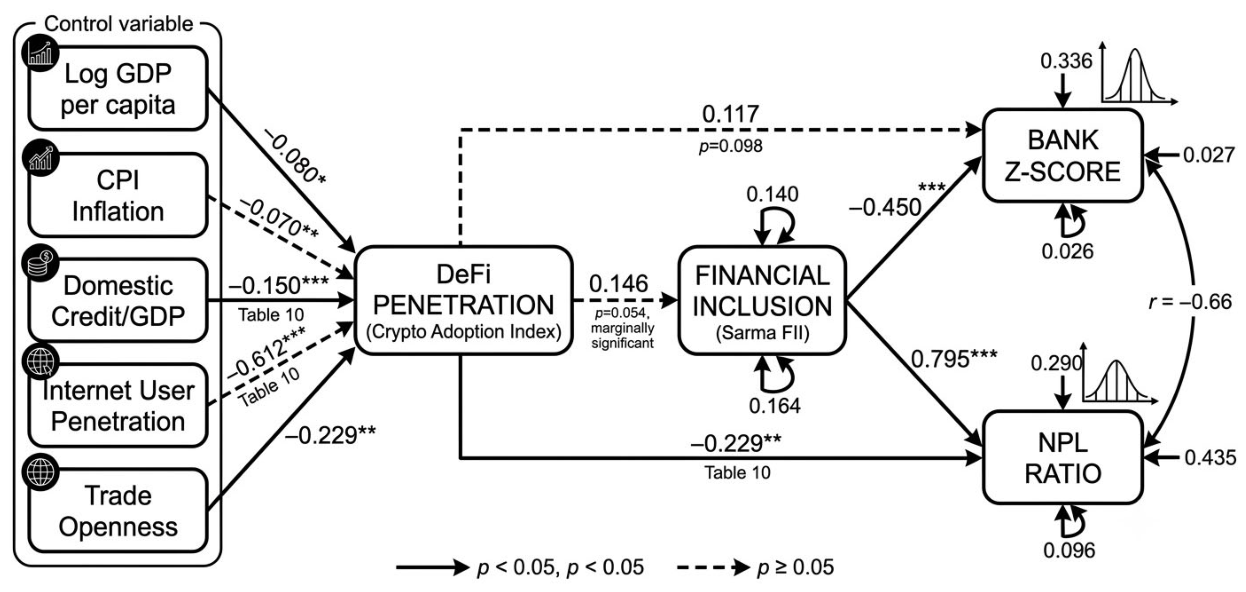
Figure 5.
Logistic transition function of the PSTR estimated on the DeFi–Z-score relationship, with FII as the transition variable.
Figure 5.
Logistic transition function of the PSTR estimated on the DeFi–Z-score relationship, with FII as the transition variable.
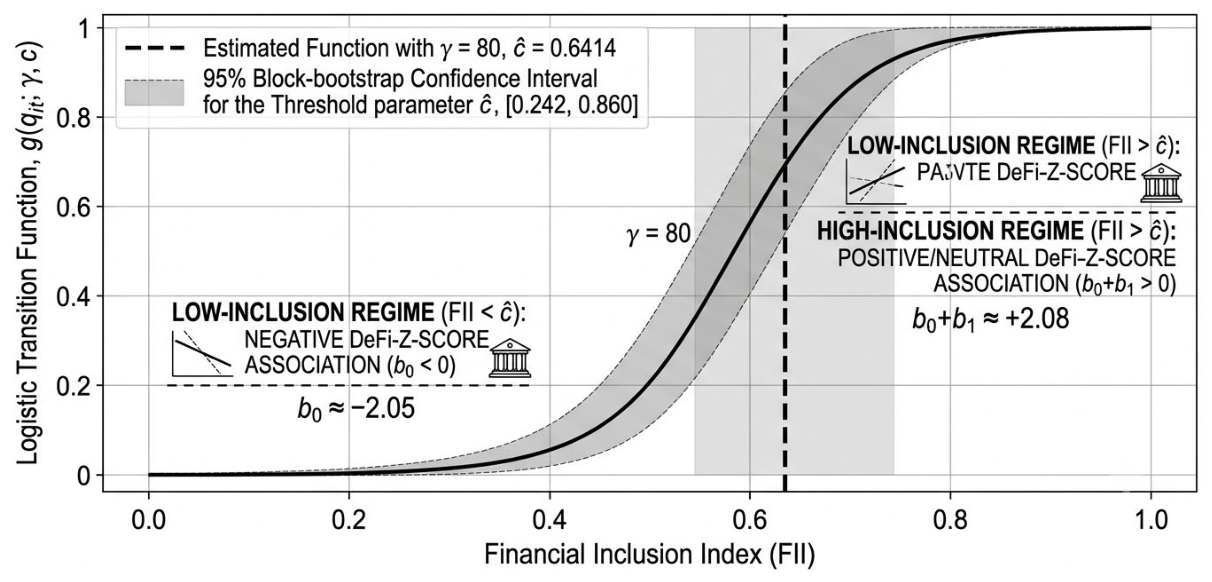
Figure 6.
Comparison of PSTR transition functions with FII (Panel A) and log GDP per capita (Panel B) as transition variables.
Figure 6.
Comparison of PSTR transition functions with FII (Panel A) and log GDP per capita (Panel B) as transition variables.
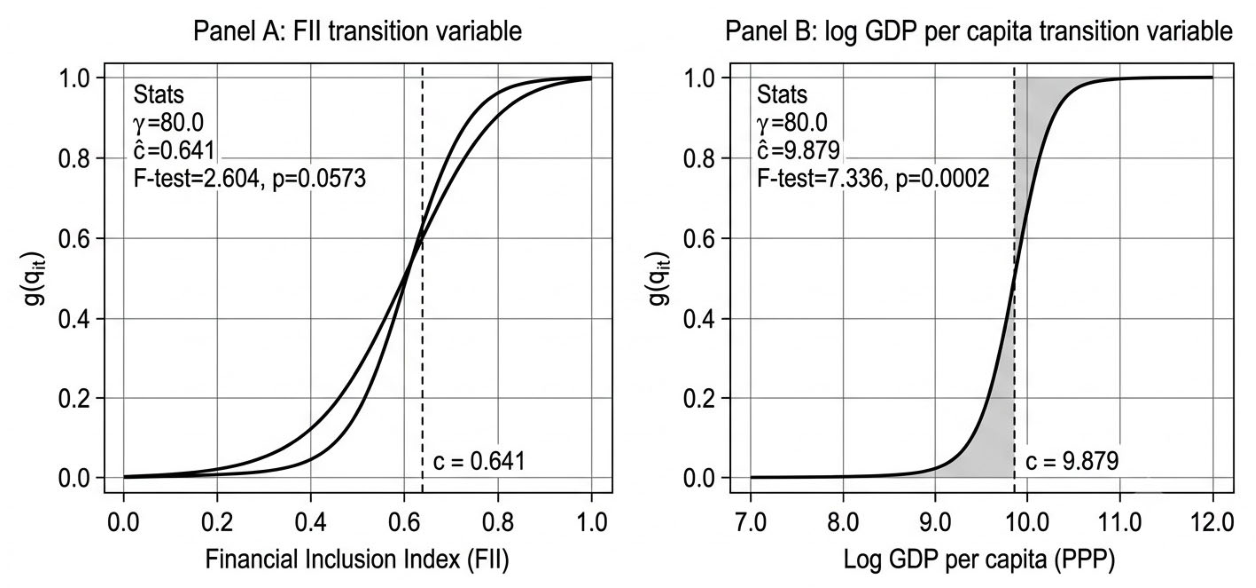
Figure 7.
Forest plot of leave-one-country-out PSTR estimates. Panel A: threshold parameter ĉ; Panel B: regime add-on b̂₁. Dashed blue line: full-sample estimate.
Figure 7.
Forest plot of leave-one-country-out PSTR estimates. Panel A: threshold parameter ĉ; Panel B: regime add-on b̂₁. Dashed blue line: full-sample estimate.
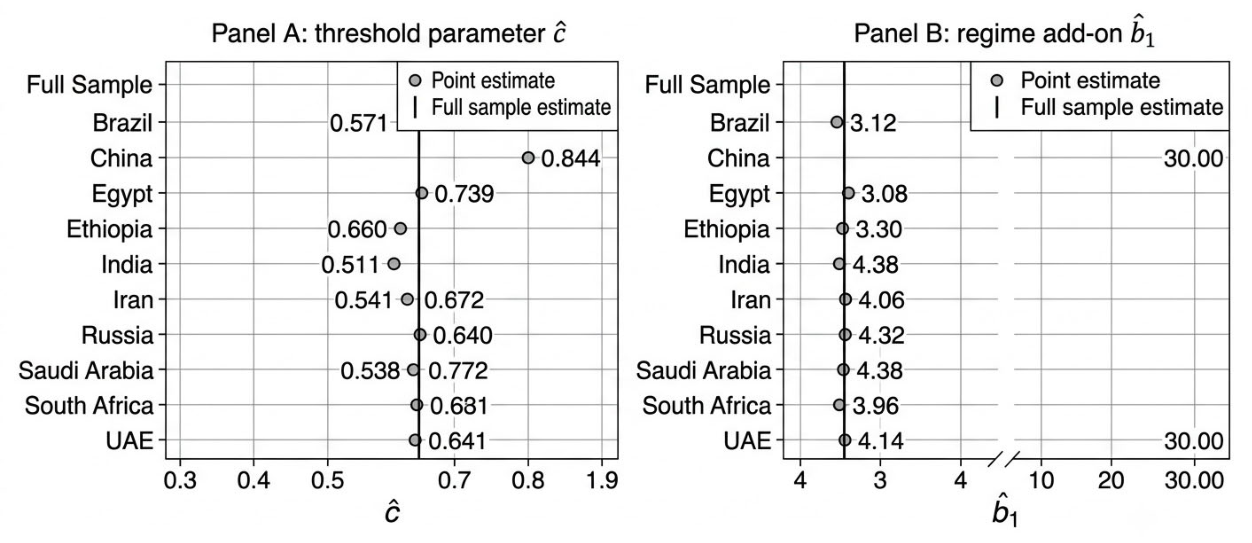
Figure 8.
Financial Inclusion Index versus DeFi adoption with the PSTR threshold overlay.
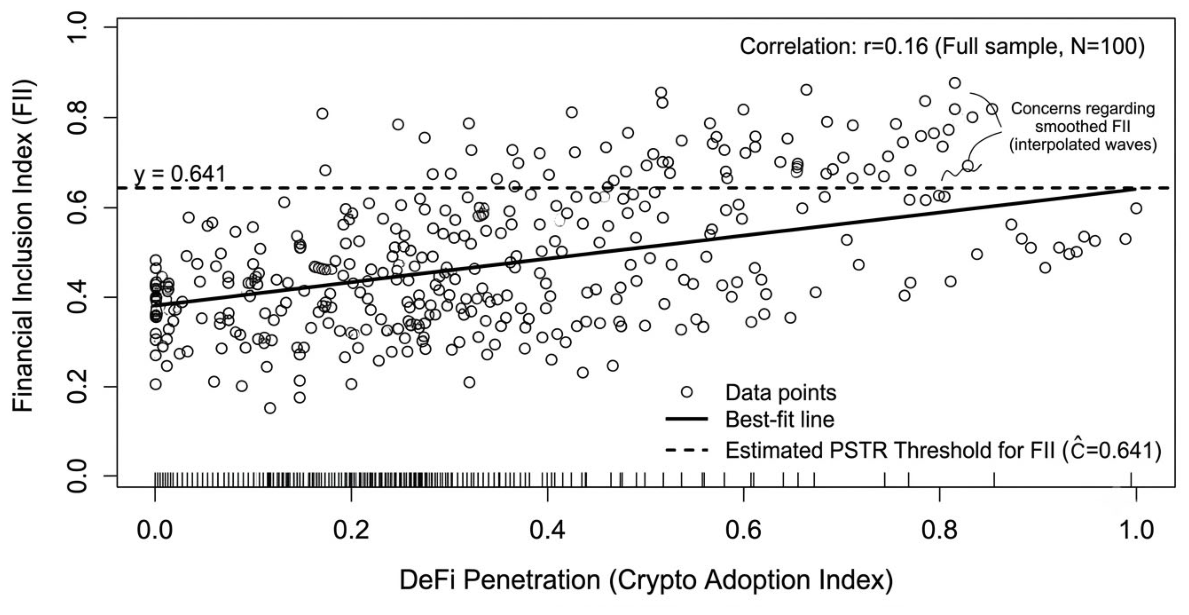
Figure 9.
Bank Z-score trajectories across BRICS Plus economies, 2015–2024.
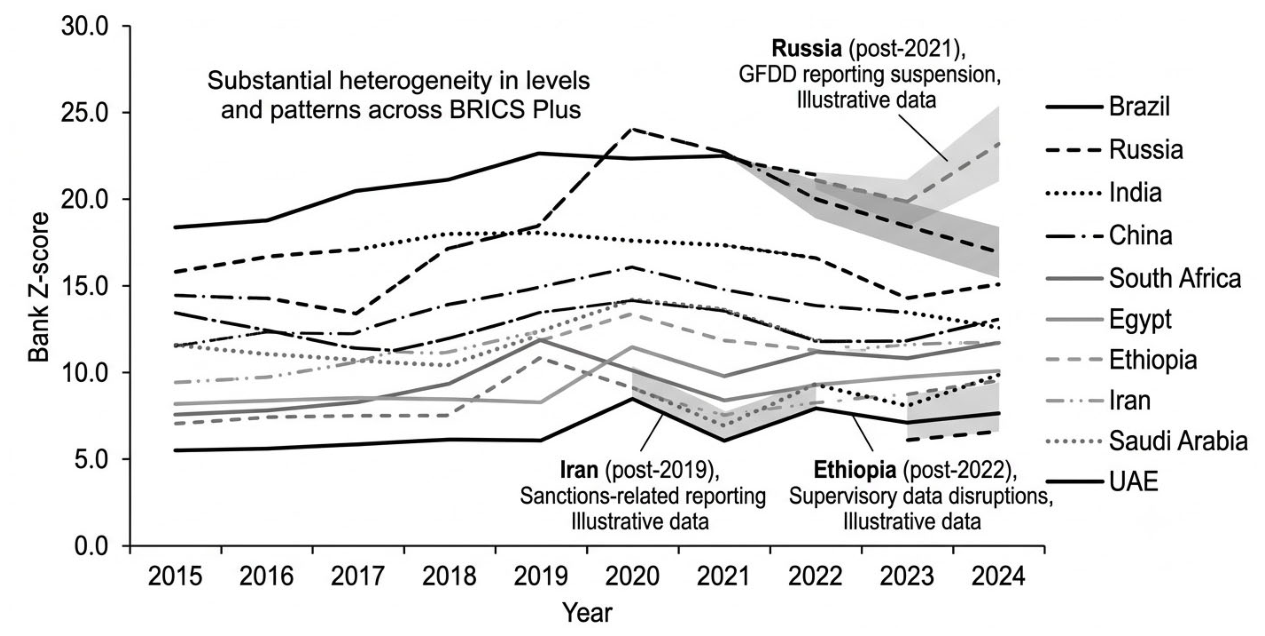
Table 1.
Literature gap matrix: positioning of the present study relative to recent benchmark contributions.
Table 1.
Literature gap matrix: positioning of the present study relative to recent benchmark contributions.
| Study | FinTech | DeFi | Inclusion | Stability | Threshold | BRICS/BRICS+ |
| Nguyen & Dang [56] | ✓ | ✗ | ✗ | ✓ | ✗ | ✗ |
| Banna et al. [27] | ✓ | ✗ | ✓ | ✓ | ✗ | ✗ |
| Uddin & Barai [24] | ✓ | ✗ | ✗ | ✓ | ✗ | ✗ |
| Abdelkader et al. [26] | ✓ | ✗ | ✗ | ✓ | ✗ | ✓ (BRICS) |
| Aquilina et al. [37] | ✓ | ✓ | ✗ | ✓ | ✗ | ✗ |
| Sebai et al. [57] | ✗ | ✗ | ✓ | ✓ | ✓ | ✗ |
| Saidi [65] | ✓ | ✗ | ✓ | ✓ | ✗ | ✗ |
| Current Study | ✓ | ✓ | ✓ | ✓ | ✓ | ✓(BRICS Plus) |
Note: ✓ indicates that the study addresses the dimension; ✗ indicates it does not. "DeFi" refers to direct operationalization of decentralized finance protocols rather than general fintech. "Threshold" refers to explicit testing for non-linear regime-switching effects.
Table 2.
Variable definition, measurement, and theoretical justification.
| Variable | Definition | Source | Theoretical Justification |
| Bank Z-score | Natural log of (equity/assets + ROA) / SD(ROA) | World Bank GFDD.SI.01 | Bank stability proxy [44,45] |
| NPL ratio | Non-performing loans / total gross loans (%) | World Bank GFDD.SI.02 / IMF FSI | Asset-quality stability proxy [46] |
| Crypto adoption index | Chainalysis Global Crypto Adoption Index (0–1 normalized) | Chainalysis (2020–2025) | DeFi penetration proxy [3,4] |
| DeFi sub-index | Retail DeFi-protocol value received, PPP-weighted (0–1) | Chainalysis (2020–2025) | DeFi-specific adoption measure [4] |
| Financial Inclusion Index (FII) | Sarma [39] multidimensional index (0–1) | Global Findex (2011–2025) | Inclusion construct [38,39,43] |
| Log GDP per capita | Log of GDP per capita (PPP, constant 2017 USD) | World Bank WDI | Economic development control [51] |
| CPI inflation | Annual CPI growth rate (%) | World Bank WDI | Macroeconomic stability control |
| Domestic credit/GDP | Private credit by banks / GDP (%) | World Bank WDI | Financial development control |
| Internet users | Individuals using the internet (% population) | World Bank WDI | Digital infrastructure control [17] |
| Trade openness | (Exports + Imports) / GDP (%) | World Bank WDI | Openness control |
Table 3.
Multicollinearity diagnostic matrix: variance inflation factors (VIF) before and after remedial action.
Table 3.
Multicollinearity diagnostic matrix: variance inflation factors (VIF) before and after remedial action.
| Variable | VIF (both DeFi measures) | VIF (one at a time) | Action |
| Crypto adoption index | 20.4 | 1.34 | Entered one at a time |
| DeFi sub-index | 19.6 | 1.31 | Entered one at a time |
| FII | 3.12 | 3.08 | Retained |
| Log GDP per capita | 4.87 | 4.82 | Retained |
| CPI inflation | 1.45 | 1.44 | Retained |
| Domestic credit/GDP | 2.31 | 2.29 | Retained |
| Internet users | 4.65 | 4.61 | Retained |
| Trade openness | 1.78 | 1.76 | Retained |
| *Mean VIF* | *7.15* | *2.71* | — |
Note: VIF values exceeding 10 indicate severe multicollinearity [28]. The simultaneous inclusion of both Chainalysis measures produces VIFs of 20.4 and 19.6, far exceeding the conventional threshold. Entering one measure at a time reduces all VIFs below 5, confirming the remedial action.
Table 4.
Descriptive statistics — BRICS Plus panel (2015–2024).
| Variable | N | Mean | SD | Min | Max |
| Z-score | 90 | 15.131 | 7.540 | 2.31 | 27.92 |
| NPL | 90 | 4.690 | 2.847 | 1.20 | 12.50 |
| Crypto adoption index | 100 | 0.136 | 0.202 | 0.000 | 1.000 |
| DeFi sub-index | 100 | 0.111 | 0.190 | 0.000 | 0.950 |
| FII | 94 | 0.494 | 0.238 | 0.011 | 0.964 |
| Account ownership (%) | 94 | 70.642 | 21.344 | 14.10 | 94.85 |
| Digital payment (%) | 94 | 52.506 | 25.510 | 6.00 | 90.30 |
| Credit/GDP (%) | 100 | 67.089 | 38.831 | 22.30 | 190.50 |
| Log GDP per capita | 100 | 9.756 | 0.885 | 7.669 | 11.249 |
| Inflation (%) | 100 | 9.219 | 10.873 | −2.09 | 45.80 |
| Internet users (%) | 100 | 66.754 | 24.112 | 11.60 | 100.00 |
| Trade openness (%) | 100 | 57.044 | 42.057 | 24.00 | 195.00 |
Table 5.
Pairwise Pearson correlations.
| Variable | Z-score | NPL | Crypto | DeFi sub | FII | Account | Digital | Credit/GDP | Log GDP | Inflation | Internet | Trade |
| Z-score | 1 | −0.66 | 0.11 | 0.12 | 0.19 | 0.37 | 0.39 | 0.62 | 0.45 | −0.56 | 0.40 | 0.29 |
| NPL | −0.66 | 1 | −0.15 | −0.18 | 0.31 | 0.16 | 0.08 | −0.34 | 0.00 | 0.18 | −0.11 | 0.14 |
| Crypto adoption | 0.11 | −0.15 | 1 | 0.97 | 0.16 | 0.25 | 0.17 | 0.08 | 0.02 | −0.05 | 0.18 | 0.05 |
| DeFi sub-index | 0.12 | −0.18 | 0.97 | 1 | 0.15 | 0.23 | 0.17 | 0.09 | 0.03 | −0.05 | 0.17 | 0.06 |
| FII | 0.19 | 0.31 | 0.16 | 0.15 | 1 | 0.90 | 0.94 | 0.39 | 0.61 | −0.13 | 0.66 | 0.34 |
| Account ownership | 0.37 | 0.16 | 0.25 | 0.23 | 0.90 | 1 | 0.89 | 0.54 | 0.57 | −0.34 | 0.58 | 0.35 |
| Digital payment | 0.39 | 0.08 | 0.17 | 0.17 | 0.94 | 0.89 | 1 | 0.58 | 0.70 | −0.27 | 0.75 | 0.41 |
| Credit/GDP | 0.62 | −0.34 | 0.08 | 0.09 | 0.39 | 0.54 | 0.58 | 1 | 0.32 | −0.40 | 0.28 | 0.05 |
| Log GDP per capita | 0.45 | 0.00 | 0.02 | 0.03 | 0.61 | 0.57 | 0.70 | 0.32 | 1 | −0.39 | 0.91 | 0.68 |
| Inflation | −0.56 | 0.18 | −0.05 | −0.05 | −0.13 | −0.34 | −0.27 | −0.40 | −0.39 | 1 | −0.23 | −0.33 |
| Internet users | 0.40 | −0.11 | 0.18 | 0.17 | 0.66 | 0.58 | 0.75 | 0.28 | 0.91 | −0.23 | 1 | 0.55 |
| Trade openness | 0.29 | 0.14 | 0.05 | 0.06 | 0.34 | 0.35 | 0.41 | 0.05 | 0.68 | −0.33 | 0.55 | 1 |
Table 6.
Maddala–Wu Fisher-type panel unit-root test.
| Variable | MW χ² | p-value | N (countries) |
| Z-score | 25.442 | 0.185 | 10 |
| NPL | 47.723 | 0.0005 | 10 |
| Crypto adoption index | 123.176 | 0.000 | 10 |
| FII | 68.859 | 0.000 | 10 |
| Credit/GDP | 18.498 | 0.555 | 10 |
| Log GDP per capita | 77.424 | 0.000 | 10 |
| Inflation | 97.099 | 0.000 | 10 |
Note: The Maddala–Wu test combines individual ADF p-values via Fisher's inverse χ² method. H₀: panel contains a unit root. Rejection at 5% implies stationarity. The credit-to-GDP series is entered in first differences as a robustness check.
Table 7.
Two-way fixed-effects panel regressions with one DeFi measure at a time.
| Dependent variable | DeFi measure | Coefficient | SE | p-value | N | R² (within) |
| Z-score | Crypto adoption index | −0.608 | 1.757 | 0.731 | 90 | −0.027 |
| Z-score | DeFi sub-index | −0.185 | 1.673 | 0.912 | 90 | −0.103 |
| NPL | Crypto adoption index | −5.385 | 1.846 | 0.005 | 90 | 0.449 |
| NPL | DeFi sub-index | −5.857 | 2.014 | 0.005 | 90 | 0.396 |
Table 8.
Synthesis of estimator results for H1 and H2.
| Hypothesis / Channel | Estimator | Coefficient | SE | p-value | Interpretation |
| H1 (DeFi → FII) | Two-way FE | +0.155 | 0.098 | 0.119 | Not significant |
| H1 (DeFi → FII) | SEM (standardized) | +0.146 | 0.076 | 0.054 | Marginally significant |
| H1 (DeFi → FII) | System GMM | −0.046 | 0.017 | 0.007 | Significant, sign reversed |
| H2 (DeFi → Z-score, direct) | Two-way FE | −0.608 | 1.757 | 0.731 | Not significant |
| H2 (DeFi → Z-score, direct) | SEM (standardized) | +0.117 | 0.070 | 0.098 | Not significant |
| H2 (DeFi → Z-score, direct) | System GMM | +0.036 | 0.129 | 0.780 | Not significant |
| H2 (DeFi → Z-score, threshold) | PSTR low regime | −2.054 | — | — | Suggestive; b₀ + b₁ = +2.08 |
| H2 (DeFi → Z-score, threshold) | PSTR linearity F | F = 2.60 | — | 0.057 | Fails to reject at 5% |
| Auxiliary (DeFi → NPL) | Two-way FE | −5.385 | 1.846 | 0.005 | Significant, negative |
| Auxiliary (DeFi → NPL) | SEM (standardized) | −0.229 | 0.080 | 0.004 | Significant, negative |
| Auxiliary (DeFi → NPL) | System GMM | −1.141 | 0.302 | <0.001 | Significant, negative |
Table 9.
Two-step system GMM diagnostics (Blundell–Bond) with collapsed instruments and Windmeijer-corrected standard errors.
Table 9.
Two-step system GMM diagnostics (Blundell–Bond) with collapsed instruments and Windmeijer-corrected standard errors.
| Model | N | AR(1) p | AR(2) p | Hansen J | Hansen J p | N (instruments) |
| M1: FII equation | 64 | 0.001 | 0.904 | 0.049 | 0.976 | 3 |
| M2: Z-score equation | 60 | 0.342 | 0.960 | 4.503 | 0.212 | 5 |
| M3: NPL equation | 60 | 0.001 | 0.764 | 2.478 | 0.479 | 5 |
Table 10.
SEM standardized path estimates.
| Path | Operator | Estimate | SE | z-value | p-value |
| FII ← Crypto adoption | ~ | 0.146 | 0.076 | 1.925 | 0.054 |
| FII ← Log GDP per capita | ~ | 0.599 | 0.085 | 7.069 | 0.000 |
| FII ← Inflation | ~ | 0.095 | 0.090 | 1.058 | 0.290 |
| FII ← Credit/GDP | ~ | 0.276 | 0.084 | 3.300 | 0.001 |
| Z-score ← Crypto adoption | ~ | 0.117 | 0.071 | 1.656 | 0.098 |
| Z-score ← FII | ~ | −0.450 | 0.097 | −4.656 | 0.000 |
| Z-score ← Log GDP per capita | ~ | 0.553 | 0.091 | 6.101 | 0.000 |
| Z-score ← Credit/GDP | ~ | 0.637 | 0.076 | 8.340 | 0.000 |
| NPL ← Crypto adoption | ~ | −0.229 | 0.079 | −2.896 | 0.004 |
| NPL ← FII | ~ | 0.795 | 0.108 | 7.352 | 0.000 |
| NPL ← Log GDP per capita | ~ | −0.343 | 0.101 | −3.392 | 0.001 |
| NPL ← Credit/GDP | ~ | −0.549 | 0.085 | −6.440 | 0.000 |
Table 11.
PSTR point estimates.
| Parameter | Estimate |
| γ (smoothness) | 80.0 |
| ĉ (threshold on FII) | 0.6414 |
| b̂₀ (low-regime slope) | −2.0536 |
| b̂₁ (regime add-on) | 4.1378 |
| b̂₀ + b̂₁ (high-regime slope) | 2.0843 |
| F-test (linearity) | 2.604 |
| p-value | 0.0573 |
| RSS (linear) | 73.103 |
| RSS (PSTR) | 66.816 |
| N | 90 |
Table 12.
Block-bootstrap confidence intervals for the PSTR parameters (B = 100).
| Parameter | Point estimate | 90% CI lower | 90% CI upper | 95% CI lower | 95% CI upper |
| ĉ (threshold) | 0.6414 | 0.315 | 0.844 | 0.242 | 0.860 |
| b̂₀ (low regime) | −2.054 | −15.019 | 3.108 | −18.980 | 13.100 |
| b̂₁ (regime add-on) | 4.138 | −5.975 | 30.000 | −10.260 | 30.000 |
| b̂₀ + b̂₁ (high regime) | 2.084 | −5.414 | 30.201 | −6.611 | 31.095 |
Table 13.
Monte Carlo statistical power of the PSTR linearity test.
| Significance level (α) | Estimated power |
| 0.10 | 0.384 |
| 0.05 | 0.248 |
| 0.01 | 0.114 |
Table 14.
PSTR estimates with alternative transition variables.
| Transition variable | γ | ĉ | b̂₀ | b̂₁ | F (linearity) | p-value |
| Financial Inclusion Index | 80.0 | 0.641 | −2.054 | 4.138 | 2.604 | 0.057 |
| Log GDP per capita (PPP) | 80.0 | 9.879 | −2.631 | 5.646 | 7.336 | 0.0002 |
| Internet users (%) | 4.65 | 93.13 | −1.815 | 3.813 | 1.352 | 0.263 |
| Bank credit/GDP | 20.0 | 151.81 | −0.863 | 9.789 | 2.540 | 0.062 |
Table 15.
Leave-one-country-out PSTR estimates.
| Excluded country | ĉ | b̂₀ | b̂₁ | b̂₀ + b̂₁ |
| Brazil | 0.571 | −0.356 | 3.123 | 2.767 |
| China | 0.844 | −0.737 | 30.000 | 29.263 |
| Egypt | 0.642 | −2.057 | 4.072 | 2.015 |
| Ethiopia | 0.640 | −2.512 | 4.156 | 1.644 |
| India | 0.621 | −5.735 | 7.599 | 1.864 |
| Iran | 0.641 | −2.207 | 4.144 | 1.937 |
| Russia | 0.649 | −2.067 | 4.348 | 2.281 |
| Saudi Arabia | 0.641 | −2.274 | 4.174 | 1.900 |
| South Africa | 0.644 | −1.647 | 3.620 | 1.973 |
| UAE | 0.826 | −2.537 | 30.000 | 27.464 |
Disclaimer/Publisher’s Note: The statements, opinions and data contained in all publications are solely those of the individual author(s) and contributor(s) and not of MDPI and/or the editor(s). MDPI and/or the editor(s) disclaim responsibility for any injury to people or property resulting from any ideas, methods, instructions or products referred to in the content. |
© 2026 by the authors. Licensee MDPI, Basel, Switzerland. This article is an open access article distributed under the terms and conditions of the Creative Commons Attribution (CC BY) license.
Copyright: This open access article is published under a Creative Commons CC BY 4.0 license, which permit the free download, distribution, and reuse, provided that the author and preprint are cited in any reuse.


