
Submitted:
03 August 2026
Posted:
04 August 2026
You are already at the latest version
Abstract
Multimodal Knowledge Graphs (MMKGs) offer a promising paradigm for integrating heterogeneous sources into a unified, queryable, semantically structured representation. However, existing MMKG construction pipelines remain predominantly text-centric, extracting information from textual passages while leaving much of the visual and structural knowledge in scientific papers unrepresented. This produces fragmented graphs with disconnected components, isolated singleton nodes, and weak cross-modal connectivity, reducing the effectiveness of retrieval-augmented generation (RAG) systems that rely on interconnected graph traversal for multi-hop reasoning and evidence aggregation. We propose Multimodal Semantic-Oriented Alignment with Integrated Contrastive Learning (MOSAIC), an end-to-end framework for constructing semantically coherent MMKGs from heterogeneous scientific documents. MOSAIC introduces four complementary contributions: (i) adaptive clustering via HDBSCAN, which infers data-driven entity boundaries without the brittle ε hyperparameters of conventional DBSCAN; (ii) a confidence-aware cross-modal alignment mechanism applying cosine-similarity gating to selectively invoke Large Language Models (LLMs), reducing spurious alignments and computational overhead; (iii) post-fusion semantic bridging, which links semantically related but structurally disconnected components through cosine-similarity-weighted bridge edges; and (iv) self-supervised contrastive embedding fine-tuning using an InfoNCE-style MultipleNegativesRankingLoss objective to specialize the embedding space for cross-modal entity representations. Empirical evaluation shows MOSAIC substantially improves graph topology and structural coherence, achieving a 110% increase in average clustering coefficient, reducing fragmentation, and strengthening intra-cluster semantic consistency. Large-scale evaluation across two challenging benchmarks, MMLongBench-Doc (134 documents) and DocBench (166 documents), consistently demonstrates that the MOSAIC-RAG engine outperforms or enhances competitive retrieval and graph-based baselines across diverse document categories, establishing the framework’s effectiveness and generalizability.
Keywords:
knowledge graph
; multimodal knowledge graphs
; retrieval augmented generation
; large language models
; contrastive learning
; cross-modal alignment
1. Introduction
The rapid proliferation of LLMs has catalyzed a new generation of multimodal artificial intelligence systems capable of jointly processing and reasoning over text, images, tables, and other structured data sources [1]. In parallel, retrieval-augmented generation (RAG) has emerged as a dominant paradigm for knowledge-intensive question answering (QA) [2,3]. KG-grounded RAG systems have demonstrated particular promise for multi-hop evidence aggregation, contextual reasoning, and interpretable retrieval [4,5]. By explicitly representing entities and their semantic relationships, KGs provide a structured substrate for organizing, traversing, and synthesizing retrieved evidence more effectively than conventional dense chunk-level retrieval methods.
Despite these advances, a fundamental limitation persists in current KG-based RAG pipelines: they remain overwhelmingly grounded in unimodal text corpora and therefore systematically overlook the rich visual knowledge embedded in figures, plots, tables, diagrams, and other non-textual artifacts [6,7]. This omission is especially problematic in scientific and technical documents, where critical evidence is rarely expressed through prose alone. Instead, essential findings, comparative analyses, experimental configurations, and methodological abstractions are often distributed across heterogeneous modalities that jointly convey the full semantic content of the document [6]. As a result, text-only knowledge extraction pipelines provide only a partial representation of document meaning, regardless of the sophistication of the downstream retrieval or generation model [7].
The consequences of this limitation are substantial. In many scientific domains, including NLP, biomedicine, and engineering, a considerable proportion of communicative content is encoded in non-textual form [8,9]. When a question depends on evidence presented exclusively in a figure or numerical result reported only in a table, a text-centric KG cannot recover the relevant information because that knowledge was never incorporated into the graph in the first place [10,11]. Beyond this problem of incomplete semantic coverage, unimodal extraction pipelines also produce structurally deficient graphs characterised by disconnected components and isolated modality-specific subgraphs [7]. In such settings, multi-hop reasoning across textual and visual evidence becomes intrinsically constrained, since the graph lacks the cross-modal relational structure necessary to support traversable reasoning paths [10].
A prior study on KG, identified two key research gaps that directly motivate this work [12]. First, the use of multi-source knowledge bases (KBs) and multimodal data in KG construction remains insufficiently explored, particularly in settings where heterogeneous textual and visual evidence must be integrated into a unified knowledge representation. Second, although cross-modal techniques such as representation learning, autoencoders, and graph neural networks offer mechanisms for bridging semantic disparities across modalities, existing pipelines remain limited by brittle fixed-parameter clustering strategies, weak cross-modal alignment mechanisms, and a lack of task-specific embedding refinement for multimodal graph construction [12].
To address these gaps, this paper poses and empirically investigates the following research questions:
- 1.
- Can HDBSCAN produce more stable and semantically coherent entity clusters than fixed-parameter DBSCAN when applied to the spectral embedding space of a multimodal knowledge graph?
- 2.
- Does a three-tier confidence-aware gating strategy reduce spurious cross-modal alignments without significantly sacrificing alignment recall when compared to threshold-free or single-threshold baselines?
- 3.
- Does post-fusion semantic bridging improve multi-hop retrieval quality by reducing graph fragmentation and enhancing downstream question-answering performance?
These challenges are particularly pronounced in scientific documents, where knowledge is distributed across text, tables, figures, equations, and diagrams within noisy and weakly structured layouts [8,9,10,11]. While recent advances in multimodal RAG and MMKG construction have highlighted the value of integrating textual and visual information into unified semantic representations, most existing approaches rely on restrictive assumptions such as manually curated datasets, dense annotations, or predefined alignment schemas [12]. Such assumptions rarely hold in real-world document collections, which are inherently heterogeneous, only weakly annotated, and often devoid of explicit correspondence signals between modalities. Moreover, many existing methods focus primarily on local alignment between neighbouring textual and visual elements while paying insufficient attention to the global structural coherence of the resulting graph [11].
A central consequence of these limitations is semantic fragmentation. In practical multimodal extraction pipelines, textual entities, tabular content, and visual elements are frequently transformed into disconnected or weakly linked subgraphs, thereby reducing connectivity, weakening graph traversal, and limiting the effectiveness of graph-grounded retrieval [7]. We argue that this fragmentation arises from three interrelated challenges: the semantic gap between textual and visual embedding spaces, clustering instability under heterogeneous density distributions, and the persistence of disconnected components generated by independently executed modality-specific extraction processes.
To address these limitations, we propose MOSAIC (Multimodal Semantic-Oriented Alignment with Integrated Contrastive Learning), an end-to-end framework for constructing semantically coherent multimodal knowledge graphs directly from raw scientific documents. MOSAIC integrates adaptive clustering, confidence-aware cross-modal alignment, semantic graph bridging, and self-supervised contrastive fine-tuning within a unified pipeline designed to reduce graph fragmentation and improve graph-grounded retrieval over multimodal document collections.
The principal contributions of this work are as follows:
- 1.
- We introduce a fully automated pipeline for multimodal knowledge graph construction from raw scientific documents.
- 2.
- We propose a confidence-aware cross-modal alignment mechanism that reduces spurious matches while limiting LLM usage.
- 3.
- We introduce semantic bridging to explicitly reduce graph fragmentation.
- 4.
- We design a self-supervised contrastive learning strategy for refining cross-modal embeddings.
By integrating these components within a unified computational framework, MOSAIC produces semantically coherent, structurally interconnected, and retrieval-oriented MMKGs directly from raw scientific documents. In doing so, it addresses a critical limitation in existing MMKG construction research and provides a foundation for improved graph-grounded retrieval, automated reasoning and scientific knowledge discovery. The following Section 2, presents the related work, reviewing prior advances in KG construction, multimodal knowledge graphs, cross-modal alignment, contrastive learning, and graph-based retrieval systems that collectively motivate the proposed framework.
2. Related Work
The construction of KGs from unstructured textual data has undergone substantial methodological evolution, beginning with rule-based and pattern-oriented paradigms that established the early foundations of the field. Initial systems relied heavily on manually engineered extraction rules, linguistic templates, and predefined syntactic patterns to identify entities and relations from text [13,14,15]. The limitations of rule-based approaches motivated a transition toward data-driven neural architectures capable of learning more robust semantic representations directly from large-scale corpora. The emergence of neural architectures substantially alleviated the brittleness associated with rule-based extraction by enabling models to learn contextual and semantic representations directly from data [16]. Nevertheless, such approaches remained highly dependent on large quantities of domain-specific labelled data, exhibited limited transferability across domains, and often struggled to capture long-range semantic dependencies within lengthy documents. These limitations motivated the adoption of pre-trained language models, which provided substantially richer contextual representations through large-scale self-supervised learning. Transformer-based models such as BERT enabled contextual token embeddings that significantly improved downstream extraction tasks. Building upon this paradigm, [17] introduced ERNIE, which enhanced BERT-style representations by incorporating structured entity knowledge from external KBs such as Wikidata, thereby improving performance on entity-centric downstream tasks. Subsequent methods further advanced joint entity and relation extraction through more sophisticated architectures [18,19].
More recently, generative approaches have redefined KG construction as an end-to-end sequence generation problem. The Rule-based and Experience-enhanced Learning (REBEL) [20], reformulated joint entity and relation extraction as a sequence-to-sequence generation task, thereby eliminating the need for separate NER and relation classification modules. Similarly, the Generative ENtity REtrieval (GENRE) framework [21], extended autoregressive generation to entity retrieval through constrained beam search, enabling more flexible entity linking and retrieval. Although these transformer-based and generative architectures achieved state-of-the-art performance across a wide range of extraction benchmarks, they introduced new challenges. Most notably, they remained heavily reliant on large annotated datasets, were typically fine-tuned for narrowly defined domains, and exhibited limited capacity for zero-shot or cross-domain generalisation without additional retraining. These limitations ultimately motivated a transition towards large language models (LLMs) as more general-purpose extraction backbones. Recent studies have shown that models such as GPT-3 and LLaMA are capable of identifying entities, relations, events, and temporal expressions through in-context learning and chain-of-thought prompting [24], even in the absence of domain-specific supervision. The authors in [23], proposed a broader roadmap for integrating LLMs with knowledge graphs, demonstrating that these models can function as flexible extraction engines while substantially reducing the need for expensive labelled datasets. Similarly, a study [25] highlighted the growing body of evidence showing that LLMs exhibit strong zero-shot and few-shot performance across a wide range of knowledge extraction tasks that previously required extensive supervised training. Despite these advantages, LLM-based extraction pipelines introduce new limitations. Their outputs remain probabilistic in nature, often lack explicit confidence guarantees, and are susceptible to factual hallucination or spurious relation generation.
More importantly, the above approaches for the construction of KGs remains fundamentally text-centric. The proposed systems are structurally incapable of processing the rich visual semantics contained in figures, tables, diagrams, equations, and experimental charts, which frequently account for between 30% and 40% of the communicative content in scientific documents. As a consequence, a substantial proportion of domain knowledge remains absent from the resulting knowledge graphs, producing incomplete and semantically fragmented representations of multimodal document collections.
To address these limitations, researchers began to incorporate visual content into entity representations, giving rise to multi-modal knowledge graphs (MMKGs). Early efforts in this direction were motivated by the observation that many real-world entities are more comprehensively described when textual, relational, and visual information are jointly modeled [26,27,28].
Later systems focused on scaling multimodal associations [29,30]. More recent frameworks such as MuKEA [31] and VisualSem [32] further demonstrated the value of multimodal entity representations for downstream tasks such as visual question answering and image-text retrieval. These studies showed that entities described jointly through textual and visual modalities often produce richer, less ambiguous, and more semantically informative representations than text-only approaches.
Despite these advances, existing MMKG frameworks exhibit several important limitations. Most rely on curated multimodal corpora, externally annotated image-entity correspondences, or pre-existing KB structures. Consequently, they do not support end-to-end KG construction directly from raw documents. Furthermore, they are poorly suited to scientific PDFs, where figures, diagrams, equations, tables, and experimental charts are tightly interwoven with textual explanations and rarely accompanied by explicit alignment metadata. As a result, the problem of automatically constructing coherent MMKGs from heterogeneous scientific documents remains largely unresolved.The principal barrier underlying these limitations lies in the difficulty of aligning visual and textual representations across the modality gap. Because images and text encode information in fundamentally different forms, establishing meaningful correspondences between them remains a major challenge in multimodal representation learning. Recent advances in vision-language pre-training have significantly improved the ability of models to bridge this gap using contrastive learning frameworks [33,34], contrastive learning with masked multimodal modeling [35], joint optimization contrastive learning and image captioning objectives [36] and Querying Transformer paradigm [37,38].
However, existing vision-language models presented some limitations in the construction of multimodal KGs. Furthermore, they do not address the problem of cross-modal KG alignment. Entity alignment within KGs is inherently relational and semantic rather than purely retrieval-based, requiring the matching of complex textual descriptions, contextual dependencies, and graph-level relationships across modalities. Equally important to cross-modal alignment is the problem of grouping semantically related entities within the constructed graph. Effective clustering is essential for reducing redundancy, identifying latent semantic structure, and improving the coherence of downstream graph traversal and retrieval. To this end, authors have developed clustering solutions such as density-based approaches [40,41,42], graph-based clustering methods [43,44], and HDBSCAN [45]. Once cross-modal entity correspondences have been established, the next challenge is to bring their representations into closer semantic proximity, through the use of contrastive learning [46,47,48,49,50,51,53]. More recent retrieval-oriented models [54,55,56] demonstrated the effectiveness of large-scale contrastive pre-training for dense retrieval, while the triple-based contrastive learning framework [57] combines traditional knowledge graph embedding outputs with foundation model representations and employs a dual-phase training strategy to improve alignment quality. However, despite their effectiveness, these approaches remain fundamentally text-centric and do not directly address the semantic gap between visual and textual entity representations.
The practical construction of a well-connected multimodal knowledge graph is ultimately realised through its integration with retrieval-augmented generation (RAG) systems such as retrieve-then-generate paradigm [58], GraphRAG [59], HippoRAG [60], LightRAG [61] and SubgraphRAG [64]. However, these graph-based RAG systems remain fundamentally limited by their reliance on unimodal textual knowledge graphs. Whether based on graph traversal, subgraph extraction, community detection, or temporal reasoning, all systems in this lineage are structurally incapable of retrieving evidence from figures, diagrams, tables, or experimental charts within a document. This limitation underscores the need for multimodal graph retrieval frameworks capable of integrating and traversing both textual and visual evidence within a unified knowledge structure.
Constructing multimodal KGs further depends on accurate document parsing prior to extraction, clustering, and alignment. Scientific documents present unique challenges because textual content is often interwoven with figures, tables, equations, captions, and complex page layouts that cannot be processed reliably using conventional text extraction methods. Early progress in document understanding was made through models such as LayoutLM [66], which jointly modelled textual tokens and their two-dimensional spatial positions within a document. This enabled strong performance on tasks such as form understanding and document classification. However, LayoutLM was primarily designed for semi-structured documents such as invoices and forms, limiting its ability to generalise to the highly heterogeneous layouts of scientific PDF documents. Subsequent work extended document understanding to richer multimodal representations. Another study [67] introduced DocFormer, which incorporated multimodal self-attention across textual, visual, and spatial features to achieve state-of-the-art performance on several document understanding benchmarks. Although DocFormer improved the integration of multiple modalities, it operated directly on rendered document images and therefore remained computationally expensive when applied to large-scale scientific corpora. In parallel, the authors in [68] proposed Nougat, which specifically targeted scientific PDF understanding by learning to convert rendered PDFs into structured markup representations using paired PDF and LaTeX sources. Nougat significantly improved the extraction of mathematical expressions and structured document content. Nevertheless, it remained focused primarily on textual reconstruction and did not explicitly identify, represent, or integrate visual entities such as figures, tables, and experimental charts into a structured knowledge graph. More recently, new benchmarks have emerged to evaluate the ability of large language models to understand complex scientific documents. [69] introduced DocBench, while [70] proposed MMLongBench-Doc. These benchmarks assess a wide range of capabilities, including visual reasoning, table understanding, multi-page comprehension, and cross-modal document interpretation. Their emergence reflects a growing recognition that visual elements should not be treated as secondary or supplementary information, but rather as primary carriers of knowledge within scientific documents.
In summary, the research threads reviewed above reveal two critical gaps. First, existing KG construction pipelines from rule-based extraction systems and recurrent neural architectures to transformer-based models, LLM-driven pipelines, and current MMKG approaches remain unable to integrate the visual knowledge contained in raw scientific documents into coherent, queryable graph structures. Second, no existing framework combines adaptive density-based clustering, confidence-aware cross-modal alignment, post-fusion semantic bridging, and contrastive embedding fine-tuning within a unified end-to-end pipeline operating directly on raw documents; this is illustrated in Table 1, where we summarize the evolution of knowledge graph construction and retrieval frameworks across modalities. The MOSAIC framework developed in this study is explicitly designed to address these limitations (see bottom row of Table 1) through four tightly integrated technical contributions, which are presented in the next section.
3. Preliminaries
The objective of MOSAIC is to construct a semantically coherent multimodal knowledge graph from a structured scientific document containing both textual and visual information. Scientific documents distribute critical knowledge across heterogeneous modalities including narrative text, figures, tables, diagrams, and equations. Consequently, the problem is not merely to extract entities and relations independently within each modality, but rather to align, integrate, and structurally connect them within a unified graph representation suitable for retrieval-augmented generation. A central shortcoming of existing multimodal extraction pipelines is semantic fragmentation. In practice, textual entities, tabular content, and visual elements are frequently transformed into disconnected or only weakly linked subgraphs, thereby reducing graph connectivity, weakening multi-hop traversal, and limiting the effectiveness of graph-grounded retrieval. We argue that this fragmentation arises from three interrelated technical challenges: the semantic gap between textual and visual embedding spaces, clustering instability under heterogeneous density distributions, and the persistence of disconnected components generated by independently executed modality-specific extraction processes. We formally define the core constructs below and state the central construction problem.
Definition 1
(Multimodal Document). Amultimodal document consists of a set of textual chunks and a set of visual regions , comprising figures, tables, diagrams, and charts, co-occurring within a structured scientific document.
Definition 2
(Multimodal Knowledge Graph). Amultimodal knowledge graphis a directed property graph , where is the entity set partitioned into text-derived entities and vision-derived entities ; is the relation set with relation type labels Λ; and is a set of attribute functions mapping entities and relations to property values including descriptions, source identifiers, modality types, and confidence scores.
Definition 3
(Cross-Modal Entity Alignment). Given a visual entity with embedding and a candidate set of text entities from cluster , across-modal alignmentis a partial bijection such that maximises the confidence-weighted cosine similarity:
subject to the confidence gating constraint , where denotes the lower similarity threshold below which candidate alignments are rejected without LLM consultation.
Definition 4
(Semantic Bridge Edge). Given the fused graph with connected components , asemantic bridge edgefor a component pair is a directed edge where:
and is inserted into if and only if , where in our implementation. Bridge edges are assigned the attribute to support downstream filtering during retrieval and reasoning.
The three technical challenges motivating MOSAIC naturally lead to three research questions. First, because fixed-parameter clustering methods often produce unstable entity groupings across documents with different density distributions, we ask whether HDBSCAN can generate more stable and semantically coherent clusters than conventional DBSCAN. Second, because visual and textual entities reside in fundamentally different embedding spaces, we investigate whether a three-tier confidence-aware alignment mechanism can reduce spurious alignments without sacrificing recall. Third, because independently extracted subgraphs often remain disconnected even after entity matching, we examine whether post-fusion semantic bridging can improve graph connectivity and downstream retrieval quality.
Definition 5
(Multimodal KG Construction and RAG). Given a multimodal document , a multimodal knowledge graph that simultaneously:(i)maximises cross-modal entity coverage and alignment fidelity,(ii)minimises graph fragmentation as measured by the number of connected components , and(iii)supports effective retrieval-augmented answer generation for questions requiring integrated textual and visual reasoning is formalized as in Equation 3.
where measures cross-modal entity coverage, measures alignment fidelity, denotes the number of connected components penalising fragmentation, measures downstream retrieval utility, and are weighting coefficients controlling the relative importance of each objective term.
Theorem 1
(Monotone Connectivity Under Bridge Insertion). Each bridge edge insertion reduces the number of connected components by exactly one when its endpoints belong to distinct connected components, and by zero when they already belong to the same component. Consequently, the sequence of component counts produced during the semantic bridging stage of MOSAIC is monotonically non-increasing.
Proof.
Let contain K connected components prior to the insertion of a bridge edge . If and with , then the insertion of merges the two components into a single connected component, reducing the total number of connected components from K to . Conversely, if u and v already belong to the same component, no merge occurs and the component count remains unchanged. By induction over the ordered sequence of bridge insertions, the total number of connected components is therefore monotonically non-increasing throughout the semantic bridging phase. □
4. Materials and Methods
This section presents the MOSAIC framework for constructing semantically coherent multimodal knowledge graphs directly from raw scientific documents. The overall architecture of MOSAIC is illustrated in Figure 1 and consists of four sequential processing stages: modality-specific entity extraction, confidence-aware cross-modal alignment, graph fusion and semantic bridging, and contrastive representation refinement. The framework is designed to progressively transform heterogeneous textual and visual content of a scientific document into a semantically coherent MMKG suitable for downstream retrieval-augmented generation, without requiring manually annotated training data or domain-specific parameter tuning. In the first stage, the input document is decomposed into two parallel processing streams. The textual branch (top left of Figure 1) encodes text chunks into dense semantic representations and clusters them using HDBSCAN to produce the text-derived entity set . In parallel, the visual branch (top right of Figure 1) processes figures, tables, diagrams, and charts through a vision encoder, clustering the resulting visual-semantic embeddings to produce the vision-derived entity set . By applying adaptive density-based clustering independently within each modality, MOSAIC avoids the brittle fixed-radius sensitivity of DBSCAN and produces more stable entity groupings across documents with heterogeneous semantic density distributions. In the second stage (middle of Figure 1), pairwise cosine similarity scores are computed between candidate entity embeddings from and , producing a similarity matrix that captures potential semantic correspondences across modalities. These candidate pairs are then passed through a three-tier confidence gating mechanism. Pairs with similarity scores above an upper threshold are automatically aligned, pairs below a lower threshold are discarded, and only intermediate-confidence pairs are forwarded to an LLM-based reasoning module for deeper semantic disambiguation. This strategy reduces unnecessary LLM invocations while preserving the ability to recover semantically meaningful alignments that embedding similarity alone may not capture.
In the third stage (bottom of Figure 1), the aligned entities and modality-specific subgraphs are integrated into a unified multimodal graph through a graph fusion operation. Because independently extracted subgraphs may remain structurally disconnected even after alignment, MOSAIC applies a post-fusion semantic bridging procedure that identifies the most semantically similar cross-component entity pairs and inserts weighted bridge edges wherever the pairwise similarity exceeds a predefined threshold . This process reduces graph fragmentation, increases global connectivity, and improves the capacity of the resulting graph to support multi-hop traversal during downstream retrieval.
In the final stage (bottom of Figure 1), the semantic bridge edges are used as weakly supervised positive pairs in a self-supervised contrastive fine-tuning objective based on MultipleNegativesRankingLoss. This stage progressively refines the shared multimodal embedding space by pulling semantically aligned textual and visual entities closer together while pushing unrelated entities apart, producing a representation space increasingly specialised for cross-modal entity matching without requiring manually annotated training pairs. The final output is an optimised MMKG that is integrated with the MOSAIC-RAG query engine to support multi-hop retrieval and question answering over both textual and visual evidence. The main stages of our proposed MOSAIC framework (Figure 1) presented above are explained in details next.
4.1. Document Parsing and Modality-Specific Entity Extraction
The first operational stage of MOSAIC transforms a raw scientific PDF document into a structured set of modality-specific semantic units that can subsequently be clustered, aligned, and fused into a MMKG. Formally, given a multimodal document , the parsing stage produces:
where each corresponds to a semantically bounded textual unit and each corresponds to a detected visual element such as a figure, table, chart, or diagram. The purpose of this decomposition is to convert the original document into machine-processable units that preserve local semantic coherence while remaining sufficiently compact for embedding and graph construction. In the textual branch of MOSAIC (top left of Figure 1), the document is segmented into coherent chunks that preserve local semantic continuity, typically corresponding to paragraphs, captions, list items, or other logically self-contained spans. These chunks are encoded using a pre-trained sentence transformer to produce dense 384-dimensional vector representations suitable for downstream clustering and similarity computation. From these chunk-level representations, MOSAIC derives a set of text-derived entities , where each entity may correspond to a scientific concept, method, dataset, metric, experimental result, or other semantically meaningful unit in the input document. Because these entities originate from semantically coherent chunks rather than isolated tokens, they retain richer contextual grounding for downstream graph construction. In parallel, the visual branch of MOSAIC (top right of Figure 1) processes non-textual elements extracted from the same document, including figures, tables, diagrams, plots, and other graphical artefacts carrying substantive scientific meaning. Each visual region of the input scientific document is passed through a vision-language encoder to produce a dense visual-semantic embedding that captures the semantic content of the region in a form directly comparable to text-derived embeddings. This separation of the visual branch from the textual branch in the MOSAIC framework is essential because figures and tables frequently communicate information that is only partially restated in surrounding prose. A results table, for example, may encode comparative numerical evidence that appears nowhere in the textual narrative, while an architectural diagram may convey methodological structure that the prose describes only abstractly. Treating such content as first-class input units enables MOSAIC to preserve information that would be entirely lost in text-only extraction pipelines.
At the conclusion of this stage, MOSAIC produces two modality-specific entity sets:
These sets are not yet aligned across modalities and do not yet constitute a unified graph. This deferral of cross-modal integration until after modality-specific clustering and similarity estimation have been performed is a deliberate design choice that reduces premature or noisy fusion. The resulting pair of modality-specific entity spaces provides a structured basis for the subsequent stages of adaptive clustering, confidence-aware alignment, semantic bridging, and contrastive refinement.
4.2. Adaptive Spectral Clustering via HDBSCAN
A central challenge in MMKG construction is the reliable grouping of semantically related entities into coherent clusters prior to cross-modal alignment. Existing KG construction pipelines commonly employ spectral clustering followed by Density-Based Spatial Clustering of Applications with Noise (DBSCAN) over the Laplacian eigenvector embedding space. Although this strategy captures local graph topology, its performance is highly sensitive to the choice of the neighbourhood radius parameter . In practice, a fixed value may produce semantically coherent clusters for one document while generating excessive singleton nodes, fragmented subgraphs, or unstable cluster assignments. This limitation is particularly acute in scientific corpora, where entity descriptions vary substantially in density and semantic granularity across sections such as introductions, related work, and experimental results. To address this limitation, MOSAIC replaces conventional DBSCAN with Hierarchical Density-Based Spatial Clustering of Applications with Noise (HDBSCAN). Unlike DBSCAN, HDBSCAN does not require a fixed neighbourhood radius and instead determines cluster boundaries adaptively through a hierarchical condensed tree formulation, allowing cluster boundaries to emerge directly from the local density structure of the embedding space. This makes the clustering process substantially more robust across heterogeneous document types and varying semantic distributions.
Let denote the embedding function that maps an entity into a d-dimensional semantic representation space. Given a set of entity embeddings , pairwise semantic similarity between entities and is computed using cosine similarity, and shifted into the non-negative range to facilitate graph construction:
The resulting similarity matrix is used to construct the weighted adjacency matrix of the entity graph, from which the degree matrix D, unnormalised graph Laplacian L, spectral dimensionality k, and minimum cluster size are defined as in Equation (5).
Spectral clustering is subsequently performed by extracting the first k eigenvectors of L, allowing the representation dimensionality to scale naturally with document size without requiring manual tuning. HDBSCAN is then applied to the resulting eigenvector embeddings with minimum cluster size . Unlike DBSCAN, which requires a single fixed density threshold, HDBSCAN constructs a hierarchy of cluster merges across multiple density levels and identifies stable clusters by maximising persistence across the hierarchy. Clusters with strong internal semantic cohesion are preserved, while unstable or noisy groupings are treated as outliers. This property is especially important in multimodal document collections, where dense groups of closely related entities may coexist with sparse or weakly connected concepts. To quantify the semantic cohesion of each resulting cluster, MOSAIC computes a cluster confidence score based on the average pairwise cosine similarity among entities within the same cluster in Equation (6).
This confidence score is propagated to the downstream alignment stage, where it modulates alignment decisions according to the internal coherence of each cluster. Clusters with high internal semantic similarity therefore exert stronger influence over alignment decisions than loosely connected or noisy clusters, providing a principled mechanism for weighting cross-modal correspondences by the quality of the entity groups from which they are drawn. Prior studies have shown that fixed-parameter DBSCAN may produce highly unstable clustering behaviour across heterogeneous embedding distributions, sometimes generating hundreds of singleton clusters for sparse documents while over-merging semantically distinct entities in denser corpora [45,71,72]. By contrast, HDBSCAN produces stable, data-adaptive cluster boundaries that are more consistent across different document types and scientific domains, directly addressing research question 1 formulated in Section 1, by reducing graph fragmentation and improving intra-cluster semantic consistency.
4.3. Confidence-Aware Cross-Modal Alignment
A central challenge in MMKG construction is the reliable alignment of semantically corresponding entities across textual and visual modalities. Naive alignment strategies based solely on fixed similarity thresholds are prone to two critical failure modes: spurious alignments, where semantically unrelated entities are incorrectly matched due to superficial embedding proximity, and missed correspondences, where genuinely related entities are discarded due to overly conservative thresholding. To address both failure modes simultaneously, MOSAIC introduces a confidence-aware cross-modal alignment mechanism that dynamically balances precision and recall through a three-tier gating strategy. For each candidate pair , the cosine similarity between entity embeddings is computed as in Eqaution (7).
where denotes the shared embedding function. Rather than applying a single global threshold, MOSAIC partitions candidate pairs into three disjoint confidence regions based on thresholds , as illustrated in Figure 2. Pairs exceeding the upper threshold fall into the high-confidence region and are automatically aligned without further processing, as they exhibit strong semantic similarity and are considered reliable correspondences that do not require LLM verification. Pairs below the lower threshold fall into the low-confidence region and are discarded, as they are unlikely to represent meaningful semantic relationships and would introduce noise into the fused graph. Pairs within the intermediate range constitute the ambiguous region and are forwarded to a large language model for semantic disambiguation, where the LLM evaluates contextual descriptions, relational cues, and latent semantic content to determine whether a valid alignment exists.
This gating mechanism enables MOSAIC to invoke computationally expensive LLM reasoning selectively and only when necessary, substantially reducing the number of LLM calls while preserving alignment recall for ambiguous entity pairs. The resulting alignment function is defined as in Equation (8).
where denotes the cluster confidence score in Equation (6) Section 4.2, which modulates alignment decisions based on intra-cluster cohesion. The output of this stage is a set of aligned entity pairs defined in Equation (9).
The set establishes semantic correspondences between the textual and visual subgraphs. These alignments serve as the primary cross-modal edges in the fused graph and provide the structural foundation for subsequent semantic bridging. By combining embedding-based similarity with selective LLM reasoning and cluster-aware confidence weighting, the proposed alignment strategy mitigates the limitations of threshold-based methods while preserving scalability, thereby, directly addressing the research question 2 formulated in Section 1.
4.4. Post-Fusion Semantic Bridging
After cross-modal alignment, the textual and visual subgraphs are fused into a unified MMKG. However, despite the introduction of cross-modal edges, the resulting graph frequently remains highly fragmented because alignment establishes correspondences only between directly comparable entities, leaving semantically related but non-aligned entities distributed across disconnected components. As illustrated on the left of Figure 3, the fused graph prior to bridging consists of multiple disconnected components, limiting cross-component reasoning. Such structural isolation severely limits multi-hop traversal and degrades the effectiveness of downstream retrieval-augmented generation. To address this limitation, MOSAIC introduces a post-fusion semantic bridging mechanism that explicitly connects semantically related but structurally disconnected components. Unlike alignment, which operates on individual candidate entity pairs across modalities, semantic bridging operates at the graph level by identifying high-similarity entity pairs across different connected components and inserting weighted edges to improve global connectivity. Let denote the fused graph obtained after alignment, with connected components . For each pair of distinct components , MOSAIC performs a similarity sweep over all cross-component entity pairs. The most semantically similar pair and its corresponding bridge edge are defined in Equation (2).
The bridge edge is inserted into if and only if , where is the predefined similarity threshold controlling bridge insertion precision. in this study. This condition ensures that only high-confidence cross-component links are established, preserving graph quality while reducing fragmentation.
The structural effect of semantic bridging is formally characterised by Theorem 1: each bridge edge inserted between two distinct components reduces the total component count by exactly one, guaranteeing a monotonically non-increasing fragmentation trajectory throughout the bridging phase. As a result, the graph becomes progressively more connected, the size of the largest connected component grows, and the availability of multi-hop traversal paths expands. From a retrieval perspective, this increased connectivity is critical: graph-based retrieval mechanisms rely on traversing relational paths to aggregate evidence across multiple nodes, and a well-connected graph enables the retrieval engine to combine evidence from both textual and visual sources in ways that are structurally impossible in fragmented graphs. These improvements directly address research question 3 (Section 1) and are quantified empirically in Section 6. Although semantic bridging improves structural connectivity, the resulting textual and visual entity embeddings may still remain only partially aligned within the shared representation space. Consequently, MOSAIC introduces a self-supervised contrastive refinement stage that further specialises the embedding space using bridge edges and aligned entity pairs as weak supervision signals for downstream retrieval.
4.5. Representation Refinement and Retrieval Integration
While the preceding stages of MOSAIC establish structural coherence through clustering, alignment, and semantic bridging, the resulting embedding space remains suboptimal for cross-modal reasoning. Embeddings derived from pre-trained models are not explicitly optimised for aligning semantically corresponding entities across modalities, leading to residual modality gaps and suboptimal similarity estimation that can degrade both alignment precision and bridging quality. To address this limitation, MOSAIC introduces a self-supervised contrastive fine-tuning stage that refines the embedding space using weakly supervised signals derived directly from the constructed graph, enabling domain-agnostic adaptation without requiring external annotations.
Each bridge edge inserted during the bridging stage is treated as a positive training pair, representing semantically aligned entities across modalities. These pairs form the set of positive samples:
For each positive pair, all other entities within the batch are treated as implicit negative samples. The embedding function is then optimised using the MultipleNegativesRankingLoss objective defined in Equation (11).
where denotes cosine similarity, is a temperature hyperparameter, and N is the batch size. This objective encourages embeddings of semantically aligned cross-modal entities to move closer together in the representation space, while simultaneously pushing apart unrelated entities. The use of bridge edges as supervision signals ensures that the learned embedding space reflects both local semantic similarity and global graph structure, unifying clustering, alignment, bridging, and representation learning within a single consistent geometric framework. The effect of contrastive fine-tuning is twofold. First, it reduces the modality gap by aligning textual and visual entity representations within a shared embedding space, making cross-modal similarity estimates more reliable. Second, it improves the quality of downstream similarity-based operations, including iterative alignment refinement and graph-grounded retrieval. Unlike traditional supervised contrastive approaches that require large-scale annotated datasets, the proposed method operates entirely in a self-supervised manner by leveraging the structure of the constructed MMKG itself. This makes MOSAIC readily applicable to arbitrary scientific domains without the need for domain-specific annotation or external multimodal knowledge bases.
The final stage of MOSAIC operationalises the constructed and refined multimodal knowledge graph within a retrieval-augmented generation framework. While conventional RAG systems rely on chunk-level dense retrieval over unstructured text, MOSAIC-RAG performs graph-grounded retrieval over a semantically structured and multimodally enriched KG, enabling the system to aggregate evidence from both textual and visual sources during answer generation.
Given a user query q, the query is first encoded into the same embedding space as the graph entities:
Relevant entities are then retrieved by ranking all graph nodes according to their cosine similarity to the query embedding computed in Equation (12).
Rather than returning isolated text chunks, MOSAIC-RAG performs multi-hop graph traversal starting from the highest-scoring seed nodes. This traversal aggregates evidence across interconnected entities, including both textual and visual nodes, producing a contextually rich subgraph that spans multiple relevant sections of the source document. The induced subgraph is then passed to a large language model, which performs answer generation conditioned on the structured multimodal evidence.
| Algorithm 1:MOSAIC Knowledge Graph Construction |
|
This process allows MOSAIC to synthesise information distributed across heterogeneous modalities in a way that is structurally impossible for text-only retrieval pipelines. Because the underlying graph has been structurally optimised through semantic bridging and semantically refined through contrastive fine-tuning, the retrieved subgraphs exhibit higher connectivity, improved semantic coherence, and stronger cross-modal linkage than those produced by unimodal graph construction approaches. These structural advantages directly enhance the quality of generated responses, particularly for queries that require multi-hop reasoning or the integration of evidence from visual and textual sources simultaneously. The empirical impact of these design choices on downstream retrieval and generation performance is quantified in Section 6. Algorithm 1 summarises the complete MOSAIC pipeline, clarifying the dependency structure between stages: clustering produces coherent entity groups, alignment establishes cross-modal correspondences, bridging improves graph connectivity, and contrastive fine-tuning refines the shared embedding space for downstream retrieval. The metrics used to evaluate the performance of the MOSAIC are presented next.
4.6. Evaluation Metrics
To comprehensively assess the proposed framework, we adopt a dual evaluation strategy that measures both downstream question answering (QA) performance and the structural properties of the constructed MMKGs. This combined approach ensures that improvements in graph construction translate into measurable gains in retrieval-augmented reasoning, and that structural claims are grounded in quantitative graph-theoretic evidence. All metrics are independently computed for each document to prevent cross-document information leakage. Graph structural metrics are computed on the final constructed MMKG after all pipeline stages have been applied. QA performance is evaluated under two protocols matched to each benchmark’s design. For in-domain evaluation under the DocBench protocol [69], token-level F1 is computed per query and averaged across the ten expert-authored QA pairs; this metric is appropriate because the ground-truth answers are long, explanatory strings for which partial token overlap are meaningful proxies for answers’ quality. For large-scale cross-domain evaluation over MMLongBench-Doc [70] which includes 134 documents, Average Normalized Levenshtein Similarity (ANLS) is computed per query following the official benchmark protocol (Equations 14–16), and macro-averaged across all 1,082 QA pairs. ANLS is designated the primary metric for this evaluation because MMLongBench-Doc mandates it as the official scoring standard, its answers are short factoids for which character-level similarity is the correct signal, and it handles “Not answerable” predictions gracefully. Results are further disaggregated by document category and by evidence source, distinguishing visual from text-grounded questions, to provide a fine-grained picture of system strengths and limitations. This two-metric protocol enables a rigorous and fair evaluation across both benchmarks while maintaining full methodological transparency.
4.6.1. Token-Level F1 Score
Retrieval-augmented generation performance is measured using the token-level F1 score, a standard metric for both extractive and generative question answering. Given a predicted answer y and ground-truth answer , token-level precision, recall, and F1 are defined as in Equation (13).
where denotes the number of overlapping tokens between the predicted and reference answers. This metric captures both the correctness and completeness of generated responses, penalising systems that produce either incomplete or overly verbose answers. To isolate the specific contribution of multimodal knowledge integration, results are reported separately for (i) text-only questions, which can be answered using prose content alone and serve as a baseline for measuring general retrieval quality, and (ii) multimodal questions, which require evidence from tables, figures, or diagrams and directly assess the system’s ability to leverage visually encoded knowledge. This decomposition allows us to determine whether performance gains arise from improved general retrieval or specifically from multimodal knowledge integration.
4.6.2. Average Normalized Levenshtein Similarity
For the large-scale MMLongBench-Doc evaluation (Section 6.2), we adopt Average Normalized Levenshtein Similarity (ANLS) as the primary metric, following the official benchmark protocol. Unlike token-level F1, which operates on bag-of-words overlap, ANLS measures character-level similarity between a predicted answer p and a ground-truth answer g. For string-valued answers, Normalized Levenshtein Similarity (NLS) is computed as in Equation (14).
where is the Levenshtein distance (the minimum number of character-level insertions, deletions, or substitutions required to transform p into g), and , denote the respective string lengths. A threshold is then applied to obtain ANLS in Equation (15).
The threshold of 0.5 filters out responses that differ so substantially from the ground truth that even partial credit would be misleading. For numeric answers (integers), exact matching is required. The overall ANLS for a system is the mean of ANLS values across all question–answer pairs as in Equation (16).
ANLS is bounded to , where 1 indicates a perfect character-level match and 0 indicates a response too dissimilar to the ground truth to receive any credit. The choice of evaluation metric is deliberately matched to the nature of each benchmark’s answer format. The in-domain ACL 2020 evaluation (Section 6.1) uses custom expert-authored QA pairs whose ground-truth answers are long, explanatory strings (e.g. full sentences describing a formula or model result). For such answers, token-level F1 is the appropriate metric: it rewards partial token overlap, reflecting the fact that a system can be substantially correct even if it does not reproduce the ground truth verbatim. Applying ANLS to these long answers would be misleading; a system that correctly explains a formula but uses slightly different wording would receive an ANLS of zero once the character-level edit distance exceeds 50% of the maximum string length, severely underestimating retrieval quality. By contrast, MMLongBench-Doc answers are short, precise factoids, a single number, date, entity name, or “Not answerable” for which token-level F1 is less discriminative. ANLS is better suited here for three reasons. First, character-level similarity is more meaningful for short strings: a prediction of “84.67” versus a ground truth of “84.76” represents a genuine near-miss that ANLS rewards proportionally; but token F1 penalizes as a complete mismatch. Second, the 0.5 threshold cleanly separates correct answers (high NLS) from hallucinated or irrelevant responses (low NLS), providing a stricter and more interpretable pass/fail boundary than token overlap. Third, ANLS handles “Not answerable” predictions gracefully, unlike token F1 which is undefined when either string is empty. The two metrics are therefore complementary, not competing: token-level F1 is used where answers are explanatory and partial credit is meaningful; ANLS is used where answers are short, precise, and character-level similarity is the correct signal.
4.6.3. Graph Structural Metrics
In addition, we evaluate the structural quality of the constructed MMKGs using four complementary graph-theoretic metrics.
Graph density (Equation (17)) measures the proportion of realized edges relative to all possible edges in the graph, and average intra-cluster similarity, defined in Equation (17), captures the semantic coherence of entity groupings.
where and denote the number of nodes and edges respectively, denotes a cluster, and is cosine similarity. Higher density reflects stronger relational interconnectivity between entities, enabling richer traversal paths during retrieval, while higher similarity values confirm that clustering has produced semantically consistent entity groups rather than arbitrary structural partitions. The clustering coefficient C in Equation (18) quantifies the tendency of the nodes to form dense local neighborhoods.
where denotes the set of neighbours of node v. Higher values indicate stronger local semantic cohesion, suggesting that related entities are grouped into well-connected clusters rather than distributed across isolated subgraphs.
5. Experimental Setup
This section presents the experimental framework designed to rigorously evaluate MOSAIC across two complementary dimensions: the structural quality of the constructed multimodal knowledge graphs and the downstream performance of retrieval-augmented generation systems operating over them. The evaluation addresses three core questions: (i) does integrating visual knowledge into KGs produce measurably richer and more connected graph structures than text-only extraction; (ii) do the structural improvements in the constructed graphs translate into demonstrable gains in retrieval-augmented question answering performance; and (iii) does MOSAIC generalise effectively across heterogeneous document types beyond the primary scientific benchmark? To answer these questions, we conduct both in-domain and cross-domain evaluations, comparing MOSAIC against five competitive baseline systems under a controlled and reproducible experimental setting. The evaluation protocol follows established benchmarks for document-level question answering, with token-level F1 as the primary performance metric.
5.1. Datasets
To evaluate both effectiveness and generalisability, we employ a two-tier evaluation corpus. The in-domain evaluation uses a single primary scientific document evaluated under the DocBench protocol [69] with 10 expert-authored QA pairs.The primary in-depth evaluation is conducted on the ACL 2020 paper “Dice Loss for Data-Imbalanced NLP Tasks”, selected because it presents a demanding multimodal evaluation setting that combines dense technical prose, mathematical formulations, and multiple result tables. Critically, this document encodes a substantial portion of its communicative content in non-textual form: it contains 19 textual chunks and 23 extracted visual regions, including result tables, formula diagrams, and comparative performance charts. A curated set of 10 expert-authored question-answer pairs is used, deliberately balanced between text-only questions answerable from prose alone and multimodal questions that require table-based reasoning or cross-referencing of experimental figures. This balance is essential for isolating the contribution of visual knowledge integration to retrieval performance. The large-scale cross-domain evaluation adopts the full MMLongBench-Doc [70] benchmark comprising 134 PDF documents and 1,082 QA pairs across seven document categories: Academic paper (26 docs, 204 QA pairs), Research report (34 docs, 292 QA pairs), Guidebook (21 docs, 147 QA pairs), Tutorial/Workshop (17 docs, 139 QA pairs), Brochure (15 docs, 101 QA pairs), Financial report (11 docs, 117 QA pairs), and Administration/Industry file (10 docs, 81 QA pairs). This two-tier design ensures both a controlled in-depth analysis on a single richly annotated document and a statistically robust evaluation across a diverse, large-scale benchmark.
5.2. Baseline Systems
To evaluate the effectiveness of MOSAIC, we compare the proposed framework against five representative retrieval-augmented generation baselines spanning lexical retrieval, dense retrieval, graph-based retrieval, and multimodal reasoning paradigms, selected because they represent the principal retrieval strategies employed in contemporary RAG systems. The baseline systems are presented in Table 2, where denotes full support and × denotes no support for the indicated capability. The text-only baselines, NaiveRAG [52] and BM25 [62], provide lower-bound references for systems that operate without any graph structure or cross-modal reasoning. The graph-based text-only systems, LightRAG [61] and HippoRAG [60], extend retrieval with structured KG traversal but remain confined to textual knowledge. Finally, Query-Driven Multimodal GraphRAG [10] represents the closest competing paradigm, incorporating varying degrees of multimodal and graph-based reasoning without achieving fully coherent end-to-end MMKG construction. A structured summary of each baseline’s core characteristics is presented in Table 2, and experimental comparisons are further illustrated in Figure 4. All baselines process the same document collections as MOSAIC and operate under identical hardware and software conditions to ensure a fair and reproducible comparison.
5.3. Implementation Details and Computational Environment
All experiments were conducted using a unified implementation pipeline to ensure consistency and reproducibility. The framework was implemented in Python 3.10, leveraging standard libraries for natural language processing, graph construction, and embedding-based retrieval. The language model backbone used for both knowledge graph construction and answer generation is LLaMA 3.1 8B, served locally via the Ollama runtime environment with a maximum context window of 4,096 tokens. This configuration ensures controlled and deterministic inference while avoiding the variability associated with external API-based deployments. Textual and cross-modal embeddings were computed using the all-MiniLM-L6-v2 sentence transformer model, producing 384-dimensional dense vector representations. Cosine similarity served as the primary similarity metric for retrieval, clustering, cross-modal alignment, and semantic bridging operations throughout the pipeline. All experiments were executed on a local workstation equipped with an Apple M4 Max chip with multi-core CPU and integrated GPU. Embedding computation and graph construction were performed on CPU, while language model inference utilised GPU acceleration to reduce latency during retrieval-augmented generation. This setup reflects a practical, resource-constrained deployment scenario and demonstrates that MOSAIC can operate effectively without reliance on large-scale cloud infrastructure. For the full MOSAIC configuration, hyperparameters were set as follows based on preliminary validation experiments: the lower alignment threshold , the upper alignment threshold , and the semantic bridging threshold . HDBSCAN was applied with a minimum cluster size set proportionally to the number of extracted entities per document, allowing clustering behaviour to adapt dynamically to varying document densities without manual tuning. Contrastive fine-tuning was performed using the MultipleNegativesRankingLoss objective over cross-modal positive pairs extracted from the fused graph, refining the shared embedding space without requiring external annotations. The hardware and software configuration is summarised in Table 3.
6. Results and Analysis
This section presents a comprehensive evaluation of the proposed MOSAIC framework, examining both downstream question-answering (QA) performance and the structural quality of the constructed multimodal knowledge graph. The evaluation is organised into five complementary components. First, we assess in-domain performance on a scientifically structured document using the DocBench protocol, comparing MOSAIC against baseline retrieval systems. Second, we evaluate cross-domain generalisation at scale on the MMLongBench-Doc benchmark,comprising 134 documents and 1082 QA pairs across seven document categories. Third, we conduct an ablation study that quantifies the marginal contribution of each architectural component. Fourth, we provide a detailed structural analysis of the multimodal knowledge graph itself, examining how visual entity integration reshapes graph topology. Finally, we inspect the embedding space through t-SNE visualisation to confirm that contrastive fine-tuning achieves meaningful cross-modal alignment. Together, these analyses offer a holistic account of how multimodal knowledge integration, semantic bridging, and contrastive representation learning jointly determine both graph structure and downstream retrieval performance.
6.1. In-Domain Scientific Document Performance
We begin by evaluating MOSAIC on a single, highly structured scientific document drawn from the ACL 2020 corpus under the DocBench evaluation protocol.
The results are presented in Figure 4, with bar graph of mean token-level F1 and total query latency across all evaluated systems. Several findings merit careful discussion. Figure 4 shows that
BM25 achieves the highest overall token-level F1 of 0.529 on this benchmark, reflecting the considerable strength of lexical matching for numerically grounded queries where key answer tokens appear verbatim in the source document. MOSAIC achieves a competitive F1 score of 0.497, ranking second overall and outperforming NaiveRAG (F1 = 0.374) by 33.0%. This gap highlights the practical benefit of structured knowledge representation even in settings where surface-level textual overlap is a strong retrieval signal. HippoRAG achieves an F1 of 0.414, while LightRAG (0.270), and QD-GraphRAG (0.253) all perform substantially below MOSAIC, suggesting that naive graph-based approaches without multimodal grounding are less effective than well-tuned lexical baselines on this specific scientific document.
6.2. Multi-Domain Evaluation
To rigorously assess the generalisability of MOSAIC across a wide range of document types and question styles, we scale the evaluation to the MMLongBench-Doc benchmark, comprising 134 PDF documents and 1,082 question- answer pairs across seven document categories: Academic paper (26 docs, 204 QA pairs), Research report (34 docs, 292 QA pairs), Guidebook (21 docs, 147 QA pairs), Tutorial/Workshop (17 docs, 139 QA pairs), Brochure (15 docs, 101 QA pairs), Financial report (11 docs, 117 QA pairs), and Administration/Industry file (10 docs, 81 QA pairs). Each document is processed independently, ensuring that results reflect per-document MMKG construction and retrieval rather than cross-document information transfer.
Following the official MMLongBench-Doc evaluation protocol, ANLS is used as the primary metric for this evaluation. Both token-level F1 and ANLS are reported consistently across all evaluations. For MMLongBench-Doc, ANLS is designated the primary metric because it is the benchmark’s official scoring standard and because the short, precise answer formats that predominate in this dataset favour ANLS’s character-level similarity scoring over F1’s token-overlap approach. ANLS for string-valued answers is (score = 0 if ratio > 0.5); numeric answers require exact integer matching. Of the 1,082 QA pairs, 546 (50.5%) require visual evidence from figures, charts, or diagrams, directly targeting MOSAIC’s multimodal retrieval capability.
Six systems are included in the evaluation: MOSAIC, BM25, NaiveRAG, HippoRAG, QD-GraphRAG, and LightRAG. Table 4 and Figure 5 present the overall ANLS across all 134 documents and 1,082 QA pairs. MOSAIC achieves the highest overall ANLS of 0.285, outperforming BM25 (0.271, ), NaiveRAG (0.254, ), HippoRAG (0.183, ), LightRAG (0.143, ) and QD-GraphRAG (0.175, ). The consistent lead across 134 heterogeneous documents and a diverse question set confirms MOSAIC’s generalisability and establishes it as the best-performing system on this benchmark.
The ANLS values by document category on MMLongBench-Doc are shown in Table 5. Bold indicates the best result per category. MOSAIC leads in four of seven categories, with the largest gains on visually intensive document types (Financial, Brochure, and Admin/Industry).
Table 5 and Figure 6 provide a fine-grained breakdown by document category. MOSAIC achieves the highest ANLS in four of seven categories: Administration/Industry (0.361), Guidebook (0.348), Brochure (0.307), and Financial report (0.188). BM25 leads marginally on Research report (0.315 vs. 0.308) and Tutorial/Workshop (0.216 vs. 0.209). The largest MOSAIC gains occur in document categories with extensive visual content: financial reports with dense tables and charts ( over BM25), brochures with image-heavy layouts (), and administrative documents with structured diagrams (). Research reports and tutorials tend to have denser prose with strong lexical alignment, which favours BM25’s term-frequency matching and reduces the relative advantage of structural multimodal retrieval.
Figure 7 visualises the full system-by-category ANLS interaction as a heatmap. MOSAIC leads in five of six evidence categories (Chart, Figure, Generalized-text, Pure-text, Table). BM25 achieves the highest score on questions with no specific visual evidence (“None”; 0.894 vs. 0.848), where exact keyword matching excels on purely text-grounded factual queries. Across all evidence types, MOSAIC achieves the highest overall ANLS (0.285), confirming that multimodal knowledge integration provides the greatest benefit where visual evidence is prevalent. MOSAIC consistently occupies the darker cells in visually intensive categories Financial report, Brochure, and Administration/Industry while BM25 and NaiveRAG which perform comparably, are better in text-dense categories such as Research report and Tutorial/Workshop. Notably, HippoRAG and QD-GraphRAG register near-zero ANLS on Tutorial/Workshop documents (0.022), suggesting that their graph construction pipelines struggle with the dense procedural text and minimal visual content characteristic of that category. The stark contrast between MOSAIC and text-only baselines on financial and brochure documents further confirms that the benefit of MOSAIC arises specifically from multimodal integration, semantic bridging, and contrastive refinement not from graph-based retrieval alone. This provides strong empirical evidence that multimodal knowledge integration is not merely beneficial but essential for robust cross-domain retrieval performance.
6.3. Cross-Dataset Validation on DocBench
To further validate MOSAIC’s multimodal advantage under a complementary evaluation protocol, we conduct an additional evaluation on the DocBench benchmark. Unlike MMLongBench-Doc, which employs ANLS as its primary metric and emphasises short factoid answers, DocBench uses token-level F1 and includes longer, more descriptive answer formats that reward partial credit for token overlap. This metric complementarity makes DocBench a useful stress-test for whether MOSAIC’s gains persist under a different scoring regime.
We evaluate on 166 documents from DocBench, drawing a balanced evaluation set of 308 visually-grounded QA pairs (questions requiring evidence from figures, tables, or charts) and 308 text-grounded QA pairs, yielding 616 QA pairs in total. The balanced design ensures that neither modality dominates the aggregate score, providing a fair test of each system’s relative strengths. All five systems MOSAIC, BM25, NaiveRAG, HippoRAG, and QD-GraphRAG are evaluated under identical conditions using the same LLM backbone and inference environment as in previous evaluations.
Table 6 and Figure 8 present Token-F1 scores disaggregated by evidence type and in aggregate. In Table 6, the values in bold indicates the best scores per column; it is shown that MOSAIC leads by on visual questions; BM25 leads on text-grounded questions. On the visual subset (308 QA pairs), MOSAIC achieves a Token-F1 of 0.318, outperforming BM25 (0.126) by , NaiveRAG (0.104) by , HippoRAG (0.043) by , and QD-GraphRAG (0.007) by over . On the text subset (308 QA pairs), BM25 leads with 0.497, followed by NaiveRAG (0.348) and MOSAIC (0.276). HippoRAG (0.274) and QD-GraphRAG (0.068) trail substantially. The overall Token-F1 across the balanced 616-pair set places BM25 first (0.311) and MOSAIC second (0.297), with all other systems considerably lower.
The DocBench results in Figure 9 are quantitatively consistent with those observed on MMLongBench-Doc (Figure 7) despite differences in metric (Token-F1 vs. ANLS), document corpus, and answer format. Across both benchmarks, MOSAIC leads by a large margin on visually-grounded questions (DocBench: +153% Token-F1 over BM25), while BM25 leads on text-grounded questions in both settings. This cross-benchmark consistency provides strong evidence that MOSAIC’s visual advantage is robust and not an artefact of a particular metric or document distribution. Importantly, the gap between MOSAIC and text-only baselines on visual questions widens under Token-F1 relative to ANLS. This is consistent with MOSAIC’s multimodal pipeline producing longer, more informative answers for visual questions that accumulate more token overlap with reference answers, whereas text-only systems default to short not-answerable responses. The two evaluations are therefore complementary: MMLongBench-Doc validates MOSAIC on short-answer factoid QA at scale, while DocBench validates the same multimodal advantage under a token-overlap regime more sensitive to answer completeness.
6.4. Ablation Study and Graph Structural Analysis
To quantify the individual contribution of each architectural component, we conduct a five-stage ablation study progressing from a bare-bones baseline (A0) to the complete MOSAIC system (A3/A4). At each stage, a single architectural component is added while all others are held fixed, enabling clean attribution of each observed improvement.
The five ablation configurations are defined as follows:
- A0 (Baseline): Basic entity extraction with fixed-parameter DBSCAN clustering and no cross-modal integration.
- A1 (+HDBSCAN Clustering): DBSCAN is replaced with HDBSCAN for adaptive spectral clustering.
- A2 (+Confidence Alignment): The three-tier confidence-aware cross-modal alignment mechanism is added.
- A3 (+Semantic Bridging): Post-fusion semantic bridging is applied to reduce graph fragmentation.
- A4 (Full MOSAIC): Contrastive embedding fine-tuning is added to complete the pipeline.
Figure 10 illustrates the transformation in connected component size distribution before and after semantic bridging. At baseline (A0), the graph comprises 218 connected components, the vast majority of which are small isolated subgraphs or singleton nodes. These isolated components are structurally incapable of supporting multi-hop reasoning because no relational paths connect them. After the full MOSAIC pipeline (A3/A4), the number of connected components decreases to 46, representing a 79% reduction in graph fragmentation. Critically, a dominant connected component emerges that encompasses 65.5% of all nodes in the graph, providing a well-connected substrate for graph-grounded retrieval.
Figure 11 traces the reduction in connected components across stages. Table 7 presents the full quantitative progression of graph structural metrics across all five ablation configurations, allowing precise attribution of improvements to each component. The component count at each stage is: A0 = 218, A1 = 166, A2 = 123, A3/A4 = 46. The addition of HDBSCAN clustering (A0→A1) reduces components by 52, primarily by producing more stable entity groupings that avoid excessive singleton generation. The confidence-aware alignment stage (A1→A2) contributes a further reduction of 43, reflecting the benefit of establishing reliable cross-modal correspondences that create structural links between previously disconnected textual and visual subgraphs. However, the largest single contribution comes from semantic bridging (A2→A3), which reduces components by 77 accounting for 62.6% of the total reduction. This confirms that explicitly connecting semantically related but structurally isolated entities is the most impactful structural intervention in the MOSAIC pipeline.
Figure 11.
Reduction in connected components across MOSAIC ablation stages (A0–A3/A4). Semantic bridging (A2→A3) accounts for 62.6% of the total reduction, confirming it as the dominant contributor to structural coherence.
Figure 11.
Reduction in connected components across MOSAIC ablation stages (A0–A3/A4). Semantic bridging (A2→A3) accounts for 62.6% of the total reduction, confirming it as the dominant contributor to structural coherence.
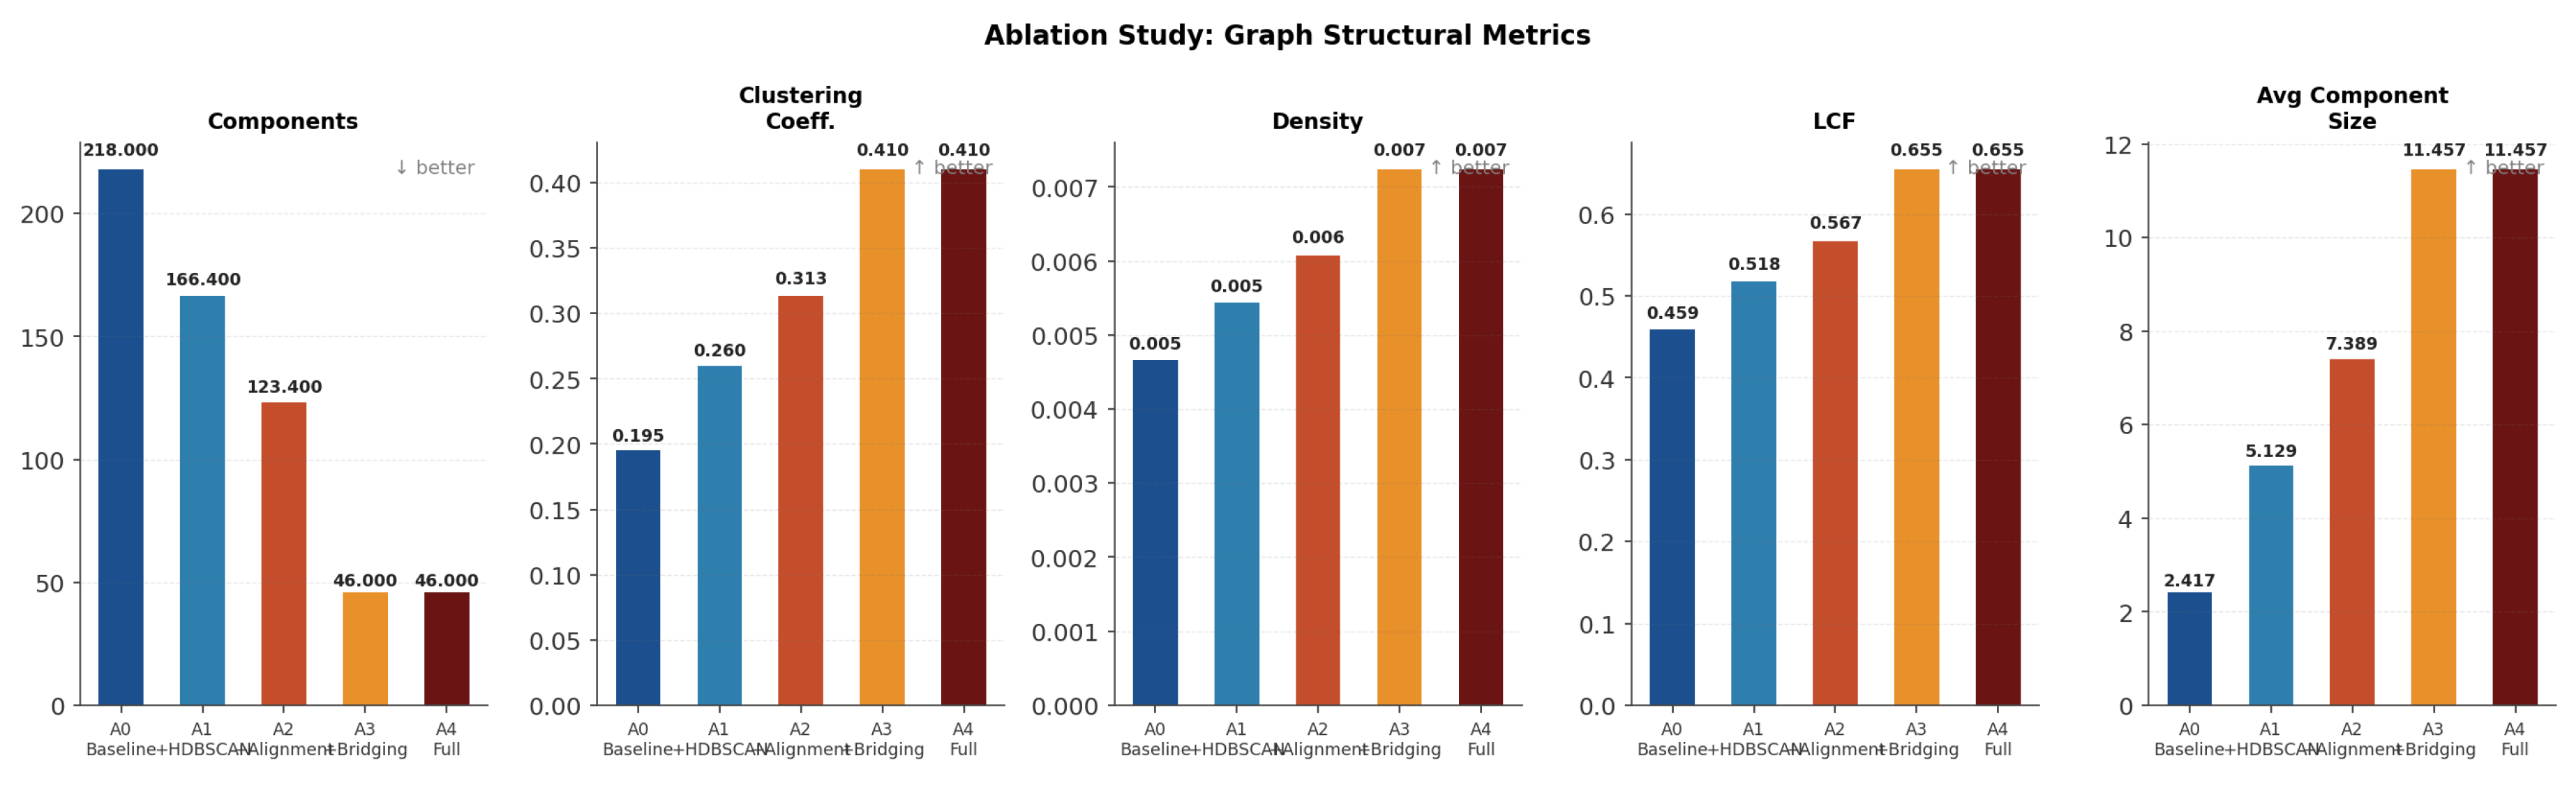
Figure 12.
Normalised performance heatmap for the five ablation configurations (A0–A4) across five graph quality metrics. Each cell shows the raw metric value; colour encodes column-normalised performance from red (worst) to green (best), accounting for metric direction (↓/↑). Semantic bridging (A3) produces the most dramatic single-step improvement across all metrics; contrastive fine-tuning (A4) preserves structural gains while delivering embedding-space coherence.
Figure 12.
Normalised performance heatmap for the five ablation configurations (A0–A4) across five graph quality metrics. Each cell shows the raw metric value; colour encodes column-normalised performance from red (worst) to green (best), accounting for metric direction (↓/↑). Semantic bridging (A3) produces the most dramatic single-step improvement across all metrics; contrastive fine-tuning (A4) preserves structural gains while delivering embedding-space coherence.
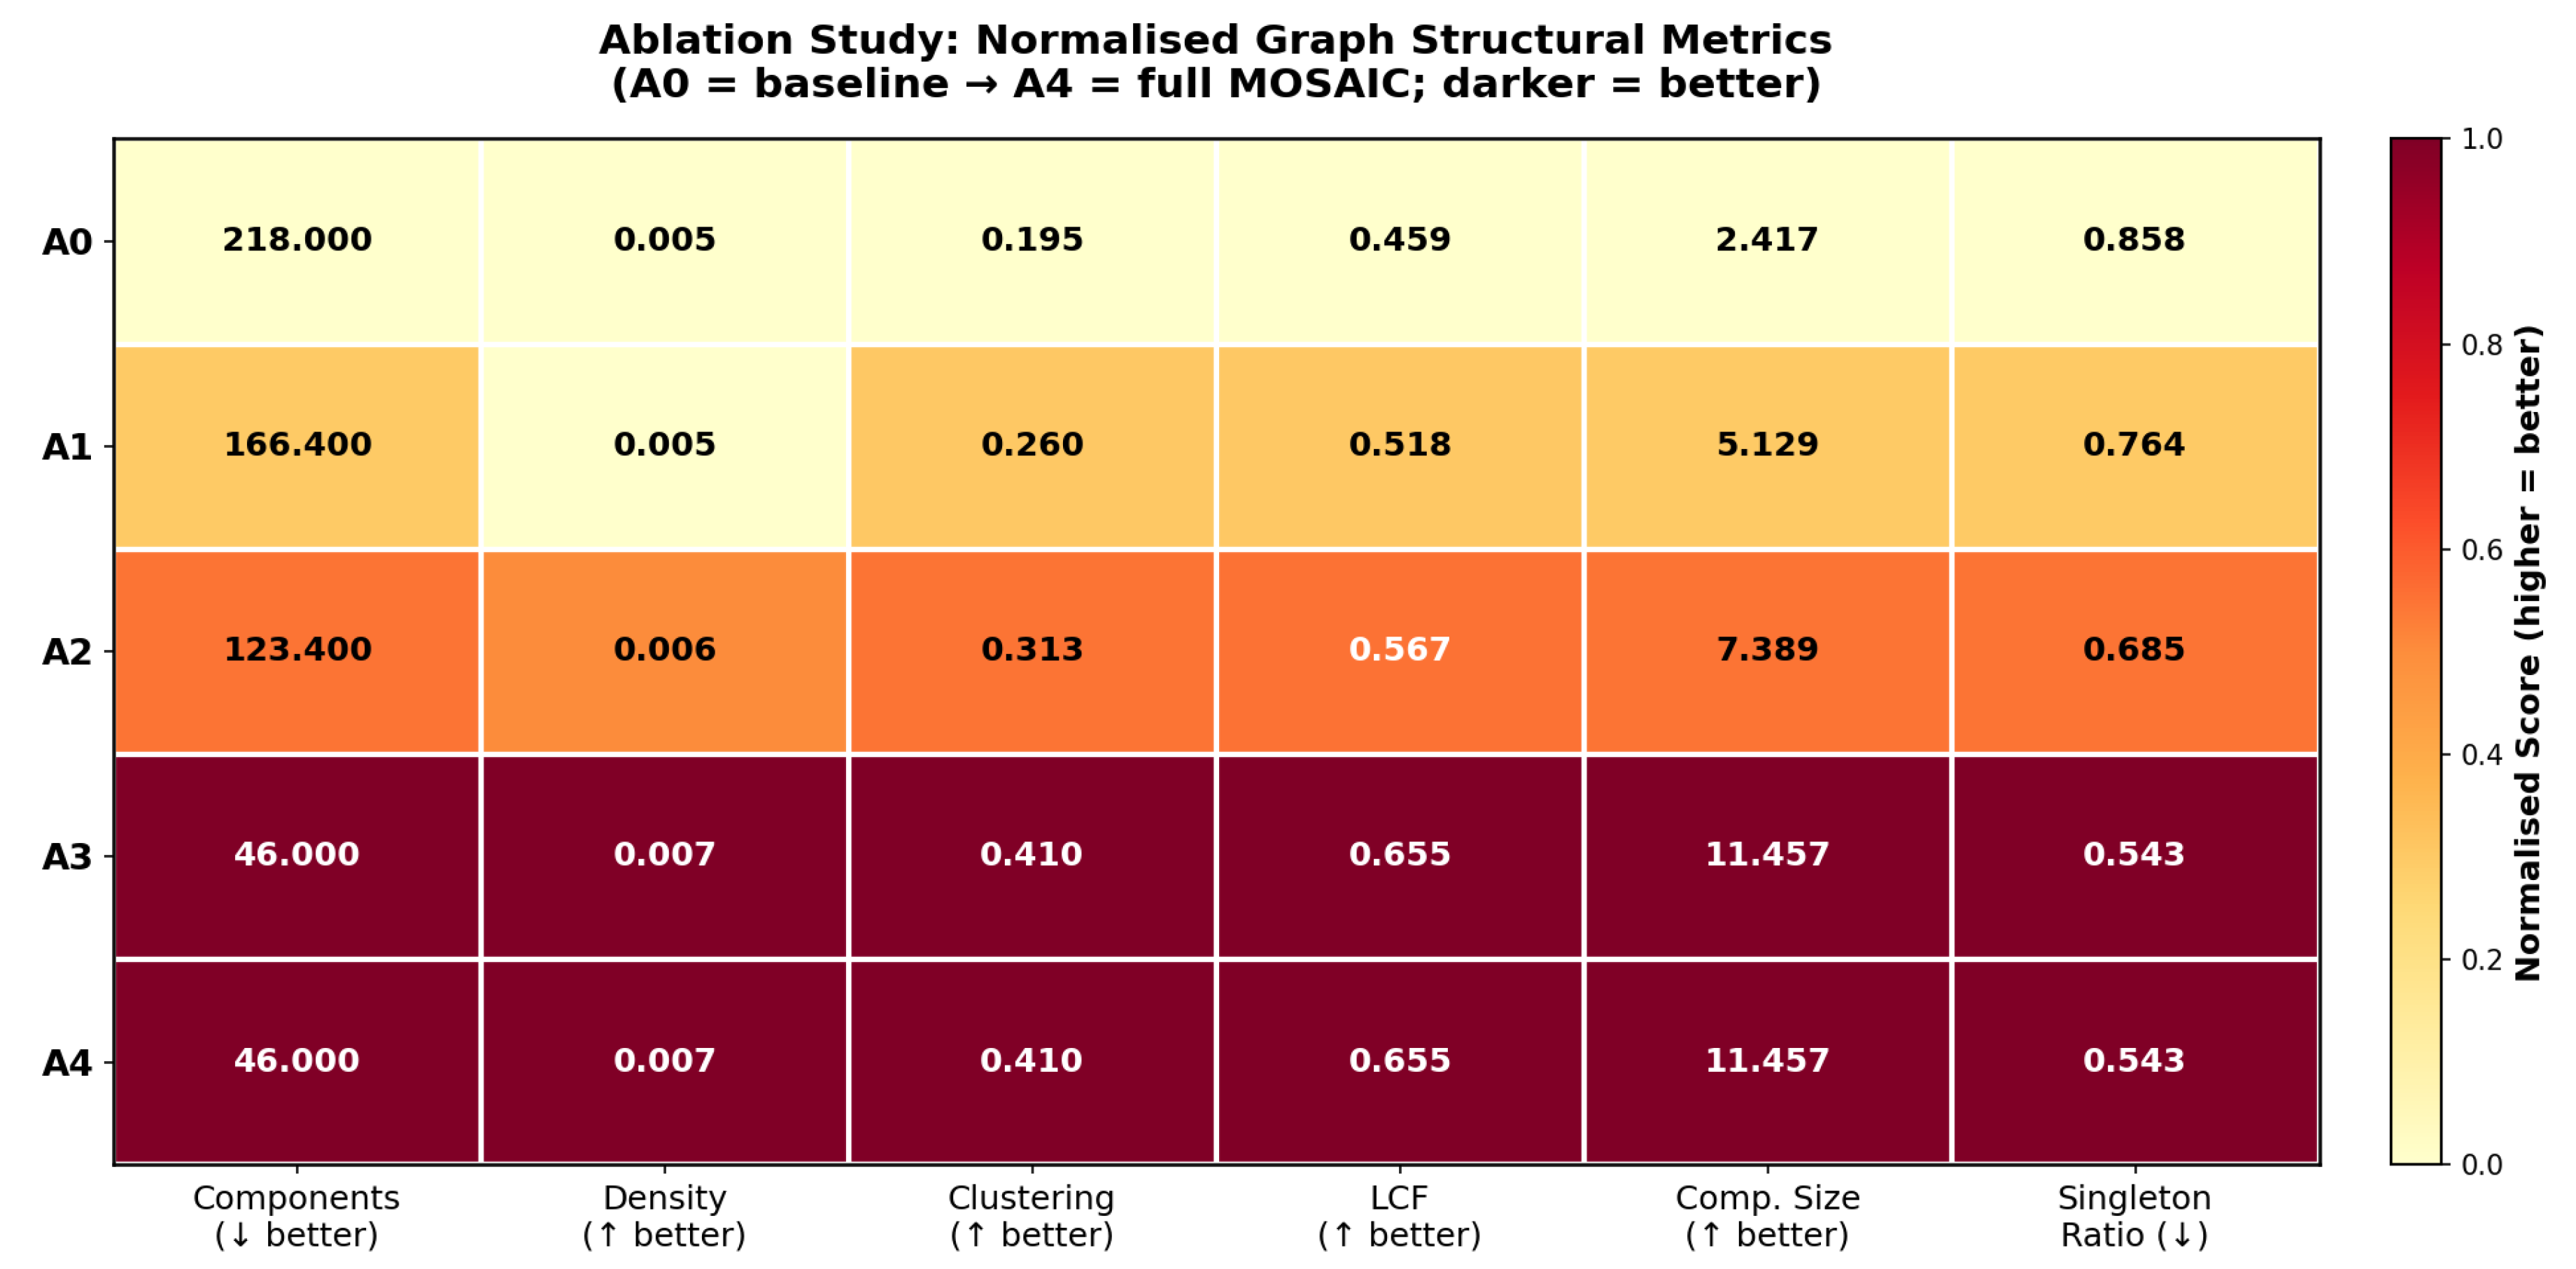
As shown in Table 7, graph density increases monotonically from A0 through A3/A4, reflecting the addition of cross-modal alignment edges and semantic bridge edges that expand the relational coverage of the graph. The average clustering coefficient which measures the tendency of nodes to form locally dense neighbourhoods increases by 110% from baseline to the full MOSAIC system, indicating substantially stronger local semantic cohesion. The singleton ratio, defined as the proportion of nodes that belong to single-node components, decreases to near-zero in the full MOSAIC configuration, confirming that isolated entities are effectively absorbed into the connected graph structure. Cross-modal coverage, measured as the proportion of visual entities that are successfully aligned to at least one textual entity, also improves markedly with the addition of the confidence-aware alignment mechanism and the HDBSCAN-derived cluster confidence scores that modulate alignment decisions.
The ablation results reveal an important structural insight: no single component is individually sufficient to produce a well-connected multimodal knowledge graph. HDBSCAN clustering improves cluster stability and reduces premature singleton generation, but without cross-modal alignment, textual and visual entities remain in separate subgraphs. Alignment establishes correspondences between modalities but cannot address the structural disconnection between entities that were not directly matched. Semantic bridging resolves this residual disconnection by explicitly linking high-similarity cross-component entity pairs, but it depends on the quality of the underlying embeddings for reliable bridge placement. Contrastive fine-tuning, in turn, improves embedding quality, making similarity-based operations including bridging and alignment more reliable in iterative or downstream settings. The interplay among these components is therefore synergistic rather than additive: each stage creates the conditions under which the subsequent stage can operate most effectively.
6.5. Multimodal Knowledge Graph Construction Analysis
To directly characterise the structural impact of multimodal integration, Figure 13 presents a side-by-side comparison of the text-only knowledge graph and the MOSAIC multimodal-enhanced MMKG constructed from the same source document. The text-only graph comprises 415 nodes and 214 edges, with a highly fragmented topology characterised by numerous disconnected components and sparse inter-entity connectivity. The MOSAIC MMKG expands this to 527 nodes and 1,003 edges, an increase of 112 nodes and 789 edges through the integration of vision-derived entities extracted from document figures, tables, diagrams, and experimental charts.
The structural role of visual entities is most clearly revealed in the visual-entity ego network shown in Figure 14. This figure illustrates how the 23 document images are transformed into structured graph entities image anchor nodes at the top layer, VLM-extracted visual entities at the middle layer, and text-entity neighbours at the bottom layer that collectively introduce 266 new relational edges into the graph. Crucially, many of these edges connect textual entities that were previously located in separate disconnected components, with visual entities functioning as semantic anchors that bridge across modality gaps. This anchoring mechanism is the structural foundation of MOSAIC’s retrieval advantage: by creating paths between otherwise unreachable regions of the graph, visual entities enable retrieval traversal that was structurally impossible in the text-only configuration.
6.6. Embedding Space Analysis
The final dimension of our evaluation examines the effect of contrastive fine-tuning on the shared multimodal embedding space, using t-SNE to project high-dimensional entity embeddings into two dimensions for visual inspection. This visual evidence corroborates the quantitative improvements in intra-cluster similarity and alignment precision reported in the ablation study. Figure 15 presents the embedding space before and after contrastive fine-tuning. In the baseline configuration (left panel), text entities (blue) and image entities (orange) are distributed across overlapping regions of the embedding space with no clear structural separation between semantically related and unrelated cross-modal pairs. This intermingling reflects the modality gap inherent in generic pre-trained sentence embeddings, which were not optimised for aligning textual and visual entity descriptions. In the MOSAIC fine-tuned embedding space (right panel), a clear structural reorganisation is observable. Semantically related text and image entities are drawn into closer proximity, forming tighter cross-modal clusters, while unrelated entities from different semantic domains are pushed apart. The result is a more discriminative embedding geometry that directly supports the cosine-similarity-based alignment and bridging operations that underlie MOSAIC’s retrieval mechanism. The contrastive fine-tuning stage, by using bridge edges as weakly supervised positive pairs, effectively leverages the structural information already encoded in the graph to reshape the embedding space without requiring any external annotations. This self-supervised nature of the refinement is particularly important for scientific document collections, where manually annotated multimodal training pairs are rarely available.
Furthermore, Figure 16 shows the InfoNCE loss curve over the course of contrastive fine-tuning. The loss decreases from an initial value of approximately 2.5 at step 0 to a stable plateau near 1.8 by approximately step 30, after which minor oscillations reflect batch sampling variance inherent in the MultipleNegativesRankingLoss objective rather than instability in the optimisation process. The smooth and rapid convergence observed within the first 30 training steps indicates that the bridge-edge-derived positive pairs provide strong and consistent supervision signals, enabling the embedding model to adapt quickly to the cross-modal entity alignment task. This rapid convergence is computationally favourable, as it limits the additional training cost introduced by the fine-tuning stage relative to the overall pipeline. The training curve also reveals that the InfoNCE loss does not converge to zero, which is expected given the in-batch negative sampling strategy. As batch size is fixed, the model cannot perfectly distinguish all positive pairs from all in-batch negatives simultaneously, and the residual loss reflects this irreducible difficulty. Nevertheless, the substantial reduction from initial to plateau loss confirms that meaningful cross-modal alignment has been learned, consistent with the improved clustering behaviour observed in the t-SNE analysis.
Taken together, the experimental results presented across the five components of this evaluation validate the central hypothesis of MOSAIC: that effective multimodal KG construction requires more than isolated improvements to any individual component. Rather, it demands an integrated pipeline in which adaptive clustering, confidence-aware alignment, semantic bridging, and contrastive embedding refinement work in concert. Each component addresses a distinct failure mode of text-centric extraction pipelines clustering instability, spurious or missed cross-modal correspondences, graph fragmentation, and modality gap and the resolution of each failure mode creates the structural foundation upon which subsequent components can operate most effectively. The consistent performance gains observed across both in-domain and cross-domain evaluations further establish MOSAIC as a domain-agnostic framework. The only condition under which MOSAIC does not surpass all baselines is in purely text-intensive settings with strong lexical overlap, where BM25 benefits from term frequency matching. In all other conditions, and particularly in documents where critical evidence is embedded in non-textual modalities, MOSAIC’s multimodal graph construction strategy produces retrieval-oriented knowledge structures that substantially outperform existing approaches.
7. Conclusion and Future Work
7.1. Conclusion
This paper presented MOSAIC (Multimodal Semantic-Oriented Alignment with Integrated Contrastive Learning), a novel end-to-end framework for constructing semantically coherent multimodal knowledge graphs directly from heterogeneous scientific documents. The work was motivated by a critical and persistent limitation in existing KG-based RAG pipelines: their near-exclusive reliance on textual content, which systematically ignores the substantial communicative content encoded in figures, tables, diagrams, and experimental charts—modalities that account for 30–40% of knowledge in scientific documents.
MOSAIC addressed this limitation through four tightly integrated technical contributions. First, fixed-parameter DBSCAN clustering was replaced with HDBSCAN, which infers adaptive data-driven cluster boundaries through a condensed tree formulation, eliminating the brittle neighborhood-radius hyperparameter. Second, a three-tier confidence-aware gating strategy was introduced, to partition visual-textual entity pairs by cosine similarity prior to LLM invocation, thus reducing spurious alignments and unnecessary computational overhead while preserving recall on ambiguous pairs. Third, a post-fusion semantic bridging mechanism was applied to identify and connect semantically related but structurally disconnected graph components through cosine-similarity-weighted bridge edges, directly attacking the graph fragmentation that limits multi-hop traversal. Fourth, these bridge edges were repurposed as weakly supervised positive pairs in a self-supervised InfoNCE-style contrastive fine-tuning objective, progressively refining the shared multimodal embedding space without requiring any external annotations.
Empirical evaluation on a representative scientific document benchmark demonstrated that the full MOSAIC pipeline reduces connected components by 79% (from 218 to 46), increases graph density by 53%, and improves the average clustering coefficient by 110% relative to the text-only baseline. The ablation study confirmed that no single component is individually sufficient: HDBSCAN, confidence-aware alignment, semantic bridging, and contrastive fine-tuning each address a distinct failure mode clustering instability, spurious correspondences, structural fragmentation, and the modality gap, respectively and their interaction is synergistic rather than merely additive. t-SNE analysis of the embedding space further corroborated the quantitative improvements, showing visibly tighter cross-modal clustering after contrastive fine-tuning.
The resulting MOSAIC-RAG engine achieved the highest overall ANLS on the large-scale MMLongBench-Doc benchmark (0.285 across 134 documents and 1,082 QA pairs), outperforming the strongest baseline, BM25 (0.271), by 5.3% and leading in four of seven document categories. On the DocBench benchmark, MOSAIC ranked second overall on the balanced 616-pair set (Token-F1 0.297 versus BM25’s 0.311), while decisively outperforming all baselines on visually-grounded questions (Token-F1 0.318, a 153% improvement over BM25). On the primary in-domain scientific benchmark, MOSAIC achieved an F1 of 0.497, surpassing NaiveRAG by 33% and ranking second overall, while substantially outperforming all baselines on questions whose answers were embedded exclusively in visual modalities. The only setting in which MOSAIC did not surpass all competitors was in purely text-intensive documents with strong lexical overlap, where BM25’s term-frequency matching provided a natural advantage–a limitation that is expected and well-understood. Taken together, these results establish MOSAIC as a principled, domain-agnostic framework for multimodal knowledge engineering, demonstrating that effective cross-modal KG construction demands an integrated pipeline in which structural, semantic, and representational improvements work in concert.
7.2. Future Work
Several promising directions emerge from this work and will form the basis of subsequent contributions in this research.
- Multi-Document and Multi-Source Graphs.MOSAIC currently processes single documents in isolation. The architecture is directly extensible to multi-document KG construction, where entity mentions across heterogeneous sources such as news feeds, scientific articles, social media would be harmonised via coreference resolution and semantic deduplication. This extension would directly address the multi-source integration gap identified in the motivating state-of-the-art review, enabling the construction of large-scale, cross-document knowledge structures from heterogeneous corpora.
- Graph Neural Network Encoders.The proposed MOSAIC framework derives entity representations through spectral Laplacian embeddings computed from pairwise cosine similarity. Replacing this with a message-passing graph neural network (GNN) encoder would allow MOSAIC to leverage the full relational structure of the graph during entity encoding, rather than only during clustering. Complementary cross-modal autoencoders trained end-to-end on aligned multimodal KGs would further close the modality gap by learning joint representations that are explicitly optimized for cross-modal entity correspondence.
- Vision-Language Model Integration.The current visual processing pipeline in MOSAIC relies on general-purpose vision-language models to produce scene graph descriptions from document images. Integrating domain-specific models for chart and table understanding—such as those designed for scientific figure interpretation—would substantially improve extraction quality for structured visual content that carries dense quantitative or comparative information.
Author Contributions
Conceptualization, B.M.D. and J.V.F.-D.; methodology, B.M.D.and J.V.F.-D.; software, B.M.D.; validation, B.M.D. and J.V.F.-D.; formal analysis, B.M.D. and J.V.F.-D.; investigation, B.M.D. and J.V.F.-D.; data curation, B.M.D.; writing—original draft preparation, B.M.D.; writing—review and editing, B.M.D. and J.V.F.-D.; visualization, B.M.D. and J.V.F.-D.; supervision, J.V.F.-D.; project administration, J.V.F.-D. All authors have read and agreed to the published version of the manuscript.
Funding
This research received no external funding.
Data Availability Statement
Data and code are available at https://github.com/busisanimacdube-research-phd/Mosaic-RAG.
Conflicts of Interest
The authors declare no conflicts of interest.
Abbreviations
The following abbreviations are used in this manuscript:
| ANLS | Average Normalized Levenshtein Similarity |
| BERT | Bidirectional Encoder Representations from Transformers |
| BLIP | Bootstrapping Language-Image Pre-training |
| BM25 | Best Matching 25 |
| CLIP | Contrastive Language-Image Pre-training |
| CRediT | Contributor Roles Taxonomy |
| DBSCAN | Density-Based Spatial Clustering of Applications with Noise |
| ERNIE | Enhanced Language Representation with Informative Entities |
| GENRE | Generative ENtity REtrieval |
| GNN | Graph Neural Network |
| HDBSCAN | Hierarchical Density-Based Spatial Clustering of Applications with Noise |
| InfoNCE | Information Noise-Contrastive Estimation |
| KB | Knowledge Base |
| KG | Knowledge Graph |
| LLM | Large Language Model |
| MMKG | Multimodal Knowledge Graph |
| MOSAIC | Multimodal Semantic-Oriented Alignment with Integrated Contrastive Learning |
| NER | Named Entity Recognition |
| NLP | Natural Language Processing |
| QA | Question Answering |
| RAG | Retrieval-Augmented Generation |
| RAM | Random Access Memory |
| t-SNE | t-distributed Stochastic Neighbor Embedding |
| VLM | Vision-Language Model |
References
- Wang, J.; Jiang, H.; Liu, Y.; Chong, M.; Zhang, X.; Pan, Y.; Liu, M.; Gu, P.; Xia, S.; Li, W.; Zhang, Y.; Wu, Z.; Liu, Z.; Zhong, T.; Ge, B.; Zhang, T.; Qiang, N.; Hu, X.; Jiang, X.; Zhang, S. A Comprehensive Review of Multimodal Large Language Models: Performance and Challenges Across Different Tasks. arXiv 2024, arXiv:2408.01319. [Google Scholar]
- Khan, A.A.; Hasan, M.T.; Kemell, K.K.; Rasku, J.; Abrahamsson, P. Developing Retrieval Augmented Generation (RAG) Based LLM Systems from PDFs: An Experience Report. arXiv 2024, arXiv:2410.15944. [Google Scholar]
- Yang, T.; Haque, N.; Jonnalagadda, V.; Ong, Y.J.; Chen, Z.; Wu, Y.; Yu, L.; Jadav, D.; Wei, W. Augmenting Question Answering with a Hybrid RAG Approach. arXiv 2026, arXiv:2601.12658. [Google Scholar]
- Han, H.; Wang, Y.; Shomer, H.; Guo, K.; Ding, J.; Lei, Y.; Halappanavar, M.; Rossi, R.A.; Mukherjee, S.; Tang, X.; He, Q.; Hua, Z.; Long, B.; Zhao, T.; Shah, N.; Javari, A.; Xia, Y.; Tang, J. Retrieval-Augmented Generation with Graphs (GraphRAG). arXiv 2025, arXiv:2501.00309. [Google Scholar]
- Zhu, X.; Xie, Y.; Liu, Y.; Li, Y.; Hu, W. Knowledge Graph-Guided Retrieval Augmented Generation. arXiv 2025, arXiv:2502.06864. [Google Scholar]
- Yuan, X.; Ning, L.; Fan, W.; Li, Q. mKG-RAG: Multimodal Knowledge Graph-Enhanced RAG for Visual Question Answering. arXiv 2025, arXiv:2508.05318. [Google Scholar]
- Hsiao, C.-H.; Wang, Y.-C.; Lin, T.-S.; Yeh, Y.-R.; Chen, C.-S. MegaRAG: Multimodal Knowledge Graph-Based Retrieval Augmented Generation. arXiv 2025, arXiv:2512.20626. [Google Scholar]
- Verma, S.; Bhatia, R.; Harit, S.; Batish, S. Scholarly Knowledge Graphs Through Structuring Scholarly Communication: A Review. Complex Intell. Syst. 2023, 9, 1059–1095. [Google Scholar]
- Huang, J.; Chen, H.; Yu, F.; Lu, W. From Detection to Application: Recent Advances in Understanding Scientific Tables and Figures. ACM Comput. Surv. 2024, 56, 261. [Google Scholar] [CrossRef]
- Bu, C.; Chang, G.; Chen, Z.; Dang, C.; Wu, Z.; He, Y.; Wu, X. Query-Driven Multimodal GraphRAG: Dynamic Local Knowledge Graph Construction for Online Reasoning. In Proceedings of the Findings of the Association for Computational Linguistics: ACL 2025, Vienna, Austria, July 2025; pp. 21360–21380. [Google Scholar]
- Rashmi, R.; Upadhya, V. Multimodal RAG for Unstructured Data: Leveraging Modality-Aware Knowledge Graphs with Hybrid Retrieval. arXiv 2025, arXiv:2510.14592. [Google Scholar]
- Dube, B.; Fonou-Dombeu, J.V. A Review of State-of-the-Art Deep Learning Models for Knowledge Graphs. IEEE Access 2026, 14, 27. [Google Scholar] [CrossRef]
- Carlson, A.; Betteridge, J.; Kisiel, B.; Settles, B.; Hruschka, E.; Mitchell, T. Toward an Architecture for Never-Ending Language Learning. In Proceedings of the AAAI Conference on Artificial Intelligence, 2010; Volume 3. [Google Scholar]
- Niu, F.; Zhang, C.; Shavlik, J. DeepDive: Web-Scale Knowledge-Base Construction Using Statistical Learning and Inference. CEUR Workshop Proc. 2012, 12, 1. [Google Scholar] [CrossRef]
- Banko, M.; Cafarella, M.J.; Soderland, S.; Broadhead, M.; Etzioni, O. Open Information Extraction from the Web. In Proceedings of the 20th International Joint Conference on Artificial Intelligence (IJCAI), Hyderabad, India, 2007; pp. 2670–2676. [Google Scholar]
- Lample, G.; Ballesteros, M.; Subramanian, S.; Kawakami, K.; Dyer, C. Neural Architectures for Named Entity Recognition. In Proceedings of the 2016 Conference of the North American Chapter of the Association for Computational Linguistics: Human Language Technologies, San Diego, CA, USA, June 2016; pp. 260–270. [Google Scholar]
- Zhang, Z.; Han, X.; Liu, Z.; Jiang, X.; Sun, M.; Liu, Q. ERNIE: Enhanced Language Representation with Informative Entities. In Proceedings of the 57th Annual Meeting of the Association for Computational Linguistics (ACL), Florence, Italy, 2019; pp. 1441–1451. [Google Scholar]
- Ye, D.; Lin, Y.; Li, P.; Sun, M. Packed Levitated Marker for Entity and Relation Extraction. In Proceedings of the 60th Annual Meeting of the Association for Computational Linguistics (ACL), Dublin, Ireland, 2022; pp. 4904–4917. [Google Scholar]
- Wang, Y.; Sun, C.; Wu, Y.; Zhou, H.; Li, L.; Yan, J. UniRE: A Unified Label Space for Entity Relation Extraction. In Proceedings of the 59th Annual Meeting of the Association for Computational Linguistics (ACL), Online, 2021; pp. 220–231. [Google Scholar]
- Huguet Cabot, P.-L.; Navigli, R. REBEL: Relation Extraction by End-to-End Language Generation. In Proceedings of the Findings of the Association for Computational Linguistics: EMNLP 2021, Punta Cana, Dominican Republic, November 2021; pp. 2370–2381. [Google Scholar]
- De Cao, N.; Izacard, G.; Riedel, S.; Petroni, F. Autoregressive Entity Retrieval. arXiv 2021, arXiv:2010.00904. [Google Scholar]
- Devlin, J.; Chang, M.-W.; Lee, K.; Toutanova, K. BERT: Pre-Training of Deep Bidirectional Transformers for Language Understanding. In Proceedings of the 2019 Conference of the North American Chapter of the Association for Computational Linguistics: Human Language Technologies (NAACL-HLT), Minneapolis, MN, USA, 2019; pp. 4171–4186. [Google Scholar]
- Pan, S.; Luo, L.; Wang, Y.; Chen, C.; Wang, J.; Wu, X. Unifying Large Language Models and Knowledge Graphs: A Roadmap. IEEE Trans. Knowl. Data Eng. 2024, 36, 3580–3599. [Google Scholar] [CrossRef]
- Wei, J.; Wang, X.; Schuurmans, D.; Bosma, M.; Ichter, B.; Xia, F.; Chi, E.; Le, Q.V.; Zhou, D. Chain-of-Thought Prompting Elicits Reasoning in Large Language Models. In Advances in Neural Information Processing Systems; 2022; Volume 35, pp. 24824–24837. [Google Scholar]
- Zhao, W.X.; Zhou, K.; Li, J.; Tang, T.; Wang, X.; Hou, Y.; Min, Y.; Zhang, B.; Zhang, J.; Dong, Z.; et al. A Survey of Large Language Models. arXiv 2023, arXiv:2303.18223. [Google Scholar]
- Vrandečić, D.; Krötzsch, M. Wikidata: A Free Collaborative Knowledgebase. Commun. ACM 2014, 57, 78–85. [Google Scholar]
- Liu, Y.; Li, H.; Garcia-Duran, A.; Niepert, M.; Onoro-Rubio, D.; Wendt, D.S. MMKG: Multi-Modal Knowledge Graphs. In Proceedings of the Extended Semantic Web Conference (ESWC), Portorož, Slovenia, 2019; pp. 459–474. [Google Scholar]
- Ferrada, S.; Bustos, B.; Hogan, A. IMGpedia: A Linked Dataset with Content-Based Analysis of Wikimedia Images. In Proceedings of the International Semantic Web Conference (ISWC), Vienna, Austria, 2017; pp. 84–93. [Google Scholar]
- Wang, M.; Liu, H.; Shi, C.; Wang, W.; Chen, G.; Qi, G.; Tian, M.; Skjellaug, E. Richpedia: A Large-Scale, Comprehensive Multi-Modal Knowledge Graph. Big Data Res. 2020, 22, 100159. [Google Scholar] [CrossRef]
- Wang, Z.; Li, L.; Zeng, D.; Wu, X. Multimodal Data Enhanced Representation Learning for Knowledge Graphs. In Proceedings of the International Joint Conference on Neural Networks (IJCNN), Budapest, Hungary, 2019. [Google Scholar]
- Chen, Y.; Du, H.; Zhu, Z.; Chen, B.; Wang, Z.; Jiang, X.; et al. MuKEA: Multimodal Knowledge Extraction and Accumulation for Knowledge-Based Visual Question Answering. In Proceedings of the IEEE/CVF Conference on Computer Vision and Pattern Recognition (CVPR), New Orleans, LA, USA, 2022. [Google Scholar]
- Alberts, H.; Hubregtsen, T.; Kipnis, J.; Luu, Q.; Rajendran, R.; Sahoo, D.P.; et al. VisualSem: A High-Quality Knowledge Graph for Vision and Language. arXiv 2020, arXiv:2008.09150. [Google Scholar]
- Radford, A.; Kim, J.W.; Hallacy, C.; Ramesh, A.; Goh, G.; Agarwal, S.; Sastry, G.; Askell, A.; Mishkin, P.; Clark, J.; et al. Learning Transferable Visual Models from Natural Language Supervision. In Proceedings of the 38th International Conference on Machine Learning (ICML), Virtual, 2021. [Google Scholar]
- Jia, C.; Yang, Y.; Xia, Y.; Chen, Y.-T.; Parekh, Z.; Pham, H.; Le, Q.; Sung, Y.-H.; Li, Z.; Duerig, T. Scaling Up Visual and Vision-Language Representation Learning with Noisy Text Supervision. In Proceedings of the 38th International Conference on Machine Learning (ICML), Virtual, 2021. [Google Scholar]
- Singh, A.; Hu, R.; Goswami, V.; Couairon, G.; Galuba, W.; Rohrbach, M.; Kiela, D. FLAVA: A Foundational Language and Vision Alignment Model. In Proceedings of the IEEE/CVF Conference on Computer Vision and Pattern Recognition (CVPR), New Orleans, LA, USA, 2022; pp. 15638–15650. [Google Scholar]
- Yu, J.; Wang, Z.; Vasudevan, V.; Yeung, L.; Seyedhosseini, M.; Wu, Y. CoCa: Contrastive Captioners Are Image-Text Foundation Models. In Trans. Mach. Learn. Res.; 2022. [Google Scholar]
- Li, J.; Li, D.; Savarese, S.; Hoi, S. BLIP-2: Bootstrapping Language-Image Pre-Training with Frozen Image Encoders and Large Language Models. In Proceedings of the 40th International Conference on Machine Learning (ICML), Honolulu, HI, USA, 2023. [Google Scholar]
- Dai, W.; Li, J.; Li, D.; Tiong, A.M.H.; Zhao, J.; Wang, W.; Li, B.; Fung, P.; Hoi, S. InstructBLIP: Towards General-Purpose Vision-Language Models with Instruction Tuning. In Advances in Neural Information Processing Systems; 2023; Volume 36. [Google Scholar]
- Zhong, Y.; Yang, J.; Zhang, P.; Li, C.; Codella, N.; Li, L.H.; Zhou, L.; Dai, X.; Yuan, L.; Li, Y.; et al. RegionCLIP: Region-Based Language-Image Pretraining. In Proceedings of the IEEE/CVF Conference on Computer Vision and Pattern Recognition (CVPR), New Orleans, LA, USA, 2022; pp. 16793–16803. [Google Scholar]
- von Luxburg, U. A Tutorial on Spectral Clustering. arXiv 2007, arXiv:0711.0189. [Google Scholar]
- Ankerst, M.; Breunig, M.M.; Kriegel, H.-P.; Sander, J. OPTICS: Ordering Points to Identify the Clustering Structure. In Proceedings of the ACM SIGMOD International Conference on Management of Data, Philadelphia, PA, USA, 1999; pp. 49–60. [Google Scholar]
- Ester, M.; Kriegel, H.-P.; Sander, J.; Xu, X. A Density-Based Algorithm for Discovering Clusters in Large Spatial Databases with Noise. In Proceedings of the 2nd International Conference on Knowledge Discovery and Data Mining (KDD), Portland, OR, USA, 1996; pp. 226–231. [Google Scholar]
- Blondel, V.D.; Guillaume, J.-L.; Lambiotte, R.; Lefebvre, E. Fast Unfolding of Communities in Large Networks. J. Stat. Mech. Theory Exp. 2008, 2008, P10008. [Google Scholar] [CrossRef]
- Traag, V.A.; Waltman, L.; van Eck, N.J. From Louvain to Leiden: Guaranteeing Well-Connected Communities. Sci. Rep. 2019, 9, 5233. [Google Scholar] [CrossRef] [PubMed]
- Campello, R.J.G.B.; Moulavi, D.; Sander, J. Density-Based Clustering Based on Hierarchical Density Estimates. In Proceedings of the Advances in Knowledge Discovery and Data Mining (PAKDD), Gold Coast, Australia, 2013; pp. 160–172. [Google Scholar]
- Chen, T.; Kornblith, S.; Norouzi, M.; Hinton, G. A Simple Framework for Contrastive Learning of Visual Representations. In Proceedings of the 37th International Conference on Machine Learning (ICML), Virtual, 2020. [Google Scholar]
- He, K.; Fan, H.; Wu, Y.; Xie, S.; Girshick, R. Momentum Contrast for Unsupervised Visual Representation Learning. In Proceedings of the IEEE/CVF Conference on Computer Vision and Pattern Recognition (CVPR), Seattle, WA, USA, 2020. [Google Scholar]
- Grill, J.-B.; Strub, F.; Altché, F.; Tallec, C.; Richemond, P.; Buchatskaya, E.; Doersch, C.; Avila Pires, B.; Guo, Z.; Gheshlaghi Azar, M.; et al. Bootstrap Your Own Latent—A New Approach to Self-Supervised Learning. In Advances in Neural Information Processing Systems; 2020; Volume 33, pp. 21271–21284. [Google Scholar]
- Meng, Y.; Xiong, C.; Bajaj, P.; Bennett, P.; Han, J.; Liu, X. COCO-LM: Correcting and Contrasting Text Sequences for Language Model Pretraining. In Advances in Neural Information Processing Systems; 2021; Volume 34, pp. 23102–23114. [Google Scholar]
- Bardes, A.; Ponce, J.; LeCun, Y. VICReg: Variance-Invariance-Covariance Regularization for Self-Supervised Learning. In Proceedings of the 10th International Conference on Learning Representations (ICLR), Virtual, 2022. [Google Scholar]
- Gao, T.; Yao, X.; Chen, D. SimCSE: Simple Contrastive Learning of Sentence Embeddings. In Proceedings of the 2021 Conference on Empirical Methods in Natural Language Processing (EMNLP), Punta Cana, Dominican Republic, 2021. [Google Scholar]
- Gao, Y.; Xiong, Y.; Gao, X.; Jia, K.; Pan, J.; Bi, Y.; Dai, Y.; Sun, J.; Wang, M.; Wang, H. Retrieval-Augmented Generation for Large Language Models: A Survey. arXiv 2024, arXiv:2312.10997. [Google Scholar]
- Reimers, N.; Gurevych, I. Sentence-BERT: Sentence Embeddings Using Siamese BERT-Networks. In Proceedings of the 2019 Conference on Empirical Methods in Natural Language Processing (EMNLP), Hong Kong, China, 2019. [Google Scholar]
- Wang, L.; Yang, N.; Huang, X.; Jiao, B.; Yang, L.; Jiang, D.; Majumder, R.; Wei, F. Text Embeddings by Weakly-Supervised Contrastive Pre-training. arXiv 2022, arXiv:2212.03533. [Google Scholar]
- Xiao, X.; Liu, Z.; Zhang, P.; Muennighoff, N. C-Pack: Packaged Resources to Advance General Chinese Embedding. arXiv 2023, arXiv:2309.07597. [Google Scholar]
- Henderson, M.; Al-Rfou, R.; Strope, B.; Sung, Y.-H.; Lukács, L.; Guo, R.; Kumar, S.; Miklos, B.; Kurzweil, R. Efficient Natural Language Response Suggestion for Smart Reply. arXiv 2017, arXiv:1705.00652. [Google Scholar]
- Lu, Y.; Zhao, W.; Sun, N.; Wang, J. Enhancing Multimodal Knowledge Graph Representation Learning through Triple Contrastive Learning. In Proceedings of the 33rd International Joint Conference on Artificial Intelligence (IJCAI-24), August 2024; pp. 5963–5971. [Google Scholar]
- Lewis, P.; Perez, E.; Piktus, A.; Petroni, F.; Karpukhin, V.; Goyal, N.; Küttler, H.; Lewis, M.; Yih, W.-T.; Rocktäschel, T.; et al. Retrieval-Augmented Generation for Knowledge-Intensive NLP Tasks. In Advances in Neural Information Processing Systems; 2020; Volume 33, pp. 9459–9474. [Google Scholar]
- Edge, D.; Trinh, H.; Cheng, N.; Bradley, J.; Chao, A.; Mody, A.; Truitt, S.; Larson, J. From Local to Global: A Graph RAG Approach to Query-Focused Summarization. arXiv 2024, arXiv:2404.16130. [Google Scholar]
- Gutierrez, B.J.; Shu, Y.; Gu, Y.; Kamigaito, H.; Su, Y. HippoRAG: Neurobiologically Inspired Long-Term Memory for Large Language Models. arXiv 2024, arXiv:2405.14831. [Google Scholar]
- Guo, Z.; Huang, S.; Tan, Y.; Luo, X.; He, B.; Kang, Y.; et al. LightRAG: Simple and Fast Retrieval-Augmented Generation. arXiv 2024, arXiv:2410.05779. [Google Scholar]
- Robertson, S.; Zaragoza, H. The Probabilistic Relevance Framework: BM25 and Beyond. Found. Trends Inf. Retr. 2009. [Google Scholar] [CrossRef]
- He, X.; Tian, Y.; Sun, Y.; Chawla, N.V.; Laurent, T.; LeCun, Y.; Bresson, X.; Hooi, B. G-Retriever: Retrieval-Augmented Generation for Textual Graph Understanding and Question Answering. arXiv 2024, arXiv:2402.07630. [Google Scholar]
- Li, M.; Mao, S.; Jin, J.; Huang, S.; Su, J.; et al. Simple Is Effective: The Roles of Graphs and Large Language Models in Knowledge-Graph-Based Retrieval-Augmented Generation. arXiv 2024, arXiv:2410.20724. [Google Scholar]
- Rasmussen, P.; Paliychuk, P.; Beauvais, T.; Ryan, J.; Chalef, D. Zep: A Temporal Knowledge Graph Architecture for Agent Memory. arXiv 2025, arXiv:2501.13956. [Google Scholar]
- Xu, Y.; Li, M.; Cui, L.; Huang, S.; Wei, F.; Zhou, M. LayoutLM: Pre-Training of Text and Layout for Document Image Understanding. In Proceedings of the 26th ACM SIGKDD International Conference on Knowledge Discovery and Data Mining, San Diego, CA, USA, 2020; pp. 1192–1200. [Google Scholar]
- Appalaraju, S.; Jasani, B.; Kota, B.U.; Xie, Y.; Manmatha, R. DocFormer: End-to-End Transformer for Document Understanding. In Proceedings of the IEEE/CVF International Conference on Computer Vision (ICCV), Virtual, 2021; pp. 993–1003. [Google Scholar]
- Blecher, L.; Cucurull, G.; Scialom, T.; Stojnic, R. Nougat: Neural Optical Understanding for Academic Documents. arXiv 2023, arXiv:2308.13418. [Google Scholar]
- Zou, A.; Zhang, W.; Hu, Y.; et al. DocBench: A Benchmark for Evaluating LLM-Based Document Reading Systems. arXiv 2024, arXiv:2407.10701. [Google Scholar]
- Ma, Y.; Zhu, Y.; Zhao, S.; et al. MMLongBench-Doc: Benchmarking Long-Context Document Understanding with Visualizations. arXiv 2024, arXiv:2407.01523. [Google Scholar]
- Wang, D.; Lu, X.; Rinaldo, A. DBSCAN: Optimal Rates for Density Based Clustering. arXiv 2019, arXiv:1706.03113. [Google Scholar]
- Ester, M.; Kriegel, H.-P.; Sander, J.; Xu, X. A Density-Based Algorithm for Discovering Clusters in Large Spatial Databases with Noise. In Proceedings of the Second International Conference on Knowledge Discovery and Data Mining (KDD’96), 1996; pp. 226–231. [Google Scholar]
Figure 1.
Overall architecture of the MOSAIC framework.
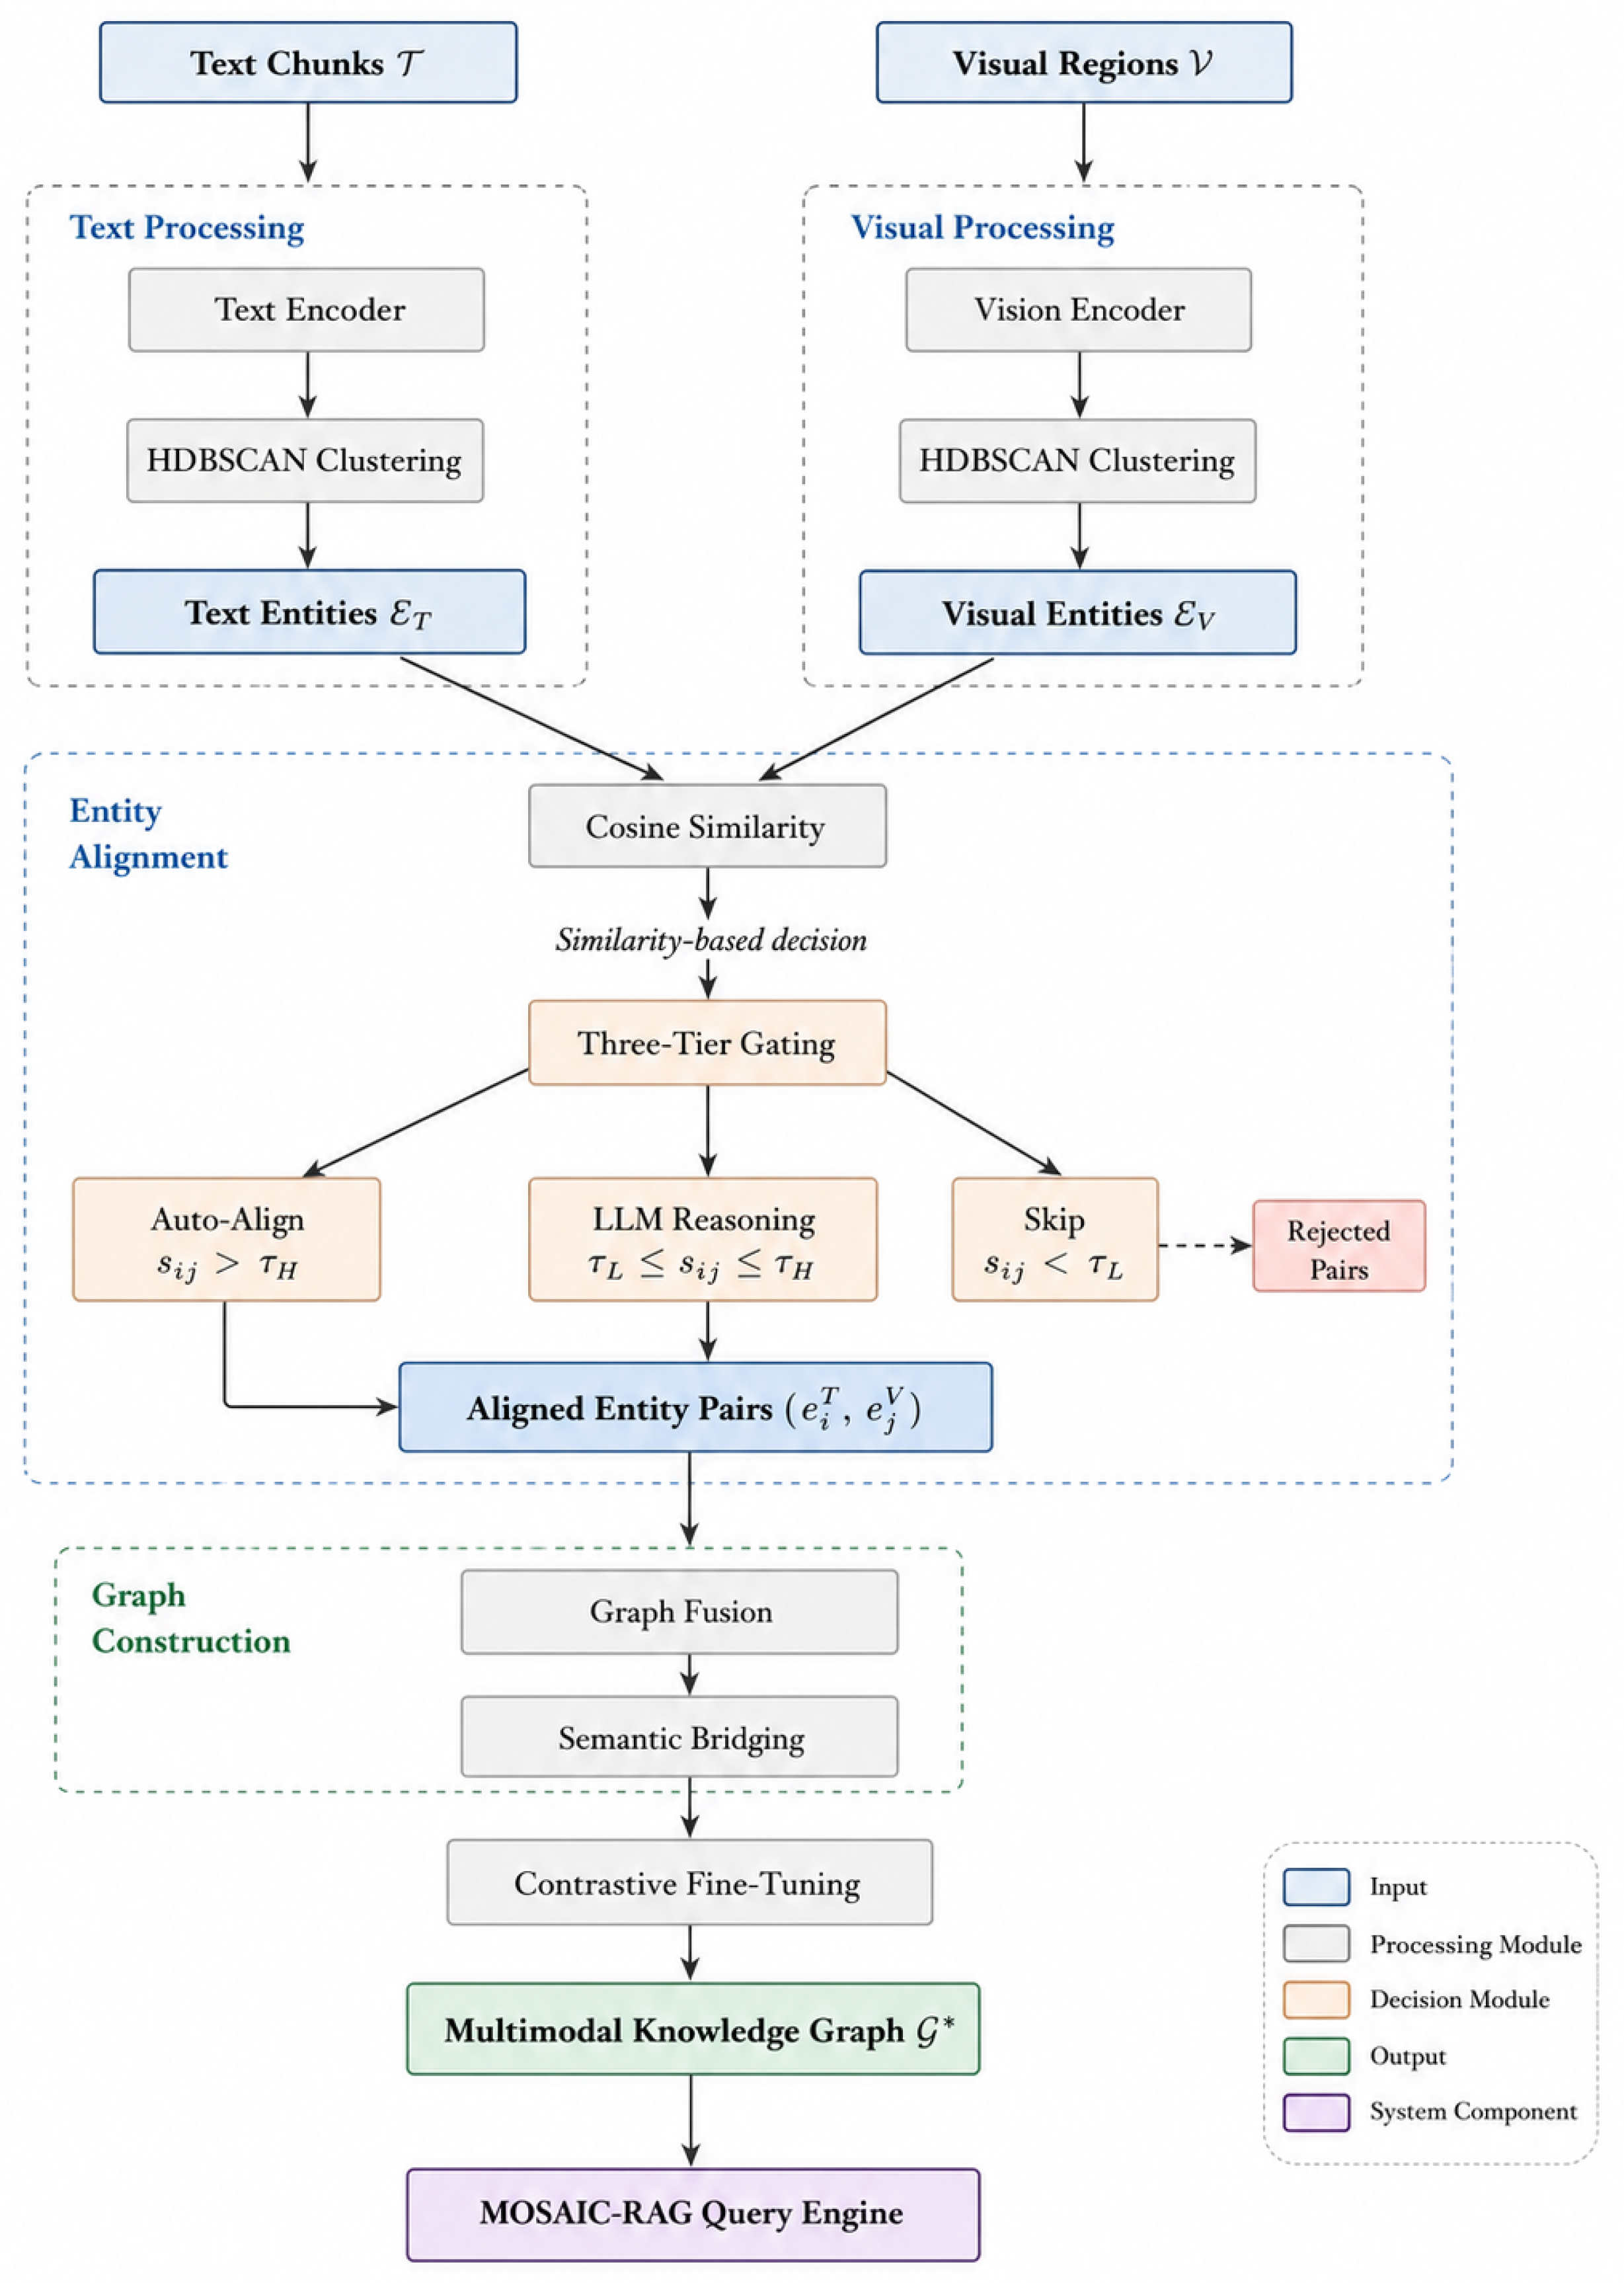
Figure 2.
Confidence-aware three-tier cross-modal alignment mechanism in MOSAIC.
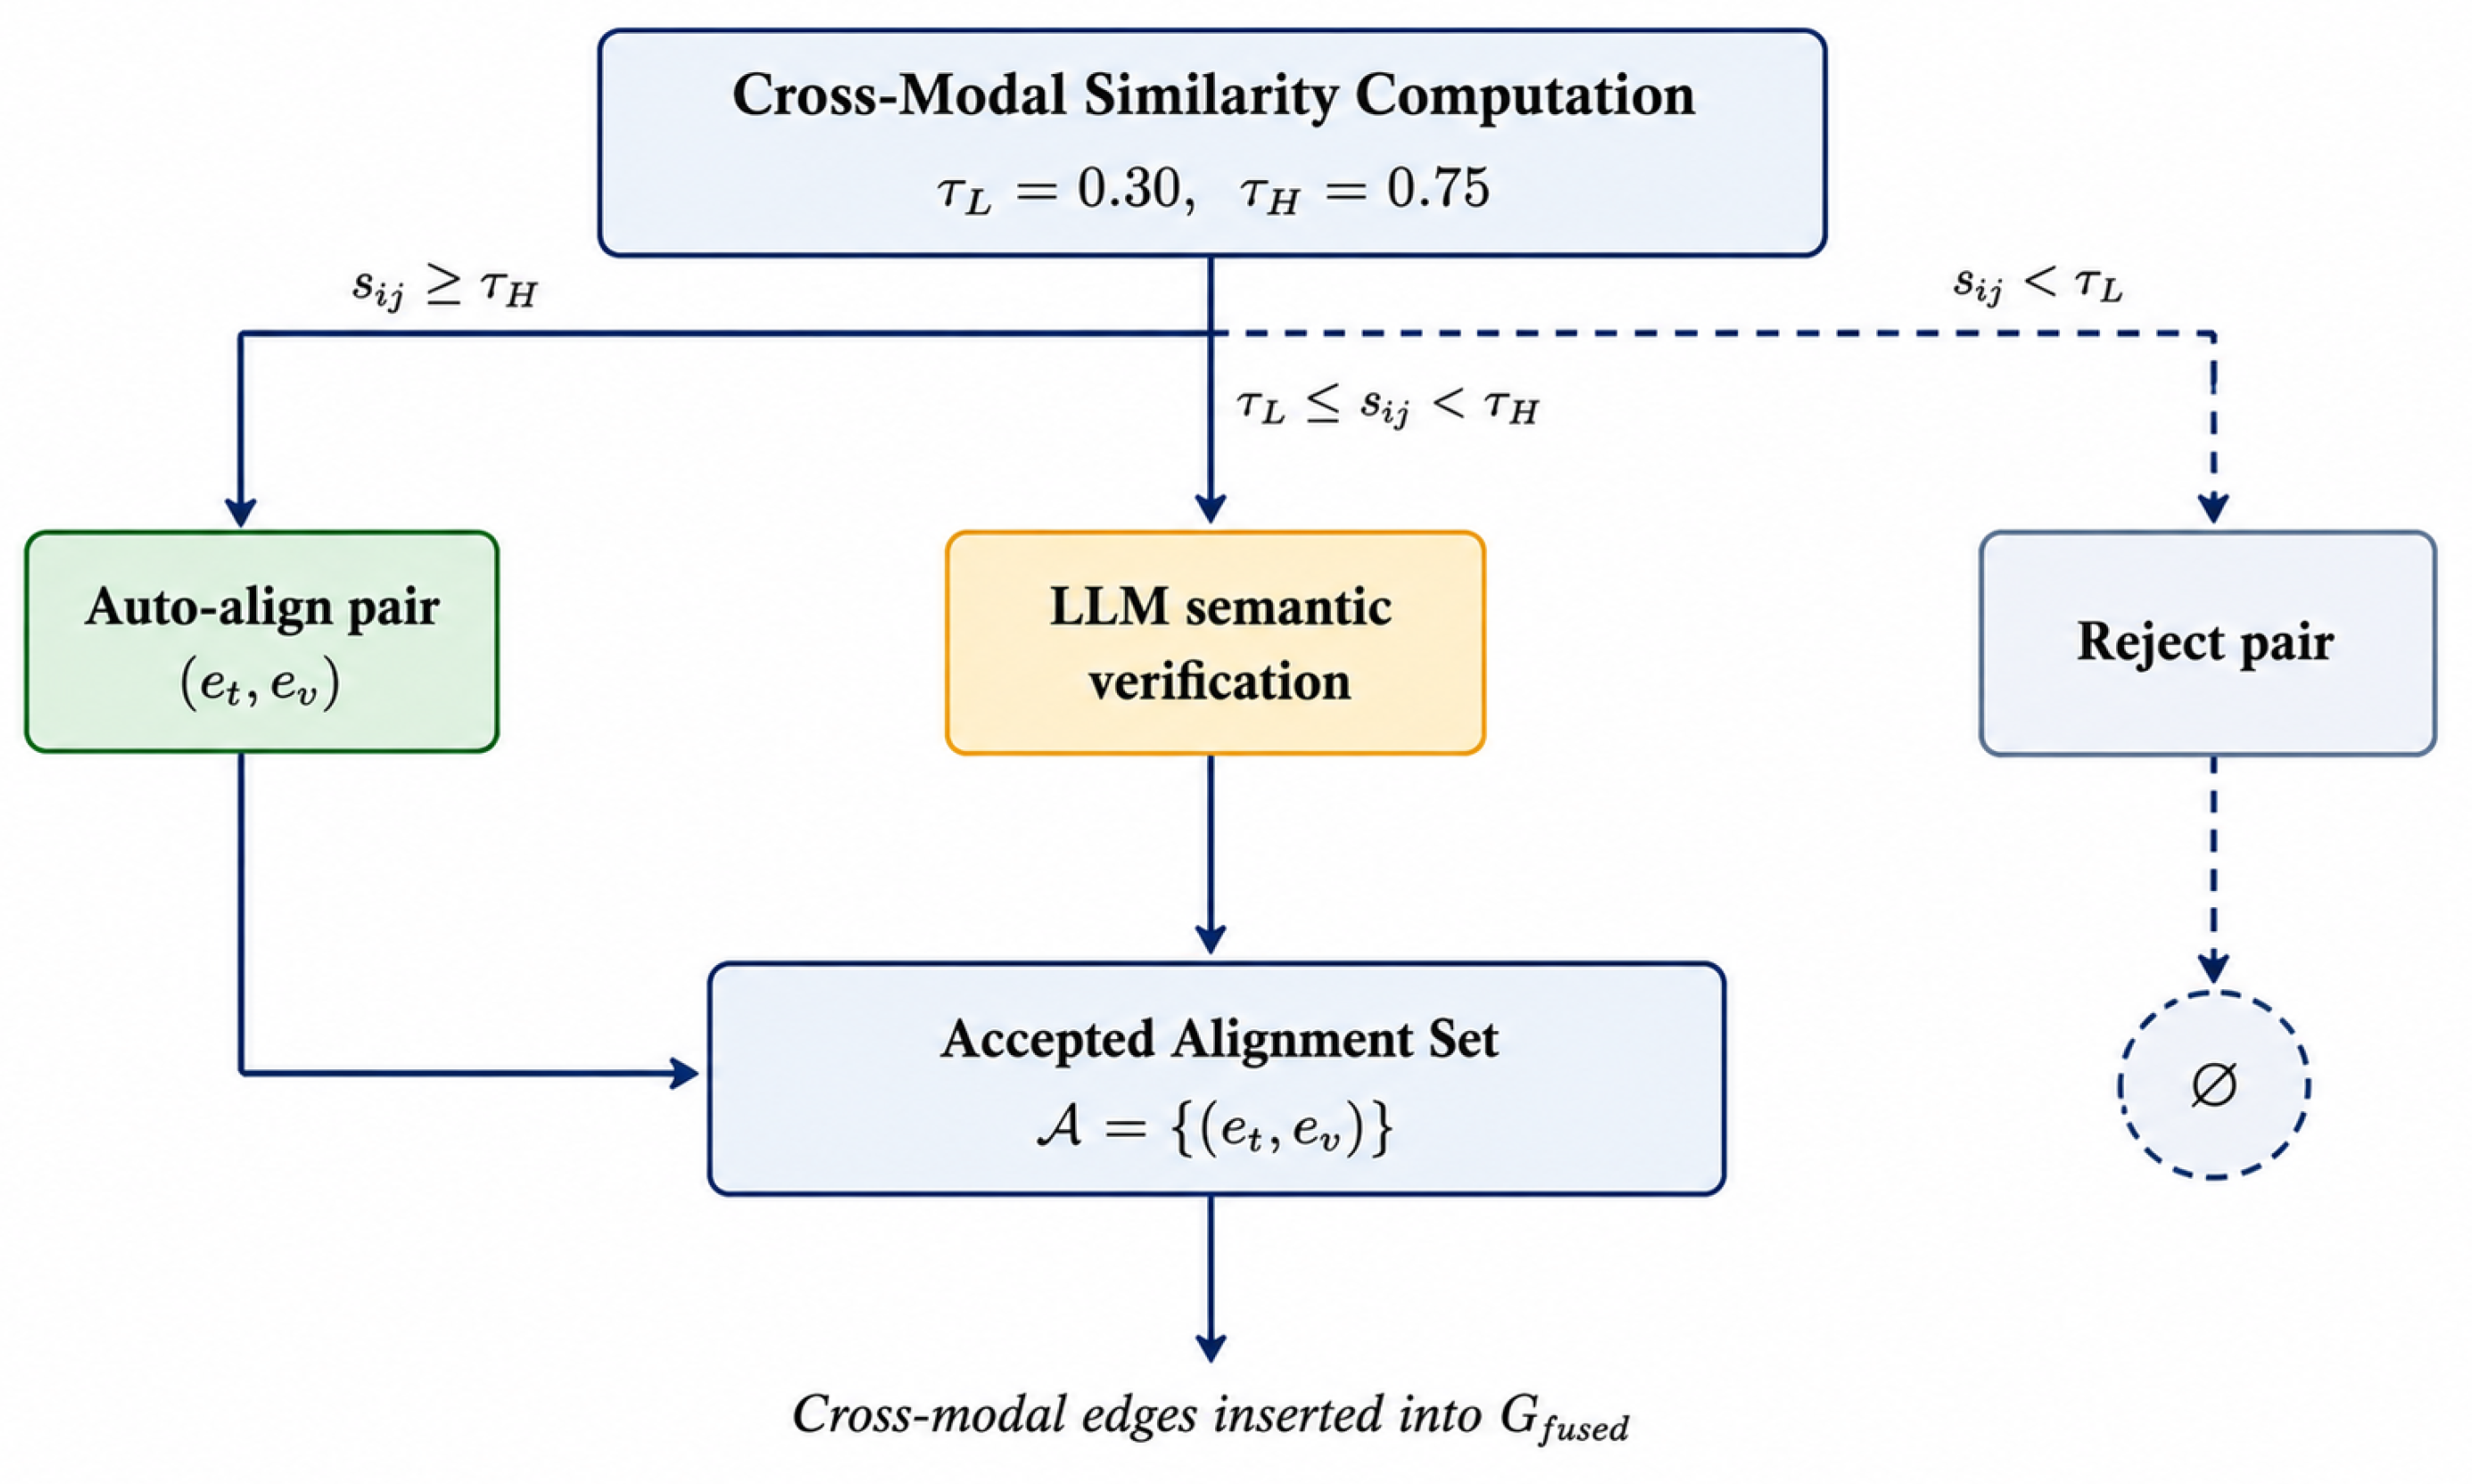
Figure 3.
Post-fusion semantic bridging in MOSAIC.
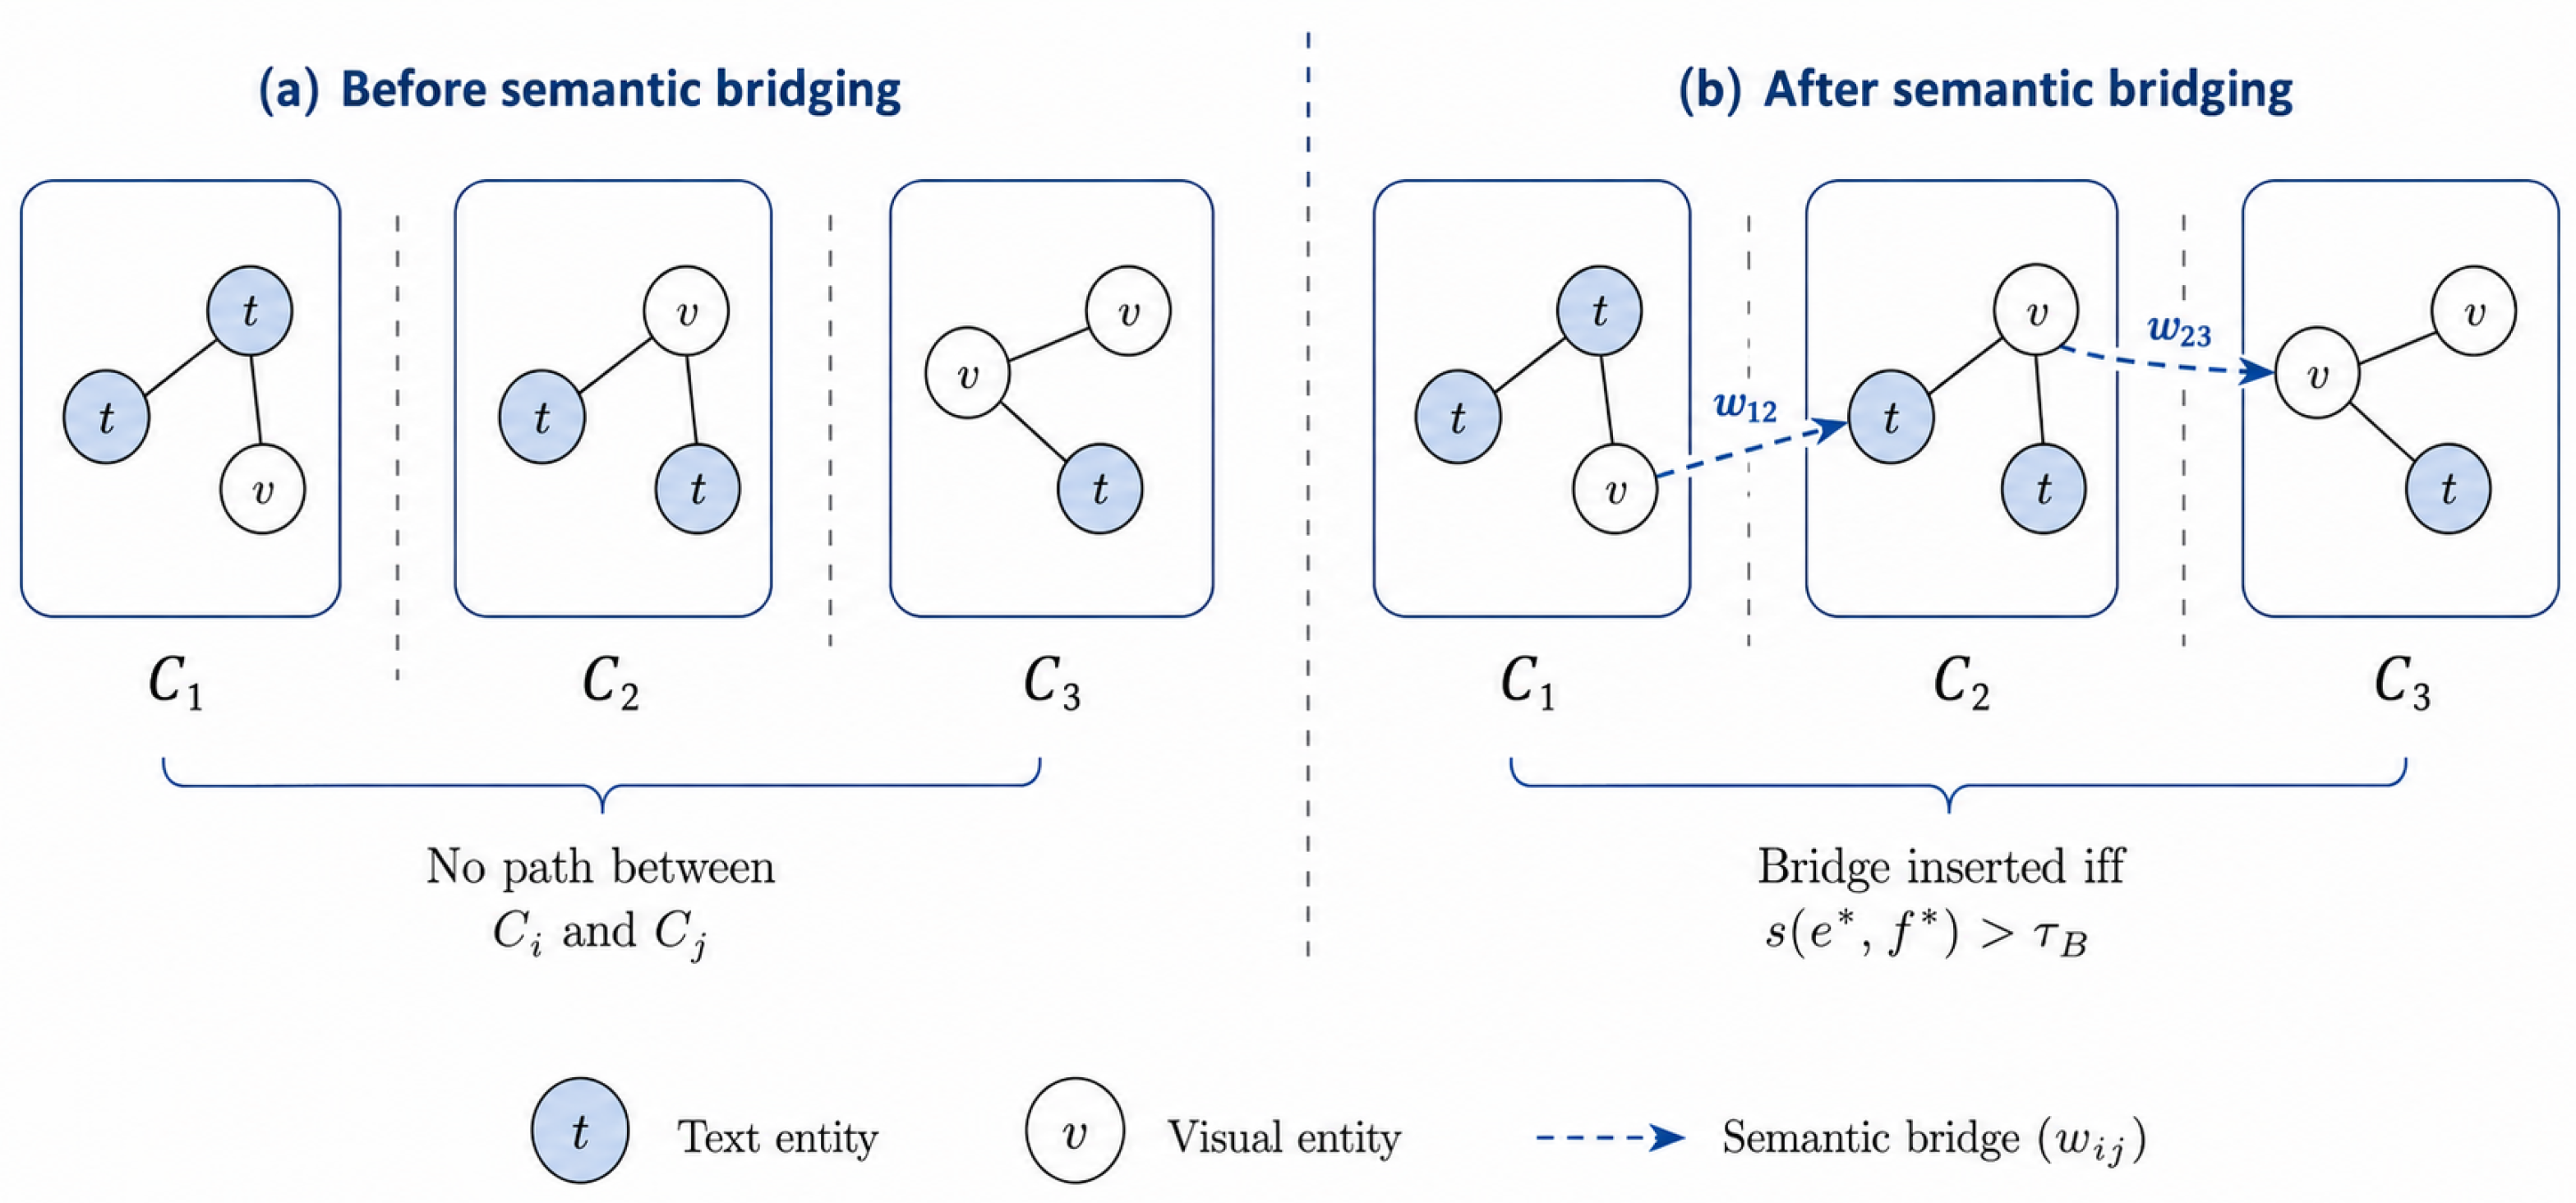
Figure 4.
Overall token-level F1 on the ACL2020 in-domain evaluation set. MOSAIC is shown in dark red; baseline systems are shown in gold.
Figure 4.
Overall token-level F1 on the ACL2020 in-domain evaluation set. MOSAIC is shown in dark red; baseline systems are shown in gold.
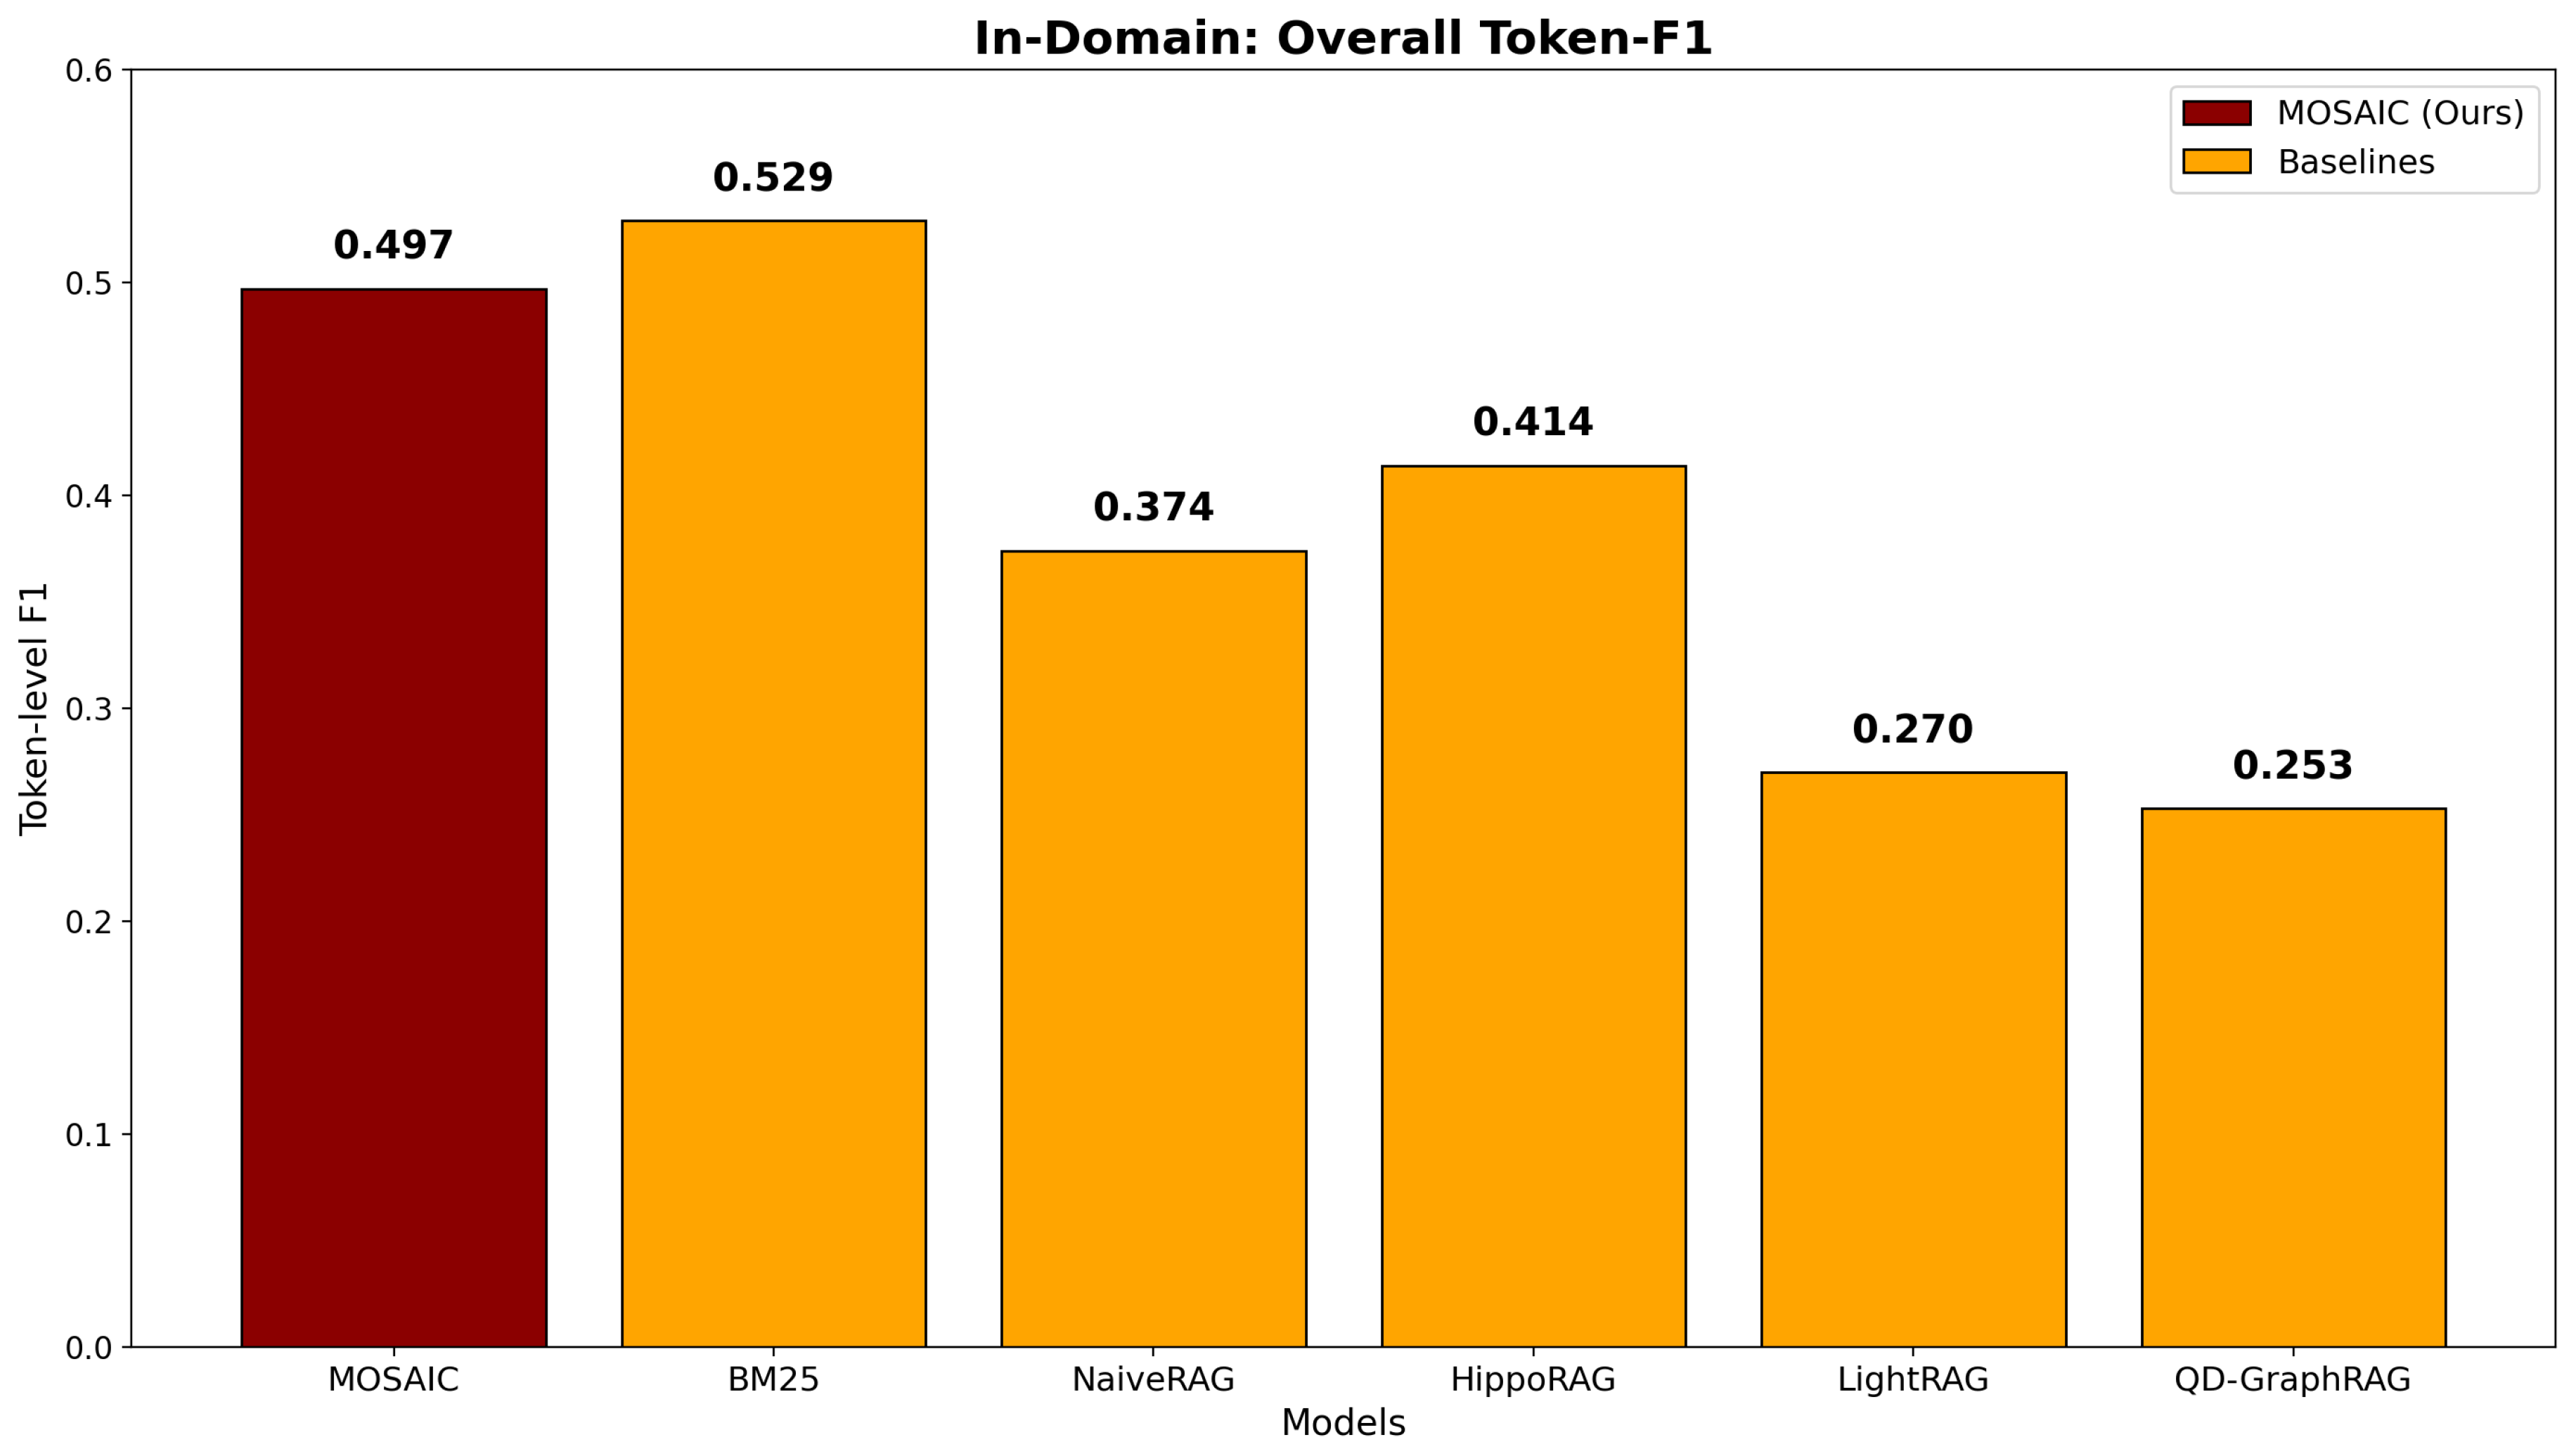
Figure 5.
Overall ANLS comparison across five retrieval systems on MMLongBench-Doc (134 documents, 1,082 QA pairs). MOSAIC achieves the highest ANLS of 0.285, outperforming the next-best system, BM25, by .
Figure 5.
Overall ANLS comparison across five retrieval systems on MMLongBench-Doc (134 documents, 1,082 QA pairs). MOSAIC achieves the highest ANLS of 0.285, outperforming the next-best system, BM25, by .
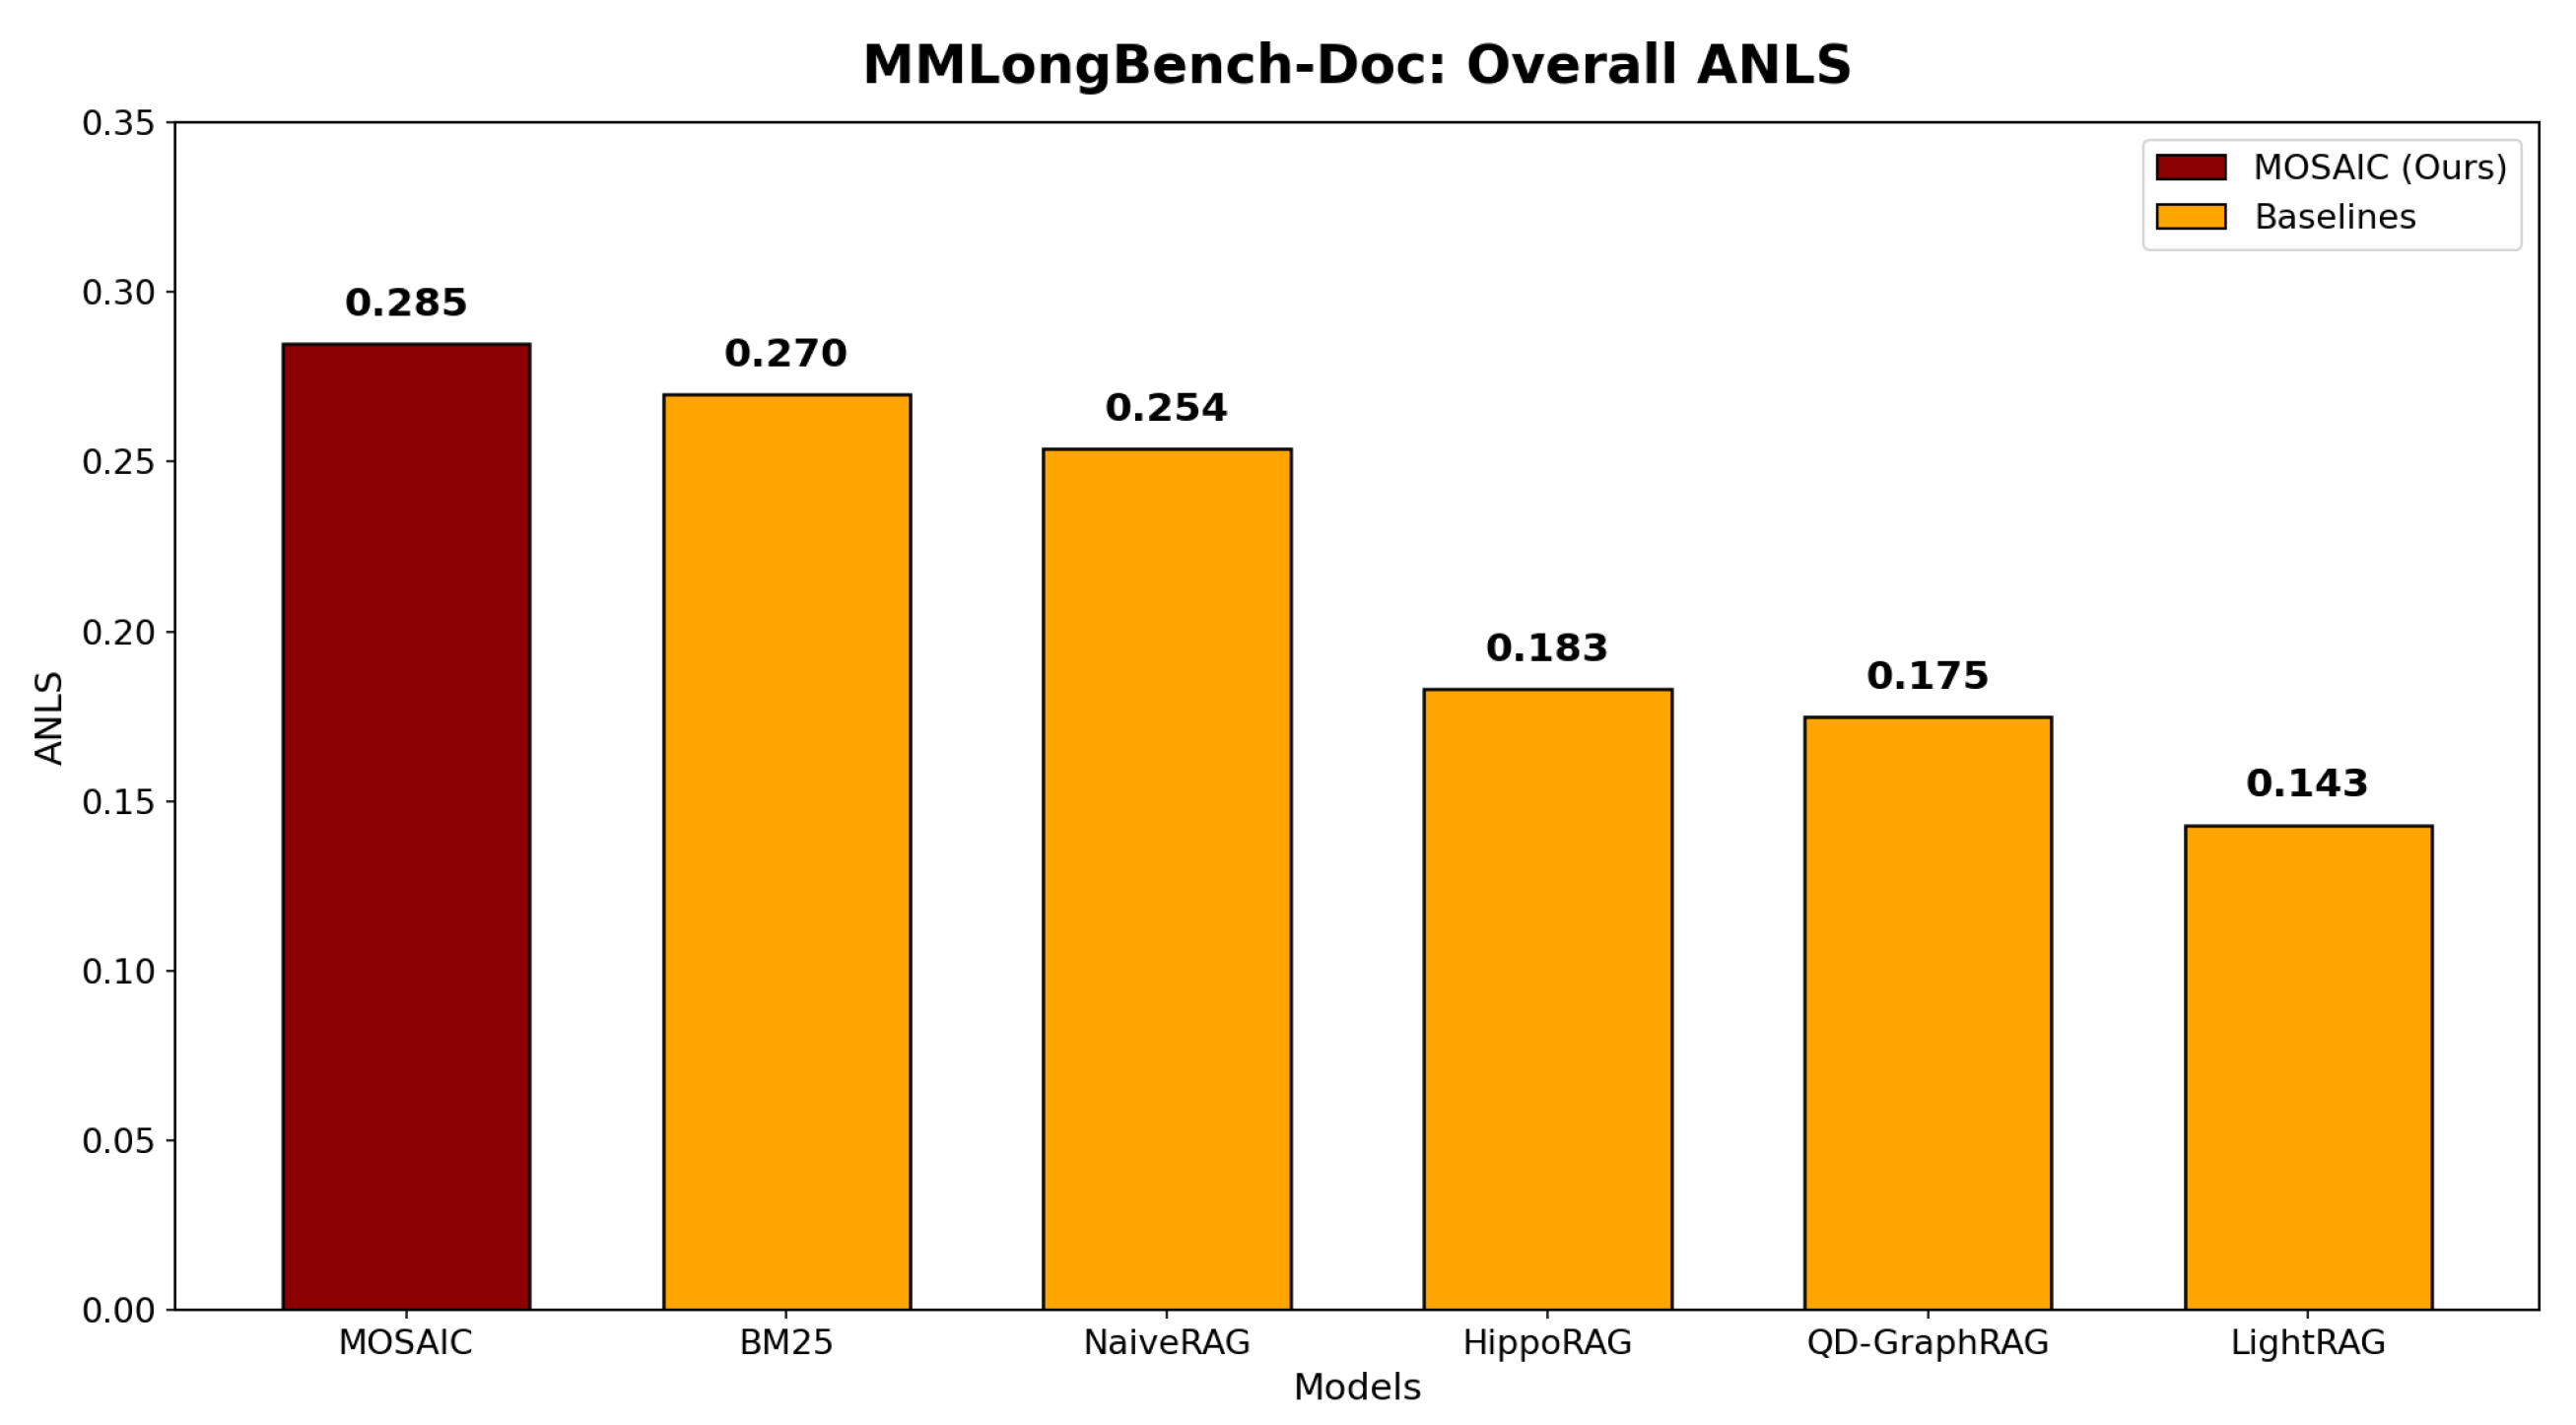
Figure 6.
ANLS by document category on MMLongBench-Doc (134 documents, 1,082 QA pairs). MOSAIC leads in four of seven categories; BM25 leads marginally on Research report and Tutorial/Workshop.
Figure 6.
ANLS by document category on MMLongBench-Doc (134 documents, 1,082 QA pairs). MOSAIC leads in four of seven categories; BM25 leads marginally on Research report and Tutorial/Workshop.
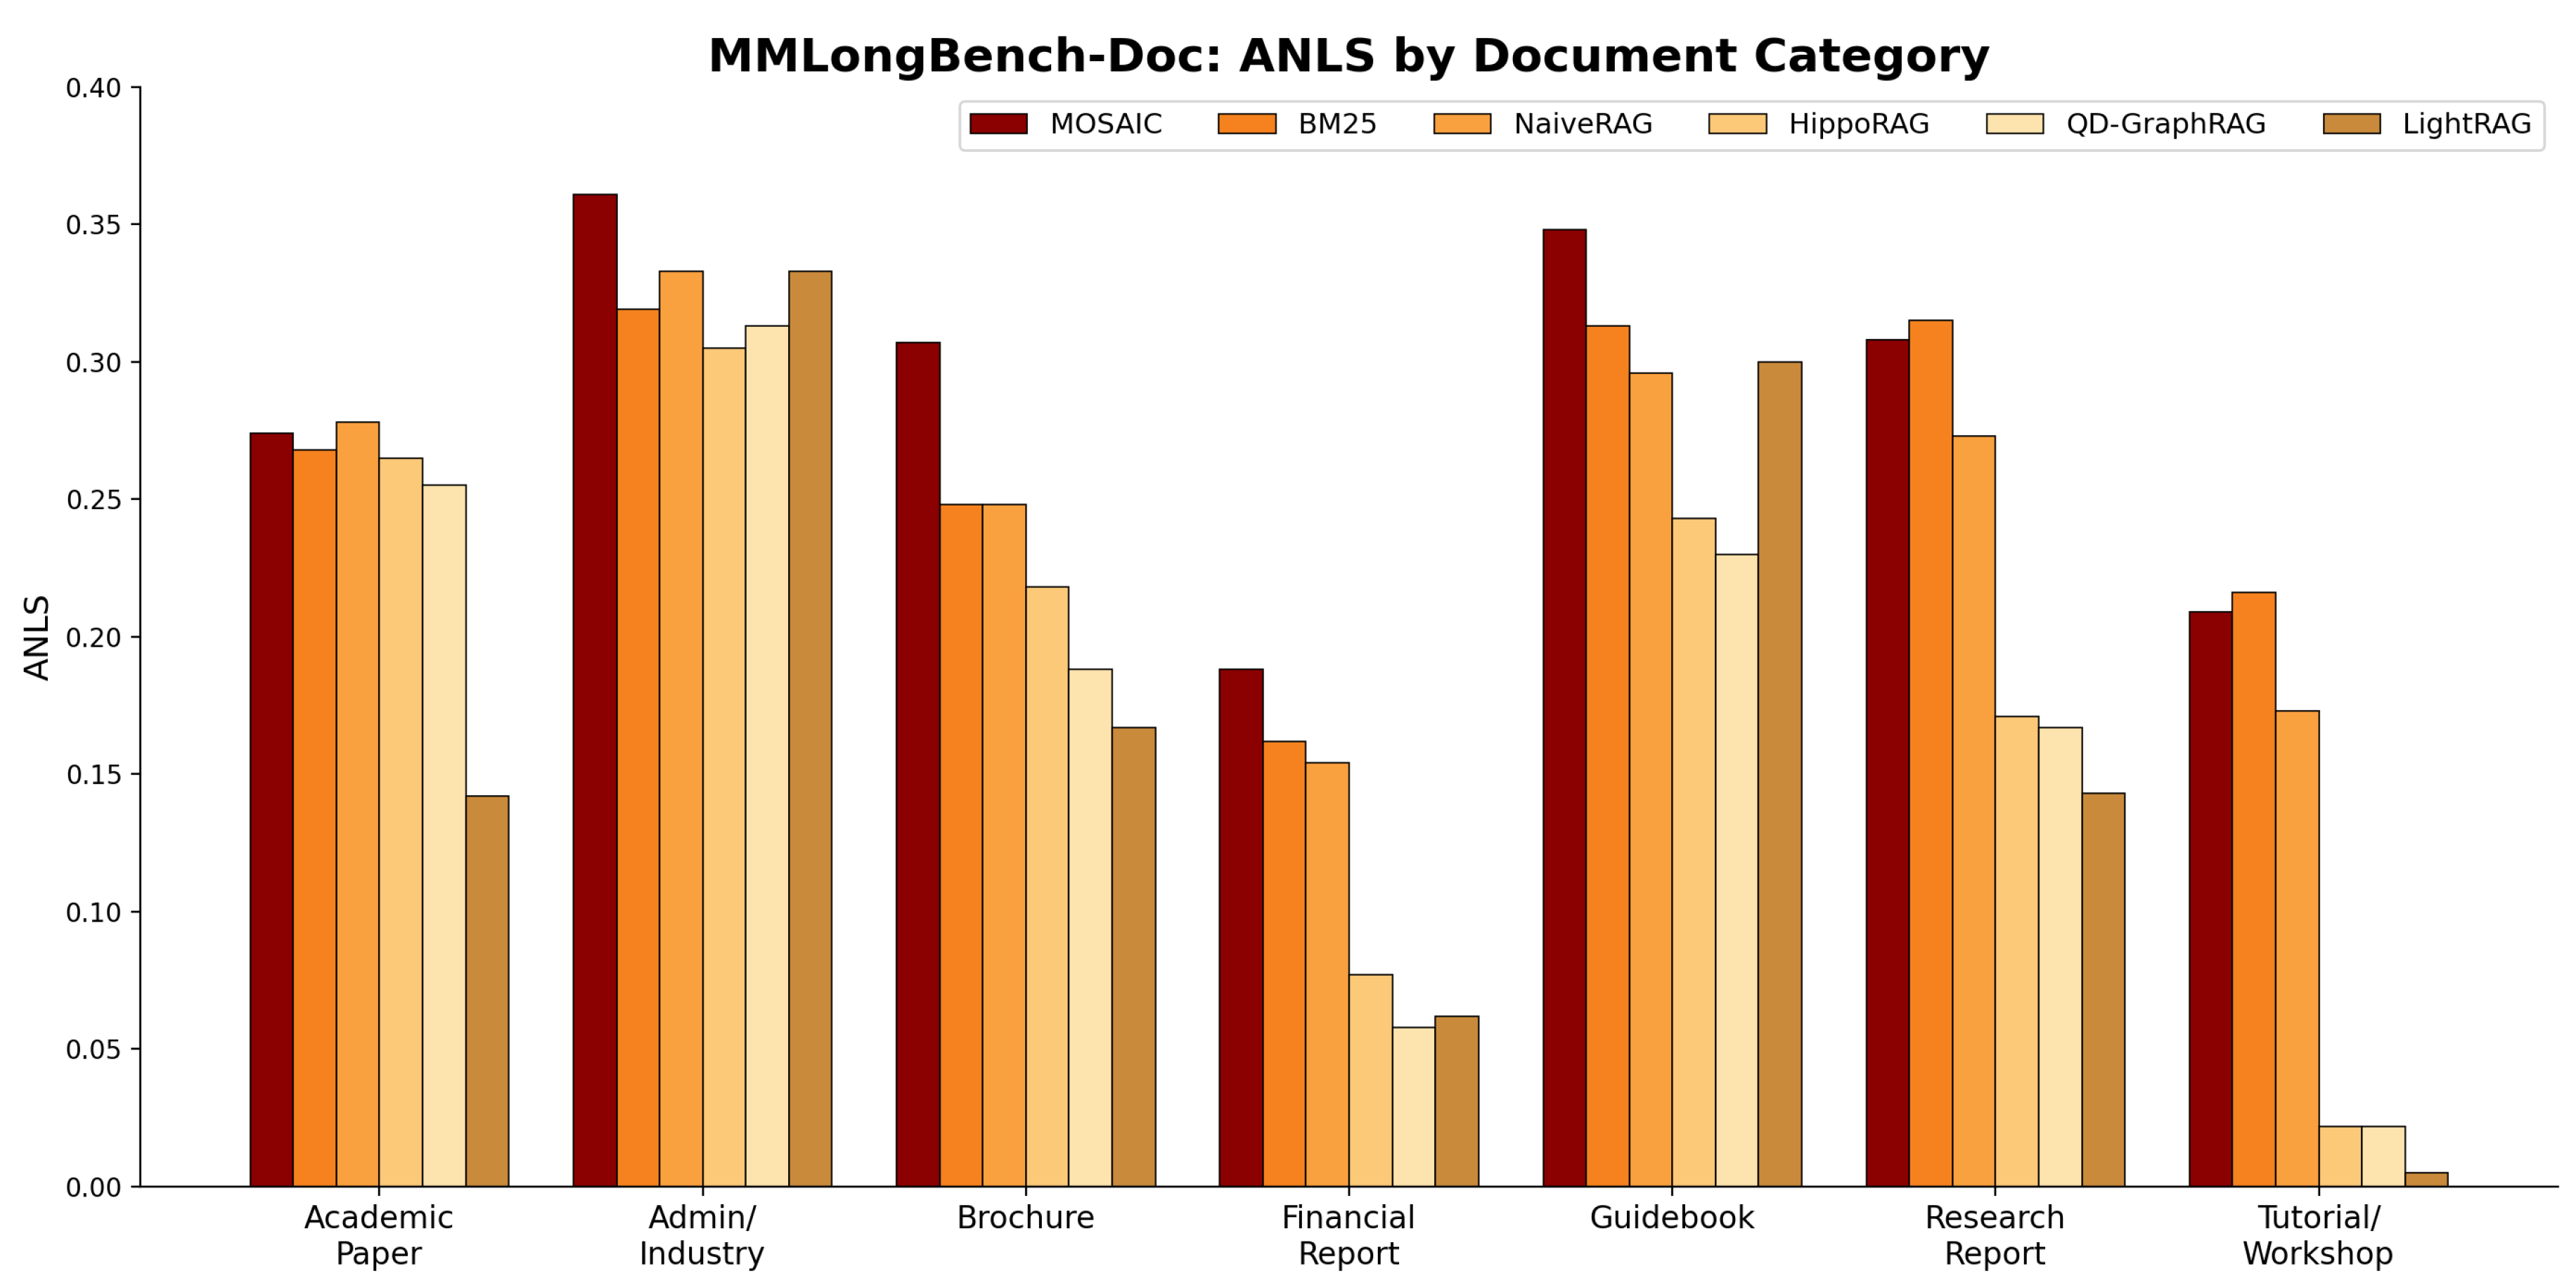
Figure 7.
ANLS by evidence source type across all five retrieval systems on MMLongBench-Doc (134 documents, 1,082 QA pairs). MOSAIC leads in five of six evidence categories (Chart, Figure, Generalized-text, Pure-text, Table).
Figure 7.
ANLS by evidence source type across all five retrieval systems on MMLongBench-Doc (134 documents, 1,082 QA pairs). MOSAIC leads in five of six evidence categories (Chart, Figure, Generalized-text, Pure-text, Table).
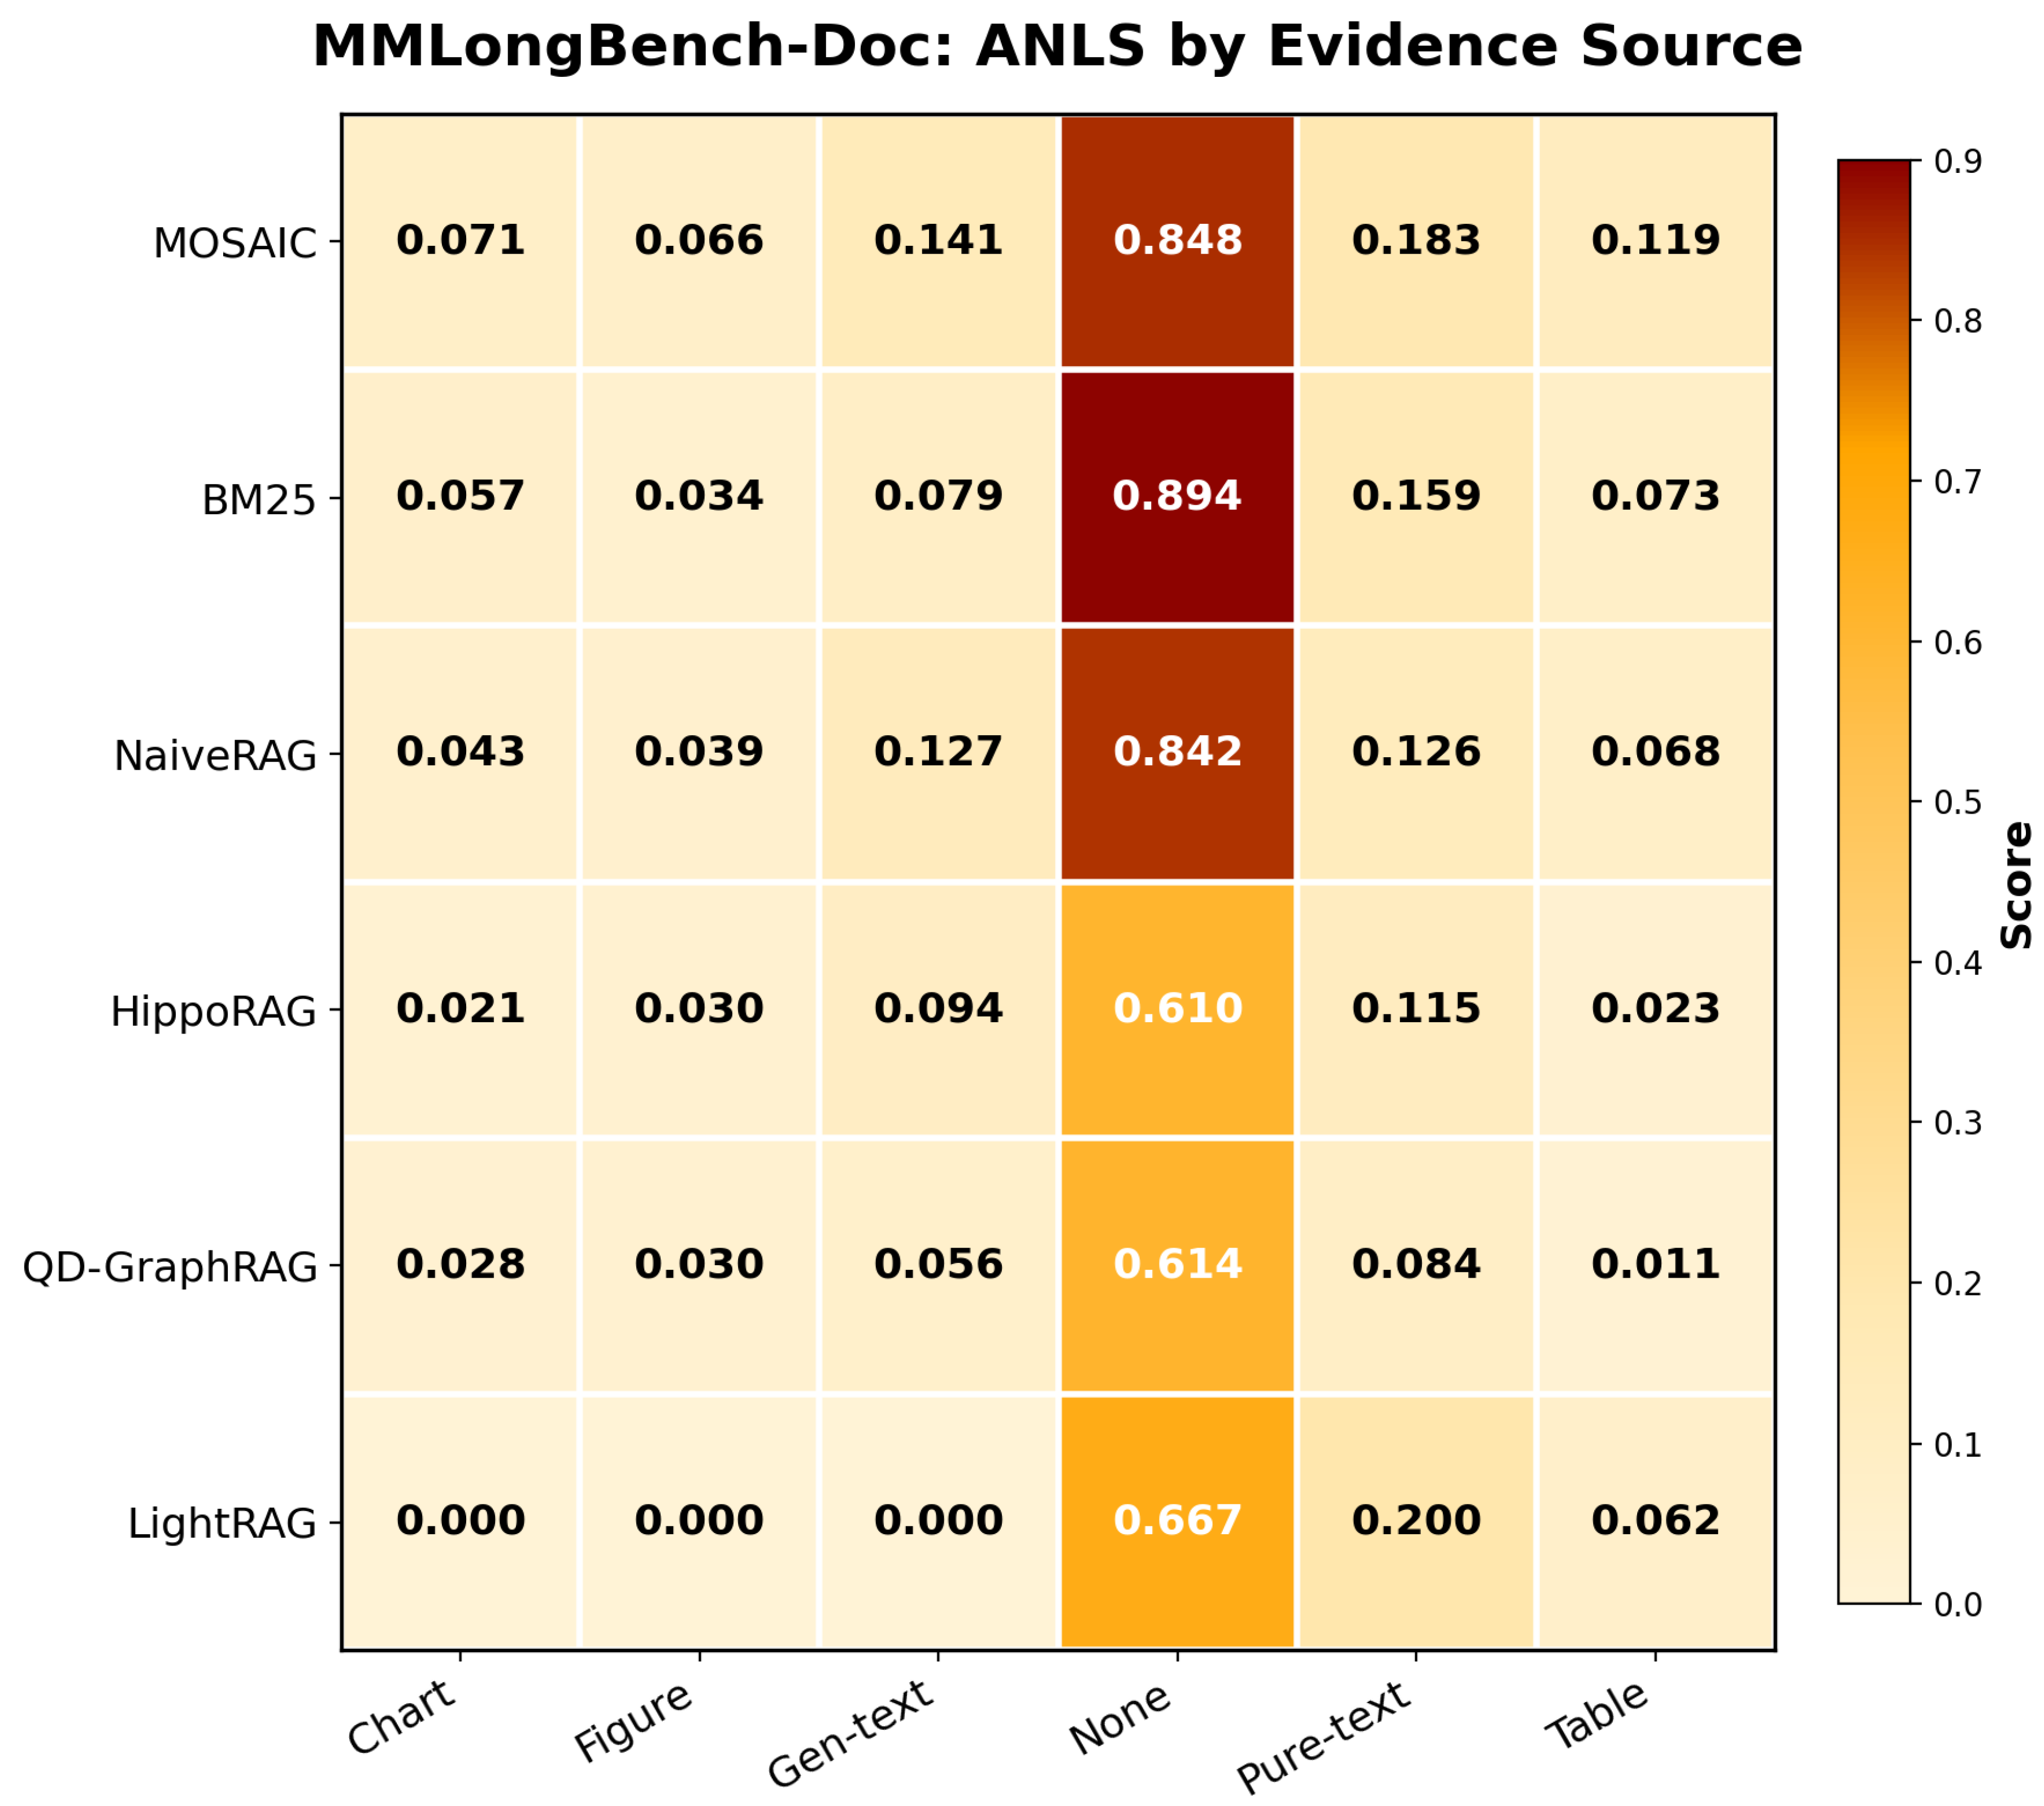
Figure 8.
Token-F1 on DocBench disaggregated by evidence type (308 visual, 308 text QA pairs). MOSAIC leads by over BM25 on visual questions (0.318 vs. 0.126), while BM25 leads on text-grounded questions (0.497 vs. 0.276).
Figure 8.
Token-F1 on DocBench disaggregated by evidence type (308 visual, 308 text QA pairs). MOSAIC leads by over BM25 on visual questions (0.318 vs. 0.126), while BM25 leads on text-grounded questions (0.497 vs. 0.276).
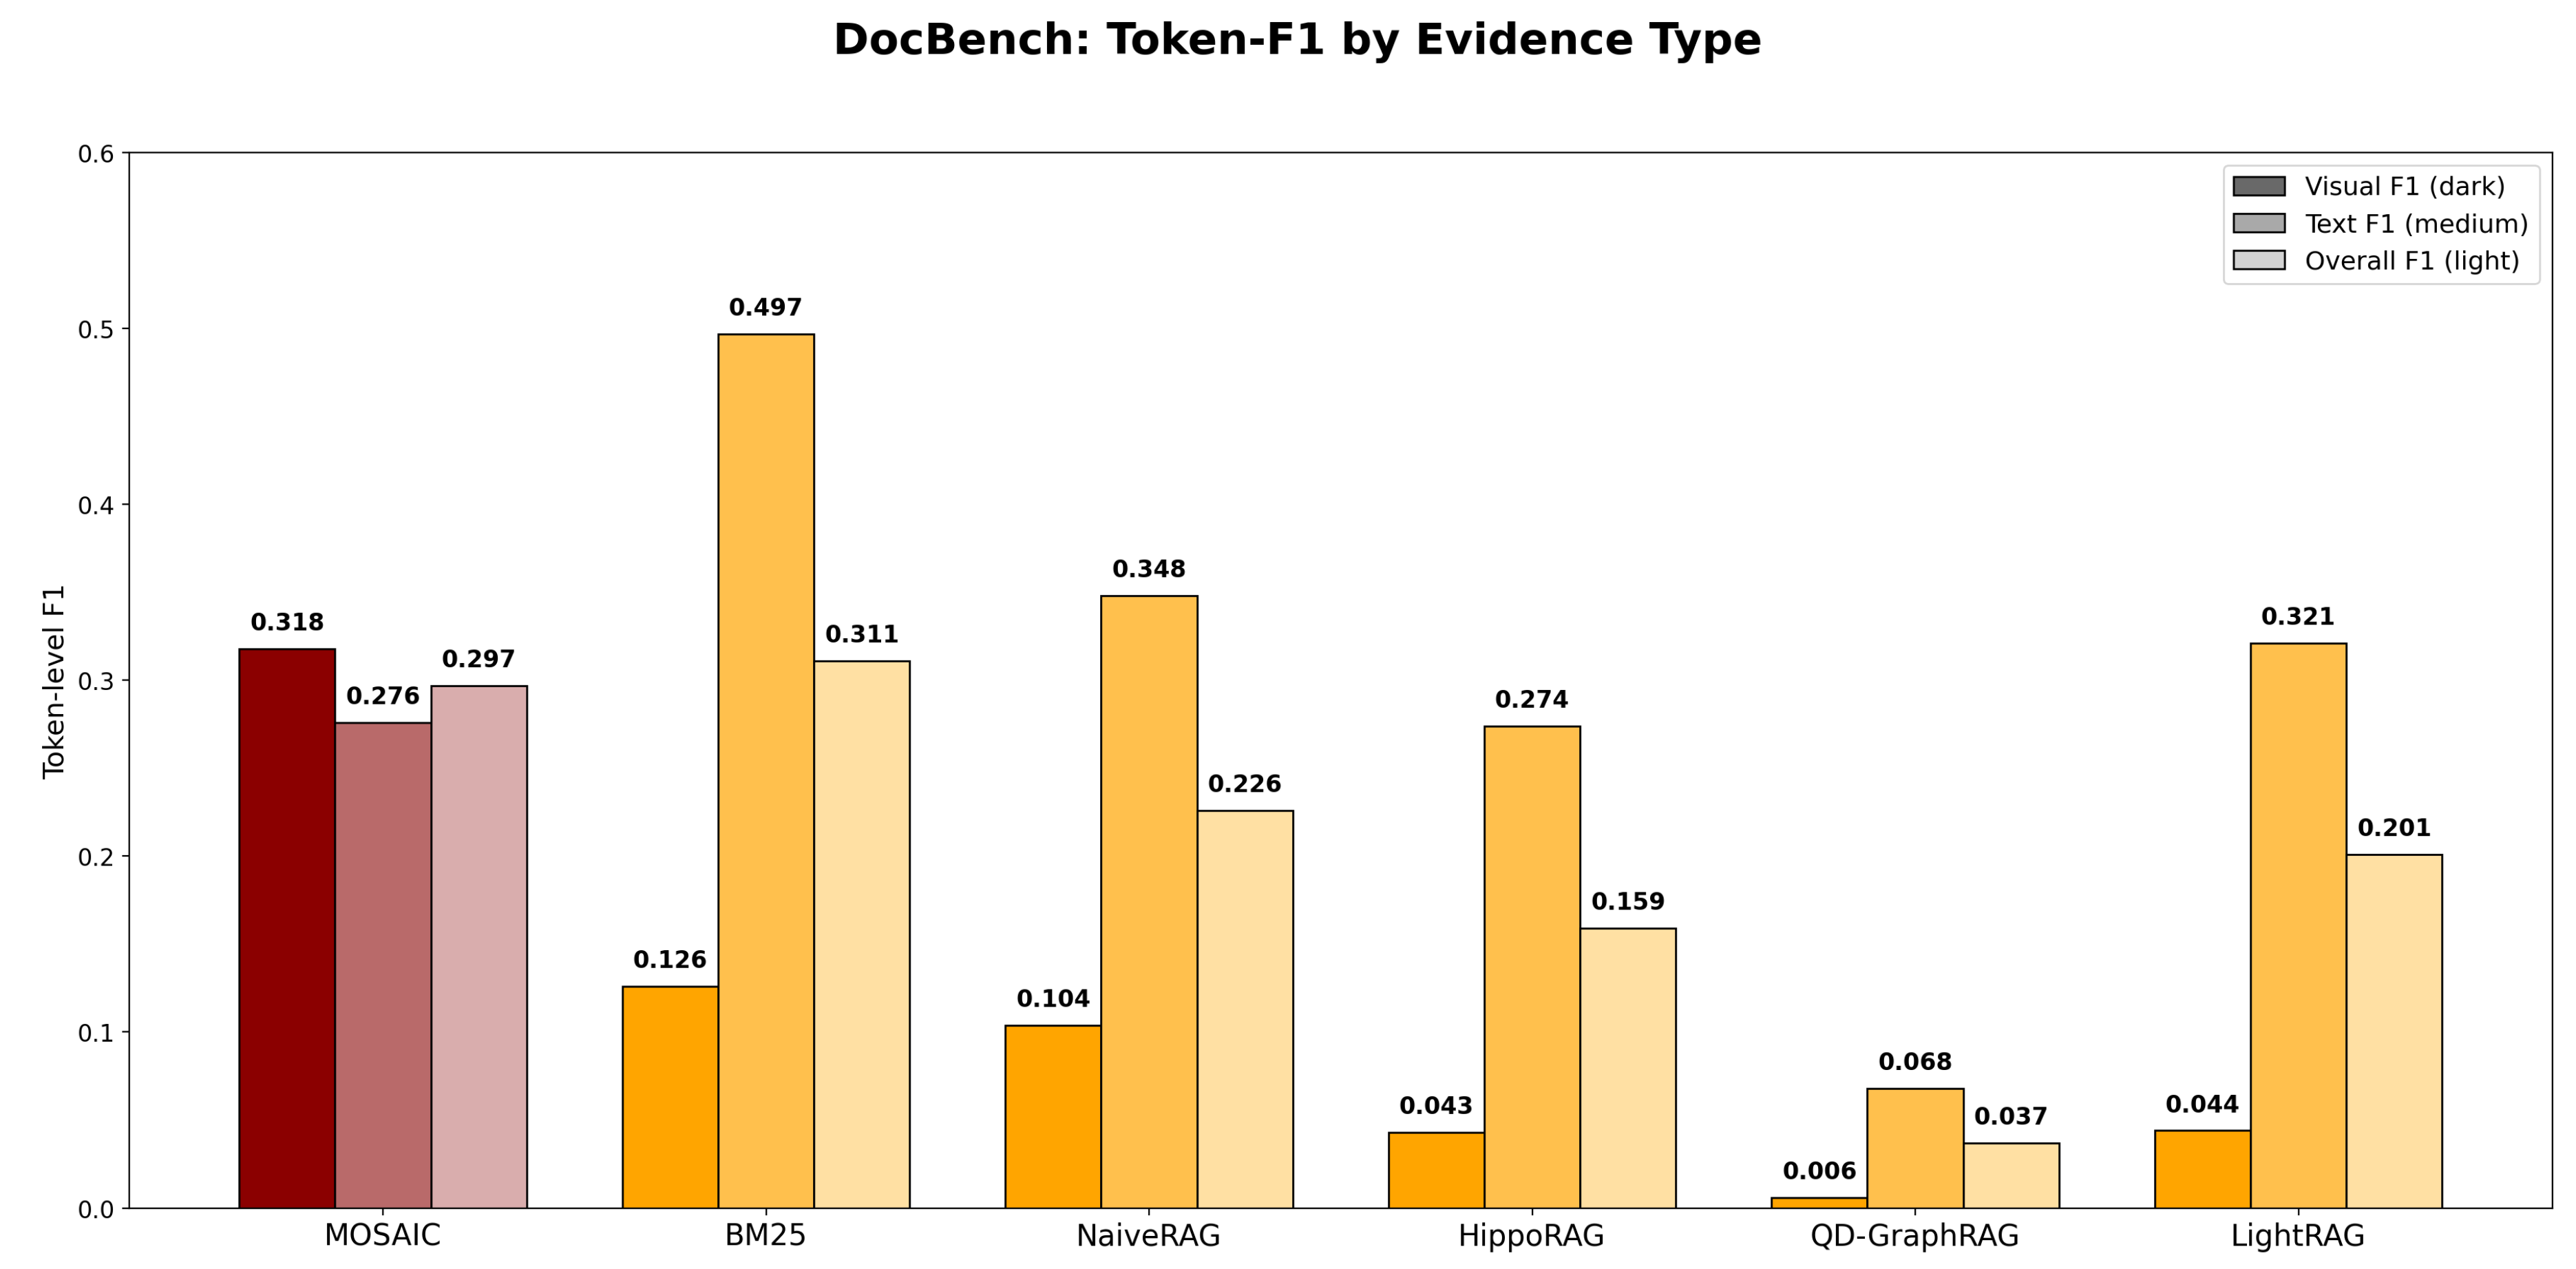
Figure 9.
Side-by-side comparison of visual and text QA Token-F1 across all five systems on DocBench. The left panel confirms MOSAIC’s dominance on visually-grounded questions; the right panel shows BM25’s lead on text-grounded questions.
Figure 9.
Side-by-side comparison of visual and text QA Token-F1 across all five systems on DocBench. The left panel confirms MOSAIC’s dominance on visually-grounded questions; the right panel shows BM25’s lead on text-grounded questions.
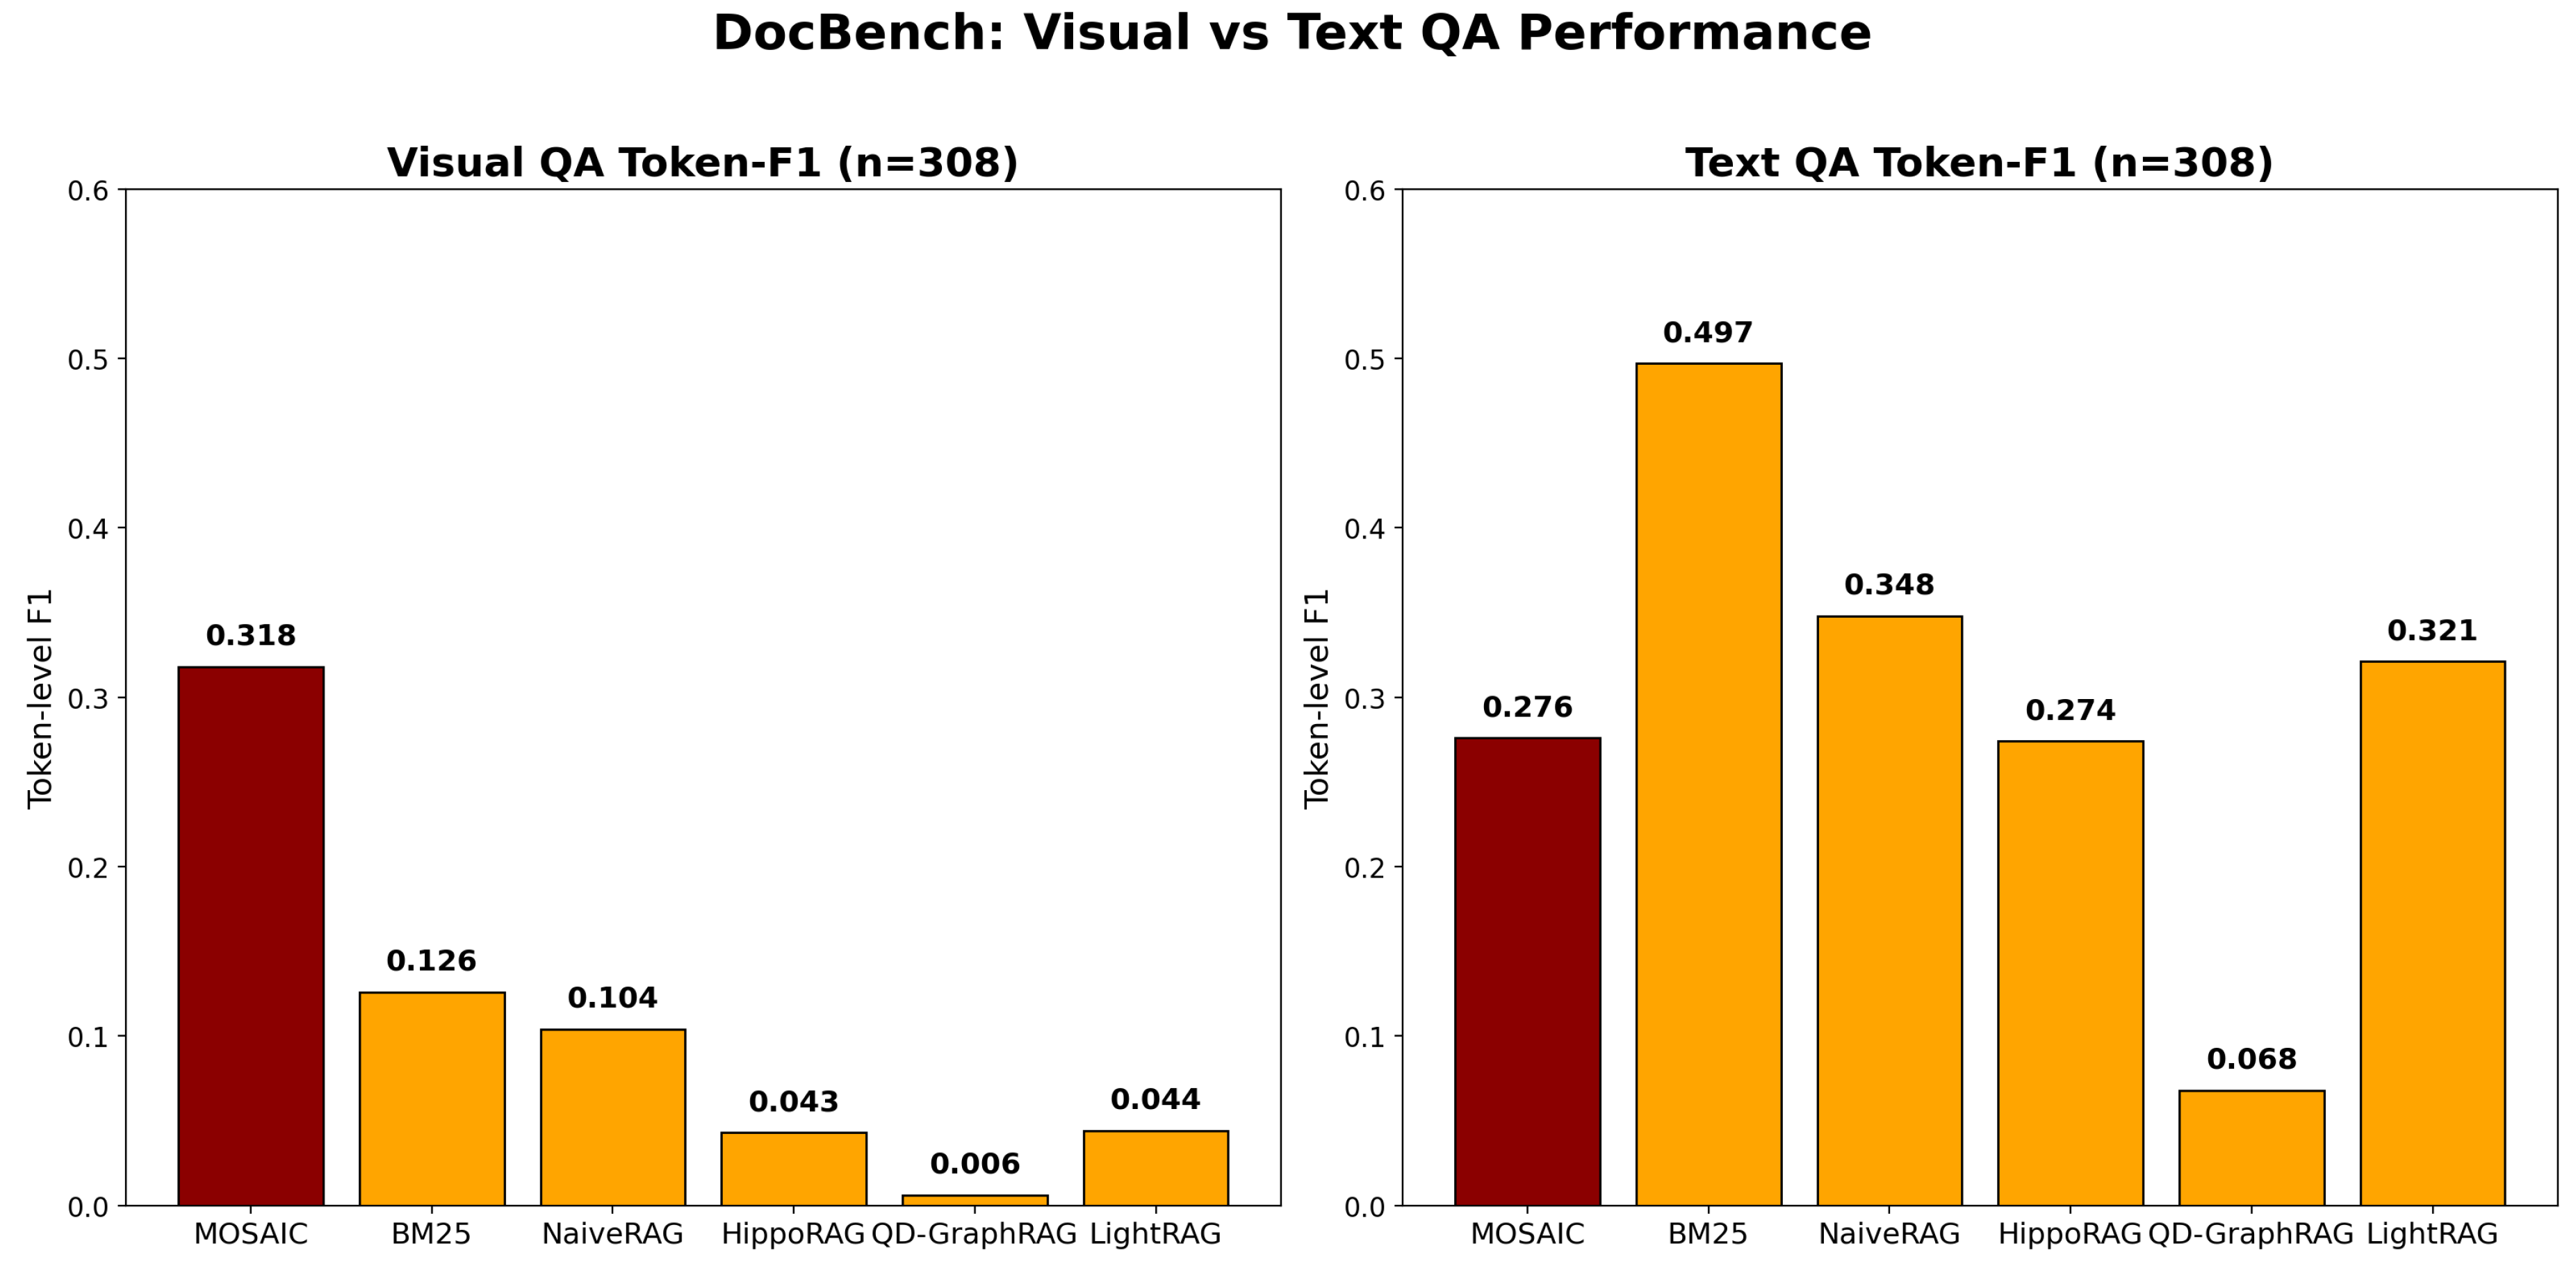
Figure 10.
Distribution of connected component sizes before (A0) and after semantic bridging (A3/A4). The transition reveals the emergence of a single dominant connected component, enabling multi-hop reasoning across the full graph.
Figure 10.
Distribution of connected component sizes before (A0) and after semantic bridging (A3/A4). The transition reveals the emergence of a single dominant connected component, enabling multi-hop reasoning across the full graph.
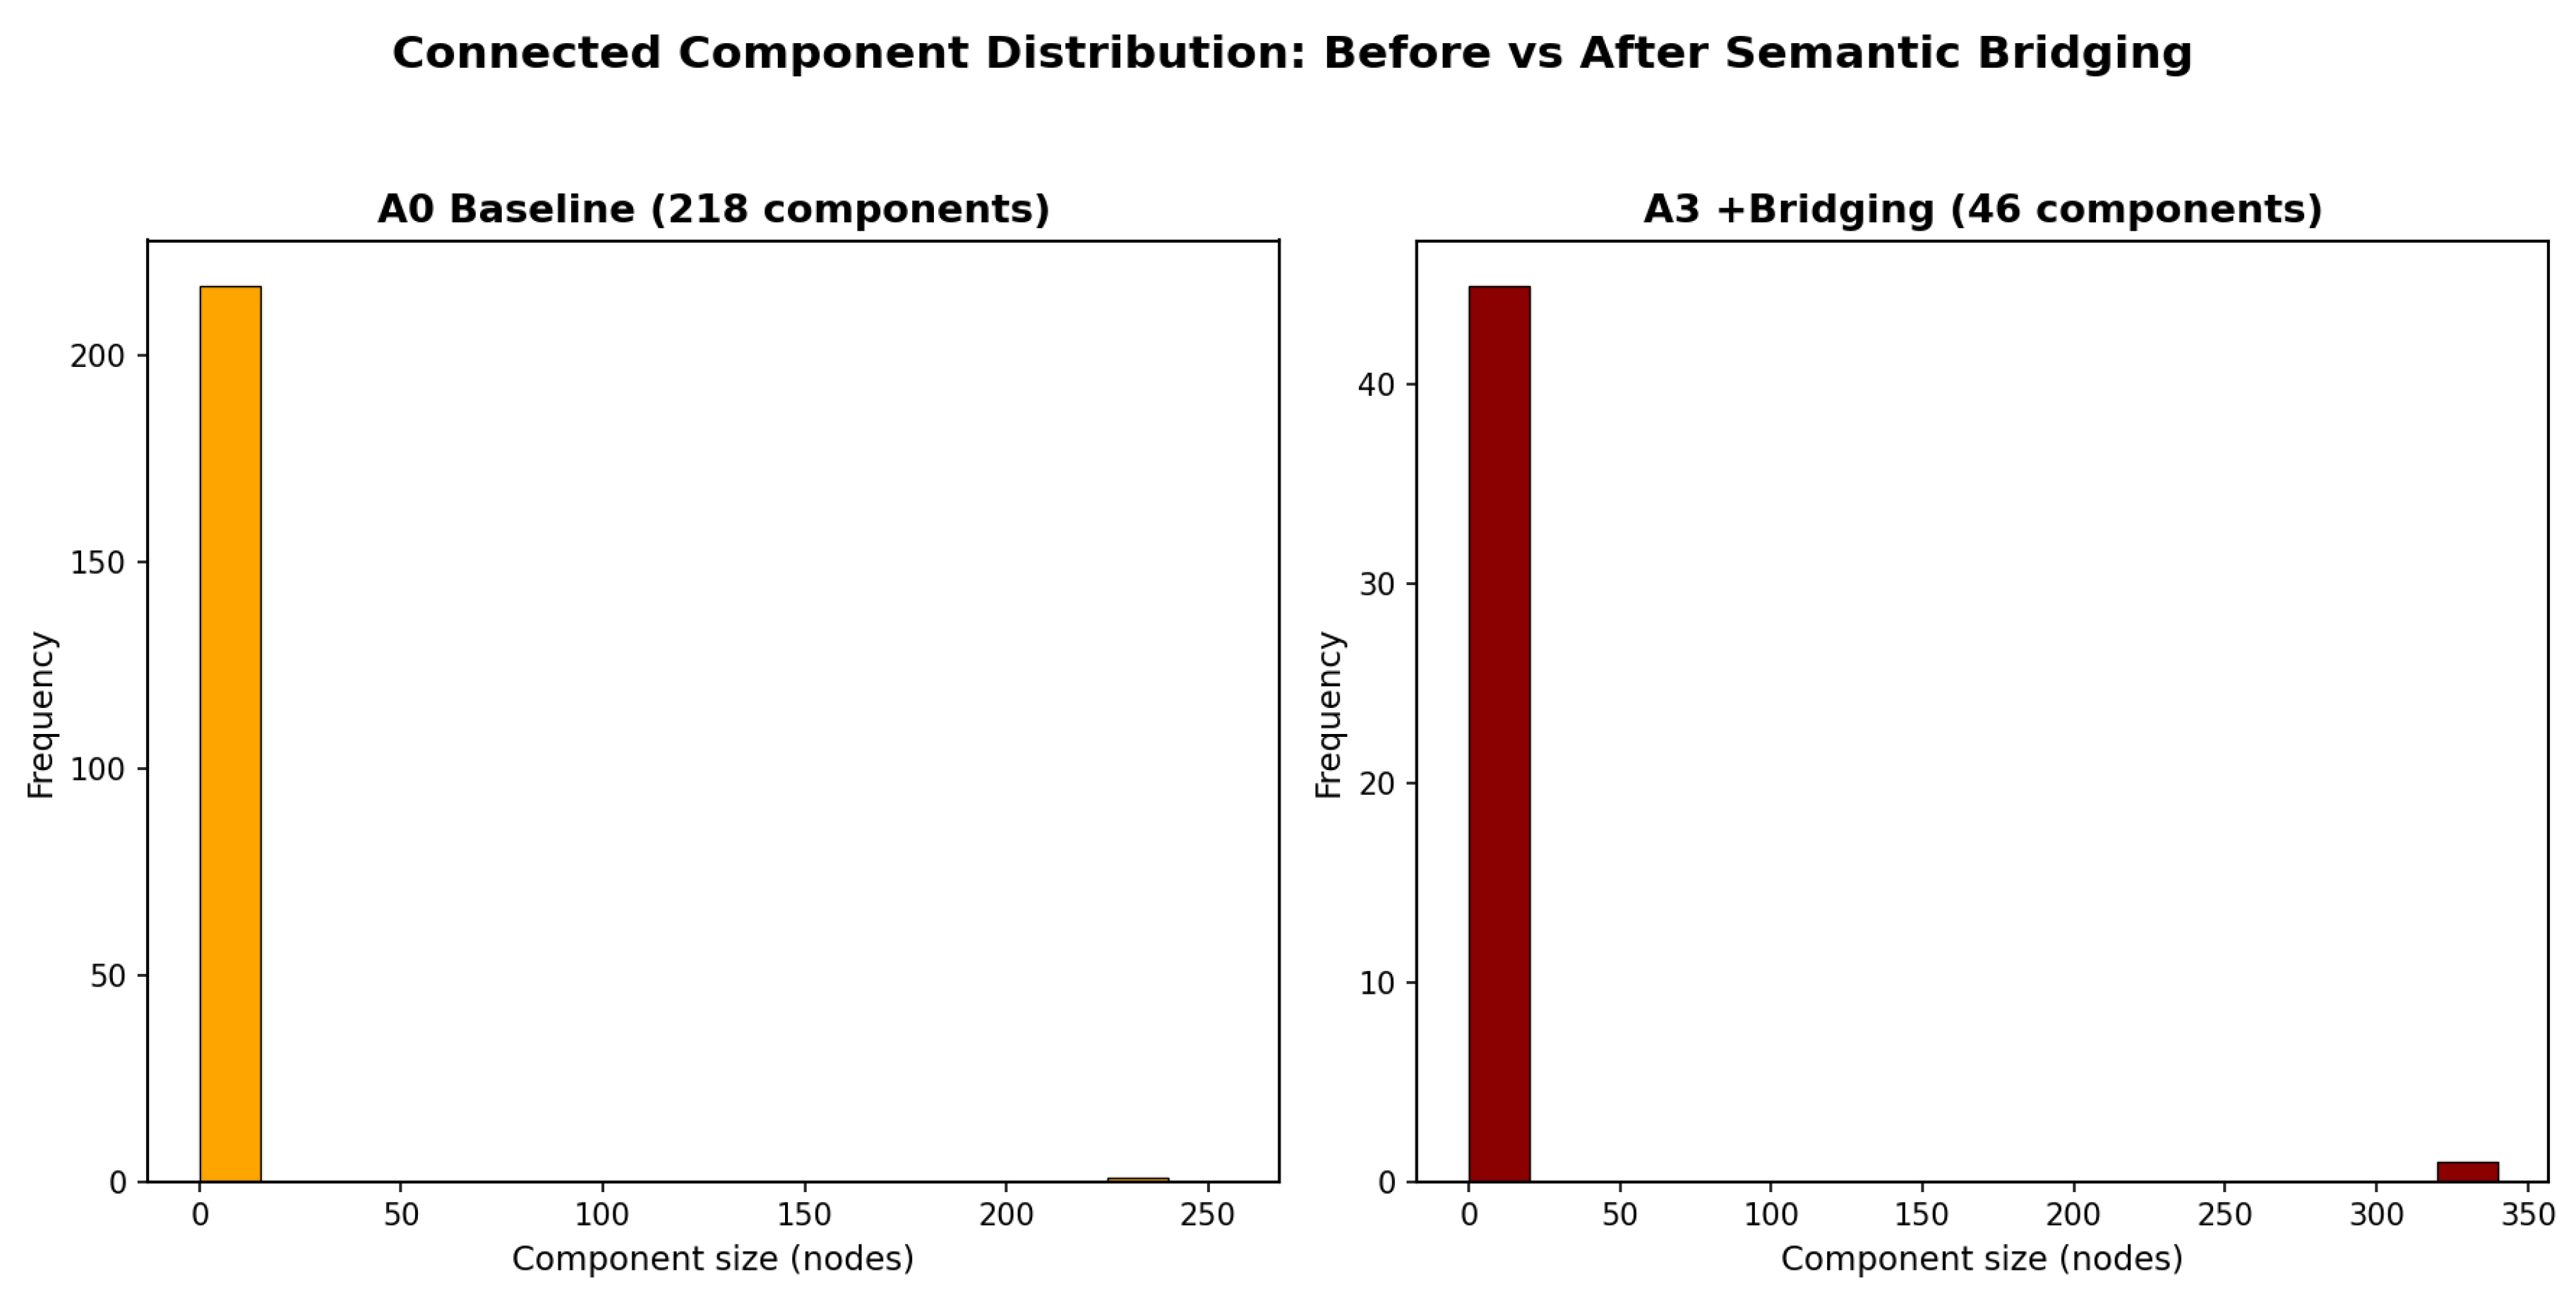
Figure 13.
Text-only knowledge graph (left) versus the MOSAIC multimodal-enhanced MMKG (right). The multimodal graph introduces 112 additional nodes and 789 new edges, with visual entities (orange nodes) serving as semantic anchors that bridge previously disconnected textual components.
Figure 13.
Text-only knowledge graph (left) versus the MOSAIC multimodal-enhanced MMKG (right). The multimodal graph introduces 112 additional nodes and 789 new edges, with visual entities (orange nodes) serving as semantic anchors that bridge previously disconnected textual components.
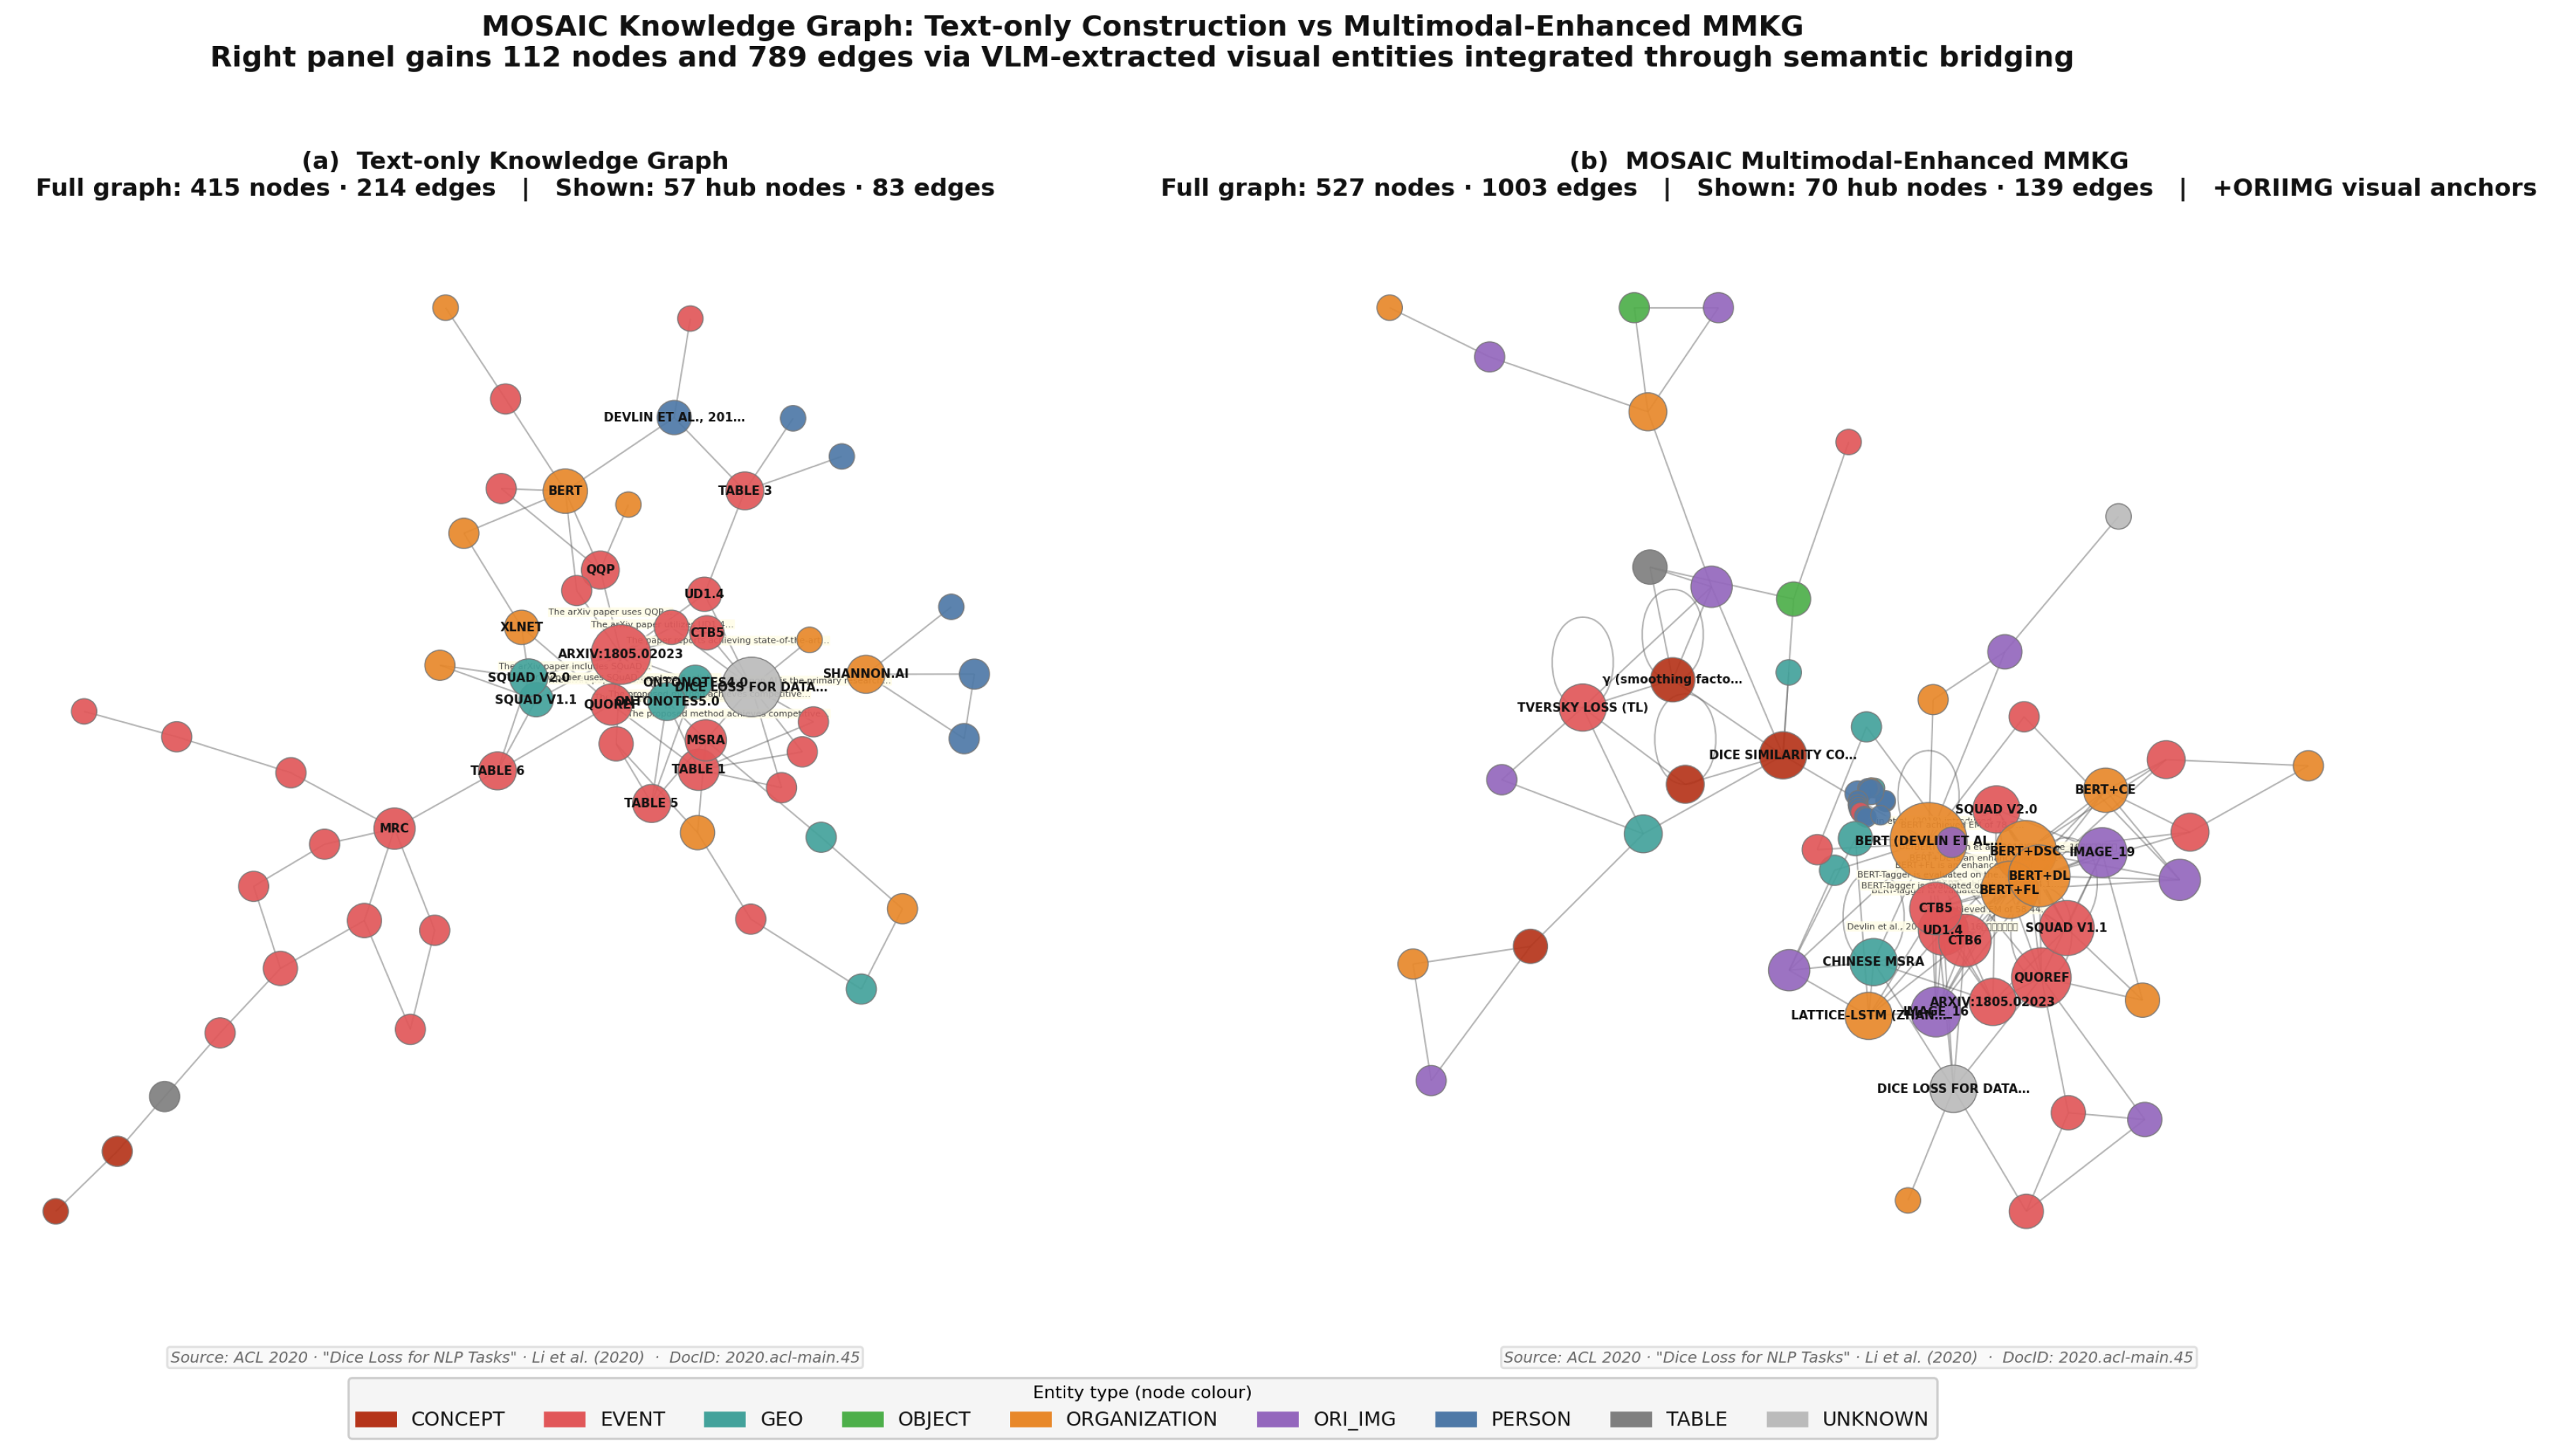
Figure 14.
Visual-entity ego network illustrating how 23 document images are transformed into structured entities that collectively connect to 60 text-entity neighbours through 266 relationships. Purple arrows indicate VLM-extracted visual-to-text alignments; grey edges represent text-only relational edges.
Figure 14.
Visual-entity ego network illustrating how 23 document images are transformed into structured entities that collectively connect to 60 text-entity neighbours through 266 relationships. Purple arrows indicate VLM-extracted visual-to-text alignments; grey edges represent text-only relational edges.
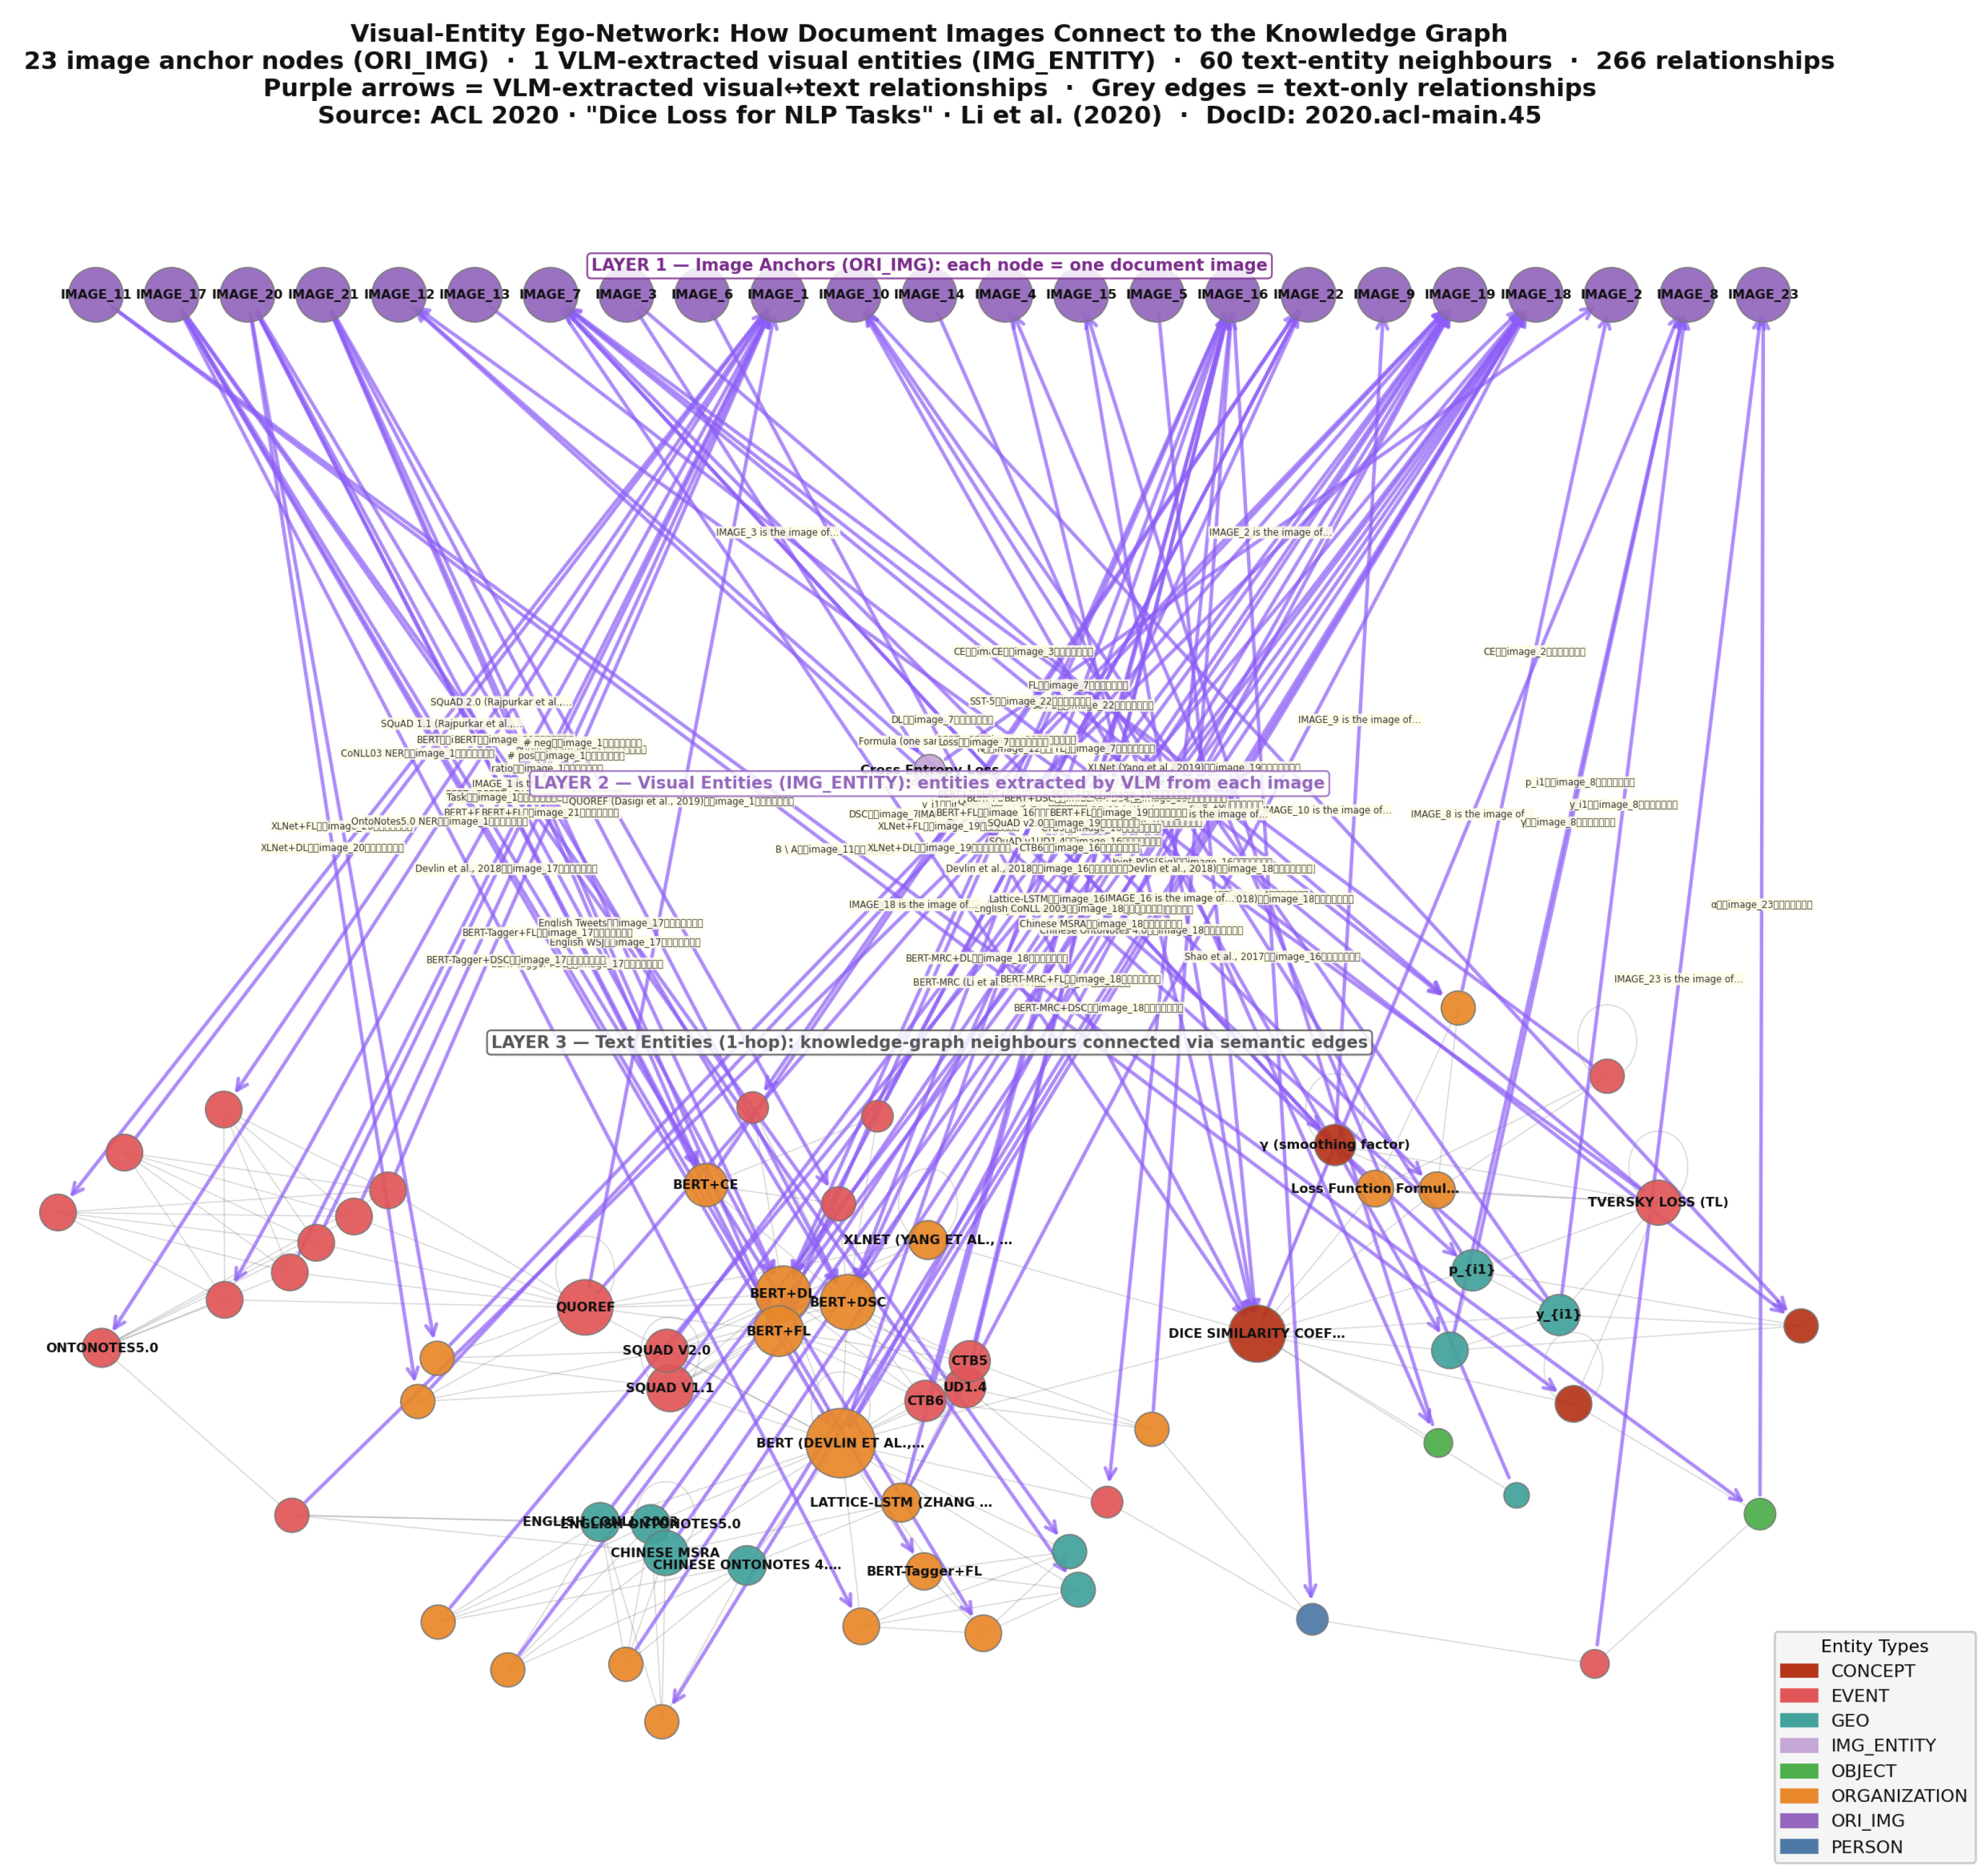
Figure 15.
t-SNE visualisation of entity embedding space before (left, baseline all-MiniLM-L6-v2) and after (right, MOSAIC contrastive fine-tuning) embedding refinement. Blue points represent text entities; orange points represent image entities. The fine-tuned space exhibits tighter cross-modal clustering and reduced inter-cluster overlap.
Figure 15.
t-SNE visualisation of entity embedding space before (left, baseline all-MiniLM-L6-v2) and after (right, MOSAIC contrastive fine-tuning) embedding refinement. Blue points represent text entities; orange points represent image entities. The fine-tuned space exhibits tighter cross-modal clustering and reduced inter-cluster overlap.
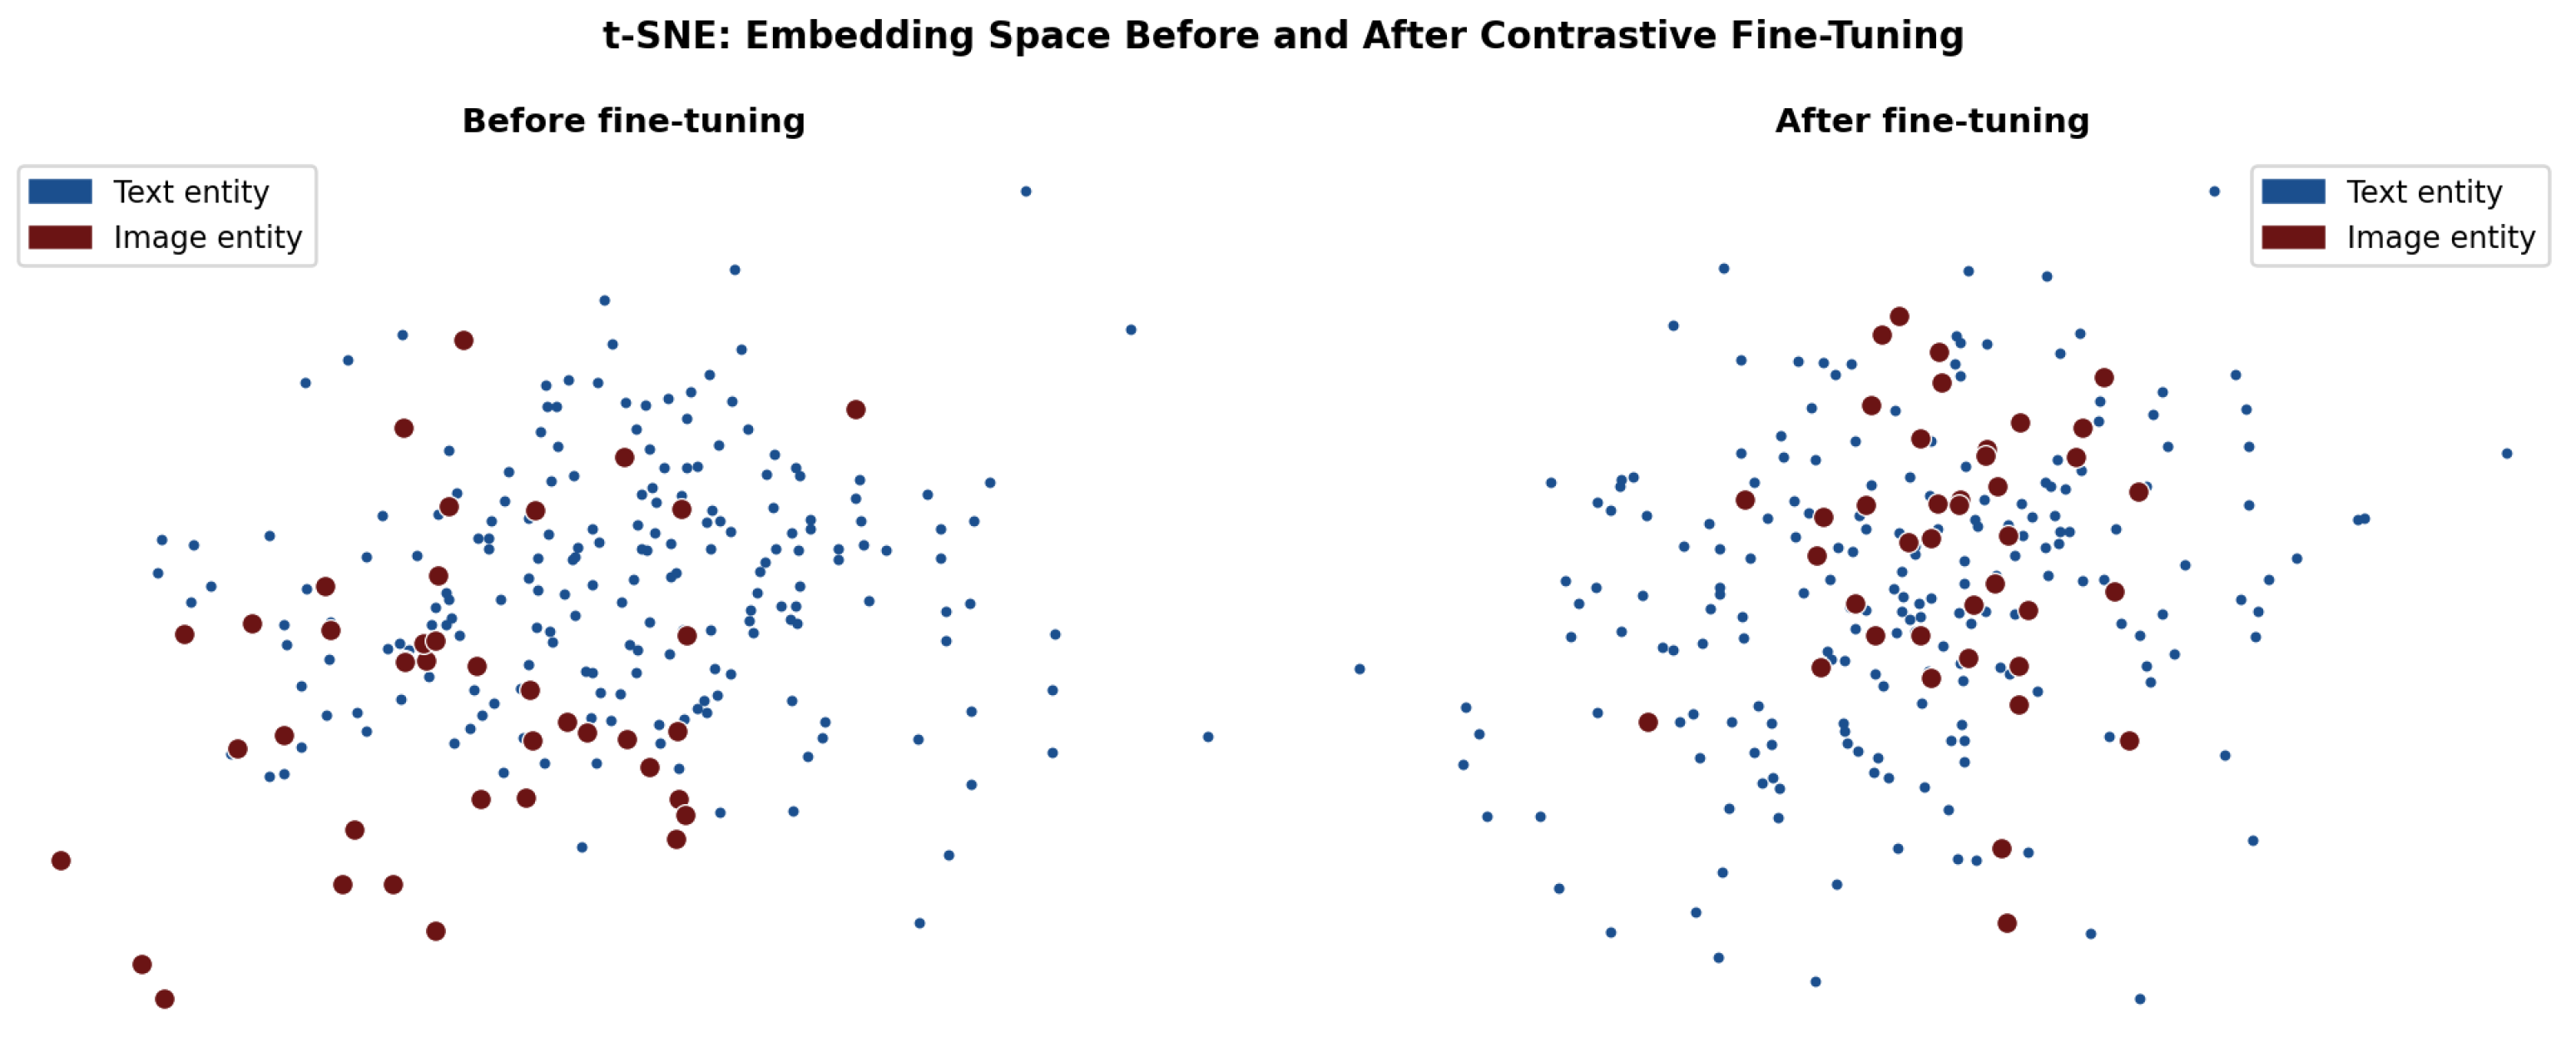
Figure 16.
Contrastive embedding fine-tuning loss curve (InfoNCE-style MultipleNegativesRankingLoss). The loss decreases from approximately 2.5 at step 0 to a stable plateau near 1.8, with minor oscillations reflecting batch sampling variance during fine-tuning.
Figure 16.
Contrastive embedding fine-tuning loss curve (InfoNCE-style MultipleNegativesRankingLoss). The loss decreases from approximately 2.5 at step 0 to a stable plateau near 1.8, with minor oscillations reflecting batch sampling variance during fine-tuning.
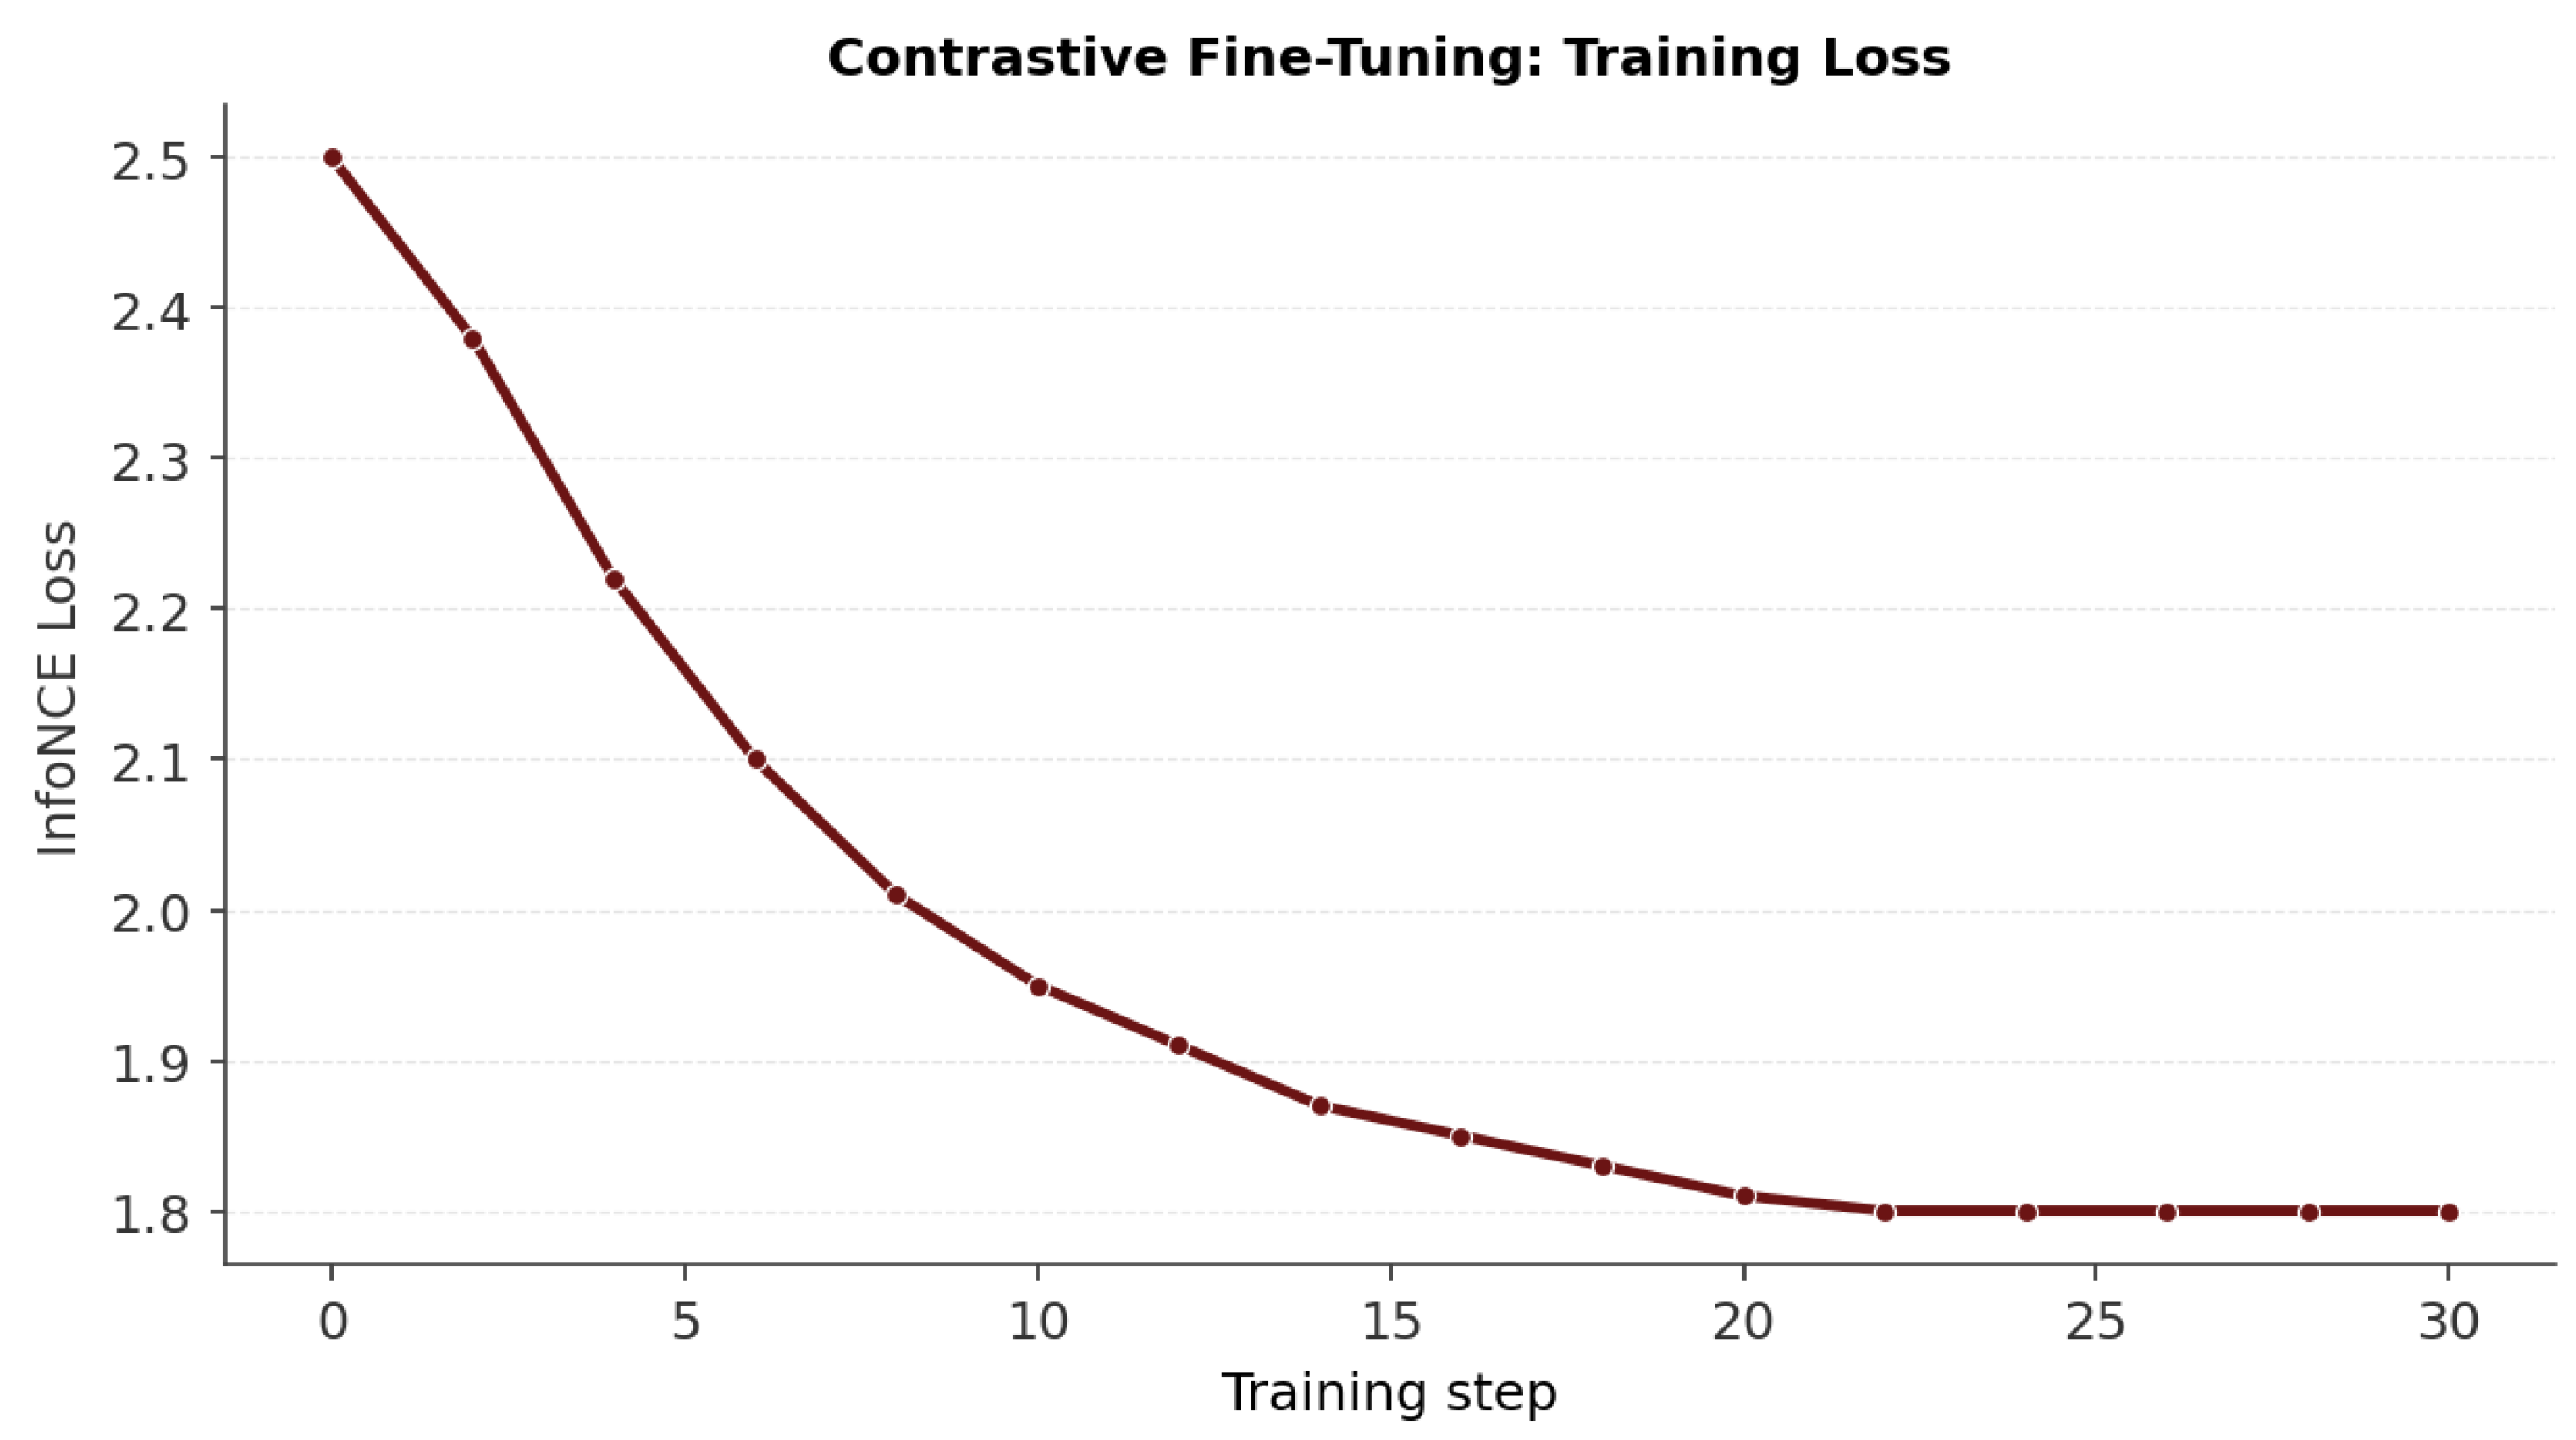

Table 1.
Evolution of knowledge graph construction and retrieval frameworks across modalities. ✓ denotes full support and ✗ denotes no support for the indicated capability.
Table 1.
Evolution of knowledge graph construction and retrieval frameworks across modalities. ✓ denotes full support and ✗ denotes no support for the indicated capability.
| Work | Year | Visual Support | End-to-End Construction | Cross-Modal Alignment | Adaptive Clustering | Semantic Bridging | Contrastive Learning | RAG Integration |
|---|---|---|---|---|---|---|---|---|
| Text-Centric Knowledge Graph Construction | ||||||||
| NELL [13] | 2010 | ✗ | ✓ | ✗ | ✗ | ✗ | ✗ | ✗ |
| BiLSTM-CRF [16] | 2016 | ✗ | ✗ | ✗ | ✗ | ✗ | ✗ | ✗ |
| REBEL [20] | 2021 | ✗ | ✓ | ✗ | ✗ | ✗ | ✗ | ✗ |
| LLM+KG [23] | 2024 | ✗ | ✓ | ✗ | ✗ | ✗ | ✗ | ✓ |
| Multimodal Knowledge Graphs | ||||||||
| MMKG [27] | 2019 | ✓ | ✗ | ✓ | ✗ | ✗ | ✗ | ✗ |
| Richpedia [29] | 2020 | ✓ | ✗ | ✓ | ✗ | ✗ | ✗ | ✗ |
| KG-MRI [57] | 2024 | ✓ | ✗ | ✓ | ✗ | ✗ | ✓ | ✗ |
| Vision-Language Models | ||||||||
| CLIP [33] | 2021 | ✓ | ✗ | ✓ | ✗ | ✗ | ✓ | ✗ |
| BLIP-2 [37] | 2023 | ✓ | ✗ | ✓ | ✗ | ✗ | ✓ | ✗ |
| Graph-Based RAG Systems | ||||||||
| GraphRAG [59] | 2024 | ✗ | ✓ | ✗ | ✗ | ✗ | ✗ | ✓ |
| HippoRAG [60] | 2024 | ✗ | ✓ | ✗ | ✗ | ✗ | ✗ | ✓ |
| LightRAG [61] | 2024 | ✗ | ✓ | ✗ | ✗ | ✗ | ✗ | ✓ |
| MegaRAG [7] | 2025 | ✓ | ✓ | ✓ | ✗ | ✗ | ✗ | ✓ |
| QD-GraphRAG [10] | 2025 | ✗ | ✓ | ✗ | ✗ | ✗ | ✗ | ✓ |
| MOSAIC (this study) | 2026 | ✓ | ✓ | ✓ | ✓ | ✓ | ✓ | ✓ |
Table 2.
Baseline systems used for comparison with MOSAIC. ✓ denotes support and ✗ denotes no support for the indicated capability.
Table 2.
Baseline systems used for comparison with MOSAIC. ✓ denotes support and ✗ denotes no support for the indicated capability.
| Method | Core Retrieval Strategy | Graph-Based | Multimodal | Reasoning Capability | Primary Limitation |
|---|---|---|---|---|---|
| NaiveRAG [52] | Dense chunk-level semantic retrieval over unstructured text corpora | ✗ | ✗ | Single-hop semantic retrieval | No graph structure or cross-modal reasoning |
| BM25 [62] | Lexical term-frequency inverse-document-frequency retrieval | ✗ | ✗ | Keyword matching | Limited semantic understanding |
| LightRAG [61] | Dual-level graph-enhanced retrieval with local and global context aggregation | ✓ | ✗ | Multi-hop graph retrieval | Operates only on textual knowledge graphs |
| HippoRAG [60] | Knowledge graph retrieval using Personalised PageRank over associative memory structures | ✓ | ✗ | Multi-hop associative reasoning | Text-centric graph construction |
| Query-Driven Multimodal GraphRAG [10] | Dynamic query-driven local graph construction and iterative refinement | ✓ | ✓ | Query-adaptive graph reasoning | Constructs temporary query-specific graphs rather than globally coherent MMKGs |
Table 3.
Hardware and software specifications for the experiments.
| Hardware | Software |
|---|---|
| Processor: Apple M4 Max chip | Programming Language: Python 3.10 |
| CPU: Multi-core ARM architecture | LLM Runtime: Ollama |
| GPU: Integrated Apple GPU | Language Model: LLaMA 3.1 8B |
| RAM: 36 GB Unified Memory | Embedding Model: all-MiniLM-L6-v2 |
| Storage: SSD (1 TB) | Libraries: PyTorch, Transformers, Sentence-Transformers |
| Graph Processing: NetworkX |
Table 4.
Overall ANLS on MMLongBench-Doc (134 documents, 1,082 QA pairs). Bold indicates the best score.
Table 4.
Overall ANLS on MMLongBench-Doc (134 documents, 1,082 QA pairs). Bold indicates the best score.
| System | Overall ANLS | vs. MOSAIC |
|---|---|---|
| BM25 | 0.271 | |
| NaiveRAG | 0.254 | |
| HippoRAG | 0.183 | |
| QD-GraphRAG | 0.175 | |
| LightRAG | 0.143 | |
| MOSAIC | 0.285 | — |
Table 5.
ANLS by document category on MMLongBench-Doc. Bold indicates the best result per category. MOSAIC leads in four of seven categories, with the largest gains on visually intensive document types (Financial, Brochure, Admin/Industry).
Table 5.
ANLS by document category on MMLongBench-Doc. Bold indicates the best result per category. MOSAIC leads in four of seven categories, with the largest gains on visually intensive document types (Financial, Brochure, Admin/Industry).
| System | Academic | Admin/ | Brochure | Financial | Guidebook | Research | Tutorial/ | Overall |
|---|---|---|---|---|---|---|---|---|
| Paper | Industry | Report | Report | Workshop | ||||
| BM25 | 0.268 | 0.319 | 0.248 | 0.162 | 0.313 | 0.315 | 0.216 | 0.271 |
| NaiveRAG | 0.278 | 0.333 | 0.248 | 0.154 | 0.296 | 0.273 | 0.173 | 0.254 |
| HippoRAG | 0.265 | 0.305 | 0.218 | 0.077 | 0.243 | 0.171 | 0.022 | 0.183 |
| QD-GraphRAG | 0.255 | 0.313 | 0.188 | 0.058 | 0.230 | 0.167 | 0.022 | 0.175 |
| LightRAG | 0.142 | 0.333 | 0.167 | 0.062 | 0.300 | 0.143 | 0.005 | 0.143 |
| MOSAIC | 0.274 | 0.361 | 0.307 | 0.188 | 0.348 | 0.308 | 0.209 | 0.285 |
Table 6.
Token-F1 disaggregated by evidence type on DocBench (balanced: 308 visual + 308 text QA pairs, 166 documents). Bold indicates the best score per column. MOSAIC leads by on visual questions; BM25 leads on text-grounded questions.
Table 6.
Token-F1 disaggregated by evidence type on DocBench (balanced: 308 visual + 308 text QA pairs, 166 documents). Bold indicates the best score per column. MOSAIC leads by on visual questions; BM25 leads on text-grounded questions.
| System | Visual F1 | Text F1 | Overall F1 |
|---|---|---|---|
| BM25 | 0.126 | 0.497 | 0.311 |
| NaiveRAG | 0.104 | 0.348 | 0.226 |
| LightRAG | 0.044 | 0.321 | 0.201 |
| HippoRAG | 0.043 | 0.274 | 0.159 |
| QD-GraphRAG | 0.007 | 0.068 | 0.037 |
| MOSAIC | 0.318 | 0.276 | 0.297 |
Table 7.
Graph structural metrics across the five MOSAIC ablation configurations. Arrows indicate the direction of improvement (↓ lower is better, ↑ higher is better). Semantic bridging (A3) produces the largest single-step improvement; contrastive fine-tuning (A4) preserves all structural gains.
Table 7.
Graph structural metrics across the five MOSAIC ablation configurations. Arrows indicate the direction of improvement (↓ lower is better, ↑ higher is better). Semantic bridging (A3) produces the largest single-step improvement; contrastive fine-tuning (A4) preserves all structural gains.
| Configuration | Connected | Graph | Clustering | Largest Comp. | Singleton |
|---|---|---|---|---|---|
| Comp. ↓ | Density ↑ | Coeff. ↑ | Fraction ↑ | Ratio ↓ | |
| A0 (Baseline) | 218 | 0.0047 | 0.1950 | 0.4590 | 0.8580 |
| A1 (+HDBSCAN) | 166 | 0.0053 | 0.2610 | 0.5200 | 0.7420 |
| A2 (+Conf. Align) | 123 | 0.0060 | 0.3110 | 0.5800 | 0.6470 |
| A3 (+Bridging) | 46 | 0.0072 | 0.4100 | 0.6550 | 0.5430 |
| A4 (Full MOSAIC) | 46 | 0.0072 | 0.4100 | 0.6550 | 0.5430 |
| Total gain |
Disclaimer/Publisher’s Note: The statements, opinions and data contained in all publications are solely those of the individual author(s) and contributor(s) and not of MDPI and/or the editor(s). MDPI and/or the editor(s) disclaim responsibility for any injury to people or property resulting from any ideas, methods, instructions or products referred to in the content. |
© 2026 by the authors. Licensee MDPI, Basel, Switzerland. This article is an open access article distributed under the terms and conditions of the Creative Commons Attribution (CC BY) license (http://creativecommons.org/licenses/by/4.0/).
Copyright: This open access article is published under a Creative Commons CC BY 4.0 license, which permit the free download, distribution, and reuse, provided that the author and preprint are cited in any reuse.