

Submitted:
02 August 2026
Posted:
04 August 2026
You are already at the latest version
Abstract
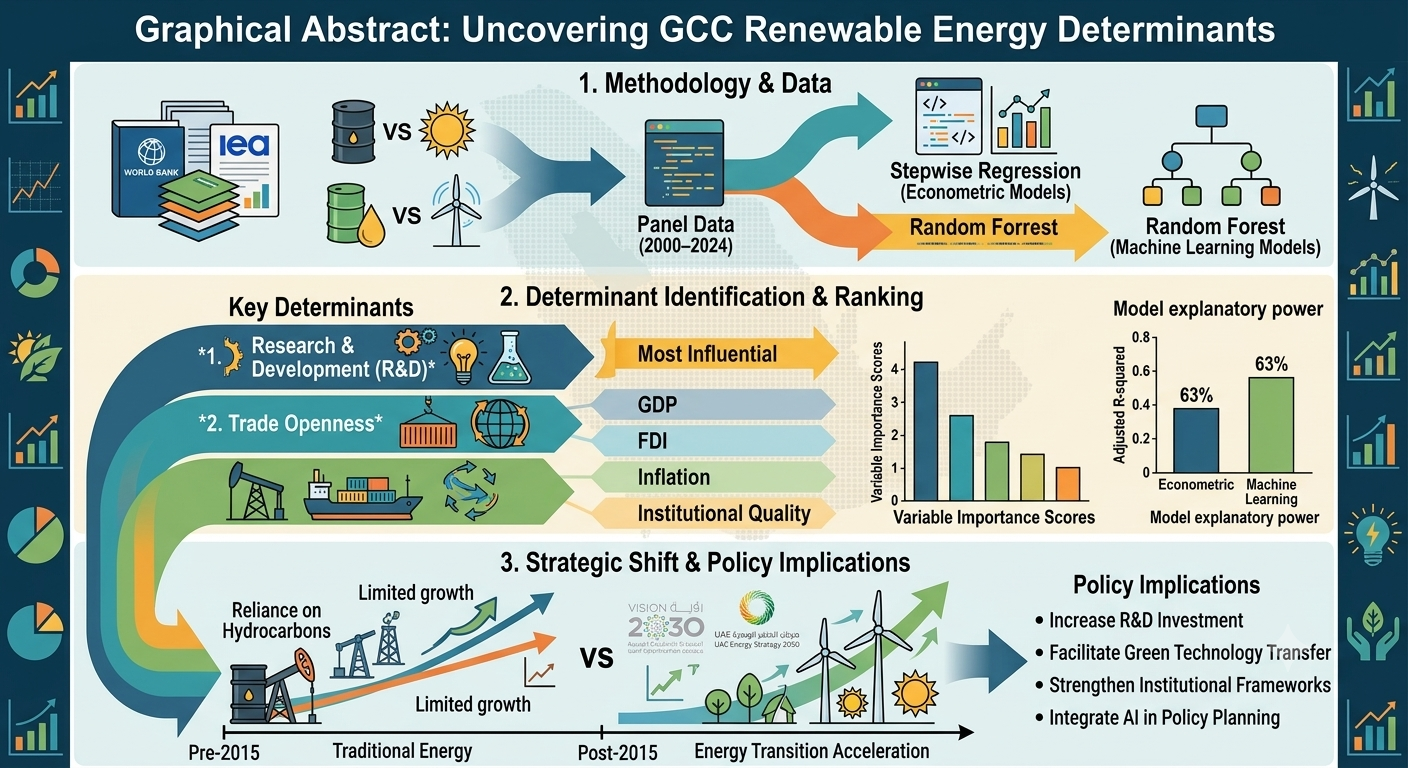
The Gulf Cooperation Council (GCC) countries face the challenge of balancing their re-liance on hydrocarbon resources with ambitious renewable energy transition goals, in-cluding initiatives such as Saudi Vision 2030. Despite these commitments, renewable energy deployment in the region remains relatively limited, highlighting the need to better understand the factors that drive renewable energy consumption. This study investigates the macro-economic determinants of renewable energy consumption in the six GCC countries over the period 2000-2024 using a hybrid methodology of stepwise regression analysis and Random Forest machine learning. Panel data were compiled from the World Bank and the International Energy Agency. The econometric results identify Research and Development (R&D) expenditure and trade openness as the two most important determinants of renewable energy consumption, jointly explaining approximately 63% of the variation (Adjusted R² = 0.629). The Random Forest model supports these findings by ranking R&D expenditure as the most influential predictor, followed by trade openness. GDP, foreign direct investment, and inflation were dropped significantly from the final model because of multicollinearity and the struc-tural characteristics of GCC economies. The Random Forest model also achieved an out-of-sample R-squared of 0.425 with a low RMSE (0.032), demonstrating satisfactory predictive performance. Sub-period analysis further shows that the influence of R&D expenditure and trade openness become more pronounced after 2015, alongside the implementation of national energy transition strategies across the GCC. These findings underline the importance of technological innovation and economic openness in sup-porting the region’s energy transition that greater investment in R&D and stronger in-ternational trade integration can help renewable energy adoption.
Keywords:
renewable energy
; GCC
; research and development
; trade openness
; machine learning
; panel data
; energy transition
1. Introduction
The transition to cleaner energy has become a global priority as countries seek to reduce greenhouse gas emissions while ensuring long-term energy security. Against this backdrop, the Gulf Cooperation Council (GCC) countries face the challenge of balancing their long-standing dependence on hydrocarbon resources with ambitious renewable energy transition goals. The (GCC) nations—Saudi Arabia, United Arab Emirates (UAE), Qatar, Kuwait, Oman, and Bahrain—face a unique challenge. While their economies have long depended on abundant hydrocarbon resources, they are increasingly pursuing renewable energy to diversify their energy mix and support climate objectives. The change in strategic direction could be observed in various programs, for instance, in the Saudi Vision 2030 plan and the UAE Energy Strategy 2050 which imply bold goals with respect to the use of clean energy [1]. Despite these ambitious strategies, renewable energy deployment has progressed more slowly than expected. For example, by 2022 renewable energy accounted for only 0.6% of electricity generation in Saudi Arabia, far below its target, while Kuwait achieved only 0.2% compared with its 5% target, showing the gap between policy ambitions and implementation [2].
Previous studies suggest that the determinants of renewable energy adoption vary across countries and depend on their economic structure, institutional environment, and energy market characteristics. Statistical analysis has revealed that traditional drivers like fiscal capacity and energy market size have been statistically insignificant in energy-exporting Arab countries characterized by strong path dependence and carbon lock-in effects [3]. For instance, studies focused on GCC countries have revealed that the institutional quality and trade openness can negatively and significantly affect renewable energy demand in the long run, opposing the traditional view on the role of openness in energy transitions [4]. Moreover, macroeconomic volatility and inflation have been identified as important negative determinants of renewable energy security in the MENA region [5]. These findings suggest that maintaining macroeconomic stability may facilitate renewable energy investment.
Although a growing body of research has examined the factors affecting renewable energy adoption in the GCC, less attention has given to understanding which factors matter most. This study addresses this issue by combining stepwise regression and Random Forest analysis to identify and rank the key macroeconomic determinants of renewable energy consumption across the GCC between 2000 and 2024. Specifically, the study addresses the following research questions:
- What are the main macroeconomic determinants of renewable energy consumption in the GCC?
- How do the results obtained from Random Forest compare with those from conventional econometric model?
- Have determinants of renewable energy consumption changed following the introduction of national energy transition strategies after 2015?
By combining econometric analysis with machine learning, this study identifies the main determinants of renewable energy consumption while also assessing their relative importance and predictive performance. In doing so, it provides additional evidence to support energy policy and the transition to renewable energy in the GCC.
The remainder of this paper is organized as follows. Section 2 reviews the relevant literature and presents the theoretical framework. Section 3 describes the data and methodology. Section 4 reports the empirical results. Section 5 discussed the findings, Section 6 concludes with policy implications and directions for further research.
2. Literature Review and Theoretical Framework
Renewable energy adoption has attracted increasing attention in energy economics literature. Previous studies have examined a wide range of economic, technological, and institutional factors that influence renewable energy consumption, although the importance of these factors varies across countries and regions. This section will review the main theoretical perspectives and empirical findings, with particular attention to the GCC context.
2.1. Economic Growth and Renewable Energy
Economic growth is widely recognized as an important factor influencing renewable energy deployment. As economies expand, they are generally having greater financial capacity to invest in energy infrastructure, technological innovation, and renewable energy projects. The Environmental Kuznets Curve (EKC) hypothesis suggests that economic development can support cleaner energy system through technological progress and stronger environmental policies [6,7]. Empirical evidence also indicates that economic growth can promote renewable energy consumption by increasing investment and improving energy infrastructure [8,9].
However, this relationship may differ in hydrocarbon- dependent economies as the GCC. Economic growth in these countries has traditionally been driven by oil and gas revenues, reinforcing reliance on fossil fuels and slowing the transition to renewable energy. This is consistent with the carbon lock-in theory, which argues that long term dependence on fossil fuel infrastructure creates path dependence that hinders the adoption of cleaner energy technologies (Unruh, 2000). Supporting this view, Al Mulali et al. [10] found that the relationship between economic growth and environmental outcomes in the GCC is more complex than predicted by the traditional EKC framework. Similarly, ref. [11] reported that continued dependence on conventional energy has constrained renewable energy development across Arab countries. These findings suggest that the effect of economic growth on renewable energy consumption depend on the economic structure and energy policies of individual countries.
2.2. Trade Openness, Foreign Direct Investment, and Renewable Energy Consumption
Trade openness and foreign direct investment (FDI) can support renewable energy development by facilitating technology transfer, attracting investment, and improving access to international markets [12]. However, their impact depends largely on the economic structure and policy environment of the host country.
Empirical evidence for the GCC countries remains mixed. Several studies have reported that trade oppeness does not necessarily promote renewable energy consumption, particularly in hydrocarbon-dependent economies where trade is closely linked to fossil fuel production and exports [4,13,14,15]. Using the pooled mean group (PMG) approach, Yakuba et al. (2024) found that trade openness had a significant negative effect on renewable energy consumption in the long run. Similarly, Al-Sarihi and Mansour [1] argued that trade alone is insufficient to accelerate the energy transition unless it is accompanied by effective technology transfer and supportive institutional framework. These findings highlight the importance of complementary policies that facilitate green technology transfer, strengthen institutional support, and direct trade related investment toward renewable energy projects [12,16].
Similarly, the role of FDI is still debated. The pollution Haven Hypothesis argues that multinational firms may relocate pollution- intensive activities to countries with weaker environmental regulations [17], whereas the pollution Halo Hypothesis suggests that FDI can promote cleaner production through the transfer of advanced technologies [18]. Evidence from the GCC, however, indicates that FDI has often supported conventional energy activities rather than renewable energy development (Al-Muharrami et al., [4]. Likewise, Ekwueme [19] found that the environmental effects of trade openness and FDI depends on how investment is directed and supported by national policies. Overall, the evidence suggests that the benefit of trade openness and FDI depend on whether they facilitate the adoption of green technologies and sustainable investment.
2.3. Inflation and Macroeconomic Stability
Macroeconomic stability plays an important role in promoting renewable energy investment by reducing financial uncertainty and improving the investment climate. High inflation can increase project costs, raise financing expenses, and discourage long-term investment in renewable energy infrastructure [5]. Consequently, maintaining price stability is considered essential for supporting the transition to cleaner energy systems.
Empirical evidence generally supports this relationship. Using panel ARDL analysis for 16 MENA countries, Yousef [5] found that inflation and macroeconomic instability had a significant negative effect on renewable energy development in both the medium and long run, while sound fiscal policies promoted renewable energy expansion. Similar evidence is reported by Ahmed et al. [3], who emphasized that macroeconomic conditions are important determinants of energy consumption and energy transition. These findings suggest that a stable macroeconomic environment, supported by sound fiscal and monetary policies, is essential for encouraging renewable energy investment.
2.4. Research and Development (R&D) Expenditure
Research and Development (R&D) is widely recognized as a key deriver of renewable energy development by promoting technological innovation, improving energy efficiency, and reducing the cost of renewable energy technologies. The Induced Innovation Theory argues that changes in relative prices encourage technological innovations, leading to more efficient use of scarce resources [20]. Empirical have consistently shown that public and private R & D investment accelerates technological progress and enhances the competitiveness of renewable energy technologies [20,21].
Recent evidence highlights the growing importance of R & D in supporting the energy transition, particularly in oil-dependent economies. Derouez [22] found that technological advancement is a major deriver of renewable energy production in Saudi Arabia, while Jaboob (2026) emphasized that innovation and green financing are essential for achieving sustainable energy transition goals in the GCC. Similarly, Al-Ghamdi et al. [23] reported that Vision 2030 has strengthened the role of innovation, human capital, and financial development in accelerating Saudi Arabia’s transition toward renewable energy. Together, these studies suggest that increasing investment in R & D is essential for enhancing renewable energy deployment and supporting the GCC’s long run energy transition.
Given the increasing emphasis on innovation-dirven energy policies in the GCC, R & D expenditure is expected to play a significant role in promoting renewable energy consumption.
2.5. The GCC Context and Research Gap
Although interest in renewable energy had grown considerably, the GCC region remains underrepresented in the empirical literature. This particularly important because GCC countries possess substantial financial resources and have adopted ambitious national strategies to promote renewable energy, yet progress in implementation has been relatively slow [1,24]. The region continues to face unique challenges, including heavy dependence on hydrocarbon revenues, high energy subsidies, and established fossil fuel infrastructure, all of which slow the transition to renewable energy [25,26].
To accelerate the energy transition, GCC countries have introduced long-run policy framework. Including Saudi Vision 2030, the UAE Energy Strategy 2050, Qatar National Vision 2030, Kuwait Vision 2035, Oman Vision 2040, and Bahrain Vision 2030 (Table 1). Despite these ambitious targets, renewable energy deployment has been slower than anticipated [1].
Existing studies have mainly focused on individual determinants such as economic growth, trade openness, or energy consumption [8,22,27], while limited attention has been given to evaluating the relative importance of multiple macroeconomic determinants within a unified analytical framework. Moreover, most previous studies rely on conventional econometrics methods, with little use of machine learning techniques to assess variable importance and predictive performance. To address these gaps, this study combines stepwise regression and Random Forest analysis to identify the key macroeconomic determinants of renewable energy consumption in GCC countries over the period 2000–2024.
3. Data and Methodology
3.1. Data and Sources
This study adopts the use of yearly panel data for the six GCC countries, which include Saudi Arabia, the United Arab Emirates UAE, Qatar, Kuwait, Oman, and Bahrain for the period from 2000 to 2024. The data for this study is drawn from two sources, the World Development Indicators (WDI) of the World Bank and the International Energy Agency (IEA).

Table 2.
Variable definitions and data sources.
| Variable | Symbol | Definition | Source |
|---|---|---|---|
| Renewable Energy Consumption | Renewable | Renewable energy consumption (% of total final energy consumption) | WDI/IEA |
| GDP | gdp | Gross Domestic Product (constant USD) | WDI |
| Foreign Direct Investment | fdi | Net inflows of FDI (% of GDP) | WDI |
| Trade Openness | trade | Sum of exports and imports (% of GDP) | WDI |
| Inflation | inflation | Annual change in consumer prices (%) | WDI |
| R&D Expenditure | r_d | Research and development expenditure (% of GDP) | WDI |
| Institutional Quality | inst_quality | World Governance Indicators (composite) | WGI |
The last dataset comprises 150 data points (6 countries × 25 years) being comparatively equal. The applied unit root tests applied by Levin-Lin-Chu and Im-Pesaran-Shin determined if or not there are stationary variables in the data. In the case of missing values, linear interpolation was used. The period analyzed was selected due to it being covering both before-vision period (2000–2014) and after-vision period (2015–2024) when different national energy strategies were implemented in practice.
Due to the fact that the GCC countries have undergone extensive economic integration and joint policy-making processes, the cross-sectional dependency is evaluated in the study using the Pesaran CD test. The findings (given in Appendix A) reveal that the panel exhibits strong cross-sectional dependency, meaning that reliable standard errors should be applied in the subsequent analysis performed in our study.
3.2. Theoretical Model Specification
Based on the theoretical framework presented in Section 2, we formulate an empirical model in which renewable energy consumption is a function of technological innovation, trade openness, economic activity, foreign investment, and price stability. The Resource Curse and Dutch Disease theories suggest that the traditional economic variables may have different relationships with energy transition outcomes in resource-rich economies than in diversified economies. Specifically, we hypothesize that:
H1;
R&D expenditure has a positive and significant effect on renewable energy consumption in the GCC.
H2:
Trade openness has a positive and significant effect on renewable energy consumption.
H3:
The effects of R&D and trade openness are amplified following the implementation of national energy visions (post-2015).
H4:
Traditional macroeconomic variables (GDP, FDI, Inflation) are not significant drivers due to the structural characteristics of GCC economies.
3.3. Econometric Models
In order to determine the most minimal number of factors that influence the consumption of renewable energy, we make use of a stepwise regression technique. Specifically, the starting model is defined as:
where indexes countries, t indexes years, captures country-specific fixed effects, and is the error term. Variables with insignificant coefficients or high multicollinearity (VIF > 10) are sequentially removed until the model with the lowest Akaike Information Criterion (AIC) is obtained.
Stepwise regression has some famous drawbacks including the risk of overfitting and instability of coefficient estimates, but we use it for exploratory purposes in this study to find the most parsimonious set of factors. To minimize the risk of stepwise selection, we also apply the VIF to identify multicollinearity, the AIC to compare data sets, and Cross-validation to assess the performance on out-of-sample information.
Other methods for variable selection, such as LASSO regression, were also considered, but were thought to be less suitable due to the relatively small sample size and the desire for interpretable coefficients. As a robustness check, we also re-estimate our final model using Fixed Effects and Random Effects panel data models.
We assess our results using both Fixed Effects (FE) and Random Effects (RE) panel models, helping us to evaluate the reliability of our results. To find out the appropriate specification, we use the Hausman test [28]. We perform diagnostic tests for serial correlation (Breusch-Godfrey) and heteroscedasticity (Breusch-Pagan) as well as employ robust standard errors where necessary [29].
3.4. Machine Learning Model: Random Forest
We adopted the Random Forest (RF) technique, which refers to the ensemble learning process that develops several decision trees and consolidates their forecasts [30]. This enables us to ascertain the stability of our econometric findings and measure our forecasting models’ efficiency. When applying the RF technique, the following hyperparameters were set: forest size–500 trees; number of features to be taken into account at each split was set to floor(sqrt (7)) = 2; minimum node size—5; out-of-bag (OOB) error monitoring technique was applied for internal validation purposes.
Stratified sampling is being applied to split the dataset into training subsets (80 percent) and testing subsets (20 percent) in order to guarantee good representation of each country. Following training of the model using the training subset, the assessment of the model’s performance on the testing subset was carried out using the RMSE and the out-of-sample R-square. MDA and MDI were used in determining the importance of the variable.
The application of machine learning in predicting energy consumption in the Gulf Cooperation Council (GCC) has shown that ensemble methods are effective. For example, in a study conducted to forecast solar photovoltaic electricity in Qassim, Saudi Arabia, ensemble trees techniques were employed to capture the effect of weather conditions, resulting in high prediction accuracy [31]. At the same time, in another instance, the Kuwait Renewable Energy Prediction System (KREPS) was developed by combining artificial intelligence and physical models, and it makes operational forecasts in renewable energy production [32].
3.5. Sub-Period Analysis
Taking into account the new announcements on the energy strategies (for example, Saudi Vision 2030 (2016) and UAE Energy Strategy 2050 (2017)), the sample has been broken down into two-time intervals—2000–2014 and 2015–2024. This helps track possible structural alterations caused by these strategic innovations. In order to detect in what manner, the above-mentioned factors affecting renewable energy consumption have changed with time, the econometric model is analyzed separately for both time intervals. This approach also fits well into the context of the Paris Agreement released in 2015 since it might have affected the renewable energy policy worldwide.
4. Results
4.1. Descriptive Statistics
The data presented in Table 3 offers descriptive statistics for all the variables that have been utilized throughout the research study. In the case of Gulf Cooperation Council (GCC) the average percentage of renewable energy corresponds to 7.1%, while considerable variation has been observed within the countries as well as over time (from 0% to 100%). The variable with the highest standard deviation is GDP, highlighting the degree of economic variability in GCC countries in comparison to one another.
The substantial variation in renewable energy consumption (SD = 0.186) reflects both the heterogeneity among GCC countries and the significant changes over time, particularly following the implementation of national energy visions.
4.2. Correlation Analysis
The correlation matrix shown in Table 4 produces some striking correlations. To begin with, renewable energy consumption is strongly connected with R&D expenditure (0.734) as well as with openness to trade (0.489), which strengthens the theory that the aforementioned indicators mean a lot in the process of explaining certain phenomena. Moreover, there is a moderate correlation between GDP and renewable energy (0.251) while foreign direct investments (0.231) and inflation demonstrate weak correlation with the latter. The strong correlation between GDP and trade (0.831), as well as with R&D (0.541), means that multicollinearity might become an issue here.
The strong correlation between GDP and trade openness (0.831) suggests potential multicollinearity issues, which we address through VIF analysis and model selection procedures. Notably, the correlation between R&D expenditure and renewable energy consumption (0.734) is substantially stronger than that between GDP and renewable energy (0.251), providing preliminary support for our hypothesis that technological innovation, rather than economic size, is the primary driver of energy transition.
4.3. Trend Analysis
Figure 1 depicts the pattern of renewable energy utilization within the confines of GCC countries throughout the review period. The figures illustrate that renewable energy consumption began to increase noticeably in 2015, coinciding with the year when the energy visions of various nations started appearing. Several other nations have started their reasonable move towards increased share from low original levels; however, UAE and Saudi Arabia seem to be the most significant movers.
Figure 2 shows the project values of six Gulf nations in billions of dollars and the respective contribution percentage of each nation in total. The first place is held by Saudi Arabia in terms of project value with USD 4.858 billion which accounts for 31.7% of the market. The second place goes to the UAE with USD 4.098 billion or a 26.7% share. In terms of third position, it goes to Kuwait as far as the project value is concerned with USD 2.678 billion or 17.4%. Oman comes next with USD 2.018 billion (13.1%) and the next nation is Qatar with USD 1.338 billion (8.7%). At last, in sixth position comes Bahrain with USD 0.388 billion (2.5%). The overall project value of the joint countries is USD 15.378 billion with more than half contributed by Saudi Arabias and UAE which is 58.4%.
4.4. Regression Results
Using the stepwise regression procedure a simple model involving only two variables such as Trade Openness and R&D Expenditure was selected. The variables like GDP, FDI, and inflation were dropped from analysis because of their statistical insignificance and potential multicollinearity problems (VIF > 10). The results of the final pooled OLS model are presented in Table 5.
The model’s explanatory power is significantly important, having adjusted R-squared of 0.629. The coefficients of each variable are positive and differ significantly from zero (p < 0.001). The coefficient of R&D expenditure is much greater than the coefficient of trade openness because the coefficient of R&D (β = 0.355) is much higher than that of trade openness (β = 0.002). This shows that the result of technological advancement on the green energy change is much greater than that of trade openness. It should be noted that one standard deviation increase in R&D expenditure (0.34%) leads to an increase of 0.121% in the share of green energy compared to 0.240% increase associated with one standard deviation increase in trade openness (133.48%).
4.5. Robustness Checks: Panel Data Models
To ensure the validity of our findings, we re-estimated the relationship using panel data models with Fixed Effects (FE) and Random Effects (RE). Table 6 summarizes the results.
At the 0.1% significance level, it was found that both models validate the importance of R&D expenditure and trade openness. The results are consistent with the existing literature about the role of institutions in GCC transitions in energy [4]. The reliability of the results was also confirmed by the Hausman test since it shows that there are no systematic differences between the two estimators (χ2 = 1.45, p= 0.563).
4.6. Diagnostic Tests
Diagnostic tests suggested the presence of heteroskedasticity (Breusch-Pagan: BP = 97.43, p < 0.001) and serial correlation (Breusch-Godfrey: χ2 = 115.99, p < 0.001) in the residuals. In order to mitigate these issues, we applied robust standard errors (White’s correction) [33] but this did not affect the coefficients’ sign and significance. The robust standard errors ensure the validity of statistical inference, and these results are provided for completeness.
4.7. Sub-Period Analysis (Pre- and Post-2015)
To reflect the structural shift in energy policy with the introduction of national visions, we split the sample into two sub-periods: 2000–2014 and 2015–2024. Table 7 displays the results.
Attention should be drawn to the fact that prior to the year 2015, both research and development (R&D) and trade were not found to be statistically significant (p > 0.05). After that year, both became important factors, with R&D showing an exceptionally large coefficient (β = 0.714, p < 0.001). The findings of the study highlight the critical role of government policies in enhancing the impact of trade and R&D on the development of renewables. The role of institutional quality also increased significantly in the years after 2015 due to strengthening of national governance systems.
4.8. Machine Learning Results
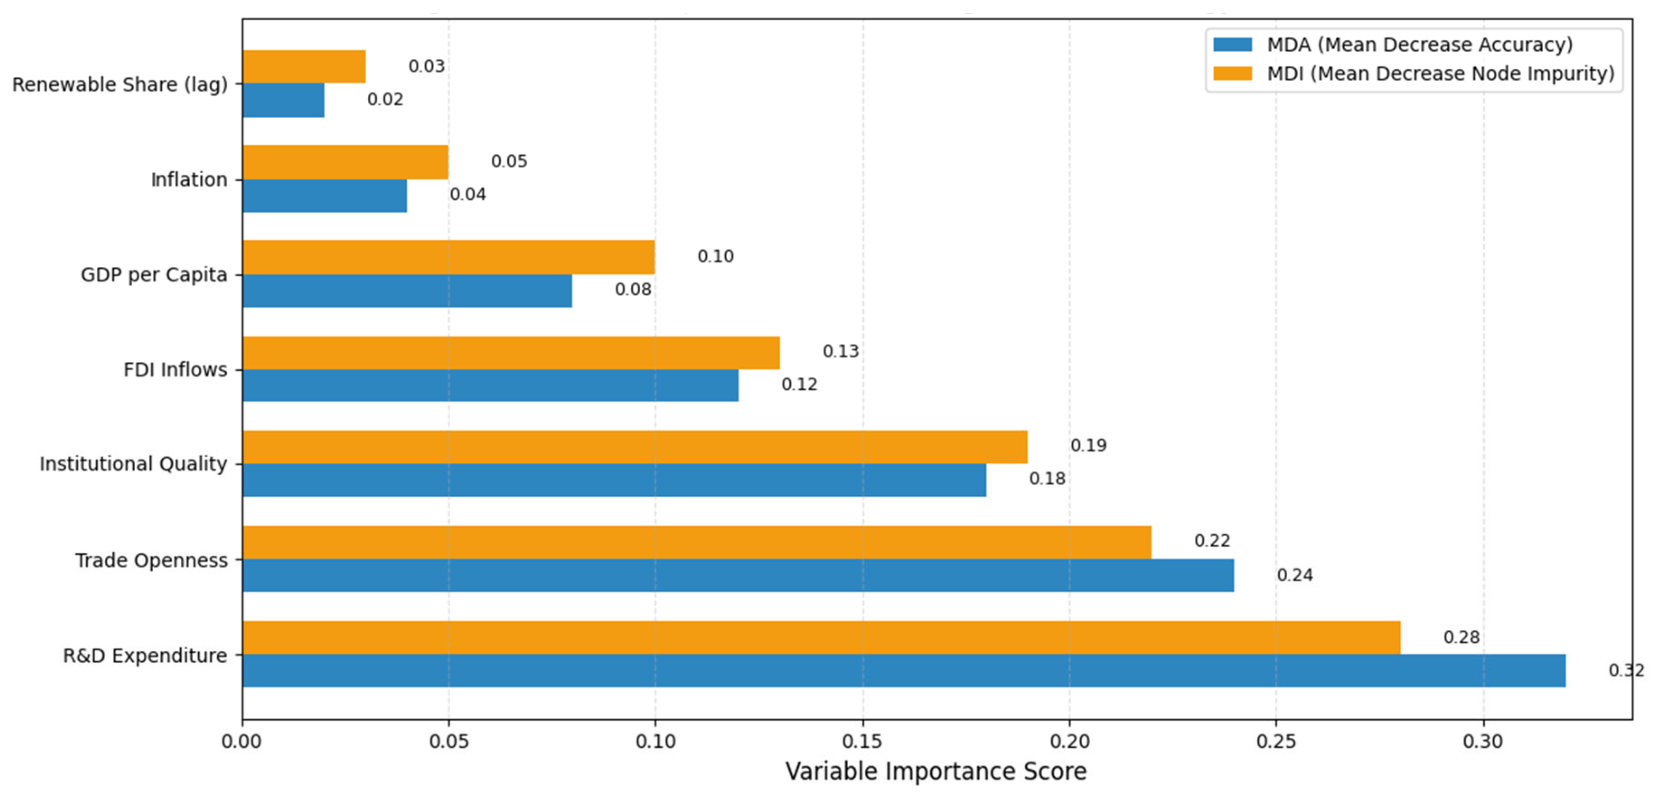
Eighty percent of the data (120 observations) were used to train the Random Forest model; the remaining twenty percent (30 observations) were used for testing. The out-of-sample performance indicators are shown in Table 8.
The model achieves good prediction accuracy as indicated by its low value of RMSE and good out-of-sample R2 results. In this case, the model’s out-of-sample R2 of 0.425 is lower than the in-sample R2 of 0.63, which is usual for machine learning models and indicates the model’s capacity to generalize well to new data without overfitting. Also, according to its MAE of 0.0258 predictions are typically within 2.6 percentage points of the actual share of renewable energy.
Figure 3.
Variable importance in predicting renewable energy (Random Forest).
4.9. Scatter Plots and Country Comparisons
Furthermore, Figure 4, Figure 5, Figure 6 and Figure 7 provide us with more visual evidence. As shown in Figure 5, there is a slightly positive correlation between trade openness and renewable energy, while in Figure 4, we see a strong positive correlation between R&D expenditure and renewable energy. Figure 6 illustrates that according to the boxplot of renewable energy shares by countries, the UAE has the highest mean value, followed by Saudi Arabia. Meanwhile, Figure 7 shows the trend of renewable energy use by each of the GCC countries over the analyzed period.
5. Discussion
5.1. The Dominant Role of R&D Expenditure
The consistently positive effect of R & D expenditure across all estimation methods highlights the central role of technological innovation in accelerating the energy transition in GCC countries. This finding supports the predictions of the Induced Innovation Theory, which argues that technological progress is a key mechanism for improving resource efficiency and promoting the adoption of cleaner energy technologies. The stronger impact of R & D after 2015 further suggests that recent investments in research institutions, such as Masdar in the UAE and K.A.CARE in Saudi Arabia, have begun to strengthen renewable energy deployment by fostering innovation and technological development.
This finding is consistent with Al-Ghamdi et al., [34] who reported that Saudi Vision 2030 has strengthened the role of innovation, financial development, and human capital in accelerating the energy transition. Together, these findings indicate that the effectiveness of R & D investment depends not only on financial resources but also on supportive government policies and skilled human capital capable of transforming innovation into practical renewable energy solution.
5.2. The Positive Impact of Trade Openness
The positive effect of trade openness indicates that greater integration with international markets can support the expansion of renewable energy in GCC countries. By opening access to global markets, countries can import advanced renewable energy technologies at lower costs while benefiting from knowledge transfer and technological spillovers. These advantages can accelerate the adoption of renewable energy technologies and strengthen the transition toward cleaner energy system. This finding is consistent with previous research showing that international trade facilitates the diffusion of green technologies and supports renewable energy development.
However, the positive role of trade openness is not automatic. Al-Muharrami et al., [4] found that, in the absence of effective regulatory and institutional frameworks, greater trade openness may have a negative long-run effect on renewable development. This suggests that economic openness alone is insufficient to derive the energy transition. To fully realize its benefits, trade policies should be accompanied by measures that promote green investment, strengthen institutional quality, and encourage the transfer of clean energy technologies. Together, these complementary policies can ensure that increased trade contributes to sustainable energy development in GCC countries.
5.3. The Exclusion of GDP, FDI, and Inflation from the Final Model
The GDP, FDI, and inflation were excluded from the final model following the stepwise regression and diagnostic tests. The high correlation among GDP, trade openness, and FDI suggests that these variables capture similar aspects of economic activity in the GCC.
The insignificant effect of GDP suggests that economic expansion alone does not necessarily stimulate renewable energy consumption in resource-rich economies. Since GCC, economies have historically relied on hydrocarbons, economic growth has not always translated into greater investment in renewable energy. Similarly, the exclusion of FDI suggests that the amount of foreign investment is less important than where it is directed. Much of the region’s FDI has historically been concentrated in hydrocarbbons and other non-renewable sectors rather than clean energy projects. This finding support Al Muharrami et al. [4], who argued that FDI contributes to renewable energy development only when supported by strong institutions and policies that encourage green investment.
The insignificant effect of inflation may reflect the relatively stable macroeconomic environment of GCC countries, where exchange rate pegs and prudent monetary policies have kept inflation low over much of the study period. While this differs from the finding of Yousef [5], who reported a negative effect of inflation on renewable energy development in MENA countries, it is consistent with Ben-Salha et al. [35]. Who emphasized that macroeconomic stability supports long-term investment in renewable energy. Overall, these findings suggest that renewable energy development in the GCC depends less on economic growth or the volume of foreign investment and more on innovation, supportive institutions, and policies that direct investment toward clean energy technologies.
5.4. The Policy Shift: Pre- and Post-2015 Dynamics
One of the key findings of this study is the stronger influence of R & D, trade openness, and institutional quality after 2015. This period marked a major shift in the GCC’s energy transition, driven by national initiatives such as Saudi Vision 2030, the UAE Energy Strategy 2050, and broader commitments to the Paris Agreement and the Sustainable Development Goals.
The stronger effect observed after 2025 suggest that innovation and international integration became more effective when supported by clear policy frameworks and stronger institutions. This finding is consistent with Al-Muharrami et al. [4], who argued that supportive regulations and institutional quality are essential for translating trade and investment in renewable energy development.
Overall, the results indicate that ambitious renewable energy targets alone are not enough. Their success depends on effective institutions, consistent policy implementation, and continued investment in innovation.
5.5. Machine Learning Validation
The Random Forest model confirmed the importance of R&D expenditure and trade openness as the most influential determinants of renewable energy consumption in GCC. Although its out-of-sample predictive performance (R2 = 0.425, RMSE = 0.032, MAE = 0.026) was lower than the in-sample fit of the regression model, this is expected because machine learning models are designed to prioritize prediction and generalizability rather than maximizing in-sample fit.
The consistency between the econometric and machine learning results strengthens the robustness of the findings and increases confidence in the identified determinants. More importantly, this study demonstrates that combining traditional econometric techniques with machine learning provides a more comprehensive understanding of renewable energy drivers than relying on a single analytical approach.
5.6. Implications for Theory
This study contributes to the renewable energy literature by demonstrating that innovation, trade openness, and institutional quality are more influential than conventional macroeconomic indicators such as GDP and FDI in explaining renewable energy consumption in the GCC. The findings support the induced innovation theory by confirming the central role of R&D in promoting technological change and renewable energy adoption. They also align with the developmental state perspective, which argues that coordinated state intervention and long-term policy planning can promote structural transformation [36].
6. Conclusions, Policy Implications, and Limitations and Future Research
6.1. Conclusions
This study employed a hybrid analytical framework combining stepwise regression and Random Forest to examine the macroeconomic determinants of renewable energy consumption in the GCC countries during the period of 2000–2024.
- R&D expenditures and trade openness emerged as the two most important determinants of renewable energy consumption, explaining approximately 63% of the variation in the baseline model. This finding suggests that technological innovation plays a more prominent role than conventional macroeconomic factors in supporting the energy transition.
- The effects became significant only after 2015, coinciding with the implementation of major initiative such as Saudi Vision 2030 and the UAE Energy Strategy 2050. This highlights the importance of strong policy frameworks and institutional quality in accelerating the renewable energy transition.
- Traditional macroeconomic indicators, including GDP, FDI, and inflation, did not emerge as significant determinants. This reflects the unique structure of GCC economies, where hydrocarbon dependence weakens the relationship between economic growth and renewable energy development.
6.2. Policy Implications
The findings suggest several policy priorities for accelerating renewable energy development in GCC countries.
First, governments should increase investment in R&D, particularly in solar energy, green hydrogen, and energy storage, while strengthening human capital and financial development to enhance innovation capacity [37].
Second, trade policies should facilitate the import of renewable energy technologies and promote technology transfer. Foreign investment should be directed toward green industries rather than reinforcing dependence on fossil fuels [4].
Third, Governments should strengthen institutional and regulatory frameworks by establishing clear long-term renewable energy targets, maintaining stable regulations, and providing consistent incentives to encourage private investment. The stronger post-2015 effects observed in this study highlight the importance of policy initiatives such as Saudi Vision 2030 and UAE’s Energy Strategy 2050.
Fourth, maintaining macroeconomic stability through sound fiscal and monetary policies remains important for reducing investment uncertainty and supporting long-term renewable energy projects [35].
Finally, governments should adopt data-driven energy planning by integrating machine learning and artificial intelligence into forecasting and policy evaluation. Greater regional cooperation through knowledge sharing and joint research initiatives could further accelerate renewable energy deployment across GCC countries [38].
6.3. Limitations and Future Research
This research has several limitations that are worth mentioning. To begin with, the study concentrates on just six countries of the GCC, which makes the data less generalizable. Secondly, data availability limited the inclusion of potentially important variable. The factors include such variables as energy prices, carbon pricing, and policies on the environment. To explain further, the inability to capture the state of the policy environment is connected with the lack of information related to carbon pricing and the relevant policy indices. Thirdly, a limitation is that this research goes up to 2024, which means that results need to be updated as soon as new data are available. Finally, the analysis of the post-2015 period is based on sixty observations only, which makes conclusions related to the coefficient of R&D tentative.
In the future, it is possible that the study will concentrate on digitalization, carbon pricing, green financing, and climate policy uncertainty in the energy transition process of oil export countries. It may also include the combination of different machine learning approaches (e.g., XGBoost and Neural Networks) along with the application of deep learning technology in order to enhance the knowledge about energy flows. Moreover, researchers may also focus on the structure of energy usage in different sectors. This could enable researchers to spot more precise policy measures. In addition, to tackle the endogeneity issue between renewable energy usage and explanatory variables, it will be necessary to apply instrumental variable techniques.
Overall, the findings suggest that accelerating the renewable energy transition in the GCC requires a shift from growth-driven strategies toward innovation policies supported by strong institutions and effective governance. By integrating econometric analysis with machine learning, this study provides a more comprehensive framework for identifying the key drivers of renewable energy consumption and offers evidence that can support future energy policy across the region.
Author Contributions
Conceptualization, S.O., H.G. and I.A.; methodology, S.O. and H.G.; software, I.A. and G.Y.; validation, S.O., H.G. and M.E.; formal analysis, S.O. and I.A.; investigation, S.O., H.G. and G.Y.; resources, S.O. and M.E.; data curation, G.Y. and M.E.; writing original draft preparation, S.O., H.G. and I.A.; writing review and editing, S.O., G.Y. and M.E.; visualization, G.Y. and M.E.; supervision, S.O. and H.G.; project administration, S.O.; funding acquisition, S.O. All authors have read and agreed to the published version of the manuscript.
Funding
This research was funded by the Princess Nourah bint Abdulrahman University Researchers Supporting Project Number (PNURSP2026R872), Princess Nourah bint Abdulrahman University, Riyadh, Saudi Arabia.
Institutional Review Board Statement
Not applicable. This study did not involve humans or animals. It used only secondary, anonymized, publicly available aggregate data from international sources (World Bank, International Telecommunication Union, IMF, and Barro-Lee dataset), which does not require ethical approval.
Informed Consent Statement
This study did not involve human subjects. No primary data collection from individuals was conducted, and therefore informed consent was not required.
Data Availability Statement
The data presented in this study are publicly available from the following sources: World Bank World Development Indicators (WDI) available at https://data.worldbank.org; International Telecommunication Union (ITU) DataHub available at https://datahub.itu.int; IMF World Economic Outlook available at https://www.imf.org/en/Publications/WEO; and the Barro-Lee Educational Attainment Dataset available at http://www.barrolee.com. The authors confirm that all data used in this study can be accessed freely from these repositories. The constructed panel dataset and analysis code are available from the corresponding author upon reasonable request.
Conflicts of Interest
The authors declare no conflicts of interest.
Acknowledgments
The authors thank Princess Nourah bint Abdulrahman University for supporting this research through the Researchers Supporting Project Number (PNURSP2026R872). The authors are also grateful to the editorial team and anonymous reviewers for their constructive comments. Earlier versions of this work were presented at departmental seminars at the University of Kassala and Princess Nourah bint Abdulrahman University; the authors thank participants for their valuable feedback.
References
- Al-Sarihi, A.; Mansouri, N. Renewable Energy Development in the Gulf Cooperation Council Countries: Status, Barriers, and Policy Options. Energies 2022, 15, 1923. [Google Scholar] [CrossRef]
- Almasri, R.A.; Narayan, S. A recent review of energy efficiency and renewable energy in the Gulf Cooperation Council (GCC) region. Int. J. Green Energy 2021, 5075, 1904941. [Google Scholar] [CrossRef]
- Ahmad, Z.; et al. Determinants of energy consumption in selected ASEAN countries: New evidence from panel ARDL and wavelet coherence approaches Determinants of energy consumption in selected ASEAN countries: New evidence from panel ARDL and wavelet coherence approaches. Cogent Econ. Financ. 2026, 14, 2610560. [Google Scholar] [CrossRef]
- Yakubu, I.N.; Kapusuzoglu, A.; Ceylan, N.B. Institutional quality, trade openness, and renewable energy consumption in the GCC countries. In Decision Making in Interdisciplinary Renewable Energy Projects: Navigating Energy Investments; Springer: Cham, Switzerland, 2024; pp. 25–37. [Google Scholar]
- Yousef, R.F.M. Macroeconomic Determinants of Renewable Energy Deployment: The Role of Inflation, Fiscal Policy, and Economic Volatility in MENA Countries (2000–2023). Energies 2026, 14, 50. [Google Scholar] [CrossRef]
- Faltsman, V. Issues of Balancing Economic Growth and the State of the Environment. Econ. Math. Methods 2023, 59, 112–121. [Google Scholar] [CrossRef]
- Ditta; Hashmi, M.S.; Anis, A.; Maqbool, M.S. The Impact of Labor, Capital, Energy and Income Growth Environmental Degradation in Selected Developed Countries. Pak. J. Humanit. Soc. Sci. 2023, 11, 440–449. [Google Scholar] [CrossRef]
- Dogru, T.; Bulut, U.; Koçak, E.; Işık, C.; Suess, C.; Sirakaya-Turk, E. The nexus between tourism, economic growth, renewable energy consumption, and carbon dioxide emissions: Contemporary evidence from OECD countries. Environ. Sci. Pollut. Res. 2020, 27, 40930–40948. [Google Scholar] [CrossRef] [PubMed]
- Muchran, M.; Idrus, A.; Badruddin, S.; Tenreng, M.; Kanto, M. INFLUENCE OF THE RENEWABLE AND NON-RENEWABLE ENERGY CONSUMPTIONS AND REAL-INCOME ON ENVIRONMENTAL DEGRADATION IN INDONESIA. Int. J. Energy Econ. Policy 2020, 11, 599–606. [Google Scholar] [CrossRef]
- Ibrahim, R.; Al-mulali, U.; Solarin, S.A.; Ajide, K.B.; Al-Faryan, M.A.S.; Mohammed, A.S. Probing environmental sustainability pathways in G7 economies: The role of energy transition, technological innovation, and demographic mobility. Environ. Sci. Pollut. Res. Int. 2023, 30, 75694–75719. [Google Scholar] [CrossRef] [PubMed]
- Qian, X.; Zhu, J. Decoding the Paradoxical Drivers of Renewable Energy Transition in Arab Countries. Sustainability 2026, 18, 2035. [Google Scholar] [CrossRef]
- Bulatova; Zakharova, O.; Vyshniakov, O. THE MAIN FORCES DRIVING THE SPREAD OF HUMANITARIAN CRISES IN THE MODERN GLOBAL ECONOMY. In Proceedings of the Annual International Scientific Conference “Competitiveness and Innovation in the Knowledge Economy”, Chisinau, Republic of Moldova, 26–27 September 2025; Available online: https://api.semanticscholar.org/CorpusID:288160076.
- Alam, M.S.; Adebayo, T.S.; Said, R.R.; Alam, N.; Magazzino, C.; Khan, U. Asymmetric impacts of natural gas consumption on renewable energy and economic growth in Kingdom of Saudi Arabia and the United Arab Emirates. Energy Environ. 2022, 35, 1359–1373. [Google Scholar] [CrossRef]
- Belaîd, F.; Sarihi, A.A. Saudi Arabia’s Energy Transition in a Post-Paris Agreement Era: An Analysis with a Multi-level Perspective Approach. Res. Int. Bus. Financ. 2023, 67, 102086. [Google Scholar] [CrossRef]
- Yakubu, N.; Kapusuzoglu, A.; Ceylan, N.B. Navigating the Energy Transition: How R&D Investment and Governance Quality Drive Clean Energy in the MENA Region. In Decision Making in Interdisciplinary Renewable Energy Projects: Navigating Energy Investments; Dinçer, H., Yüksel, S., Deveci, M., Eds.; Springer Nature: Cham, Switzerland, 2024; pp. 159–171. [Google Scholar] [CrossRef]
- Transitions, E.; Times, I.N.; Disruption, O.F. OECD Science, Technology and Innovation Outlook 2023; OECD: Paris, France, 2023. [Google Scholar]
- Li, W.; Qiao, Y.; Li, X.; Wang, Y. Energy consumption, pollution haven hypothesis, and environmental Kuznets curve: Examining the environment–economy link in belt and road initiative countries. Energy 2021, 239, 122559. [Google Scholar]
- Lin, H.; Wang, X.; Bao, G.; Xiao, H. Heterogeneous Spatial Effects of FDI on CO2 Emissions in China. Earth’s Futur. 2022, 10, e2021EF002331. [Google Scholar] [CrossRef]
- Ekwueme, D.C. Pathway to Oman’s environmental sustainability: Does trade openness and foreign direct investment matter? Arab Gulf J. Sci. Res. 2026, 44, 35–48. [Google Scholar] [CrossRef]
- Pasqualino, R.; et al. Modelling induced innovation for the low-carbon energy transition: A menu of options. Environ. Res. Lett. 2024, 19, 73004. [Google Scholar] [CrossRef]
- Bindi, G. Technological Innovation and the Environment: An Analysis Based on Patent Counts. 2019. Available online: https://api.semanticscholar.org/CorpusID:208332842.
- Derouez, F.M. Technological Advancements and Economic Growth as Key Drivers of Renewable Energy Production in Saudi Arabia: An ARDL and VECM Analysis. Energies 2025, 18, 2177. [Google Scholar] [CrossRef]
- Alzahrani, F. Building A Sustainable Green Economy in Saudi Arabia: Green Energy and Workforce Development, 2026.
- Jaboob, M. Financing green energy transition for sustainable environment in GCC countries: The pathway for attaining SDGs 7 and 13. Int. J. Energy Sect. Manag. 2026, 20, 691–712. [Google Scholar] [CrossRef]
- Sharaf, M.F.; Shahen, A.M. Rethinking Growth in the Gulf: The Role of Renewable Energy, Electricity Use, and Economic Openness in Oil-Rich Economies. Sustainability 2025, 17, 8949. [Google Scholar] [CrossRef]
- Asna, M.; Deb, S. Re-Envisioning Electric Vehicle Charging Infrastructure and Sustainable Energy Transitions in the Gulf Cooperation Council Countries. Energies 2026, 19, 1367. [Google Scholar] [CrossRef]
- Chaabouni; Abid, I. Key drivers of energy consumption in the gulf cooperation council countries: A panel analysis. Eng. Technol. Appl. Sci. Res. 2025, 15, 21627–21632. [Google Scholar] [CrossRef]
- Le Gallo, M.-A.; Sénégas. On the proper computation of the Hausman test statistic in standard linear panel data models: Some clarifications and new results. Econometrics 2023, 11, 25. [Google Scholar] [CrossRef]
- Hamza, R.K.; Husain, W.J. Robust Methods for Detecting and Correcting Autocorrelation in Financial Time Series Modeling. Int. J. Adv. Sci. Eng. Inf. Technol. 2025, 15, 1623–1628. [Google Scholar] [CrossRef]
- Scornet, E.; Hooker, G. Theory of random forests. Annu. Rev. Stat. Its Appl. 2026, 13, 99–121. [Google Scholar] [CrossRef]
- Alharbi, T.; Iqbal, S. Towards a Greener Future: Machine Learning Applications in Solar Irradiance Forecasting for Renewable Energy Planning in Saudi Arabia. J. Eng. Comput. Sci. 2023, 15, 39–57. [Google Scholar]
- Haupt, S.E.; et al. Combining artificial intelligence with physics-based methods for probabilistic renewable energy forecasting. Energies 2020, 13, 1979. [Google Scholar] [CrossRef]
- Yessengeldina; Taizhanova, Z.; Kuttybayeva, N.; Iskakova, D.; Khalbayev, Y. Government Project Offices and the Effectiveness of Government Programs: An Empirical Analysis Based on Panel Data. Economies 2026, 14, 267. [Google Scholar] [CrossRef]
- Alghamdi, N.; James, P.; Bahaj, A. Vision and reality: An assessment of Saudi Arabia’s in-country capacity to deliver on its solar ambitions. Sustainability 2025, 17, 5721. [Google Scholar] [CrossRef]
- Ben-Salha, O.; Louail, B.; Riache, S.; Soltani, H.; Choukaier, D. Asymmetric environmental effects of policy uncertainty in the GCC: Evidence from MMQR, bootstrap and Bayesian quantile regressions. Int. J. Islam. Middle East. Financ. Manag. 2026. [Google Scholar] [CrossRef]
- Impact of Industrial Policy on the Growth of Micro, Small And Medium Enterprises in Uttar Pradesh. Int. J. Res. Eng. Appl. Manag. 2020, 6, 307–312. [CrossRef]
- AL-Ghamdi, A.; Alhazmi, Y.A. Optimal emission plan for independent power producers using generation mix to meet Saudi Arabia environmental goals. Period. Eng. Nat. Sci. 2024, 12, 146–168. [Google Scholar] [CrossRef]
- Abo-Khalil, G. Towards Sustainable AI-Driven Renewable Energy Systems through Integration of Forecasting, Grid Economics and Lifecycle Assessment. Renew. Sustain. Energy Technol. 2026, 2, 8. [Google Scholar] [CrossRef]
Figure 1.
Trend of renewable energy consumption in GCC countries (2000–2024).
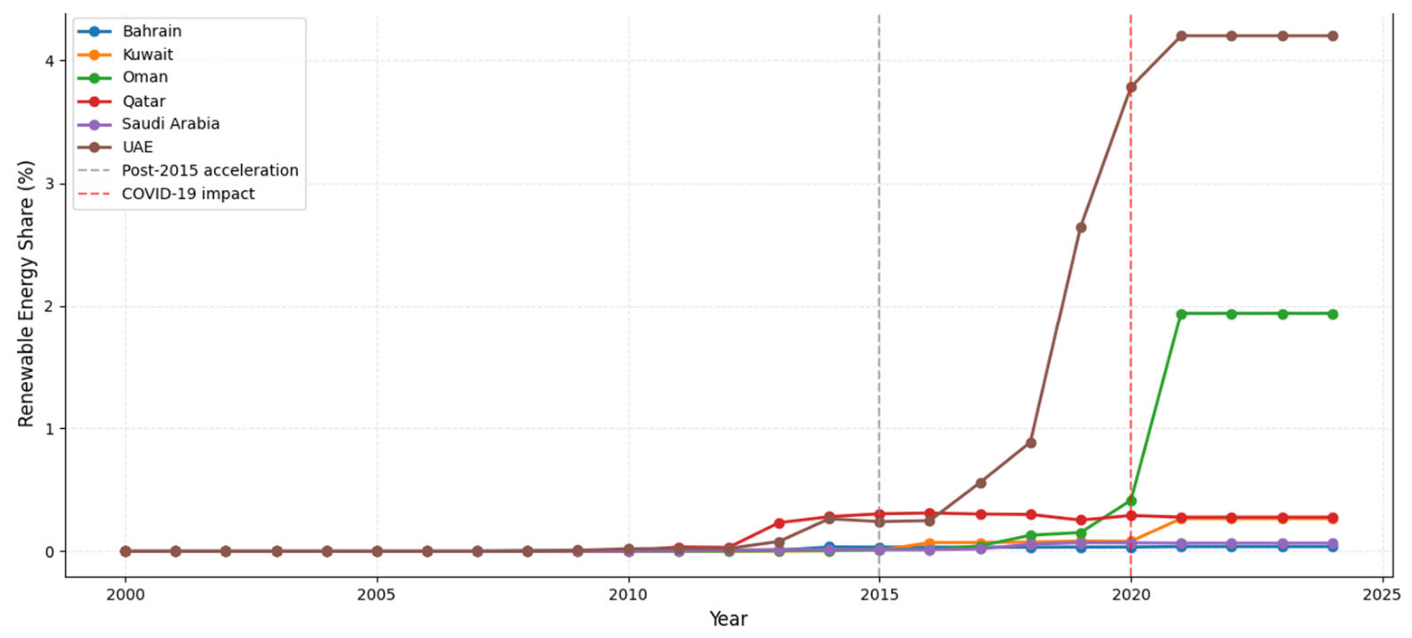
Figure 2.
GCC renewable energy project awards by country (2017–2021).
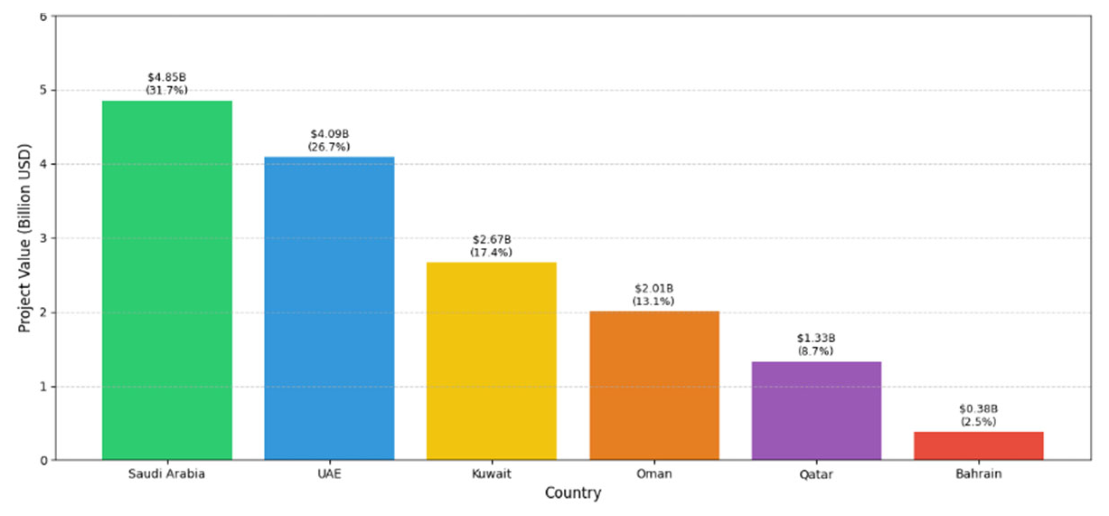
Figure 4.
R&D expenditure vs. renewable energy.
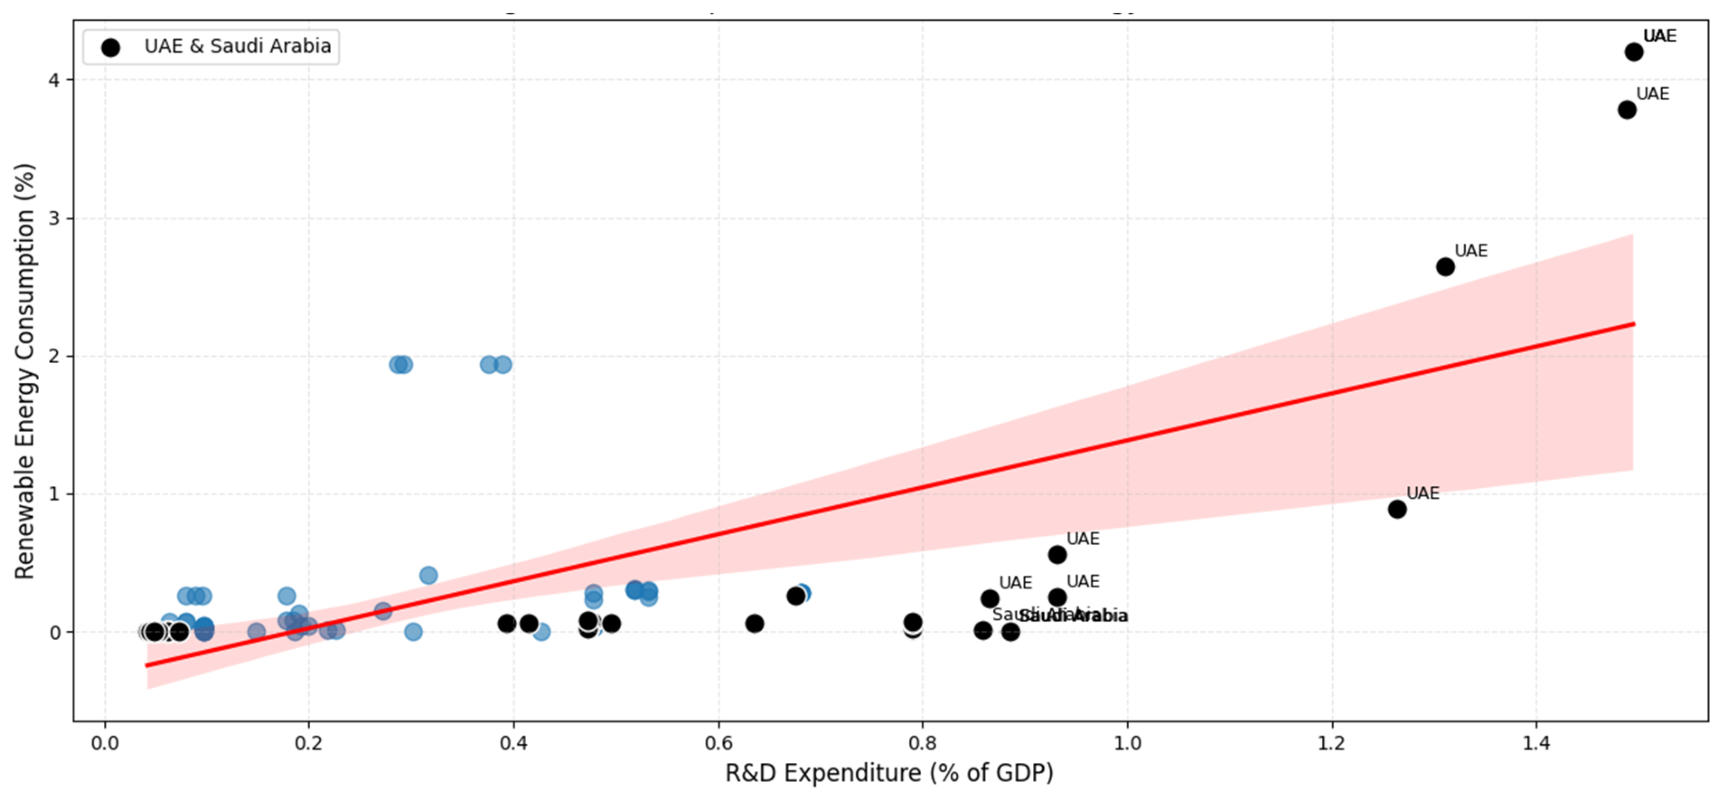
Figure 5.
Trade openness vs. renewable energy.
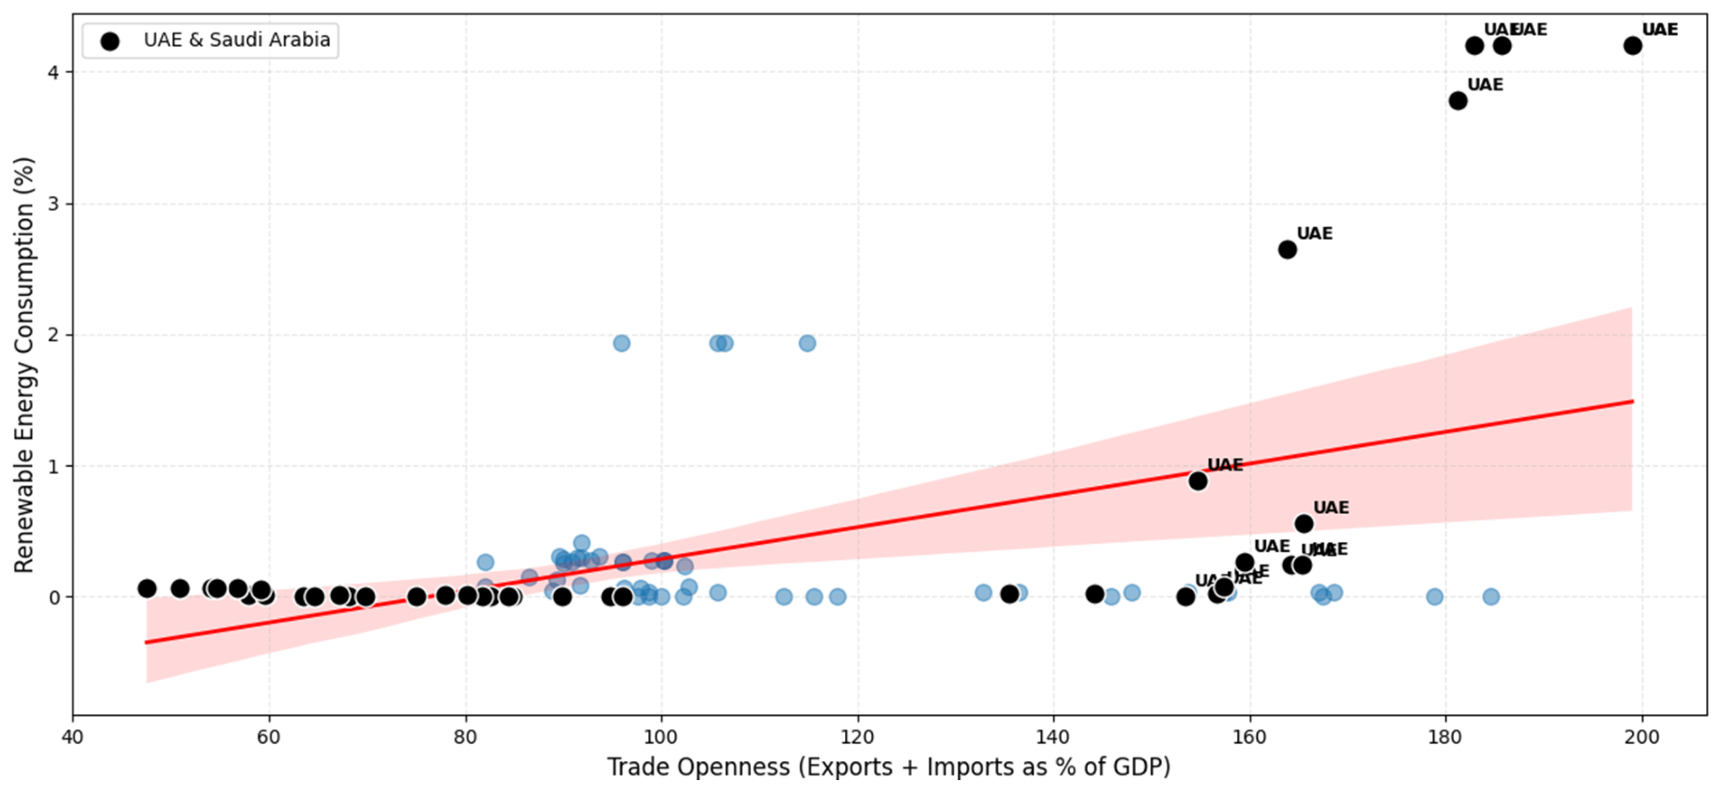
Figure 6.
Distribution of renewable energy by country.
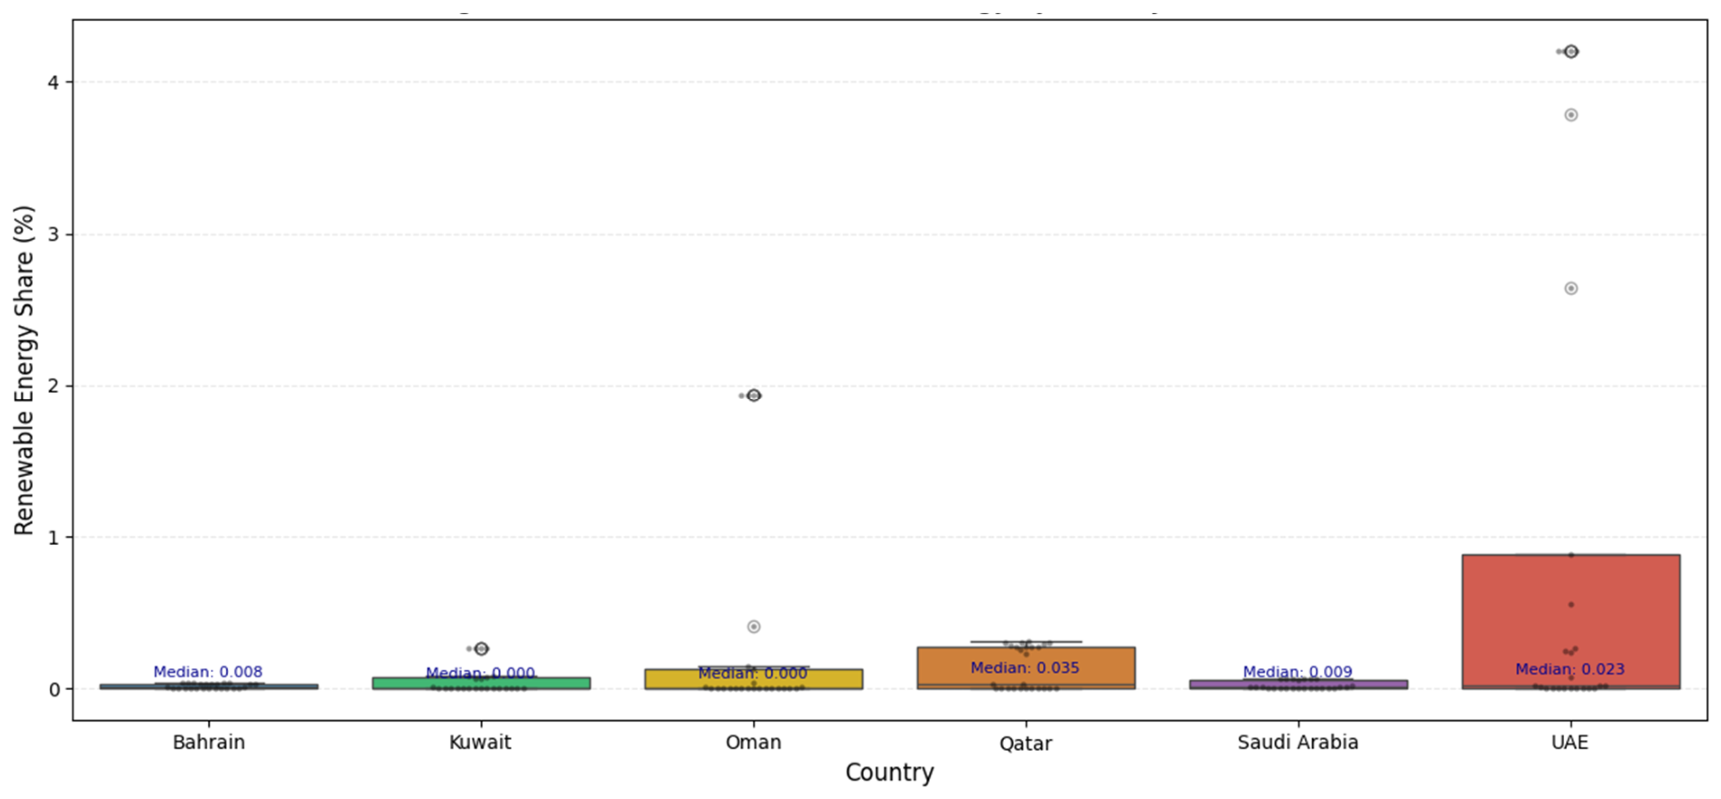
Figure 7.
Renewable energy share evolution by country (2000–2024).
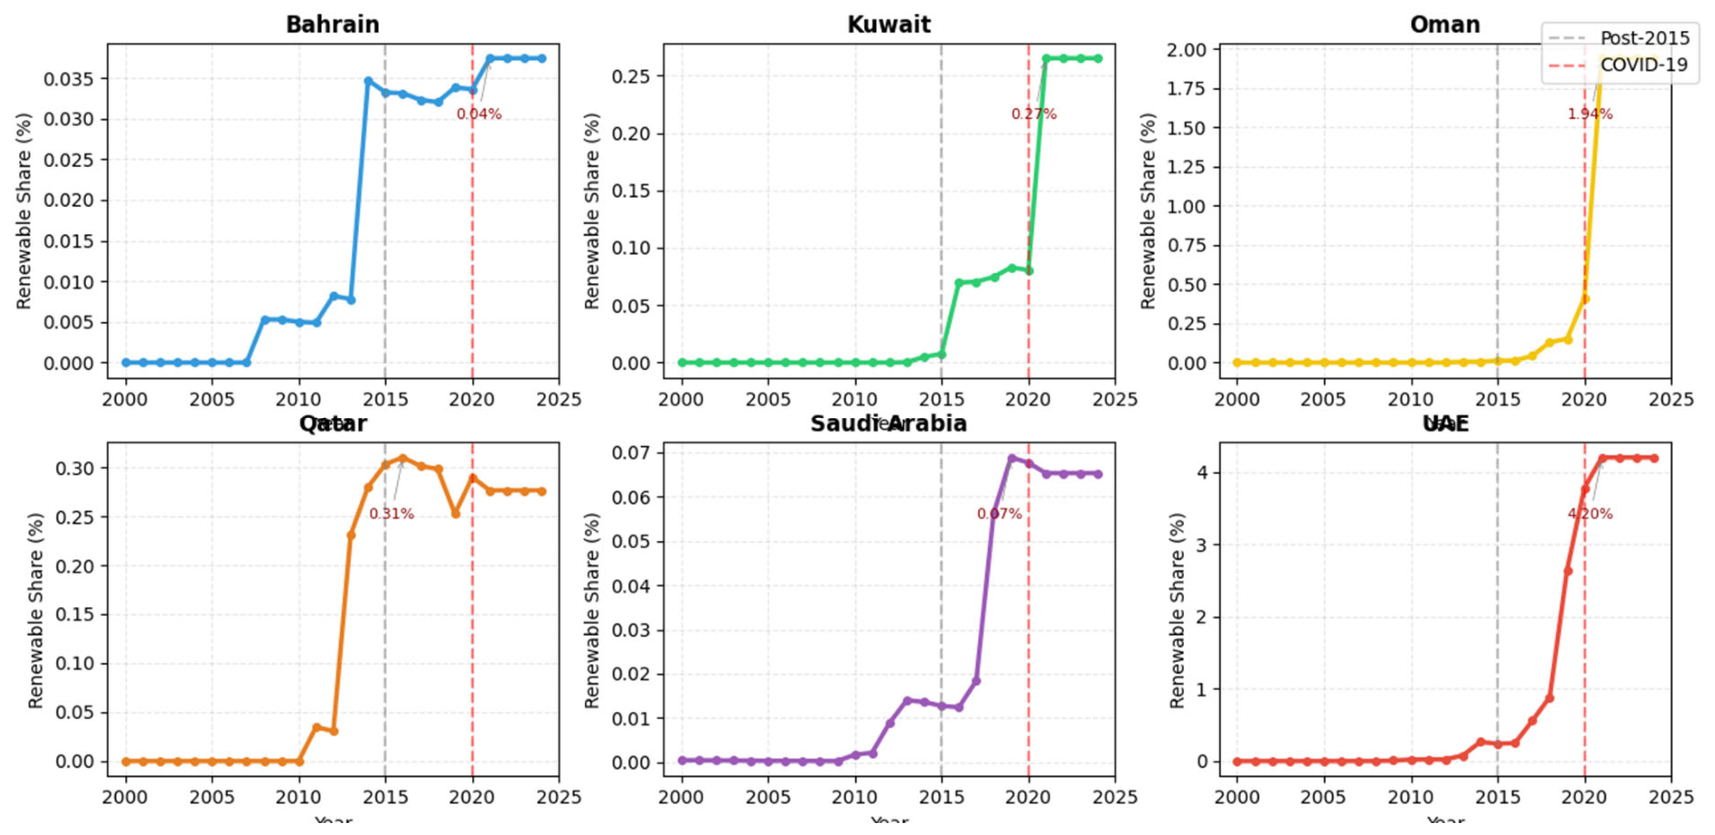
Table 1.
Renewable energy targets and policy frameworks in GCC countries.
| Country | Renewable Energy Targets | Key Policy Framework |
|---|---|---|
| Saudi Arabia | 27.3 GW by 2024; 58.7 GW by 2030 | Saudi Vision 2030 |
| UAE | 44% clean energy power capacity by 2050 | UAE Energy Strategy 2050 |
| Qatar | 20% by 2030 | Qatar National Vision 2030 |
| Kuwait | 15% by 2030 | Kuwait Vision 2035 |
| Oman | 16% of electricity generation by 2025 | Oman Vision 2040 |
| Bahrain | 5% by 2030 | Bahrain Vision 2030 |
Source: Adapted from [1].
Table 3.
Descriptive statistics.
| Variable | Mean | SD | Min | Max |
|---|---|---|---|---|
| Renewable (%) | 0.071 | 0.186 | 0 | 1 |
| GDP (current USD) | 2.18 × 10¹¹ | 2.58 × 10¹¹ | 8.98 × 10⁹ | 1.24 × 10¹² |
| FDI (% of GDP) | 2.466 | 3.1 | −2.76 | 15.751 |
| Trade (% of GDP) | 107.33 | 133.48 | 47.533 | 199.045 |
| Inflation (%) | 2.879 | 3.685 | −4.863 | 15.05 |
| R&D (% of GDP) | 0.366 | 0.34 | 0.042 | 1.495 |
| Institutional Quality | 0.452 | 0.312 | −0.214 | 0.891 |
Table 4.
Correlation matrix.
| Renewable | GDP | FDI | Trade | Inflation | R&D | Inst. Quality | |
|---|---|---|---|---|---|---|---|
| Renewable | 1 | 0.251 | 0.231 | 0.489 | −0.037 | 0.734 | 0.412 |
| GDP | 0.251 | 1 | −0.146 | 0.831 | −0.016 | 0.541 | 0.623 |
| FDI | 0.231 | −0.146 | 1 | 0.468 | 0.084 | 0.064 | 0.189 |
| Trade | 0.489 | 0.831 | 0.468 | 1 | −0.031 | 0.26 | 0.445 |
| Inflation | −0.037 | −0.016 | 0.084 | −0.031 | 1 | 0.021 | −0.089 |
| R&D | 0.734 | 0.541 | 0.064 | 0.26 | 0.021 | 1 | 0.578 |
| Inst. Quality | 0.412 | 0.623 | 0.189 | 0.445 | −0.089 | 0.578 | 1 |
Table 5.
Stepwise regression results.
| Variable | Coefficient | Std. Error | t-Statistic | p-Value |
|---|---|---|---|---|
| Intercept | −0.2494 | 0.0311 | −8.003 | <0.001 *** |
| Trade Openness | 0.0018 | 0.0003 | 6.191 | <0.001 *** |
| R&D Expenditure | 0.3547 | 0.0282 | 12.595 | <0.001 *** |
Observations:150, R2: 0.6341, Adjusted R2: 0.6291, F-statistic: 127.39 (p < 0.001), and Note: *** p < 0.001.
Table 6.
Panel data model results (FE and RE).
| FE | RE | |
|---|---|---|
| Trade Openness | 0.0024 (0.0006) *** | 0.0022 (0.0005) *** |
| R&D Expenditure | 0.3706 (0.0416) *** | 0.3701 (0.0375) *** |
| Institutional Quality | 0.0189 (0.0112) * | 0.0201 (0.0108) * |
| R2 | 0.535 | 0.557 |
| Adjusted R2 | 0.509 | 0.542 |
| Observations | 150 | 150 |
| Number of Countries | 6 | 6 |
| Hausman Test | χ2 = 1.45, p = 0.563 |
Note: Standard errors in parentheses. *** p < 0.001, * p < 0.10. FE = Fixed Effects, RE = Random Effects.
Table 7.
Sub-period analysis (Fixed Effects models).
| 2000–2014 | 2015–2024 | |
|---|---|---|
| Trade Openness | −0.0001 (0.0002) | 0.0034 (0.0020) * |
| R&D Expenditure | 0.0008 (0.0140) | 0.7141 (0.1416) *** |
| Institutional Quality | −0.0123 (0.0156) | 0.0421 (0.0189) ** |
| R2 | 0.012 | 0.532 |
| Adjusted R2 | −0.067 | 0.461 |
| Observations | 90 | 60 |
Note: Standard errors in parentheses. *** p < 0.001, ** p < 0.05, * p < 0.10.
Table 8.
Random Forest model performance.
| Metric | Value |
|---|---|
| RMSE (Test Set) | 0.0321 |
| R2 (Test Set) | 0.4247 |
| MAE (Test Set) | 0.0258 |
Disclaimer/Publisher’s Note: The statements, opinions and data contained in all publications are solely those of the individual author(s) and contributor(s) and not of MDPI and/or the editor(s). MDPI and/or the editor(s) disclaim responsibility for any injury to people or property resulting from any ideas, methods, instructions or products referred to in the content. |
© 2026 by the authors. Licensee MDPI, Basel, Switzerland. This article is an open access article distributed under the terms and conditions of the Creative Commons Attribution (CC BY) license (http://creativecommons.org/licenses/by/4.0/).
Copyright: This open access article is published under a Creative Commons CC BY 4.0 license, which permit the free download, distribution, and reuse, provided that the author and preprint are cited in any reuse.


