

Submitted:
31 July 2026
Posted:
03 August 2026
You are already at the latest version
Abstract
Land subsidence amplifies the impacts of sea-level rise (SLR) in low-lying deltas, yet most Coastal Vulnerability Index (CVI) assessments omit it or rely on global estimates, drastically understating deltaic vulnerability. This study presents the first CVI assessment along Ghana’s coast to integrate validated, spatially resolved land subsidence derived from Persistent Scatterer Interferometric Synthetic Aperture Radar (PS-InSAR). Nine geological, geomorphological, hydrodynamics and anthropogenic variables were quantified across 72 contiguous grid cells spanning ~150 km of the Volta Delta coastline and ranked on a 1–5 vulnerability scale. Two composite indices were computed using an unweighted square root of product mean formulation, one incorporating subsidence (CVI(+sub)) and one excluding it (CVI(-sub)), classified against a common quantile distribution for direct comparability. By incorporating measured subsidence, ranging from -2.44 to -4.23 mm/yr (grid cell means), 75% of grid cells indicated High to Very High vulnerability under CVI(+sub), compared with 28% under CVI(-sub); a Wilcoxon signed-rank test confirmed the increase as significant (p < .001). Vulnerability peaked along the Keta and Songor lagoonal margins. Omitting measured subsidence understates deltaic vulnerability, and this approach offers a transferable method for data-sparse deltas.
Keywords:
Coastal Vulnerability Index (CVI)
; land subsidence
; InSAR
; coastal hazards
; sea-level rise
; Volta Delta
; Ghana
1. Introduction
Coastal zones support over two-thirds of the global population [1,2] and contribute largely to national economic output through fisheries, tourism and maritime trade [3]. However, these environments are also among the most exposed to the growing impacts of climate change. Multi-hazards such as coastal erosion, saltwater intrusion, periodic inundation, sea-level rise (SLR) and storm surges are increasing in frequency and intensity, and projections indicate continued acceleration throughout the 21st century [4]. In low-lying deltaic coastal environments, these multi-hazards are amplified by land subsidence, the downward displacement of the ground surface, which exacerbates the rate of relative SLR experienced at the coast beyond what eustatic global estimates alone would suggest [5,6,7,8,9].
SLR results primarily from the thermal expansion of ocean water and the accelerating loss of ice from glaciers and ice sheets [10]. Since the pre-industrial period, global mean sea level has risen by approximately 0.20 m, with current rates near 3.6 mm/yr and projections exceeding 1 m by the end of the century (2100) under high-emissions scenarios [4]. In coastal areas, SLR accelerates saltwater intrusion into freshwater aquifers [11], leads to permanent inundation of low-lying terrain [12], intensifies storm surge impacts [4], and disrupts healthy coastal ecosystem functions that provide natural protection, including mangroves, wetlands and beaches [13,14]. In the Global South, where most countries have environment-dependent economies, most low-lying coastal deltas are severely impacted due to limited adaptive capacity [15]. The West African sub-region is no exception to this global phenomenon. The West African coast, which already has a low-elevation coastal zone [3,16], experiences storm surges with high winds and intense wave action that cause coastal erosion [17]. With increasing global temperatures [4], coastal multi-hazards are projected to intensify. Climate projections predict that the West African coastal region may experience more frequent coastal hazards by 2100 [18,19,20]. Some of these coastal hazards have become prevalent in recent years.
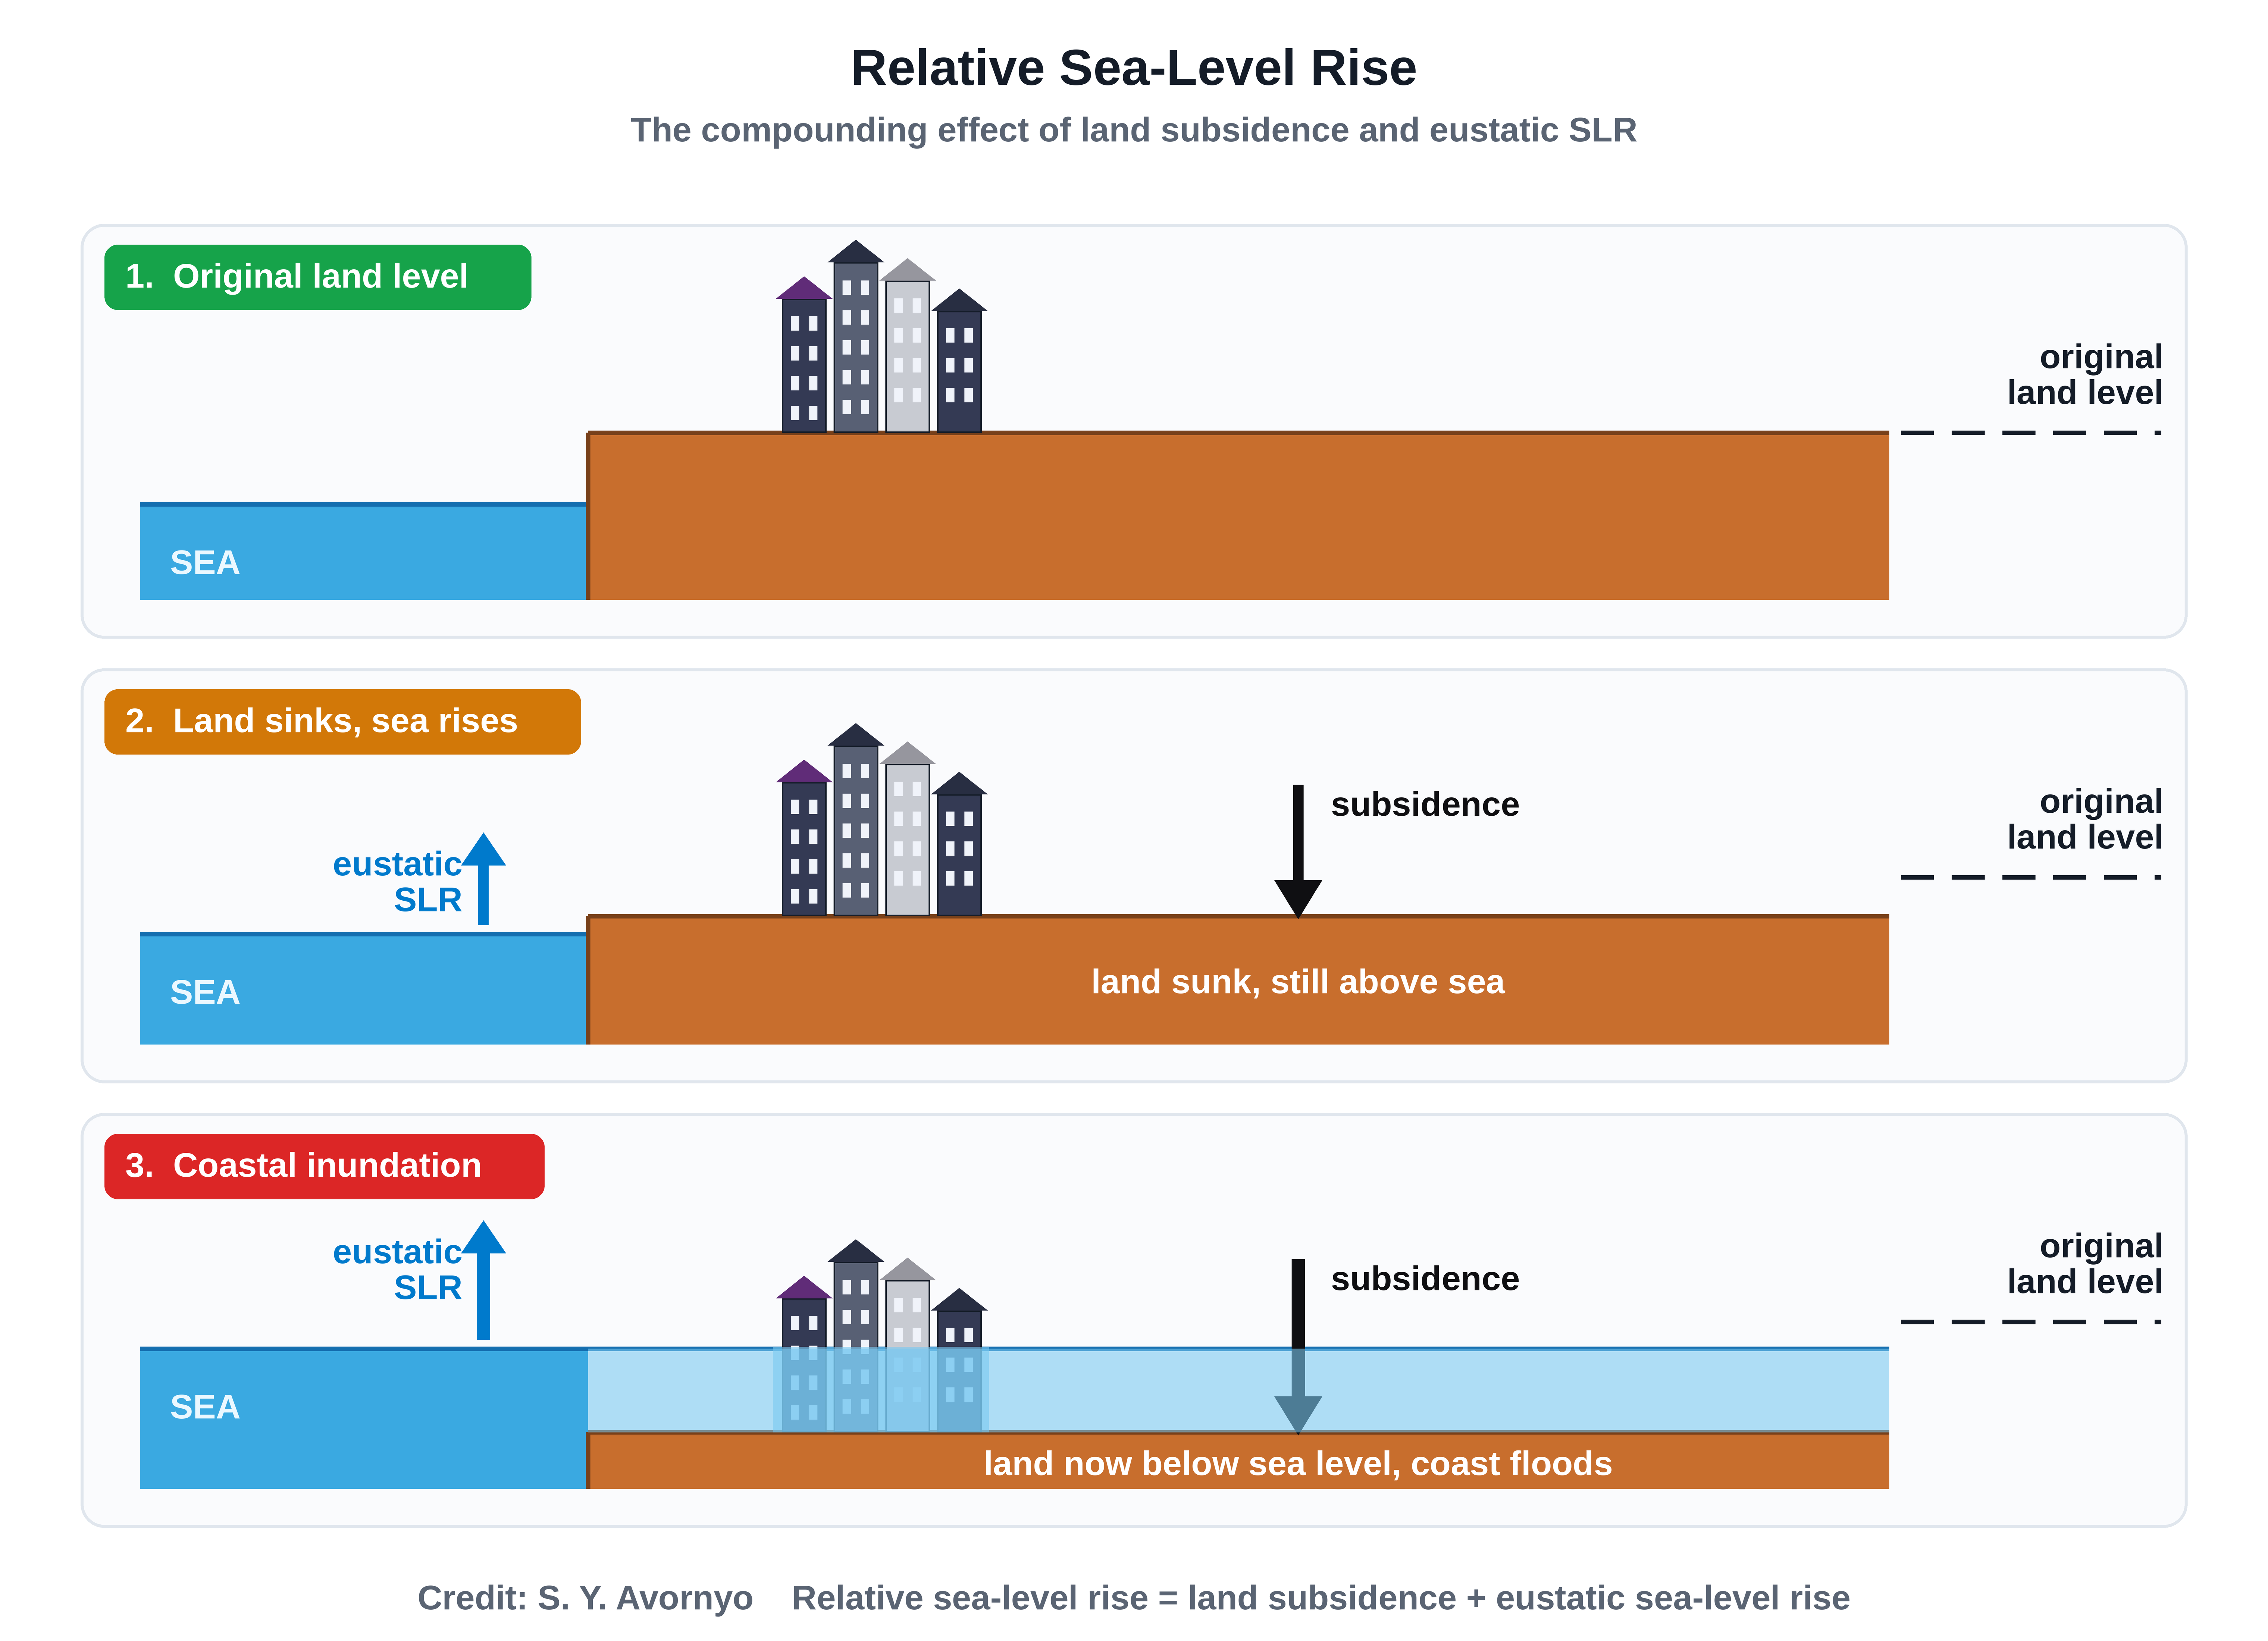
Despite its exacerbating effect, land subsidence receives inadequate attention in coastal vulnerability research, particularly in West Africa [15,21]. Land subsidence is driven by both natural and human-induced factors. However, land subsidence is driven more prominently by human-induced factors such as sediment compaction [22], groundwater or hydrocarbon extraction [6,23], sediment starvation through damming and coastal infrastructure [8], local and basin tectonics [24], isostasy [25], natural oxidation and land drainage [26], amongst others. In most deltaic environments, natural compaction of unconsolidated alluvial deposits is compounded by human activities, producing subsidence rates that far exceed local SLR rates [7,8,26]. Subsidence directly amplifies the local rate of relative SLR, a combination of land subsidence and offshore (eustatic) SLR. Hypothetically, a coast experiencing 5 mm/yr of eustatic SLR and 8 mm/yr of subsidence is effectively experiencing a relative SLR of 13 mm/yr, well above what global tide gauge or satellite altimetry records alone would indicate. Also, the local rates of relative SLR can vary spatio-temporally. Stouthamer and Asselen [27] note that the spatio-temporal variability in subsidence corresponds to the natural and human-induced drivers of land deformation, which often manifest at localised scales that are not captured by global estimates.
Understanding the difference between relative and eustatic SLR is critical for accurate coastal vulnerability assessment. The concept of vulnerability is generally expressed in terms of the exposure, sensitivity and adaptive capacity of a system to climate-related multi-hazards [28]. Among the methodologies employed for evaluating coastal risk, index-based techniques such as the Coastal Vulnerability Index (CVI) have been widely applied due to their simplicity, transparency and ability to integrate multiple geological and physical process variables into a simple composite measure (e.g. Appeaning Addo [17]; Boateng et al. [29]; Theocharidis et al. [30]). Particularly in the case of Ghana’s Volta Delta, which is challenged by data sparsity, the CVI approach fits its data constraints. Other approaches include indicator-based methods [31], Geographic Information Systems (GIS)-based decision support systems [32], and dynamic computer models [33].
Due to the large number of parameters that coastal vulnerability assessment entails and their potential interactions, the evaluation is typically approximated and simplified [34]. However, most CVI frameworks either omit subsidence entirely, use spatially uniform rates from distant tidal gauges, or use assumed global averages, typically between -1 and -2 mm/yr (e.g. Appeaning Addo, [17]; Boateng et al., [29]), instead of locally measured and spatially resolved rates. In deltaic settings with higher localised subsidence, this approach systematically underestimates actual vulnerability. Interferometric Synthetic Aperture Radar (InSAR), a satellite-based technique, offers a practical solution. InSAR measures ground deformation to the millimetre scale, across varying spatio-temporal scales at relatively low cost, with validated accuracy in deltaic and coastal settings globally [35,36]. Despite the advantages, InSAR-derived subsidence data remain largely absent from CVI frameworks applied along the West African coast.
Previous CVI assessments along Ghana’s coast, such as Boateng et al. [29] at the district scale for the entire coast and Appeaning Addo [17] at a sub-regional scale (Accra), have established useful baseline profiles. However, both studies did not use spatially resolved measured data. In a delta where sediment compaction, salt mining, wetland drainage and groundwater extraction may drive locally variable subsidence, using unresolved spatial data introduces unquantified errors that may alter vulnerability classifications. Boateng et al. [29] approximation of land subsidence from a single tide gauge to represent the entire coast, including the Volta Delta, despite being located over 300 km east of the tide gauge, introduces unquantified bias in vulnerability classification. As a knowledge gap identified by Avornyo et al. [15], no spatially resolved InSAR-derived subsidence measurements have been integrated into any CVI assessment for the Volta Delta or for any other part of Ghana’s coastline. Additionally, the contribution of land subsidence to the Delta’s overall coastal vulnerability profile, relative to geophysical and oceanographic variables, remains unquantified.
This study, therefore, seeks to assess the vulnerability of the Volta Delta’s coastline using geological, geomorphological, hydrodynamics and anthropogenic variables, and to identify coastal hotspots that are highly vulnerable to the impending threats of climate change. Specifically, it addresses these gaps through four objectives: (i) to quantify and rank nine geological, geomorphological, hydrodynamics and anthropogenic variables across the Volta Delta coastline using a standardised 1 to 5 vulnerability classification scheme; (ii) to compute and compare two CVIs, one incorporating InSAR-derived subsidence (CVI(+sub)) and one excluding it (CVI(-sub)); (iii) to assess the contribution of measured land subsidence to the overall coastal vulnerability classification; and (iv) to identify spatial hotspots of High and Very High coastal vulnerability. It is hypothesised that the inclusion of measured subsidence rates will significantly increase the vulnerability classification of the Volta Delta.
2. Materials and Methods
2.1. Study Area
The Volta Delta is located in southeastern Ghana, along the Gulf of Guinea. The Delta’s coastline stretches approximately 150 km along the coast of the Bight of Benin, extending from the Ghana-Togo border in the east to Ningo-Prampram to the west. The inland extents are delineated by the 5 m elevation contour within the Accra-Ho-Keta Plains (Figure 1), covering an area of about 2000 km2, which is administratively made up of ten (10) districts [5]. The Delta is predominantly characterised by low-lying topography, a sandy barrier shoreline and two extensive lagoonal systems: the Keta Lagoon to the east and the Songor Lagoon to the west. The Delta’s coast is bounded by a narrow shelf, varying between 15 and 33 km wide and is characterised by a relatively uniform, moderately steep shoreface with a gradient ranging between 1:120 and 1:150 down to 15 m, which is considered to be the close-out depth for significant wave-induced sediment movement along its coast [37].
Geologically, the Delta is located within the Keta Basin and includes late quaternary rocks as well as loose sediments made up of clay, sand, and gravel deposits [15,38]. Acid and basic gneisses and schists of the Dahomeyan system underlie the Basin and outcrop on its northern margins [39]. Large portions of the coastal fringe sit below 2 m above mean sea level, making them susceptible to inundation from the sea, the lagoon and other inland water bodies [40], along with other multi-hazards such as erosion and saltwater intrusion into freshwater aquifers. Over time, there have been significant sea defence initiatives, such as the Keta Sea Defence Project, the Dzita-Atorkor Sea Defence, the Ada Sea Defence, the Ningo-Prampram Sea Defence, and, more recently, the makeshift Blekusu-Agavedzi Sea Defence, in response to the destruction caused by coastal erosion along this coast. Even though these initiatives have stabilised the local shoreline, erosion continues, especially at the downdrift of these structures [38]. There is also evidence of land subsidence rates exceeding 8 mm/yr and exacerbating the recurrence of prevalent multi-hazard events [5].
The Delta supports livelihoods that include artisanal fisheries, subsistence and commercial agriculture, salt mining and aquaculture [41]. These activities are concentrated along the coastal fringe and lagoonal margins, hence directly exposing them to multi-hazard events such as erosion, flooding and saltwater intrusion. The Volta Delta is both a scientifically important site for studying low-lying deltaic vulnerability in the Global South and a policy-relevant priority for Ghana’s national coastal adaptation planning.
2.2. Methodological Framework
The methodology follows six (6) sequential stages. Stage one covers the acquisition and processing of all variable data from validated secondary sources. Stage two covers the segmentation of the approximately 150 km Volta Delta into 72 contiguous grid cells at 2 km intervals. Stage three covers the quantification of each variable within each cell and the ranking of each variable on a 1 to 5 vulnerability scale. Stage four involves the computation of two composite CVIs: one incorporating InSAR-derived subsidence (CVI(+sub)) and one excluding it (CVI(-sub)). Stage five covers the classification of CVI values into percentile vulnerability categories and the creation of grid cell vulnerability maps for both CVI(+sub) and CVI(-sub). Stage six covers the identification of spatial hotspots and statistical analysis. A methodological workflow is provided in Figure 2.
2.3. Data Acquisition and Sources
The initial step in computing CVI is to identify the variables that influence vulnerability. Most of the selected variables were identified by Appeaning Addo et al. [41] as the drivers potentially influencing the vulnerability of Volta Delta’s coast. To evaluate the influence of land subsidence on coastal vulnerability, the CVI was computed under two scenarios following Husnayaen et al. [42]. In the first scenario, CVI was calculated using eight standard variables: shoreline change, geology, coastal slope, geomorphology, mean tidal range, sea level rise, land cover, and significant wave height. In the second scenario, subsidence was incorporated as an additional variable, increasing the total number of variables to nine (9). This dual-scenario approach enables a direct assessment of the extent to which subsidence alters coastal vulnerability patterns across the Volta Delta. All variables were ranked on a standardised scale prior to inclusion in the index to ensure comparability. Subsidence was treated as an independent parameter to capture its localised contribution to relative sea-level change, which may not be fully represented by regionally uniform sea-level rise estimates. The list of variables and their attributes is summarised in Table 1.
Coastal elevation, though included in some CVI formulations [43,44], was excluded from the vulnerability assessment for two reasons. First, the Volta Delta’s uniformly low-lying terrain (the majority of the coastal fringes lie below 2m above mean sea level [40]) results in all grid cells being ranked as Very High for elevation, hence failing to offer spatial variations. Second, in a subsiding delta, elevation and land subsidence are interrelated, with subsidence driving long-term elevation loss. Including both in the same index would create redundancy and obscure the effects of subsidence on coastal vulnerability, which is the study’s primary focus.

Table 1.
List of geological, geomorphological, hydrodynamics and anthropogenic variables used for the CVI computation, and their respective sources, resolution and period.
Table 1.
List of geological, geomorphological, hydrodynamics and anthropogenic variables used for the CVI computation, and their respective sources, resolution and period.
| Parameters | Data Source | Resolution | Period |
|---|---|---|---|
| Subsidence | GNSS-validated InSAR-derived Land Subsidence [5] | ~20 m | 2016 – 2020 |
| Sea Level Rise | NASA’s IPCC Regional Sea Level Tool with data sourced from IPCC’s Sixth Assessment Report (AR6), Working Group I [45,46,47]. | 1° x 1° | 2020 |
| Shoreline Change | Planet Satellite Imagery (https://www.planet.com/) and 2005 Orthophoto (Geological Survey Authority (GSA)). | Planet = 4 m Orthophoto = 0.5 m |
2005 – 2020 |
| Coastal Slope | Global Coastal Characteristics Dataset [48,49] | 1 km | 2012 – 2023 |
| Geology | GSA and BGR [50]. | 1:1,000,000 | 2009 |
| Geomorphology | Planet Satellite Imagery, 2005 Orthophoto (Geological Survey Dept.) and LULC maps [41] | Planet = 4 m Orthophoto = 0.5 m |
2005 – 2020 |
| Significant Wave Height | Global Atmospheric Reanalysis Interim data. Sources: ECMWF (https://apps.ecmwf.int/datasets/data/interim-full-daily/levtype=sfc/ ) and Giardino et al. [51]. | 0.75° | 2018 |
| Mean Tidal Range | Tidal gauge data from GPHA (Tema) and the MPS Terminal 3. | ― | 2016 – 2020 |
| Land-use / Land cover | Sentinel-2 land cover time series [52]. | 10 m | 2020 |
2.3.1. Validated InSAR-Derived Subsidence Rates
Although mostly inapparent, coastal land subsidence amplifies the impacts of SLR, hence an integral component of coastal vulnerability estimations. High subsidence rates translate into high coastal vulnerability to SLR and its cascading impacts. Spatially resolved land subsidence rates for the Volta Delta were obtained from the Avornyo et al. [5] study, which employed the Persistent Scatterer InSAR (PS-InSAR) technique. Sentinel-1 (S1) Single Look Complex (SLC) SAR images with 250 km by 180 km Interferometric Wide (IW) Swath were used. The entire shore length of the study area was covered by two Swaths (flight paths 147 and 74). Each Swath contains three sub-swaths, and three of the six sub-swaths together covered the full extent of the study area. For each of these three sub-swaths, 119 C-band (5.6 cm wavelength) images with vertical co-polarisation (VV) and ascending geometry were acquired from January 2016 to December 2020 (5 years). The PS-InSAR approach followed the SNAP-to-StaMPS chain [53], with a correction of residual atmospheric phase using the TRAIN toolbox by Bekaert et al. [54]. The analysis yielded 119,477 persistent scatterers at a density of 66.52 PS/km2, with calibrated line-of-sight velocities from 1.77 mm/yr (uplift) to -9.16 mm/yr (subsidence) and an overall mean of -3.25 mm/yr. Per-pixel displacement time series were extracted for each scatterer, with the twenty most-subsiding locations following a linear trend at an area-mean rate of -8.67 ±0.27 mm/yr.
The InSAR-derived velocities were validated against a GNSS survey (precise point positioning) of seven Ground Control Points dotted along the coast (Fig. 6 of the Avornyo et al. [5] study), with the highest subsidence at Keta (-5.36 mm/yr). The surveyed control points were compared with the mean InSAR velocity within a 100 m radius of each. The mean absolute difference between the two datasets gave a calibration uncertainty of ±2.75 mm/yr. In adopting the results for this study, the mean land deformation value (subsiding or uplifting deformation in mm/yr) in each grid cell was ranked based on the subsidence vulnerability classification in Table 2.
2.3.2. Sea-Level Rise
The regional or localised increase in sea levels is driven largely by climate forcings that translate into cascading multi-hazards, which exacerbate coastal vulnerability. Due to the possibility of coastal land being inundated, coasts exposed to the rising sea level are considered highly vulnerable locations [55]. On the contrary, coasts with low rates of sea level rise are relatively resilient and less susceptible to flooding [55]. Rising sea levels amplify coastal flooding, erosion and saltwater intrusion, thus degrading land utilisation, the supply of groundwater and surface freshwater, and other socio-economic livelihoods that are environment-dependent. In this study, a regional SLR change rate for 2020 was obtained from NASA’s IPCC Regional Sea Level Tool with data sourced from IPCC’s Sixth Assessment Report (AR6), Working Group I [45,46,47]. The 50th percentile of the Shared Socioeconomic Pathway (SSP) scenarios 2–4.5 and 5–8.5, characterised by moderate and very high greenhouse gas emissions, respectively and without IPCC’s vertical land motion (VLM) component, was selected. The VLM-free product was chosen to avoid double counting VLM, since subsidence is included in the CVI estimation separately. Due to spatial invariability at the selected extent, the SLR value of 4 mm/yr to 5 mm/yr (SSPs 2–4.5 and 5–8.5) was used to uniformly characterise each grid cell in the entire region.
2.3.3. Shoreline Change
Erosion and accretion rates indicate the dynamics of the coast and are used as proxy indicators for the potential impact of climate change. Unlike eroding coastlines, accreting coastlines are generally considered less vulnerable, since they contribute to coastline progradation that helps in incident wave energy dissipation. To obtain the rate of shoreline change, the shorelines of the 2005 orthophoto and 2020 Planet imagery were digitised and compiled in ArcGIS V. 10.7.1 into a single shapefile with relevant attributes. Using a manually delineated offshore baseline, the Digital Shoreline Analysis System (DSAS) tool Version 5.1 of ArcGIS was used to relatively estimate changes between 2005 and 2020 following Jayson-Quashigah et al. [40]. To accurately quantify the variations along the beach, perpendicular transects were cast at 50 m intervals alongshore [42]. The End Point Rate (EPR) approach, used to assess and quantify the long-term movement and changes in coastal shorelines, was adopted for the assessment of the shoreline change rate. The EPR’s key advantage lies in its computational simplicity and the minimal need for only two shoreline timestamps [56]. Shoreline change uncertainty was assessed by combining the positional uncertainties of the 2005 orthophoto and 2020 Planet imagery, yielding an estimated EPR uncertainty of ±0.30 m/year. The mean shoreline change rate (m/yr) value in each grid was correspondingly ranked based on the shoreline change vulnerability classification in Table 2.
2.3.4. Coastal Slope
The relative risk of inundation and the potential rate of shoreline recession is indicated by the coastal slope [57]. SLR will have a relatively lower impact on steep slopes when compared to a gently sloping coast, where significant inundation extent is expected for any rise in sea level [58]. Coastal hydrodynamic and morphological processes are also influenced by the slope [59]. Both small-scale and extensive coastal research include the slope as an integral component of CVI studies.
The backshore slope, which is the subaerial profile from the shoreline to the first landward elevation peak, as defined by Athanasiou et al.[48], was used for the CVI estimation. The spatial distribution is a global dataset with transects spaced at 1 km, with each transect containing data sourced from both the Copernicus Digital Elevation Model (DEM) and the Delta Digital Terrain Model (DTM). Unlike the Copernicus DEM, which is a Digital Surface Model that includes buildings and vegetation canopy that may give false elevation peaks, the DeltaDTM―a Digital Terrain Model―was preferred for this study. The coastal slope value (%) per grid, or the mean value for two or more slopes (transects) in a grid, was ranked based on the slope vulnerability classification in Table 2.
2.3.5. Geology and Geomorphology
The structure of the coast, which represents the relative erodibility and extent of the resilience of the various features ranging from towering cliffs to sandy coasts, is important in deciding how the coast will respond to SLR [60]. Erosivity risks, the potential for soil erosion, correlate with geology and coastal landform [61]. The erosion resistance of bedrock lithology, shore materials, and coastal landforms varies greatly [57]. Gornitz and Kanciruk [62] suggested a generalised scale of lithologic and geomorphologic resistance to erosion.
The geological data was digitised from a 2009 1:1,000,000 scale geologic map by the Geological Survey Authority, Ghana (GSA) and Bundesanstalt für Geowissenschaften und Rohstoffe, Germany (BGR) [50]. In the case of geomorphology, data were sourced from a combination of 2005 orthophotos from the GSA, a 4-metre 2020 satellite imagery from Planet and a 2015 land cover map obtained from Appeaning Addo et al. [41]. The dominant features for each variable (geology and geomorphology) in each grid were correspondingly ranked based on the geology and geomorphology vulnerability classification in Table 2.
2.3.6. Significant Wave Height
Significant Wave Height (SWH) is simply defined as the average height (meters) of the highest one-third of the waves during a given sampling period. The SWH is a major driver of the sediment budget. It is used as a substitute for wave energy and is regarded as a crucial factor in determining how vulnerable a coastline is [42]. SWH is a measure of the wave energy’s ability to transport coastal sediment [60,61] and greatly determines the morphodynamic regime of a coastline. Coastlines that have high wave heights are also known to be more vulnerable than those that are exposed to low wave heights [63].
The SWH data was sourced from the global data provided by Giardino et al. [51] based on Global Atmospheric Reanalysis Interim data from the European Centre for Medium-Range Weather Forecasts (ECMWF) website (Table 1). The spatial variability along the coast of the study area was kept at 2 km intervals based on the grid cell positioning. The SWH value in each grid was ranked based on the SWH vulnerability classification in Table 2. Where there was more than one dissimilar SWH value in a grid cell, the mean was used.
2.3.7. Mean Tidal Range
Tidal range, which is connected to tidal flooding, is the phrase used to describe the vertical difference between the maximum high tide and the minimum low tide [64]. The mean tidal range has been used as a measure to assess coastal vulnerability in earlier research [61]. Permanent and sporadic tidal floods are both influenced by the tidal range [65]. If a coastal location has a high tidal range, it is considered to be extremely susceptible because powerful tidal currents have an influence on coastal behaviour [43,66]. Thieler and Hammar-Klose [44] posit an opposite classification where microtidal coasts are rather the most vulnerable since the proximity of their coastlines to the high tide allows storm surges to easily overtop normal water levels, hence causing immediate flooding. The classification by Thieler and Hammar-Klose [44] was adopted for this study.
Daily tidal data were obtained from the Ghana Ports and Harbours Authority as well as the Meridian Ports Services Terminal 3, the closest tide station to the study area, from 2016 to 2020. The mean tidal range (m) was then estimated from the dataset and used to uniformly characterise each grid cell.
2.3.8. Land Use and Land Cover (LULC)
LULC change is a parameter related to the trend of human management related to biodiversity, carbon cycle, greenhouse gas emissions, productivity, survivability, and a diverse variety of social, economic and ecological processes [67,68,69]. Land cover and land-use patterns are human-driven and essentially complement the physical or environmental component [70] of the CVI estimation. Some land use patterns can cause severe repercussions on landforms, hence exacerbating the prevalent deteriorating conditions. The land cover maps for the study area were obtained from global data provided by Karra et al. [52] using Sentinel-2 images (10 m resolution) and a machine learning algorithm. The dominant land cover in each grid was ranked based on the LULC vulnerability classification in Table 2.
2.4. Coastline Segmentation and Grid Cell Design
In the second stage of the methodology, the approximately 150 km Volta Delta coastline was divided into 72 contiguous grid cells (Figure 1), each spanning 2 km alongshore. This interval was selected to balance spatial resolution sufficient to detect meaningful variation across the nine (9) input variables and to ensure an even grading of the input data. Grid cells were delineated in ArcGIS V. 10.7.1 using a coastline baseline derived from the Geological Survey Authority’s 2005 data, with cells extending 2 km landward from the mean high-water line to cover the active coastal zone. The choice of the grids’ landward extent was due to its adequate coverage of the sand barrier width. All spatial data were projected in WGS 1984 UTM Zone 31N (EPSG: 32631) to ensure metric consistency across datasets.
2.5. Coastal Vulnerability Index Computation
The third stage of the methodology involved the quantification and ranking of each variable within each of the contiguous grid cells. The variables are quantified and categorised based on a standardised scale of one to five [42,57,60,61], with the magnitude of vulnerability increasing from one (1= very low vulnerability) to five (5 = very high vulnerability). In each of the seventy-two (72) 2 km by 2 km grid cells, each of the nine (9) variables is categorised individually based on the 1 to 5 vulnerability scale (Table 2). Within each grid cell, the mean value of continuous variables (shoreline change, nearshore slope, subsidence, SLR, significant wave height, and mean tidal range) was computed as the representative cell value. For categorical variables (geology, geomorphology, and land cover), the dominant class within each cell was assigned as the representative value.
Table 2.
Quantification and ranking of selected variables based on the 1 to 5 vulnerability scale, with the vulnerability rank ranging from one (1= very low vulnerability) to five (5 = very high vulnerability).
Table 2.
Quantification and ranking of selected variables based on the 1 to 5 vulnerability scale, with the vulnerability rank ranging from one (1= very low vulnerability) to five (5 = very high vulnerability).
| Parameters | Very Low (1) | Low (2) | Moderate (3) | High (4) | Very High (5) |
|---|---|---|---|---|---|
| Subsidence (mm/yr) [61] | >1.0 uplifting |
1.0 – -1.0 | -1.0 – -2.0 | -2.1 – -4.0 | < -4.0 Subsiding |
| Sea Level Rise (mm/yr) [63] | <0.8 | 0.8 – 1.6 | 1.6 – 2.4 | 2.4 – 3.2 | > 3.2 |
| Shoreline Change (m/yr) [61] | >2.0 Accretion |
1.0 – 2.0 | -1.0 – 1.0 | -1.1 – -2.0 | <-2.0 Erosion |
| Coastal Slope (%) [71] | >12 | 8 – 12 | 4 – 8 | 2 – 4 | <2 |
| Geology [61] | Plutonic Volcanic (lava) High-medium grade metamorphics | Low-grade metamorphics, Sandstone and conglomerate (well cemented) | Most sedimentary | Coarse and/or poorly sorted unconsolidated sediments | Fine unconsolidated sediment Volcanic ash |
| Geomorphology [61] | Rocky, cliffed coast, fjords, fiards | Medium cliffs, indented coasts | Low cliffs, Glacial drift, Salt marsh, Coral reefs, Mangrove | Beaches (pebbles), Estuary, Lagoon, Alluvial plains | Barrier beaches, Beaches (sand), Mud flats, Deltas |
| Significant Wave Height (m) [65] | <0.55 | 0.55–0.85 | 0.85–1.05 | 1.05–1.25 | >1.25 |
| Mean Tidal Range (m) [44] | >6.0 Macrotidal |
4.1 – 6.0 | 2.0 – 4.0 Mesotidal |
1.0 – 1.9 | <1.0 Microtidal |
| Land-use / Land cover [72] | Water bodies, marsh/bog and moor, sparsely vegetated areas, bare rocks | Natural grasslands, coastal areas | Forest | Agriculture | Urban and Industrial Infrastructure |
Gornitz [43,73] established one of the foremost methods for computing the overall CVI by dividing the square root of the product of ranked variables by the total number of variables. The variables used in computing the overall CVI were unweighted following Gornitz [43], Thieler and Hammar-Klose [60] and Boateng et al. [29]. The CVI formula adopted assigns equal weight to all nine input variables, implying that each contributes equally to coastal vulnerability. This assumption may not accurately reflect the relative physical importance of individual variables in the Volta Delta context. The unweighted formulation was retained to maintain comparability with prior assessments along the Ghanaian coast [17,29] and to isolate the specific contribution of subsidence inclusion from any effects of variable weighting. The implications of this assumption are addressed in the limitations section.
The CVI computation stage (fourth stage) integrates all variables into a single composite index by adopting the square root of the product mean formula by Gornitz [43]. To assess the magnitude of impact subsidence could have on the vulnerability of the coastal zone to hazards, two CVIs were calculated: with land subsidence (CVI(+sub), Equation 1) and without subsidence (CVI(-sub), Equation 2), following a similar assessment by Husnayaen et al. [42] in Semarang, Indonesia.
where CVI(+sub) = CVI with subsidence; CVI(-sub) = CVI without subsidence; SC= Shoreline Change; GL = Geology; S = Subsidence; CS = Coastal Slope; GM = Geomorphology; MTR =Mean Tidal Range; SLR = Sea-Level Rise; LULC = Land Use/Land Cover; and SWH = Significant Wave Height.
In stage five, the CVI values from both CVI(+sub) and CVI(-sub) were combined into one single dataset, and the vulnerability classes were derived from the combined distribution by splitting the dataset into four quantile ranges. The quantile thresholds were applied consistently with both CVI scenarios in order to ensure direct comparison between them. The vulnerability classes were: 0 to 25% (22 - 68) = Low Vulnerability; 25% to 50% (68 - 105) = Moderate Vulnerability; 50% to 75% (105 - 155) = High Vulnerability; and 75% to 100% (155 - 333) = Very High Vulnerability.
Finally, using a quantitative measure of the impact land subsidence has on coastal vulnerability, the following equation (Equation 3), which computes relative change in CVI, was used to quantify the compounding influence of land subsidence on coastal vulnerability for every grid and to identify the most vulnerable hotspots along the Volta Delta’s coast. The relative change estimation is an indication of the percentage increase or decrease in CVI for each grid cell pair.
The result of the relative change in CVI between CVI(+sub) and CVI(-sub), for each grid was classified as follows: < -25% = Major Decrease (uplift); -25% to 0% = Minor Decrease (uplift); 0% to 25% = Minor Increase (subsidence); 25% to 50% = Moderate Increase (subsidence); > 50% = Major Increase (subsidence). Between the dual-scenario CVI computation, the corresponding transitions between vulnerability classes for each grid were also identified using categorical classifications as follows: Vulnerability Class Decrease; No Change in Vulnerability Class; and Vulnerability Class Increase (+1 increase, +2 increase, +3 increase and +4 increase). In complementing the relative change estimation and vulnerability class transition map, a Wilcoxon signed-rank test was applied to assess the statistical difference between the two scenarios and whether the CVI values differed significantly due to the inclusion of land subsidence across paired grid cells. The Wilcoxon signed-rank test, a non-parametric test, was selected because of the composite nature of the CVI values, which involved the ranking and multiplication of variables and may not truly be normally distributed, even if normality tests portray so.
All processing steps described above are implemented in the dynamic, automated CVI Assessment tool, which is a configuration-driven, interactive Python pipeline that turns GIS variables into vulnerability maps, ranks and statistics. The code and its documentation are available on GitHub and archived on Zenodo (see Data Availability Statement).
3. Results
3.1. Geological, Geomorphological, Hydrodynamics and Anthropogenic Variables for CVI
Figure 3 (a – i) displays maps of the input data from the various sources used in this study. The maps indicate the range and gradation of values for continuous variables or the various classes in the case of categorical variables, obtained from the corresponding variable sources.
Figure 4 shows the vulnerability-ranked maps of each of the nine (9) variables used in computing the CVI for the Volta Delta. For each variable, it gives a breakdown of the varied vulnerability classification of the Delta’s entire coast using the corresponding vulnerability (colour) classification scheme shown in Table 2.
3.1.1. Subsidence and Sea-Level Rise
Figure 3a shows the rate of subsidence along the coast in mm/yr, with values ranging from -2.44 mm/yr to -4.23 mm/yr and an average value of -3.35 mm/yr. Using the mean subsidence rates in each grid cell, 87.5% of the shoreline indicated High vulnerability, whereas the remaining 12.5% of the coast showed Very High vulnerability. Figure 3b shows the spatially uniform rate of SLR (mm/yr) along the Delta’s coast. The entire coastline of the Delta is experiencing SLR of 4 mm/yr - 5 mm/yr, thus indicating a Very High vulnerability status.
3.1.2. Shoreline Change
Figure 3c shows the rate of shoreline change (m/yr) along the Delta’s coast, ranging from an eroding coast (-12.02 m/yr ±0.30) to an accreting coast (7.30 m/yr ±0.30), with a net average of -0.66 m/yr ±0.30 (erosion). Using the mean shoreline change value per grid cell, 6.94% of the shoreline showed Very Low vulnerability; 4.17% of the shoreline showed Low vulnerability; 51.39% of the shoreline showed Moderate vulnerability; 22.22% of the shoreline showed High vulnerability; whereas 15.28% showed Very High vulnerability.
3.1.3. Coastal Slope, Geology and Geomorphology
Figure 3d shows the coastal slope (%) of the coast ranging from 0.18% to 11.04%, with an average of 3.28%. Using the mean coastal slope value in each grid cell, 6.94% of the shoreline showed Low vulnerability; 18.06% of the shoreline showed Moderate vulnerability; 40.28% of the shoreline showed High vulnerability; whereas 34.72% showed Very High vulnerability. Figure 3e shows the geology classes along the coast, with the “Unconsolidated Alluvial Sand, Silt and Clay” class being the most extensive class. Using the most dominant geology class in each grid cell, 2.78% of the shoreline indicated Very Low vulnerability; 8.33% of the shoreline showed Low vulnerability; 6.94% of the shoreline showed Moderate vulnerability; whereas the remaining majority of 81.94% indicated Very High vulnerability. Figure 3f shows the geomorphology classes along the coast, with the most dominant class being the “Beaches (sand) or Barrier Beaches” class. Using the most dominant geomorphology class in each grid cell, 8.33% of the shoreline indicated High vulnerability, whereas the remaining majority of 91.67% indicated coasts with Very High vulnerability status.
3.1.4. Significant Wave Height and Mean Tidal Range
The highest significant wave height (m) obtained was 1.25 m, whilst the lowest was 0.56 m (Figure 3g), with an average of 0.95 m. Using the mean significant wave height value in each grid cell, 25% of the shoreline indicated Low vulnerability; 40.28% of the shoreline showed Moderate vulnerability; 31.94% of the shoreline indicated High vulnerability; whereas 2.78% indicated Very High vulnerability. Figure 3h shows the mean tidal range (m) along the coast. The entire coastline of the Delta is experiencing a spatially uniform mean tidal range of 1.47 m, thus indicating a High vulnerability status.
3.1.5. LULC
Figure 3i shows the LULC classes along the Delta’s coast, with the most dominant class across the entire coast being built-up areas (urban and industrial infrastructure). Using the most dominant land cover in each grid cell, 27.78% of the shoreline showed Very Low vulnerability; 13.89% of the shoreline indicated Low vulnerability; whereas the remaining 58.33% showed Very High vulnerability.
The percentage distribution of grid cell ranking, based on the 1–5 vulnerability scale for each variable, is summarised in Table 3. Individually, six out of the nine variables had more than 50% of the coastline indicating High (2 variables) to Very High (4 variables) vulnerability.
3.2. Comparing the Estimated Composite CVIs and Identifying Hotspots
The composite CVI for each of the seventy-two (72) grid cells, under both CVI(+sub) and CVI(-sub), are shown in Figure 5b. CVI(+sub) produced values ranging from a minimum CVI of 42 to a maximum CVI of 333, with a mean CVI of 156 (Very High Vulnerability status based on quantile thresholds). CVI(-sub) produced values ranging from a minimum CVI of 22 to a maximum CVI of 177, with a mean CVI of 82 (Moderate Vulnerability status based on quantile thresholds). The grid cells with the highest CVI estimation under both CVI(+sub) and CVI(-sub) were grid cells 39 and 56, whereas the grid cell with the lowest CVI estimation under both CVI(+sub) and CVI(-sub) was grid cell 34. In comparing both mean values, the incorporation of land subsidence into the CVI computation increases the level of vulnerability by 90.89%. Using the dual-CVI quantile or percentile thresholds (shown by the horizontal reference lines in Figure 5b), the two composite CVI computations mostly produced distinctly different vulnerability classes for each grid pair comparison, as shown by the grid cell map in Figure 5a.
Complementing the grid cell map is the table in Figure 5a, which gives a count breakdown for each vulnerability rank for the two composite CVIs. The composite CVI(+sub) produced 4 (5.6%) grid cells with Low vulnerability; 14 (19.4%) grid cells with Moderate vulnerability; 23 (31.9%) grid cells with High vulnerability; and 31 (43.1%) grid cells with Very High vulnerability. On a comparatively lower vulnerability level, the composite CVI(-sub) produced 31 (43.1%) grid cells with Low vulnerability; 21 (29.2%) grid cells with Moderate vulnerability; 16 (22.2%) grid cells with High vulnerability; and 4 (5.6%) grid cells with Very High vulnerability. The composite CVI(+sub) indicated 75% (54 counts) of the grid cells as High or Very High vulnerability status, as against 28% (20 counts) for the composite CVI(-sub). On the lower vulnerability ranks, the composite CVI(+sub) indicated 25% (18 counts) of the grid cells as Moderate or Low vulnerability status, as against 72% (52 counts) for the composite CVI(-sub). Despite the disparities, both CVIs showed similar profiles (Figure 5b) and peaked at the coastlines of the two extensively distinct lagoons in the study area, the Keta and Songor lagoons (Figure 1). The highest composite CVIs under both scenarios were located along the coastal margins of the Keta and Songor lagoons, which account for the majority of grid cells classified as Very High vulnerability (Figure 5a). The relative change in CVI (Figure 5c) between CVI(+sub) and CVI(-sub) grid pairs ranged from 89% to 111% with a mean of 91%, far exceeding the lower bound of the highest increase (> 50%) threshold; hence, all grid cells indicated “Major Increase”.
Figure 6 shows the vulnerability rank transition between CVI(+sub) and CVI(-sub) for each grid pair. Using the transition categories for each grid-pair transition between CVI(+sub) and CVI(-sub), 8 (11.1%) of the grid cells maintained their vulnerability rank status for both CVI(+sub) and CVI(-sub); 40 (55.6%) of the grid cells transitioned one level up the vulnerability scale from a lower vulnerability scale (CVI(-sub)) to a higher vulnerability scale (CVI(+sub)); and 24 (33.3%) of the grid cells transitioned two levels up the vulnerability scale from a lower vulnerability scale (CVI(-sub)) to a higher vulnerability scale (CVI(+sub)). No decrease in vulnerability status was recorded. The compounding impact of subsidence on the CVI estimation and vulnerability ranks for each grid cell was corroborated by the Wilcoxon signed-rank test, which indicated a statistically significant increase in vulnerability scores when subsidence was incorporated (p < .001). The median CVI score shifted from 76.23 to 146.06, with a median paired difference of 68.60.
4. Discussion
4.1. Comparing the Computed CVIs
All variables included in computing the CVIs tend to exacerbate the vulnerability of a coastal zone and the socio-economic livelihood therein, especially when individual rates or magnitudes exceed normal thresholds. Gornitz [43] and Thieler and Hammar-Klose [44] identified six or seven of the variables as the most crucial components in coastal vulnerability assessment, namely geomorphology, geology, coastal slope, relative SLR (eustatic and isostatic SLR), shoreline change, mean tide range, and mean wave height, while land use or land cover was included to capture the anthropogenic dimensions of exposure. Along the coast of Ghana, the only CVI assessments that incorporate land subsidence were carried out on a regional (Greater Accra Region) scale by Appeaning Addo [17] and extensively along the entire coast of Ghana on a district scale by Boateng et al. [29]. In both instances, data on all variables except subsidence were either measured directly or sourced as secondary data from reliable institutions. Both studies, Appeaning Addo [17] and Boateng et al. [29], assumed average and spatially invariant subsidence rates of -2 mm/yr and ≤-1 mm/yr, respectively, based on global trends and tide gauge data. The present study is therefore the first CVI assessment along the coast of Ghana to incorporate GNSS-validated, InSAR-derived subsidence rates in the overall CVI computation. To assess the differences in vulnerability attributable to subsidence, a comparative approach was adopted, computing two indices, one with subsidence as an input variable (CVI(+sub)) and one without (CVI(-sub)).
The dual-scenario computation demonstrates that incorporating measured subsidence alters the vulnerability profile of the Delta’s coastline (Figure 5b). The mean composite CVI increased from 82 for CVI(-sub), a Moderate vulnerability status, to 156 for CVI(+sub), a Very High vulnerability status, an increase of about 91%. Along with the mean-related increase in the vulnerability status was a shift in the classification structure for the individual grid cells: 75% of the grid cells indicated High or Very High vulnerability under CVI(+sub), compared with the majority (72%) indicating Moderate to Lower vulnerability under CVI(-sub). The vulnerability rank transitions also reinforce the pattern: 88.9% of the grid cells moved at least one class upward when subsidence was incorporated, while 33.3% of the cells moved two classes upward, with no cell indicating a decrease in vulnerability. Given that the two indices (CVI(+sub)) and (CVI(-sub)) are derived from the same 72 contiguous grid cells and share the same variables except subsidence, the paired, non-parametric Wilcoxon signed-rank test confirmed that the paired differences are statistically significant (p < .001). The composite CVI values per grid cell, the classification transitions and the paired test all point to the same conclusion that excluding land subsidence from CVI computation understates the vulnerability of the Delta’s coast.
Land subsidence directly amplifies the local rate of SLR and its cascading impacts. The grid cell subsidence inputs, ranging from -2.44 to -4.23 mm/yr (mean of -3.35 mm/yr), are therefore of almost the same magnitude as the regional SLR rates of 4 to 5 mm/yr. This translates into the compounding effect of land subsidence on SLR rates, suggesting an amplification of the impacts of eustatic SLR by almost a twofold factor. This doubling effect is inapparent to assessments that rely on globally averaged or assumed subsidence rates of -1 to -2 mm/yr, as applied by the only CVI studies [17,29] along Ghana’s coast that incorporated land subsidence. While the grid cell means of the PS-InSAR data smooth out localised extremes, the highest point-scale subsidence rate recorded was 7.68 mm/yr (Figure 3a), which far exceeds the regional SLR rates of 4 to 5 mm/yr. This is consistent with global evidence that VLM frequently rivals or exceeds eustatic SLR as the dominant driver of relative sea-level change in deltas [5,7,8].
On the standardised 1–5 vulnerability scale adopted for this study, the averaged subsidence rates place 87.5% of the grid cells in High subsidence class and the remainder in the Very High class, whereas the estimations used by the previous studies (e.g. Boateng et al. [29]) would have understated the compounding effect of subsidence by ranking the vulnerability status of the grid cells two or three classes lower, thus Moderate to Low status. A comparable dual-scenario CVI assessment by Husnayaen et al. [42] in Semarang, Indonesia, similarly reported obvious reclassification of grid cells when measured land subsidence rates were used, suggesting that the pattern observed is characteristic of subsiding deltaic coasts and not peculiar to the Volta Delta. Higher subsidence rates would translate into a higher subsidence vulnerability rank and hence exacerbate the magnitude and frequency of prevalent coastal multi-hazards such as flooding and complete inundation, coastal erosion, saltwater intrusion, and loss of wetlands and ecosystem services.
4.4. Vulnerability Hotspots, Low-Risk Zones and the Driving Variables
The high overall quantile or percentile distribution used in ranking each of the grid cells for both CVIs was due largely to the high vulnerability status of the individual variables. Seven out of the nine variables had major sections (>58% – 100%) of the Delta’s coastline registering either Very High or High vulnerability status (Table 3). The largest contributors were sea-level rise, geomorphology, geology and LULC, with 100%, 91.67%, 81.94%, and 58.33% of the coastline, respectively, registering Very High vulnerability. Most of these high contributors were not spatially variant.
In terms of vulnerability hotspots, both CVIs displayed similar alongshore profiles and peaked at the coastal margins of the dominant Keta and Songor lagoons (Figure 5b); however, peaks along the Keta lagoon’s coastal margin showed relatively higher values when compared with Songor lagoon’s coastal margin. The grid cell with the lowest vulnerability under both CVI computations is grid cell 34. Grid cell 34 is located at the mouth or estuarine area of the Volta River, and owing to its location, it recorded the lowest rank for the following reasons. It has a Very Low vulnerability rank under the LULC variable due to the dominance of the low-ranked waterbody class, and a Very Low vulnerability rank under the shoreline change variable since the dominance of water means there is little to no shore to erode. It also has a patch of alluvial beach reinforced with groynes, which has drastically reduced erosion (Very Low vulnerability rank) and widened the beach. The cell also has a Low vulnerability rank under SWH due to submerged fluvial deposit shoals at the river mouth that dissipate wave energy approaching the grid cell’s coast. Despite a low coastal slope (Very High rank) to aid the river’s directional flow into the sea, and pockets of subsiding islands in the landward extent of the grid cell, the influence of the aforementioned low-ranked variables outweighed the high-ranked variables. On the contrary, the grid cells that recorded the highest composite values under both CVI computations were grid cells 39 and 56, which are dotted along the Keta lagoon’s coastal margin, reaffirming the Keta coastal margin’s relatively higher vulnerability status. Except for MTR, subsidence (case of CVI(+sub)) and SWH, which indicated High rank, all other variables showed Very High rank.
Focussing on the composite CVI(+sub), the 54 grid cells that indicated High or Very High composite vulnerability (Figure 5a) are spatially distributed as follows, using the grid cell numerical label in Figure 1 and Figure 5a: 23 continuous grid cells (grid cells 36 to 57 and 59) along the coastal margins of the Keta lagoon (Agorkedzi-Keta stretch); 16 discontinuous grid cells (grid cells 14 to 23, 26 and 29 to 33) along the Songor lagoon coastal margin; 5 grid cells (grid cells 68 to 72) along the Denu-Aflao stretch (easternmost coastline); 3 grid cells (grid cells 60, 63 and 65) dotted along the Blekusu-Agavedzi stretch, which has seen recent makeshift groynes (already showing signs of toe failure) to build the beach in response to increased flooding and erosion; and the remaining 7 discontinuous grid cells dotted along the western coast of the Delta. These spatial distribution trends highlight a number of driving factors. For geology, 70% of the entire Delta is predominantly covered by erodible alluvial deposits of sand, silt and clay [5], with gentle slope gradients that make it extremely vulnerable to SLR or storm surge, while the sandy barrier beach geomorphology compounds the vulnerability. These depositional landforms offer little inherent resistance to erosive and inundation forces. The little to no inherent resistance of the depositional landforms is heightened along the Delta’s coast by the long-standing reduction in fluvial sediment supply following the construction of the Akosombo Dam [74,75]. Additionally, the coast of both lagoons has relatively thin barrier beaches (beach width), especially in the Songor area and Keta to Hlorve township, with pockets of extensive shoreline erosion. This is corroborated by the extensive revetments and groynes constructed at Ada, Dzita, Keta, Ningo-Prampram, and recently at Blekusu-Agavedzi to prevent further erosion. In the case of Keta, Kumapley [39] reports a 1000 m shoreline recession since 1880, while Fiadzigbey [76] indicates that about 70% of the town is now submerged underwater. The land cover or land-use patterns along the Agorkedzi-Keta stretch are dominated by built-up areas and extensive agricultural farmlands, which increase the composite CVI, coupling physical exposure to socio-economic exposure.
These lagoonal margins additionally face constrained adaptation space. Bounded by the sea on one side and the lagoon water bodies on the other (Figure 7a), the barrier coastlines lack natural landward retreat pathways. Given this setting, the sand barrier is predicted to experience coastal narrowing as defined by Pontee [77], that is, a reduction of the coastal width, due to increased water levels at both the seaward boundary from SLR and the landward boundary (Figure 7a) from inland flooding of the Volta River or from rising lagoon levels driven by the inland influx of seawater. In locations protected by groynes or revetments, such as Keta and Dzita, the rate of coastal squeeze will increase. The presence of these structures only stabilises the local shoreline while displacing erosion downdrift [38], as shown by eroded coastline images along the Blekusu-Agavedzi stretch (Figure 7b to d), downdrift of the Keta Sea Defence Project. The presence of defence structures also prevents the landward migration of ecosystems, leading to the loss of unique coastal habitats and ecosystems (e.g. Doody [78]). Inundation of the coast from the seaward boundary will also push the salt wedge further up into freshwater aquifer systems, with consequences for agricultural activities, livelihoods and human health. Cases of saltwater intrusion are already reported along the coast [79], particularly in the towns dotted along the Bight of Benin.
5. Limitations
The unweighted CVI computation assigns equal importance to all nine variables, an assumption that may not reflect their relative physical influence in the Volta Delta. It was, however, retained for comparability with prior assessments and to isolate the effect of subsidence inclusion. Also, the 2 km by 2 km grid cells average out sub-kilometre variability, suppressing or smoothing localised value extremes of the nine variables. For instance, the grid cell means for the land subsidence variable peaks at -4.23 mm/yr, although the highest point-scale rate measured was 7.68 mm/yr (Figure 3a), suggesting that the results are conservative. Lastly, the shoreline-change estimate rests on two timestamps under the EPR approach and may not account for temporal variations between the timestamps. In the absence of tide monitoring stations in the Delta, the study adopted SLR and tidal range inputs that are uniform alongshore and therefore do not contribute to spatial variability in the index.
6. Conclusions
The study employed the use of an index-based approach that incorporated validated, InSAR-derived subsidence, the first of its kind in the Volta Delta, to assess the vulnerability and sensitivity of the Delta’s coastal areas to increasing coastal hazards. By computing two composite indices (CVI(+sub) and CVI(-sub)) across 72 contiguous grid cells along the ~150 km coastline, and classifying both against a common quantile distribution, the study isolates and quantifies the contribution of land subsidence to coastal vulnerability in a data-sparse deltaic setting.
Three findings stand out. First, the study showed that 75% of the entire coastline registered either High or Very High vulnerability when subsidence is included as an input variable. In comparing the composite mean Indices of CVI(+sub) and CVI(-sub), the inclusion of subsidence raised the mean CVI from 82 to 156, shifting the Delta’s overall status from Moderate to Very High vulnerability and moving 88.9% of the grid cells at least one class up the vulnerability scale. This difference is confirmed as statistically significant by the Wilcoxon signed-rank test. Second, with measured mean subsidence of -3.35 mm/yr against the regional SLR of 4 to 5 mm/yr, the relative SLR experienced along the coast is approximately double the eustatic rate, a condition entirely missed by the assumed spatially uniform subsidence values used in earlier assessments. Higher subsidence rates will scale up the already compounding impacts of climate change further. Third, vulnerability is spatially concentrated along the continuous stretch of sand barrier bounded by the two dominant lagoons, the Songor and Keta. These coastal margins (Keta especially) combine erodible geology, barrier beach geomorphology, built-up land cover, persistent subsidence and constrained retreat space, hence emerging as the Delta’s critical hotspots under both CVI scenarios.
These findings support the following recommendations: coastal management and adaptation planning should prioritise the identified hotspots for monitoring, early warning and contingency planning; instead of using global rates, validated InSAR-derived VLM must be adopted as a standard input in vulnerability frameworks by national agencies responsible for coastal assessment; regulatory attention should be directed at identifying and quantifying the human drivers of subsidence in the Delta, such as groundwater abstraction and salt mining activities; hybrid defences that incorporate ecosystem-based measures should be adopted in place of hard engineering alone; future research should test weighted CVI computations.
Author Contributions
Conceptualization, S.Y.A., K.A.A., E.M., P.T., R.B. and P.S.J.M.; methodology, S.Y.A.; software, S.Y.A. and P-N.J-Q.; validation, S.Y.A., P-N.J-Q. and F.E.I.; formal analysis, S.Y.A. and P-N.J-Q.; investigation, S.Y.A.; resources, K.A.A., E.M. and P.T.; data curation, S.Y.A., P-N.J-Q., M.K-B., O.O.O. and F.E.I.; writing—original draft preparation, S.Y.A., F.E.I., and O.O.O.; writing—review and editing, K.A.A., E.M., P.T., R.B. and P.S.J.M.; visualization S.Y.A., P-N.J-Q. and F.E.I.; supervision, K.A.A., E.M., P.T., R.B. and P.S.J.M. All authors have read and agreed to the published version of the manuscript.
Funding
This research received no external funding.
Data Availability Statement
The raw data supporting the conclusions of this article will be made available by the authors on request. The Python pipeline used to compute and map the Coastal Vulnerability Index is publicly available on GitHub at https://github.com/selavorn/Automated-Coastal-Vulnerability-Index-Assessment and archived on Zenodo at https://doi.org/10.5281/zenodo.XXXXXXX.
Acknowledgments
During the preparation of this manuscript, the authors used Claude v1.11187.5 for the purposes of generating the methodology workflow chart and improving wording. The authors have reviewed and edited the output and take full responsibility for the content of this publication.
Conflicts of Interest
The authors declare no conflicts of interest.
Abbreviations
The following abbreviations are used in this manuscript:
| AR6 | IPCC’s Sixth Assessment Report |
| BGR | Bundesanstalt für Geowissenschaften und Rohstoffe, Germany |
| CS | Coastal Slope |
| CVI | Coastal Vulnerability Index |
| DEM | Digital Elevation Model |
| DSAS | Digital Shoreline Assessment System |
| DTM | Digital Terrain Model |
| ECMWF | European Centre for Medium-Range Weather Forecasts |
| EPR | End Point Rate |
| GIS | Geographic Information Systems |
| GL | Geology |
| GM | Geomorphology |
| GNSS | Global Navigation Satellite System |
| GPHA | Ghana Ports and Harbours Authority |
| GSA | Geological Survey Authority, Ghana |
| InSAR | Interferometric Synthetic Aperture Radar |
| IPCC | Intergovernmental Panel on Climate Change |
| IW | Interferometric Wide |
| LULC | Land Use Land Cover |
| MPS | Meridian Port Services |
| MTR | Mean Tidal Range |
| NASA | National Aeronautics and Space Administration |
| PS-InSAR | Persistent Scatterer Interferometric Synthetic Aperture Radar |
| S | Subsidence |
| S1 | Sentinel-1 |
| SAR | Synthetic Aperture Radar |
| SC | Shoreline Change |
| SLC | Single Look Complex |
| SLR | Sea-Level Rise |
| SNAP | Sentinel Application Platform |
| SSP | Shared Socioeconomic Pathway |
| StaMPS | Stanford Method for Persistent Scatterers |
| SWH | Significant Wave Height |
| TRAIN | Toolbox for Reducing Atmospheric InSAR Noise |
| UTM | Universal Transverse Mercator |
| VLM | Vertical Land Motion |
| WGS | World Geodetic System |
References
- Nicholls, R.J.; Wong, P.P.; Burkett, V.; Codignotto, J.; Hay, J.; McLean, R.; Ragoonaden, S.; Woodroffe, C.D.; Abuodha, P.A.O.; Arblaster, J.; et al. Coastal Systems and Low-Lying Areas. In Climate Change 2007: Impacts, Adaptation and Vulnerability. Contribution of Working Group II to the Fourth Assessment Report of the Intergovernmental Panel on Climate Change; Cambridge University Press: Cambridge, UK and New York, NY, USA, 2007; pp. 315–356. [Google Scholar]
- Durand, G.; den Broeke, M.R. van; Cozannet, G.L.; Edwards, T.L.; Holland, P.R.; Jourdain, N.C.; Marzeion, B.; Mottram, R.; Nicholls, R.J.; Pattyn, F.; et al. Sea-Level Rise: From Global Perspectives to Local Services. Front. Mar. Sci. 2022, 8. [Google Scholar] [CrossRef]
- Neumann, B.; Vafeidis, A.T.; Zimmermann, J.; Nicholls, R.J. Future Coastal Population Growth and Exposure to Sea-Level Rise and Coastal Flooding - A Global Assessment. PLoS ONE 2015, 10, e0118571. [Google Scholar] [CrossRef] [PubMed]
- Intergovernmental Panel on Climate Change (IPCC) Climate Change 2021 – The Physical Science Basis: Working Group I Contribution to the Sixth Assessment Report of the Intergovernmental Panel on Climate Change, 1st ed.; Cambridge University Press, 2023; ISBN 978-1-009-15789-6.
- Avornyo, S.Y.; Minderhoud, P.S.J.; Teatini, P.; Seeger, K.; Hauser, L.T.; Woillez, M.-N.; Jayson-Quashigah, P.-N.; Mahu, E.; Kwame-Biney, M.; Appeaning Addo, K. The Contribution of Coastal Land Subsidence to Potential Sea-Level Rise Impact in Data-Sparse Settings: The Case of Ghana’s Volta Delta. Quat. Sci. Adv. 2024, 14, 100175. [Google Scholar] [CrossRef]
- Minderhoud, P.S.J.; Erkens, G.; Pham, V.H.; Bui, V.T.; Erban, L.; Kooi, H.; Stouthamer, E. Impacts of 25 Years of Groundwater Extraction on Subsidence in the Mekong Delta, Vietnam. Environ. Res. Lett. 2017, 12, 064006. [Google Scholar] [CrossRef] [PubMed]
- Ohenhen, L.O.; Shirzaei, M.; Davis, J.L.; Tiwari, A.; Nicholls, R.; Dasho, O.; Sadhasivam, N.; Seeger, K.; Werth, S.; Chadwick, A.J.; et al. Global Subsidence of River Deltas. Nature 2026, 649, 894–901. [Google Scholar] [CrossRef]
- Syvitski, J.P.M.; Kettner, A.J.; Overeem, I.; Hutton, E.W.H.; Hannon, M.T.; Brakenridge, G.R.; Day, J.; Vörösmarty, C.; Saito, Y.; Giosan, L.; et al. Sinking Deltas Due to Human Activities. Nat. Geosci. 2009, 2, 681–686. [Google Scholar] [CrossRef]
- Wu, P.-C.; Wei, M.; D’Hondt, S. Subsidence in Coastal Cities Throughout the World Observed by InSAR. Geophys. Res. Lett. 2022, 49. [Google Scholar] [CrossRef]
- Clark, P.U.; Shakun, J.D.; Marcott, S.A.; Mix, A.C.; Eby, M.; Kulp, S.; Levermann, A.; Milne, G.A.; Pfister, P.L.; Santer, B.D.; et al. Consequences of Twenty-First-Century Policy for Multi-Millennial Climate and Sea-Level Change. Nat. Clim. Change 2016, 6, 360–369. [Google Scholar] [CrossRef]
- Xu, D.; Bisht, G.; Feng, D.; Tan, Z.; Li, L.; Qiu, H.; Leung, L.R. Impacts of Sea-Level Rise on Coastal Groundwater Table Simulated by an Earth System Model With a Land-Ocean Coupling Scheme. Earths Future 2024, 12. [Google Scholar] [CrossRef]
- Intergovernmental Panel on Climate Change (IPCC) Sea Level Rise and Implications for Low-Lying Islands, Coasts and Communities. In The Ocean and Cryosphere in a Changing Climate: Special Report of the Intergovernmental Panel on Climate Change; Cambridge University Press, 2022; pp. 321–446.
- Carnero-Bravo, V.; Sanchez-Cabeza, J.-A.; Ruiz-Fernández, A.C.; Merino-Ibarra, M.; Corcho-Alvarado, J.A.; Sahli, H.; Hélie, J.-F.; Preda, M.; Zavala-Hidalgo, J.; Díaz-Asencio, M.; et al. Sea Level Rise Sedimentary Record and Organic Carbon Fluxes in a Low-Lying Tropical Coastal Ecosystem. CATENA 2018, 162, 421–430. [Google Scholar] [CrossRef]
- Nicholls, R. Planning for the Impacts of Sea Level Rise. Oceanography 2011, 24, 144–157. [Google Scholar] [CrossRef]
- Avornyo, S.Y.; Addo, K.A.; Teatini, P.; Minderhoud, P.; Woillez, M.-N.; Jayson-Quashigah, P.-N.; Mahu, E. A Scoping Review of Coastal Vulnerability, Subsidence and Sea Level Rise in Ghana: Assessments, Knowledge Gaps and Management Implications. Quat. Sci. Adv. 2023, 12, 100108. [Google Scholar] [CrossRef]
- Hauser, L.; Boni, R.; Minderhoud, P.-S.-J.; Teatini, P.; Woillez, M.-N.; Almar, R.; Avornyo, S.Y.; Addo, K.A. A Scoping Study on Coastal Vulnerability to Relative Sea-Level Rise in the Gulf of Guinea; Éditions AFD, 2023. [Google Scholar]
- Appeaning Addo, K. Assessing Coastal Vulnerability Index to Climate Change: The Case of Accra – Ghana. J. Coast. Res. 2013, 165, 1892–1897. [Google Scholar] [CrossRef]
- Nicholls, R.J.; Tol, R.S.J. Impacts and Responses to Sea-Level Rise: A Global Analysis of the SRES Scenarios over the Twenty-First Century. Philos. Trans. R. Soc. Math. Phys. Eng. Sci. 2006, 364, 1073–1095. [Google Scholar] [CrossRef] [PubMed]
- Dada, O.A.; Almar, R.; Morand, P. Coastal Vulnerability Assessment of the West African Coast to Flooding and Erosion. Sci. Rep. 2024, 14, 890. [Google Scholar] [CrossRef] [PubMed]
- Nyadzi, E.; Bessah, E.; Kranjac-Berisavljevic, G. Taking Stock of Climate Change Induced Sea Level Rise across the West African Coast. Environ. Claims J. 2021, 33, 77–90. [Google Scholar] [CrossRef]
- Bonì, R.; Minderhoud, P.S.J.; Addo, K.A.; Avornyo, S.Y.; Hauser, L.T.; Ikuemonisan, F.E.; Woillez, M.-N.; Canesi, M.; Wade, C.T.; Almar, R.; et al. Sixty Years of Research on Land Subsidence and Sea-Level Change: A Systematic Review of Global Literature with a Regional Lens on the Gulf of Guinea, Africa. Land 2026, 15, 721. [Google Scholar] [CrossRef]
- Chaussard, E.; Amelung, F.; Abidin, H.; Hong, S.-H. Sinking Cities in Indonesia: ALOS PALSAR Detects Rapid Subsidence Due to Groundwater and Gas Extraction. Remote Sens. Environ. 2013, 128, 150–161. [Google Scholar] [CrossRef]
- Gambolati, G.; Teatini, P. Geomechanics of Subsurface Water Withdrawal and Injection. Water Resour. Res. 2015, 51, 3922–3955. [Google Scholar] [CrossRef]
- Shirzaei, M.; Bürgmann, R. Global Climate Change and Local Land Subsidence Exacerbate Inundation Risk to the San Francisco Bay Area. Sci. Adv. 2018, 4. [Google Scholar] [CrossRef] [PubMed]
- Fowler, A.; Ng, F. Glaciers and Ice Sheets in the Climate System; Springer International Publishing, 2021; ISBN 978-3-030-42582-1. [Google Scholar]
- Koster, K.; Stafleu, J.; Cohen, K.M.; Stouthamer, E.; Busschers, F.S.; Middelkoop, H. Three-Dimensional Distribution of Organic Matter in Coastal-Deltaic Peat: Implications for Subsidence and Carbon Dioxide Emissions by Human-Induced Peat Oxidation. Anthropocene 2018, 22, 1–9. [Google Scholar] [CrossRef]
- Stouthamer, E.; Asselen, S. van Drivers of Delta Subsidence. In Proceedings of the Abstract from 36th IAHR World Congress on Deltas of the Future, 2015. [Google Scholar]
- Bukvic, A.; Rohat, G.; Apotsos, A.; Sherbinin, A. de A Systematic Review of Coastal Vulnerability Mapping. Sustainability 2020, 12, 2822. [Google Scholar] [CrossRef]
- Boateng, I.; Wiafe, G.; Jayson-Quashigah, P.-N. Mapping Vulnerability and Risk of Ghana’s Coastline to Sea Level Rise. Mar. Geod. 2017, 40, 23–39. [Google Scholar] [CrossRef]
- Theocharidis, C.; Doukanari, M.; Kalogirou, E.; Christofi, D.; Mettas, C.; Kontoes, C.; Hadjimitsis, D.; Argyriou, A.V.; Eliades, M. Coastal Vulnerability Index (CVI) Assessment: Evaluating Risks Associated with Human-Made Activities along the Limassol Coastline, Cyprus. Remote Sens. 2024, 16, 3688. [Google Scholar] [CrossRef]
- Babanawo, D.; Mattah, P.A.D.; Agblorti, S.K.M.; Brempong, E.K.; Mattah, M.M.; Aheto, D.W. Local Indicator-Based Flood Vulnerability Indices and Predictors of Relocation in the Ketu South Municipal Area of Ghana. Sustainability 2022, 14, 5698. [Google Scholar] [CrossRef]
- Torresan, S.; Critto, A.; Rizzi, J.; Zabeo, A.; Furlan, E.; Marcomini, A. DESYCO: A Decision Support System for the Regional Risk Assessment of Climate Change Impacts in Coastal Zones. Ocean Coast. Manag. 2016, 120, 49–63. [Google Scholar] [CrossRef]
- Hinkel, J.; Klein, R.J.T. Integrating Knowledge to Assess Coastal Vulnerability to Sea-Level Rise: The Development of the DIVA Tool. Glob. Environ. Change 2009, 19, 384–395. [Google Scholar] [CrossRef]
- Ružić, I.; Jovančević, S.D.; Benac, Č.; Krvavica, N. Assessment of the Coastal Vulnerability Index in an Area of Complex Geological Conditions on the Krk Island, Northeast Adriatic Sea. Geosciences 2019, 9, 219. [Google Scholar] [CrossRef]
- Beattie, A.; Ahmed, M.; Chu, T.; Gebremichael, E.; Elshalkany, M.; Abdelrehim, R. Temporal Gravimetry, Campaign and Permanent GNSS, and Interferometric Radar Techniques: A Comparative Approach to Quantifying Land Deformation Rates in Coastal Texas. Sci. Total Environ. 2024, 956, 177280. [Google Scholar] [CrossRef] [PubMed]
- Fabris, M.; Battaglia, M.; Chen, X.; Menin, A.; Monego, M.; Floris, M. An Integrated InSAR and GNSS Approach to Monitor Land Subsidence in the Po River Delta (Italy). Remote Sens. 2022, 14, 5578. [Google Scholar] [CrossRef]
- Rossi, G. L’érosion Du Littoral Dans Le Golfe Du Bénin: Un Exemple de Perturbation d’un Équilibre Morphodynamique. Z. Geomorphol. 1989, 73, 139–165. [Google Scholar] [CrossRef]
- Jayson-Quashigah, P.-N.; Addo, K.A.; Kodzo, K.S. Medium Resolution Satellite Imagery as a Tool for Monitoring Shoreline Change. Case Study of the Eastern Coast of Ghana. J. Coast. Res. 2013, 65, 511–516. [Google Scholar] [CrossRef]
- Kumapley, N.K. The Geology and Geotechnology of the Keta Basin with Particular Reference to Coastal Protection. In Coastal Lowlands; Springer Netherlands, 1989; pp. 311–320. [Google Scholar] [CrossRef]
- Jayson-Quashigah, P.-N.; Addo, K.A.; Amisigo, B.; Wiafe, G. Assessment of Short-Term Beach Sediment Change in the Volta Delta Coast in Ghana Using Data from Unmanned Aerial Vehicles (Drone). Ocean Coast. Manag. 2019, 182, 104952. [Google Scholar] [CrossRef]
- Appeaning Addo, K.; Nicholls, R.J.; Codjoe, S.N.A.; Abu, M. A Biophysical and Socioeconomic Review of the Volta Delta, Ghana. J. Coast. Res. 2018, 345, 1216–1226. [Google Scholar] [CrossRef]
- Husnayaen; Rimba, A.B.; Osawa, T.; Parwata, I.N.S.; As-syakur, A.R.; Kasim, F.; Astarini, I.A. Physical Assessment of Coastal Vulnerability under Enhanced Land Subsidence in Semarang, Indonesia, Using Multi-Sensor Satellite Data. Adv. Space Res. 2018, 61, 2159–2179. [Google Scholar] [CrossRef]
- Gornitz, V. Global Coastal Hazards from Future Sea Level Rise. Palaeogeogr. Palaeoclimatol. Palaeoecol. 1991, 89, 379–398. [Google Scholar] [CrossRef]
- Thieler, E.R.; Hammar-Klose, E.S. National Assessment of Coastal Vulnerability to Sea-Level Rise: Preliminary Results for the U.S. Pacific Coast; 2000. [Google Scholar] [CrossRef]
- Fox-Kemper, B.; Hewitt, H.; Xiao, C.; Aðalgeirsdóttir, G.; Drijfhout, S.; Edwards, T.; Golledge, N.; Hemer, M.; Kopp, R.; Krinner, G.; et al. Ocean, Cryosphere and Sea Level Change. In Climate Change 2021 – The Physical Science Basis; Cambridge University Press, 2021; pp. 1211–1362. [Google Scholar] [CrossRef]
- Kopp, R.E.; Garner, G.G.; Hermans, T.H.J.; Jha, S.; Kumar, P.; Reedy, A.; Slangen, A.B.A.; Turilli, M.; Edwards, T.L.; Gregory, J.M.; et al. The Framework for Assessing Changes To Sea-Level (FACTS) v1.0: A Platform for Characterizing Parametric and Structural Uncertainty in Future Global, Relative, and Extreme Sea-Level Change. Geosci. Model Dev. 2023, 16, 7461–7489. [Google Scholar] [CrossRef]
- Garner, G.G.; Hermans, T.; Kopp, R.E.; Slangen, A.B.A.; Edwards, T.L.; Levermann, A.; Nowicki, S.; Palmer, M.D.; Smith, C.; Fox-Kemper, B.; et al. IPCC AR6 Sea Level Projections 2021. Dataset, Version 20210809. 2021; (accessed on 2026-03-25). [CrossRef]
- Athanasiou, P.; Van Dongeren, A.; Pronk, M.; Giardino, A.; Vousdoukas, M.; Ranasinghe, R. Global Coastal Characteristics (GCC): A Global Dataset of Geophysical, Hydrodynamic, and Socioeconomic Coastal Indicators. Earth Syst. Sci. Data 2024, 16, 3433–3452. [Google Scholar] [CrossRef]
- Pronk, M.; Hooijer, A.; Eilander, D.; Haag, A.; De Jong, T.; Vousdoukas, M.; Vernimmen, R.; Ledoux, H.; Eleveld, M. DeltaDTM: A Global Coastal Digital Terrain Model. Sci. Data 2024, 11, 273. [Google Scholar] [CrossRef] [PubMed]
- Geological Survey Authority, Accra, Ghana (GSA); Bundesanstalt für Geowissenschaften und Rohstoffe (BGR) Geological Map of Ghana 2009.
- Giardino, A.; Schrijvershof, R.; Nederhoff, C.M.; de Vroeg, H.; Brière, C.; Tonnon, P.K.; Caires, S.; Walstra, D.J.; Sosa, J.; van Verseveld, W.; et al. A Quantitative Assessment of Human Interventions and Climate Change on the West African Sediment Budget. Ocean Coast. Manag. 2018, 156, 249–265. [Google Scholar] [CrossRef]
- Karra, K.; Kontgis, C.; Statman-Weil, Z.; Mazzariello, J.C.; Mathis, M.; Brumby, S.P. Global Land Use / Land Cover with Sentinel 2 and Deep Learning. In Proceedings of the 2021 IEEE International Geoscience and Remote Sensing Symposium IGARSS; IEEE, July 2021; pp. 4704–4707. [Google Scholar]
- Delgado Blasco, J.M.; Ziemer, J.; Foumelis, M.; Dubois, C. SNAP2StaMPS v2: Increasing Features and Supported Sensors in the Open Source SNAP2StaMPS Processing Scheme 2023.
- Bekaert, D.P.S.; Walters, R.J.; Wright, T.J.; Hooper, A.J.; Parker, D.J. Statistical Comparison of InSAR Tropospheric Correction Techniques. Remote Sens. Environ. 2015, 170, 40–47. [Google Scholar] [CrossRef]
- Noor, N.M.; Maulud, K.N.A. Coastal Vulnerability: A Brief Review on Integrated Assessment in Southeast Asia. J. Mar. Sci. Eng. 2022, 10, 595. [Google Scholar] [CrossRef]
- Thieler, E.R.; Himmelstoss, E.A.; Zichichi, J.L.; Ergul, A. The Digital Shoreline Analysis System (DSAS) Version 4.0 - An ArcGIS Extension for Calculating Shoreline Change. 2009. [Google Scholar] [CrossRef]
- Koroglu, A.; Ranasinghe, R.; Jiménez, J.A.; Dastgheib, A. Comparison of Coastal Vulnerability Index Applications for Barcelona Province. Ocean Coast. Manag. 2019, 178, 104799. [Google Scholar] [CrossRef]
- Rao, K.N.; Subraelu, P.; Rao, T.V.; Malini, B.H.; Ratheesh, R.; Bhattacharya, S.; Rajawat, A.S. Ajai Sea-Level Rise and Coastal Vulnerability: An Assessment of Andhra Pradesh Coast, India through Remote Sensing and GIS. J. Coast. Conserv. 2008, 12, 195–207. [Google Scholar] [CrossRef]
- Athanasiou, P.; van Dongeren, A.; Giardino, A.; Vousdoukas, M.; Gaytan-Aguilar, S.; Ranasinghe, R. Global Distribution of Nearshore Slopes with Implications for Coastal Retreat. Earth Syst. Sci. Data 2019, 11, 1515–1529. [Google Scholar] [CrossRef]
- Thieler, E.R.; Hammar-Klose, S. National Assessment of Coastal Vulnerability to Sea-Level Rise: Preliminary Results for the U.S. Atlantic Coast, U.S; Geological Survey Open-File Report 99-593; Woods Hole, 1999. [Google Scholar]
- Gornitz, V.M.; Daniels, R.C.; White, T.W.; Birdwell, K.R. The Development of a Coastal Risk Assessment Database: Vulnerability to Sea-Level Rise in the U.S. Southeast. Coast. Res. 1994, 327–338. [Google Scholar]
- Gornitz, V.; Kanciruk, P. Assessment of Global Coastal Hazards from Sea Level Rise. In Proceedings of the In: Coastal Zone 89, Proc. 6th Syrup. Coastal and Ocean Management/ASCE, 1989; pp. 1345–1359. [Google Scholar]
- Oloyede, M.O.; Williams, A.B.; Ode, G.O.; Benson, N.U. Coastal Vulnerability Assessment: A Case Study of the Nigerian Coastline. Sustainability 2022, 14, 2097. [Google Scholar] [CrossRef]
- Diez, P.G.; Perillo, G.M.E.; Piccolo, M.C. Vulnerability to Sea-Level Rise on the Coast of the Buenos Aires Province. J. Coast. Res. 2007, 231, 119–126. [Google Scholar] [CrossRef]
- Pendleton, E.A.; Barras, J.A.; Williams, S.J.; Twichell, D.C. Coastal Vulnerability Assessment of the Northern Gulf of Mexico to Sea-Level Rise and Coastal Change; 2010. [Google Scholar]
- Mahapatra, M.; Ramakrishnan, R.; Rajawat, A.S. Coastal Vulnerability Assessment of Gujarat Coast to Sea Level Rise Using GIS Techniques: A Preliminary Study. J. Coast. Conserv. 2015, 19, 241–256. [Google Scholar] [CrossRef]
- Loginova, D.; Mann, S.; Hoidn, S.; Varvaris, I. Land-Use Change and Long-Term Socioeconomic Outcomes: Studying over Six Decades of Global Data (1960–2023). Land Use Policy 2026, 169, 108155. [Google Scholar] [CrossRef]
- Marques, A.; Martins, I.S.; Kastner, T.; Plutzar, C.; Theurl, M.C.; Eisenmenger, N.; Huijbregts, M.A.J.; Wood, R.; Stadler, K.; Bruckner, M.; et al. Increasing Impacts of Land Use on Biodiversity and Carbon Sequestration Driven by Population and Economic Growth. Nat. Ecol. Evol. 2019, 3, 628–637. [Google Scholar] [CrossRef] [PubMed]
- Simkin, R.D.; Seto, K.C.; McDonald, R.I.; Jetz, W. Biodiversity Impacts and Conservation Implications of Urban Land Expansion Projected to 2050. Proc. Natl. Acad. Sci. 2022, 119, e2117297119. [Google Scholar] [CrossRef] [PubMed]
- Tanim, A.H.; Goharian, E.; Moradkhani, H. Integrated Socio-Environmental Vulnerability Assessment of Coastal Hazards Using Data-Driven and Multi-Criteria Analysis Approaches. Sci. Rep. 2022, 12, 11625. [Google Scholar] [CrossRef] [PubMed]
- López Royo, M.; Ranasinghe, R.; Jiménez, J.A. A Rapid, Low-Cost Approach to Coastal Vulnerability Assessment at a National Level. J. Coast. Res. 2016, 320, 932–945. [Google Scholar] [CrossRef]
- Mclaughlin, S.; Cooper, J.A.G. A Multi-Scale Coastal Vulnerability Index: A Tool for Coastal Managers? Environ. Hazards 2010, 9, 233–248. [Google Scholar] [CrossRef]
- Gornitz, V. Vulnerability of the East Coast, U.S.A. to Future Sea Level Rise. J. Coast. Res. 1990, 201–237. [Google Scholar]
- Amenuvor, M.; Gao, W.; Li, D.; Shao, D. Effects of Dam Regulation on the Hydrological Alteration and Morphological Evolution of the Volta River Delta. Water 2020, 12, 646. [Google Scholar] [CrossRef]
- Boateng, I.; Bray, M.; Hooke, J. Estimating the Fluvial Sediment Input to the Coastal Sediment Budget: A Case Study of Ghana. Geomorphology 2012, 138, 100–110. [Google Scholar] [CrossRef]
- Fiadzigbey, M. The Story of Keta: The Land Factor. Volta. Monit. 2005, 20–22. [Google Scholar]
- Pontee, N. Defining Coastal Squeeze: A Discussion. Ocean Coast. Manag. 2013, 84, 204–207. [Google Scholar] [CrossRef]
- Doody, J.P. Coastal Squeeze and Managed Realignment in Southeast England, Does It Tell Us Anything about the Future? Ocean Coast. Manag. 2013, 79, 34–41. [Google Scholar] [CrossRef]
- Yidana, S.M.; Banoeng-Yakubo, B.; Akabzaa, T.M. Analysis of Groundwater Quality Using Multivariate and Spatial Analyses in the Keta Basin, Ghana. J. Afr. Earth Sci. 2010, 58, 220–234. [Google Scholar] [CrossRef]
Figure 1.
Map of the study area with the red elevation contour showing the landward delineation of the Volta Delta. The 72 contiguous grid cells (2 km x 2 km) were used in the segmentation and quantification of the CVI.
Figure 1.
Map of the study area with the red elevation contour showing the landward delineation of the Volta Delta. The 72 contiguous grid cells (2 km x 2 km) were used in the segmentation and quantification of the CVI.
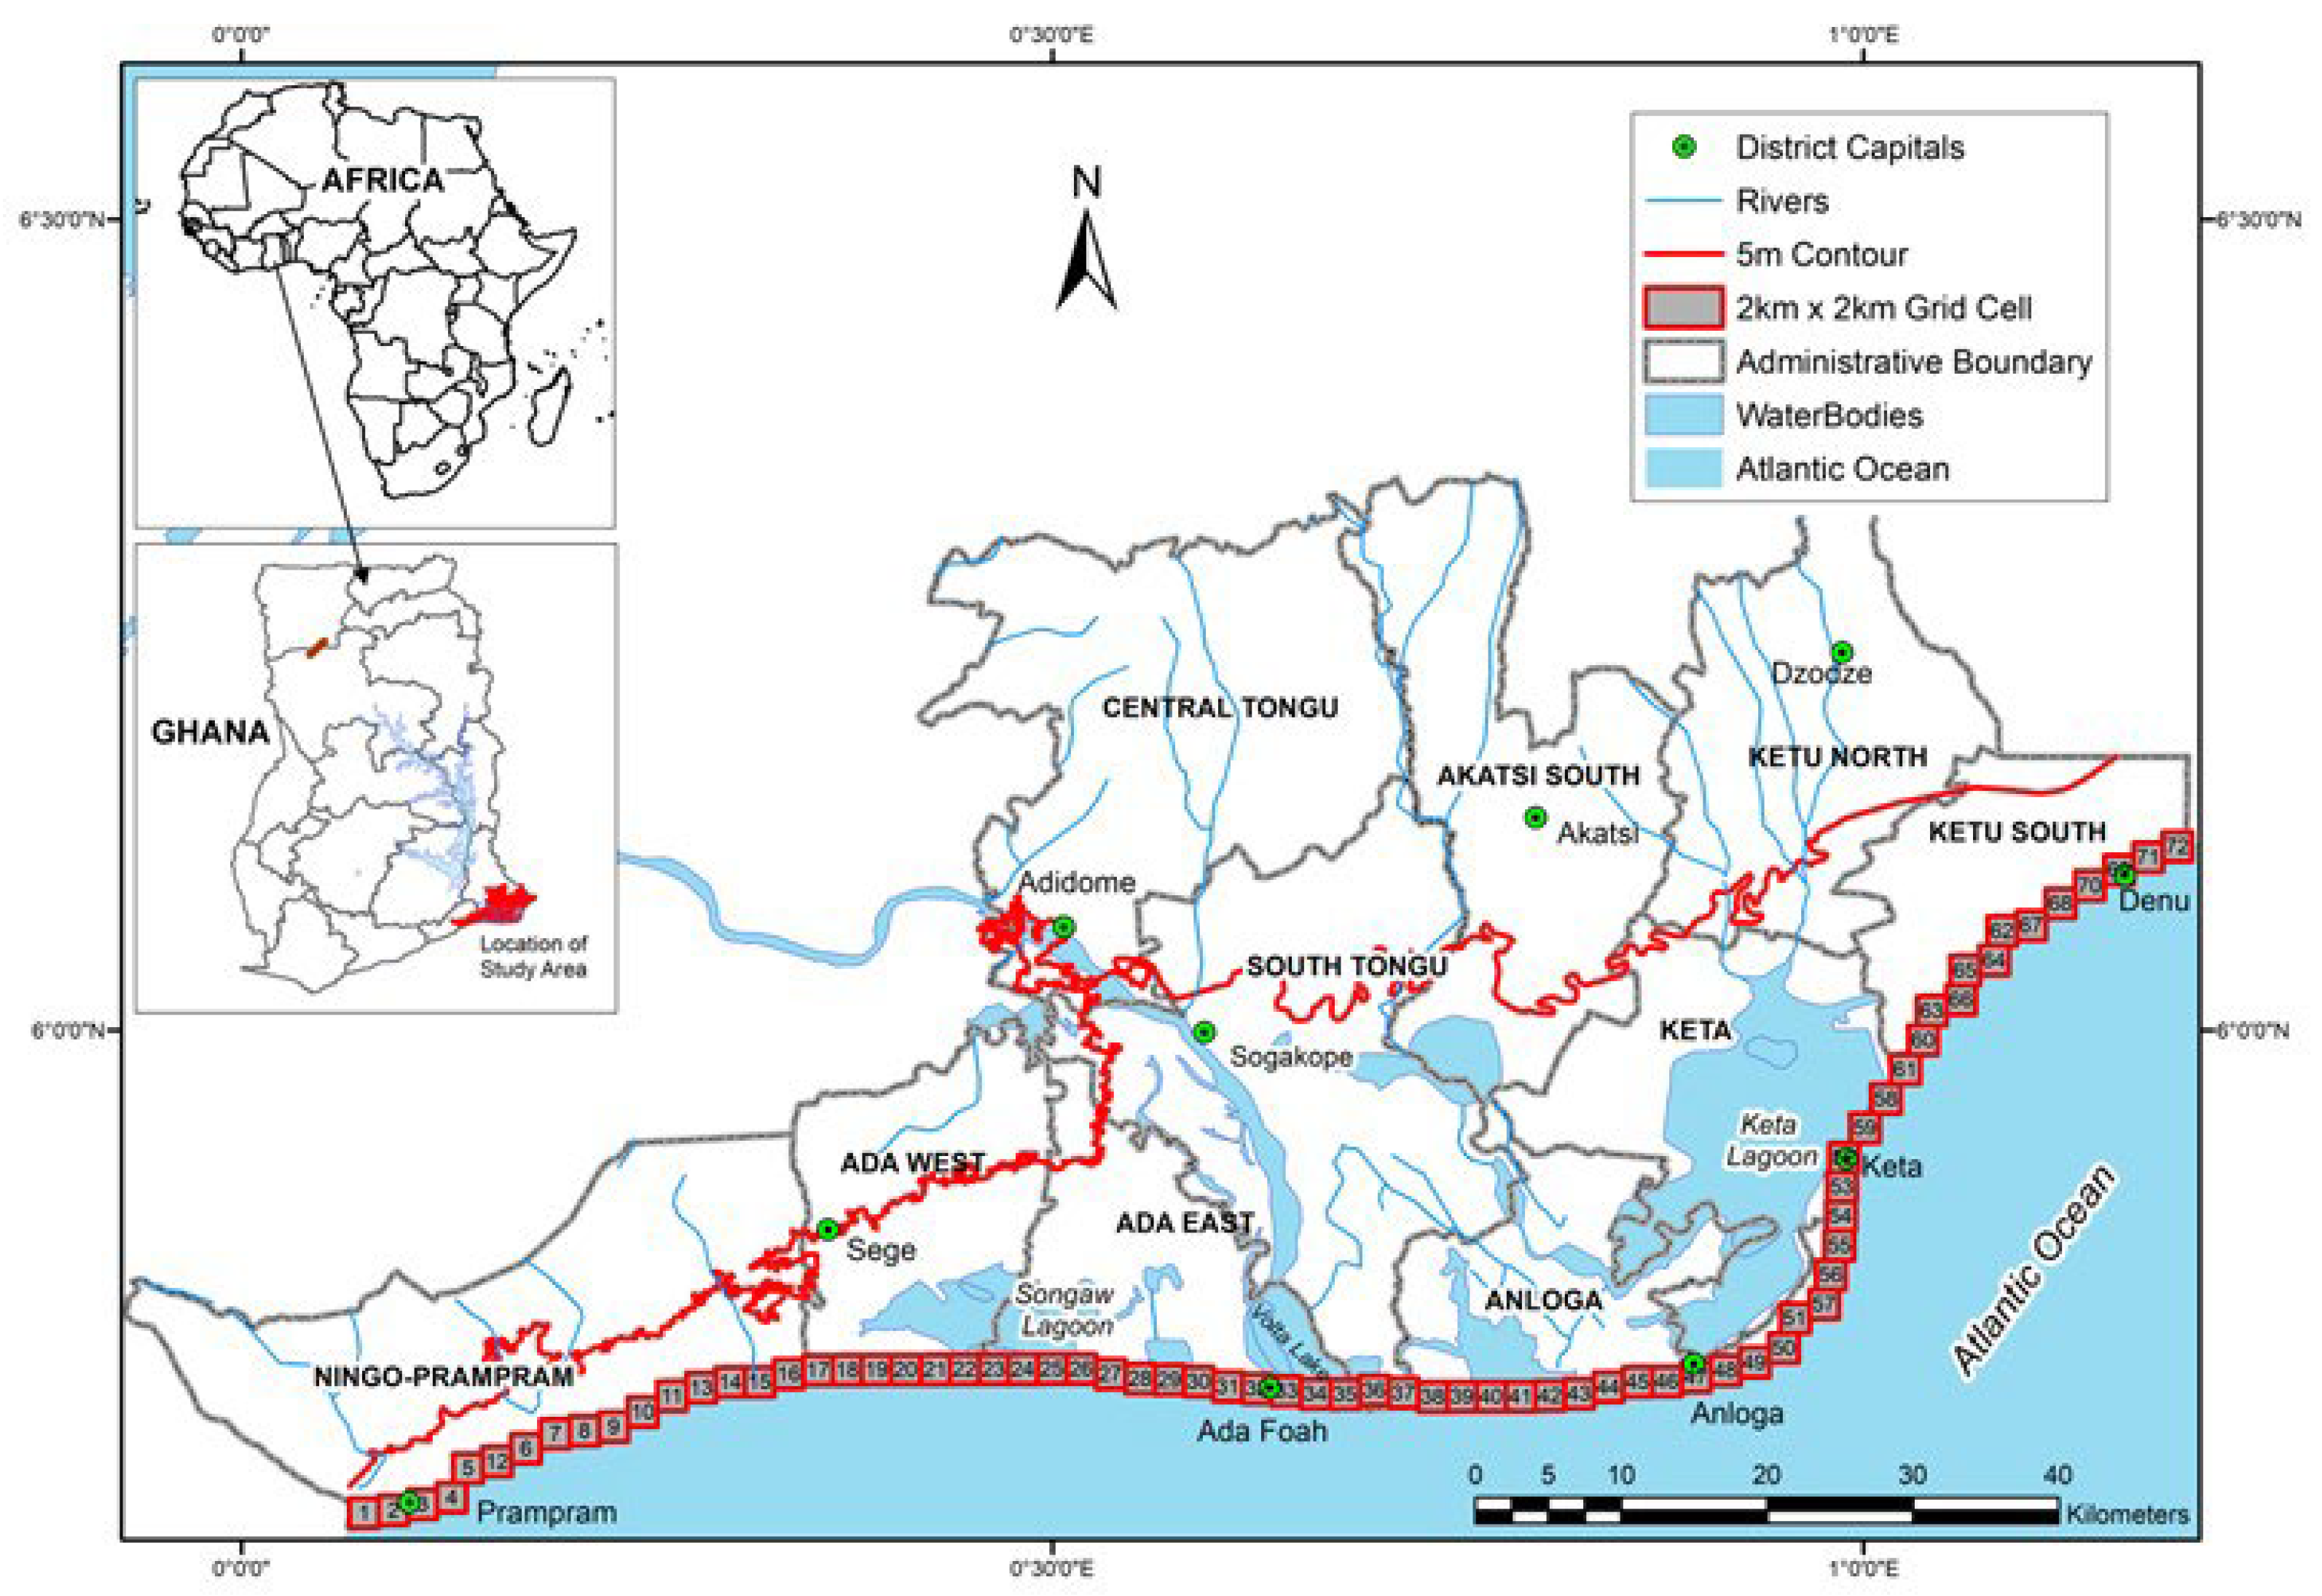
Figure 2.
Methodology workflow for the dual-scenario CVI assessment of the Volta Delta coastline, Ghana. CVI(+sub) incorporates PS-InSAR-derived subsidence rates as a ninth variable; CVI(-sub) excludes subsidence. Both indices are classified against a single combined quantile distribution to ensure direct comparability.
Figure 2.
Methodology workflow for the dual-scenario CVI assessment of the Volta Delta coastline, Ghana. CVI(+sub) incorporates PS-InSAR-derived subsidence rates as a ninth variable; CVI(-sub) excludes subsidence. Both indices are classified against a single combined quantile distribution to ensure direct comparability.
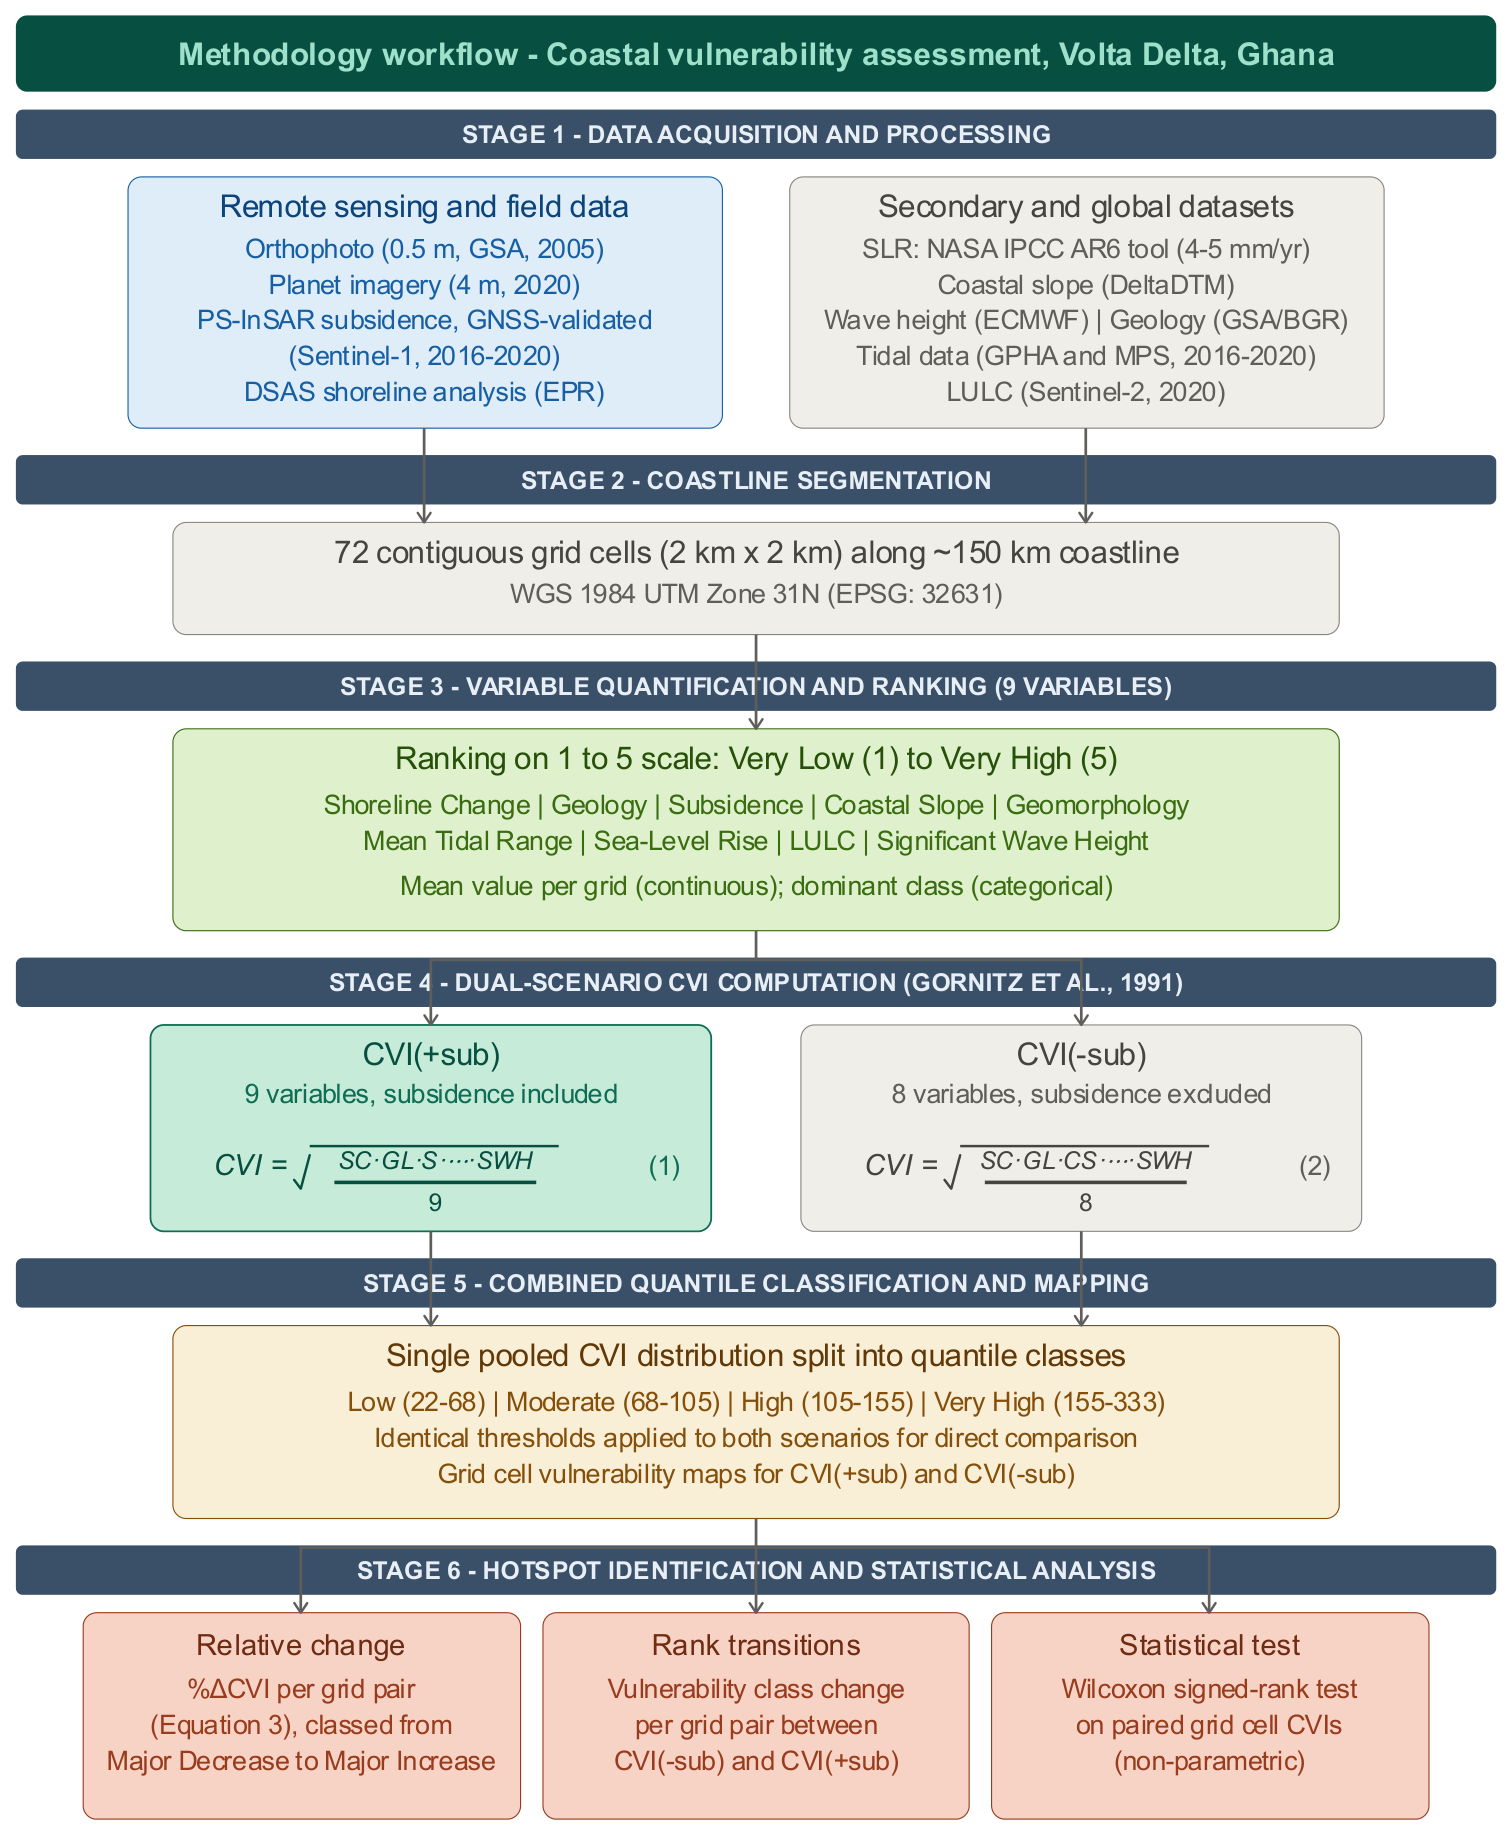
Figure 3.
Maps displaying the CVI input data’s range of values (continuous variables) or classes (categorical variables).
Figure 3.
Maps displaying the CVI input data’s range of values (continuous variables) or classes (categorical variables).
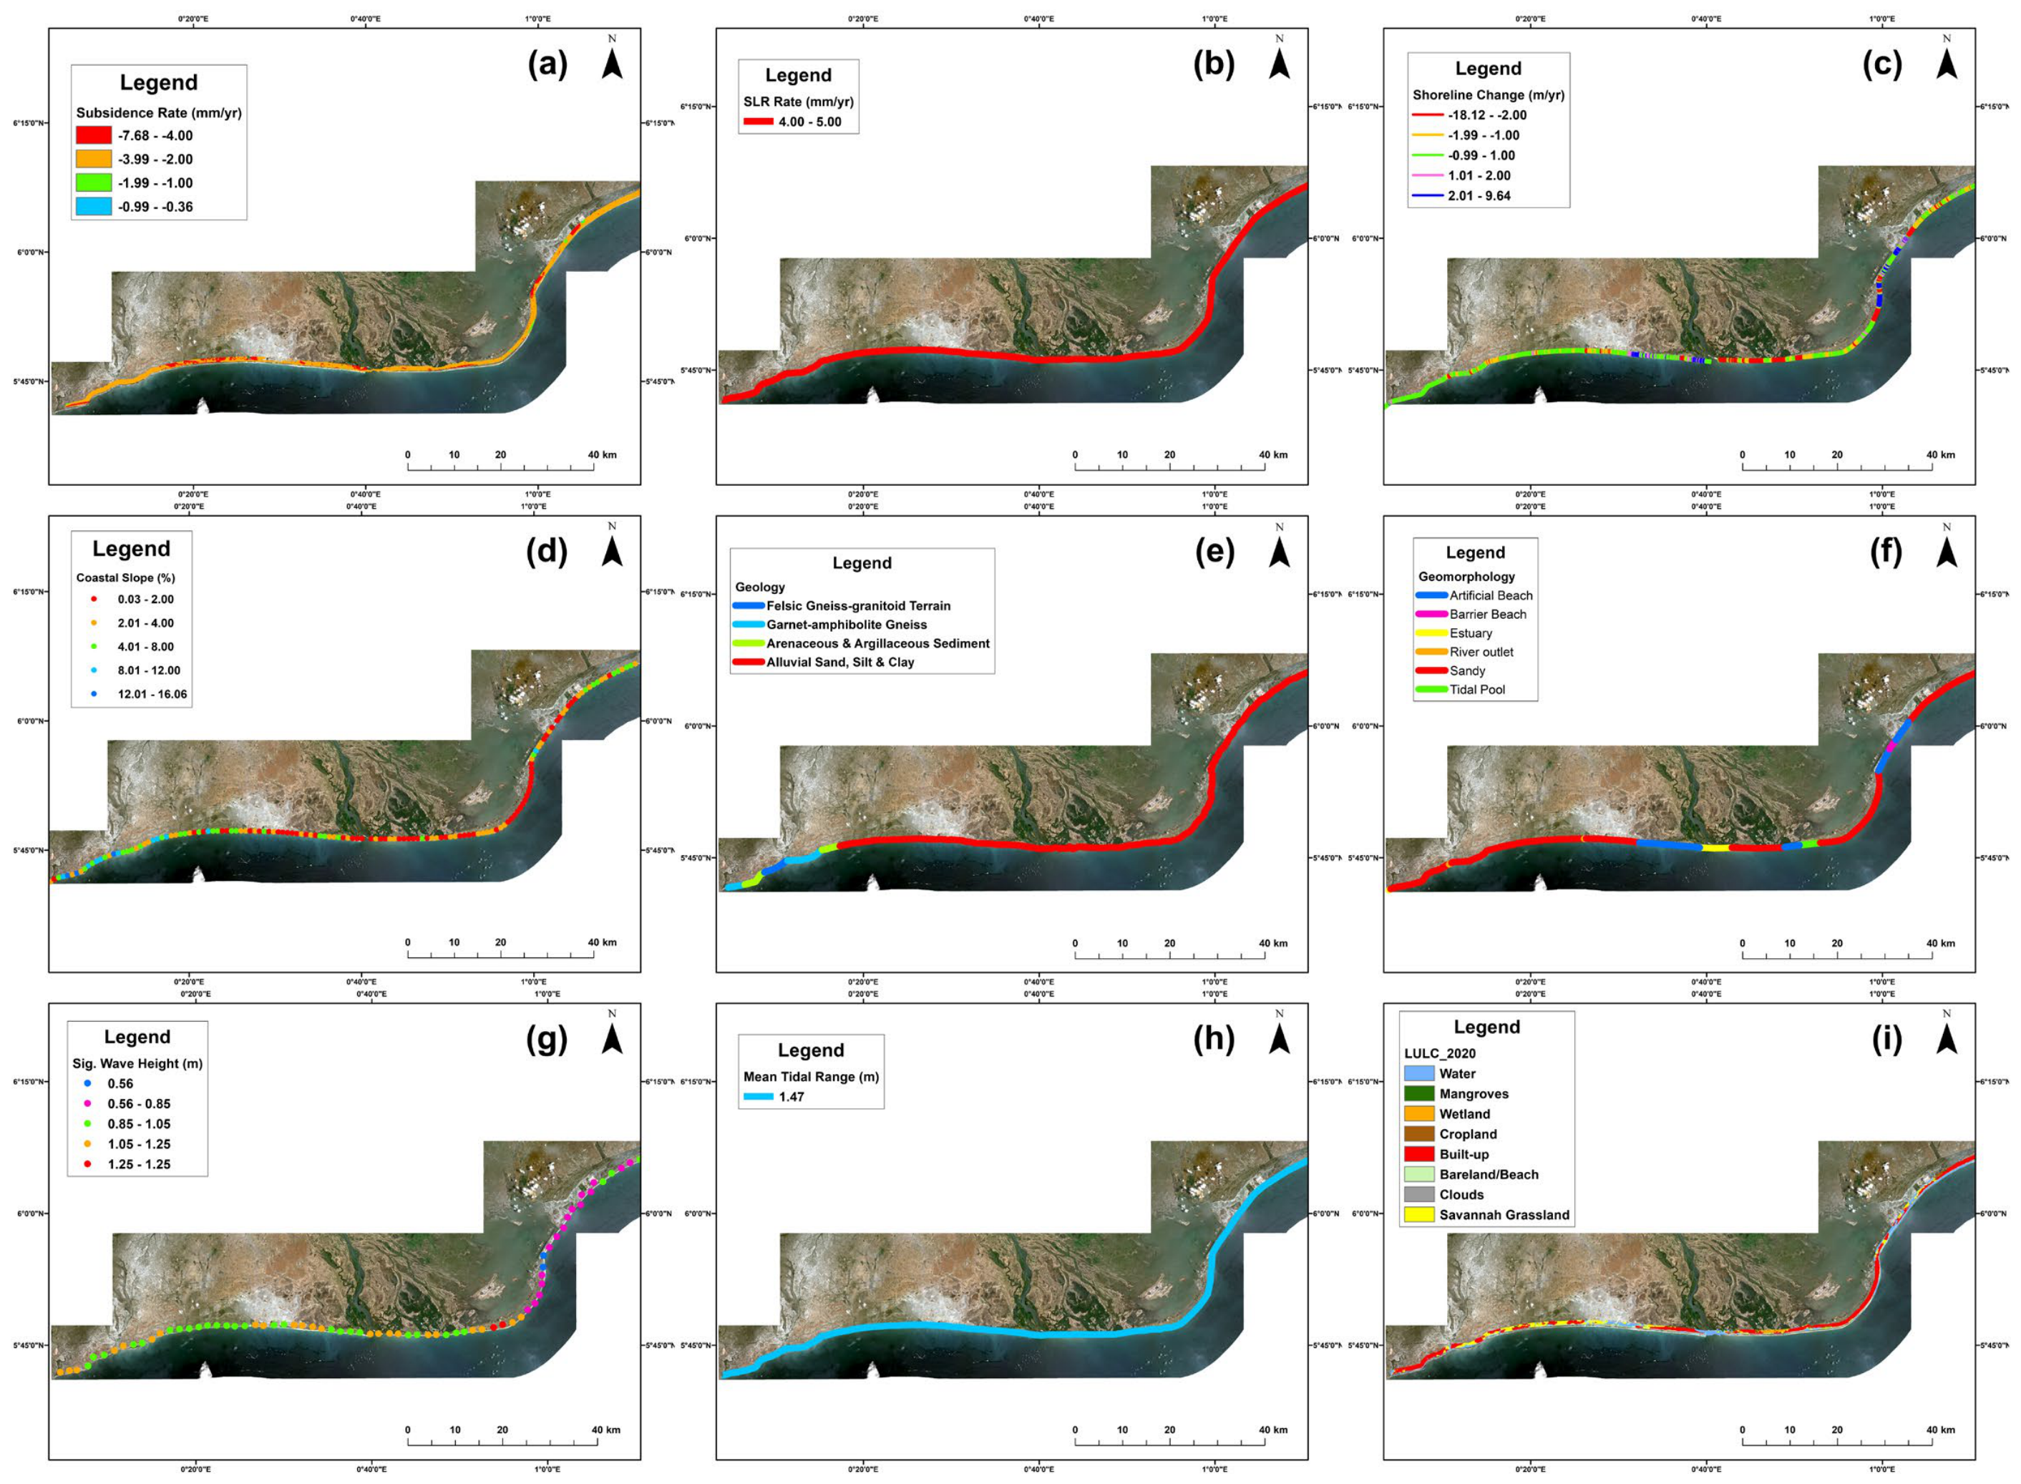
Figure 4.
A map showing the quantification and ranking of selected variables based on the 1 to 5 vulnerability scale, with the vulnerability rank ranging from one (1= very low vulnerability) to five (5 = very high vulnerability). The variables are SC = Shoreline Change; GL = Geology; S = Subsidence; CS = Coastal Slope; GM = Geomorphology; MTR = Mean Tidal Range; SLR = Sea-Level Rise; LULC = Land Use/ Land Cover; and SWH = Significant Wave Height.
Figure 4.
A map showing the quantification and ranking of selected variables based on the 1 to 5 vulnerability scale, with the vulnerability rank ranging from one (1= very low vulnerability) to five (5 = very high vulnerability). The variables are SC = Shoreline Change; GL = Geology; S = Subsidence; CS = Coastal Slope; GM = Geomorphology; MTR = Mean Tidal Range; SLR = Sea-Level Rise; LULC = Land Use/ Land Cover; and SWH = Significant Wave Height.
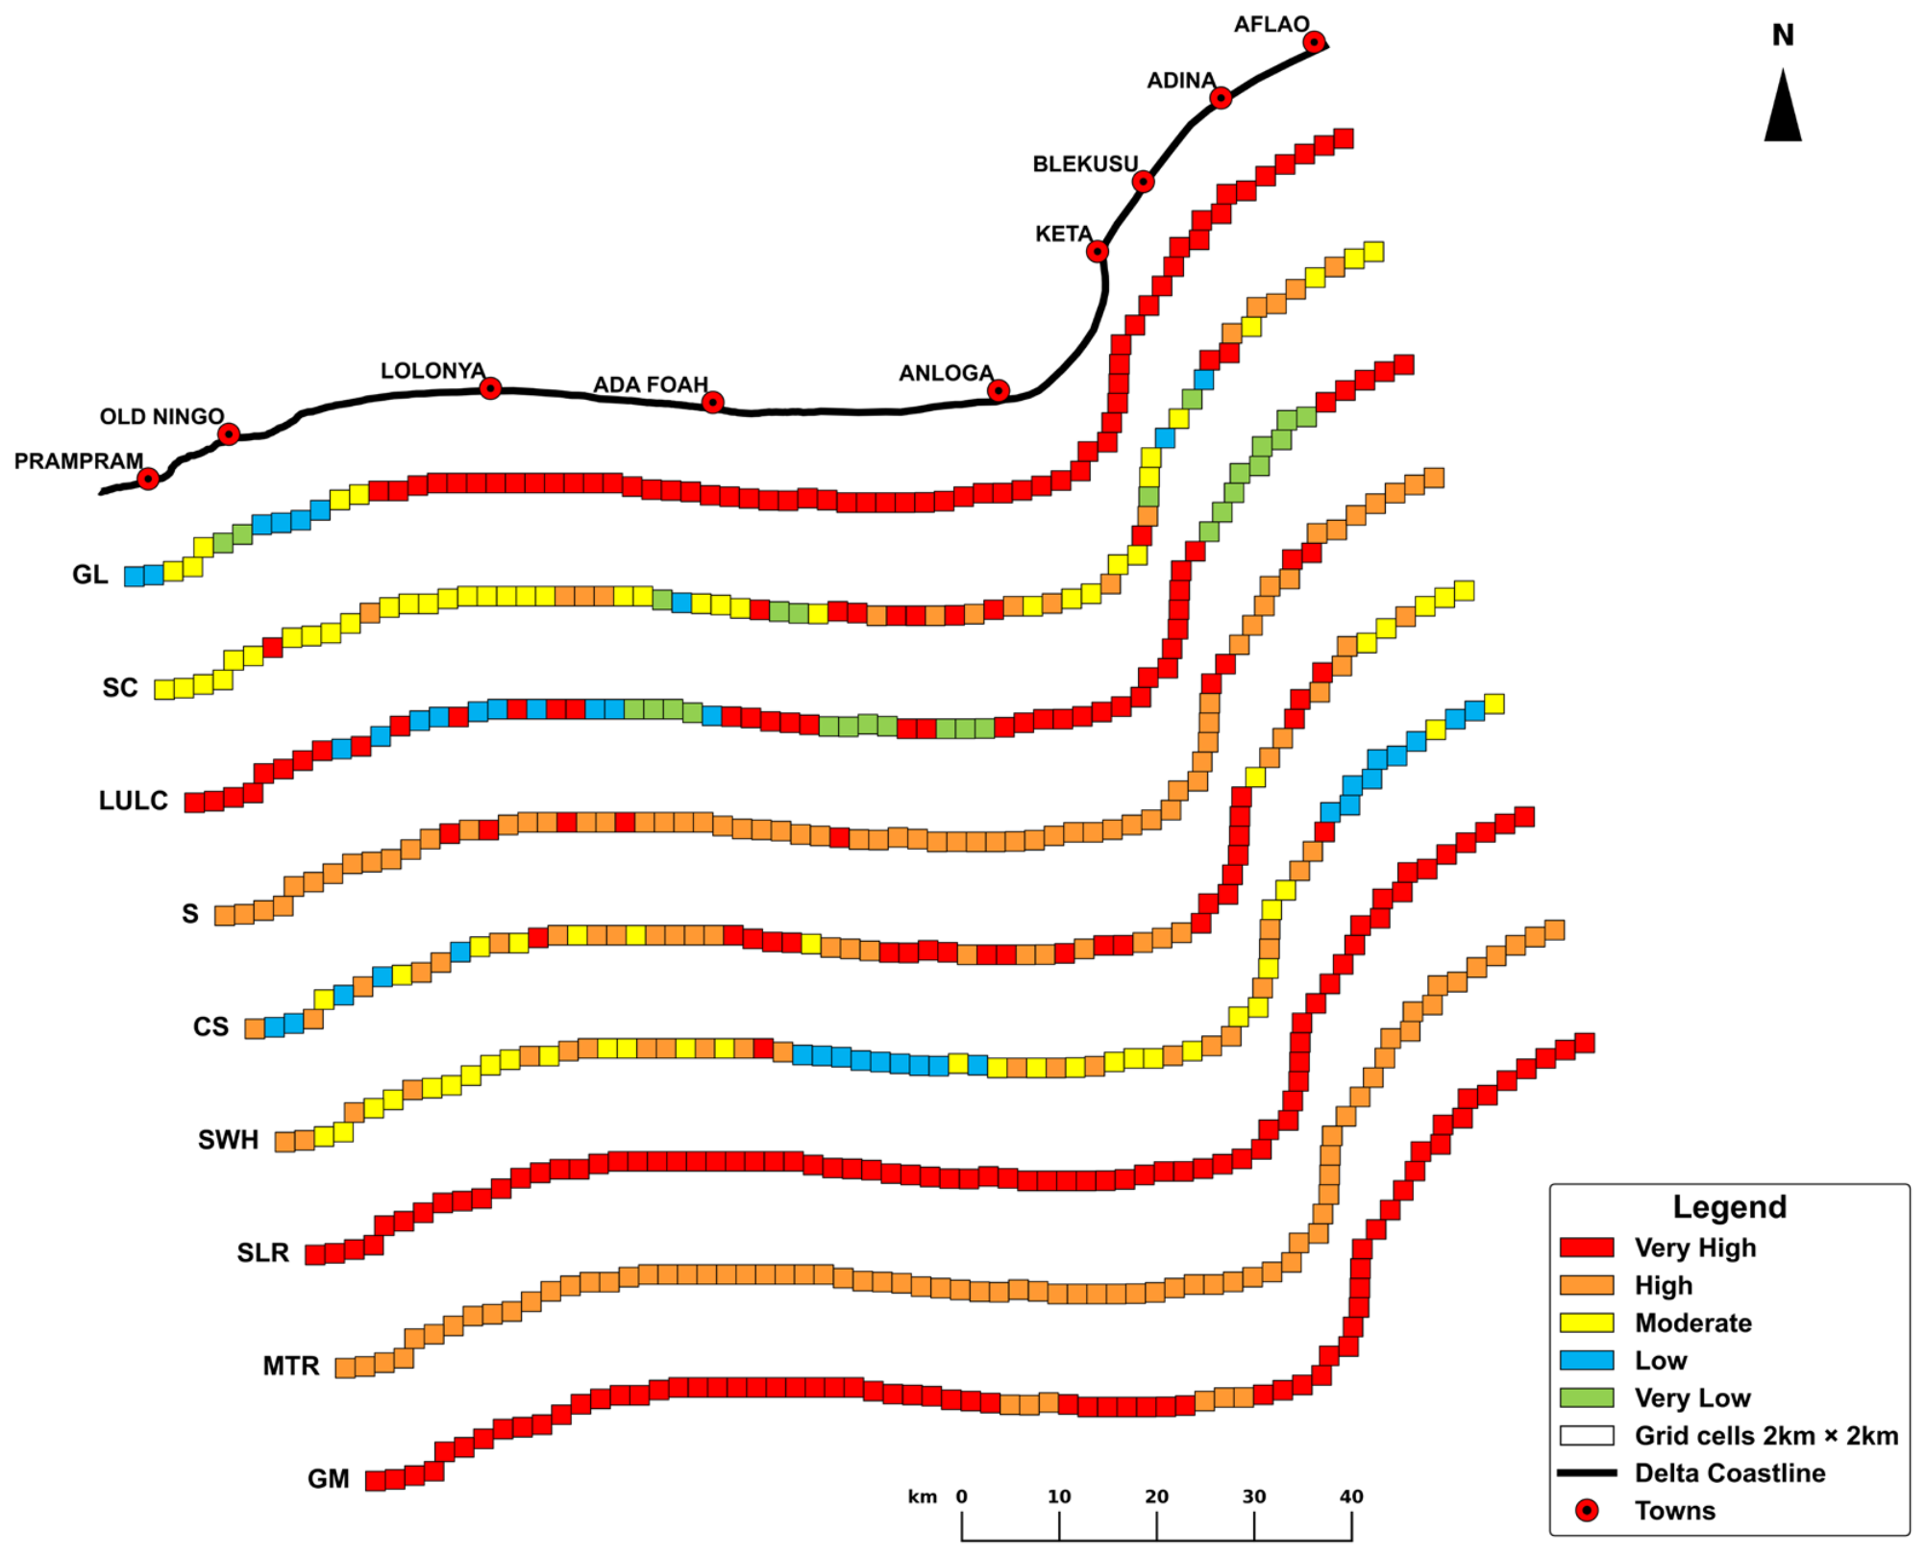
Figure 5.
A map showing the composite CVI ranking of the dual scenarios per grid, CVI(+sub) and CVI(-sub), based on the vulnerability rank, which ranged from Low Vulnerability to Very High Vulnerability. (B) A line plot showing the composite CVI estimations per grid cell for the dual scenarios and the quantile thresholds represented by the horizontal references for categorising the composite CVI ranking. (C) A line plot showing the relative change in CVI per grid when land subsidence is incorporated in CVI estimation. All relative changes in CVI values (%) per grid far exceed the major vulnerability increase threshold set at 50%.
Figure 5.
A map showing the composite CVI ranking of the dual scenarios per grid, CVI(+sub) and CVI(-sub), based on the vulnerability rank, which ranged from Low Vulnerability to Very High Vulnerability. (B) A line plot showing the composite CVI estimations per grid cell for the dual scenarios and the quantile thresholds represented by the horizontal references for categorising the composite CVI ranking. (C) A line plot showing the relative change in CVI per grid when land subsidence is incorporated in CVI estimation. All relative changes in CVI values (%) per grid far exceed the major vulnerability increase threshold set at 50%.
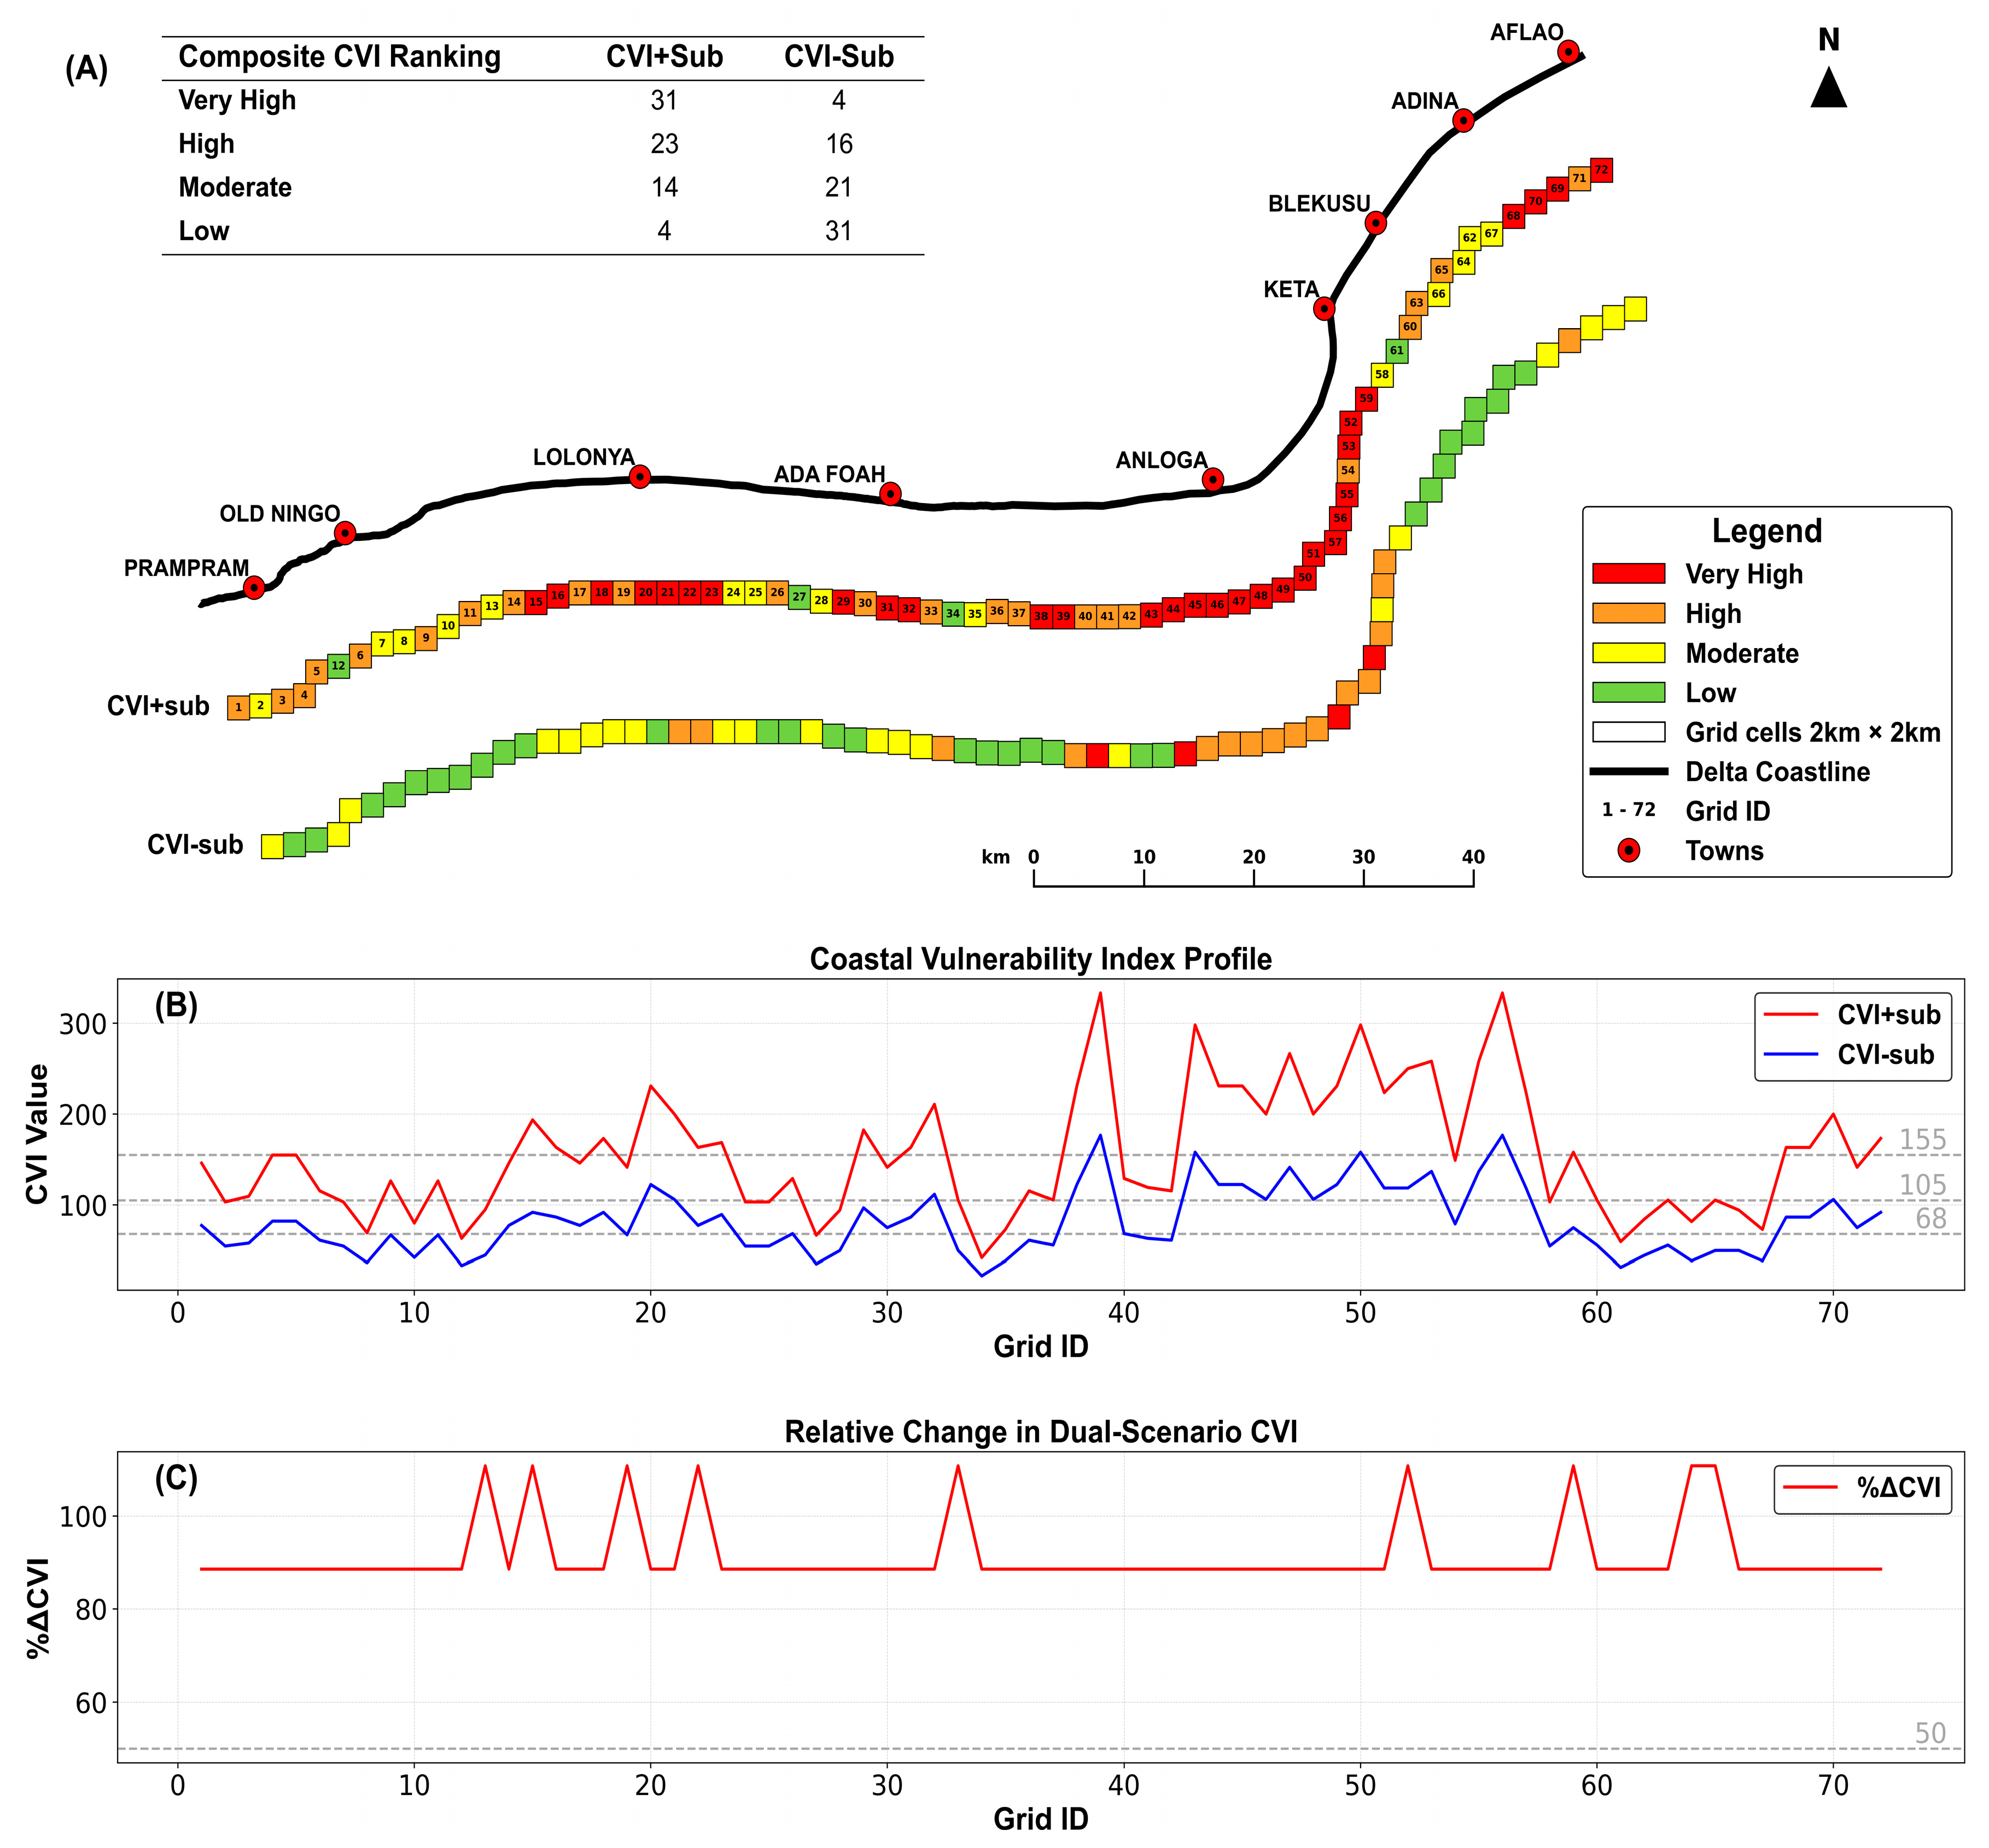
Figure 6.
A map showing the differences in vulnerability levels or classes due to the incorporation of land subsidence into CVI computation. It shows the vulnerability rank transition between CVI(+sub) and CVI(-sub) for each grid pair.
Figure 6.
A map showing the differences in vulnerability levels or classes due to the incorporation of land subsidence into CVI computation. It shows the vulnerability rank transition between CVI(+sub) and CVI(-sub) for each grid pair.
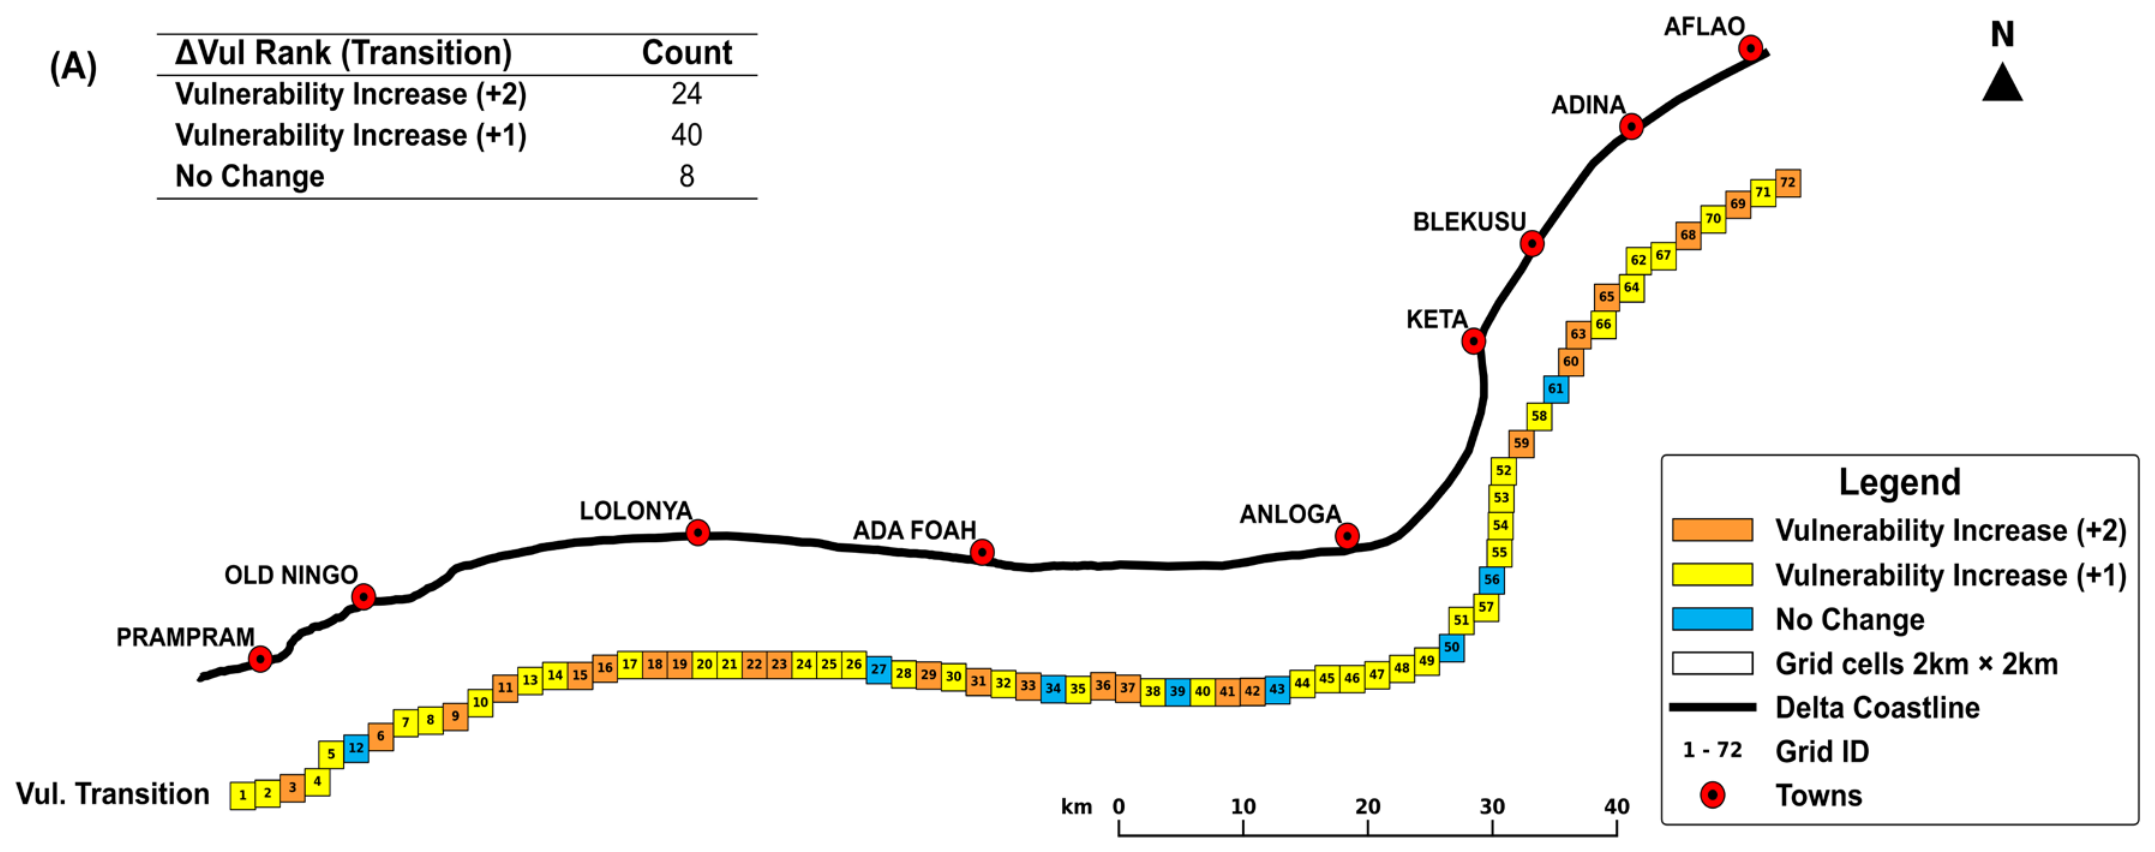
Figure 7.
(a) Coastal narrowing along the Volta Delta’s sand barrier, with forcings on both the seaward and landward boundaries (Photo Credit: Jayson-Quashigah, 2017). (b-d) Images showing destruction in coastal built-up areas due to coastal hazards (Photo credit: Adogla-Bessa, 2021).
Figure 7.
(a) Coastal narrowing along the Volta Delta’s sand barrier, with forcings on both the seaward and landward boundaries (Photo Credit: Jayson-Quashigah, 2017). (b-d) Images showing destruction in coastal built-up areas due to coastal hazards (Photo credit: Adogla-Bessa, 2021).
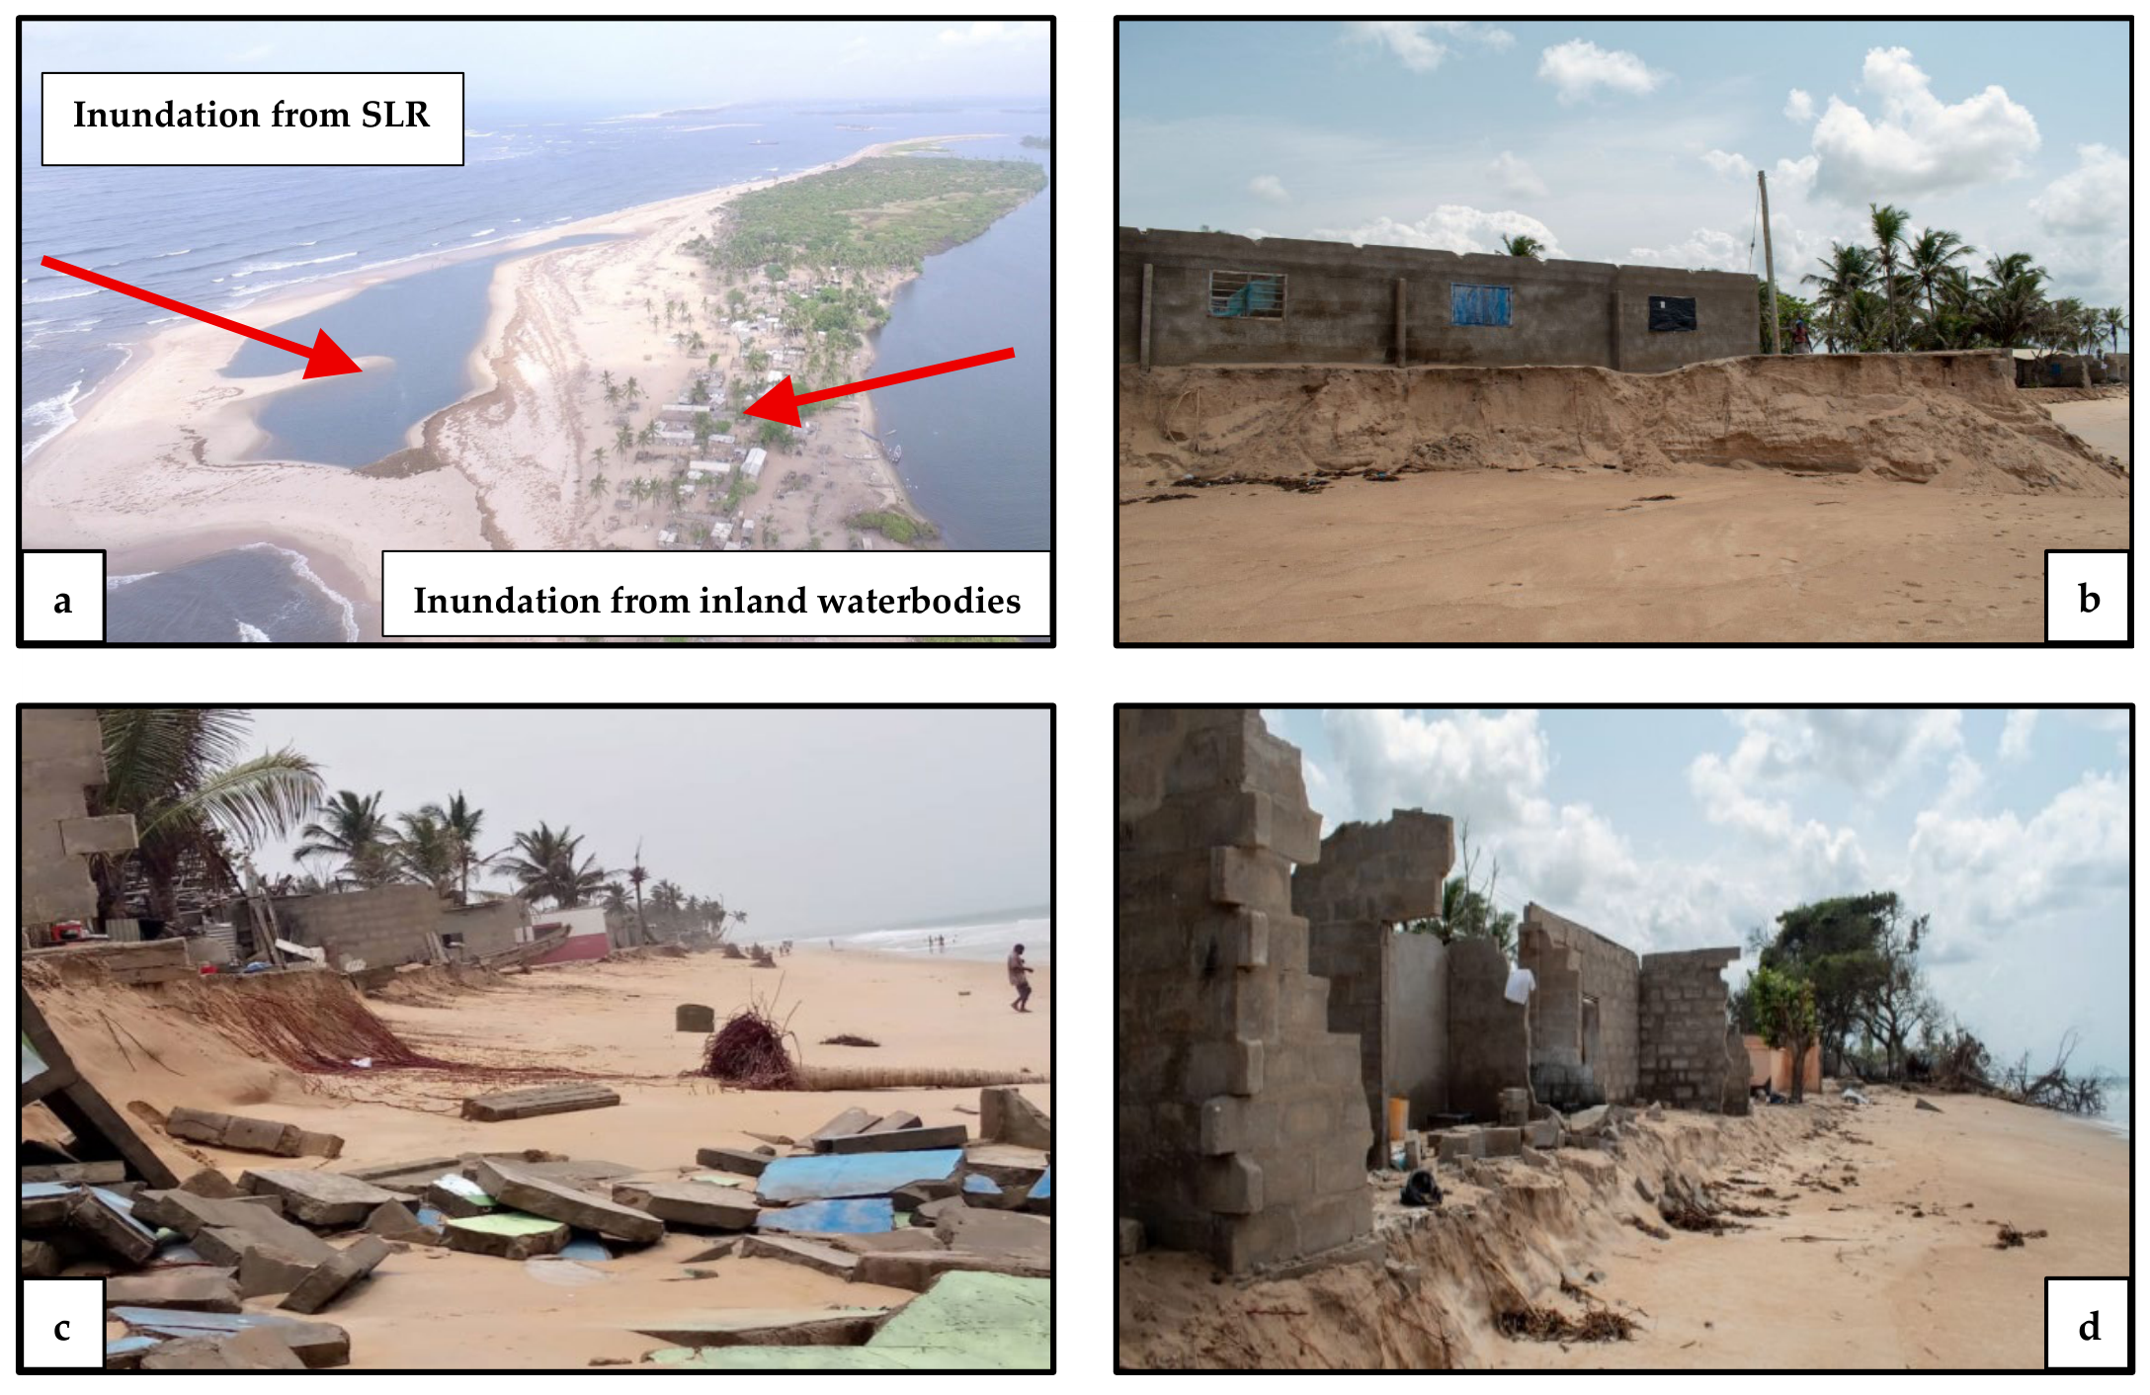
Table 3.
Percentage distribution of vulnerability ranks per variable.
| Variables | Very High (%) | High (%) | Moderate (%) | Low (%) | Very Low (%) |
|---|---|---|---|---|---|
| Subsidence* | 12.50 | 87.50 | ― | ― | ― |
| Sea-Level Rise** | 100 | ― | ― | ― | ― |
| Shoreline Change | 15.28 | 22.22 | 51.39 | 4.17 | 6.94 |
| Coastal Slope | 34.72 | 40.28 | 18.06 | 6.94 | ― |
| Geology** | 81.94 | ― | 6.94 | 8.33 | 2.78 |
| Geomorphology** | 91.67 | 8.33 | ― | ― | ― |
| Sig. Wave Height | 2.78 | 31.94 | 40.28 | 25 | ― |
| Mean Tidal Range* | ― | 100 | ― | ― | ― |
| LULC** | 58.33 | ― | ― | 13.89 | 27.78 |
**Variable that indicated Very High vulnerability for >50% of the coastline. *Variable that indicated High vulnerability for >50% of the coastline.
Disclaimer/Publisher’s Note: The statements, opinions and data contained in all publications are solely those of the individual author(s) and contributor(s) and not of MDPI and/or the editor(s). MDPI and/or the editor(s) disclaim responsibility for any injury to people or property resulting from any ideas, methods, instructions or products referred to in the content. |
© 2026 by the authors. Licensee MDPI, Basel, Switzerland. This article is an open access article distributed under the terms and conditions of the Creative Commons Attribution (CC BY) license (http://creativecommons.org/licenses/by/4.0/).
Copyright: This open access article is published under a Creative Commons CC BY 4.0 license, which permit the free download, distribution, and reuse, provided that the author and preprint are cited in any reuse.