

Submitted:
31 July 2026
Posted:
03 August 2026
You are already at the latest version
Abstract
Understanding critical transcriptomic state transitions is essential for elucidating cancer progression and therapeutic response. Although single-cell transcriptomics has transformed the study of cellular heterogeneity, existing approaches primarily characterize gene expression changes or pseudotemporal ordering rather than the underlying dynamics of cellular state transitions. Here, we present a nonlinear dynamical systems framework for the early detection and quantitative characterization of transcriptomic state transitions. The proposed framework integrates diffusion pseudotime, data-driven observable selection, Takens delay-coordinate embedding, nonlinear dynamical analysis, trajectory-aware bootstrap uncertainty estimation, and a novel Transcriptomic Dynamical Instability Score (TDIS). The framework was evaluated using the publicly available single-cell RNA-sequencing dataset GSE147405, which captures epithelial-to-mesenchymal transition (EMT) in A549 cells following EGF, TGFβ1, and TNF stimulation. The reconstructed transcriptomic state spaces exhibited distinct treatment-specific dynamics, with TGFβ1 showing the highest dynamical instability (LLE = 0.0344; TDIS = 0.700), followed by EGF (LLE = 0.0136; TDIS = 0.309) and TNF (LLE = 0.0131; TDIS = 0.188). Local TDIS preceded canonical EMT-associated transcriptional reprogramming for EGF, provided moderate evidence for TGFβ1, and showed no detectable lead for TNF, indicating that its early-warning capability is pathway dependent. Trajectory-aware bootstrap analysis confirmed the robustness and reproducibility of the nonlinear dynamical measures, while independent validation using the GSE149428 treatment-response dataset demonstrated a strong association between transcriptomic trajectory geometry and cell viability (Pearson r = 0.891, p = 0.007; Spearman ρ = 0.821, p = 0.023). These findings establish TDIS as a robust and reproducible framework for quantifying transcriptomic instability and identifying pathway-dependent early-warning signals of critical cellular state transitions, providing a new systems-level approach for investigating cancer progression, therapeutic response, and other dynamic biological processes.
Keywords:
transcriptomic dynamical instability score (TDIS)
; nonlinear dynamical systems
; single-cell RNA sequencing
; early-warning signals
; transcriptomic state transitions
; takens delay-coordinate embedding
; epithelial-to-mesenchymal transition (EMT)
; cancer progression
1. Introduction
Cancer is fundamentally a dynamic evolutionary disease in which cells continuously transition through distinct molecular and phenotypic states in response to genetic alterations, epigenetic remodeling, and microenvironmental cues [1,2,3,4]. Rather than existing as discrete phenotypes, tumors evolve as heterogeneous and adaptive ecosystems whose constituent cells exhibit remarkable plasticity, enabling proliferation, invasion, metastasis, immune evasion, and therapeutic resistance [2,3,4,5,6]. This plasticity arises from the coordinated activity of complex gene regulatory networks that continuously remodel the transcriptomic landscape, allowing individual cells to change their functional identity in response to intrinsic and extrinsic biological signals [7,8,9,10]. Consequently, understanding how cells progress through these dynamic transcriptomic states has become a central challenge in cancer biology, with profound implications for disease progression, therapeutic response, and precision medicine [2,5,11,12,13].
The concept of continuous cellular evolution is a central principle of modern systems biology [7,14,15]. Waddington’s epigenetic landscape describes cellular differentiation as movement through a continuously evolving developmental landscape, where stable cellular phenotypes correspond to valleys separated by transitional regions of varying stability [16]. Modern systems biology and nonlinear dynamical theory have extended this concept by interpreting cellular phenotypes as attractor states of high-dimensional gene regulatory networks, while differentiation, cellular reprogramming, and disease progression are viewed as transitions between these attractors driven by coordinated changes in regulatory network activity [8,9,10,17]. Rather than representing discrete biological events, these transitions arise from the collective dynamics of thousands of interacting molecular components connected through nonlinear feedback and feedforward mechanisms [8,9,17,18,19]. Consequently, identifying when cells begin to depart from one stable attractor and approach another has become a fundamental objective for understanding cellular decision-making, fate determination, and disease progression [9,17,19,20].
Among the diverse forms of cellular plasticity associated with cancer, epithelial-to-mesenchymal transition (EMT) is one of the most extensively studied models of dynamic cellular reprogramming [6,21,22,23]. During EMT, epithelial cells progressively lose defining characteristics, including apico-basal polarity and cell-cell adhesion, while acquiring mesenchymal traits associated with increased migration, invasion, stemness, immune evasion, and therapeutic resistance [5,6,22,23,24]. Accumulating experimental evidence demonstrates that EMT is not a binary epithelial-to-mesenchymal switch but rather a continuous spectrum of intermediate or hybrid epithelial/mesenchymal states with distinct molecular, phenotypic, and functional properties [25,26,27,28,29]. These intermediate states have been implicated in metastatic dissemination, tumor recurrence, and therapeutic resistance, suggesting that cancer progression is more accurately viewed as continuous movement through a high-dimensional transcriptomic landscape than as transitions between a limited number of discrete cellular phenotypes [26,27,28,29,30,31]. Consequently, identifying the early dynamical changes that precede these critical transcriptomic state transitions, before irreversible phenotypic commitment occurs, remains a major challenge in cancer systems biology and may provide opportunities for earlier therapeutic intervention [28,30,31].
Single-cell RNA sequencing (scRNA-seq) has fundamentally transformed the investigation of complex biological systems by enabling genome-wide transcriptomic profiling at single-cell resolution, thereby revealing cellular heterogeneity and dynamic biological processes that are obscured by conventional bulk RNA sequencing [32,33,34,35,36]. Over the past decade, rapid advances in experimental technologies, computational algorithms, and large-scale cell atlas initiatives have enabled comprehensive characterization of diverse cell populations across developmental, physiological, and pathological conditions with unprecedented resolution [13,37,38,39,40]. In cancer research, scRNA-seq has uncovered extensive intratumoral heterogeneity, identified rare cell populations associated with metastasis and therapeutic resistance, and provided new insights into the transcriptional programs governing tumor evolution and interactions with the tumor microenvironment [11,12,41,42,43]. Collectively, these advances have established scRNA-seq as an indispensable platform for investigating cellular plasticity, transcriptomic evolution, and the molecular mechanisms underlying cancer progression [11,44,45,46].
A major breakthrough enabled by scRNA-seq has been the reconstruction of continuous cellular trajectories from static transcriptomic snapshots [47,48,49]. Because individual cells are sampled at different stages of an underlying biological process, computational trajectory inference algorithms can order cells according to their relative progression, thereby approximating temporal evolution without requiring continuous experimental observation [47,48,49,50]. Methods such as Monocle, Slingshot, diffusion pseudotime (DPT), Partition-based Graph Abstraction (PAGA), and other graph-based approaches have become indispensable tools for reconstructing developmental lineages, identifying branching events, and investigating cellular differentiation across diverse biological systems [48,49,50,51,52,53,54]. More recently, RNA velocity has extended trajectory inference by exploiting the kinetics of spliced and unspliced messenger RNA to estimate the future direction of cellular transitions, providing a vector-field representation of transcriptomic evolution and additional insight into the temporal behavior of single-cell populations [55,56,57,58]. Collectively, these advances have transformed single-cell transcriptomics from a descriptive tool for characterizing cellular identity into a dynamic framework for reconstructing cellular progression and lineage evolution [40,49,52,56].
Despite these remarkable advances, existing trajectory inference methodologies were developed primarily to reconstruct cellular progression rather than to characterize the underlying dynamical properties of transcriptomic evolution [40,49]. Their principal objective is to infer the ordering, branching structure, or future direction of cellular trajectories rather than to quantify the stability of the underlying biological system [47,48,49,50,51,52,55,56,57,58]. Pseudotime methods estimate relative progression along biological processes but do not determine whether transcriptomic evolution remains dynamically stable, approaches a critical transition, or undergoes increasing instability [47,48,49]. Similarly, dimensionality reduction techniques, including principal component analysis (PCA), diffusion maps, and Uniform Manifold Approximation and Projection (UMAP), preserve transcriptomic similarity for visualization and manifold learning but are not intended to reconstruct the governing dynamics of transcriptomic state evolution [48,50,52,59,60,61]. Consequently, although current approaches effectively reveal where cells are located within a transcriptomic landscape—and in some cases where they are likely to progress—they provide limited insight into how the underlying transcriptomic system evolves or whether it exhibits signatures of impending critical transitions [40,49]. As a result, most existing methods characterize transcriptomic changes only after they become detectable rather than identifying the early dynamical changes that precede irreversible cellular state transitions [19,62,63,64]. Bridging this gap requires computational frameworks capable of reconstructing transcriptomic dynamics and quantitatively characterizing the stability of evolving cellular states.
Many natural systems cannot be adequately described by linear models because their behavior emerges from complex interactions among numerous interconnected components operating across multiple spatial and temporal scales [65,66,67,68]. Nonlinear dynamical systems theory provides a mathematical framework for analyzing such systems by describing how their states evolve over time, identifying stable and unstable regimes, and characterizing transitions between qualitatively different system behaviors [65,66,67,68,69]. Unlike conventional statistical approaches, which analyze observations independently, nonlinear dynamics treats successive observations as the evolution of an underlying system whose future behavior depends on its current state and governing interactions [66,67,68]. This systems-level perspective has transformed the study of complex phenomena across diverse scientific disciplines, including climate science, ecology, neuroscience, cardiovascular physiology, and electrical power systems, where nonlinear dynamical analyses have enabled the identification of critical transitions, quantified system resilience, and improved understanding of stability, synchronization, and emergent behavior [62,70,71,72,73]. These capabilities make nonlinear dynamical systems theory particularly well suited for investigating transcriptomic state transitions, where coordinated interactions among thousands of genes give rise to complex cellular behaviors that cannot be fully characterized using linear or static analytical approaches [19,74].
A central concept in nonlinear dynamics is the state space, an abstract mathematical representation in which each point corresponds to the instantaneous state of a dynamical system [65,66,67,68,75]. As the system evolves, successive states trace trajectories whose geometry reflects the underlying governing dynamics rather than merely the observed measurements [66,67,68]. Stable systems converge toward characteristic attractors, whereas unstable systems exhibit increasing divergence, bifurcations, or transitions between attractor states as system parameters change [65,66,67,68,76]. Importantly, these dynamical changes often emerge before obvious alterations become apparent in the observed variables, enabling nonlinear analyses to identify early-warning signals of impending critical transitions [62,63,64]. Consequently, nonlinear dynamical systems theory has become a powerful framework for investigating complex natural and engineered systems by quantifying stability, resilience, and transitions between distinct dynamical regimes [19,62,64,75].
Gene regulatory networks exhibit many of the defining characteristics of nonlinear dynamical systems, with cellular behavior emerging from coordinated interactions among thousands of genes, transcription factors, signaling molecules, and epigenetic regulators connected through complex positive and negative feedback loops [7,8,9,10,14]. These interactions generate high-dimensional regulatory landscapes in which stable cellular phenotypes can be viewed as attractor states, whereas differentiation, cellular reprogramming, immune activation, and epithelial-to-mesenchymal transition correspond to trajectories evolving between attractors under changing biological conditions [9,16,17,18,19,20]. Perturbations that reshape the regulatory network can destabilize existing attractors, driving cells toward alternative phenotypic states and ultimately giving rise to critical biological transitions associated with cancer progression [5,6,17,19,20]. From this perspective, transcriptomic measurements collected along biological processes are not merely independent gene-expression profiles but partial observations of an evolving dynamical system [7,9,10,67,68,75]. Consequently, reconstructing the underlying transcriptomic state space and quantitatively characterizing its stability provide a unique opportunity to identify early dynamical changes preceding critical cellular transitions rather than simply describing their downstream molecular consequences [9,19,20,75].
Despite this strong conceptual foundation, nonlinear dynamical systems theory has seen only limited application in transcriptomic trajectory analysis [19,20,40,49]. Although existing computational approaches have substantially advanced transcriptomic analysis, they primarily reconstruct cellular trajectories without explicitly modeling the latent dynamical system governing transcriptomic evolution [40,47,48,49,50,55,56,57,58]. Consequently, fundamental properties of transcriptomic dynamics—including dynamical stability, local trajectory divergence, recurrence structure, and proximity to critical state transitions—remain largely unexplored [19,20,62,64]. Applying nonlinear dynamical systems theory to transcriptomic trajectories therefore represents a natural extension of modern systems biology, enabling cellular progression to be investigated as an evolving dynamical process rather than merely an ordered sequence of transcriptomic states.
Motivated by these limitations, we developed a unified nonlinear dynamical systems framework for the early detection and quantitative characterization of critical transcriptomic state transitions in cancer. The proposed methodology integrates data-driven transcriptomic representation, Takens delay-coordinate embedding, complementary nonlinear dynamical analyses, bootstrap uncertainty estimation, and a novel Transcriptomic Dynamical Instability Score (TDIS) to reconstruct and quantify the latent dynamics underlying transcriptomic evolution. The framework was developed using a publicly available single-cell RNA-sequencing dataset of epithelial-to-mesenchymal transition (EMT) in A549 lung adenocarcinoma cells stimulated with EGF, TGFβ1, and TNF [28], and subsequently validated using both canonical EMT marker dynamics and an independent treatment-response dataset containing longitudinal transcriptomic measurements and experimentally measured cell viability [77]. In addition, we evaluated whether local TDIS identifies transcriptomic dynamical changes preceding canonical EMT-associated transcriptional reprogramming, thereby assessing its potential as an early-warning indicator of critical cellular state transitions. Together, these complementary biological and external validation strategies demonstrate the robustness, generalizability, and biological relevance of the proposed framework.
This study establishes a new systems-level framework for investigating transcriptomic evolution during cancer progression by integrating nonlinear dynamical systems theory with single-cell transcriptomics. Rather than focusing exclusively on differential gene expression, trajectory reconstruction, or pseudotemporal ordering, the proposed approach quantitatively characterizes the dynamical properties governing transcriptomic state transitions and evaluates whether transcriptomic dynamical instability provides early-warning signals of impending cellular state transitions. By shifting transcriptomic analysis from descriptive trajectory reconstruction to quantitative dynamical characterization, this work introduces a broadly applicable computational framework for investigating transcriptomic dynamics, critical state transitions, and cellular reprogramming across cancer and other complex biological systems.
2. Materials and Methods
2.1. Study Design
This study developed a fully reproducible computational framework for identifying and characterizing critical transcriptomic state transitions associated with cancer progression using nonlinear dynamical systems theory. Unlike conventional transcriptomic analyses, which primarily characterize differences in gene expression between predefined biological states, the proposed framework reconstructs the underlying dynamical evolution of transcriptomic systems from high-dimensional single-cell gene expression data. The central hypothesis is that transcriptomic reprogramming during cellular state transitions exhibits nonlinear dynamical behavior that can be quantitatively characterized through state-space reconstruction and dynamical stability analysis [65,67,68,78,79].
The computational workflow was designed as a sequential and fully reproducible pipeline beginning with the acquisition of publicly available transcriptomic datasets and proceeding through quality control, transcriptomic trajectory reconstruction, data-driven observable selection, delay-coordinate embedding, nonlinear dynamical analysis, biological validation, early-warning analysis, and external validation. Each stage was implemented as an independent Python module to facilitate reproducibility, modular development, and future methodological extension.
Primary methodological development was performed using the public single-cell RNA-sequencing dataset GSE147405, which contains multiplexed time-course measurements of epithelial-to-mesenchymal transition (EMT) induced by multiple signaling factors in human lung adenocarcinoma cells. The dense temporal sampling provided by this dataset enables reconstruction of continuous transcriptomic trajectories suitable for nonlinear dynamical analysis [28].
Independent validation was performed using the public bulk RNA-sequencing treatment-response dataset GSE149428 [77], which contains longitudinal transcriptomic measurements together with experimentally measured cell viability following multiple therapeutic perturbations. Because each treatment trajectory contains only a limited number of temporal observations, this dataset was not suitable for delay-coordinate embedding or largest Lyapunov exponent estimation. Instead, it served as an independent validation cohort to evaluate whether transcriptomic trajectory geometry derived from the proposed framework was associated with experimentally measured treatment response.
A distinguishing feature of the proposed methodology is that the observable used for nonlinear reconstruction was selected through a data-driven optimization procedure rather than specified a priori. Instead of relying solely on the first principal component, multiple candidate transcriptomic observables—including principal components, diffusion components, and trajectory-based geometric descriptors—were systematically evaluated using objective nonlinear reconstruction criteria. The optimal observable was selected using Average Mutual Information (AMI) for delay estimation [80], False Nearest Neighbors (FNN) for embedding dimension estimation [81], and quantitative measures of reconstruction quality before applying Takens’ delay-coordinate embedding theorem [78]. This strategy minimizes observer bias and improves the robustness of reconstructed transcriptomic state spaces.
The reconstructed attractors were subsequently characterized using complementary nonlinear dynamical analyses, including the largest Lyapunov exponent (LLE) to quantify local dynamical instability [82], Recurrence Quantification Analysis (RQA) to characterize global trajectory organization [83], and bootstrap uncertainty analysis to evaluate the statistical robustness of the estimated nonlinear measures [84]. These descriptors were integrated into the proposed Transcriptomic Dynamical Instability Score (TDIS), which provides a unified quantitative measure of transcriptomic instability. An additional analysis evaluated whether local TDIS increased before canonical EMT-associated transcriptional reprogramming, thereby assessing its potential as an early-warning indicator of critical transcriptomic state transitions. Finally, the biological relevance of the framework was evaluated using canonical epithelial and mesenchymal marker dynamics during EMT [6,21,22,85], and its generalizability was assessed through external validation using an independent treatment-response dataset.
Figure 1 summarizes the complete computational workflow developed in this study. Beginning with publicly available transcriptomic datasets, the pipeline sequentially performs quality control, normalization, feature selection, transcriptomic trajectory reconstruction, data-driven observable selection, Takens delay-coordinate embedding, nonlinear dynamical characterization, computation of the proposed Transcriptomic Dynamical Instability Score (TDIS), early-warning analysis of transcriptomic state transitions, biological validation using EMT marker dynamics, and external validation using an independent treatment-response dataset.
All computational analyses were implemented as modular Python scripts within a fully automated and reproducible workflow. Intermediate datasets, quality-control reports, metadata, and analysis outputs were generated automatically at each stage of the pipeline, ensuring complete traceability and computational reproducibility.
2.2. Public Transcriptomic Datasets
The proposed nonlinear dynamical framework was developed and evaluated using two independent publicly available transcriptomic datasets obtained from the Gene Expression Omnibus (GEO). The datasets were selected a priori according to predefined criteria designed to support nonlinear dynamical reconstruction. Specifically, eligible datasets were required to (i) provide genome-wide transcriptomic measurements, (ii) capture temporal or pseudotemporal progression through a biological process, (iii) contain sufficient sampling density for trajectory reconstruction, (iv) be publicly accessible without controlled-access restrictions, and (v) include adequate biological annotation for independent biological validation.
Primary methodological development was performed using GSE147405, a large-scale single-cell RNA-sequencing (scRNA-seq) dataset that characterizes epithelial-to-mesenchymal transition (EMT) induced by multiple signaling factors in human cancer cell lines [28]. Among the available experiments, the A549 lung adenocarcinoma cell line was selected because it contains well-characterized time-course measurements following stimulation with epidermal growth factor (EGF), transforming growth factor-β1 (TGFβ1), and tumor necrosis factor (TNF). These perturbations induce distinct EMT programs with different temporal dynamics, providing an ideal experimental system for reconstructing transcriptomic trajectories, quantifying nonlinear dynamical behavior, and evaluating the early emergence of transcriptomic instability. The combination of high cellular resolution, dense temporal sampling, and multiple independent perturbations makes this dataset particularly well suited for state-space reconstruction and nonlinear dynamical analysis.
Independent validation was performed using GSE149428, a bulk RNA-sequencing dataset containing longitudinal transcriptomic responses to multiple pharmacological perturbations together with experimentally measured cell viability [77]. The MCF7 breast cancer cell line served as the primary external validation cohort because it provides matched transcriptomic measurements and treatment-response data. In contrast to GSE147405, each treatment trajectory in GSE149428 contains only a limited number of temporal observations, precluding reliable delay-coordinate embedding and largest Lyapunov exponent estimation. Consequently, this dataset was used to evaluate whether transcriptomic trajectory geometry derived from the proposed framework was associated with independent measurements of therapeutic response. The LNCaP prostate cancer cell line was included as an exploratory dataset to assess the potential applicability of the framework beyond the primary validation cohort but was not included in the principal validation analyses.
Together, these complementary datasets enabled evaluation of the proposed framework at two distinct levels. GSE147405 provided the temporal resolution required for nonlinear dynamical reconstruction, method development, and early-warning analysis, whereas GSE149428 enabled an independent assessment of the relationship between transcriptomic trajectory geometry and therapeutic response in a separate experimental setting. The principal characteristics of both datasets are summarized in Table 1.
Figure 2 summarizes the transcriptomic datasets used for method development and independent validation, including the experimental design, biological perturbations, sequencing platforms, and principal characteristics of each cohort.
2.3. Data Acquisition and File Selection
The transcriptomic datasets analyzed in this study were obtained from the Gene Expression Omnibus (GEO) repository maintained by the National Center for Biotechnology Information (NCBI). GEO provides a publicly accessible archive of functional genomic experiments together with standardized metadata and supplementary files, facilitating transparent and reproducible computational analyses [86].
Dataset acquisition was performed using a fully automated Python workflow that recorded the original GEO accession numbers, downloaded the corresponding series metadata, and catalogued all supplementary files associated with each study. For every downloaded file, an inventory was generated containing the file type, file size, cryptographic checksum (SHA-256), and biological annotations extracted from the accompanying metadata. This inventory established complete traceability from the original GEO repository to the processed datasets used throughout the computational pipeline.
Following data acquisition, a systematic file-selection procedure identified the datasets required for nonlinear dynamical analysis. For GSE147405, the analysis was restricted to the A549 epithelial-to-mesenchymal transition (EMT) time-course experiments induced by EGF, TGFβ1, and TNF. For each treatment, both the single-cell unique molecular identifier (UMI) expression matrix and the corresponding cell-level metadata were retained. Kinase-screen experiments, untreated controls, barcode-count files, barcode annotation files, and experiments from other cell lines were excluded because they were outside the scope of the present study.
For GSE149428, the analysis retained the normalized bulk RNA-sequencing expression matrices together with the corresponding sample metadata and experimentally measured cell viability data from the MCF7 cell line. These data provided the transcriptomic trajectories and independent biological response measurements required for external validation of the proposed framework.
All retained datasets were organized within a dedicated project directory while preserving the original filenames and directory hierarchy. The acquisition and file-selection workflow generated machine-readable inventories documenting every retained dataset and processing decision, thereby ensuring complete traceability from the original GEO repository to the analytical inputs.
Supplementary Table S1 lists all GEO files retained for analysis together with their biological roles, experimental conditions, and functions within the computational workflow.
2.4. Data Parsing and Quality Control
Following file selection, all transcriptomic datasets were parsed into standardized expression matrices and corresponding metadata tables using a fully automated Python workflow. Dataset-specific parsers were developed to accommodate the distinct formats of single-cell and bulk RNA-sequencing experiments while producing a unified data representation for subsequent nonlinear dynamical analysis.
For the single-cell RNA-sequencing dataset (GSE147405), compressed unique molecular identifier (UMI) count matrices and the corresponding cell-level metadata were imported directly from the GEO supplementary files. Gene identifiers were standardized, duplicate gene entries were removed, and expression matrices were aligned with their corresponding metadata using unique cell barcodes. Cell-level metadata included treatment condition, sampling time, biological replicate, and additional experimental annotations required for pseudotemporal trajectory reconstruction. Multiple integrity checks verified one-to-one correspondence between expression matrices and metadata, identified duplicated identifiers and missing values, and ensured consistency between gene annotations and cellular measurements.
For the bulk RNA-sequencing dataset (GSE149428), normalized log-counts-per-million (log-CPM) expression matrices, sample metadata, and experimentally measured cell viability values were extracted from the supplementary files and converted into standardized tabular formats. Treatment labels, sampling times, and biological replicates were parsed automatically from the original sample identifiers using regular-expression matching and subsequently verified manually to ensure consistency across all experimental conditions. Expression matrices were then aligned with the corresponding sample annotations before downstream analysis.
Quality control was performed independently for the single-cell and bulk RNA-sequencing datasets because of their distinct experimental characteristics. For GSE147405, quality control followed established recommendations for single-cell transcriptomic analysis [40,50,87]. Cells expressing fewer than 500 detected genes were excluded to remove low-complexity transcriptomes, whereas genes detected in fewer than 10 cells were removed to reduce sparsity and eliminate minimally informative features. Cells with more than 25% mitochondrial transcripts were excluded because elevated mitochondrial expression is a well-established indicator of cellular stress or reduced RNA quality. Following filtering, all retained cells preserved complete metadata annotation. Quality-control metrics were computed and archived for downstream analyses.
For GSE149428, the normalized expression matrices contained no missing transcriptomic values and therefore required no sample exclusion. Gene-wise variance was evaluated to identify non-informative transcripts; however, no genes were removed because all retained features exhibited measurable variability across the experimental conditions. Cell viability measurements were independently inspected for completeness before external validation.
The quality-control workflow generated standardized expression matrices, curated metadata tables, and comprehensive quality-control reports for each dataset. These outputs served as the standardized inputs for transcriptomic trajectory reconstruction and all subsequent nonlinear dynamical analyses. The effectiveness of the quality-control procedure for the GSE147405 A549 single-cell RNA-sequencing dataset is summarized in Figure 3, which presents transcriptome complexity, sequencing depth, mitochondrial transcript content, and cell retention across treatment conditions.
2.5. Construction of Transcriptomic Trajectories
Following normalization and dimensionality reduction, transcriptomic trajectories were reconstructed independently for each treatment condition to represent the continuous evolution of cellular transcriptional states during epithelial-to-mesenchymal transition (EMT). Rather than treating individual cells as independent observations, the proposed framework assumes that cells sampled at different stages of the biological process collectively approximate successive observations of an underlying dynamical system. Under this assumption, the ordered transcriptomic states constitute discrete samples of a continuous trajectory evolving through high-dimensional gene expression space.
Principal component analysis (PCA) [88] was first performed using the 3,000 highly variable genes identified during preprocessing. The first 20 principal components were retained because they captured the dominant biological variation while substantially reducing measurement noise and computational complexity. A k-nearest-neighbor (kNN) graph [50] was subsequently constructed using these principal components with k = 30 neighbors per cell to represent the local transcriptomic manifold.
Cell ordering was then inferred using Diffusion Pseudotime (DPT) [48], which estimates progression along a continuous biological process by computing diffusion distances on the neighborhood graph while preserving the intrinsic geometry of the transcriptomic manifold. DPT was selected because it provides robust ordering of asynchronously sampled single cells without assuming linear progression or requiring uniformly sampled experimental time points. This property is particularly advantageous for nonlinear dynamical analysis, where preserving the continuity of state evolution is more important than preserving absolute experimental time.
For each treatment condition, the trajectory root cell was selected automatically as the cell with the minimum value of the first diffusion component (DC1), representing the earliest point along the inferred biological progression. Diffusion pseudotime values were subsequently computed for all cells relative to this root, and cells were ordered according to increasing pseudotime to generate continuous transcriptomic trajectories.
To reduce stochastic variability inherent to single-cell measurements while preserving the global trajectory structure, the ordered cells were partitioned into 120 consecutive pseudotime bins, each containing a minimum of 10 cells. Within each bin, transcriptomic observables were summarized by their mean values, producing uniformly sampled trajectory points suitable for nonlinear dynamical analysis. This binning strategy reduced technical noise while preserving the continuous biological progression required for state-space reconstruction.
Unlike conventional pseudotime analyses that terminate after estimating cellular ordering, the reconstructed trajectories served as the dynamical signals from which candidate transcriptomic observables were extracted for data-driven observable selection, delay-coordinate embedding, nonlinear state-space reconstruction, and subsequent computation of the Transcriptomic Dynamical Instability Score (TDIS).
Figure 4 summarizes the computational workflow for transcriptomic trajectory reconstruction. Cells were projected into principal component space, connected through a k-nearest-neighbor graph, ordered using Diffusion Pseudotime (DPT), and aggregated into uniformly sampled pseudotime bins to generate smooth transcriptomic trajectories for subsequent nonlinear dynamical analysis.
2.6. Candidate Dynamical Observables
A fundamental requirement for delay-coordinate embedding is the selection of a one-dimensional observable that faithfully represents the dynamics of the underlying system. According to Takens’ embedding theorem, under appropriate conditions the complete dynamics of an unknown multidimensional system can be reconstructed from successive observations of a single scalar variable, provided that the observable is sufficiently informative and the embedding parameters are appropriately chosen. Consequently, observable selection is a critical component of nonlinear state-space reconstruction rather than an arbitrary preprocessing step. Takens’ theorem guarantees that, for generic observation functions, the reconstructed attractor preserves the topological properties of the original dynamical system [78].
where denotes the unknown high-dimensional transcriptomic state vector and is the scalar observation function selected from the candidate transcriptomic observables.
The objective of the observable selection procedure is therefore to identify the scalar function that yields the most faithful delay-coordinate reconstruction of the underlying transcriptomic dynamics.
Previous applications of nonlinear dynamics to biological systems have frequently adopted either the first principal component or an experimentally measured variable as the reconstruction observable. Although these choices are computationally convenient, they implicitly assume that a predefined variable adequately captures the evolution of the underlying transcriptomic dynamics. Because distinct biological perturbations may follow different transcriptional programs, no single observable can be expected to be universally optimal across all experimental conditions.
To minimize observer bias, a data-driven observable selection strategy was adopted in which multiple candidate transcriptomic observables were evaluated independently for each treatment condition before state-space reconstruction. Seven candidate observables were considered: the first three principal components (PC1–PC3), the first three diffusion components (DC1–DC3), and the cumulative arc length of the diffusion pseudotime trajectory. Principal components summarize the dominant axes of transcriptomic variation, whereas diffusion components preserve the intrinsic nonlinear geometry of the transcriptomic manifold. The cumulative arc length provides a complementary geometric descriptor that quantifies the cumulative distance traveled along the reconstructed transcriptomic trajectory.
Each candidate observable was normalized to the interval [0,1] before nonlinear analysis to ensure comparability across observables with different numerical scales. For every candidate, the optimal delay time () was estimated using Average Mutual Information (AMI), while the minimum embedding dimension () was determined using the False Nearest Neighbors (FNN) algorithm [80,81]. These complementary measures identify delay times that minimize redundant information and embedding dimensions sufficient to unfold the reconstructed attractor without projection artifacts.
Only observables satisfying the criterion were considered eligible for nonlinear reconstruction because one-dimensional embeddings cannot recover multidimensional attractor geometry. Eligible observables were subsequently ranked using a composite reconstruction score integrating embedding quality, false-nearest-neighbor percentage, and overall reconstruction performance. The highest-ranked observable was selected independently for each treatment condition and used for all subsequent nonlinear dynamical analyses.
The candidate observables evaluated for nonlinear state-space reconstruction are summarized in Figure 5, and their biological and computational characteristics are described in Table 2. The complete quantitative evaluation of all candidate observables—including the estimated delay time (), embedding dimension (), false-nearest-neighbor (FNN) percentage, composite reconstruction score, eligibility, and final ranking—is provided in Supplementary Table S2.
2.7. State-Space Reconstruction Using Takens Delay-Coordinate Embedding
Following selection of the optimal transcriptomic observable for each treatment condition, nonlinear state-space reconstruction was performed using Takens’ delay-coordinate embedding theorem, which provides a mathematical framework for recovering the geometry of an unknown dynamical system from sequential observations of a single scalar variable. Rather than requiring direct observation of every state variable governing transcriptomic regulation, Takens demonstrated that the underlying attractor can be reconstructed from delayed measurements of an appropriately chosen observable while preserving its topological properties [78].
The delay-coordinate embedding procedure and the corresponding reconstruction parameters are summarized in Table 3. For each treatment condition, the selected transcriptomic observable was transformed into a sequence of delay-coordinate vectors according to
where denotes the selected transcriptomic observable, is the optimal delay time estimated using Average Mutual Information (AMI), and is the minimum embedding dimension determined using the False Nearest Neighbors (FNN) algorithm. Both parameters were estimated independently for each treatment condition to ensure that the reconstructed state spaces accurately represented the underlying transcriptomic dynamics.
Equation (2) reconstructs the trajectory of the underlying transcriptomic dynamical system in an -dimensional embedding space, where each coordinate corresponds to a delayed observation of the selected transcriptomic observable. Under the conditions of Takens’ theorem, this reconstructed trajectory is diffeomorphic to the original attractor, thereby preserving the geometric and topological properties required for subsequent nonlinear dynamical analyses [78].
The resulting delay-coordinate vectors define reconstructed transcriptomic state spaces that approximate the underlying attractor governing transcriptomic evolution. Unlike conventional dimensionality-reduction techniques, which provide static representations of transcriptomic similarity, delay-coordinate embedding reconstructs the temporal evolution of the underlying dynamical system. The reconstructed state spaces subsequently served as the basis for largest Lyapunov exponent estimation, Recurrence Quantification Analysis (RQA), bootstrap uncertainty analysis, computation of the proposed Transcriptomic Dynamical Instability Score (TDIS), and the subsequent early-warning analysis.
2.8. Nonlinear Dynamical Characterization of Reconstructed Transcriptomic State Spaces
Following state-space reconstruction, each transcriptomic attractor was characterized using complementary nonlinear dynamical measures that quantify local dynamical instability, global geometric organization, and statistical robustness. Whereas delay-coordinate embedding reconstructs the underlying state space, nonlinear dynamical analysis extracts quantitative descriptors that characterize the behavior of the reconstructed transcriptomic system.
Four complementary analyses were performed. First, the largest Lyapunov exponent (LLE) [82,89] was estimated to quantify the average exponential divergence of neighboring transcriptomic trajectories and thereby assess local dynamical instability. Second, Recurrence Quantification Analysis (RQA) [83] was applied to characterize the global geometric organization of reconstructed state spaces using recurrence statistics derived from the reconstructed attractors. Third, bootstrap resampling [84] was performed to quantify the statistical uncertainty associated with the estimated nonlinear dynamical measures. Finally, these complementary descriptors were integrated into a unified Transcriptomic Dynamical Instability Score (TDIS) designed to quantify the overall dynamical instability associated with transcriptomic state transitions.
Unlike conventional transcriptomic analyses that primarily evaluate differential expression or trajectory topology, the proposed framework characterizes transcriptomic progression from a dynamical systems perspective by quantifying instability, recurrence structure, and uncertainty within reconstructed transcriptomic state spaces.
The computational procedures used to estimate each nonlinear dynamical measure are described in the following subsections.
2.8.1. Largest Lyapunov Exponent Estimation
The largest Lyapunov exponent (LLE) is one of the most widely used quantitative measures of nonlinear dynamical behavior because it characterizes the average exponential rate at which initially neighboring trajectories diverge in phase space. Positive Lyapunov exponents indicate sensitive dependence on initial conditions and increasing dynamical instability, whereas values approaching zero indicate marginal stability and negative values correspond to convergent dynamics [89].
For each reconstructed transcriptomic state space, the LLE was estimated using the algorithm proposed by Rosenstein et al., which is particularly well suited for relatively short and noisy experimental time series [82]. This method estimates the average logarithmic divergence between neighboring trajectories while enforcing a minimum temporal separation (Theiler window) to avoid selecting temporally adjacent points as nearest neighbors. The complete parameter settings and regression statistics for Lyapunov exponent estimation are provided in Supplementary Table S3.
For every embedded state vector , the nearest spatial neighbor satisfying the temporal separation constraint was identified. The average logarithmic divergence between neighboring trajectories was then computed as
where denotes the nearest neighbor of state vector , and represents the discrete evolution step along the reconstructed trajectory.
Within the initial region of exponential divergence, the average logarithmic divergence evolves approximately according to
where denotes the largest Lyapunov exponent and is a constant. The value of was estimated by ordinary least-squares linear regression over the predefined fitting interval (–10). The corresponding average logarithmic divergence values used for regression are reported in Supplementary Table S4. The quality of the linear approximation was assessed using the coefficient of determination (), regression P value, and the standard error of the estimated slope [90,91].
To ensure consistent estimation across all treatment conditions, identical reconstruction parameters were applied throughout the analysis, including a minimum temporal separation of five embedded samples and a maximum divergence horizon of 25 evolution steps. These parameters were selected to capture the initial exponential divergence regime while minimizing finite-trajectory effects.
2.8.2. Recurrence Quantification Analysis
To complement the local stability information provided by the largest Lyapunov exponent, the reconstructed transcriptomic state spaces were further characterized using Recurrence Quantification Analysis (RQA), a nonlinear time-series analysis technique that quantifies the global geometric organization and recurrent behavior of dynamical systems. Originally introduced by Eckmann et al. through recurrence plots and subsequently extended by Webber and Zbilut into a quantitative analytical framework, RQA provides robust descriptors of nonlinear dynamics that remain applicable to relatively short and noisy biological time series [92,93].
For each reconstructed transcriptomic state space, the pairwise Euclidean distance matrix was first computed among all embedded state vectors. A binary recurrence matrix was then constructed according to
where and denote embedded transcriptomic state vectors and is the recurrence threshold. Rather than selecting a fixed distance threshold, was determined independently for each treatment condition to achieve a recurrence rate of approximately 10%, thereby enabling meaningful comparison of recurrence structures across transcriptomic trajectories with different geometric scales [83].
Several complementary RQA measures were subsequently computed from the recurrence matrix. The recurrence rate (RR) quantifies the proportion of recurrent state pairs within the reconstructed attractor and reflects the overall density of recurrence. Determinism (DET) measures the proportion of recurrence points forming diagonal line structures and provides an indication of the predictability and deterministic organization of the underlying dynamics. Laminarity (LAM) quantifies the fraction of recurrence points forming vertical line structures and reflects the persistence of slowly evolving transcriptomic states. The mean diagonal line length () and mean vertical line length () characterize the average duration of deterministic and laminar behavior, respectively. Finally, diagonal line entropy (ENTR) measures the Shannon entropy of the diagonal line-length distribution and provides a quantitative estimate of the structural complexity of the reconstructed transcriptomic dynamics.
Together, these complementary recurrence measures characterize the global organization of reconstructed transcriptomic state spaces and provide information that complements the local instability quantified by the largest Lyapunov exponent. The resulting RQA descriptors were subsequently used in downstream nonlinear dynamical analyses and integrative instability assessment.
2.8.3. Bootstrap Uncertainty Analysis
To evaluate the statistical robustness of the estimated nonlinear dynamical measures, a nonparametric bootstrap resampling procedure was applied to each reconstructed transcriptomic trajectory. Bootstrap analysis provides an empirical estimate of parameter uncertainty without requiring assumptions regarding the underlying probability distribution and has become a standard approach for quantifying confidence in statistical estimators derived from finite datasets [84].
Because estimation of the largest Lyapunov exponent (LLE) requires preservation of the temporal continuity of the reconstructed trajectory, a trajectory-aware bootstrap strategy was adopted. For LLE estimation, bootstrap replicates were generated by resampling valid nearest-neighbor trajectory pairs with replacement while preserving their temporal evolution, and the Rosenstein regression was recomputed for each replicate. This procedure maintains the sequential structure required for reliable Lyapunov exponent estimation and avoids the artificial trajectory discontinuities introduced by random reordering of embedded state vectors.
For Recurrence Quantification Analysis (RQA), bootstrap uncertainty was estimated using randomly selected contiguous subtrajectories rather than independently resampled trajectory points. Preserving continuous trajectory segments maintains the recurrence geometry and prevents artificial distortion of diagonal and vertical line structures that are fundamental to RQA.
Bootstrap analysis was performed for the largest Lyapunov exponent (LLE), recurrence rate (RR), determinism (DET), laminarity (LAM), and diagonal line entropy (ENTR). For each metric, 300 bootstrap replicates were generated, and the resulting empirical distributions were used to estimate the bootstrap mean, standard deviation, and the 95% percentile confidence interval, defined by the 2.5th and 97.5th percentiles. These quantities provide quantitative measures of estimator uncertainty and enable direct comparison of the robustness of nonlinear dynamical measures across treatment conditions.
The bootstrap-derived confidence intervals were subsequently incorporated into the Transcriptomic Dynamical Instability Score (TDIS), estimation of confidence intervals for transcriptomic onset times, and quantification of the statistical uncertainty associated with early-warning lead-time analysis.
Unlike conventional transcriptomic analyses that typically report only point estimates, incorporating trajectory-aware bootstrap uncertainty provides an additional layer of statistical rigor while preserving the dynamical assumptions underlying nonlinear state-space analysis, thereby improving the robustness, reliability, and reproducibility of the proposed framework.
2.8.4. Transcriptomic Dynamical Instability Score (TDIS)
Although the largest Lyapunov exponent and Recurrence Quantification Analysis (RQA) each characterize important aspects of nonlinear transcriptomic dynamics, no single metric adequately captures the overall degree of transcriptomic instability. The largest Lyapunov exponent quantifies local divergence between neighboring trajectories, whereas RQA measures describe complementary global properties of the reconstructed state space, including determinism, recurrence structure, laminarity, and dynamical complexity. Because these descriptors capture distinct but complementary characteristics of nonlinear behavior, we developed a unified Transcriptomic Dynamical Instability Score (TDIS) that integrates multiple nonlinear dynamical measures into a single quantitative measure of transcriptomic instability.
Prior to integration, all nonlinear metrics were transformed onto a common dimensionless scale using min–max normalization
where denotes the value of a given nonlinear metric and is its normalized value ranging from 0 to 1. Metrics expected to increase with transcriptomic instability, including the largest Lyapunov exponent and diagonal line entropy, were normalized directly. Metrics expected to decrease with increasing instability, specifically determinism and laminarity, were transformed according to
thereby ensuring that larger values consistently correspond to greater transcriptomic instability.
To account for estimation uncertainty, the bootstrap-derived confidence interval widths for determinism, laminarity, and diagonal line entropy were first averaged,
and subsequently normalized using min–max scaling to obtain the uncertainty component,
The Transcriptomic Dynamical Instability Score (TDIS) was then defined as
where is the normalized largest Lyapunov exponent, is the normalized diagonal line entropy, is the inverse normalized determinism, is the inverse normalized laminarity, and is the normalized bootstrap uncertainty component.
Because TDIS integrates complementary nonlinear descriptors together with estimator uncertainty, it provides a unified quantitative framework for comparing transcriptomic dynamical instability across biological perturbations and experimental datasets.
Unlike individual nonlinear metrics, TDIS combines information describing local instability, global recurrence structure, dynamical complexity, deterministic organization, and statistical uncertainty into a single interpretable measure. Consequently, TDIS provides a unified and interpretable measure of transcriptomic dynamical instability that integrates complementary local, global, and statistical characteristics of reconstructed transcriptomic dynamics. This composite score constitutes the principal methodological contribution of the proposed framework and serves as the basis for the subsequent early-warning analyses of transcriptomic state transitions.
Although TDIS can be computed for an entire reconstructed trajectory, the same formulation can be applied locally within sliding pseudotime windows to quantify temporal changes in transcriptomic instability. These local TDIS profiles were subsequently used to evaluate the early emergence of transcriptomic instability during epithelial-to-mesenchymal transition.
2.8.5. Early-Warning Analysis of Transcriptomic State Transitions
To determine whether transcriptomic dynamical instability provides an early indicator of cellular state transitions, a dedicated early-warning analysis was performed by comparing the temporal evolution of the local Transcriptomic Dynamical Instability Score (TDIS) with established biological markers of epithelial-to-mesenchymal transition (EMT). Whereas the global TDIS quantifies the overall dynamical instability of an entire transcriptomic trajectory, the local TDIS characterizes the temporal evolution of transcriptomic instability along diffusion pseudotime, thereby enabling identification of the onset of critical dynamical changes preceding biological state transitions.
For each treatment condition, the reconstructed transcriptomic trajectory was partitioned into overlapping sliding windows along diffusion pseudotime. Within each window, the complete nonlinear dynamical analysis pipeline was repeated, including state-space reconstruction, largest Lyapunov exponent estimation, Recurrence Quantification Analysis (RQA), bootstrap uncertainty estimation, and computation of the local TDIS. The resulting sequence of local TDIS values generated a continuous instability profile describing the evolution of transcriptomic dynamics throughout the epithelial-to-mesenchymal transition.
To provide an independent biological reference, a composite EMT score was computed for each pseudotime window using the average expression of canonical epithelial and mesenchymal marker genes. The epithelial markers included CDH1 and EPCAM, whereas the mesenchymal markers included VIM, FN1, ZEB1, and SNAI1 [6,21,22,86]. Individual marker trajectories were also analyzed independently to compare the onset of transcriptomic instability with the temporal behavior of established EMT-associated transcriptional programs.
The onset of transcriptomic instability was defined as the earliest pseudotime at which the local TDIS exhibited a sustained increase above its baseline level. Similarly, the onset of EMT progression was defined as the earliest pseudotime at which the composite EMT score or an individual EMT marker exhibited a sustained transcriptional change relative to its baseline expression. To reduce the influence of local measurement noise, lightly smoothed profiles were used solely for visualization, whereas all onset times and statistical analyses were computed from the original unsmoothed measurements.
To evaluate statistical robustness, nonparametric bootstrap resampling was performed by repeatedly resampling transcriptomic windows with replacement while preserving the pseudotemporal ordering. For each bootstrap replicate, transcriptomic onset times, EMT onset times, and the corresponding lead times were recalculated. The resulting bootstrap distributions were used to estimate median lead times, 95% percentile confidence intervals, and the probability that transcriptomic instability preceded EMT-associated transcriptional reprogramming.
Because onset detection may depend on the choice of analysis parameters, a sensitivity analysis was performed across multiple smoothing levels and onset-detection thresholds. The proportion of parameter combinations yielding consistent onset ordering was summarized as a robustness score for each treatment condition. This procedure enabled assessment of whether the observed lead times represented stable dynamical features rather than artifacts of a particular parameter selection.
The early-warning analysis generated treatment-specific local TDIS trajectories, transcriptomic onset times, EMT onset times, bootstrap confidence intervals, lead-time distributions, onset probabilities, and robustness estimates. These quantities were subsequently used to evaluate whether transcriptomic dynamical instability preceded canonical EMT-associated transcriptional remodeling and to assess the potential of TDIS as an early-warning indicator of critical transcriptomic state transitions.
2.9. Biological Validation Using Canonical EMT Markers
To evaluate the biological relevance of the proposed nonlinear dynamical framework, the reconstructed transcriptomic trajectories were validated using the expression dynamics of established epithelial and mesenchymal marker genes during epithelial-to-mesenchymal transition (EMT). EMT is a fundamental cellular reprogramming process that is frequently reactivated during cancer progression and is characterized by coordinated transcriptional changes associated with increased cellular plasticity, invasion, metastasis, and therapeutic resistance [21,85,94].
For each treatment condition, canonical epithelial marker genes (CDH1, EPCAM, KRT8, KRT18, KRT19, CLDN1, and OCLN) and mesenchymal marker genes (VIM, FN1, CDH2, SNAI1, ZEB1, and ZEB2) were selected based on their established roles in EMT. Because SNAI2 was detected only in the TGFβ1 dataset, it was included exclusively in the corresponding mesenchymal marker panel for that treatment.
Cells were ordered according to diffusion pseudotime, and the normalized expression of each marker gene was averaged within the same pseudotime bins used for transcriptomic trajectory reconstruction. Composite epithelial () and mesenchymal () expression profiles were calculated by averaging the normalized expression of their respective marker sets. The composite EMT score was then defined as
where and denote the average normalized expression of the mesenchymal and epithelial marker sets, respectively. Increasing EMT scores indicate progressive transition toward a mesenchymal transcriptional state.
For each treatment condition, the initial and final EMT scores, total EMT score change, EMT score range, maximum transition rate, and the diffusion pseudotime corresponding to the maximum transition rate were calculated. The association between EMT progression and diffusion pseudotime was quantified using both Pearson and Spearman correlation analyses.
To evaluate the biological relevance of transcriptomic dynamical instability, the global Transcriptomic Dynamical Instability Score (TDIS) was compared with the overall extent of EMT-associated transcriptional remodeling across treatment conditions. In addition, local TDIS trajectories were compared with the temporal evolution of the composite EMT score and individual canonical EMT markers to determine whether transcriptomic dynamical instability emerged before detectable transcriptional reprogramming. These analyses provided an independent biological assessment of both the quantitative validity of TDIS and its potential utility as an early-warning indicator of critical transcriptomic state transitions.
2.10. External Validation Using GSE149428
To evaluate the generalizability of the proposed framework, independent validation was performed using the publicly available bulk RNA-sequencing dataset GSE149428 [77], which contains longitudinal transcriptomic measurements of the MCF7 breast cancer cell line following treatment with multiple therapeutic perturbations. Unlike the primary method-development dataset, GSE149428 includes experimentally measured cell viability, thereby enabling assessment of whether transcriptomic trajectory characteristics derived from the proposed framework are associated with biological treatment response.
Because each treatment trajectory in GSE149428 consists of only six temporal observations, the dataset does not provide sufficient temporal resolution for reliable delay-coordinate embedding or largest Lyapunov exponent estimation. Consequently, the external validation focused on transcriptomic trajectory geometry rather than complete nonlinear state-space reconstruction. This strategy enabled evaluation of whether biologically meaningful information extracted from transcriptomic trajectories remained predictive even when full nonlinear dynamical analysis was not feasible.
For each treatment condition, transcriptomic trajectories were reconstructed from the low-dimensional transcriptomic representation generated during preprocessing. Three complementary geometric descriptors were then computed. Trajectory arc length was calculated as the cumulative Euclidean distance between consecutive transcriptomic states and quantified the overall extent of transcriptomic progression during treatment. Net displacement was defined as the Euclidean distance between the initial and final transcriptomic states, representing the overall magnitude of transcriptomic change. Trajectory curvature was estimated from consecutive trajectory segments to quantify changes in the direction of transcriptomic evolution.
Prior to integration, each geometric descriptor was normalized to the interval [0,1] using min–max normalization. The External Response Score (ERS) was then computed as
where the superscript denotes the normalized value of each trajectory descriptor.
To evaluate biological relevance, the External Response Score was compared with experimentally measured changes in cell viability across treatment conditions. Both Pearson product-moment and Spearman rank correlation analyses were performed to quantify the association between transcriptomic trajectory geometry and therapeutic response.
Although GSE149428 does not permit complete nonlinear state-space reconstruction because of its limited temporal resolution, it provides an independent assessment of the general applicability of the proposed framework. Demonstrating that transcriptomic trajectory geometry remains strongly associated with biological treatment response supports the robustness and generalizability of the underlying dynamical concepts across distinct transcriptomic datasets and experimental designs.
2.11. Statistical Analysis
Statistical analyses were performed to evaluate the robustness of the proposed nonlinear dynamical framework and to quantify associations between nonlinear dynamical measures and biological phenotypes. Unless otherwise stated, all statistical tests were two-sided, and statistical significance was assessed at a significance level of .
Associations between continuous variables were evaluated using both the Pearson product-moment correlation coefficient [91,95], which measures linear relationships, and the Spearman rank correlation coefficient [91,96], which assesses monotonic relationships independent of distributional assumptions. Pearson correlation was used to quantify the association between transcriptomic trajectory geometry and experimentally measured cell viability during external validation, as well as between EMT scores and diffusion pseudotime during biological validation. Spearman correlation was computed in parallel to provide a nonparametric assessment of these relationships.
The largest Lyapunov exponent was estimated by ordinary least-squares linear regression [90,91] of the average logarithmic divergence curve over the predefined exponential divergence interval. Regression quality was evaluated using the coefficient of determination (), the regression P value, and the standard error of the estimated slope.
The statistical uncertainty associated with nonlinear dynamical measures was evaluated using nonparametric bootstrap resampling [84] with 300 bootstrap replicates. Bootstrap distributions were used to estimate the mean, standard deviation, and 95% percentile confidence intervals for the largest Lyapunov exponent, Recurrence Quantification Analysis (RQA) metrics, and the bootstrap uncertainty component incorporated into the proposed Transcriptomic Dynamical Instability Score (TDIS).
For the early-warning analysis, bootstrap resampling was additionally used to estimate transcriptomic onset times, composite EMT onset times, lead-time distributions, and their corresponding 95% confidence intervals. The proportion of bootstrap replicates in which local TDIS preceded the composite EMT score was interpreted as the probability of an earlier transcriptomic dynamical transition. To evaluate the stability of onset detection, sensitivity analyses were performed across multiple smoothing parameters and onset-detection thresholds. The fraction of parameter combinations yielding consistent onset ordering was reported as the robustness score for each treatment condition.
No multiple-testing correction was applied because the analyses were designed to evaluate predefined nonlinear dynamical descriptors and biologically established EMT marker sets rather than to perform genome-wide hypothesis testing. All statistical analyses were performed using the SciPy [97], NumPy [98], and pandas [99] Python libraries.
2.12. Software, Computational Environment, and Reproducibility
All computational analyses were implemented in Python using a fully reproducible, modular workflow composed of independently executable scripts corresponding to each stage of the analytical pipeline, including data acquisition, quality control, transcriptomic preprocessing, trajectory reconstruction, nonlinear state-space reconstruction, largest Lyapunov exponent estimation, Recurrence Quantification Analysis (RQA), bootstrap uncertainty analysis, computation of the proposed Transcriptomic Dynamical Instability Score (TDIS), early-warning analysis, biological validation, external validation, and generation of publication-ready figures and tables. The modular implementation enables independent verification of each analytical stage while facilitating future methodological extension and maintenance.
Single-cell transcriptomic preprocessing and trajectory reconstruction were performed using the Scanpy framework [50] together with the AnnData data structure [100]. Numerical computations were carried out using NumPy [98], statistical analyses were performed using SciPy [97] and pandas [99]., and dimensionality reduction and machine learning algorithms were implemented using scikit-learn [101]. Publication-quality figures were generated using Matplotlib [102]. All software packages were open source and executed within a dedicated Python virtual environment to ensure version consistency and computational reproducibility.
The computational workflow was executed on a Linux-based high-performance computing (HPC) environment, where parallel execution and batch processing were employed to efficiently process large transcriptomic datasets and computationally intensive analyses, including bootstrap resampling and Recurrence Quantification Analysis. The workflow used predefined parameter settings and standardized directory structures to ensure deterministic execution and reproducibility across computational environments.
To ensure complete reproducibility, all intermediate datasets, reconstructed transcriptomic state spaces, nonlinear dynamical measures, summary tables, and publication figures were automatically archived using a standardized project directory structure. Metadata files documenting analytical parameters, processing steps, software versions, and generated outputs were also produced to facilitate independent verification and complete reproduction of the computational workflow.
The complete source code, analysis scripts, processed datasets, publication figures, supplementary tables, and documentation are publicly available through the project repository:
The repository includes the complete computational workflow, installation instructions, software dependencies, example datasets, and scripts required to reproduce all analyses presented in this study.
All analyses can be reproduced by executing the pipeline scripts in numerical order, beginning with data acquisition and ending with automated generation of all manuscript figures, tables, and supplementary outputs.
3. Results
To identify the transcriptomic coordinate most suitable for nonlinear state-space reconstruction, seven candidate observables were evaluated independently for each epithelial-to-mesenchymal transition (EMT)-inducing treatment using the objective selection framework described in Section 2.6. The evaluated observables included the first three principal components (PC1–PC3), the first three diffusion components (DC1–DC3), and the cumulative trajectory arc length. The treatment-specific selection results are summarized in Table 4.
The optimal reconstruction observable differed among the three treatments, indicating that transcriptomic dynamics were best represented by different coordinates depending on the biological perturbation. PC3 was selected for EGF, whereas DC1 and DC3 provided the highest-quality eligible reconstructions for TGFβ1 and TNF, respectively. All selected observables satisfied the minimum embedding criterion (), enabling reliable delay-coordinate embedding and subsequent nonlinear dynamical analysis.
Although the cumulative trajectory arc length achieved the highest composite reconstruction score for both the EGF and TNF trajectories, it was excluded because its optimal embedding dimension was , which does not satisfy the theoretical requirements for delay-coordinate reconstruction under Takens’ embedding theorem. Consequently, the framework selected the highest-ranked eligible observable rather than simply the highest-scoring candidate. This result demonstrates that the proposed selection strategy balances reconstruction quality with theoretical validity, thereby avoiding degenerate one-dimensional embeddings.
The complete evaluation of all candidate observables, including the estimated delay time (), embedding dimension (), false-nearest-neighbor (FNN) percentage, composite reconstruction score, eligibility, and final ranking, is provided in Supplementary Table S2.
3.1. Reconstruction of Transcriptomic State Spaces
Using the treatment-specific observables and embedding parameters identified in Section 3.1, transcriptomic state spaces were reconstructed by Takens delay-coordinate embedding. The resulting attractors provide low-dimensional representations of transcriptomic dynamics while preserving the temporal evolution of the underlying biological system.
Figure 7 presents the reconstructed three-dimensional transcriptomic state spaces for the EGF, TGFβ1, and TNF treatment trajectories.
, ), (B) TGFβ1 (DC1, , ), and (C) TNF (DC3, , ). Points are colored according to diffusion pseudotime, illustrating the temporal progression of transcriptomic states along each reconstructed trajectory.
All three treatment conditions produced well-defined three-dimensional state spaces suitable for nonlinear dynamical analysis, confirming that the selected observables and embedding parameters yielded valid delay-coordinate reconstructions. Although each trajectory was reconstructed using the same embedding dimension (m=3), the resulting attractors exhibited distinct geometric organizations, indicating treatment-specific transcriptomic dynamics. The EGF trajectory displayed a broader and more dispersed attractor, consistent with greater variability in transcriptomic evolution. The TGFβ1 trajectory followed a smoother and more continuous progression, suggesting a more coherent dynamical transition through transcriptomic state space. In contrast, the TNF trajectory formed a comparatively compact attractor with localized directional changes, indicating a distinct mode of transcriptomic evolution.
The treatment-specific embedding parameters are summarized in Table 5.
Despite differences in the selected observables and optimal delay times, all three treatments satisfied the requirements for reliable state-space reconstruction. These reconstructed attractors provided the basis for subsequent estimation of the largest Lyapunov exponent, Recurrence Quantification Analysis (RQA), bootstrap uncertainty analysis, and computation of the Transcriptomic Dynamical Instability Score (TDIS).
3.2. Largest Lyapunov Exponent Analysis
The largest Lyapunov exponent (LLE) was estimated for each reconstructed transcriptomic state space to quantify local dynamical instability during epithelial-to-mesenchymal transition (EMT). Positive Lyapunov exponents were obtained for all three treatment conditions, indicating exponential divergence of neighboring transcriptomic trajectories and confirming that transcriptomic evolution exhibits nonlinear dynamical behavior throughout the EMT process.
Figure 8 presents the average logarithmic divergence curves together with the linear regressions used to estimate the largest Lyapunov exponent for each treatment condition.
The divergence curves exhibited a well-defined linear increase during the initial exponential divergence interval for all three treatments, supporting reliable estimation of the largest Lyapunov exponent. Quantitative differences in LLE were observed among the treatment conditions (Table 6). TGFβ1 exhibited the highest exponent (0.0344), indicating the strongest local transcriptomic instability, whereas EGF (0.0136) and TNF (0.0131) showed substantially lower and nearly identical levels of local trajectory divergence. These findings suggest that TGFβ1 induces more rapid divergence of neighboring transcriptomic states, consistent with its stronger dynamical reorganization during epithelial-to-mesenchymal transition.
The complete regression statistics—including the coefficient of determination (), regression standard error, P value, fitting interval, and algorithm parameters—are provided in Supplementary Table S3, whereas the average logarithmic divergence values used for regression are reported in Supplementary Table S4.
Although the largest Lyapunov exponent quantifies local trajectory divergence, it does not characterize the global organization or recurrence structure of reconstructed transcriptomic state spaces. These complementary properties were therefore investigated using Recurrence Quantification Analysis (RQA) in the following section.
3.3. Recurrence Quantification Analysis
To characterize the global organization of the reconstructed transcriptomic state spaces, Recurrence Quantification Analysis (RQA) was performed for each treatment condition. Whereas the largest Lyapunov exponent quantifies local trajectory divergence, RQA provides complementary information by characterizing the global recurrence structure, deterministic organization, and geometric complexity of reconstructed transcriptomic dynamics.
Figure 9 presents the recurrence plots for the reconstructed transcriptomic state spaces.
Although all three treatments were analyzed using a comparable recurrence rate (RR ≈ 0.108), their recurrence structures differed substantially. The EGF trajectory exhibited fragmented diagonal structures interspersed with localized recurrent regions, indicating comparatively weaker deterministic organization. In contrast, the TGFβ1 trajectory displayed long, continuous diagonal structures with minimal fragmentation, consistent with highly organized and deterministic transcriptomic dynamics. The TNF trajectory exhibited an intermediate recurrence pattern characterized by extended diagonal structures together with localized recurrent clusters.
The principal recurrence measures are summarized in Table 7.
Quantitative RQA confirmed marked differences in the global organization of transcriptomic dynamics among the three treatments. TGFβ1 exhibited the highest determinism (DET = 0.926), followed by TNF (0.902), whereas EGF showed substantially lower determinism (0.715), indicating a less organized recurrence structure. Together with the Lyapunov analysis, these results demonstrate that the EMT-inducing perturbations differ not only in local trajectory divergence but also in the global organization of transcriptomic state-space evolution.
The complete set of recurrence statistics—including laminarity, entropy, line-length measures, and bootstrap confidence intervals—is provided in Supplementary Table S5.
3.4. Bootstrap Uncertainty Analysis
To evaluate the statistical robustness of the estimated nonlinear dynamical measures, 300 trajectory-aware bootstrap replicates were generated independently for each reconstructed transcriptomic trajectory. The revised bootstrap procedure preserved the temporal structure required for nonlinear dynamical analysis by resampling valid nearest-neighbor trajectory pairs for largest Lyapunov exponent (LLE) estimation and contiguous subtrajectories for Recurrence Quantification Analysis (RQA). The resulting confidence intervals were subsequently incorporated into the Transcriptomic Dynamical Instability Score (TDIS) as a measure of estimator uncertainty.
Figure 10 presents the bootstrap distributions of the largest Lyapunov exponent for the three treatment conditions.
The trajectory-aware bootstrap analysis demonstrated that the estimated nonlinear dynamical measures were robust across repeated resampling. For all three treatment conditions, the bootstrap distributions were centered close to the original LLE estimates, and the original values were contained within the corresponding 95% confidence intervals, indicating stable and reproducible estimation of transcriptomic dynamical instability. TGFβ1 exhibited the highest bootstrap mean LLE, consistent with its greater local transcriptomic dynamical instability relative to EGF and TNF.
The quantitative bootstrap statistics are summarized in Table 8, while the complete bootstrap calculations used for computation of the Transcriptomic Dynamical Instability Score (TDIS) are provided in Supplementary Table S6.
The complete bootstrap distributions for LLE and the principal RQA metrics, including recurrence rate (RR), determinism (DET), laminarity (LAM), and diagonal line entropy (ENTR), are reported in Supplementary Table S6.
3.5. Transcriptomic Dynamical Instability Score
To provide an integrated assessment of transcriptomic dynamical behavior, the proposed Transcriptomic Dynamical Instability Score (TDIS) was calculated for each treatment condition by combining the nonlinear dynamical measures described in the previous sections. TDIS integrates local dynamical instability, recurrence structure, dynamical complexity, and bootstrap-derived estimation uncertainty into a single quantitative measure of transcriptomic instability.
Figure 11 compares the TDIS values obtained for the three EMT-inducing perturbations.
The proposed score clearly differentiated the three treatment conditions. TGFβ1 exhibited the highest transcriptomic dynamical instability (TDIS = 0.700), followed by EGF (0.309), whereas TNF showed the lowest instability (0.188) (Table 9). This ranking was consistent with the largest Lyapunov exponent, the recurrence quantification measures, and the corrected trajectory-aware bootstrap uncertainty analysis, demonstrating that TDIS effectively integrates complementary nonlinear dynamical characteristics into a single interpretable metric. The substantially higher TDIS observed for TGFβ1 is consistent with its stronger EMT-associated transcriptomic remodeling and greater transcriptomic plasticity relative to EGF and TNF.
The individual components contributing to TDIS are summarized in Table 9, while the complete calculation is provided in Supplementary Table S6.
3.6. Biological Validation Using Canonical EMT Markers
To evaluate the biological relevance of the proposed nonlinear dynamical framework, epithelial and mesenchymal marker expression profiles were examined along the reconstructed diffusion pseudotime trajectories for each treatment condition. Composite epithelial (E) and mesenchymal (M) marker scores were computed for every pseudotime bin, and the EMT score (M − E) was used to quantify transcriptional remodeling during EMT.
Figure 12 presents the evolution of epithelial, mesenchymal, and EMT scores across diffusion pseudotime for the EGF, TGFβ1, and TNF treatments. All three perturbations exhibited progressive remodeling of EMT-associated transcriptional programs, although the magnitude of these changes differed substantially among treatments. TGFβ1 showed the largest overall EMT remodeling, EGF displayed an intermediate response, whereas TNF produced the weakest transcriptomic transition. This ordering closely paralleled the transcriptomic dynamical instability quantified by the proposed Transcriptomic Dynamical Instability Score (TDIS).
To further assess this relationship, the EMT score range was compared with TDIS across the three treatment conditions (Figure 13). Treatments with higher TDIS values exhibited larger EMT score ranges, indicating that increased transcriptomic dynamical instability was associated with greater biological remodeling during EMT. Although only three treatment conditions were available, the strong concordance between EMT remodeling and TDIS supports the biological relevance of the proposed nonlinear dynamical framework.
The complete quantitative summary of EMT progression metrics is provided in Table 10, while correlation statistics between EMT-derived measures and nonlinear dynamical metrics are reported in Supplementary Table S7.
3.7. Early Detection of Transcriptomic State Transitions
To evaluate whether the TDIS functions as an early-warning indicator of cellular state transitions, we compared the onset of local TDIS with the onset of canonical EMT transcriptional activation along the pseudotime trajectory for each treatment condition. Local TDIS was computed within sliding windows along diffusion pseudotime, whereas EMT progression was quantified using the composite EMT score derived from canonical epithelial and mesenchymal marker genes. Bootstrap resampling was subsequently performed to estimate confidence intervals for the detected lead times, quantify the probability that local TDIS preceded the EMT transition, and assess the robustness of the inferred temporal ordering.
Figure 14A illustrates the temporal evolution of local TDIS and the composite EMT score for EGF-, TGFβ1-, and TNF-treated cells. For EGF stimulation, local TDIS increased at diffusion pseudotime 0.17, whereas the composite EMT score began its sustained increase at pseudotime 0.26, yielding a median lead time of 0.18 pseudotime units (95% CI: 0.09–0.21). The bootstrap analysis assigned a probability of 1.00 that local TDIS preceded the EMT transition, providing strong evidence that transcriptomic dynamical instability emerged before the major transcriptional reprogramming associated with EMT.
A similar trend was observed for TGFβ1 stimulation. Local TDIS increased at pseudotime 0.17, while the composite EMT transition occurred substantially later at pseudotime 0.45. The estimated median lead time was 0.28 pseudotime units, representing the largest temporal separation among the three treatments. However, the bootstrap confidence interval included zero (95% CI: −0.02 to 0.28), and the probability that local TDIS preceded EMT was 0.93, indicating moderate evidence for early detection but greater statistical uncertainty than observed for EGF. This greater uncertainty likely reflects the smaller number of cells available for the TGFβ1 trajectory together with the slower and more heterogeneous transcriptional response.
In contrast, TNF stimulation exhibited a different temporal relationship. Local TDIS and the composite EMT score increased almost simultaneously, with the composite EMT transition occurring marginally earlier than local TDIS (median lead time = −0.01 pseudotime units; 95% CI: −0.01 to 0.00). The bootstrap probability that local TDIS preceded EMT was 0.00, indicating that no early-warning behavior was detected for this inflammatory response. These observations are consistent with the biological role of TNF, which primarily induces inflammatory transcriptional programs rather than driving a complete epithelial-to-mesenchymal transition.
The bootstrap lead-time estimates are summarized in Figure 14B and Table 11. Positive lead times indicate that local TDIS preceded the corresponding EMT transition, whereas negative values indicate that biological marker activation occurred first. Together, these results demonstrate strong evidence for early-warning behavior under EGF stimulation, moderate but less certain evidence for TGFβ1, and no evidence for TNF, suggesting that the predictive capability of TDIS depends on the underlying signaling pathway.
To further investigate the biological relationship between transcriptomic instability and EMT progression, onset times were compared with individual canonical EMT markers (Figure 14C). Under EGF stimulation, local TDIS increased before most EMT-associated genes, including CDH1, VIM, FN1, ZEB1, and SNAI1, indicating that dynamical instability developed prior to widespread activation of the EMT transcriptional program. Similar trends were observed for several markers under TGFβ1 stimulation, although greater variability was evident, and one marker (VIM) did not exhibit a clearly detectable onset within the analyzed trajectory. In contrast, marker activation under TNF generally coincided with or slightly preceded the increase in local TDIS, reinforcing the absence of a measurable early-warning interval.
The robustness of these conclusions was further evaluated through bootstrap resampling and sensitivity analysis (Figure 14D). The probability that local TDIS preceded the composite EMT transition reached 1.00 for EGF and 0.93 for TGFβ1, whereas TNF exhibited no evidence of early detection. Sensitivity analyses across multiple onset-detection thresholds demonstrated high robustness for EGF and moderate robustness for TNF, while the lower robustness observed for TGFβ1 reflected increased uncertainty arising from limited sampling and weaker trajectory separation. Importantly, despite this uncertainty, the inferred temporal ordering remained consistent across most bootstrap replicates.
Overall, these findings demonstrate that transcriptomic dynamical instability can emerge before canonical EMT-associated transcriptional reprogramming in signaling pathways that induce robust epithelial-to-mesenchymal transition. These results demonstrate that transcriptomic dynamical instability is not a universal early-warning signal but rather a pathway-dependent indicator of critical cellular state transitions. It exhibited strong predictive performance for EGF, moderate evidence for TGFβ1, and no detectable lead for TNF. This treatment-specific behavior suggests that TDIS captures the onset of dynamical reorganization preceding phenotypic commitment only in biological systems where transcriptomic instability is an intrinsic component of the transition process.
3.8. External Validation Using the GSE149428 Dataset
To assess the generalizability of the proposed framework, independent validation was performed using the GSE149428 breast cancer treatment-response dataset. Because each treatment trajectory contained only six temporal observations, reliable nonlinear state-space reconstruction was not feasible. Instead, transcriptomic trajectory geometry was quantified using trajectory arc length, net displacement, and curvature, which were integrated into an External Response Score (ERS). This score was then compared with experimentally measured treatment-induced changes in cell viability.
Figure 15 shows the relationship between the transcriptomic trajectory response score and the measured viability response across the seven treatment conditions.
The External Response Score exhibited a strong positive association with treatment-induced changes in cell viability (Pearson r = 0.891, p = 0.007; Spearman ρ = 0.821, p = 0.023). Treatments producing larger transcriptomic trajectory responses consistently induced greater reductions in cell viability, whereas DMSO exhibited both the smallest trajectory response and the weakest biological effect. These findings demonstrate that transcriptomic trajectory geometry captures biologically meaningful treatment responses in an independent dataset despite differences in sequencing technology, experimental design, and temporal sampling. The quantitative validation results are summarized in Table 12.
Independent validation using GSE149428 demonstrated that transcriptomic trajectory geometry strongly predicts experimentally measured treatment response, supporting the robustness, biological relevance, and generalizability of the proposed framework beyond the primary method-development dataset.
4. Discussion
Understanding when cells approach critical transcriptomic state transitions remains a fundamental challenge in cancer biology, as conventional transcriptomic analyses primarily characterize static molecular differences rather than the dynamic processes governing cellular evolution. In this study, we developed a nonlinear dynamical systems framework that reconstructs transcriptomic trajectories from diffusion pseudotime and quantifies their stability using complementary measures derived from nonlinear dynamical systems theory. As summarized in Figure 16, the proposed framework integrates state-space reconstruction, largest Lyapunov exponent estimation, Recurrence Quantification Analysis (RQA), trajectory-aware bootstrap uncertainty estimation, the Transcriptomic Dynamical Instability Score (TDIS), biological validation using canonical EMT markers, early-warning analysis of transcriptomic state transitions, and independent external validation into a unified computational pipeline.
The results demonstrate that nonlinear dynamical characteristics capture biologically meaningful differences among treatment conditions, correlate with the extent of epithelial-to-mesenchymal transition (EMT) remodeling, and generalize to an independent treatment-response dataset. More importantly, the early-warning analysis showed that local TDIS preceded the onset of canonical EMT-associated transcriptional reprogramming for EGF stimulation, provided moderate evidence for TGFβ1, and showed no detectable lead for TNF, indicating that the predictive capability of transcriptomic instability is pathway dependent rather than universal. Collectively, these findings suggest that transcriptomic instability represents an informative systems-level property of cellular state transitions that complements conventional gene-centric analyses and provides a quantitative framework for investigating dynamic biological processes in cancer.
4.1. Principal Findings
This study presents a nonlinear dynamical systems framework for characterizing transcriptomic state transitions during cancer progression. Unlike conventional transcriptomic approaches, which primarily identify differential gene expression or infer pseudotemporal ordering, the proposed framework reconstructs transcriptomic trajectories as nonlinear dynamical systems and quantifies their stability using complementary measures derived from nonlinear dynamical systems theory. By integrating Takens delay-coordinate embedding, the largest Lyapunov exponent (LLE), Recurrence Quantification Analysis (RQA), trajectory-aware bootstrap uncertainty estimation, and the proposed Transcriptomic Dynamical Instability Score (TDIS), the framework provides a unified systems-level representation of cellular state transitions.
Application of the framework to the A549 epithelial-to-mesenchymal transition (EMT) dataset demonstrated that different EMT-inducing stimuli generate distinct transcriptomic dynamical behaviors. Data-driven observable selection enabled robust state-space reconstruction for each treatment, while Lyapunov and recurrence analyses consistently distinguished their underlying dynamical organization. Trajectory-aware bootstrap resampling further demonstrated that these nonlinear descriptors were statistically robust, supporting their reliability for quantifying transcriptomic dynamics.
A principal finding of this study is that integrating multiple nonlinear descriptors into the proposed TDIS produced a more comprehensive measure of transcriptomic instability than any individual metric alone. The resulting treatment ranking, with TGFβ1 exhibiting the highest instability, followed by EGF and TNF, closely paralleled the extent of EMT-associated transcriptional remodeling, indicating that transcriptomic dynamical instability reflects biologically meaningful changes in cellular state rather than numerical properties of the reconstructed trajectories.
Another important finding is that local TDIS identified transcriptomic dynamical changes preceding canonical EMT-associated transcriptional reprogramming for EGF stimulation, provided moderate evidence for TGFβ1, and showed no detectable lead for TNF. These results demonstrate that the predictive capability of transcriptomic instability is pathway dependent, suggesting that nonlinear transcriptomic dynamics capture early cellular reorganization in signaling pathways undergoing progressive phenotypic transitions rather than serving as a universal predictor across all biological stimuli.
Finally, independent validation using the GSE149428 treatment-response dataset demonstrated that transcriptomic trajectory geometry remained strongly associated with experimentally measured treatment response despite differences in sequencing technology, experimental design, and temporal sampling. This successful external validation indicates that the proposed framework captures general characteristics of transcriptomic dynamics that extend beyond a single dataset and provides a quantitative foundation for studying dynamic cellular reprogramming, identifying early-warning signals of cellular state transitions, and investigating treatment response in cancer.
4.2. Biological Interpretation
The observed differences in transcriptomic dynamical instability among the three EMT-inducing treatments are consistent with their established biological roles in regulating epithelial-to-mesenchymal transition (EMT). TGFβ1 produced the highest TDIS and the greatest EMT-associated transcriptional remodeling, reflecting its well-established role as a master regulator of EMT and cellular plasticity. EGF induced an intermediate level of transcriptomic instability, whereas TNF exhibited comparatively weaker dynamical changes, indicating that these stimuli promote distinct degrees of transcriptomic reorganization despite partial overlap in their downstream signaling pathways.
An important observation is that increased transcriptomic dynamical instability was accompanied by larger changes in canonical EMT marker expression. The close agreement between TDIS and EMT remodeling suggests that the reconstructed nonlinear dynamics capture biologically meaningful cellular reprogramming rather than merely reflecting mathematical properties of the reconstructed trajectories. Consequently, transcriptomic instability represents a systems-level measure of coordinated cellular state transitions that complements conventional analyses based on differential gene expression or individual molecular markers.
The early-warning analysis provides additional biological insight into the temporal organization of these transitions. Under EGF stimulation, local TDIS consistently increased before the onset of canonical EMT-associated transcriptional reprogramming, suggesting that transcriptomic instability emerges during the initial stages of cellular reorganization before widespread activation of EMT marker genes. TGFβ1 exhibited a similar temporal trend but with greater statistical uncertainty, likely reflecting increased biological heterogeneity and the more gradual progression of the transcriptional response. In contrast, TNF showed no detectable early-warning interval, indicating that inflammatory transcriptional activation occurred simultaneously with, or slightly before, the increase in transcriptomic dynamical instability. These observations demonstrate that the predictive capability of TDIS is pathway dependent rather than representing a universal feature of all cellular state transitions.
More broadly, these findings support the hypothesis that critical cellular transitions can be viewed as dynamical processes evolving within high-dimensional transcriptomic state spaces. From this perspective, nonlinear dynamical measures characterize how cellular states evolve, whereas conventional transcriptomic analyses primarily describe which genes change in expression. The proposed framework therefore provides complementary information by quantifying the stability, organization, and temporal evolution of transcriptomic trajectories. This systems-level perspective may improve our understanding of cancer progression, therapeutic response, and other biological processes involving coordinated cellular state transitions.
4.3. Comparison with Existing Approaches
Most existing transcriptomic trajectory analysis methods focus on reconstructing cellular progression or identifying genes associated with biological state transitions. Dimensionality reduction techniques, including principal component analysis (PCA), diffusion maps, and Uniform Manifold Approximation and Projection (UMAP), provide low-dimensional representations of transcriptomic data, whereas trajectory inference algorithms such as diffusion pseudotime estimate the temporal ordering of cells along developmental or disease-associated processes. Although these approaches have substantially advanced the study of cellular heterogeneity, they primarily describe the geometry of transcriptomic trajectories rather than the dynamical stability underlying cellular state transitions.
Several computational methods have also been developed to identify critical transitions in biological systems, including Dynamic Network Biomarkers (DNB), RNA velocity, critical transition indices, and gene regulatory network analyses. These approaches provide valuable insights into early-warning signals, transcriptional directionality, or regulatory interactions, but they generally do not reconstruct the underlying transcriptomic state space or directly quantify its nonlinear dynamical behavior. Consequently, they provide limited information about the global stability and temporal organization of evolving cellular states.
The proposed framework differs by treating transcriptomic progression as the evolution of a nonlinear dynamical system. Rather than analyzing individual genes or local trajectory geometry alone, it reconstructs transcriptomic state spaces using Takens delay-coordinate embedding and characterizes their stability through complementary nonlinear descriptors integrated into the Transcriptomic Dynamical Instability Score (TDIS). This systems-level representation enables quantitative assessment of transcriptomic instability while preserving the continuous nature of cellular state transitions.
An additional distinction of the proposed methodology is its data-driven observable selection strategy. Instead of assuming that a predefined transcriptomic coordinate adequately represents the underlying dynamics, candidate observables are objectively evaluated using nonlinear reconstruction criteria before state-space reconstruction. This reduces observer bias, enables treatment-specific reconstruction of transcriptomic dynamics, and improves the robustness of downstream nonlinear analyses.
Beyond quantifying transcriptomic instability, the proposed framework demonstrates that nonlinear dynamical analysis can provide early-warning information preceding canonical transcriptional reprogramming. Unlike conventional trajectory inference methods, which primarily reconstruct cellular progression, local TDIS identified pathway-dependent transcriptomic dynamical changes preceding EMT-associated transcriptional activation for EGF, provided moderate evidence for TGFβ1, and showed no detectable lead for TNF. These findings suggest that nonlinear dynamical analysis complements existing trajectory-based approaches by characterizing when cellular systems begin to reorganize, rather than only describing how they evolve.
Together with the biological validation using canonical EMT markers and the independent validation using the GSE149428 treatment-response dataset, these results demonstrate that nonlinear dynamical systems theory provides a complementary computational framework for investigating cellular state transitions, quantifying transcriptomic instability, and identifying pathway-dependent early-warning signals of biological reprogramming.
4.4. Strengths and Limitations
The proposed framework has several strengths that distinguish it from conventional transcriptomic trajectory analysis methods. First, it provides a unified nonlinear dynamical framework that reconstructs transcriptomic state spaces and quantitatively characterizes their stability rather than relying solely on differential gene expression or static low-dimensional representations. Second, the data-driven observable selection strategy minimizes observer bias by objectively identifying the most informative transcriptomic coordinate for state-space reconstruction under each biological condition. Third, the integration of complementary nonlinear descriptors into the Transcriptomic Dynamical Instability Score (TDIS) yields a single, interpretable measure of transcriptomic instability that combines local trajectory divergence, recurrence structure, dynamical complexity, and trajectory-aware bootstrap-derived estimation uncertainty. Finally, the framework was biologically validated using canonical EMT marker dynamics, demonstrated pathway-dependent early-warning behavior preceding EMT-associated transcriptional reprogramming, and was independently validated using an external treatment-response dataset, supporting its robustness, biological relevance, and generalizability.
Several limitations should also be acknowledged. The nonlinear reconstruction relies on accurate transcriptomic trajectory inference and therefore depends on the quality of pseudotime estimation, the density of cellular sampling, and the assumption that inferred pseudotime faithfully represents the underlying biological progression. Reliable delay-coordinate embedding additionally requires sufficiently long trajectories, restricting full nonlinear reconstruction to the single-cell RNA-sequencing dataset and necessitating a geometry-based validation strategy for the more sparsely sampled bulk RNA-sequencing dataset. Furthermore, although local TDIS provided robust early-warning behavior for EGF stimulation and moderate evidence for TGFβ1, no detectable lead was observed for TNF, indicating that transcriptomic dynamical instability is not a universal early-warning indicator across all signaling pathways. Finally, the present study focused on EMT as a representative model of transcriptomic state transitions. Additional validation across diverse cancer types, developmental systems, longitudinal patient-derived datasets, and prospective time-course experiments will be necessary to establish the broader applicability and clinical utility of the framework.
Despite these limitations, the proposed framework demonstrates that nonlinear dynamical systems theory provides biologically meaningful information that complements existing transcriptomic analysis methods. The consistent agreement between nonlinear dynamical measures, EMT-associated transcriptional remodeling, pathway-dependent early-warning behavior, and independent external validation suggests that transcriptomic dynamical instability captures fundamental properties of cellular state transitions rather than dataset-specific characteristics. Collectively, these findings establish TDIS as a complementary systems-level framework for quantifying transcriptomic dynamics and investigating critical cellular state transitions in cancer.
4.5. Future Directions
The present study establishes a nonlinear dynamical framework for characterizing transcriptomic state transitions using publicly available transcriptomic datasets. Several opportunities exist to extend this methodology. First, the framework should be evaluated across a broader range of biological systems, including cancer progression, drug resistance, stem cell differentiation, immune cell activation, and developmental processes, to determine the generality of transcriptomic dynamical instability as a systems-level descriptor of cellular state transitions.
Second, future studies should investigate the integration of transcriptomic dynamics with complementary multi-omics measurements, including epigenomic, proteomic, metabolomic, and chromatin accessibility data. Such multimodal analyses may provide a more comprehensive representation of cellular dynamics and improve the identification of critical state transitions that cannot be fully captured by transcriptomic information alone.
Another important direction is the application of the framework to longitudinal patient-derived datasets. Quantifying transcriptomic instability during disease progression or therapeutic intervention may enable the identification of early-warning signals associated with treatment response, disease recurrence, or the emergence of drug resistance. Beyond serving as a measure of transcriptomic instability, the proposed Transcriptomic Dynamical Instability Score (TDIS) may also provide a quantitative biomarker for monitoring the temporal evolution of cellular states.
Beyond epithelial-to-mesenchymal transition, the proposed framework has broad translational potential in biological systems characterized by dynamic cellular state transitions. One particularly promising application is CAR-T-cell therapy, where longitudinal single-cell transcriptomic profiling could determine whether transcriptomic instability precedes T-cell exhaustion, loss of proliferative capacity, terminal differentiation, or therapeutic failure. Similarly, applying the framework to malignant cells may reveal whether increasing transcriptomic instability anticipates antigen escape, lineage plasticity, or the emergence of therapy-resistant clones before conventional molecular biomarkers become detectable. Future studies jointly analyzing CAR-T-cell and tumor-cell trajectories may establish transcriptomic dynamical instability as a general early-warning biomarker for treatment response, disease evolution, and acquired therapeutic resistance.
From a computational perspective, future work should explore alternative state-space reconstruction strategies, adaptive embedding techniques, graph-based dynamical representations, and machine learning approaches for automated observable selection and instability prediction. Integrating nonlinear dynamical systems theory with modern artificial intelligence models may further improve scalability, robustness, interpretability, and applicability to increasingly large single-cell and spatial transcriptomic datasets.
Overall, this study demonstrates that nonlinear dynamical systems theory provides a powerful complementary framework for studying cellular state transitions from high-dimensional transcriptomic data. As longitudinal, single-cell, spatial, and multi-omics datasets continue to expand, quantitative measures of transcriptomic dynamical instability have the potential to evolve from descriptive computational metrics into mechanistically informed, systems-level biomarkers for investigating cancer progression, therapeutic response, immunotherapy, and other complex biological processes involving dynamic cellular reprogramming.
5. Conclusions
This study presents a novel nonlinear dynamical systems framework for identifying and characterizing transcriptomic state transitions during cancer progression. By integrating diffusion pseudotime trajectory reconstruction, data-driven observable selection, Takens delay-coordinate embedding, largest Lyapunov exponent estimation, Recurrence Quantification Analysis (RQA), trajectory-aware bootstrap uncertainty analysis, and the proposed Transcriptomic Dynamical Instability Score (TDIS), the framework provides a unified, reproducible, and interpretable approach for quantifying transcriptomic instability from high-dimensional single-cell gene expression data.
Application of the framework to a single-cell RNA-sequencing model of epithelial-to-mesenchymal transition (EMT) demonstrated that transcriptomic trajectories exhibit distinct nonlinear dynamical behaviors under different biological perturbations. The reconstructed state spaces revealed treatment-specific differences in local dynamical instability, recurrence structure, and overall transcriptomic organization. Integrating these complementary nonlinear descriptors into TDIS enabled quantitative discrimination of transcriptomic state transitions and produced instability rankings that closely paralleled the extent of canonical EMT-associated transcriptional remodeling. Importantly, the proposed framework also demonstrated that local TDIS can provide an early-warning signal of impending transcriptomic state transitions, preceding canonical EMT-associated transcriptional reprogramming for EGF stimulation, providing moderate evidence for TGFβ1, and showing no detectable lead for TNF. These findings demonstrate that the predictive capability of transcriptomic instability is pathway dependent rather than a universal feature of all biological perturbations.
Independent validation using an external treatment-response dataset further demonstrated that transcriptomic trajectory geometry remained strongly associated with experimentally measured biological response, supporting the robustness, biological relevance, and generalizability of the proposed framework. Beyond its application to EMT, this work introduces a conceptual shift in transcriptomic analysis by treating cellular state transitions as evolving nonlinear dynamical systems rather than as a sequence of independent molecular measurements. This systems-level perspective complements conventional gene-centric analyses by providing quantitative measures of transcriptomic stability, trajectory organization, and critical state transitions that cannot be captured through differential expression analysis alone.
Overall, this study establishes a foundation for applying nonlinear dynamical systems theory to transcriptomics and demonstrates its potential to provide new insights into cancer progression, cellular reprogramming, and treatment response. As increasingly dense longitudinal, single-cell, spatial, and multi-omics datasets become available, the proposed framework provides a scalable and extensible platform for investigating dynamic biological processes, identifying pathway-dependent early-warning signals of critical cellular state transitions, and advancing quantitative systems biology approaches for cancer research and precision medicine.
Supplementary Materials
The following supporting information can be downloaded at the website of this paper posted on Preprints.org.
Data Availability: The transcriptomic datasets analyzed in this study are publicly available from the Gene Expression Omnibus (GEO) under accession numbers GSE147405 and GSE149428. All source code, analysis scripts, processed data, supplementary tables, documentation, and the complete computational pipeline required to reproduce the analyses are openly available in the Transcriptomic Dynamics GitHub repository at: https://github.com/hamiddi/transcriptomic-dynamics.
Acknowledgments
The authors would like to express their sincere gratitude to the Computational Data Science and Engineering Department at North Carolina A&T State University and the Department of Electrical and Energy Engineering at the German Jordanian University (GJU) for their continuous support throughout this research. The authors also acknowledge the Visualization, Computing, and Applied Research (ViCAR) Laboratory at North Carolina A&T State University for providing an outstanding collaborative research environment and computational resources that supported this work. Finally, the authors would like to express their sincere appreciation to the Steps4Growth program at North Carolina A&T State University for fostering an innovative research environment through the development of smart microgrid and digital twin technologies, which inspired several aspects of this research.
References
- Hanahan, D.; Weinberg, R.A. Hallmarks of cancer: the next generation. cell 2011, 144(5), 646–674. [Google Scholar] [CrossRef] [PubMed]
- Hanahan, D. Hallmarks of cancer: new dimensions. Cancer Discov. 2022, 12(1), 31–46. [Google Scholar] [CrossRef] [PubMed]
- Greaves, M.; Maley, C.C. Clonal evolution in cancer. Nature 2012, 481(7381), 306–313. [Google Scholar] [CrossRef] [PubMed]
- Nowell, P.C. The clonal evolution of tumor cell populations. Science 1976, 194(4260), 23–8. [Google Scholar] [CrossRef] [PubMed]
- Lambert, A.W.; Pattabiraman, D.R.; Weinberg, R.A. Emerging Biological Principles of Metastasis. Cell 2017, 168(4), 670–691. [Google Scholar] [CrossRef] [PubMed]
- Dongre, A.; Weinberg, R.A. New insights into the mechanisms of epithelial–mesenchymal transition and implications for cancer. Nat. Rev. Mol. Cell Biol. 2019, 20(2), 69–84. [Google Scholar] [CrossRef] [PubMed]
- Alon, U. An introduction to systems biology: design principles of biological circuits; Chapman and Hall/CRC, 2019. [Google Scholar]
- Huang, S. Gene expression profiling, genetic networks, and cellular states: an integrating concept for tumorigenesis and drug discovery. J. Mol. Med. (Berl) 1999, 77(6), 469–80. [Google Scholar] [CrossRef] [PubMed]
- Tyson, J.J.; Novák, B. Functional motifs in biochemical reaction networks. Annu. Rev. Phys. Chem. 2010, 61(1), 219–240. [Google Scholar] [CrossRef] [PubMed]
- Kauffman, S.A. The Origins of Order: Self-Organization and Selection in Evolution; Oxford University Press, 1993. [Google Scholar]
- Suvà, M.L.; Tirosh, I. Single-cell RNA sequencing in cancer: lessons learned and emerging challenges. Mol. Cell 2019, 75(1), 7–12. [Google Scholar] [CrossRef] [PubMed]
- Baslan, T.; Hicks, J. Unravelling biology and shifting paradigms in cancer with single-cell sequencing. Nat. Rev. Cancer 2017, 17(9), 557–569. [Google Scholar] [CrossRef] [PubMed]
- Heumos, L.; et al. Best practices for single-cell analysis across modalities. Nat. Rev. Genet 2023, 24(8), 550–572. [Google Scholar] [CrossRef] [PubMed]
- Kitano, H. Systems biology: a brief overview. Science 2002, 295(5560), 1662–4. [Google Scholar] [CrossRef] [PubMed]
- Ideker, T.; Krogan, N.J. Differential network biology. Mol. Syst. Biol. 2012, 8, 565. [Google Scholar] [CrossRef] [PubMed]
- Waddington, C.H. The strategy of the genes; Routledge, 2014. [Google Scholar]
- MacLean, A.L.; Hong, T.; Nie, Q. Exploring intermediate cell states through the lens of single cells. Curr. Opin. Syst. Biol. 2018, 9, 32–41. [Google Scholar] [CrossRef] [PubMed]
- Huang, S. Reprogramming cell fates: reconciling rarity with robustness. Bioessays 2009, 31(5), 546–60. [Google Scholar] [CrossRef] [PubMed]
- Mojtahedi, M.; et al. Cell Fate Decision as High-Dimensional Critical State Transition. PLoS Biol. 2016, 14(12), e2000640. [Google Scholar] [CrossRef] [PubMed]
- Richard, A.; et al. Single-Cell-Based Analysis Highlights a Surge in Cell-to-Cell Molecular Variability Preceding Irreversible Commitment in a Differentiation Process. PLoS Biol. 2016, 14(12), e1002585. [Google Scholar] [CrossRef] [PubMed]
- Thiery, J.P.; et al. Epithelial-mesenchymal transitions in development and disease. cell 2009, 139(5), 871–890. [Google Scholar] [CrossRef] [PubMed]
- Nieto, M.A. Emt. Cell 2016, 166(1), 21–45. [PubMed]
- Brabletz, T.; et al. EMT in cancer. Nat. Rev. Cancer 2018, 18(2), 128–134. [Google Scholar] [CrossRef] [PubMed]
- Yang, J.; et al. Guidelines and definitions for research on epithelial–mesenchymal transition. Nat. Rev. Mol. Cell Biol. 2020, 21(6), 341–352. [Google Scholar] [CrossRef] [PubMed]
- Pastushenko, I.; Blanpain, C. EMT transition states during tumor progression and metastasis. Trends Cell Biol. 2019, 29(3), 212–226. [Google Scholar] [CrossRef] [PubMed]
- Pastushenko, I.; et al. Identification of the tumour transition states occurring during EMT. Nature 2018, 556(7702), 463–468. [Google Scholar] [CrossRef] [PubMed]
- Jolly, M.K.; Mani, S.A.; Levine, H. Hybrid epithelial/mesenchymal phenotype (s): The ‘fittest’for metastasis? Biochim. Et. Biophys. Acta (BBA) -Rev. Cancer 2018, 1870(2), 151–157. [Google Scholar] [CrossRef] [PubMed]
- Cook, D.P.; Vanderhyden, B.C. Context specificity of the EMT transcriptional response. Nat. Commun. 2020, 11(1), 2142. [Google Scholar] [CrossRef] [PubMed]
- Lu, W.; Kang, Y. Epithelial-mesenchymal plasticity in cancer progression and metastasis. Dev. Cell 2019, 49(3), 361–374. [Google Scholar] [CrossRef] [PubMed]
- Williams, E.D.; et al. Controversies around epithelial-mesenchymal plasticity in cancer metastasis. Nat. Rev. Cancer 2019, 19(12), 716–732. [Google Scholar] [CrossRef] [PubMed]
- Aiello, N.M.; Kang, Y. Context-dependent EMT programs in cancer metastasis. J. Exp. Med. 2019, 216(5), 1016–1026. [Google Scholar] [CrossRef] [PubMed]
- Tang, F.; et al. mRNA-Seq whole-transcriptome analysis of a single cell. Nat. Methods 2009, 6(5), 377–382. [Google Scholar] [CrossRef] [PubMed]
- Svensson, V.; Vento-Tormo, R.; Teichmann, S.A. Exponential scaling of single-cell RNA-seq in the past decade. Nat. Protoc. 2018, 13(4), 599–604. [Google Scholar] [CrossRef] [PubMed]
- Stuart, T.; Satija, R. Integrative single-cell analysis. Nat. Rev. Genet. 2019, 20(5), 257–272. [Google Scholar] [CrossRef] [PubMed]
- Lähnemann, D.; et al. Eleven grand challenges in single-cell data science. Genome Biol. 2020, 21(1), 31. [Google Scholar] [CrossRef] [PubMed]
- Wang, Y.; Navin, N.E. Advances and applications of single-cell sequencing technologies. Mol. Cell 2015, 58(4), 598–609. [Google Scholar] [CrossRef] [PubMed]
- Regev, A.; et al. The Human Cell Atlas. Elife 2017. [Google Scholar] [CrossRef] [PubMed]
- Jones, R.C.; et al. The Tabula Sapiens: A multiple-organ, single-cell transcriptomic atlas of humans. Science 2022, 376(6594), eabl4896. [Google Scholar] [CrossRef] [PubMed]
- Hao, Y.; et al. Integrated analysis of multimodal single-cell data. Cell 2021, 184(13), 3573–3587.e29. [Google Scholar] [CrossRef] [PubMed]
- Luecken, M.D.; Theis, F.J. Current best practices in single-cell RNA-seq analysis: a tutorial. Mol. Syst. Biol. 2019, 15(6), MSB188746. [Google Scholar] [CrossRef] [PubMed]
- Neftel, C.; et al. An Integrative Model of Cellular States, Plasticity, and Genetics for Glioblastoma. Cell 2019, 178(4), 835–849.e21. [Google Scholar] [CrossRef] [PubMed]
- Maynard, A.; et al. Therapy-Induced Evolution of Human Lung Cancer Revealed by Single-Cell RNA Sequencing. Cell 2020, 182(5), 1232–1251.e22. [Google Scholar] [CrossRef] [PubMed]
- Wu, S.Z.; et al. A single-cell and spatially resolved atlas of human breast cancers. Nat. Genet 2021, 53(9), 1334–1347. [Google Scholar] [CrossRef] [PubMed]
- Lähnemann, D.; et al. Eleven grand challenges in single-cell data science. Genome Biol. 2020, 21(1), 31. [Google Scholar] [CrossRef] [PubMed]
- Kinker, G.S.; et al. Pan-cancer single-cell RNA-seq identifies recurring programs of cellular heterogeneity. Nat. Genet 2020, 52(11), 1208–1218. [Google Scholar] [CrossRef] [PubMed]
- Kim, C.; et al. Chemoresistance Evolution in Triple-Negative Breast Cancer Delineated by Single-Cell Sequencing. Cell 2018, 173(4), 879–893.e13. [Google Scholar] [CrossRef] [PubMed]
- Trapnell, C.; et al. The dynamics and regulators of cell fate decisions are revealed by pseudotemporal ordering of single cells. Nat. Biotechnol. 2014, 32(4), 381–386. [Google Scholar] [CrossRef] [PubMed]
- Haghverdi, L.; et al. Diffusion pseudotime robustly reconstructs lineage branching. Nat. Methods 2016, 13(10), 845–848. [Google Scholar] [CrossRef] [PubMed]
- Saelens, W.; et al. A comparison of single-cell trajectory inference methods. Nat. Biotechnol. 2019, 37(5), 547–554. [Google Scholar] [CrossRef] [PubMed]
- Wolf, F.A.; Angerer, P.; Theis, F.J. SCANPY: large-scale single-cell gene expression data analysis. Genome Biol. 2018, 19(1), 15. [Google Scholar] [CrossRef] [PubMed]
- Street, K.; et al. Slingshot: cell lineage and pseudotime inference for single-cell transcriptomics. BMC Genom. 2018, 19(1), 477. [Google Scholar] [CrossRef] [PubMed]
- Wolf, F.A.; et al. PAGA: graph abstraction reconciles clustering with trajectory inference through a topology preserving map of single cells. Genome Biol. 2019, 20(1), 59. [Google Scholar] [CrossRef] [PubMed]
- Setty, M.; et al. Wishbone identifies bifurcating developmental trajectories from single-cell data. Nat. Biotechnol. 2016, 34(6), 637–45. [Google Scholar] [CrossRef] [PubMed]
- Cannoodt, R.; Saelens, W.; Saeys, Y. Computational methods for trajectory inference from single-cell transcriptomics. Eur. J. Immunol. 2016, 46(11), 2496–2506. [Google Scholar] [CrossRef] [PubMed]
- La Manno, G.; et al. RNA velocity of single cells. Nature 2018, 560(7719), 494–498. [Google Scholar] [CrossRef] [PubMed]
- Bergen, V.; et al. Generalizing RNA velocity to transient cell states through dynamical modeling. Nat. Biotechnol. 2020, 38(12), 1408–1414. [Google Scholar] [CrossRef] [PubMed]
- Gorin, G.; et al. RNA velocity unraveled. PLoS Comput Biol. 2022, 18(9), e1010492. [Google Scholar] [CrossRef] [PubMed]
- Qiu, X.; et al. Mapping transcriptomic vector fields of single cells. Cell 2022, 185(4), 690–711.e45. [Google Scholar] [CrossRef] [PubMed]
- Coifman, R.R.; Lafon, S. Diffusion maps. Appl. Comput. Harmon. Anal. 2006, 21(1), 5–30. [Google Scholar] [CrossRef]
- McInnes, L.; Healy, J.; Melville, J. Umap: Uniform manifold approximation and projection for dimension reduction. arXiv 2018, arXiv:1802.03426. [Google Scholar]
- Maaten, L.; Hinton, G.E. Visualizing Data using t-SNE. J. Mach. Learn. Res. 2008, 9, 2579–2605. [Google Scholar]
- Scheffer, M.; et al. Early-warning signals for critical transitions. Nature 2009, 461(7260), 53–9. [Google Scholar] [CrossRef] [PubMed]
- Scheffer, M. Critical transitions in nature and society; Princeton university press, 2009; Vol. 16. [Google Scholar]
- Dakos, V.; et al. Methods for detecting early warnings of critical transitions in time series illustrated using simulated ecological data. PLoS ONE 2012, 7(7), e41010. [Google Scholar] [CrossRef] [PubMed]
- Strogatz, S. Nonlinear dynamics and chaos: with applications to physics, biology, chemistry, and engineering, 2nd edn; Westview Press.[Google Scholar: Boulder. CO, 2015. [Google Scholar]
- Ott, E. Chaos in Dynamical Systems, 2 ed.; Cambridge University Press: Cambridge, 2002. [Google Scholar]
- Kantz, H.; Schreiber, T. Nonlinear time series analysis; Cambridge university press, 2003. [Google Scholar]
- Abarbanel, H.D.; Gollub, J.P. Analysis of observed chaotic data; American Institute of Physics, 1996. [Google Scholar]
- Sprott, J.C. Chaos and time-series analysis. 2001. [Google Scholar] [CrossRef]
- Breakspear, M. Dynamic models of large-scale brain activity. Nat. Neurosci. 2017, 20(3), 340–352. [Google Scholar] [CrossRef] [PubMed]
- Goldberger, A.L.; et al. Fractal dynamics in physiology: alterations with disease and aging. Proc. Natl. Acad. Sci. U S A 2002, 99 Suppl 1(Suppl 1), 2466–72. [Google Scholar] [CrossRef] [PubMed]
- Sugihara, G.; et al. Detecting causality in complex ecosystems. Science 2012, 338(6106), 496–500. [Google Scholar] [CrossRef] [PubMed]
- Boccaletti, S.; et al. The structure and dynamics of multilayer networks. Phys. Rep. 2014, 544(1), 1–122. [Google Scholar] [CrossRef] [PubMed]
- Huang, S. The molecular and mathematical basis of Waddington’s epigenetic landscape: a framework for post-Darwinian biology? Bioessays 2012, 34(2), 149–57. [Google Scholar] [CrossRef] [PubMed]
- Takens, F. Detecting strange attractors in turbulence. In Dynamical Systems and Turbulence, Warwick 1980; Springer Berlin Heidelberg: Berlin, Heidelberg, 1981. [Google Scholar]
- Kuznetsov, Y. Elements of Applied Bifurcation Theory; Springer New York, 2004. [Google Scholar]
- Diaz, J.E.; et al. The transcriptomic response of cells to a drug combination is more than the sum of the responses to the monotherapies. Elife 2020. [Google Scholar] [CrossRef] [PubMed]
- Flois, T. Detecting strange attractors in turbulence. In Lecture Notes in Mathematics. Dynamical Systems of Turbulence; 1981; pp. 366–381. [Google Scholar]
- Packard, N.H.; et al. Geometry from a time series. Phys. Rev. Lett. 1980, 45(9), 712. [Google Scholar] [CrossRef]
- Fraser, A.M.; Swinney, H.L. Independent coordinates for strange attractors from mutual information. Phys. Rev. A 1986, 33(2), 1134. [Google Scholar] [CrossRef] [PubMed]
- Kennel, M.B.; Brown, R.; Abarbanel, H.D. Determining embedding dimension for phase-space reconstruction using a geometrical construction. Phys. Rev. A 1992, 45(6), 3403. [Google Scholar] [CrossRef] [PubMed]
- Rosenstein, M.T.; Collins, J.J.; De Luca, C.J. A practical method for calculating largest Lyapunov exponents from small data sets. Phys. D. Nonlinear Phenom. 1993, 65(1-2), 117–134. [Google Scholar] [CrossRef]
- Marwan, N.; et al. Recurrence plots for the analysis of complex systems. Phys. Rep. 2007, 438(5-6), 237–329. [Google Scholar] [CrossRef]
- Efron, B. R.J. Tibshirani, An introduction to the bootstrap New York.; Chapman and Hall: NY, 1993; p. 473. [Google Scholar]
- Lamouille, S.; Xu, J.; Derynck, R. Molecular mechanisms of epithelial–mesenchymal transition. Nat. Rev. Mol. Cell Biol. 2014, 15(3), 178–196. [Google Scholar] [CrossRef] [PubMed]
- Edgar, R.; Domrachev, M.; Lash, A.E. Gene Expression Omnibus: NCBI gene expression and hybridization array data repository. Nucleic Acids Res. 2002, 30(1), 207–210. [Google Scholar] [CrossRef] [PubMed]
- Stuart, T.; et al. Comprehensive integration of single-cell data. cell 2019, 177(7), 1888–1902. e21. [Google Scholar] [CrossRef] [PubMed]
- Jolliffe, I. Principal Component Analysis. In International Encyclopedia of Statistical Science; Springer, 2025; pp. 1945–1948. [Google Scholar]
- Wolf, A.; et al. Determining Lyapunov exponents from a time series. Phys. D. Nonlinear Phenom. 1985, 16(3), 285–317. [Google Scholar] [CrossRef]
- Legendre, A.M. Nouvelles me ́thodes pour la de ́termination des orbites des comètes; F. Didot, 1805. [Google Scholar]
- Ismail, H. Statistical Modeling, Linear Regression and ANOVA: A Practical Computational Perspective; LULU COM, 2018. [Google Scholar]
- Eckmann, J.-P.; Kamphorst, S.O.; Ruelle, D. Recurrence plots of dynamical systems, in Turbulence, strange attractors and chaos; World Scientific, 1995; pp. 441–445. [Google Scholar]
- Webber, C.L., Jr.; Zbilut, J.P. Dynamical assessment of physiological systems and states using recurrence plot strategies. J. Appl. Physiol. 1994, 76(2), 965–973. [Google Scholar] [CrossRef] [PubMed]
- Chaffer, C.L.; et al. EMT, cell plasticity and metastasis. Cancer Metastasis Rev. 2016, 35(4), 645–654. [Google Scholar] [CrossRef] [PubMed]
- Pearson, K., VII. Note on regression and inheritance in the case of two parents. Proc. R. Soc. Lond. 1895, 58(347-352), 240–242. [Google Scholar] [CrossRef]
- Spearman, C. The proof and measurement of association between two things; 1961. [Google Scholar]
- Virtanen, P.; et al. SciPy 1.0: fundamental algorithms for scientific computing in Python. Nat. Methods 2020, 17(3), 261–272. [Google Scholar] [CrossRef] [PubMed]
- Harris, C.R.; et al. Array programming with NumPy. nature 2020, 585(7825), 357–362. [Google Scholar] [CrossRef] [PubMed]
- McKinney, W. Data structures for statistical computing in Python. scipy 2010, 445(1), 51–56. [Google Scholar]
- Virshup, I.; et al. The scverse project provides a computational ecosystem for single-cell omics data analysis. Nat. Biotechnol. 2023, 41(5), 604–606. [Google Scholar] [CrossRef] [PubMed]
- Pedregosa, F.; et al. Scikit-learn: Machine learning in Python. J. Mach. Learn. Res. 2011, 12, 2825–2830. [Google Scholar]
- Hunter, J.D. Matplotlib: A 2D graphics environment. Comput. Sci. Eng. 2007, 9(3), 90–95. [Google Scholar] [CrossRef]
Figure 1.
Overview of the computational workflow developed for reconstructing transcriptomic state spaces and identifying critical dynamical state transitions from cancer transcriptomic trajectories using nonlinear dynamical systems analysis.
Figure 1.
Overview of the computational workflow developed for reconstructing transcriptomic state spaces and identifying critical dynamical state transitions from cancer transcriptomic trajectories using nonlinear dynamical systems analysis.
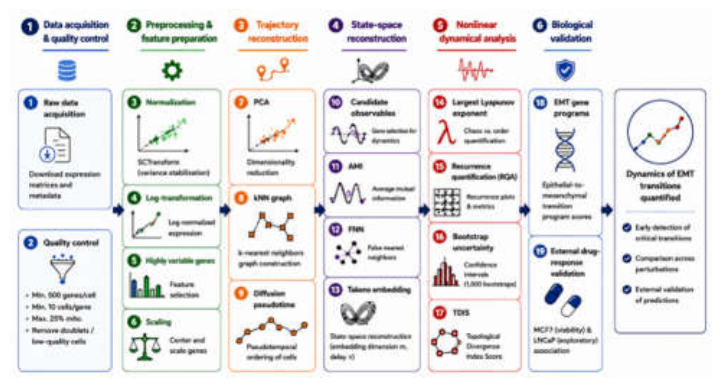
Figure 2.
Summary of the transcriptomic datasets used for development and validation of the proposed framework. GSE147405 provided densely sampled single-cell RNA sequencing data for nonlinear dynamical method development, whereas GSE149428 supplied independent bulk RNA sequencing and matched treatment-response data for external validation.
Figure 2.
Summary of the transcriptomic datasets used for development and validation of the proposed framework. GSE147405 provided densely sampled single-cell RNA sequencing data for nonlinear dynamical method development, whereas GSE149428 supplied independent bulk RNA sequencing and matched treatment-response data for external validation.
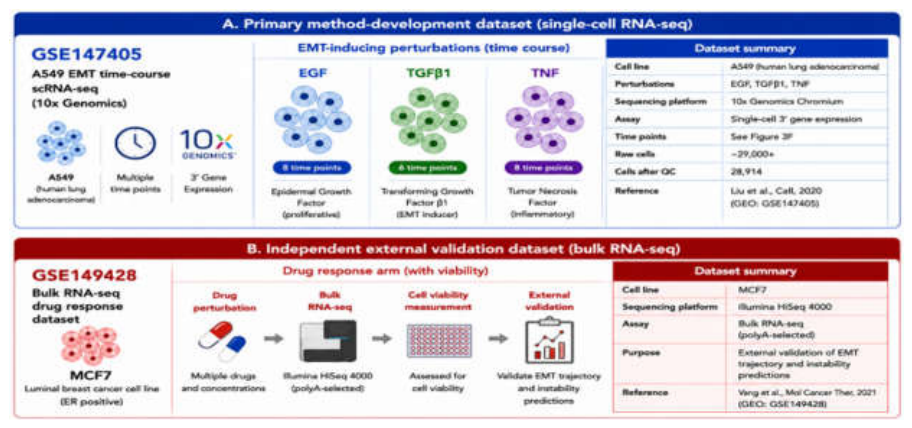
Figure 3.
Quality-control summary of the GSE147405 A549 single-cell RNA sequencing dataset, showing transcriptome complexity, sequencing depth, mitochondrial transcript percentage, retained cells, and overall dataset characteristics following preprocessing for the EGF, TGFβ1, and TNF treatment trajectories.
Figure 3.
Quality-control summary of the GSE147405 A549 single-cell RNA sequencing dataset, showing transcriptome complexity, sequencing depth, mitochondrial transcript percentage, retained cells, and overall dataset characteristics following preprocessing for the EGF, TGFβ1, and TNF treatment trajectories.
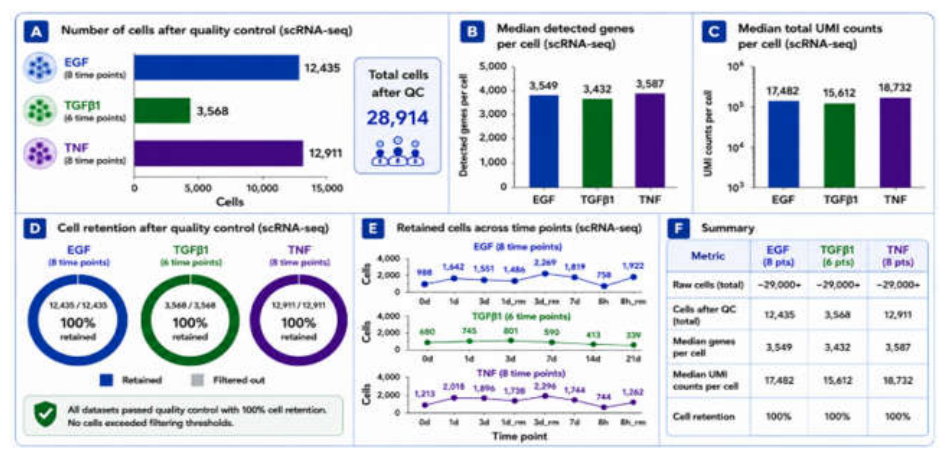
Figure 4.
Construction of continuous transcriptomic trajectories using principal component projection, k-nearest-neighbor graph construction, Diffusion Pseudotime ordering, and pseudotime binning.
Figure 4.
Construction of continuous transcriptomic trajectories using principal component projection, k-nearest-neighbor graph construction, Diffusion Pseudotime ordering, and pseudotime binning.
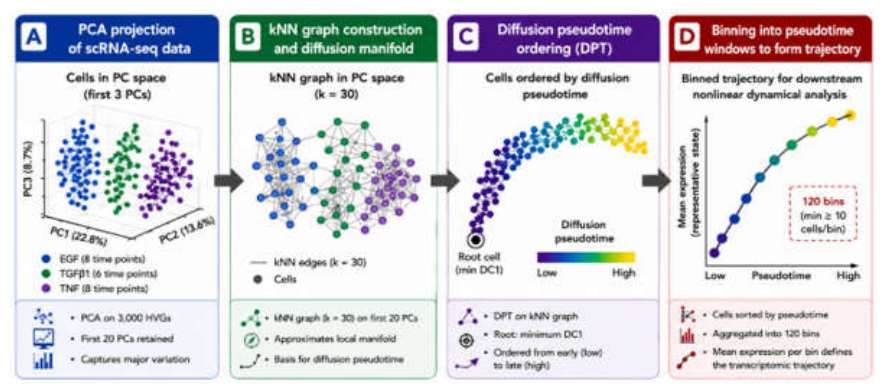
Figure 5.
Data-driven selection of the optimal transcriptomic observable for nonlinear state-space reconstruction. Candidate observables (PC1–PC3, DC1–DC3, and trajectory arc length) were evaluated using AMI, FNN, and a composite reconstruction score. The highest-ranked eligible observable (m ≥ 2) was selected for Takens delay-coordinate embedding and subsequent nonlinear dynamical analyses.
Figure 5.
Data-driven selection of the optimal transcriptomic observable for nonlinear state-space reconstruction. Candidate observables (PC1–PC3, DC1–DC3, and trajectory arc length) were evaluated using AMI, FNN, and a composite reconstruction score. The highest-ranked eligible observable (m ≥ 2) was selected for Takens delay-coordinate embedding and subsequent nonlinear dynamical analyses.
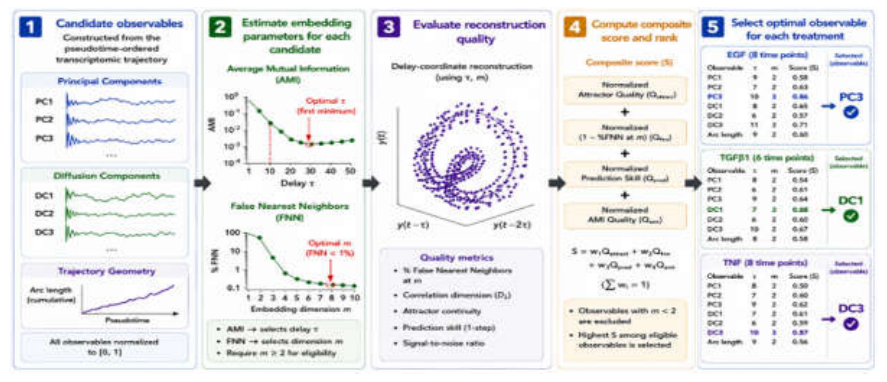
Figure 6.
Reconstruction of transcriptomic state spaces using Takens delay-coordinate embedding. Treatment-specific observables were embedded using the optimal delay time (τ) and embedding dimension (m) determined by Average Mutual Information (AMI) and False Nearest Neighbors (FNN), generating three-dimensional state spaces for subsequent nonlinear dynamical analysis.
Figure 6.
Reconstruction of transcriptomic state spaces using Takens delay-coordinate embedding. Treatment-specific observables were embedded using the optimal delay time (τ) and embedding dimension (m) determined by Average Mutual Information (AMI) and False Nearest Neighbors (FNN), generating three-dimensional state spaces for subsequent nonlinear dynamical analysis.
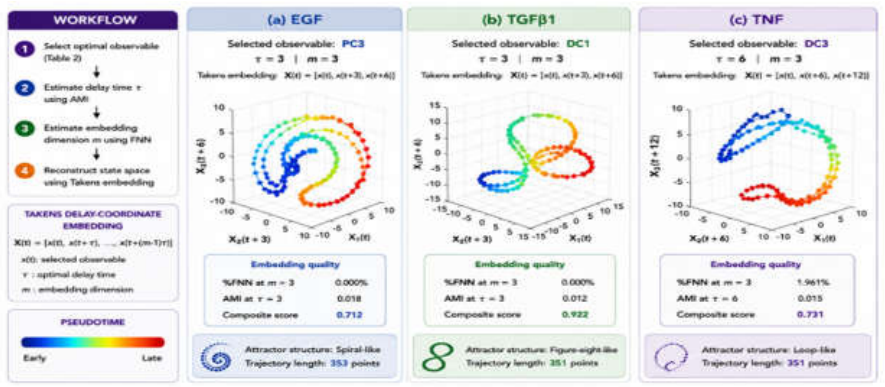
Figure 7.
Three-dimensional transcriptomic state spaces reconstructed using Takens delay-coordinate embedding. Reconstructed attractors are shown for (A) EGF (PC3,
Figure 7.
Three-dimensional transcriptomic state spaces reconstructed using Takens delay-coordinate embedding. Reconstructed attractors are shown for (A) EGF (PC3,
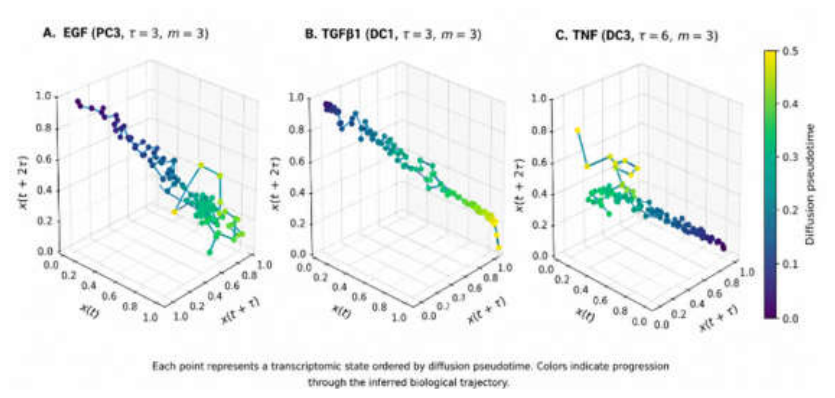
Figure 8.
Estimation of the largest Lyapunov exponent using the Rosenstein algorithm. Average logarithmic divergence between neighboring trajectories is shown for (A) EGF, (B) TGFβ1, and (C) TNF. The dashed orange line represents the linear regression fitted over the initial exponential divergence region, and its slope corresponds to the estimated largest Lyapunov exponent.
Figure 8.
Estimation of the largest Lyapunov exponent using the Rosenstein algorithm. Average logarithmic divergence between neighboring trajectories is shown for (A) EGF, (B) TGFβ1, and (C) TNF. The dashed orange line represents the linear regression fitted over the initial exponential divergence region, and its slope corresponds to the estimated largest Lyapunov exponent.
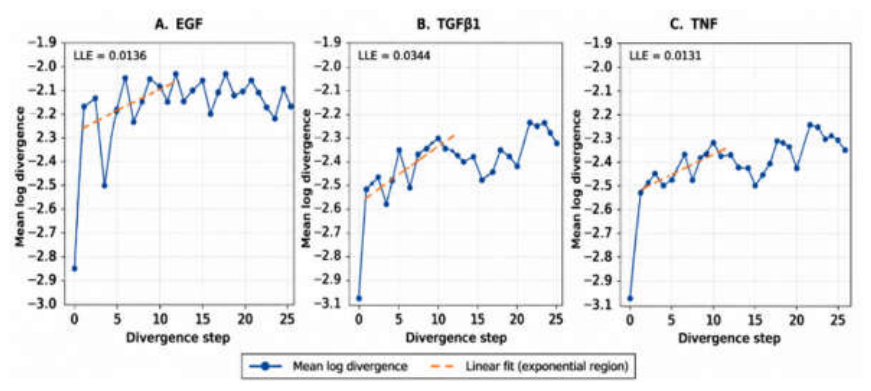
Figure 9.
Recurrence plots of reconstructed transcriptomic state spaces. Recurrence plots are shown for (A) EGF, (B) TGFβ1, and (C) TNF. Black pixels denote recurrent state pairs identified using treatment-specific distance thresholds corresponding to an approximately 10% recurrence rate. Although the recurrence rate was held constant across treatments, the recurrence structures differed markedly, with TGFβ1 exhibiting the most continuous diagonal line structures, TNF showing an intermediate organization, and EGF displaying comparatively more fragmented recurrence patterns. These qualitative differences are quantified by the recurrence measures summarized in Table 7.
Figure 9.
Recurrence plots of reconstructed transcriptomic state spaces. Recurrence plots are shown for (A) EGF, (B) TGFβ1, and (C) TNF. Black pixels denote recurrent state pairs identified using treatment-specific distance thresholds corresponding to an approximately 10% recurrence rate. Although the recurrence rate was held constant across treatments, the recurrence structures differed markedly, with TGFβ1 exhibiting the most continuous diagonal line structures, TNF showing an intermediate organization, and EGF displaying comparatively more fragmented recurrence patterns. These qualitative differences are quantified by the recurrence measures summarized in Table 7.
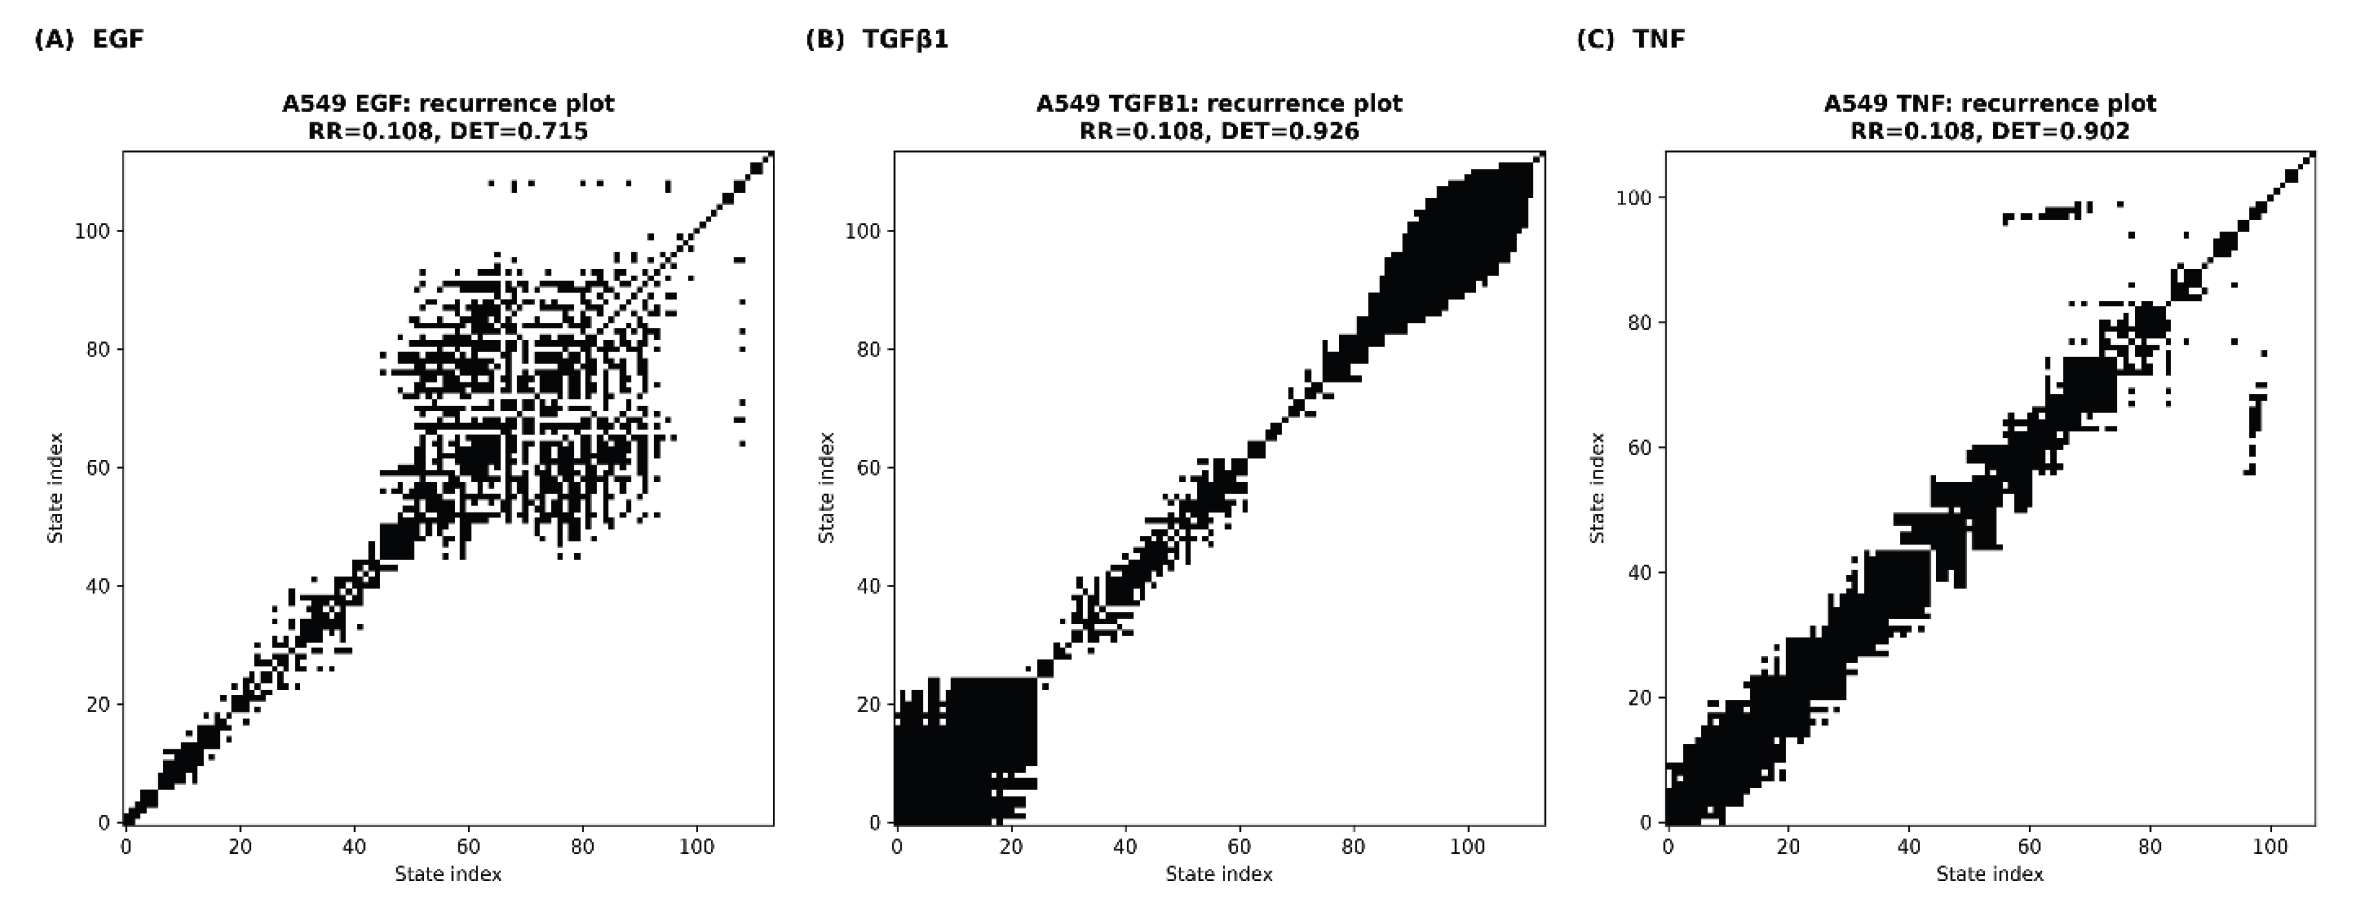
Figure 10.
Trajectory-aware bootstrap uncertainty analysis of the largest Lyapunov exponent (LLE). Bootstrap distributions of the LLE are shown for (A) EGF, (B) TGFβ1, and (C) TNF using 300 trajectory-aware bootstrap replicates. The solid red line indicates the original LLE estimate, the dashed blue line denotes the bootstrap mean, and the dotted black lines represent the 95% percentile confidence interval. The close agreement between the original LLE estimates and the bootstrap distributions demonstrates the robustness and reproducibility of the nonlinear dynamical analysis across all treatment conditions.
Figure 10.
Trajectory-aware bootstrap uncertainty analysis of the largest Lyapunov exponent (LLE). Bootstrap distributions of the LLE are shown for (A) EGF, (B) TGFβ1, and (C) TNF using 300 trajectory-aware bootstrap replicates. The solid red line indicates the original LLE estimate, the dashed blue line denotes the bootstrap mean, and the dotted black lines represent the 95% percentile confidence interval. The close agreement between the original LLE estimates and the bootstrap distributions demonstrates the robustness and reproducibility of the nonlinear dynamical analysis across all treatment conditions.
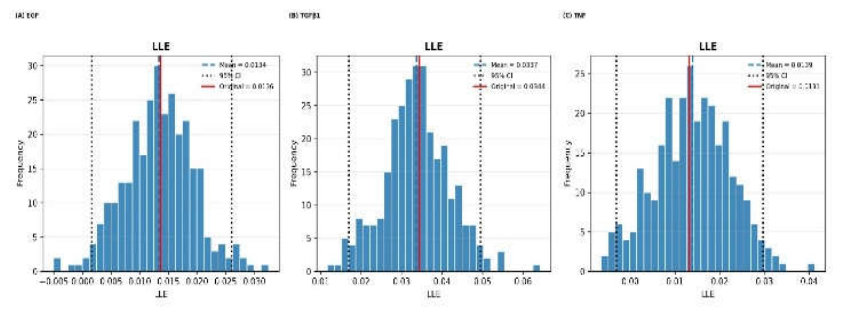
Figure 11.
Comparison of the Transcriptomic Dynamical Instability Score (TDIS) for the EGF, TGFβ1, and TNF treatment trajectories. Higher TDIS values indicate greater transcriptomic dynamical instability.
Figure 11.
Comparison of the Transcriptomic Dynamical Instability Score (TDIS) for the EGF, TGFβ1, and TNF treatment trajectories. Higher TDIS values indicate greater transcriptomic dynamical instability.
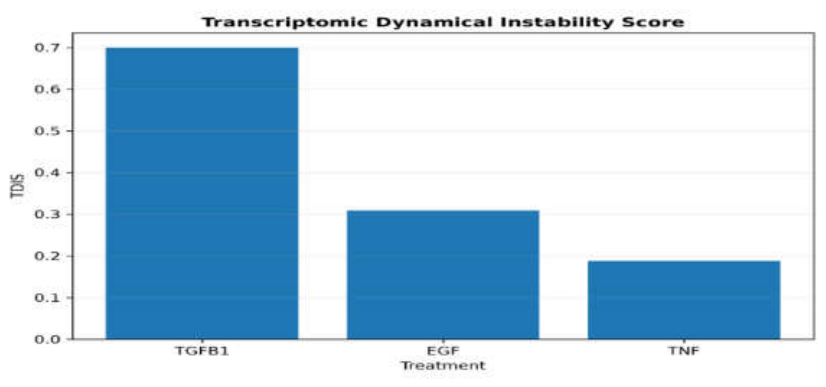
Figure 12.
Biological validation of reconstructed transcriptomic trajectories using canonical EMT marker dynamics. Composite epithelial (blue), mesenchymal (orange), and EMT (green; EMT = M − E) scores are shown as a function of diffusion pseudotime for (A) EGF, (B) TGFβ1, and (C) TNF treatment conditions. The trajectories demonstrate progressive remodeling of epithelial and mesenchymal transcriptional programs during epithelial-to-mesenchymal transition (EMT), with distinct magnitudes and temporal patterns across the three perturbations. TGFβ1 exhibited the largest overall EMT remodeling, EGF showed an intermediate response, and TNF displayed the weakest transcriptomic transition, consistent with the relative transcriptomic dynamical instability quantified by TDIS.
Figure 12.
Biological validation of reconstructed transcriptomic trajectories using canonical EMT marker dynamics. Composite epithelial (blue), mesenchymal (orange), and EMT (green; EMT = M − E) scores are shown as a function of diffusion pseudotime for (A) EGF, (B) TGFβ1, and (C) TNF treatment conditions. The trajectories demonstrate progressive remodeling of epithelial and mesenchymal transcriptional programs during epithelial-to-mesenchymal transition (EMT), with distinct magnitudes and temporal patterns across the three perturbations. TGFβ1 exhibited the largest overall EMT remodeling, EGF showed an intermediate response, and TNF displayed the weakest transcriptomic transition, consistent with the relative transcriptomic dynamical instability quantified by TDIS.
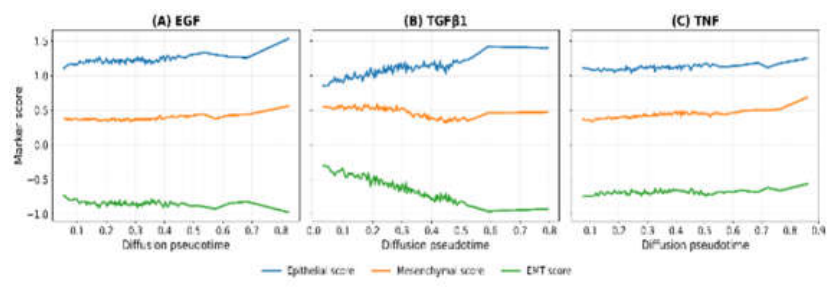
Figure 13.
Relationship between the Transcriptomic Dynamical Instability Score (TDIS) and EMT score range across the three EMT-inducing treatments. Treatments with higher transcriptomic dynamical instability exhibited greater EMT-associated transcriptional remodeling.
Figure 13.
Relationship between the Transcriptomic Dynamical Instability Score (TDIS) and EMT score range across the three EMT-inducing treatments. Treatments with higher transcriptomic dynamical instability exhibited greater EMT-associated transcriptional remodeling.
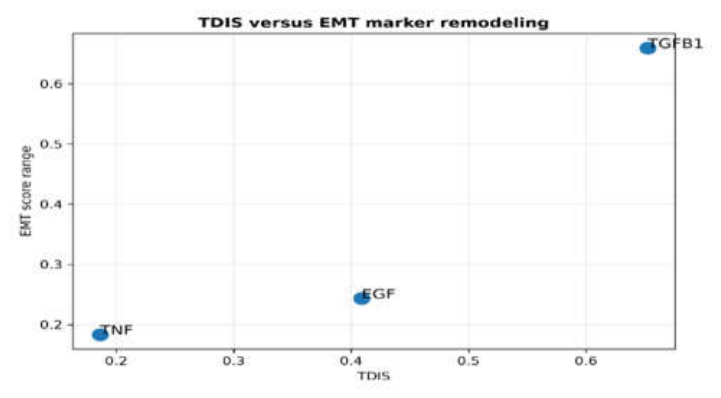
Figure 14.
Early detection of transcriptomic state transitions during epithelial-to-mesenchymal transition (EMT). (A) Time-resolved local Transcriptomic Dynamical Instability Score (TDIS) and composite EMT score along diffusion pseudotime for EGF, TGFβ1, and TNF stimulation. Vertical lines indicate the detected onset of local TDIS and EMT progression, and the shaded region denotes the early-warning interval. (B) Bootstrap median lead times with 95% confidence intervals, where positive values indicate that local TDIS preceded the EMT transition. (C) Heatmap of detected onset pseudotimes for local TDIS, the composite EMT score, and canonical EMT markers. (D) Bootstrap probability that local TDIS preceded the composite EMT transition together with the robustness of the inferred temporal ordering across sensitivity analyses. Positive lead times indicate early-warning behavior, whereas negative lead times indicate that EMT progression occurred simultaneously with or before local TDIS.
Figure 14.
Early detection of transcriptomic state transitions during epithelial-to-mesenchymal transition (EMT). (A) Time-resolved local Transcriptomic Dynamical Instability Score (TDIS) and composite EMT score along diffusion pseudotime for EGF, TGFβ1, and TNF stimulation. Vertical lines indicate the detected onset of local TDIS and EMT progression, and the shaded region denotes the early-warning interval. (B) Bootstrap median lead times with 95% confidence intervals, where positive values indicate that local TDIS preceded the EMT transition. (C) Heatmap of detected onset pseudotimes for local TDIS, the composite EMT score, and canonical EMT markers. (D) Bootstrap probability that local TDIS preceded the composite EMT transition together with the robustness of the inferred temporal ordering across sensitivity analyses. Positive lead times indicate early-warning behavior, whereas negative lead times indicate that EMT progression occurred simultaneously with or before local TDIS.
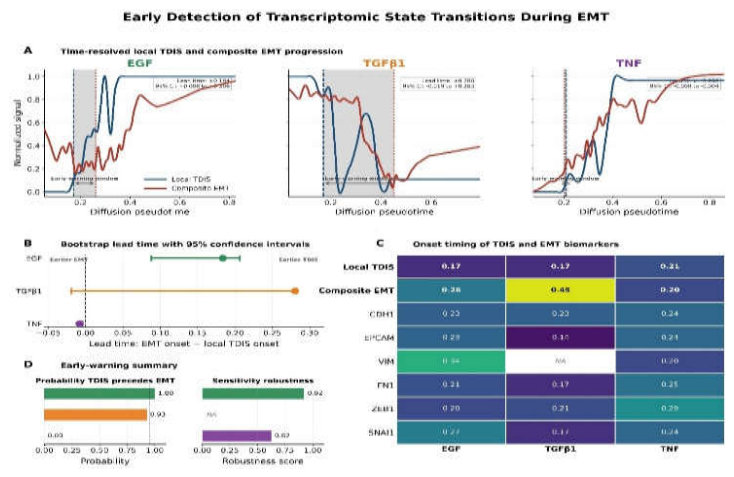
Figure 15.
External validation of the proposed framework using the independent GSE149428 treatment-response dataset. Each point represents one treatment condition in MCF7 cells. The External Response Score (ERS), computed from transcriptomic trajectory arc length, net displacement, and curvature, is plotted against the experimentally measured cell viability response. The strong positive association indicates that larger transcriptomic trajectory perturbations correspond to greater biological treatment responses.
Figure 15.
External validation of the proposed framework using the independent GSE149428 treatment-response dataset. Each point represents one treatment condition in MCF7 cells. The External Response Score (ERS), computed from transcriptomic trajectory arc length, net displacement, and curvature, is plotted against the experimentally measured cell viability response. The strong positive association indicates that larger transcriptomic trajectory perturbations correspond to greater biological treatment responses.
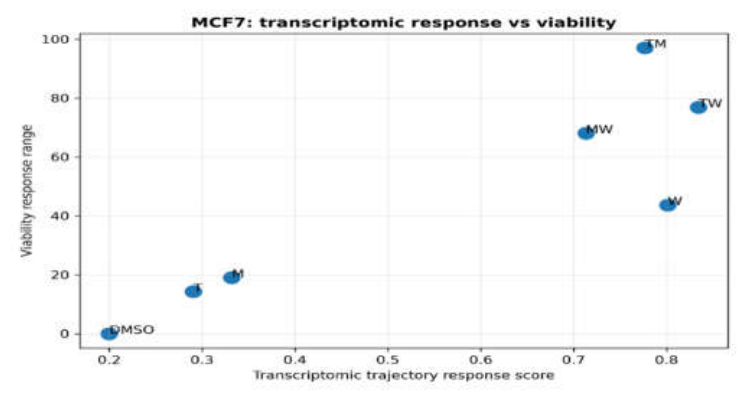
Figure 16.
Overview of the proposed nonlinear dynamical framework for identifying transcriptomic state transitions in cancer. The workflow integrates scRNA-seq preprocessing, diffusion pseudotime trajectory reconstruction, data-driven observable selection, Takens delay-coordinate embedding, largest Lyapunov exponent (LLE) estimation, Recurrence Quantification Analysis (RQA), trajectory-aware bootstrap uncertainty estimation, and computation of the proposed Transcriptomic Dynamical Instability Score (TDIS). The framework is subsequently validated using canonical EMT marker dynamics, early-warning analysis of transcriptomic state transitions, and an independent treatment-response dataset (GSE149428), enabling quantitative characterization of critical transcriptomic state transitions associated with cancer progression.
Figure 16.
Overview of the proposed nonlinear dynamical framework for identifying transcriptomic state transitions in cancer. The workflow integrates scRNA-seq preprocessing, diffusion pseudotime trajectory reconstruction, data-driven observable selection, Takens delay-coordinate embedding, largest Lyapunov exponent (LLE) estimation, Recurrence Quantification Analysis (RQA), trajectory-aware bootstrap uncertainty estimation, and computation of the proposed Transcriptomic Dynamical Instability Score (TDIS). The framework is subsequently validated using canonical EMT marker dynamics, early-warning analysis of transcriptomic state transitions, and an independent treatment-response dataset (GSE149428), enabling quantitative characterization of critical transcriptomic state transitions associated with cancer progression.
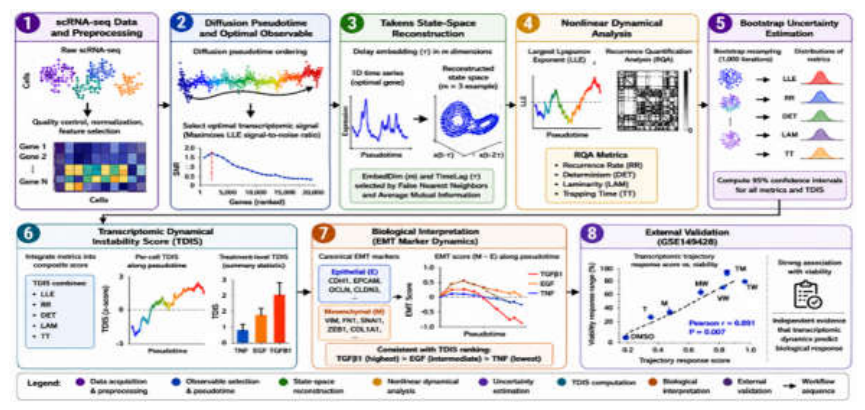

Table 1.
Public transcriptomic datasets used for the development and validation of the proposed nonlinear dynamical framework.
Table 1.
Public transcriptomic datasets used for the development and validation of the proposed nonlinear dynamical framework.
| Dataset | Biological model | Experimental condition | Genes after QC | Cells / Samples | Purpose in this study |
|---|---|---|---|---|---|
| GSE147405 | EMT time-course | EGF stimulation | 13,132 | 12,435 cells | Method development |
| GSE147405 | EMT time-course | TGFB1 stimulation | 13,239 | 3,568 cells | Method development |
| GSE147405 | EMT time-course | TNF stimulation | 13,143 | 12,911 cells | Method development |
| GSE149428 | Drug-response time-course | Multiple therapeutic perturbations | 16,724 | 126 samples | External biological validation |
Table 2.
Candidate transcriptomic observables evaluated for data-driven nonlinear state-space reconstruction.
Table 2.
Candidate transcriptomic observables evaluated for data-driven nonlinear state-space reconstruction.
| Candidate Observable | Description | Biological Interpretation |
|---|---|---|
| PC1 | First principal component | Dominant transcriptomic variation |
| PC2 | Second principal component | Secondary transcriptomic variation |
| PC3 | Third principal component | Higher-order transcriptomic variation |
| DC1 | First diffusion component | Primary nonlinear manifold |
| DC2 | Second diffusion component | Secondary nonlinear manifold |
| DC3 | Third diffusion component | Higher-order manifold structure |
| Arc length | Cumulative trajectory distance | Global geometric progression |
Table 3.
Parameters used for Takens delay-coordinate embedding and transcriptomic state-space reconstruction.
Table 3.
Parameters used for Takens delay-coordinate embedding and transcriptomic state-space reconstruction.
| Parameter | Description | Determination Method |
|---|---|---|
| Observable | One-dimensional transcriptomic signal | Data-driven selection (Section 2.6) |
| Delay time (τ) | Temporal separation between coordinates | Average Mutual Information (AMI) |
| Embedding dimension (m) | Number of delayed coordinates | False Nearest Neighbors (FNN) |
| Delay-coordinate vectors | Reconstructed state vectors | Takens embedding |
| State space | Reconstructed attractor | Delay-coordinate embedding |
Table 4.
Data-driven selection of optimal transcriptomic observables for nonlinear state-space reconstruction.
Table 4.
Data-driven selection of optimal transcriptomic observables for nonlinear state-space reconstruction.
| Treatment | Selected Observable | Optimal Delay (τ) | Embed. Dim (m) | FNN (%) | Composite Score |
|---|---|---|---|---|---|
| EGF | PC3 | 3 | 3 | 0.00 | 0.712 |
| TGFβ1 | DC1 | 3 | 3 | 0.00 | 0.922 |
| TNF | DC3 | 6 | 3 | 1.96 | 0.731 |
Table 5.
Treatment-specific Taken embedding parameters for transcriptomic state-space reconstruction.
Table 5.
Treatment-specific Taken embedding parameters for transcriptomic state-space reconstruction.
| Treatment | Selected Observable | Delay Time (τ) | Embed. Dim. (m) | Traj. Points | Embedded Vectors |
|---|---|---|---|---|---|
| EGF | PC3 | 3 | 3 | 120 | 114 |
| TGFβ1 | DC1 | 3 | 3 | 120 | 114 |
| TNF | DC3 | 6 | 3 | 120 | 108 |
Table 6.
Largest Lyapunov exponent estimates for reconstructed transcriptomic state spaces.
| Treatment | Largest Lyapunov Exponent |
|---|---|
| EGF | 0.0136 |
| TGFβ1 | 0.0344 |
| TNF | 0.0131 |
Table 7.
Principal recurrence quantification measures of reconstructed transcriptomic state spaces.
| Treatment | RR | DET |
|---|---|---|
| EGF | 0.108 | 0.715 |
| TGFβ1 | 0.108 | 0.926 |
| TNF | 0.108 | 0.902 |
Table 8.
Bootstrap uncertainty estimates for nonlinear dynamical measures.
| Treatment | Original LLE | Bootstrap Mean | Bootstrap SD | 95% CI |
|---|---|---|---|---|
| EGF | 0.0136 | 0.0134 | 0.0061 | 0.0016–0.0260 |
| TGFβ1 | 0.0344 | 0.0337 | 0.0081 | 0.0170–0.0495 |
| TNF | 0.0131 | 0.0139 | 0.0085 | −0.0031–0.0297 |
Table 9.
Transcriptomic Dynamical Instability Score (TDIS) and treatment ranking.
| Treatment | TDIS | Rank |
|---|---|---|
| TGFβ1 | 0.700 | 1 |
| EGF | 0.309 | 2 |
| TNF | 0.188 | 3 |
Table 10.
Summary of EMT remodeling and its relationship with transcriptomic dynamical instability.
| Treatment | EMT Score Range | Maximum Transition Rate | TDIS |
|---|---|---|---|
| TGFβ1 | 0.651 | 1196.87 | 0.700 |
| EGF | 0.243 | 1342.17 | 0.309 |
| TNF | 0.184 | 547.73 | 0.188 |
Table 11.
Early-warning analysis of transcriptomic state transitions across EMT-inducing treatments.
Table 11.
Early-warning analysis of transcriptomic state transitions across EMT-inducing treatments.
| Treatment | Local TDIS onset | Composite EMT onset | Lead time† | 95% CI | P (TDIS earlier) | Evidence | Interpretation |
|---|---|---|---|---|---|---|---|
| EGF | 0.17 | 0.26 | 0.18 | 0.09–0.21 | 1.00 | Strong | ocal TDIS consistently preceded EMT, indicating a robust early-warning signal. |
| TGFβ1 | 0.17 | 0.45 | 0.28 | −0.02–0.28 | 0.93 | Moderate | Local TDIS generally preceded EMT but with greater statistical uncertainty. |
| TNF | 0.21 | 0.2 | −0.01 | −0.01–0.00 | 0.00 | None | EMT-associated transcriptional changes occurred simultaneously with or slightly before local TDIS. |
Table 12.
External validation of the proposed framework using the GSE149428 dataset.
| Dataset | GSE149428 |
|---|---|
| Cell line | MCF7 |
| Treatments | 7 |
| Pearson r | 0.891 |
| P value | 0.007 |
| Spearman ρ | 0.821 |
| P value | 0.0234 |
Disclaimer/Publisher’s Note: The statements, opinions and data contained in all publications are solely those of the individual author(s) and contributor(s) and not of MDPI and/or the editor(s). MDPI and/or the editor(s) disclaim responsibility for any injury to people or property resulting from any ideas, methods, instructions or products referred to in the content. |
© 2026 by the authors. Licensee MDPI, Basel, Switzerland. This article is an open access article distributed under the terms and conditions of the Creative Commons Attribution (CC BY) license (http://creativecommons.org/licenses/by/4.0/).
Copyright: This open access article is published under a Creative Commons CC BY 4.0 license, which permit the free download, distribution, and reuse, provided that the author and preprint are cited in any reuse.


