
Submitted:
31 July 2026
Posted:
31 July 2026
You are already at the latest version
Abstract
Global terrestrial water storage change (TWSC) induces hydrological loading, a core driver of nonlinear deformations in GNSS benchmark coordinate time series. High-precision hydrological load models are essential for refining the Terrestrial Reference Frame (TRF) and investigating global climate change mechanisms. To address GRACE's coarse spatiotemporal resolution, discrepancies among reanalysis models, and the common reliance on single-source fusion without uncertainty quantification, we propose an LS-based scale-factor fusion scheme. Integrating GRACE Mascon data with the multi-model ACH-VCE product, we develop GHLW1.0. On a 1°×1° grid, LS determines optimal scale factors between GRACE and ACH-VCE, calibrating GRACE TWSC and fusing with ACH-VCE to produce the GHLW1.0 dataset (2000–2016). Multi-dimensional validation shows GHLW1.0 matches GRACE Mascon in linear trend, RMS of temporal signals, seasonal amplitude, and phase lag. Its phase difference relative to GRACE is ~15 days, substantially better than ACH-VCE's ~30 days, and captures finer spatial details. Applying GHLW1.0-derived vertical displacements to correct 300 GNSS stations, over 90% show correlation >0.7 between modeled and observed. Average correction efficiency is 76%, peaking at 79% (3% above ACH-VCE), with only 5% fluctuation across tests, indicating superior stability. Our LS fusion strategy compensates single-source deficiencies, enhancing TWSC retrieval and GNSS correction, and offers a novel pathway for high-precision stable hydrological load models. Future work will use Singular Spectrum Analysis to decompose homogeneous signals and optimize performance.
Keywords:
hydrological load model
; GRACE
; reanalysis products
; least squares
; scale factor
; GNSS coordinate time series
; terrestrial water storage change
1. Introduction
Global Terrestrial Water Storage Change (TWSC) is a complex process driven by the interplay of climate change, intensified human activities, and natural geographical features. TWSC not only profoundly influences the natural environment and human society but also induces large-scale surface mass redistribution, leading to solid Earth deformation—termed hydrological loading effects. The complex non-linear motions of Global Navigation Satellite System (GNSS) stations induced by hydrological loads have become a primary factor limiting the accuracy of current Terrestrial Reference Frame (TRF) establishment. Consequently, constructing precise hydrological load models, encompassing both TWSC models and hydrological displacement models, holds significant scientific value and practical application for understanding the global water cycle and climate change, as well as for determining accurate positions and velocities of GNSS stations.
In recent years, researchers have made significant progress in global and regional TWSC studies using GRACE satellite data and reanalysis hydrological model products, confirming the important contribution of hydrological load displacement to non-linear station motions (Tapley et al., 2004; Wahr et al., 2004; Strassberg et al., 2009; Chen et al., 2012; Ren et al., 2013; Jiang et al., 2013; Dill et al., 2013; Yuan et al., 2018; Chen et al., 2015; Li et al., 2017; Li et al., 2020; Hu et al., 2021; Pan et al., 2019, 2022). However, both existing data sources possess inherent, non-negligible limitations. GRACE products suffer from coarse spatiotemporal resolution due to observational constraints, hindering the capture of fine-scale local TWSC variations and limiting the correction of high-frequency (daily-scale) hydrological signals in GNSS coordinate time series. Furthermore, different processing strategies among institutions lead to inconsistencies in retrieved TWSC spatial and temporal characteristics, potentially causing biases in regional water resource assessments and limiting universality. Conversely, various reanalysis hydrological models differ in input observations, data assimilation frameworks, and parameterization schemes (Zhang et al., 2021), yielding significantly divergent TWSC outputs. Their application for GNSS non-linear correction yields inconsistent results and can even produce geophysically implausible interpretations (Van Dam & Wahr, 2001; Davis et al., 2004; Jiang et al., 2013; He et al., 2015; Li et al., 2016; Lu et al., 2024).
To overcome the limitations of GRACE and standalone hydrological models, multi-source data fusion studies have been undertaken to improve TWSC estimation and GNSS time series correction. Notable works include: Karegar et al. (2018), who combined a high-resolution hydrological model (WaterGAP Global Hydrology Model, WGHM) near North American GPS sites with GRACE data for distant regions, finding that the combined result improved correction of non-linear vertical GPS time series by 25% and 35% on average compared to GRACE or WGHM alone. Springer et al. (2019) noted that rapid water storage changes cause daily GPS height fluctuations, yet no definitive processing strategy or reliable hydrological model exists for correcting these signals. Currently, available hydrological models do not encompass all TWSC components; aside from WGHM providing groundwater data, most products contain only surface water components. Furthermore, only WGHM and LSDM include surface terrestrial water storage (soil water, snow, rivers, lakes) (Dill, 2013), while others offer only specific components like soil moisture or snow depth. GRACE observes total TWSC but with limited spatiotemporal resolution; integrating GRACE data into high-temporal-resolution hydrological models can mitigate this. Sun et al. (2020) demonstrated in Europe that incorporating daily hydrological mass changes reduced scatter in GPS height time series by nearly 50% compared to considering only monthly variations. Tangdamrongsub et al. (2021) integrated the PCRaster Global Water Balance Model (PCR-GLOBWB) with GRACE/GRACE-FO data via a Data Assimilation (DA) framework, establishing a GRACE/GRACE-FO DA model validated in East Asia, achieving correlations up to 0.89 with GPS time series and RMS reductions of 53%. Li Wanqiu et al. (2024) used GRACE-inverted TWSC displacements in Xinjiang, referencing hydrological model displacements and scale factor methods, incorporating GPCP precipitation data. Their comparison with 12 CORS stations showed significantly improved correlations (0.63–0.91) and WRMS reductions (16.18%–58.97%). Gerdener et al. (2023) assimilated monthly GRACE/GRACE-FO mass changes into the WaterGAP model using Ensemble Kalman Filtering, generating a new TWSC dataset (2003–2019). Comparison with GNSS data at over 1000 global stations showed superior correlation across short-term, seasonal, and long-term scales compared to original GRACE/GRACE-FO data.
However, most of these studies rely on a single hydrological model, failing to adequately account for the model's inherent uncertainties, thereby limiting the accuracy of weight determination in the combination process. To address this deficiency, this paper employs the Least Squares (LS) method to fuse GRACE Mascon observations with ACH-VCE (Adaptively Constrained Hydrological model with Variance Component Estimation, Lu et al., 2026), a multi-model combined TWSC product. This aims to construct a new high-precision TWSC dataset and associated hydrological displacement model, providing enhanced technical support for monitoring TWSC and mitigating hydrological loading effects on non-linear GNSS coordinate time series.
2. Data and Methodology
2.1. Data Products
2.1.1. GRACE Mascon Data
This study utilizes JPL RL06 Mascon data (Watkins et al., 2015), sampled at 0.5°×0.5° grids (effective spatial resolution ~300 km) with monthly updates, and CSR RL06 Mascon data (Save et al., 2016), employing finer 0.25°×0.25° grids (effective resolution ~200 km), also monthly. Both are official RL06 versions, incorporating advanced leakage correction, GIA correction (ICE-6G_C), and TWSC signal enhancement processing (see Scanlon et al., 2016). To match hydrological model resolution, both JPL and CSR Mascon products were spatially resampled to a uniform 1°×1° global grid using 2D bilinear interpolation, avoiding the artificial oscillations or over-smoothing associated with cubic splines. This method is widely considered suitable for global hydrological and geodetic grid resampling, preserving original TWSC amplitudes and spatial structures. These products effectively reduce spatial leakage and systematic biases from differing post-processing strategies, serving as independent GRACE-derived TWSC estimates for cross-validation in hydrological and geodetic studies (see Scanlon et al., 2016). The selection of JPL/CSR RL06 Mascon products over other GRACE data (e.g., spherical harmonic solutions) is based on: (1) higher spatial resolution and weaker smoothing effects, better capturing regional TWSC; (2) dedicated ocean leakage correction consistent with our land-ocean masking; (3) their widespread use and thorough validation, ensuring comparability and reproducibility (Wang et al., 2023). It is crucial to note the dual role of GRACE Mascon data here: (i) as the reference baseline for grid-wise LS scale factor estimation during GHLW1.0 construction (see Section 3); and (ii) as a comparative reference field for global TWSC spatial patterns (trends, RMS, annual amplitude). Since GRACE signals directly participate in scale factor calibration and ACH-VCE weighting optimization, an inherent signal correlation exists between GHLW1.0 and the GRACE reference field. Therefore, all comparisons between GHLW1.0 and GRACE in Section 4 are defined as internal consistency checks, verifying whether the fused model retains macro-scale hydrological spatiotemporal characteristics depicted by satellite gravimetry, rather than independent external validation. The true independent quantitative assessment of the model is conducted using data completely external to GRACE: the vertical displacement observations from 300 global GNSS stations in Section 5.
2.1.2. ACH-VCE
ACH-VCE is a combined TWSC model established via a constrained ensemble modeling approach for hydrological loads, incorporating externally constrained observations. It adjusts sample region sizes via a sliding window to resolve inaccurate weighting caused by underestimated model differences. Furthermore, by introducing GRACE and land-ocean boundary data, it mitigates weight estimation biases due to model uncertainties, significantly enhancing application accuracy. Validation demonstrated that the combined model effectively addresses ocean leakage issues. ACH-VCE and the GLWS2.0 dataset show similar seasonal variations and phases across six major basins, with correlation coefficients exceeding 0.85 in the Amazon, Yangtze, Yellow, Congo, and Mississippi basins, and surpassing 0.9 in the Yangtze, Yellow, and Mississippi basins. The ACH-VCE-derived hydrological displacement model achieved an average non-linear correction rate of approximately 73% for 300 global GNSS station height time series, an improvement of about 13% over the H-VCE combined model and 24% over the single NCEP model (Lu et al., 2024; 2026).
2.1.3. Global GNSS Vertical Displacement Time Series
This study utilizes observation data from 300 globally distributed core IGS stations archived at the Scripps Orbit and Permanent Array Center (SOPAC). Based on the station selection and data processing framework by Durga Rao and Srilatha Indira Dutt (2015), we quantified the capability of the integrated TWSC model to mitigate non-linear displacements at GNSS stations (Figure 1). These 300 stations were selected via a rigorous four-step procedure from the >2000 IGS stations operational by 2016: (1) Stability screening: stations with continuous data from 2000-2016 and missing rates below 5%; (2) Quality control: stations with IGS quality ratings of A/B and equipped with high-precision geodetic instruments; (3) Spatial distribution optimization: global uniform sampling via spherical Delaunay triangulation (Bock and Wdowinski, 2020), covering major basins and hydrological hotspots; (4) Geodetic attribute matching: selecting stations where vertical displacement is dominated by hydrological loading, minimizing tectonic and GIA contributions. These stations were chosen because (i) they provide the most reliable and continuous data in the global GNSS network, ensuring accurate correction assessment; and (ii) their uniform global distribution enables analysis of regional variability in hydrological loading correction across different climatic and hydrological zones. The SOPAC official dataset is available at: http://sopac-csrc.ucsd.edu/index.php/data-archive/. Prior to TWSC correction, non-hydrological signals and systematic errors were rigorously removed from GNSS height time series, including: Non-Tidal Atmospheric Loading (NTAL), Non-Tidal Ocean Loading (NTOL), thermoelastic deformation of monuments and antennas, draconitic year errors, polar motion-induced deformation, and orbit/station-related systematic artifacts. Consistent Glacial Isostatic Adjustment (GIA) corrections based on the ICE-6G_C model (Argus et al., 2014) were applied to both GNSS time series and GRACE Mascon products to ensure full consistency among geodetic observations. NTAL and NTOL models were obtained from GFZ (0.25° resolution, 1-hour temporal resolution), widely used in high-precision GNSS processing (Williams and Penna, 2011). Thermoelastic, draconitic, and polar motion corrections followed IGS standard models (Dach et al., 2015).
2.2. Least-Squares Method
The least-squares (LS) method is a widely used data-fitting technique. Its core objective is to determine an optimal fitting line or curve that minimises the sum of squared distances between all data points and the line/curve. This method has extensive applications in linear regression, nonlinear regression, and time-series forecasting. The following shows how to compute the scale factor between two data sets using LS.
Suppose we have a set of data points , and we want to find a straight line to fit these points. Specifically, the squared distance from each data point to the line is:
Summing the squared distances over all points gives the LS objective function:
To minimise this function, we take partial derivatives with respect to a and b and set them to zero:
Solving this system yields:
where and are the mean values of and , respectively.
3. Constructing Scale Factors Using the Least Squares Method
Scale factors are essentially linear proportionality coefficients, enabling uniform amplitude calibration across different data sources and eliminating dimensional discrepancies. This study employs LS linear fitting to determine the optimal scale coefficient a between GRACE Mascon and ACH-VCE TWSC time series, calibrating GRACE Mascon amplitudes and achieving scale unification. The procedure is as follows: 1) Data Preprocessing:Extract matched 1°×1° grid TWSC time series from both datasets, ensuring complete spatial and temporal alignment. 2) Grid-wise Parameter Estimation: For each global 1°×1° grid cell, extract the corresponding monthly TWSC time series from GRACE Mascon and ACH-VCE, and apply LS to solve for the optimal scale factor a. 3) Global Matrix Construction: Traverse all land grid cells, arranging the independently derived scale factors spatially to generate a global scale factor matrix, Factor (Figure 2). The spatial distribution of the scale factor matrix (Figure 2) reveals pronounced regional differentiation across global landmasses, directly linked to climatic wet-dry patterns and hydrological model performance. High-value regions (a > 1.3) concentrate in tropical humid zones like the Amazon Basin, Southeast Asian Archipelago, and Congo Basin, indicating systematic underestimation of precipitation-runoff amplitudes in ACH-VCE, requiring larger scale factors for amplitude correction. Mid-to-low value regions (0.9 < a < 1.1) cover arid areas like Central Asia, Sahara, and interior Australia, where minimal interannual TWSC variability results in consistent amplitudes between data sources, requiring less correction. Localized anomalous zones (a < 0.8 or a > 1.5) appear near Greenland's ice margins and the Tibetan Plateau highlands, potentially linked to residual leakage errors in GRACE Mascon or improper parameterization of cryospheric processes in hydrological models. This spatial pattern underscores the necessity of grid-wise scale factor estimation: a globally uniform factor would severely distort seasonal amplitudes in humid regions, whereas the grid-wise scheme enables differentiated correction based on local hydrological characteristics, laying the groundwork for constructing the high-precision GHLW1.0 TWSC field.
It is noteworthy that a sliding window mechanism was incorporated during grid-wise scale factor calculation. For each target grid cell, the LS fitting did not rely solely on the single-point time series. Instead, a spatial neighborhood was defined by a preset window size (e.g., 1°, 3°, 6°, 10°, 30°, 60°, 90°, and 180°), and time series from all grid cells within the window were included in the scale factor estimation for the central point. The rationale is that adjacent grid cells experience spatially continuous hydrological signals; expanding the sample size effectively suppresses noise or outliers in single-point estimates, enhancing statistical robustness. Furthermore, comparing results across multiple window sizes allows systematic assessment of scale factor sensitivity to spatial neighborhood extent, enabling selection of optimal parameters. The "different window" comparisons of model performance in Section 4 and Section 5 are all based on multiple scale factor matrices generated via this sliding window mechanism.
4. Spatiotemporal Characteristics of the GHLW1.0 Combined TWSC Model
To eliminate systematic amplitude biases between GRACE observations and the reanalysis-based combined hydrological model ACH-VCE, this study applies the grid-wise scale factors to calibrate the GRACE-derived TWSC series, and fuses the calibrated GRACE data with ACH-VCE, constructing a new combined global TWSC dataset named Global Hydrological Load Model version 1.0 (GHLW1.0). Existing GRACE Mascon products suffer from spatial smoothing, which suppresses local water storage details in small-to-medium basins and mountain glaciers. While ACH-VCE provides richer spatial detail, it exhibits systematic phase lags and seasonal amplitude offsets due to constraints from model boundary conditions and meteorological forcing. This chapter evaluates GHLW1.0 against original GRACE Mascon data (2000–2016) across four core geodetic and hydrological metrics: long-term linear trend, temporal RMS variability, seasonal annual amplitude, and phase lag. Through multi-dimensional quantitative consistency checks, we demonstrate that the LS scale factor fusion strategy simultaneously leverages the long-term observational constraints of GRACE satellite gravimetry and the high spatial detail of the combined hydrological model. This fusion approach explains the underlying mechanism for the subsequent improvement in GNSS deformation correction, providing prior physical and data support for the main conclusions. Figure 3 presents the global TWSC linear trend fields for different window parameter GHLW1.0 models compared to GRACE Mascon. Subfigures (a)–(h) correspond to GHLW1.0 models constructed with sliding windows of 1°, 3°, 6°, 10°, 30°, 60°, 90°, and 180°, while subfigure (l) shows the original unfused GRACE Mascon reference field. Globally, GHLW1.0 models across all window sizes exhibit high spatial consistency with GRACE Mascon in the distribution of positive and negative trends, without large-scale trend reversals. Regionally, GRACE Mascon reveals contiguous significant negative trends across Europe, Central and West Asia, with annual TWSC declines exceeding 15 mm/yr, corresponding to groundwater over-extraction, inland lake shrinkage, and aridification. Strong positive trends (>10 mm/yr) appear in the Amazon Basin, West African Sahel, South African Plateau, Indochina Peninsula, and eastern Australia, consistent with increased tropical monsoon precipitation, enhanced glacial meltwater recharge, and increased surface runoff. Compared to GRACE Mascon, GHLW1.0 trend patterns are broadly consistent but generally smaller in magnitude, mainly because ACH-VCE incorporates only soil moisture and snow water equivalent, excluding groundwater, lakes, and rivers. In large humid basins (Amazon, Congo, Mississippi) dominated by surface components, trend magnitudes show better agreement. Moreover, GHLW1.0, leveraging ACH-VCE's higher resolution, captures finer local trend structures. Weak trend signals near Greenland and Antarctic margins arise from snow water equivalent and frozen soil moisture changes in ice-free marginal zones, combined with boundary effects from spatial resampling; they do not represent polar ice sheet mass balance changes (none of the hydrological models include polar ice sheet modules). Multi-window sensitivity tests further indicate that large windows (60°, 90°) yield the smoothest trend fields, best matching GRACE Mascon's large-scale patterns, while small windows (1°, 3°) exhibit richer spatial detail without widespread trend reversals, demonstrating stable long-term trend simulation capability across spatial scales. This qualitative comparison supports the core premise: after introducing GRACE observational constraints via data fusion, the combined model effectively maintains macro-scale water storage migration patterns consistent with satellite gravimetry, providing reliable prior physical field support for subsequent quantitative deformation assessment using independent GNSS data.
Temporal RMS characterizes intra-annual and interannual TWSC fluctuation intensity, a core metric for evaluating seasonal signal simulation capability. Figure 4 shows the global TWSC RMS spatial fields for GHLW1.0 and GRACE Mascon (2000–2016). The macro-scale distribution of high and low RMS values shows good correspondence between GHLW1.0 and GRACE Mascon. High RMS values concentrate in large basins with pronounced seasonal precipitation variability, including the Amazon, Mississippi, Nile-Congo, and Ganges-Yangtze-Yellow River basins, forming contiguous high-value zones consistent with strong wet-dry alternations. Arid deserts and high-latitude permafrost regions exhibit RMS values generally below 20 mm, reflecting minimal intra-annual water storage fluctuations, consistent with regional characteristics. Compared to GRACE Mascon's smoothing that filters signals in sub-basins, GHLW1.0, benefiting from ACH-VCE's high-resolution hydrological information, more completely captures moderate-intensity fluctuations in secondary basins and intermontane valleys. Notably, significant high RMS signals are identified across Greenland, accurately characterizing seasonal glacial meltwater storage evolution during the 2000–2016 warming period—a feature underestimated by ACH-VCE alone. Quantitative statistics show high consistency between GHLW1.0 and GRACE Mascon RMS spatial distributions globally, surpassing the agreement between ACH-VCE and GRACE (Lu et al., 2026). RMS patterns remain essentially stable across different window parameters, indicating good model robustness. The consistency in RMS metrics confirms that the scale factor fusion scheme, while preserving the true fluctuation amplitude constraints from GRACE observations, refines spatial hydrological signals and improves the spatial depiction of seasonal hydrological loading deformation. This data-level explanation underlies the improvement in vertical displacement correction rates at GNSS stations discussed later. Similar to the linear trend field, this RMS comparison (Figure 4) is a qualitative internal consistency check, not independent validation. The quantitative credibility of RMS simulation capability will be independently assessed through GNSS-derived correction effectiveness in Section 5.
Figure 5 displays the global TWSC annual amplitude spatial distribution (2000–2016). Annual amplitude directly dictates the magnitude of seasonal crustal vertical deformation induced by hydrological loading and is a critical input parameter for correcting annual signals in GNSS coordinate time series. Spatially, GHLW1.0 shows macro-scale amplitude patterns consistent with GRACE Mascon in regions with strong seasonal water storage fluctuations: high-amplitude centers in the Amazon rainforest, Central African Congo Basin, South Asian Ganges-Brahmaputra Basin, and eastern/western North American monsoon regions, aligning with existing regional hydrological and GRACE deformation studies (Wen et al., 2021; Long et al., 2017; Ferreira et al., 2020; Sun et al., 2020; Tao et al., 2020). Comparing the two single data sources reveals two key optimizations: First, pure GRACE Mascon underestimates amplitudes in mountainous and small-to-medium basins due to smoothing constraints, whereas GHLW1.0, via ACH-VCE's distributed hydrological details, recovers moderate amplitude signals in mountain tributaries and small lakes. Second, ACH-VCE exhibits systematic amplitude offsets (overestimated in arid regions, underestimated in humid large basins), which are substantially reduced in GHLW1.0—after LS grid-wise scale factor calibration (Lu et al., 2026), global amplitude deviations from GRACE Mascon are controlled within ±10 mm.
To quantify the model's simulation accuracy for annual amplitude, we define the relative amplitude error as the percentage deviation of model amplitude from GRACE Mascon amplitude . Absolute deviations are computed grid-wise, and the mean absolute deviation over all land grids within specified basins is calculated as:
where N is the total number of valid grids in the basin. Based on this definition, the basin-scale quantitative statistics show that for the Yangtze, Mississippi, and Amazon basins, the relative deviation between GHLW1.0 and GRACE is about 8%, while that of ACH-VCE is about 22% (Lu et al., 2026). This indicates that the grid-wise scale factor effectively reduces systematic amplitude biases of reanalysis hydrological models, ensuring the accuracy of simulated hydrological load vertical displacement amplitudes, and providing the data basis for the high correlation coefficients and high correction rates obtained later for global GNSS sites.
Temporal phase lag reflects the temporal synchronization between TWSC changes and satellite gravity observations. Larger phase lags imply poorer matching between seasonal hydrological loading deformation and GNSS vertical time series, directly degrading annual signal correction effectiveness. Figure 6 presents two comparison dimensions: (i) phase differences among GHLW1.0 models with different window parameters; and (ii) the global phase difference field between GRACE Mascon and the 1° baseline GHLW1.0 model. First, internal temporal phase consistency among multi-window GHLW1.0 models is excellent: phase differences are less than 5 days across most global land grids; only in high mountain glacier regions (Tian Shan, eastern Himalayas, Colorado Rockies, Andes, Kilimanjaro) do deviations expand to 10–20 days. Physically, snowmelt and accumulation processes in glacier regions exhibit significant topographic variability; small windows are more sensitive to local mountain hydrological processes, while large windows smooth local phase characteristics via regional averaging. These window-dependent phase differences have clear hydrological physical meaning, not model errors, further supporting the physical plausibility of GHLW1.0's spatiotemporal features. Second, the global mean phase difference between GHLW1.0 and GRACE Mascon is only about 15 days, halving the ~30-day average phase lag of the original ACH-VCE model. ACH-VCE relies solely on meteorological forcing data to simulate water storage evolution, with inherent model time lags in the propagation of precipitation/snowmelt signals to soil water/groundwater. Our LS temporal fitting for scale factor estimation simultaneously corrects the temporal phase offsets between the two datasets, achieving temporal synchronization between GRACE observations and hydrological model time series. The significant reduction in phase lag effectively overcomes the inherent temporal lag deficiency of traditional combined hydrological models, explaining from a temporal perspective why GHLW1.0's correction of GNSS seasonal non-linear motions is comprehensively superior to ACH-VCE. This indicates that improved model temporal accuracy contributes to enhanced GNSS deformation correction.
5. Correcting Non-Linear GNSS Height Time Series Using the GHLW1.0 Combined Model
To comprehensively quantify the engineering applicability of the GHLW1.0 hydrological load model, this study applies the modeled hydrological vertical displacement field to correct hydrologically-driven non-linear deformation components in the height time series of 300 global GNSS stations. The correction method subtracts the GHLW1.0-simulated hydrological displacement series from the observed vertical displacement series at each station. We define the correction rate as the percentage of GNSS stations for which the RMS of the vertical displacement time series decreases after correction, relative to the total valid stations. This metric directly reflects the model's effective removal rate of hydrological loading noise in practical GNSS data processing and is a primary quantitative indicator for evaluating the model's practical utility. The following sections provide a stepwise quantitative evaluation: spatial distribution of correlation coefficients between modeled hydrological displacements and GNSS observations, spatial variation of correction rates, and statistical stability of correction rates across multiple window parameters. By linking these results with the TWSC temporal accuracy findings in Section 4, we establish physical mechanism connections, providing direct geodetic observational evidence supporting the core conclusion that the LS scale factor fusion strategy significantly improves GNSS non-linear deformation correction accuracy and model stability. Unlike the internal consistency checks against GRACE Mascon in Section 4, the vertical displacement time series from the 300 global GNSS stations used in this chapter are completely independent of the GHLW1.0 construction process (neither used in scale factor estimation nor ACH-VCE weighting optimization). Therefore, the correlation coefficients and correction rates computed in this chapter using GNSS data constitute an independent external quantitative validation of GHLW1.0 performance, objectively reflecting the model's real-world capability in correcting hydrological loading deformation.
Figure 7 displays the spatial distribution of Pearson correlation coefficients between GHLW1.0-simulated hydrological displacements (using various window parameters) and observed vertical displacements at 300 global GNSS stations. The correlation coefficient quantitatively represents the degree of homologous signal matching between the modeled hydrological signal and observed crustal deformation, serving as a core statistical indicator for assessing the physical validity of the hydrological load model. Broadly, the vast majority of GNSS stations across Eurasia, North America, South America, and Australia show significant positive correlations; over 90% of stations globally exhibit correlation coefficients exceeding 0.7. This result corroborates the findings in Section 4, where GHLW1.0 showed high consistency with GRACE in TWSC time series over major global basins and monsoon regions. Physically, these land areas encompass major monsoon basins and large river-lake basins, where large seasonal TWSC amplitudes drive elastic crustal vertical deformation as the dominant contributor to annual non-linear signals in GNSS height time series. GHLW1.0, leveraging GRACE-constrained TWSC fields, accurately reproduces the deformation signals driven by such seasonal mass redistribution, resulting in strong linear correlation. Regionally, weak negative correlations appear at island stations (Caribbean coast, Cuba, Jamaica, Haiti, Taiwan, Ryukyu Islands), with absolute correlation coefficients generally below 0.5. This spatial differentiation has a clear geophysical interpretation: island regions have limited land area and total terrestrial water storage; GNSS vertical displacements are simultaneously affected by multiple signals (non-tidal ocean loading, poroelastic deformation, thermal expansion), where hydrological loading signals no longer dominate, weakening the correlation between model and observed time series. Compared to the ACH-VCE control group, GHLW1.0 improves average correlation coefficients for continental stations by 0.06–0.11 and reduces scatter for island stations, reflecting comprehensive optimization of the model's adaptability to hydrological loading deformation across diverse physiographic units after incorporating GRACE constraints. The global quantitative correlation results directly support that GHLW1.0 objectively captures the spatiotemporal evolution of global-scale hydrological loading deformation with a robust physical basis, providing credibility for subsequent GNSS height time series non-linear signal correction.
Figure 8 shows the spatial distribution of hydrological loading correction rates for GHLW1.0 (various windows) applied to the vertical displacement time series of the 300 global GNSS stations. The correction rate is defined as the RMS reduction ratio of the GNSS vertical displacement time series before and after hydrological correction, directly quantifying the model's capability to remove non-linear hydrological deformation signals—a key quantitative metric for engineering utility. Spatially, correction rates exceed 75% for stations across Europe, northeastern North America, and monsoon basins in eastern South America; effective corrections are also achieved in polar continental and remote island stations. In Australia and the South Asian Ganges-Indochina Peninsula basins, GHLW1.0 correction effects are significantly superior to the single combined model ACH-VCE. Linking with Section 4's temporal metrics, these high-correction-rate regions correspond to areas with high TWSC seasonal amplitude and RMS. Here, GHLW1.0 precisely corrects inherent amplitude underestimation and phase lag biases in the reanalysis model, fully restoring the magnitude and temporal synchronization of hydrological loading deformation, thereby substantially improving the removal efficiency of non-linear GNSS signals. For two special regional categories—arid deserts and small islands—sub-analysis shows: in arid inland regions (Central Asia, Sahara), TWSC fluctuations are minimal, and hydrological loading signals have low amplitudes; both models show moderate correction rates, but GHLW1.0, leveraging GRACE long-term trend constraints, still slightly reduces time series scatter. For remote small islands, due to sparse local hydrological data, ACH-VCE struggles to capture minute TWSC variations, yielding correction rates generally below 50% (Lu et al., 2026); GHLW1.0, via grid-wise scale factor calibration, incorporates distant GRACE mass change constraints, marginally improving correction effects for island stations. This spatial comparison fully demonstrates that compared to the multi-model ensemble ACH-VCE, GHLW1.0, incorporating GRACE observational constraints, provides more balanced and superior hydrological deformation correction capability for GNSS stations across diverse climate and geomorphic regions globally, effectively mitigating performance deficiencies of traditional combined models in tropical humid basins, islands, and arid zones.
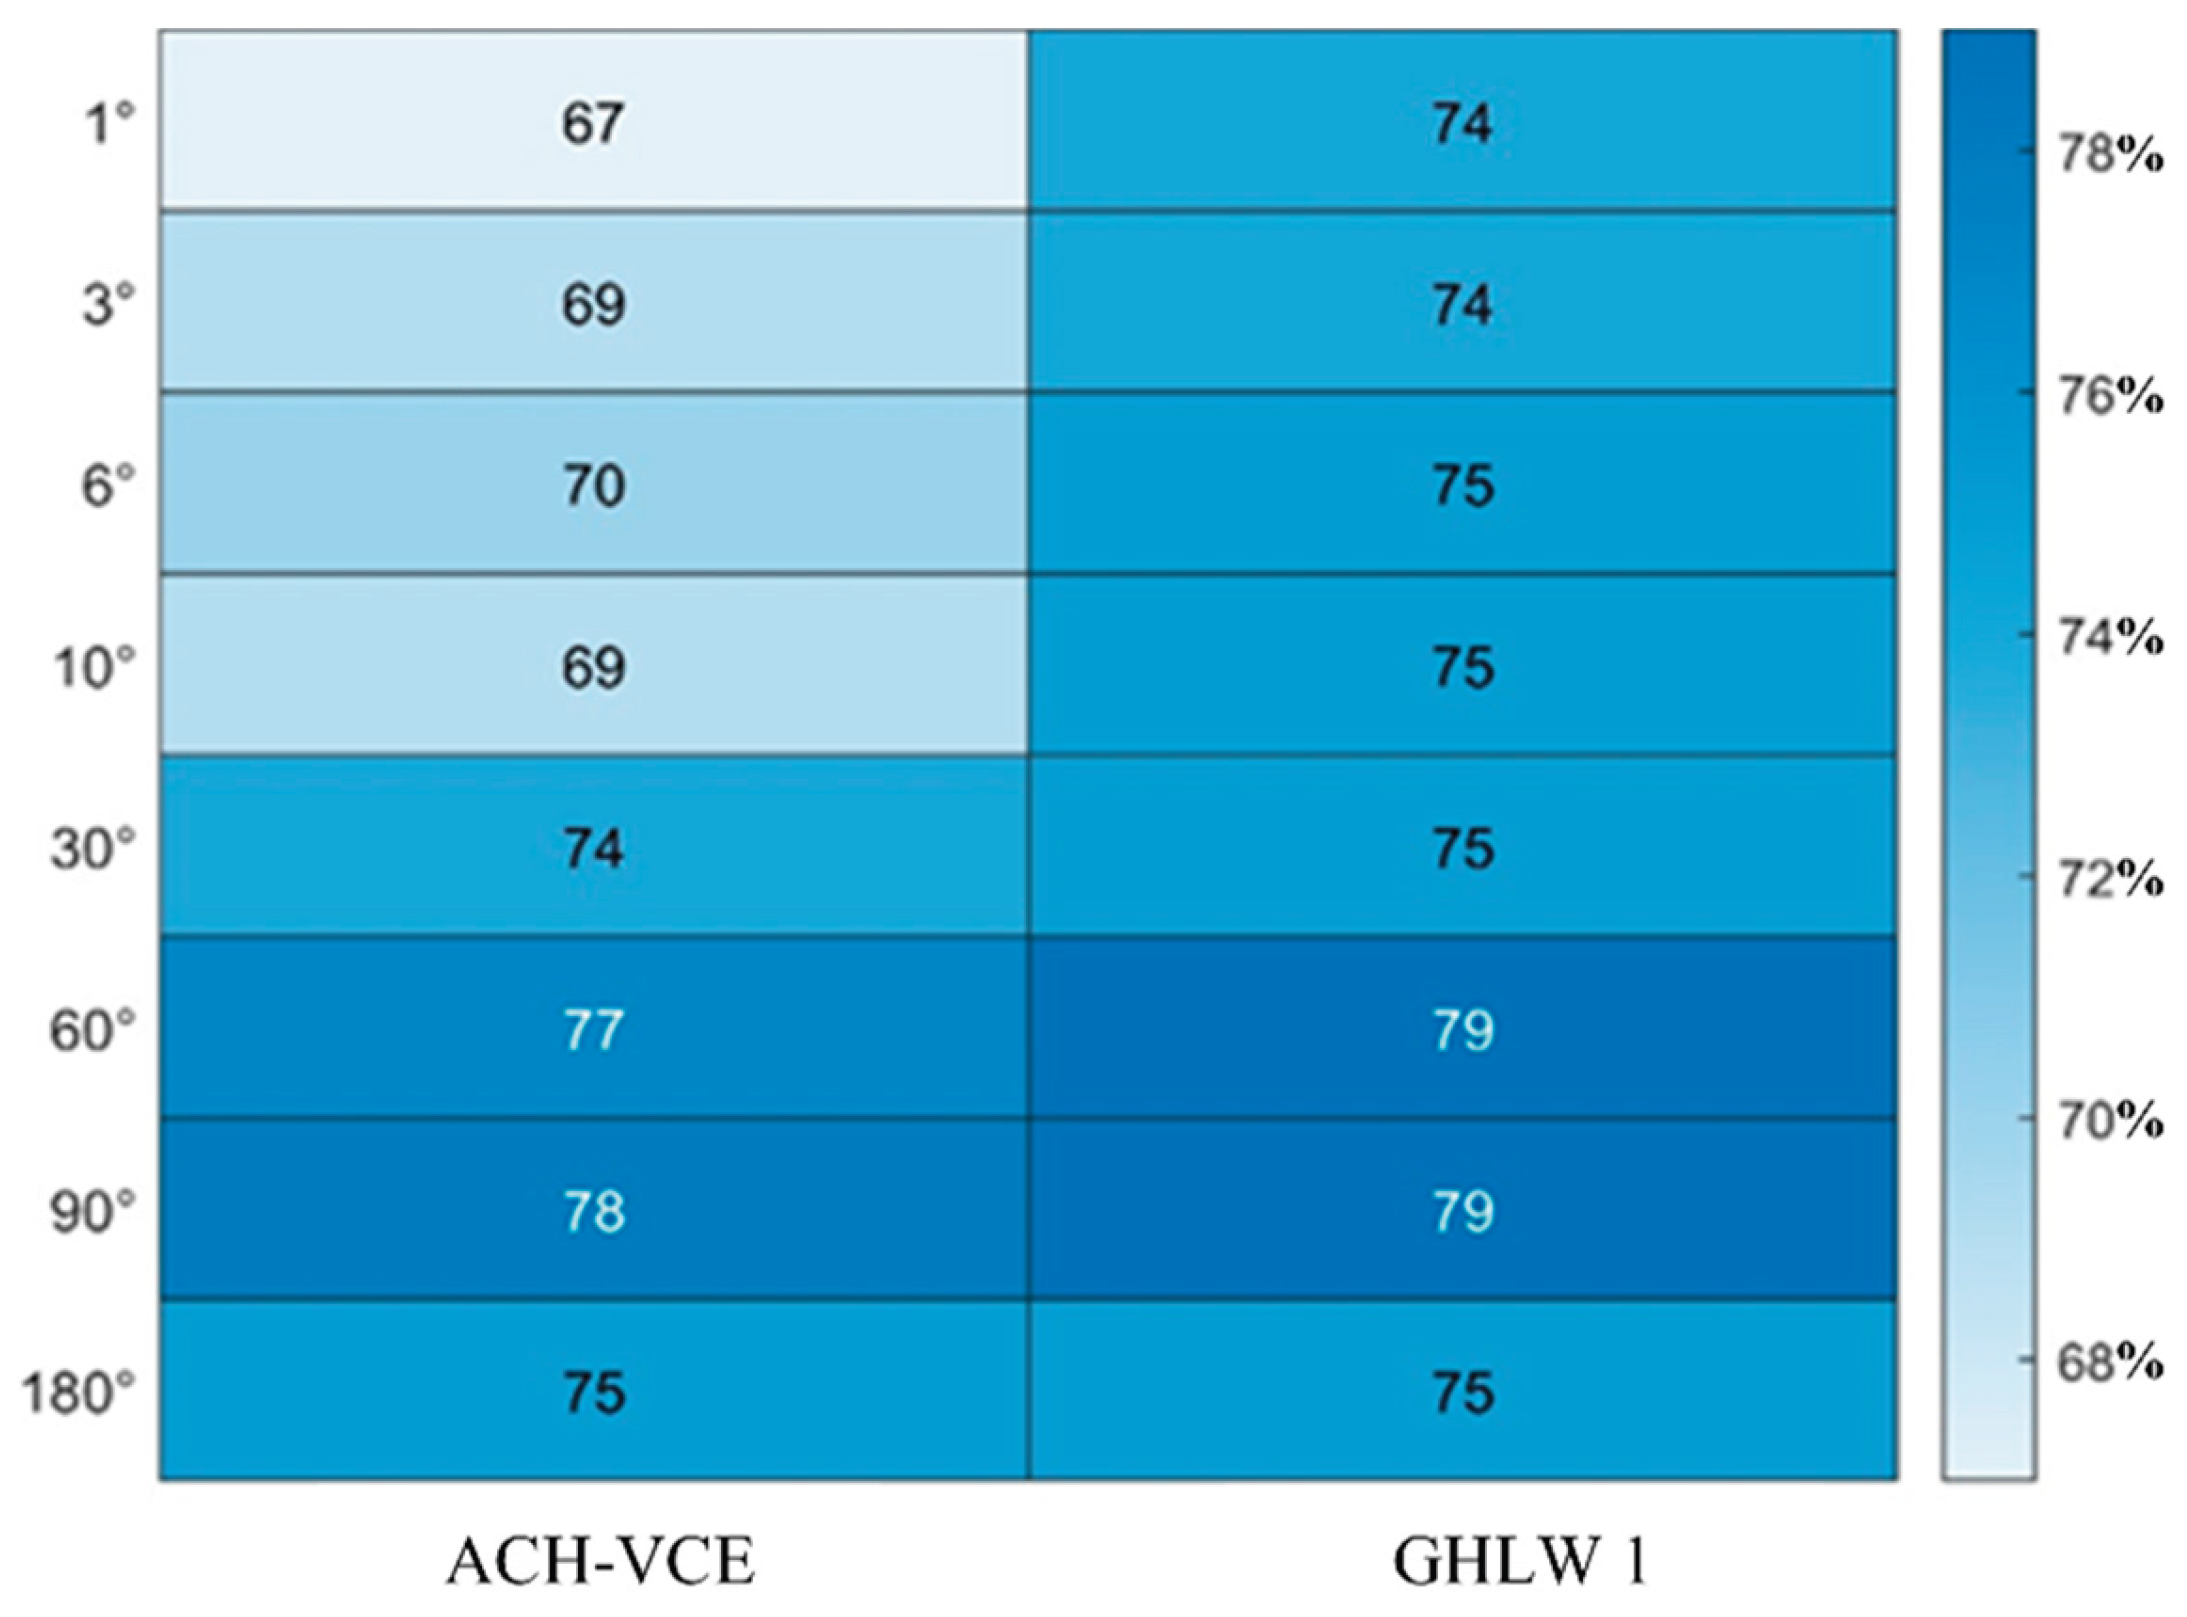
Figure 9 presents the global average correction rates for GHLW1.0 and ACH-VCE across the 300 GNSS stations, for eight sliding window sizes (1°, 3°, 6°, 10°, 30°, 60°, 90°, 180°). Analysis from mean and parameter sensitivity perspectives quantifies GHLW1.0's correction accuracy and computational stability. Global mean: GHLW1.0 achieves an average multi-window global correction rate of 76% for vertical non-linear deformations, approximately 3 percentage points higher than ACH-VCE (~73%) under identical window parameters. Optimal performance occurs at 60° and 90° windows, with maximum global correction rate reaching 79%. Combined with Section 4's multi-window TWSC temporal metrics, under 60°/90° large-window conditions, GHLW1.0 shows optimal consistency with GRACE Mascon in linear trends, RMS, and annual amplitude, with temporal phase lag controlled within 15 days. The optimal TWSC field precision directly corresponds to the peak GNSS deformation correction effect, indicating a progressive positive correlation among TWSC simulation accuracy, hydrological displacement precision, and GNSS correction rate. Model stability (parameter sensitivity): This provides critical support for the core innovative conclusions: GHLW1.0 correction rates fluctuate by only 5% across multi-window tests, maintaining consistent correction effectiveness under different window settings. In contrast, the ACH-VCE control group exhibits correction rate fluctuations up to 16%, showing strong dependence on the computational window and poor robustness. The underlying mechanism for this difference stems from the fundamental distinction in data source composition: ACH-VCE is constructed solely from an ensemble of reanalysis hydrological models without independent satellite observational constraints; its uncertainty is significantly affected by window sample selection. GHLW1.0, however, integrates GRACE Mascon gravity observations via LS grid-wise scale factors; the satellite gravity data provide stable, independent constraints on global water storage amplitude and timing, substantially reducing output biases due to window parameter adjustments and lowering model uncertainty. This quantitative comparison supports the effectiveness of our fusion strategy—introducing GRACE observational constraints reduces single-model uncertainty—and demonstrates GHLW1.0's enhanced generality and robustness in practical applications, obviating the need for stringent window parameter restrictions.
6. Conclusions
Addressing the spatiotemporal resolution limitations and systematic biases inherent in standalone GRACE and reanalysis hydrological model TWSC retrievals, as well as the reliance of existing fusion schemes on single hydrological models that neglect model uncertainties, this paper proposes a multi-source data fusion method based on grid-wise Least Squares scale factors. By integrating GRACE Mascon with the combined hydrological product ACH-VCE, we construct GHLW1.0, a global hydrological load model at 1°×1° resolution for 2000–2016. GHLW1.0 effectively inherits the macro-scale hydrological characteristics depicted by GRACE Mascon (internal consistency checks) across long-term trends, temporal RMS, annual amplitude, and phase patterns. It reduces temporal phase lag from 30 days (ACH-VCE) to 15 days relative to GRACE, simultaneously leveraging satellite gravimetry's global constraints and the fine spatial detail of hydrological models. Independent validation using 300 global GNSS stations shows correlation coefficients exceeding 0.7 between modeled hydrological displacements and observed vertical displacements at most stations. The model achieves an average global correction rate of 76%, peaking at 79% under optimal windows—a 3% improvement over ACH-VCE—with only 5% fluctuation across multiple window parameters, demonstrating significantly superior robustness compared to traditional ensemble-only schemes. Comprehensive multi-source evaluation confirms that the LS scale factor fusion strategy effectively corrects systematic amplitude and phase biases in reanalysis hydrological models, substantially reducing modeling uncertainties. The resulting improvements in both TWSC retrieval accuracy and GNSS non-linear vertical deformation correction are significantly better than those from GRACE or single hydrological models alone. This fusion framework has global applicability and provides a high-precision, high-stability hydrological load dataset for TRF refinement and research on the global water cycle and climate change.
Limitations and Future Work: GRACE observes only total TWSC, without resolving subsurface components (groundwater, snow, soil water), leading to inherent signal component mismatches with reanalysis models that linear scale factors alone cannot fully eliminate, resulting in slight accuracy degradation in regions like alpine glaciers and islands. Additionally, the model uses monthly temporal resolution with a limited time span and does not provide a complete model error covariance field, hindering rigorous error propagation analysis and high-frequency GNSS correction. To address these, future research will: (1) introduce Singular Spectrum Analysis for decomposing homogeneous hydrological signals from GRACE and model time series to mitigate fusion errors from component discrepancies; (2) develop a multi-source data assimilation framework coupling GRACE-FO observations to extend the temporal coverage and produce daily-resolution high-frequency hydrological loading products with associated uncertainty fields; and (3) conduct regionally refined calibrations for typical basins and high mountain areas, extending the model's application to crustal deformation separation and polar glacier hydrological responses.
Author Contributions
Conceptualization, Yang Lu and Xuping Jiang; literature review, All Authors; methodology, Yang Wu; formal analysis, Yinhu Zhang.; writing—original draft, Yang Lu.; writing—review & editing, Xinsheng Wang and Yaofeng Su; visualization, Xinsheng Wang; supervision, Xuping Jiang; funding acquisition, Yang Wu.
Data Availability Statement
The original contributions presented in this study are included in the article. Further inquiries can be directed to the corresponding author.
Conflicts of Interest
The authors declare no conflicts of interest.
References
- Tapley B D. GRACE Measurements of Mass Variability in the[J]. science, 2004, 1099192(503): 305.
- Wahr, J., Swenson, S., Zlotnicki, V., & Velicogna, I.. Time-variable gravity from GRACE: First resultsGeophysical Research Letters, 2004, 31, L11501.
- Strassberg G, Scanlon B R, Chambers D. Evaluation of groundwater storage monitoring with the GRACE satellite: Case study of the High Plains aquifer, central United States[J]. Water Resources Research, 2009, 45(5).
- Chen, J. L., Wilson, C. R., & Zhou, Y. H. Seasonal excitation of polar motion. Journal of Geodynamics ,2012, 62, 8-15.
- Ren, Y., Pan, Y., & Gong, H. Haihe Basin groundwater reserves time-varying trends analysis. Journal of Capital Normal University (Natural Science Edition) , 2013, 34(4), 88-94,7.
- Jiang, W. P., Li, Z., Liu, H. F., & Zhao, Q. Cause analysis of the non-linear variation of the IGS reference station coordinate time series inside China. Chinese Journal of Geophysics, 2013, 56(7), 2228-2237.
- Dill R, Dobslaw H. Numerical simulations of global-scale high-resolution hydrological crustal deformations[J]. Journal of Geophysical Research: Solid Earth, 2013, 118(9): 5008-5017.
- Chen Q. Analyzing and modeling environmental loading induced displacements with GPS and GRACE[D]. Stuttgart, Universität Stuttgart, Diss., 2015.
- Li, Z., Yue, J., Li, W., Lu, D., & Li, X. A comparison of hydrological deformation using GPS and global hydrological model for the Eurasian plate. Advances in Space Research, 2017, 60(3), 587-596.
- Li, Z., Chen, W., van Dam, T., Rebischung, P., & Altamimi, Z. Comparative analysis of different atmospheric surface pressure models and their impacts on daily ITRF2014 GNSS residual time series: Z. Li et al. Journal of Geodesy, 2020, 94(4), 42.
- Hu, S., Wang, T., Guan, Y., & Yang, Z. Analyzing the seasonal fluctuation and vertical deformation in Yunnan province based on GPS measurement and hydrological loading model. Chinese Journal of Geophysics, 2021, 64(8), 2613-2630.
- Pan, Y., Chen, R., Yi, S., Wang, W., Ding, H., Shen, W., & Chen, L. Contemporary mountain-building of the Tianshan and its relevance to geodynamics constrained by integrating GPS and GRACE measurements. Journal of Geophysical Research: Solid Earth, 2019, 124(11), 12171-12188.
- Pan, Y., Ding, H., Li, J., Shum, C. K., Mallick, R., Jiao, J., ... & Zhang, Y. Transient hydrology-induced elastic deformation and land subsidence in Australia constrained by contemporary geodetic measurements. Earth and Planetary Science Letters, 2022, 588, 117556.
- Yuan, P., Jiang, W., Wang, K., & Sneeuw, N. Effects of spatiotemporal filtering on the periodic signals and noise in the GPS position time series of the crustal movement observation network of China. Remote Sensing ,2018, 10(9), 1472.
- Zhang, Y., Ye, A., Nguyen, P., Analui, B., Sorooshian, S., & Hsu, K. Error characteristics and scale dependence of current satellite precipitation estimates products in hydrological modeling. Remote Sensing, 2021, 13(16), 3061.
- Van Dam, T., Wahr, J., Milly, P. C. D., Shmakin, A. B., Blewitt, G., Lavallée, D., & Larson, K. M. Crustal displacements due to continental water loading. Geophysical research letters, 2001, 28(4), 651-654.
- Davis, J. L., Elósegui, P., Mitrovica, J. X., & Tamisiea, M. E. Climate-driven deformation of the solid Earth from GRACE and GPS. Geophysical research letters, 2004, 31(24).
- He, X., Hua, X., Yu, K., Xuan, W., Lu, T., Zhang, W., & Chen, X. Accuracy enhancement of GPS time series using principal component analysis and block spatial filtering. Advances in Space Research, 2015, 55(5), 1316-1327.
- Li, Z., van Dam, T., Collilieux, X., Altamimi, Z., Rebischung, P., & Nahmani, S. Quality evaluation of the weekly vertical loading effects induced from continental water storage models. In IAG 150 Years: Proceedings of the IAG Scientific Assembly in Postdam, Germany, 2013 (pp. 45-54). Cham: Springer International Publishing.
- Lu, Y., Li, Z., Chen, Q., He, M., Wang, Z., Wang, J., & Jiang, W. 2024. Comparative analysis of recent hydrological models and an attempt to generate new combined products for monitoring terrestrial water storage change. Geodesy and Geodynamics, 15(6), 616-626. [CrossRef]
- Karegar, M. A., Dixon, T. H., Kusche, J., & Chambers, D. P. A new hybrid method for estimating hydrologically induced vertical deformation from GRACE and a hydrological model: an example from Central North America. Journal of Advances in Modeling Earth Systems, 2018, 10(5), 1196-1217. [CrossRef]
- Springer, A., Karegar, M. A., Kusche, J., Keune, J., Kurtz, W., & Kollet, S. Evidence of daily hydrological loading in GPS time series over Europe. Journal of geodesy, 2019, 93(10), 2145-2153. [CrossRef]
- Dill R, Dobslaw H. Numerical simulations of global-scale high-resolution hydrological crustal deformations[J]. Journal of Geophysical Research: Solid Earth, 2013, 118(9): 5008-5017. [CrossRef]
- Sun, Z., Long, D., Yang, W., Li, X., & Pan, Y. Reconstruction of GRACE data on changes in total water storage over the global land surface and 60 basins. Water Resources Research, 2020, 56(4), e2019WR026250. [CrossRef]
- Tangdamrongsub N, Šprlák M. The assessment of hydrologic-and flood-induced land deformation in data-sparse regions using GRACE/GRACE-FO data assimilation[J]. Remote Sensing, 2021, 13(2): 235. [CrossRef]
- Gerdener, H., Kusche, J., Schulze, K., Döll, P., & Klos, A. The global land water storage data set release 2 (GLWS2. 0) derived via assimilating GRACE and GRACE-FO data into a global hydrological model: H. Gerdener et al. Journal of Geodesy, 2023, 97(7), 73. [CrossRef]
- Yang Lu., Xuping Jiang., Zhao Li., Weiping Jiang., Yang Wu., Yaofeng Su., Wenlan Fan., Ruiqi Liu. Constrained Ensemble Modeling of Terrestrial Water Storage Changes for Improved Hydrological Loading Correction in GNSS Height Time Series[J]. Geo-Spatial Information Science, 2026.
- Save H, Bettadpur S, Tapley B D. High-resolution CSR GRACE RL05 mascons[J]. Journal of Geophysical Research: Solid Earth, 2016, 121(10): 7547-7569. [CrossRef]
- Scanlon, B. R., Zhang, Z., Save, H., Wiese, D. N., Landerer, F. W., Long, D., ... & Chen, J. Global evaluation of new GRACE mascon products for hydrologic applications[J]. Water Resources Research, 2016, 52(12): 9412-9429. [CrossRef]
- Wang, P., Wang, S. Y., Li, J., Chen, J., & Qi, Z. Comparison of GRACE/GRACE-FO spherical harmonic and mascon products in interpreting GNSS vertical loading deformations over the Amazon Basin[J]. Remote Sensing, 2023, 15(1): 252. [CrossRef]
- Durga Rao K, Srilatha Indira Dutt V B S. Investigation of Suitable Geometry Based Ionospheric Models to Estimate the Ionospheric Parameters Using the Data of a Ground Based GPS Receiver[M]//Microelectronics, Electromagnetics and Telecommunications: Proceedings of ICMEET 2015. New Delhi: Springer India, 2015: 459-466. [CrossRef]
- Bock, Y., & Wdowinski, S. GNSS geodesy in geophysics, natural hazards, climate, and the environment. Position, Navigation, and Timing Technologies in the 21st Century: Integrated Satellite Navigation, Sensor Systems, and Civil Applications, 2020, 1, 741-820. [CrossRef]
- Argus, D. F., Peltier, W. R., Drummond, R., & Moore, A. W. 2014. The Antarctica component of postglacial rebound model ICE-6G_C (VM5a) based on GPS positioning, exposure age dating of ice thicknesses, and relative sea level histories[J]. Geophysical Journal International, 198(1), 537-563. [CrossRef]
- Williams, S. D. P., & Penna, N. T. Non-tidal ocean loading effects on geodetic GPS heights[J]. Geophysical Research Letters, 2011, 38(9). [CrossRef]
- Wen Zhiqiang, Huang Zhengkai. A research on water storage changes in the Indus-Ganges river basin based on GRACE time-varying gravity field[J]. GNSS World of China, 2020, 45(5): 103-107. [CrossRef]
- Long, D., Pan, Y., Zhou, J., Chen, Y., Hou, X., Hong, Y., ... & Longuevergne, L. Global analysis of spatiotemporal variability in merged total water storage changes using multiple GRACE products and global hydrological models[J]. Remote sensing of environment, 2017, 192: 198-216. [CrossRef]
- Ferreira, V. G., Yong, B., Tourian, M. J., Characterization of the hydro-geological regime of Yangtze River basin using remotely-sensed and modeled products[J]. Science of the Total Environment, 2020, 718: 137354. [CrossRef]
- Tao, D., Shi, H., Gao, C., Zhan, J., & Ke, X. Water storage monitoring in the Aral Sea and its Endorheic Basin from multisatellite data and a hydrological model[J]. Remote Sensing, 2020, 12(15): 2408. [CrossRef]
Figure 1.
Distribution of GNSS stations used in this study.
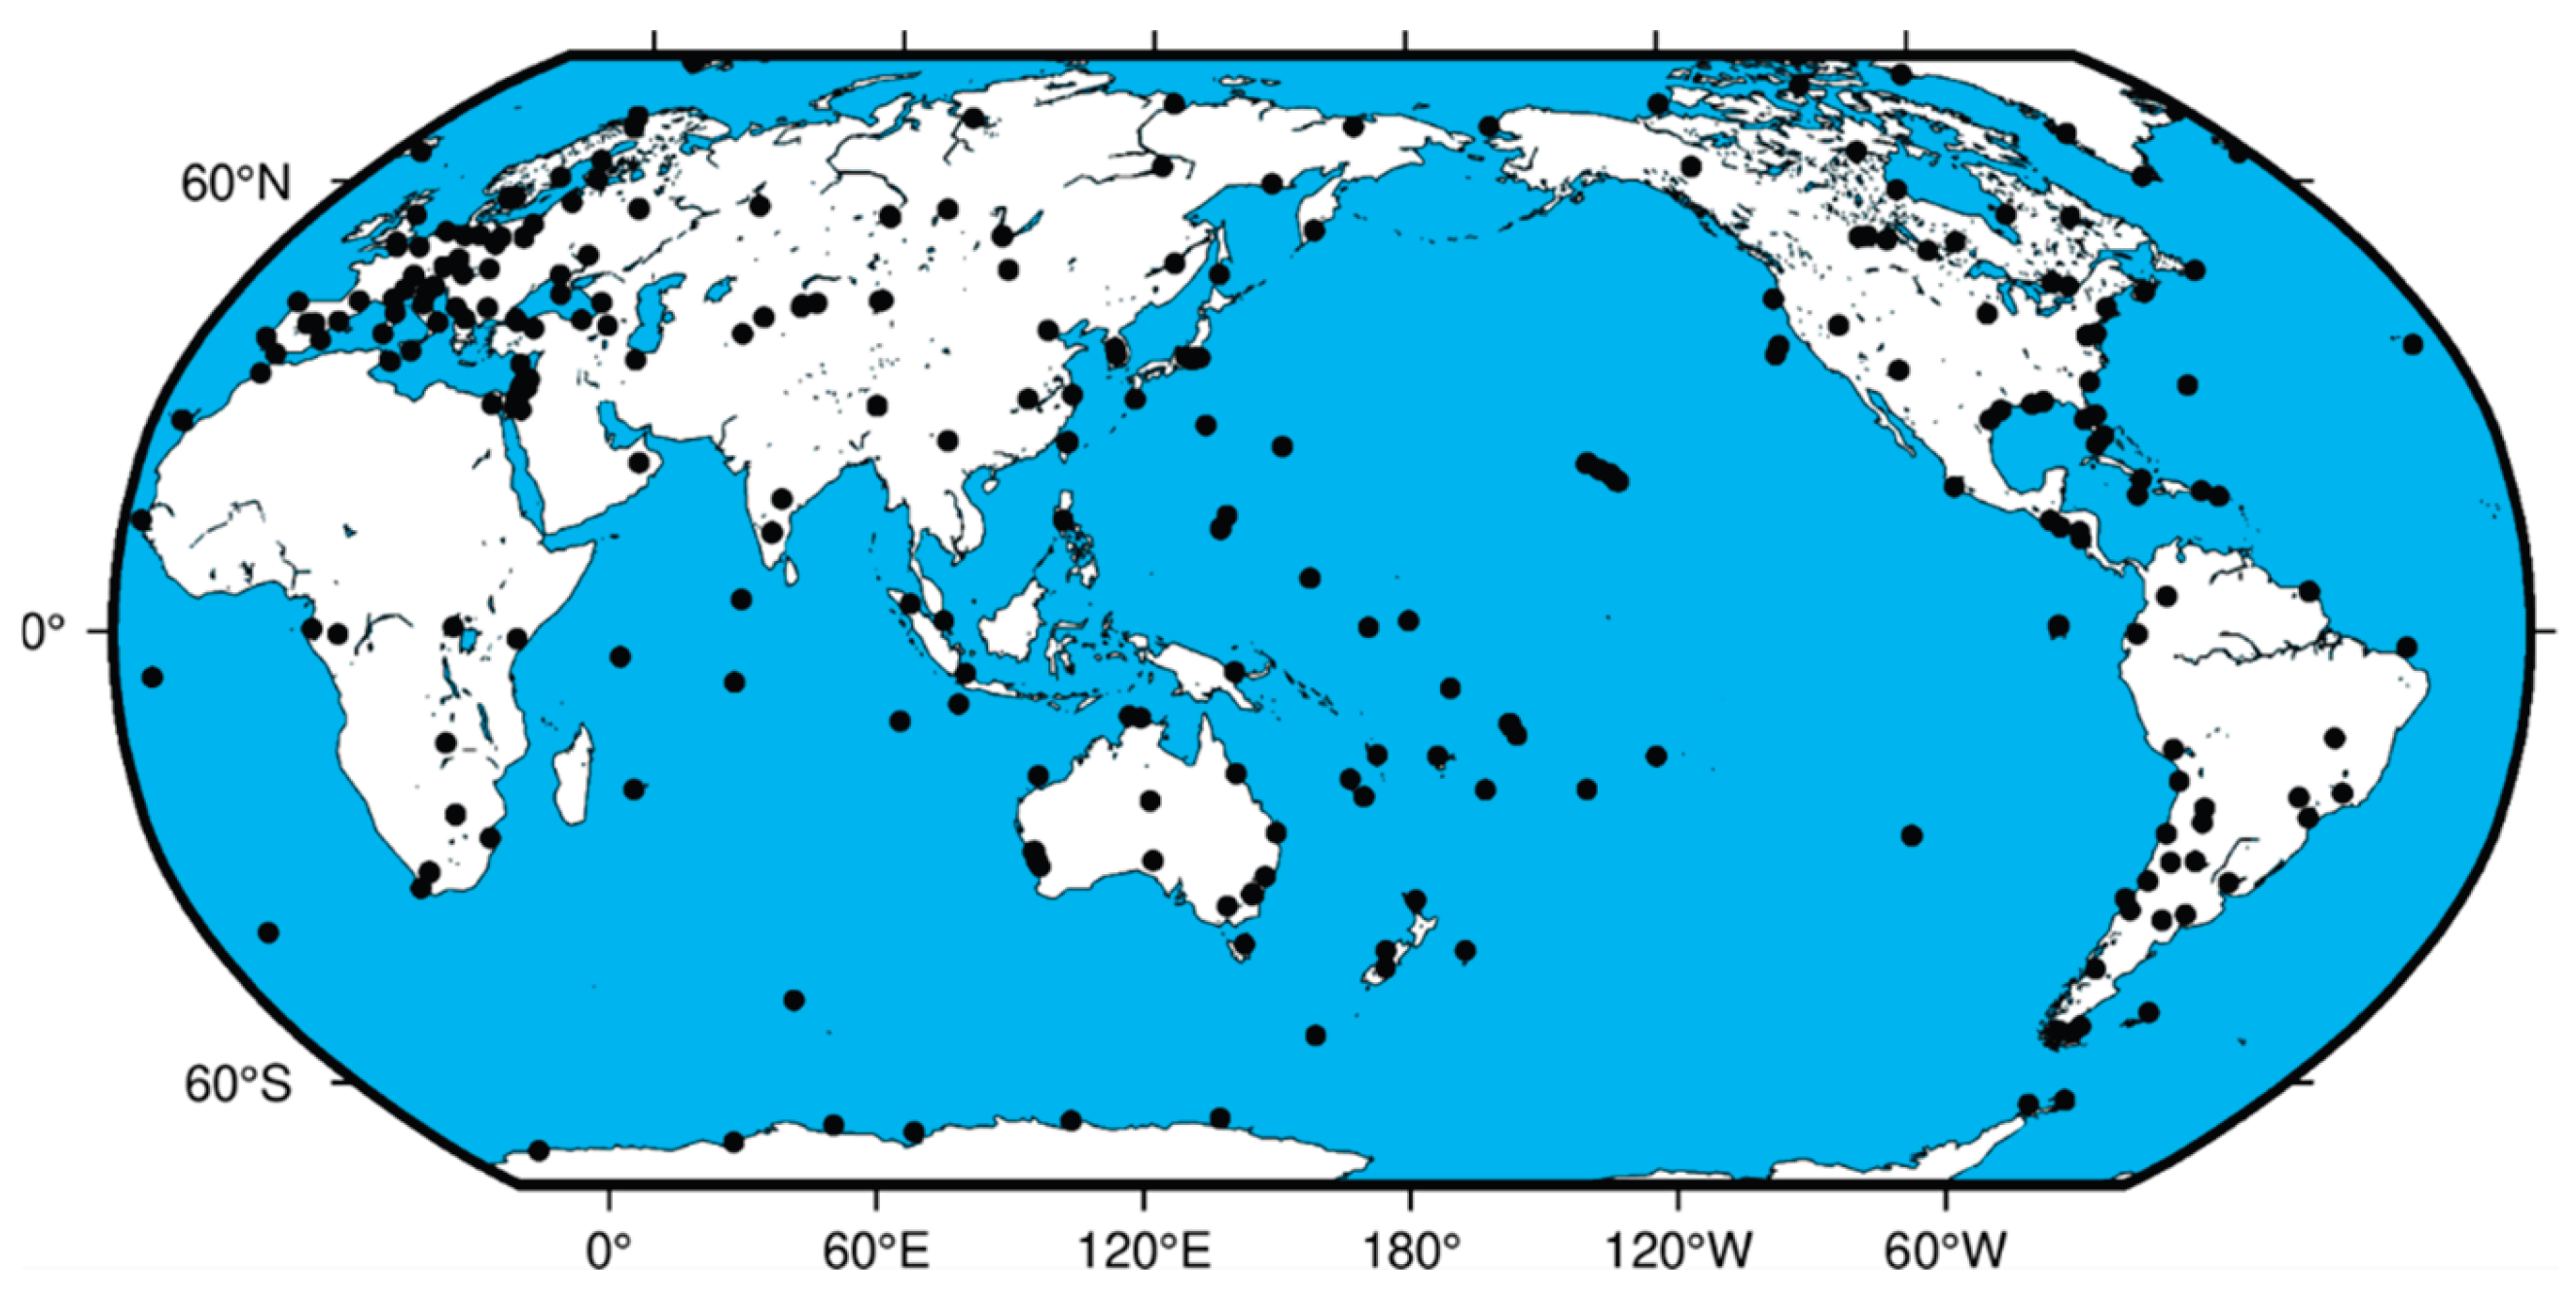
Figure 2.
Global scale factor matrix (Factor) derived via the Least Squares method.
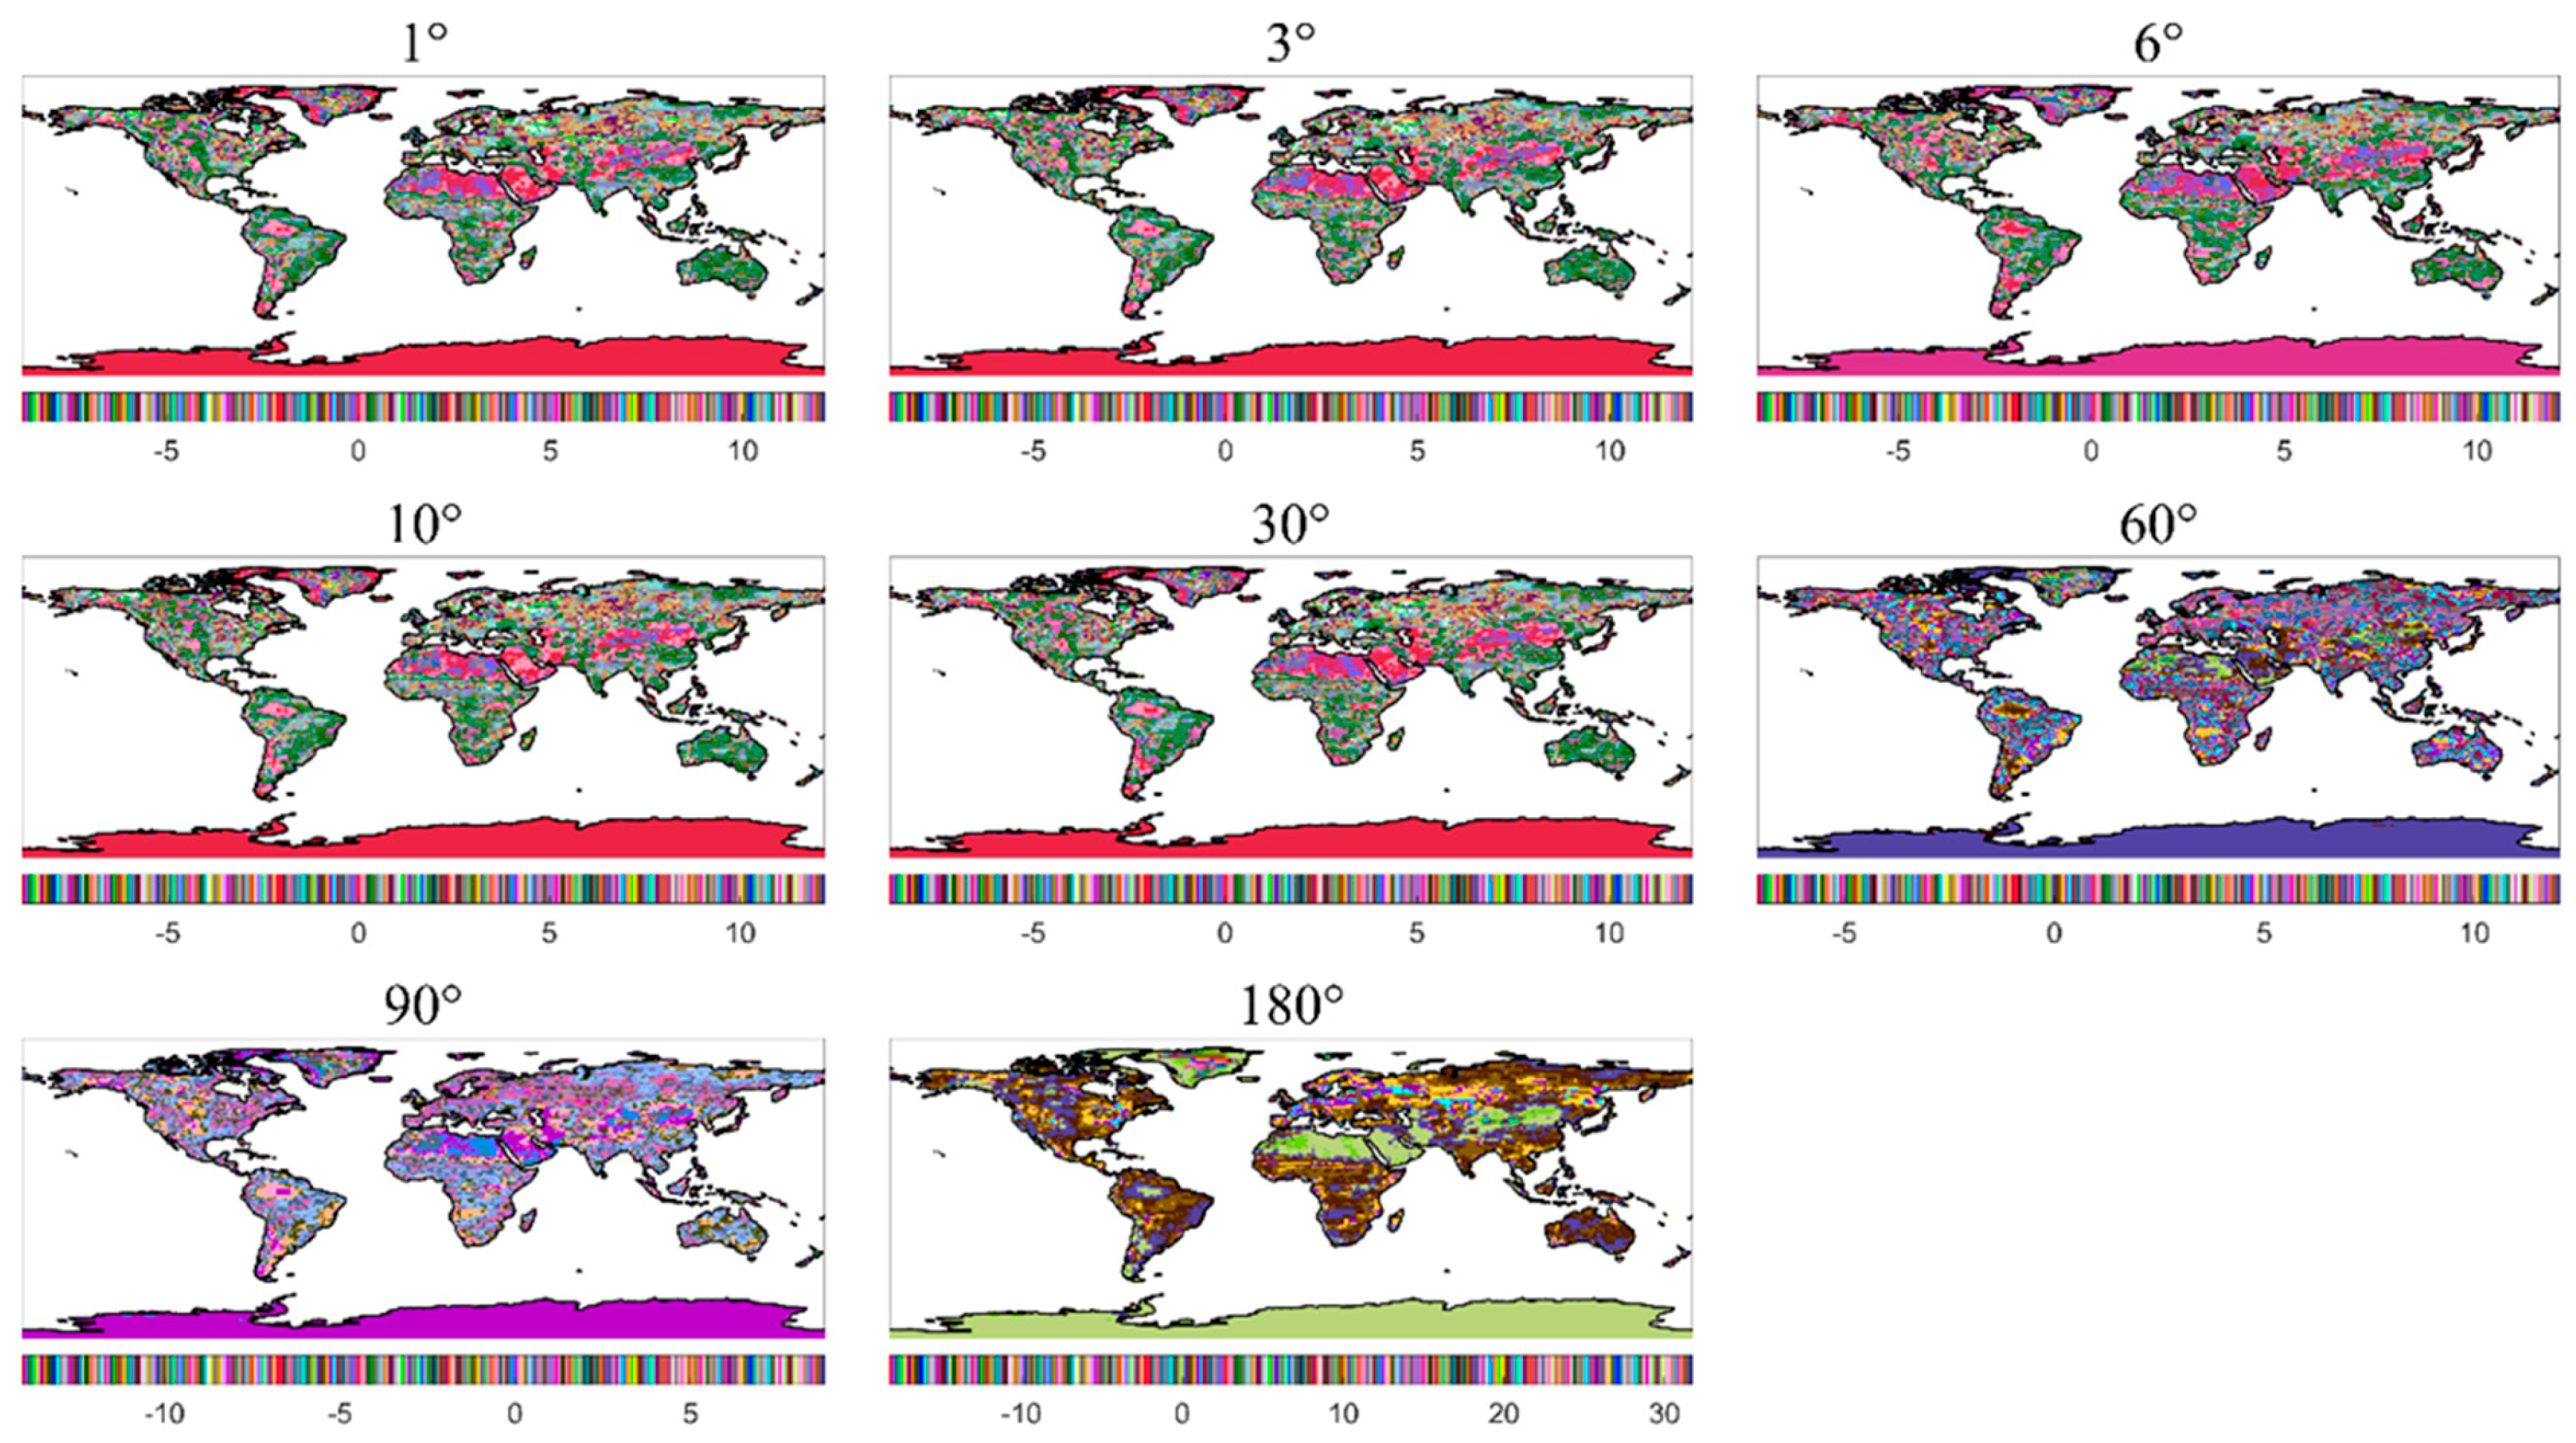
Figure 3.
Global TWSC linear trends for GHLW1.0 models (various windows) and the GRACE Mascon reference. (Note: This is an internal consistency comparison between GHLW1.0 and the GRACE Mascon reference field; GRACE Mascon data participated in model construction and do not serve as independent validation.).
Figure 3.
Global TWSC linear trends for GHLW1.0 models (various windows) and the GRACE Mascon reference. (Note: This is an internal consistency comparison between GHLW1.0 and the GRACE Mascon reference field; GRACE Mascon data participated in model construction and do not serve as independent validation.).
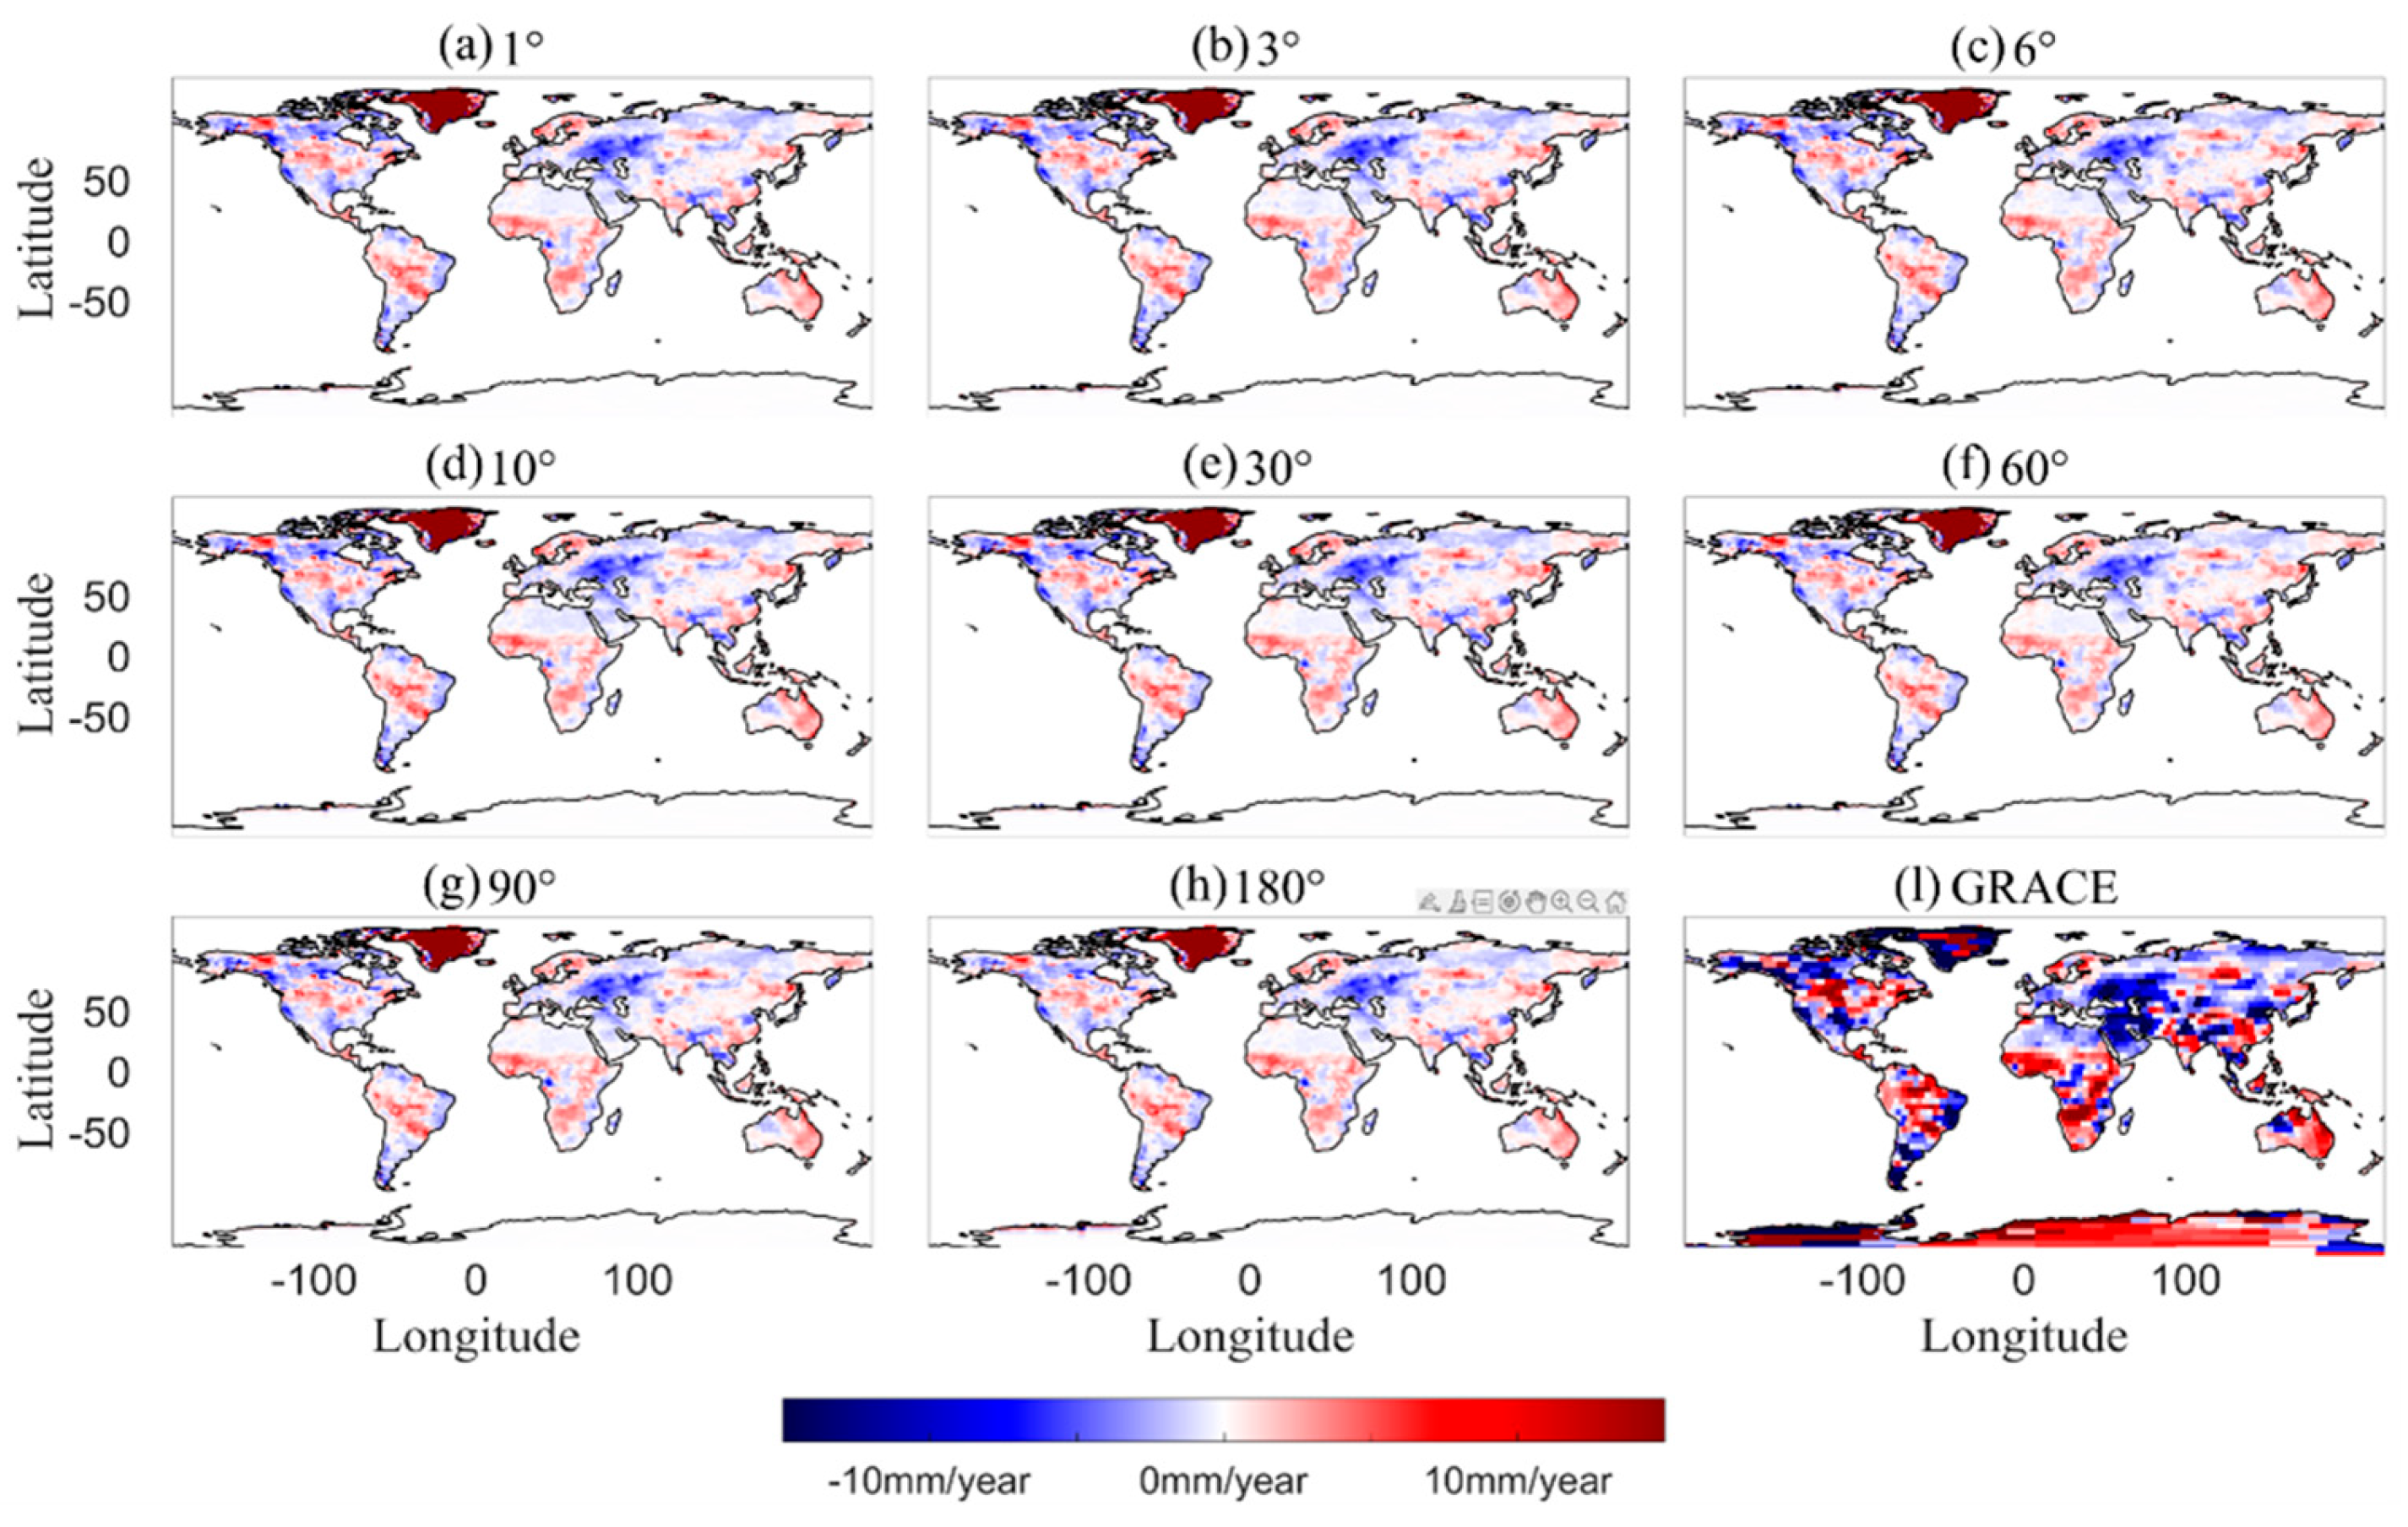
Figure 4.
Global TWSC RMS for GHLW1.0 models (various windows) and the GRACE Mascon reference. (Note: Internal consistency comparison; GRACE Mascon data participated in model construction and do not serve as independent validation.).
Figure 4.
Global TWSC RMS for GHLW1.0 models (various windows) and the GRACE Mascon reference. (Note: Internal consistency comparison; GRACE Mascon data participated in model construction and do not serve as independent validation.).
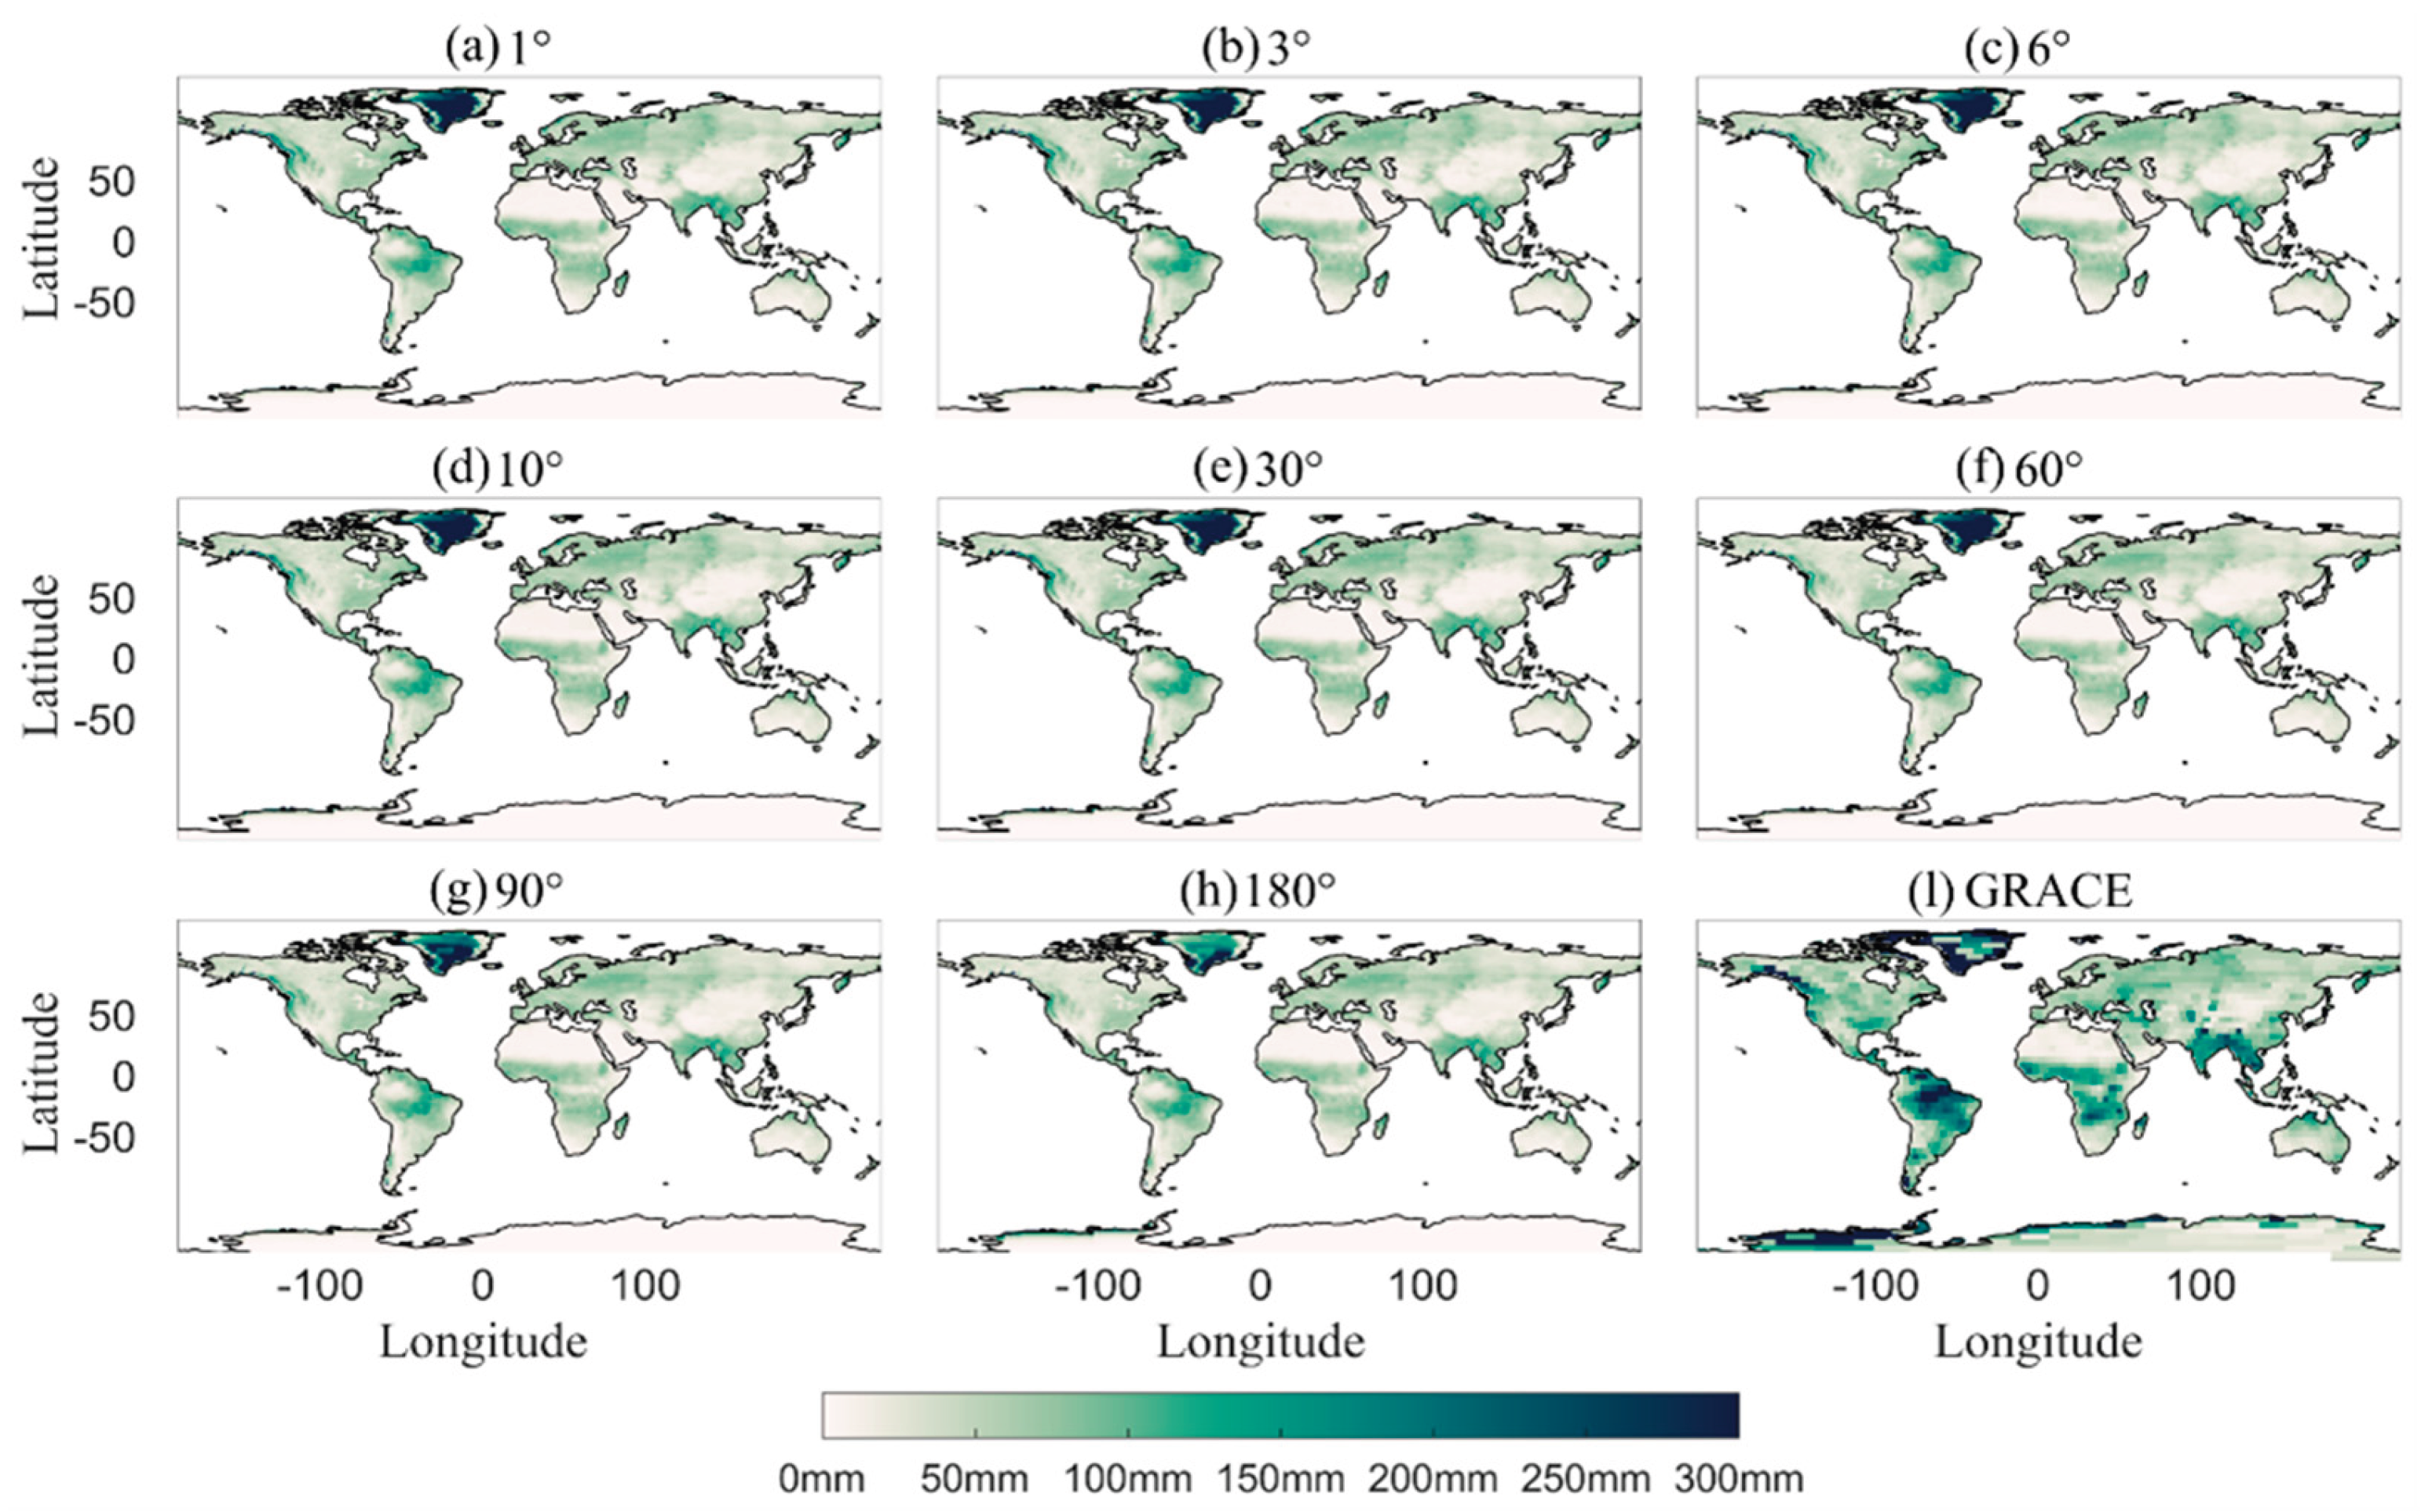
Figure 5.
Global TWSC annual amplitude for GHLW1.0 models (various windows) and the GRACE Mascon reference (2002-2016). (Note: Internal consistency comparison; GRACE Mascon data participated in model construction and do not serve as independent validation.).
Figure 5.
Global TWSC annual amplitude for GHLW1.0 models (various windows) and the GRACE Mascon reference (2002-2016). (Note: Internal consistency comparison; GRACE Mascon data participated in model construction and do not serve as independent validation.).
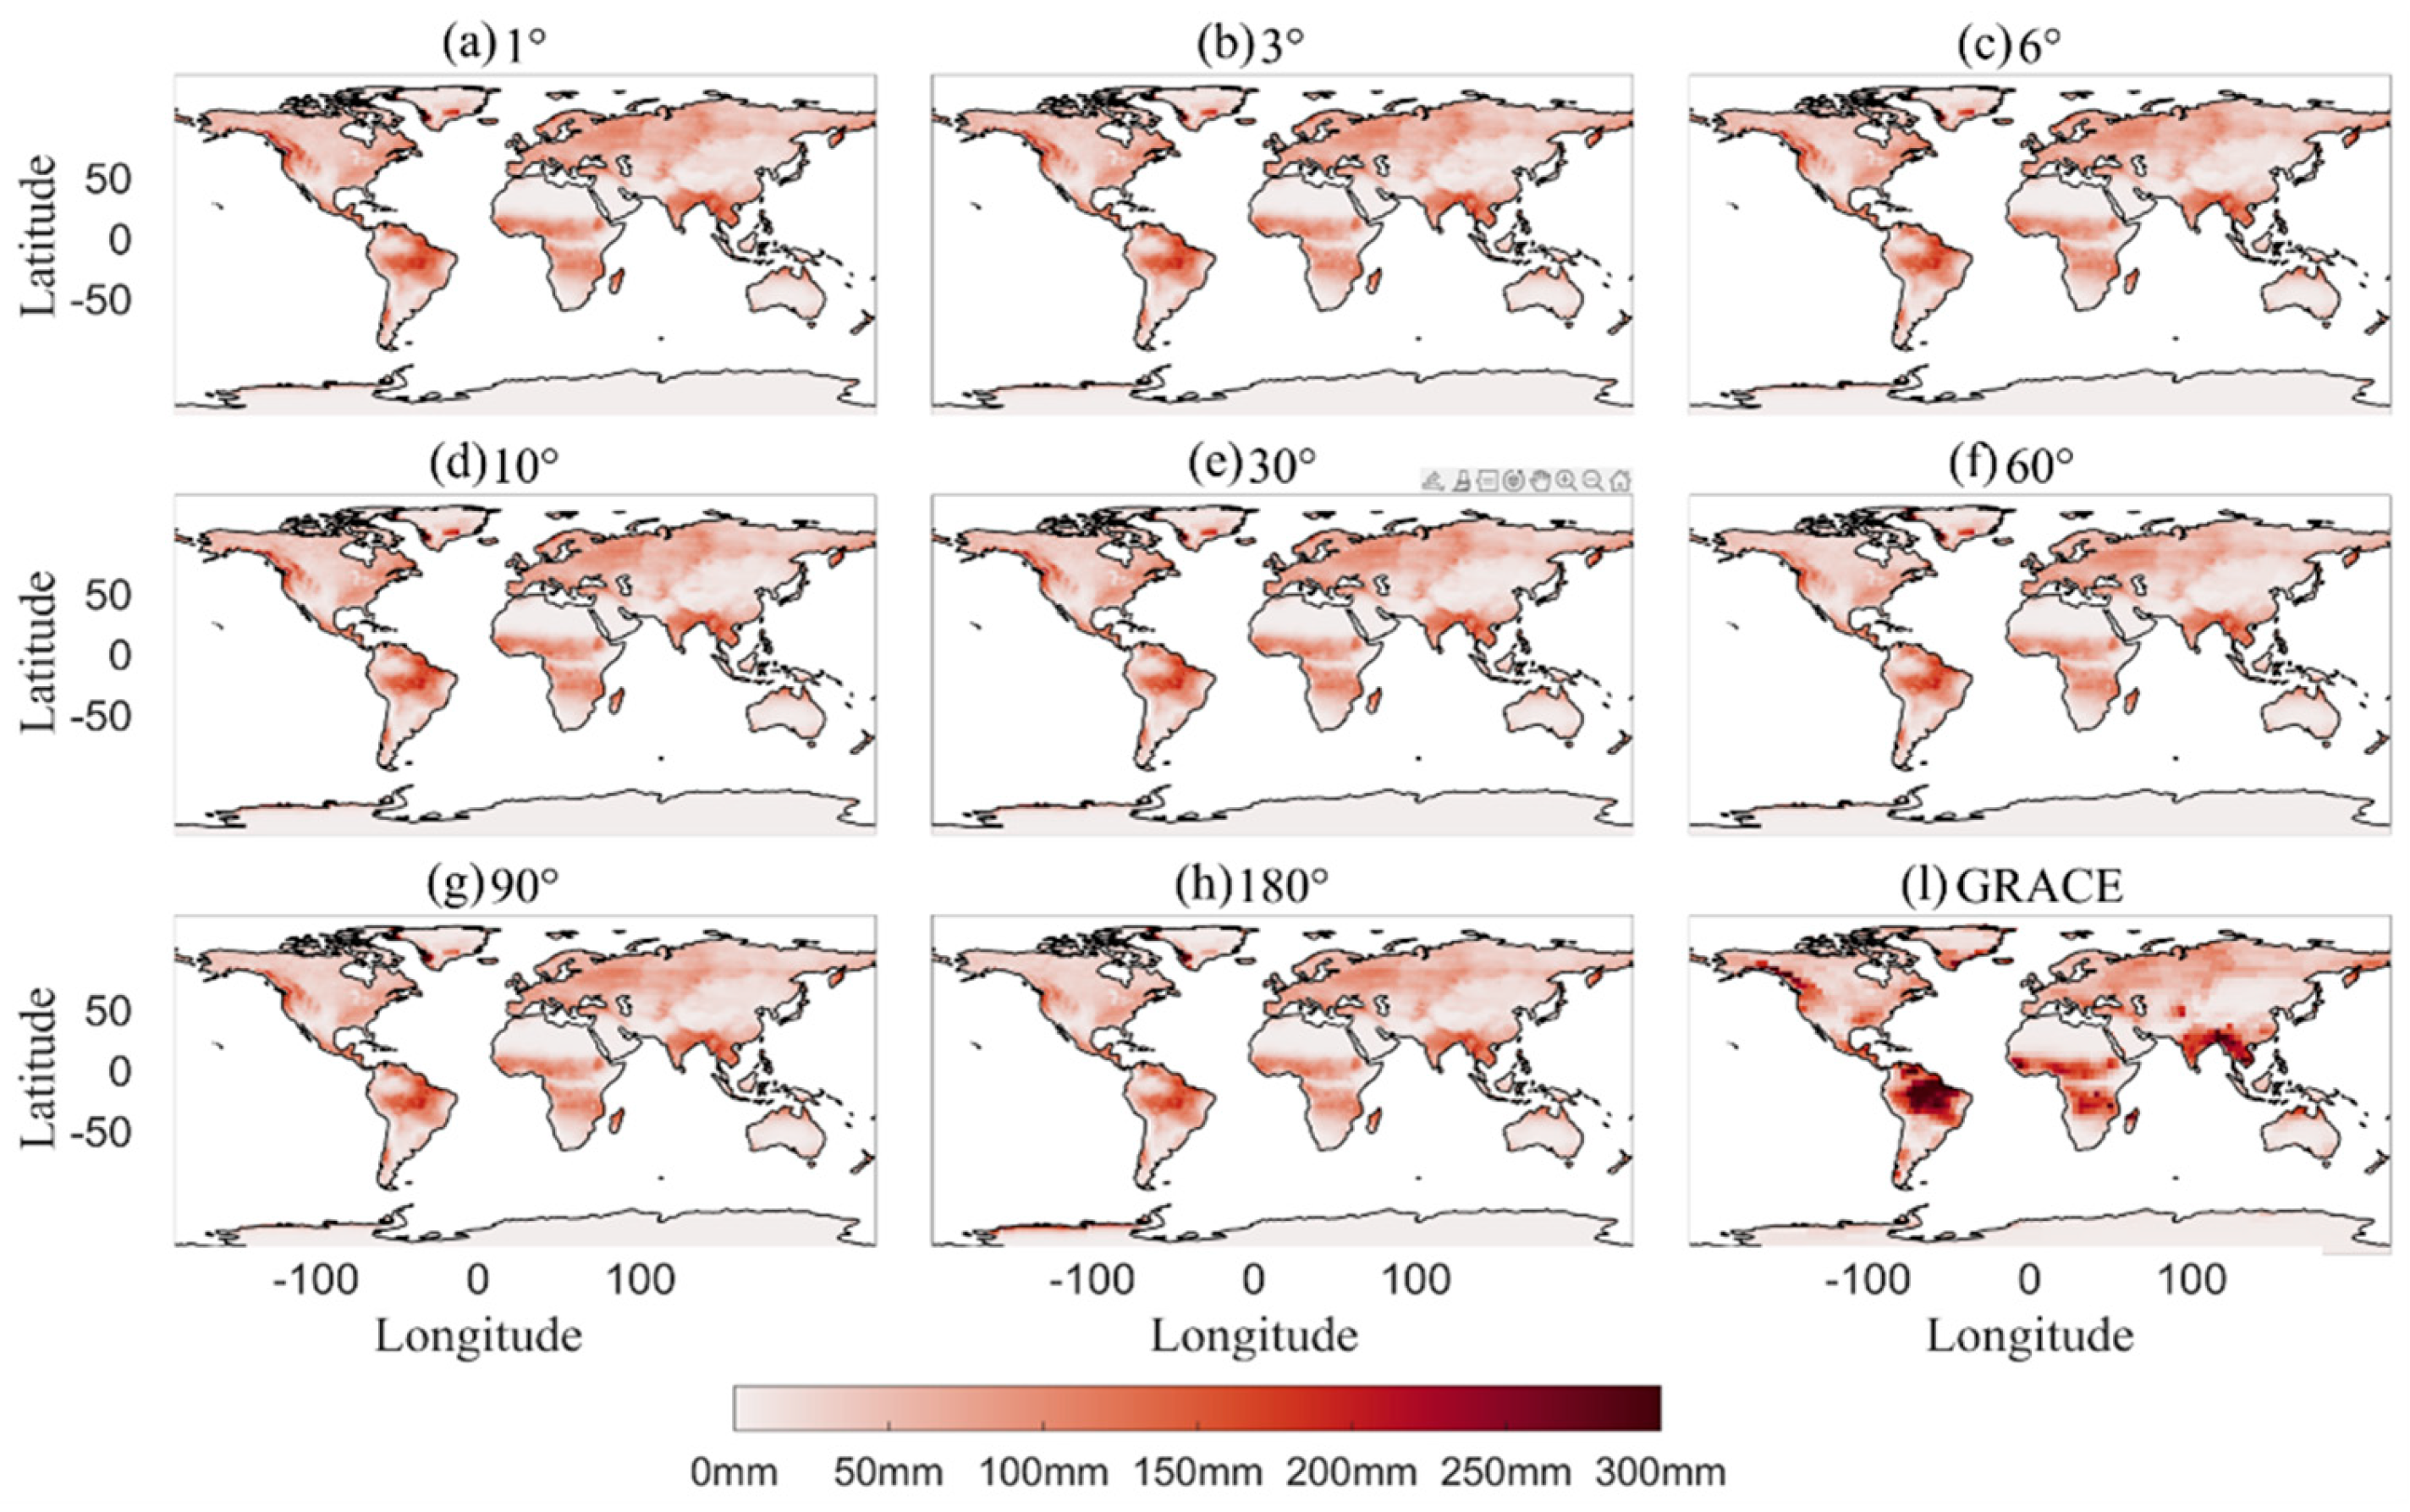
Figure 6.
Phase delays among GHLW1.0 models with different window sizes, and between the GRACE Mascon and the GHLW1.0 model with a 1° window.
Figure 6.
Phase delays among GHLW1.0 models with different window sizes, and between the GRACE Mascon and the GHLW1.0 model with a 1° window.
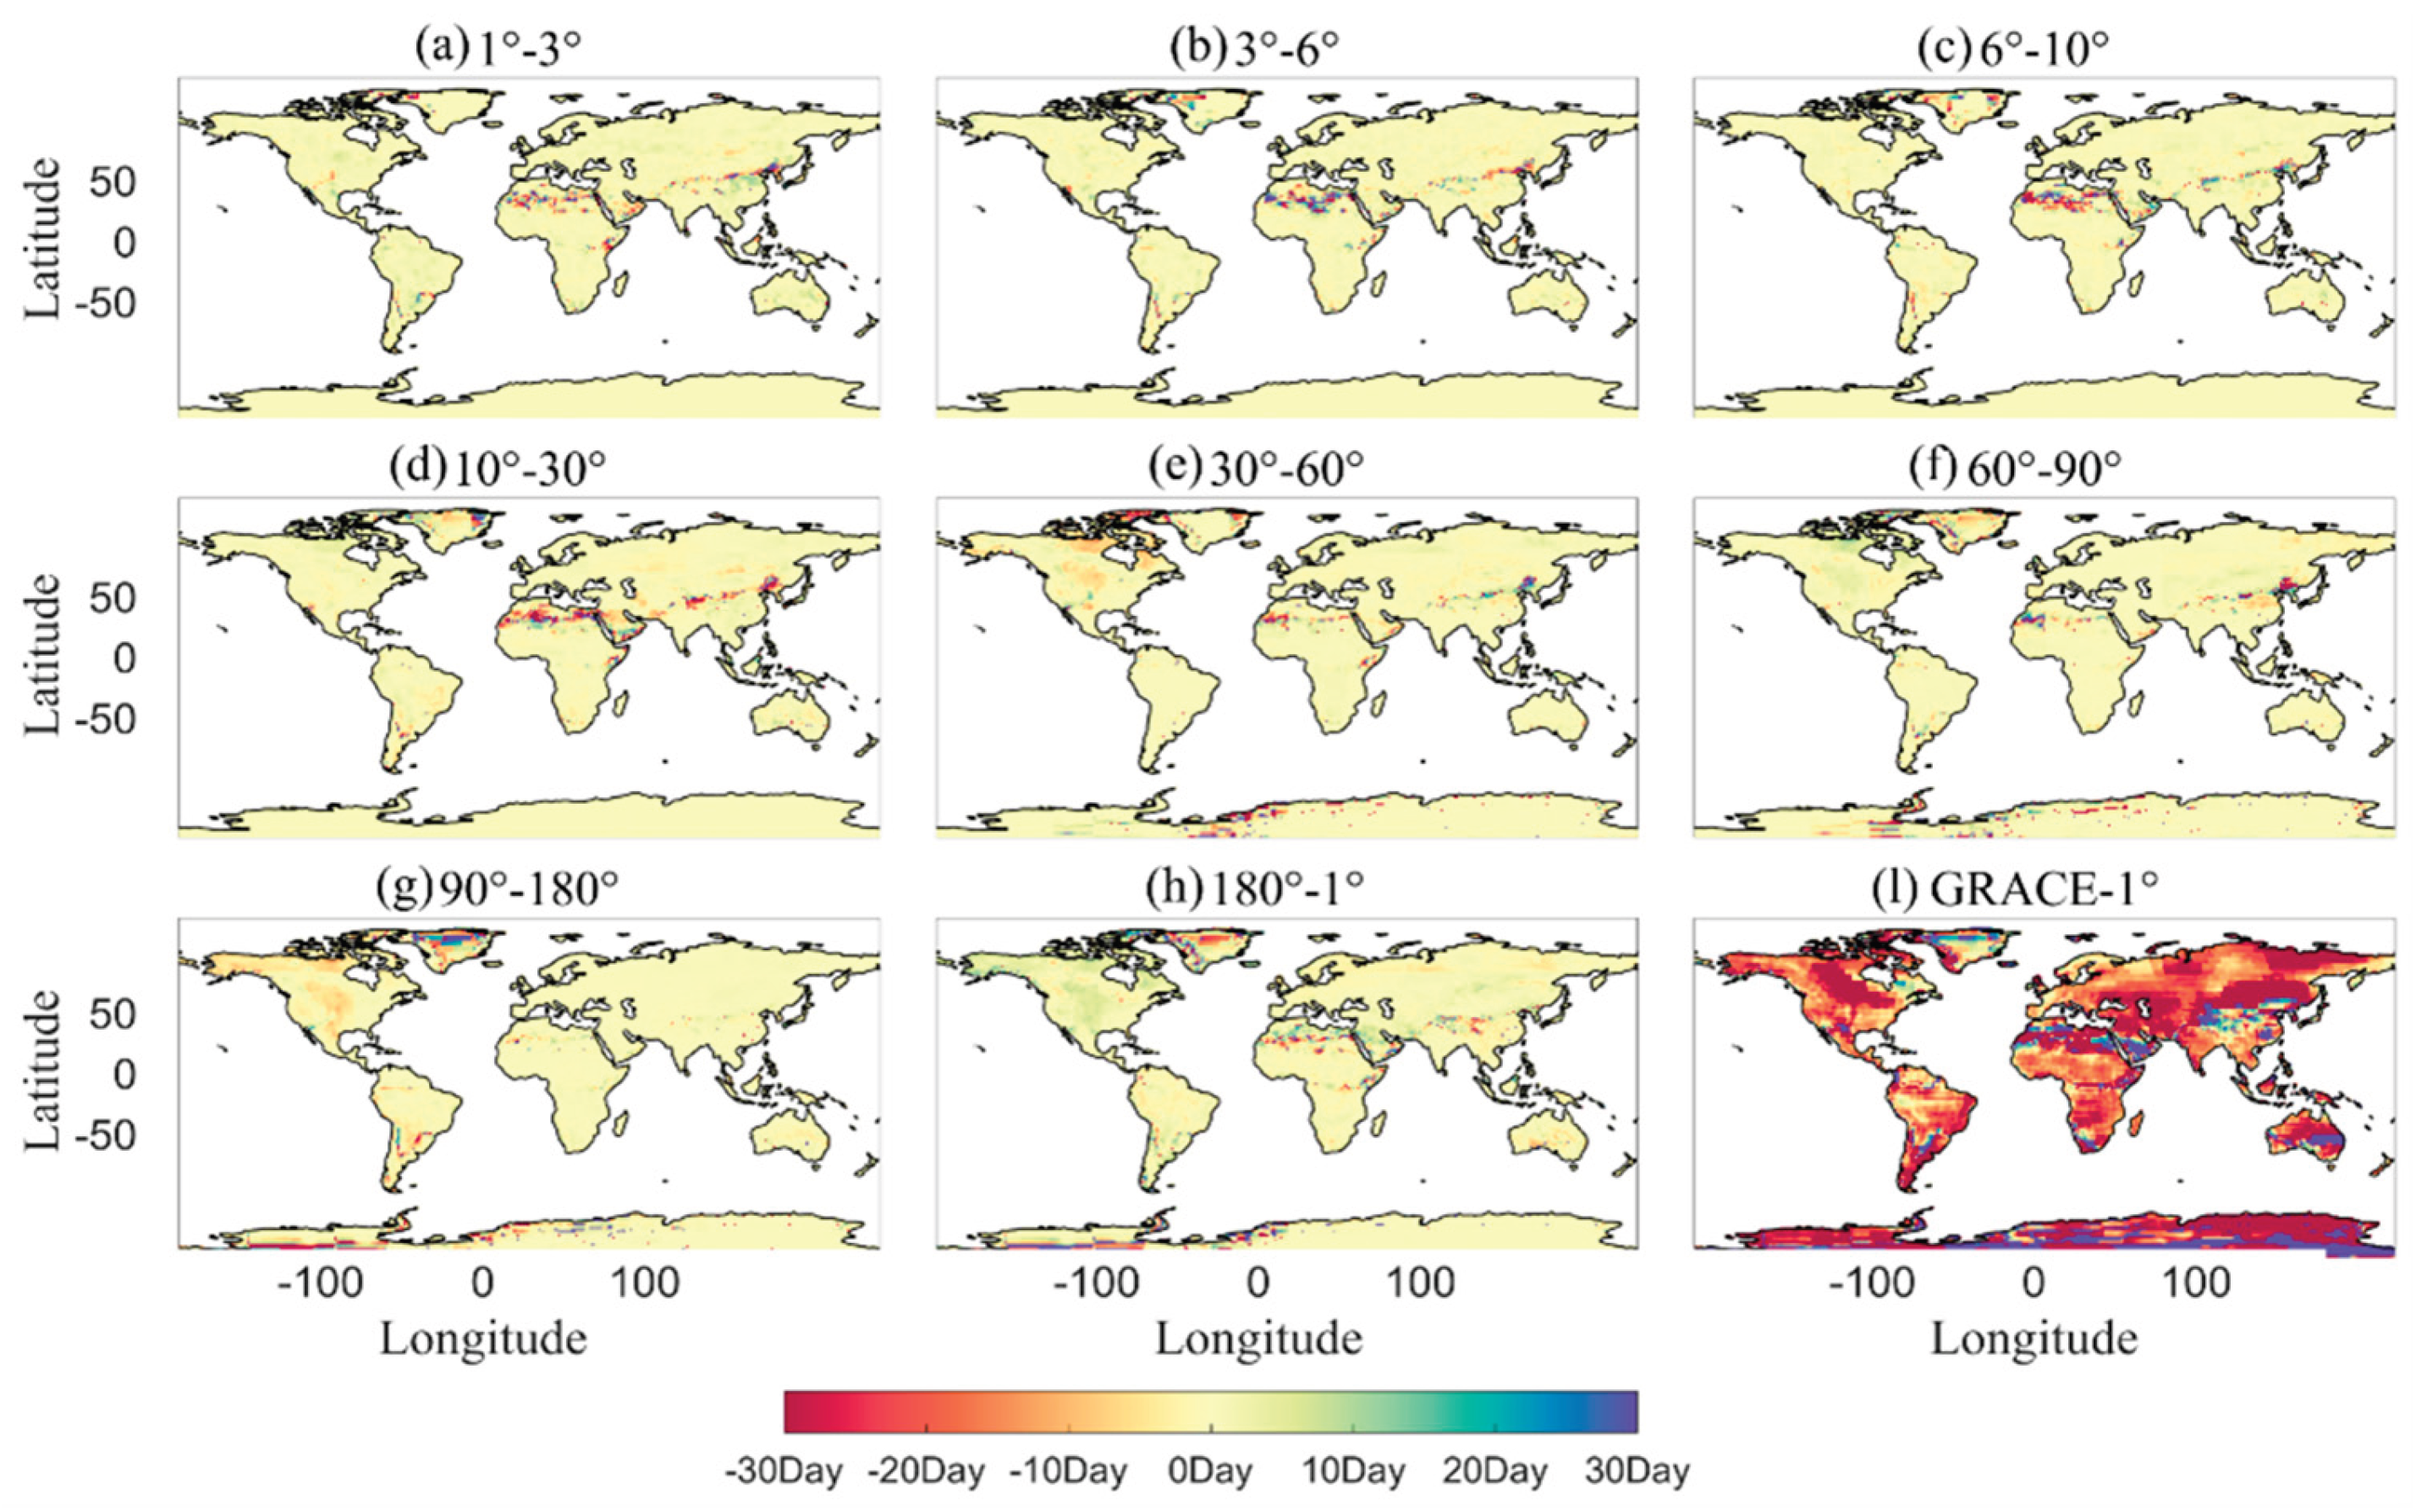
Figure 7.
Correlation between GHLW1.0 hydrological displacements (various windows) and vertical displacements at 300 GNSS stations.
Figure 7.
Correlation between GHLW1.0 hydrological displacements (various windows) and vertical displacements at 300 GNSS stations.
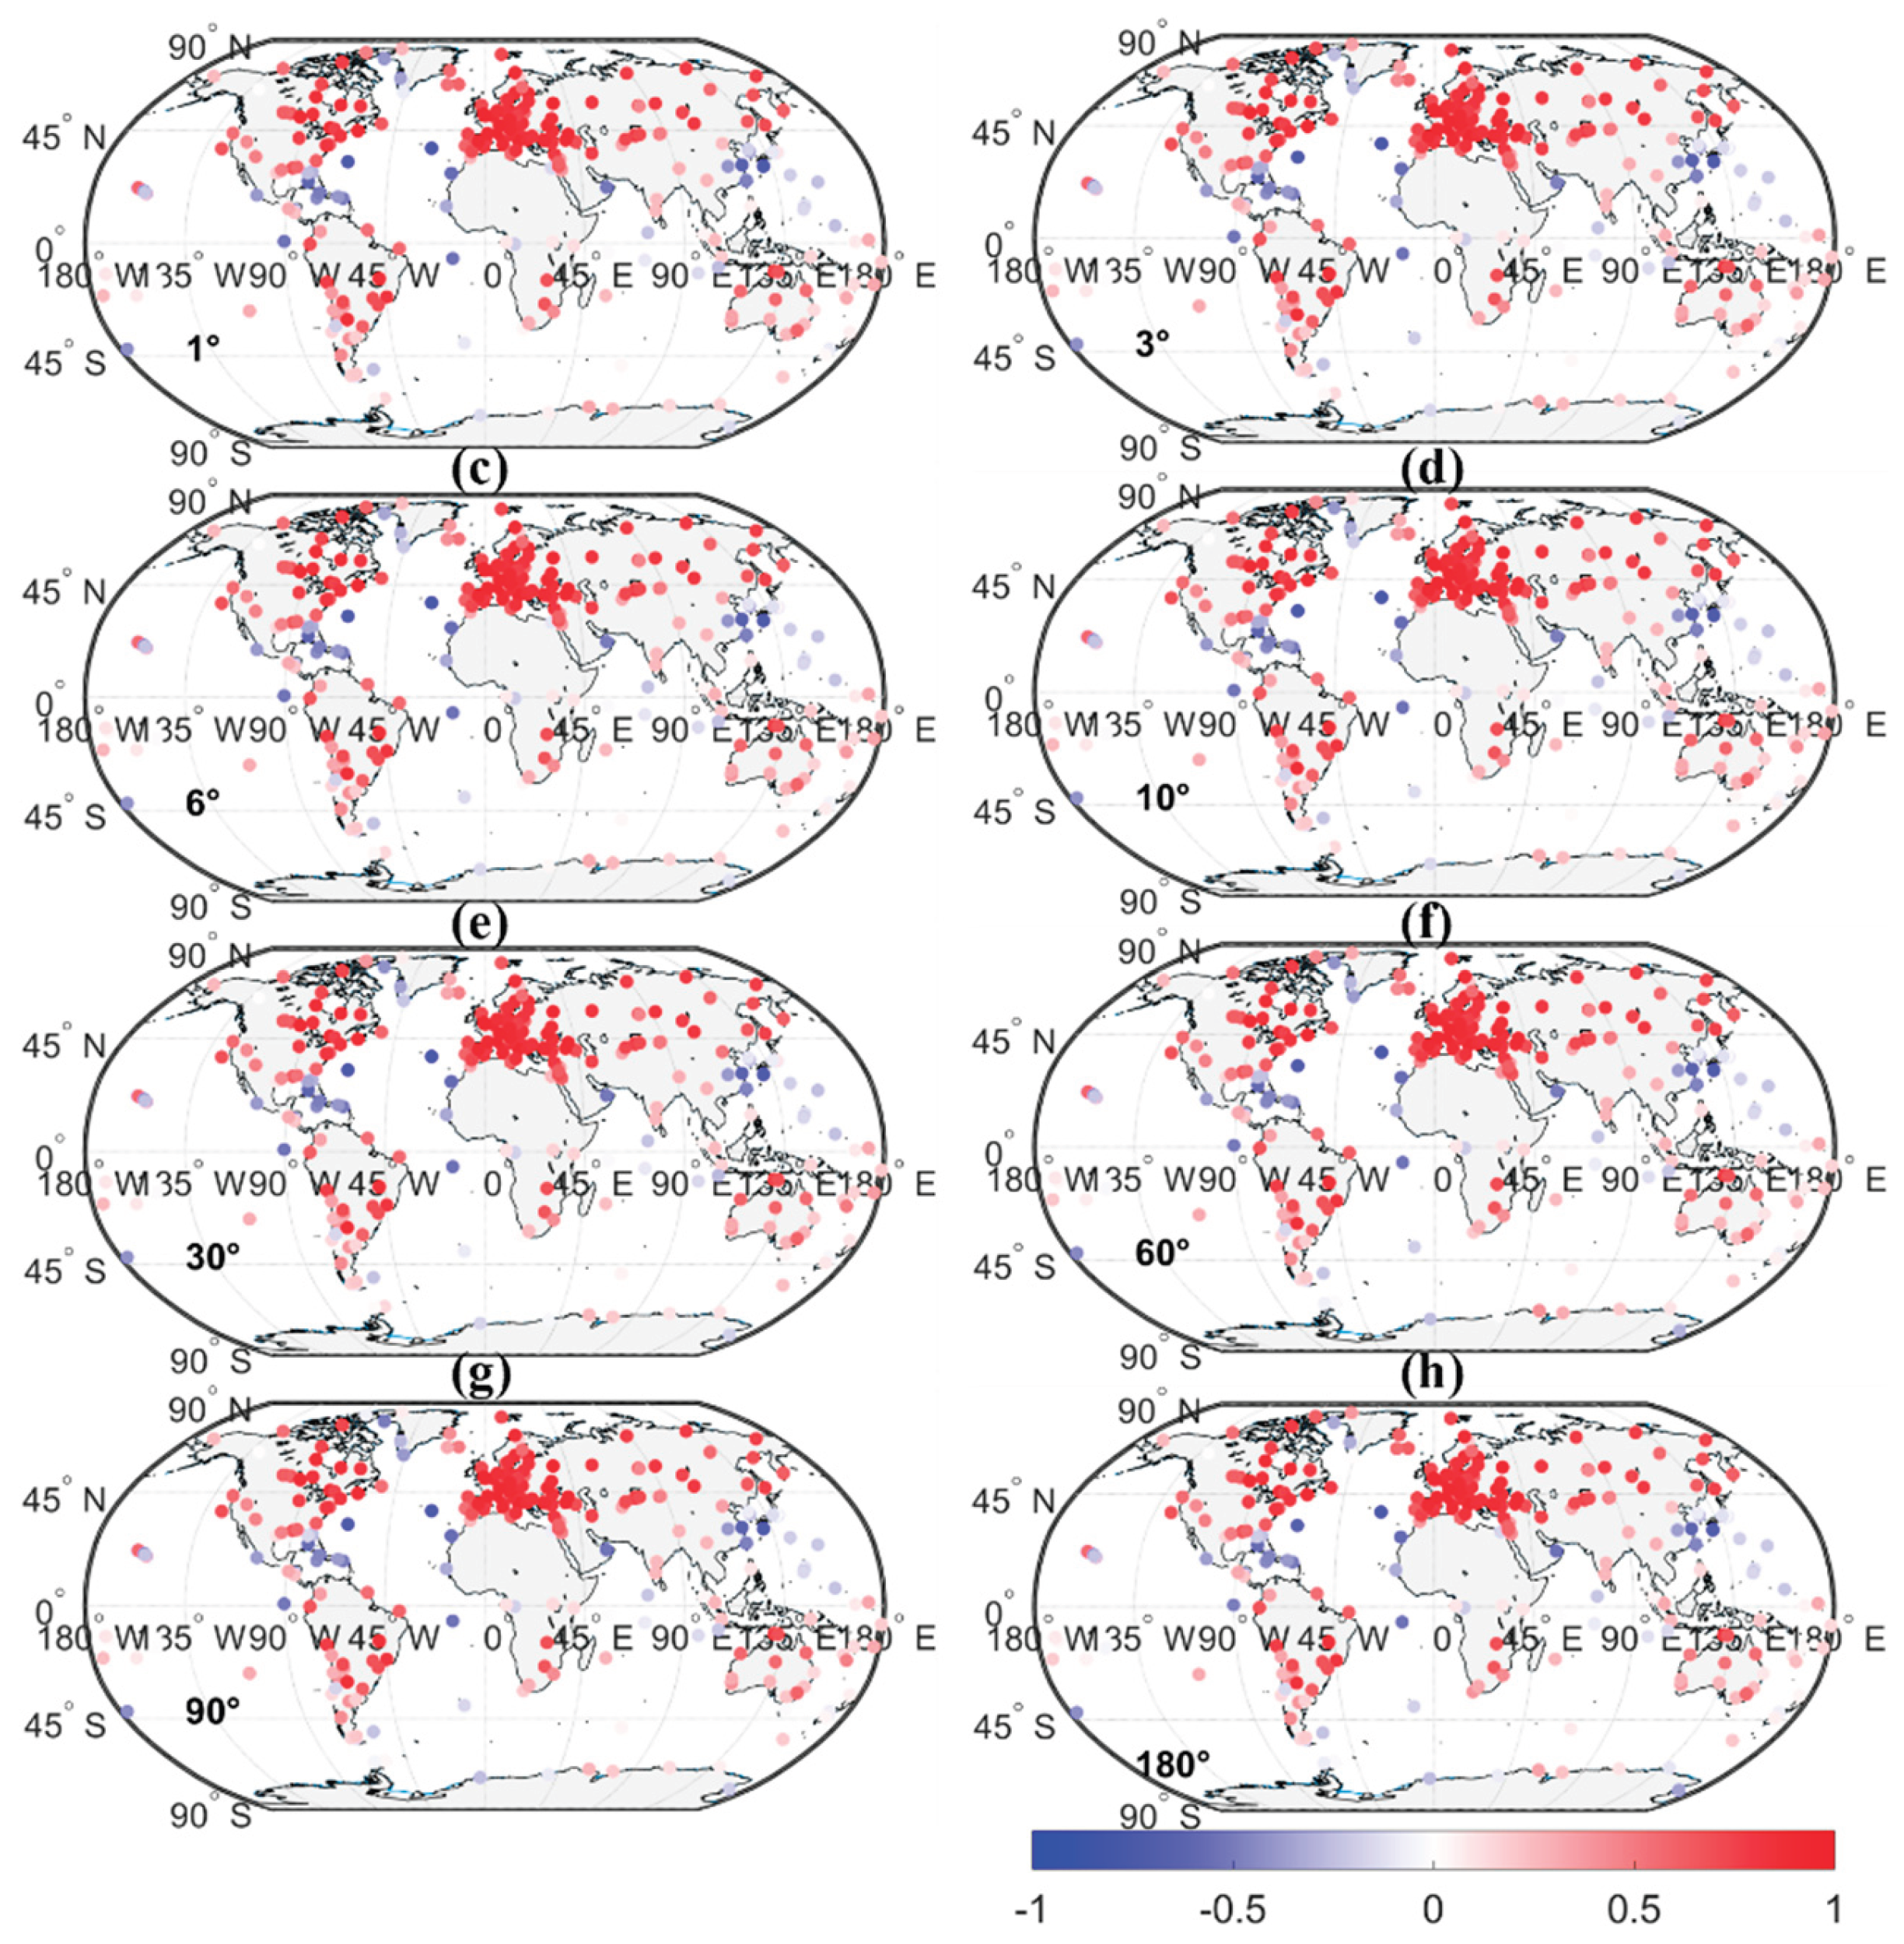
Figure 8.
Correction effectiveness of GHLW1.0 models (various windows) on vertical displacements at 300 GNSS stations.
Figure 8.
Correction effectiveness of GHLW1.0 models (various windows) on vertical displacements at 300 GNSS stations.
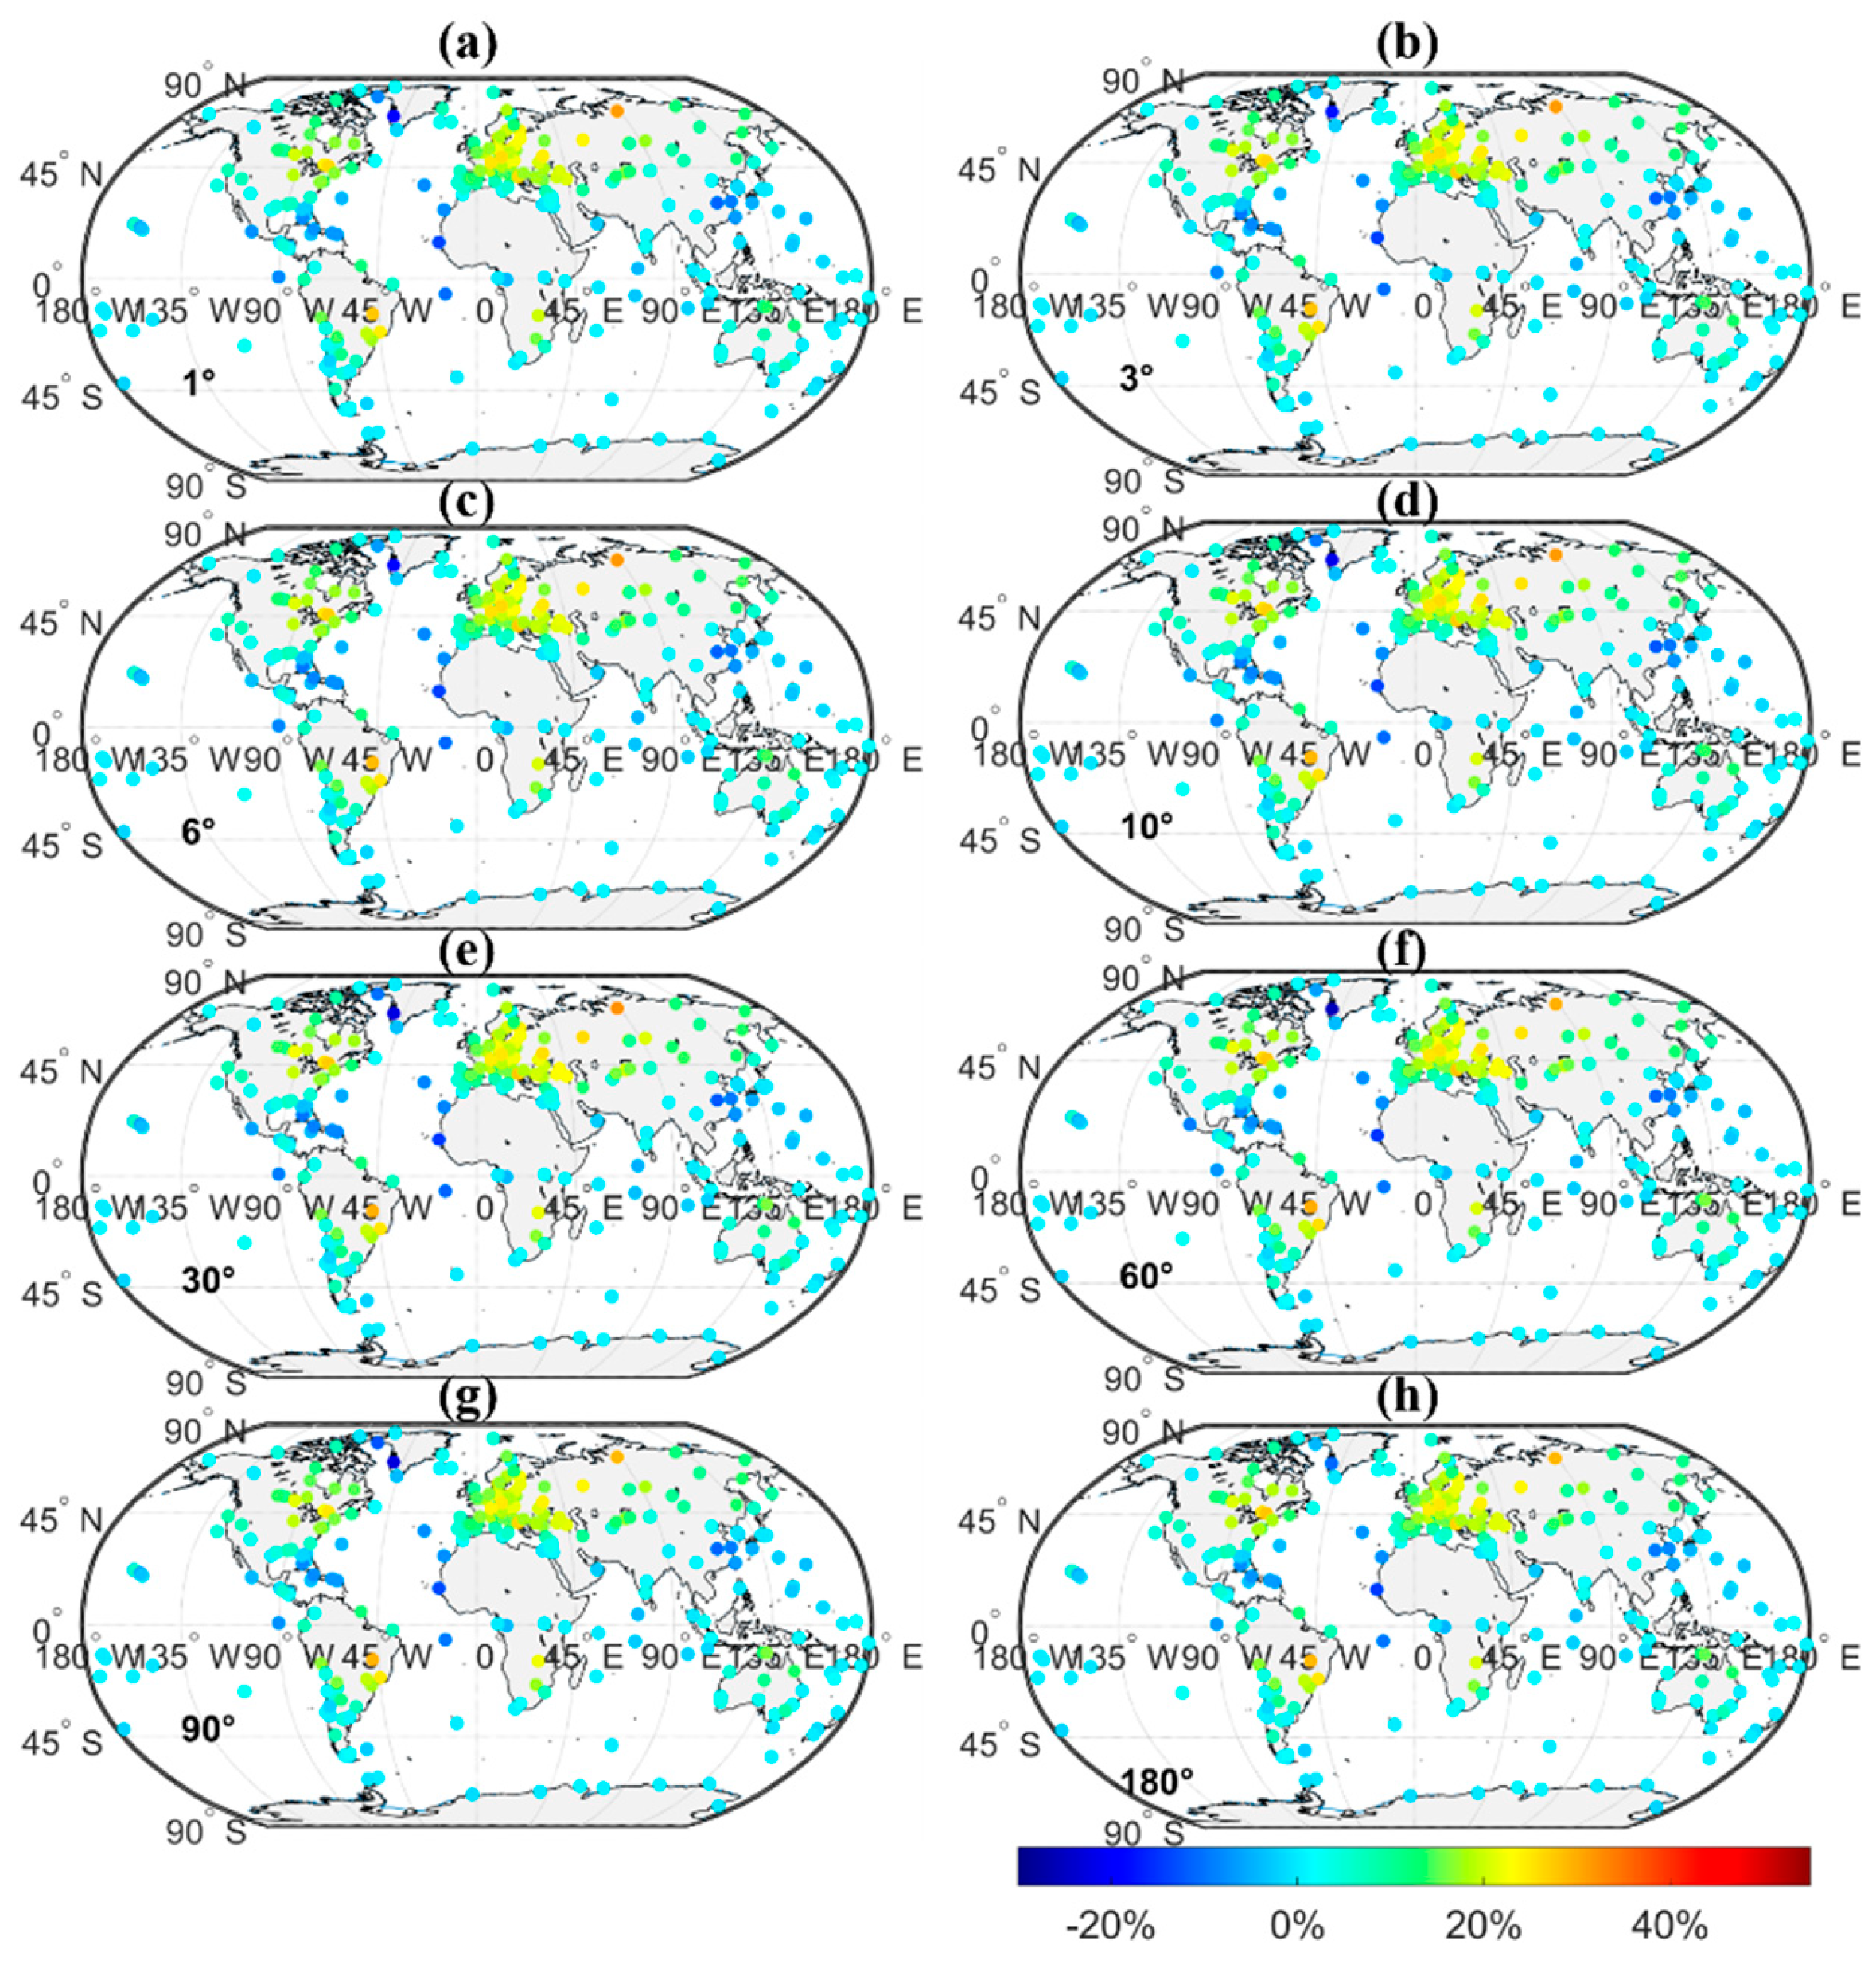
Figure 9.
Correction rates of GHLW1.0 (various windows) and ACH-VCE on vertical displacements at 300 GNSS stations.
Figure 9.
Correction rates of GHLW1.0 (various windows) and ACH-VCE on vertical displacements at 300 GNSS stations.
Disclaimer/Publisher’s Note: The statements, opinions and data contained in all publications are solely those of the individual author(s) and contributor(s) and not of MDPI and/or the editor(s). MDPI and/or the editor(s) disclaim responsibility for any injury to people or property resulting from any ideas, methods, instructions or products referred to in the content. |
© 2026 by the authors. Licensee MDPI, Basel, Switzerland. This article is an open access article distributed under the terms and conditions of the Creative Commons Attribution (CC BY) license (http://creativecommons.org/licenses/by/4.0/).
Copyright: This open access article is published under a Creative Commons CC BY 4.0 license, which permit the free download, distribution, and reuse, provided that the author and preprint are cited in any reuse.