
Submitted:
30 July 2026
Posted:
31 July 2026
You are already at the latest version
Abstract
Green bonds and green bank loans coexist as instruments for financing the low-carbon transition, yet the strategic mechanism through which issuers select between them remains weakly formalized. This paper models green debt instrument choice as a three-stage extensive-form game with perfect information in which a firm first selects a financing route, investors then decide whether to subscribe to a green bond issuance, and a bank sets lending conditions under regulatory incentives. The subgame-perfect equilibrium is characterized analytically by backward induction and is then implemented numerically: the equilibrium correspondence is mapped over the parameter space and evaluated through a Monte Carlo experiment of 200,000 parameter drawing across the eight admissible states of demand, issuer credibility and regulatory regime. Equilibrium green bond issuance requires two conditions to hold jointly, namely investor participation and a demand-driven advantage exceeding the fixed issuance and certification cost. The simulation shows that green bond adoption falls from 79.2% under high demand and strong credibility to 1.5% under moderate demand and weak credibility, with a sharp discontinuity at the participation threshold, and that bank concessionally shifts financing levels without altering the bond-versus-loan margin. The framework provides a tractable basis for assessing sustainability-related financing risk and for the empirical separation of feasibility, optimality and institutional transmission channels.
Keywords:
green bonds
; green bank loans
; game theory
; subgame-perfect equilibrium
; Monte Carlo simulation
; sustainable finance
; regulatory incentives
; greenwashing risk
1. Introduction
Green finance has become a central mechanism for mobilizing capital towards environmentally sustainable investment and for accelerating the transition to a low-carbon economy [1,2]. As climate risks intensify, financing decisions increasingly reflect not only expected financial pay-offs but also regulatory constraints, reputational considerations and shifting investor preferences towards ESG-aligned assets [3,4]. These forces have altered the firm's financing problem: access to capital is progressively mediated by the credibility of environmental commitments, the quality of disclosure, and the institutional architecture governing sustainable finance markets [2,5].
Among the most widely used green debt instruments, green bonds and green bank loans offer distinct advantages and frictions. Green bonds can broaden market access, enhance visibility and potentially reduce long-term financing costs, particularly when investor appetite for sustainable assets is strong and the issuer's environmental track record is perceived as credible [1,2,5]. However, bond issuance typically entails non-trivial fixed costs, including certification, disclosure and compliance requirements, which may limit its attractiveness for some issuers. Green bank loans, by contrast, are negotiated bilaterally and may offer contractual flexibility and lower upfront transaction costs, making them attractive for firms with constrained capital-market access or shorter-term funding needs [6,7]. Loan-based financing may nonetheless involve higher pricing, tighter monitoring or greater dependence on bank incentives and regulatory regimes, implying that the relative appeal of bonds versus loans is contingent upon market and institutional settings [8].
Despite a rapidly expanding empirical literature on the diffusion and pricing of green debt, the strategic interdependence between issuers, investors and banks remains less explicitly formalized. In practice, firms do not choose instruments in isolation: investor participation determines whether bond financing can be executed at acceptable terms, while banks adjust lending conditions in response to policy incentives, risk assessments and their own competitive positioning. Game-theoretic approaches are particularly well suited to capturing strategic interactions and interdependencies in financial markets [9,10,11,12]. Moreover, sustainable finance contexts involve institutional and behavioral frictions, such as information asymmetry, credibility concerns and greenwashing risk, that affect beliefs and therefore strategic choices [1,13]. Behavioral perspectives further suggest that decision-makers operate under cognitive limitations, and that heuristics, framing and loss aversion can materially influence investment and financing choices [14,15,16].
This paper addresses the following research question: which strategic conditions determine a firm's choice between green bonds and green bank loans, and how sensitive is that choice to the parameters governing investor participation, issuance cost and institutional design? To answer it, we develop a sequential game with perfect information involving three players: (i) the firm, choosing between green bonds and green loans; (ii) investors, deciding whether to subscribe to a green bond issuance; and (iii) the bank, selecting loan conditions (favorable versus standard terms), potentially shaped by regulatory incentives. The equilibrium is derived via backward induction, providing transparent conditions that link investor sentiment, issuance and verification costs, and policy-driven banking incentives to instrument choice outcomes [10,11]. This modelling approach aligns with prior applications of sequential games to corporate financing under strategic interaction and signaling [17,18], as well as with recent work on modelling green financing incentives using game-theoretic frameworks [8,19].
The contribution of this paper is twofold. Analytically, it derives a closed-form characterization of the subgame-perfect equilibrium of the issuer–investor–bank triad, separating the feasibility of market-based green debt from its optimality conditional on feasibility, and isolating an institutional transmission channel that operates through bank term-setting rather than investor demand. Methodologically, and in direct response to the modelling and simulation focus of this Special Issue, the paper does not stop at directional comparative statics. The equilibrium correspondence is implemented numerically and evaluated through a Monte Carlo experiment over the model's parameter space, which quantifies the size of the bond-feasible region, ranks the model primitives by their influence on equilibrium instrument choice, and characterizes the discontinuity that arises when the investor participation constraint is violated. This numerical layer converts threshold inequalities into a quantitative risk-assessment device: for a given institutional configuration, the model returns the probability that market-based green financing is attainable, which is precisely the object of interest for issuers, lenders and supervisors concerned with the resilience of sustainable debt markets.
The model yields three core insights. First, green bond financing is optimal when investor confidence is sufficiently strong to compensate for issuance and certification costs and when environmental credibility supports participation [2,5]. Second, green bank loans become optimal when bond-market participation is weak or uncertain, when bond-related fixed costs are high, or when banks, responding to policy incentives, offer concessionary loan terms [6,7]. Third, the adoption of green finance instruments is governed by strategic complementarities: investor confidence and bank incentives jointly determine whether markets coordinate on bond-based financing or shift towards relationship-based loan financing, with direct implications for issuers, financial institutions and regulators designing standards and incentives to improve market functioning [1,13].
The remainder of the paper is organized as follows. Section 2 reviews the relevant literature on game theory in corporate finance and its applications in sustainable finance, including behavioral and institutional perspectives. Section 3 presents the model, its assumptions and pay-off structure, the equilibrium concept, and the design of the numerical experiment. Section 4 reports the analytical equilibrium and the simulation results. Section 5 discusses implications for firms, investors, banks and policymakers, and delimits the scope of the conclusions. Section 6 concludes
2. Literature Review
2.1. Game Theory and Corporate Finance
A foundational contribution of game theory to corporate finance is its ability to model strategic interaction under information asymmetry, where financing choices convey signals about firm quality and where investors and intermediaries respond endogenously. Classical work shows that financial contracts and issuance decisions are not merely responses to exogenous prices, but strategic actions shaped by beliefs, incentives and sequencing [20]. The seminal literature on extensive-form games and equilibrium refinement provides the methodological basis for analyzing such problems, including sequential rationality and subgame perfection in multi-stage financing contexts [10,11]. Within this framework, financing instruments can be interpreted as strategic commitments, screening devices or signaling mechanisms, depending on the informational structure and the timing of moves [21].
A prominent strand models capital structure as a signaling game. Under asymmetric information, insiders may prefer debt to equity because issuing equity can reveal adverse information to the market or dilute existing claims; in many signaling environments, the announcement of equity financing is predicted to be interpreted negatively relative to debt [17]. Related analyses discuss circumstances under which debt dominates equity as a strategic financing measure, while equity issuance may generate adverse selection dynamics [18]. These contributions underscore two points relevant to green finance: financing choice is intrinsically informational, and equilibrium outcomes depend not only on fundamentals but on how the market interprets and updates beliefs about issuer type and project quality. At the same time, the broader theoretical literature cautions that informational asymmetries do not universally imply a strict financing hierarchy, suggesting that equilibrium ordering can be sensitive to modelling assumptions, security design and the richness of the contract space [22].
Game theory has also been applied to financial intermediation, including bank monitoring, credit contracting, collateral and risk-shifting incentives [9,23,24]. In these settings the intermediary is not a passive price-taker; banks strategically choose contract terms given borrower incentives and regulatory constraints, and borrowers decide whether to accept bank finance or seek market-based funding. Survey work synthesizing game-theoretic research in finance emphasizes how equilibrium outcomes reflect agency costs, contract design and the strategic behavior of multiple parties [12]. This insight is particularly relevant for green finance because it suggests that the terms of green lending, such as discounts, covenants and KPI-linked pricing, may be endogenously determined by bank incentives, reputational concerns and regulatory pressures, rather than being simple reflections of project risk.
More recent research extends game-theoretic logic beyond traditional issuance to strategic decision-making in operational and supply-chain contexts, where financing interacts with pricing, production and investment choices under constraints. Stackelberg structures are frequently used to represent leader–follower dynamics among manufacturers, retailers and financiers, including financing modes in capital-constrained supply chains and the influence of external parameters such as carbon prices on financing and operational equilibria [19,25,26]. Although these papers are not primarily about green bonds or green loans, they establish a transferable modelling insight: financing choices often arise as equilibrium objects in broader strategic systems, where the optimal instrument depends on the responses of other strategic agents and on the institutional parameters governing the environment.
2.2. Game Theory in Sustainable Finance
Sustainable finance research indicates that ESG considerations, market design and policy constraints increasingly shape capital allocation. A broad literature argues that sustainable finance can support decarbonization and climate adaptation by reallocating capital towards green technologies and by modifying risk pricing and investment mandates [13,27]. Investor preferences for sustainability may influence expected returns and price dynamics: under certain conditions, assets with lower expected returns can outperform when ESG-related factors experience favorable shocks, indicating that preferences and risk premia are jointly determined [28]. This channel creates a conceptual bridge to strategic modelling. If investors derive utility from impact or face mandate constraints, demand for green instruments becomes endogenous and can shift equilibrium outcomes in corporate financing.
Within green debt markets, two instrument families dominate practice and academic debate. The literature documents that green bonds can improve issuer visibility and potentially lower financing costs, often discussed through the notion of greenium, but that such benefits depend on credibility, standardization and the cost of certification and disclosure [1,2,5]. Green loans, in contrast, are frequently characterized by contractual flexibility and bilateral monitoring, but their pricing advantages and disclosure properties can be less transparent and more heterogeneous, reflecting bespoke KPIs and private contracting [6,7]. These differences suggest that instrument choice is not purely technological; it is institutional and strategic, shaped by how markets and banks reward or penalize disclosure and by how policy frameworks condition the relative attractiveness of each instrument.
Despite the rapid growth of empirical work, explicitly game-theoretic treatments of green financing decisions remain comparatively scarce. Where game theory is applied in sustainability contexts, it often appears in adjacent domains such as green innovation and supply-chain sustainability, typically through evolutionary games or Stackelberg leadership structures. Evolutionary game approaches models how strategies diffuse over time among heterogeneous agents, emphasizing learning, bounded rationality and the possibility of multiple stable outcomes [29]. Related work in platform and supply-chain settings examines how green innovation incentives interact with financing availability, suggesting that policy and financing can jointly determine whether firms choose greener technologies or marketing strategies [8]. Such studies reinforce a critical point for green debt markets: equilibrium outcomes may be path dependent and sensitive to institutional signals, especially where credibility is costly to establish and where the value of green is partly reputational.
Beyond supply chains, game-theoretic approaches have been applied to renewable energy project financing and to public–private partnership structures. Coopetition models of renewable project financing show how banks' competitive incentives can be reconciled with cooperative gains under specific payoff structures, highlighting that sustainable investment may require coordination mechanisms rather than simple price incentives [30]. In PPP financing, evolutionary game frameworks are employed to investigate how governments, private capital and financial institutions converge towards cooperative equilibria under suitable incentive design [31]. While these contexts differ from corporate green debt issuance, they provide transferable insights regarding the role of policy-induced payoffs, the emergence of coordination equilibria, and the importance of enforcement and monitoring structures.
A recurring theme across sustainable finance studies is the role of standardization and credibility in supporting market participation. If investors cannot distinguish credible green projects from greenwashing, demand may weaken and equilibrium may shift away from market instruments, favoring intermediate finance where monitoring is stronger but potentially more expensive. The key theoretical gap is therefore not whether green bonds or green loans are better on average, but under what strategic and institutional conditions each becomes dominant.
2.3. Behavioral and Institutional Perspectives
Standard models of corporate finance and asset pricing are built on rational choice under well-defined preferences and complete information. Behavioral finance, however, demonstrates that real-world financial decisions often deviate from strict rationality due to cognitive constraints, biases and social preferences [32,33]. Institutional economics simultaneously emphasizes those rules, incentives and the credibility of policy shape choices. Both perspectives are especially relevant in green finance because sustainability claims are information-intensive, partially non-verifiable and subject to evolving regulatory standards. Consequently, the willingness of investors and banks to reward green labels depends not only on cash-flow expectations but also on perceived credibility, reputational implications and the likelihood of regulatory enforcement.
A central behavioral concept is bounded rationality, the notion that agents face limits in information processing and optimization [14]. In green finance, bounded rationality can manifest as reliance on heuristics such as ESG ratings and second-party opinions, simplified screening rules, or reputational signals. Rubinstein [16] develops bounded rationality in game-theoretic contexts, supporting the modelling claim that perfect optimization is a stylized benchmark rather than a descriptive assumption. Prospect theory and the broader behavioral literature further emphasize that agents display loss aversion and asymmetric reactions to gains and losses [15]. This is particularly salient for green debt, where payoffs may be long-dated and uncertainty about policy, technology or verification can increase perceived downside risk. Investors may discount green instruments if they fear reputational or performance losses from greenwashing scandals, even if expected returns are comparable [34]. Such asymmetries provide a plausible micro-foundation for why investor demand may collapse discontinuously under credibility shocks.
Institutional economics complements behavioral perspectives by highlighting that financing decisions are embedded in policy and regulatory architectures. Policy affects pay-offs directly through tax incentives, capital relief, subsidies and disclosure standards, and indirectly through credibility and enforcement. Campiglio et al. [13] argue that financial policy and regulation can play a decisive role in steering capital towards sustainability, while the political economy literature highlights how institutional design and policy commitments influence economic incentives and outcomes [35]. In green debt markets, regulatory clarity can reduce information asymmetry, lower verification costs and strengthen investor confidence, conditions likely to shift the equilibrium towards market-based financing. If regulators encourage sustainability-linked lending, banks may rationally offer favorable terms even when short-term margins are lower, because policy-driven benefits enter the bank's objective function. This institutional channel provides the direct justification for including favorable versus standard terms as a bank strategy in the game.
2.4. Research Gap and Positioning
Two limitations remain salient. First, much of the green debt literature is instrument-centric and primarily empirical, focusing on whether a greenium exists and on cross-sectional correlates of pricing, without fully formalizing the strategic mechanism through which firms select instruments in anticipation of investor and bank responses. While research on green bonds emphasizes disclosure standards, certification and credibility [1,2,5], and work on green loans highlights contractual flexibility and bilateral monitoring [6,7], fewer studies integrate both instruments within a single framework that endogenizes the responses of both capital-market investors and banks.
Second, existing game-theoretic applications in sustainability are often situated in adjacent domains rather than modelling the issuer–investor–bank triad that characterizes corporate green debt choice. Evolutionary games and Stackelberg settings capture diffusion and leader–follower interactions [8,19,29], but they typically do not formalize the trade-off central to corporate treasury practice: market-based bond issuance versus relationship-based bank financing, under disclosure and certification costs, reputational pay-offs and regulatory incentives. A third gap is methodological. Theoretical treatments of green instrument choice typically stop at directional comparative statics, leaving unquantified the size of the equilibrium regions, the relative influence of each primitive, and the magnitude of regime-switching effects. Numerical implementation of the equilibrium correspondence closes this gap and is what allows a strategic model to function as a risk-assessment instrument.
Accordingly, this paper positions its contribution as a unifying strategic model that treats green bond issuance and green loan contracting as competing financing instruments, models financing choice as a sequential game in which the firm anticipates the endogenous reactions of investors and banks, embeds the key sustainable-finance frictions directly into player pay-offs, and evaluates the resulting equilibrium correspondence numerically over the parameter space.
3. Materials and Methods
3.1. Model Setup and Assumptions
The model is specified as a sequential game with three strategic agents, Firm (F), Investors (I) and Bank (B), whose decisions unfold over ordered stages. The objective is to characterize the conditions under which each financing instrument is optimal once the firm internalizes the anticipated responses of investors and the bank. This is consistent with game-theoretic approaches to financing under interdependence, where equilibrium outcomes reflect not only firm fundamentals but also belief-sensitive participation and contract choices by capital providers and intermediaries [9,12].
At Stage 1 the firm selects the financing instrument, choosing between issuing green bonds (GB) and contracting a green bank loan (GBL):
a ∈ {GB, GBL}
At Stage 2, conditional on a = GB, investors decide whether to subscribe to the green bond issuance:
i ∈ {Invest, Not}
At Stage 3 the bank sets lending conditions, selecting either favorable (F) or standard (S) terms:
t ∈ {F, S}
In the GBL branch the investor node is absent from construction, reflecting that green loans are negotiated bilaterally between the firm and the bank; investors have no strategic action and no payoff relevance in that branch [11]. The baseline information structure assumes perfect observability of the firm's instrument choice, of the relevant state variables and of prior actions at each stage. This assumption provides a transparent benchmark, enabling a clean characterization of subgame-perfect equilibria via backward induction [10,11]. Real-world green finance decisions are influenced by bounded rationality and credibility frictions; these enter the baseline through reduced-form parameters that capture the informational and reputational environment, while extensions can explicitly relax perfect information or introduce learning [14,15,16,29,36].
Three primitives organize the economic environment. First, bond-market conditions are captured by an exogenous demand state for green bonds:
where H denotes high demand and M denotes moderate demand. High demand typically enables the firm to place more bonds or secure better pricing. This parameter proxies investors' aggregate appetite and the pricing and placement conditions faced by the issuer, consistent with evidence that green bond outcomes are sensitive to market depth and sustainability-oriented flows [2,5]. The relative attractiveness of green bonds further depends on a demand-related benefit scaled by α > 0, interpreted as improved pricing, placement success or liquidity advantage when D is high. Stronger demand may translate into a lower required yield and hence a lower cost of debt; it may improve placement success and reduce the need for costly price concessions; and it often correlates with better secondary-market liquidity, which further compresses yields. Because these effects are jointly determined and empirically difficult to disentangle within a stylized model, they are represented parsimoniously by the single demand-driven net benefit term αD. The scaling parameter α is therefore the issuer's exposure to market conditions: a higher α implies that the firm's net benefit from green bonds is more responsive to changes in green bond demand, consistent with the view that frequent, benchmark-size issuers are better positioned to monetize investor appetites than others.
D ∈ {H, M}
The second primitive is issuer credibility, represented by an environmental track record state:
where S denotes strong credibility and W denotes weak credibility, capturing the degree to which investors perceive the issuer as aligned with sustainability commitments and less exposed to greenwashing concerns [1]. Third, bank incentives are shaped by a regulatory and policy state:
which summarizes policy instruments and supervisory guidance that can make sustainability-linked credit more attractive for banks [13,35].
E ∈ {S, W}
R ∈ {Strong, Weak}
The model distinguishes between costs and benefits specific to each instrument. Green bond issuance entails an issuance, certification and disclosure cost CGB > 0, reflecting reporting, verification and compliance burdens noted in the green bond literature [1,5]. Green bank loans are represented through an effective borrowing cost ct, where the subscript indicates the contractual terms chosen by the bank, with cF < cS. Importantly, ct is not the quoted interest rate alone: it is an all-in measure of the borrower's financing burden, decomposable into the periodic cost of debt service, non-interest charges such as arrangement, commitment, monitoring and verification fees, and the implicit costs created by contractual constraints including covenant tightness, collateral requirements, mandatory reporting and performance-linked pricing grids. Under favorable terms the bank may reduce the interest margin, lengthen maturity, increase grace periods, relax collateral requirements or adopt more borrower-friendly covenant packages; under standard terms it prices and structures the loan according to conventional risk–return criteria. The inequality cF < cS therefore operationalizes the institutional argument that bank lending conditions are not exogenous but vary endogenously with regulatory incentives, sustainability mandates, reputational considerations and competitive positioning.
An equally important consideration is execution risk in market-based financing. Unlike bilateral bank lending, which can be finalized once terms are agreed, bond issuance is contingent on investor subscription and the successful completion of a placement process. The model captures this vulnerability through a non-negative loss term L ≥ 0, incurred when the firm chooses green bonds, but investors do not subscribe or subscribe insufficiently. Conceptually, L represents the broader economic consequences of a failed or under-subscribed issuance that are not fully captured by CGB: sunk underwriting and preparation costs beyond formal certification expenses; delays in project implementation and the associated opportunity costs; reputational damage from a visibly weak market reception, which can impair future access to capital markets; and the need to revert rapidly to alternative funding under time pressure, which weakens bargaining power. Introducing L is essential to represent the strategic logic that a firm may rationally avoid green bond issuance ex ante when it anticipates weak participation, precisely because the cost of trying and failing is not neutral.
Finally, the baseline operating value of the financed activity is denoted V and is common across instruments. This choice ensures that the analysis focuses on incremental financing incentives rather than on differences in the underlying project's operating cash flows, avoiding any conflation of financing choice with project selection. Table 1 summarizes the notation and parameter definitions.
3.2. Players and Pay-off Functions
The firm is modelled as the initial mover because, in practice, the issuer initiates the financing process and must commit resources to a route before observing the market's final response. Investors are assumed to evaluate subscription decisions based on expected risk-adjusted performance and credibility-related considerations. The emphasis on risk-adjusted return rather than nominal yield reflects the notion that liquidity conditions, uncertainty premium and reputational risks materially affect the attractiveness of labelled bonds. Investor utility is allowed to depend positively on issuer credibility, capturing the fact that ESG preferences, mandate constraints and reputational concerns can create additional value from funding credible green issuers, while greenwashing risk raises perceived participation costs [1,4,5,28]. The bank is modelled as a strategic agent because green lending conditions are not mechanically determined by borrower risk alone; they may respond to institutional incentives and regulatory design [13,35].
Under the green bond route, the firm's payoff is contingent on successful placement. When the firm chooses green bonds and investors subscribe:
πF(GB | Invest, t) = V + αD − CGB − ct
This formulation separates the payoff into four economically interpretable components. Term V is the baseline value generated once funding is secured, held constantly across instruments. The term αD captures the demand-driven advantage of issuing green bonds. The term −CGB formalizes the non-trivial fixed costs of certification, verification, alignment with reporting standards, enhanced disclosure, internal governance and external review; these are incurred regardless of whether the firm obtains a pricing advantage, which is a central reason why green bond issuance is not universally optimal even where investor demand exists. The term −ct captures the firm's effective borrowing cost associated with the bank's lending terms, included because even when bond issuance succeeds, firms typically retain complementary bank financing in the form of revolving credit lines, liquidity buffers or bridge facilities. When the firm selects green bonds, but investors do not subscribe, the relevant payoff is:
πF(GB | Not, t) = V − CGB − ct − L
The first subtraction reflects that a substantial portion of issuance costs is sunk once the transaction is initiated: fees and expenses associated with structuring and documentation, third-party verification, internal reporting and compliance work, and communication costs are incurred mainly before the subscription decision is observed. CGB is therefore best interpreted as the irrecoverable entry cost of attempting green bond financing, and it is precisely this irreversibility that makes the firm's initial choice strategic and forward-looking. The retention of −ct formalizes the idea that, following non-subscription, the firm may still require bank financing as a fallback or bridge, on terms set by the bank. Under green bank loans the firm's payoff is:
reflecting two defining characteristics of bank-based green lending. First, the firm avoids the fixed issuance, certification and market preparation costs inherent to bond issuance, which is why CGB does not appear. Second, green bank loans are characterized by execution certainty relative to bonds: once approved and contracted, a loan typically provides predictable access to funds, which is why no term analogous to L appears. The model therefore treats the core risk in green bonds as placement risk, while the core risk in green bank loans is captured indirectly through the pricing and contractual conditions embedded in ct.
πF(GBL | t) = V − ct
Investors are assumed to evaluate green bonds through an expected risk-adjusted return measure ERR(D), assumed increasing in D in reduced form. Investor utility from subscribing is:
πI(Invest) = β·ERR(D) + δ·1{E = S} − θ
The first term captures the financial motive for subscribing, with β > 0 measuring sensitivity to expected risk-adjusted returns. The second term represents the credibility-related benefit of investing in a green-labelled instrument issued by a firm with a strong environmental track record, with δ > 0 interpretable as a reduced-form representation of non-pecuniary utility, mandate satisfaction and reduced perceived reputational risk. The third term captures participation frictions, with θ ≥ 0 representing perceived greenwashing risk, uncertainty about taxonomy alignment, doubts regarding the measurability of environmental outcomes, monitoring and reporting burdens, and uncertainty premia linked to evolving regulation. The outside option is normalized to:
so that pay-offs are measured incrementally: πI(Invest) is the net surplus from subscribing to this green bond over and above what the investor could obtain elsewhere with comparable capital and risk capacity. Investors therefore subscribe if and only if:
πI(Not) = 0
β·ERR(D) + δ·1{E = S} ≥ θ
The bank's pay-offs are specified so that offering favorable terms is privately costly but can be compensated by policy-induced benefits:
where γ > 0 is a reduced-form representation of the channels through which policy increases the net attractiveness of green lending, including explicit financial incentives such as subsidies, guarantees or concessional funding, prudential and supervisory considerations, and reputational or strategic value. This representation does not imply that the bank incurs losses under standard lending; it normalizes pay-offs so that the decision depends on incremental costs and benefits. The bank prefers favorable terms whenever:
πB(F) = γ·1{R = Strong} − kF
πB(S) = −kS, with kF ≥ kS ≥ 0
γ·1{R = Strong} ≥ kF − kS
The right-hand side is the incremental cost of offering favorable rather than standard conditions; the left-hand side is the policy-driven benefit, available only when the incentive regime is strong.
3.3. Equilibrium Concept and Solution Method
The appropriate solution concept is the subgame-perfect Nash equilibrium (SPNE), which refines Nash equilibrium by requiring that strategies constitute a Nash equilibrium not only for the game but also for every subgame that can arise after any history of play. This requirement matters in sequential financing problems because actors might otherwise be assumed to commit to actions they would have no incentive to carry out when the relevant node is reached: without subgame perfection, the bank could be attributed a threat of offering concessionary terms were doing so would reduce its payoff, or investors could be assumed to subscribe despite negative expected utility. SPNE eliminates such inconsistencies and ensures that equilibrium behavior remains internally coherent across all contingencies [10,11].
The equilibrium is obtained through backward induction. The derivation begins with the bank's final-stage term-setting decision, because the bank's choice determines the effective borrowing cost faced by the firm. It then proceeds to the investor stage, where subscription is governed by a participation constraint that determines whether the bond issuance succeeds. Finally, the analysis returns to the firm's initial instrument choice, where the firm compares expected pay-offs taking as given the investors' subscription rule and the bank's term-setting rule derived in later stages. Table 2 maps every terminal history of the game to the corresponding payoff expressions, and Figure 1 presents the extensive form.
3.4. Numerical Implementation and Simulation Design
The analytical solution delivers threshold inequalities but not magnitudes. To quantify equilibrium regions, rank the influence of the model primitives and characterize regime switching, the equilibrium correspondence is implemented numerically in Python 3.11 (NumPy 2.4, Matplotlib 3.10). The solver evaluates Equations (15), (12) and (7)–(9) in that order for any parameter vector, returning the equilibrium instrument, the bank's contractual stance, the subscription outcome and all terminal pay-offs. The numerical experiment has three components.
First, a deterministic evaluation solves the game at a baseline parameterization for each of the eight admissible states of (D, E, R), establishing the reference equilibrium. Second, the equilibrium correspondence is mapped over a 400 × 400 grid in the (θ, CGB) plane for each combination of demand and credibility, partitioning the parameter space into a green bond region, a region in which bonds are feasible but dominated, and a region in which bonds are infeasible because the participation constraint fails. Third, a Monte Carlo experiment draws N = 200,000 parameter vectors and solves the game for each draw in every state, yielding the probability of investor subscription, of favorable bank terms and of a green bond equilibrium. Global sensitivity is assessed by the correlation between each primitive and the equilibrium indicator for green bond choice, pooling over uniformly drawn states.
The baseline calibration is reported in Table 3. Values are illustrative and expressed in normalized units; they are chosen so that the reference point lies in an economically interesting region of the parameter space, in which neither instrument dominates across all states. Sampling distributions are lognormal for strictly positive scale parameters (α, CGB, L) and truncated normal for the remaining parameters, with dispersions calibrated to span the plausible ordering of magnitudes rather than to reproduce any market. The pseudo-random number generator is seeded (seed = 20260718), so all reported figures are exactly reproducible.
Two clarifications on the epistemic status of the numerical results are warranted. The simulation is a numerical solution of the theoretical model, not an estimation exercise: every reported quantity is a deterministic or Monte Carlo evaluation of Equations (7)–(15) and contains no empirical data on green bonds, green loans or issuers. Consequently, the probabilities reported below are properties of the model under the stated parameterization and must not be read as measured frequencies in any real market. What the exercise does deliver is the quantitative shape of the equilibrium correspondence, which is precisely what is required to use the framework as a scenario and risk-assessment device.
4. Results
4.1. Bank's Optimal Lending Terms (Stage 3)
At Stage 3 the bank internalizes a trade-off between the private economic cost of granting concessionary lending conditions and the institutional or strategic benefits arising when the regulatory environment supports sustainable credit expansion. The decision is characterized by the threshold condition (15). The structure clarifies that the bank's choice is governed not by absolute profitability levels but by an incremental comparison: the concessionary stance is selected only if the incremental policy or strategic benefit outweighs the incremental cost of providing those terms. When the regulatory environment does not activate the incentive component, the inequality collapses to a comparison driven purely by private costs, and the bank's best response is the baseline stance whenever concessions are strictly more costly. When incentives are active, the bank may rationally deviate from baseline pricing because part of its objective function is effectively shifted by institutional design. This is the channel emphasized by the policy-oriented sustainable finance literature: regulation can affect the supply side of green finance not only by shaping disclosure norms or investor demand, but by altering banks' own pay-offs so that sustainable lending becomes privately incentive-compatible [13].
Denoting the bank's equilibrium choice by t*(R), the perfect-information benchmark implies that t*(R) is uniquely pinned down by (15) for any admissible parameter configuration. Increases in the incentive intensity parameter expand the set of configurations in which the concessionary stance is optimal, while increases in the incremental private cost of concessions shrink that set. Stage 3 is economically consequential because it determines which effective borrowing cost the firm faces under bank finance, and it therefore constitutes the model's primary institutional transmission channel.
4.2. Investors' Subscription Decision (Stage 2)
Stage 2 introduces the defining institutional asymmetry between market-based and bank-based green debt: green bond issuance requires voluntary investor participation, whereas green lending is negotiated bilaterally and faces no equivalent subscription stage. Equation (12) makes it explicit that participation depends on three conceptually distinct components. The first is the expected risk-adjusted return, expressed as a reduced-form function of the demand state, reflecting the premise that investors evaluate a labelled bond not solely on headline yield but on risk-adjusted performance incorporating liquidity conditions, uncertainty premia and the broader pricing environment [2,5]. The second is the credibility-dependent term, which formalizes the idea that credibility is an economically relevant determinant of demand because it affects beliefs about whether the green label is informative. Investors may attach additional value to funding credible issuers because many institutions face ESG mandates, because some derive non-pecuniary utility from impact [28], and because credibility mitigates greenwashing concerns and the associated reputational risk [1]. The third is the participation friction, which can also be interpreted through behavioral lenses: when credibility is noisy or scandals are salient, investors may overweight downside outcomes and treat potential reputational losses asymmetrically, increasing the perceived cost of participation even if expected returns are competitive [14,15,16].
The equilibrium relevance of Stage 2 lies in its definition of a binding participation constraint for the issuer. Even if the firm prefers the bond route on its own cost–benefit calculus, that route is not implementable unless (12) holds. In market-based sustainable finance, instrument choice is therefore constrained by beliefs and credibility, not solely by the issuer's private optimization, and the investor decision acts as the principal gatekeeping mechanism separating states in which green bond issuance is feasible from states in which it is not.
4.3. Firm's Instrument Choice (Stage 1)
At Stage 1 the firm selects its financing instrument anticipating the continuation strategies derived above. A disciplined way to present the decision is to condition on whether the green bond branch is feasible in the continuation game. Consider first the regime in which (12) holds and investors subscribe. The net payoff difference between green bonds and green loans, evaluated at the bank's equilibrium stance, is:
ΔπFInvest = πF(GB | Invest, t) − πF(GBL | t) = αD − CGB
Hence, conditional on subscription, the firm prefers issuing green bonds if and only if:
αD ≥ CGB
When the bond branch is feasible, the firm chooses the market-based route only if the demand-driven advantage is sufficiently large to offset the fixed issuance, certification and disclosure burden. The result formalizes the intuition that green bond issuance is not automatically optimal even in supportive markets: it must clear an economic threshold once compliance costs are accounted for. Because the loan payoff (9) and the bond payoff (7) both include −ct, the bank's equilibrium stance affects the absolute pay-offs but cancels out of the relative comparison in this baseline specification. Bank terms therefore matter for the firm's overall financing burden, but the bond-versus-loan comparison under subscription is driven by the trade-off between the bond-market advantage and the bond-specific fixed cost. This analytical neutrality result is confirmed numerically in Section 4.6.
Next, consider the regime in which (12) fails and investors do not subscribe. The net payoff difference becomes:
ΔπFNot = πF(GB | Not, t) − πF(GBL | t) = −CGB − L
Because CGB > 0 and L ≥ 0, Equation (18) is strictly negative. When the firm anticipates non-subscription, attempting a green bond issuance is therefore strictly dominated by choosing a green bank loan: a failed issuance imposes sunk costs and execution losses without delivering the intended market-based funding benefit. The Stage-1 decision can thus be summarized as an equilibrium selection rule. The firm chooses green bonds if and only if both conditions hold: feasibility, so that the participation condition (12) is satisfied; and optimality conditional on feasibility, so that the net-benefit condition (17) is satisfied. In all other states the firm chooses green bank loans. This characterization makes clear that market-based green debt can be observed in equilibrium only when the bond branch is both feasible and economically attractive after accounting for issuance burdens, and it identifies the source of potential discontinuities: once investor participation fails, the bond option becomes strictly dominated by the sunk cost and execution loss, yielding a discrete shift towards the loan branch.
4.4. Deterministic Equilibrium across States
Table 4 reports the equilibrium of the game solved at the baseline calibration of Table 3 for each of the eight states of (D, E, R). Three features stand out. Green bonds emerge in equilibrium in all four high-demand states, where the demand-driven advantage αD = 6.00 comfortably exceeds the issuance cost CGB = 3.50, delivering a payoff advantage of 2.50 over the loan route. Under moderate demand the advantage falls to αD = 2.70, below the issuance cost, so that green loans are chosen even where investors would still subscribe; the payoff advantage of bonds turns negative at −0.80. When moderate demand is combined with weak credibility, the participation constraint fails outright and the relevant comparison becomes (18), which yields −7.50: the bond route is not merely suboptimal but strictly dominated by a wide margin.
The regulatory state affects the level of the firm's payoff, which is 1.20 higher under favorable than under standard terms in every state, but never the choice of instrument. This is the numerical counterpart of the cancellation of ct in Equation (16) and illustrates the model's separation of the demand channel, which governs the margin between instruments, from the institutional channel, which governs the level of financing costs.
4.5. Equilibrium Regions in Parameter Space
Figure 2 maps the equilibrium correspondence over the (θ, CGB) plane for the four combinations of demand and credibility. The vertical boundary is the participation threshold θ* = β·ERR(D) + δ·1{E = S}; to its right the bond branch is infeasible regardless of issuance cost. The horizontal boundary is the net-benefit threshold CGB* = αD; above it bonds are feasible but dominated. The green bond region is the intersection of the two half-planes and shrinks monotonically as demand weakens and as credibility deteriorates.
The comparison across panels quantifies the substitutability between demand and credibility. Under high demand, the participation threshold falls from θ* = 1.35 with strong credibility to θ* = 0.90 with weak credibility, a contraction of one third in the admissible range of participation frictions. Under moderate demand the corresponding thresholds are 0.85 and 0.40, and the net-benefit ceiling collapses from CGB* = 6.00 to CGB* = 2.70. Credibility therefore does not merely shift outcomes at the margin: in the moderate-demand, weak-credibility panel the green bond region is a small rectangle confined to configurations combining very low participation frictions with very low issuance costs. This is the formal sense in which verification ecosystems and disclosure quality operate as equilibrium-shaping constraints on sustainable debt markets rather than as background conditions [1,2,5].
4.6. Monte Carlo Results and Global Sensitivity
Table 5 reports on the Monte Carlo experiment over N = 200,000 parameter draws. The probability of investor subscription falls from 95.7% under high demand and strong credibility to 63.8% when credibility weakens, to 57.0% when demand instead weakens, and to 4.4% when both deteriorate. The probability of a green bond equilibrium follows the same ordering but at systematically lower levels, declining from 79.2% to 52.8%, 18.6% and 1.5% respectively. The gap between the two probabilities is the quantitative measure of the second, issuer-side constraint: conditional on subscription, bonds are chosen in 82.7% of draws under high demand but in only about 33% under moderate demand, because the demand-driven advantage more frequently fails to cover the fixed issuance cost.
The decomposition is economically informative. Moving from high to moderate demand reduces green bond adoption by 60.6 percentage points in the strong-credibility case, of which roughly two fifths operate through the participation constraint and three fifths through the net-benefit condition. Moving from strong to weak credibility at high demand reduces adoption by 26.4 percentage points, operating almost entirely through participation, since the conditional probability of choosing bonds given subscription is virtually unchanged at 82.7%. Demand and credibility therefore act through partially distinct channels: credibility governs whether the market validates the label, while demand governs both validation and the economics of issuance.
Panel (a) of Figure 3 ranks the model primitives by the correlation between each parameter and the equilibrium indicator for green bond choice, pooling over uniformly drawn states. The demand state dominates (0.578), followed by the credibility state (0.226), the issuance cost (−0.260), the participation friction (−0.218), the demand sensitivity α (0.185) and the investor return sensitivity β (0.148). Two results deserve emphasis because they are not artefacts of the calibration, but analytical properties of the model recovered numerically. The regulatory state and the bank incentive intensity γ are essentially uncorrelated with instrument choice (−0.002 and 0.002), confirming that the institutional channel operates on financing levels rather than on the bond-versus-loan margin in the baseline specification. The execution loss L is likewise essentially uncorrelated with the outcome (−0.003), because L enters only states where the participation constraint has already failed and bonds are dominated for any L ≥ 0; the magnitude of the execution penalty therefore governs how costly a mistake would be, not whether the firm makes it.
Panel (b) traces the share of draws yielding a green bond equilibrium as the participation friction varies continuously. The curves are not smoothly declining but exhibit a pronounced fall concentrated around the state-specific participation threshold, beyond which green bond adoption collapses towards zero within a narrow interval of θ. In the high-demand, strong-credibility configuration, adoption remains above 75% for θ ≤ 1.1 and falls below 5% by θ = 1.6; the corresponding collapse occurs between θ = 0.7 and θ = 1.1 under weak credibility, and earlier still under moderate demand. This is the quantitative signature of the dominance result in Equation (18): as parameters deteriorate, the model does not predict less bond issuance but the disappearance of bond issuance from the firm's optimal set. The implication for risk assessment is that labelled bond activity should be expected to contract abruptly rather than gradually during credibility shocks or periods of heightened uncertainty about standards.
5. Discussion
5.1. Main Equilibrium Message
A key message of the model is that a green label advantage is neither automatic nor uniform across instruments. Green bonds are observed in equilibrium only when two conditions are jointly satisfied. First, issuance must be feasible in the continuation game, which requires that the combined financial and credibility-related benefits outweigh participation frictions. This formalizes the idea that labelled debt markets are governed by belief-sensitive participation: the issuer does not unilaterally choose a bond outcome unless investors validate the label by subscribing. Second, conditional on feasibility, issuance must be optimal relative to green bank loans, which requires that the demand-related advantage is large enough to compensate for the fixed issuance, certification and disclosure burden. The model therefore predicts heterogeneity in instrument choice even among issuers that can successfully place a green bond.
The simulation converts these statements into magnitudes. Under the baseline parameterization the model implies that market-based green financing is attainable in roughly four out of five parameter configurations when demand is deep and the issuer is credible, but in fewer than one in fifty when both conditions deteriorate. The intermediate cases are the informative ones for policy: a credible issuer facing moderate demand retains a 57% probability of investor validation but only an 18.6% probability of issuing, because the fixed cost of the label is not amortized. This distinction between validation and viability is invisible in reduced-form spread comparisons.
5.2. Interpretation of the Comparative Statics
Because the equilibrium is characterized by threshold inequalities, the model predicts both marginal effects and regime changes. On the investor side, stronger demand raises the return component and expands the subscription region; stronger credibility adds the credibility benefit and relaxes the participation constraint; and higher participation frictions, interpretable as greenwashing concerns, uncertainty about label meaning, monitoring burdens or reputational sensitivity, tighten it. Conditional on subscription, higher issuance costs shrink the bond-choice region even when issuance is feasible, while higher demand sensitivity or stronger demand states expand it. This clarifies why observed instrument choice may differ across issuers and across market regimes: issuers with high compliance burdens or limited ability to monetize demand will rationally prefer loans even when they could place a bond.
On the banking side, stronger incentive intensity or a shift from a weak to a strong incentive regime expands the set of environments in which the bank rationally offers favorable terms, reducing the firm's effective borrowing cost. Cross-jurisdictional variation in policy frameworks can therefore lead to systematic variation in loan pricing and contract generosity, holding issuer fundamentals constant. The numerical results sharpen the interpretation of this channel: in the baseline specification it shifts the level of financing costs by 1.20 units without altering the instrument margin. This does not make the institutional channel irrelevant. It means that its effect on instrument composition must operate through mechanisms outside the baseline, such as differential effects of bank terms across instruments, capital constraints or competition, which is a specific and testable prediction rather than a limitation of exposition.
5.3. Implications for Empirical Interpretation and Measurement
The model provides a structure for interpreting observed patterns in sustainable debt markets by separating three mechanisms that can otherwise be conflated. First, empirical analysis should distinguish between feasibility and pricing. Observed bond spreads conditional on issuance reflect outcomes in the subset of states where the participation constraint is satisfied; they do not capture states in which bonds are infeasible and therefore unobserved. Analyses focusing only on issued bonds may consequently understate the economic role of credibility and participation frictions unless issuance incidence, withdrawal or under-subscription events are explicitly considered. The Monte Carlo results quantify the potential magnitude of this selection: in the moderate-demand, weak-credibility state, 95.6% of parameter configurations produce no observable green bond at all.
Second, the model clarifies the role of fixed issuance burdens. Even when bonds are feasible, the bond-versus-loan choice depends on whether the demand-driven advantage compensates for the certification and disclosure cost. Empirically, this suggests that issuer characteristics related to compliance capacity and to the amortization of fixed costs, such as scale, frequency of issuance and established frameworks, should systematically correlate with instrument choice independently of short-run pricing. Third, the model highlights an institutional intermediation channel operating through banks, which should be treated as a driver of equilibrium outcomes rather than as background context, motivating careful attention to supervisory environments when interpreting cross-country differences in the prevalence and terms of green lending.
5.4. Implications for Risk Assessment and Policy Design
Read as a risk-assessment device, the framework returns, for any institutional configuration, the probability that market-based green financing is attainable. Three implications follow for issuers, lenders and supervisors. First, because the equilibrium exhibits threshold behavior, exposure to labelled bond markets carries a discontinuous risk profile: a small deterioration in perceived credibility or in the meaning of the label can eliminate market access rather than merely raise its price. Contingency planning that assumes a gradually rising cost of issuance will therefore understate the funding risk faced by marginal issuers. Second, the sensitivity ranking indicates where regulatory effort is most productive. Interventions that lower participation frictions, such as harmonized taxonomies, assurance standards and enforcement against greenwashing, act directly on the binding constraint, whereas interventions that subsidies bank concessions improve financing conditions without expanding the set of issuers able to access the bond market. Third, the substitutability between demand and credibility documented in Section 4.5 implies that credibility infrastructure is most valuable precisely where market depth is weakest, which is typically in smaller jurisdictions and among first-time issuers.
5.5. Limitations and Future Research
As a benchmark, the model deliberately abstracts from several complexities to preserve tractability. First, the baseline adopts perfect information. In practice, issuer credibility is not perfectly observed and may be strategically managed through disclosure, certification and post-issuance reporting. Introducing incomplete information, in the form of a signaling environment in which credibility is private and verification is endogenous, would allow a more explicit treatment of greenwashing risk. Second, investor behavior is represented by a reduced-form participation rule, whereas the investor base is heterogeneous in ESG mandates, reputational sensitivity, benchmark constraints and risk tolerance; allowing heterogeneity would yield richer predictions about oversubscription, market segmentation and the dispersion of pricing outcomes. Third, the bank's payoff is modelled in reduced form; a richer intermediation structure incorporating capital constraints, risk-weight incentives, funding costs and competition would endogenize the incremental concession cost and could generate an instrument-margin effect of the institutional channel that the baseline rules out by construction. Fourth, the baseline project value is held constant across instruments to isolate incremental financing incentives, whereas in practice financing choice can affect project timing, governance and investment scale.
A fifth limitation concerns the numerical layer itself. The simulation solves the model; it does not confront it with data: the calibration is illustrative and the reported probabilities are properties of the model rather than measured market frequencies. The natural next step is therefore empirical, namely, to estimate the participation and net-benefit thresholds from issuance-incidence data covering both issued and withdrawn transactions, and to discipline the calibration with observed certification costs and spread differentials. Together with the incomplete-information, investor-heterogeneity and banking extensions, this would preserve the model's strategic core while substantially improving its empirical relevance.
6. Conclusions
This paper set out to explain why firms alternate between green bonds and green bank loans, why the prevalence of these instruments differs across issuers and jurisdictions, and how credibility and institutional incentives shape sustainable debt market outcomes. The guiding premise was that sustainable debt markets cannot be understood solely through static price comparisons: instrument choice is a strategic decision formed under sequential interaction, in which feasibility and contractual conditions are endogenously shaped by the behavior of capital providers and intermediaries.
The framework yields a disciplined equilibrium account of instrument coexistence. By explicitly modelling both a market-based route and a relationship-based route, the analysis clarifies why green bonds and green loans can coexist even when they appear to serve similar sustainability objectives and shows that instrument choice emerges from the interaction of demand conditions, credibility, issuance costs and policy-conditioned lending incentives rather than from issuer preferences alone. It further distinguishes the market-based validation of labelled finance, through investor subscription, from the bank-based provisioning of green credit, through term-setting under incentives, preventing conceptually distinct mechanisms from being conflated in interpretation.
The numerical implementation converts these mechanisms into quantities. Green bond adoption ranges from 79.2% of parameter configurations under deep demand and strong credibility to 1.5% when both deteriorate; the collapse is concentrated in a narrow interval around the participation threshold rather than distributed smoothly; and the regulatory regime shifts financing costs without altering the instrument margin, an analytical neutrality result recovered independently by the sensitivity analysis. These findings identify participation frictions and fixed certification costs, rather than bank concessionally, as the binding determinants of access to market-based green finance in the baseline environment, and they indicate that the risk profile of labelled bond markets is discontinuous by construction. The framework thereby provides a rigorous foundation for interpreting sustainable debt markets and a tractable simulation platform for assessing sustainability-related financing risk under alternative institutional configurations.
Author Contributions
Conceptualization, Paulo Alcarva; methodology, Paulo Alcarva and João Pinto.; software, Paulo Alcarva.; validation, João Pinto., Luís Pacheco. and Mara Madaleno; formal analysis, Paulo Alcarva; investigation, Paulo Alcarva; writing—original draft preparation, Paulo Alcarva; writing—review and editing, João Pinto, Luís Pacheco and Mara Madaleno; supervision, João Pinto., Luís Pacheco. and Mara Madaleno. All authors have read and agreed to the published version of the manuscript.
Funding
This research received no external funding.
Data Availability Statement
No new empirical data were created or analyzed in this study. All quantitative results reported in Section 4 are numerical solutions of the theoretical model specified in Section 3 and are fully reproducible from the Python code and the parameter values reported in Table 3, using the random seed 20260718. The simulation code is available from the corresponding author on request and will be deposited in a public repository upon acceptance.
Acknowledgments
During the preparation of this manuscript, the authors used Claude (Anthropic) for the purposes of manuscript structuring, language editing and implementation of the simulation code described in Section 3.4. The authors have reviewed and edited the output and take full responsibility for the content of this publication.
Conflicts of Interest
The authors declare no conflicts of interest.
Abbreviations
The following abbreviations are used in this manuscript:
| GB | Green bond |
| GBL | Green bank loan |
| ESG | Environmental, social and governance |
| SPNE | Subgame-perfect Nash equilibrium |
| KPI | Key performance indicator |
| PPP | Public–private partnership |
| ERR | Expected risk-adjusted return |
Appendix A
Appendix A provides the path-coding convention used to index terminal histories of the extensive-form game. It is referenced in Section 3.3 and supports the backward-induction argument developed in Section 4.

Table A1.
Path coding of terminal histories.
| Path | Stage 1 (Firm) | Stage 2 (Investor) | Stage 3 (Bank) | Payoff mapping (Table 2) |
| 1 | GB | Invest | Favorable | Panel A, row Favorable, col Invest |
| 2 | GB | Invest | Standard | Panel A, row Standard, col Invest |
| 3 | GB | Not | Favorable | Panel A, row Favorable, col Not |
| 4 | GB | Not | Standard | Panel A, row Standard, col Not |
| 5 | GBL | — | Favorable | Panel B, row Favorable |
| 6 | GBL | — | Standard | Panel B, row Standard |
Notes: The table enumerates terminal histories by the sequence of actions taken at each stage and provides a compact indexing scheme for referencing terminal outcomes in the equilibrium analysis. The symbol — indicates that the corresponding stage is not reached in the green loan branch. Source: authors' elaboration.
References
- Ehlers, T., & Packer, F. Green bond finance and certification. BIS Quarterly Review. 2017, September, 89–104. SSRN: 3042378.
- Flammer, C. Corporate green bonds. Journal of Financial Economics. 2021, 142(2), 499–516. [CrossRef]
- Amel-Zadeh, A., & Serafeim, G. Why and how investors use ESG information: Evidence from a global survey. Financial Analysts Journal. 2018, 74(3), 87–103. [CrossRef]
- Pástor, Ľ.; Stambaugh, R.F.; Taylor, L.A. Sustainable investing in equilibrium. Journal of Financial Economics. 2021, 142, 550–571. [CrossRef]
- Zerbib, O.D. The effect of pro-environmental preferences on bond prices: Evidence from green bonds. Journal of Banking & Finance. 2019, 98, 39–60. [CrossRef]
- Migliorelli, M.; Dessertine, P. (Eds.) The Rise of Green Finance in Europe: Opportunities and Challenges for Issuers, Investors and Marketplaces; Palgrave Macmillan: Cham, Switzerland, 2019. [CrossRef]
- Hu, X., Zhong, A., & Cao, Y. Greenium in the Chinese corporate bond market. Emerging Markets Review. 2022, 53, 100946. [CrossRef]
- Liu, L., & Peng, Q. Evolutionary game analysis of enterprise green innovation and green financing in platform supply chain. Sustainability. 2022, 14(13), Article 7807. [CrossRef]
- Thakor, A.V. Game theory in finance. Financial Management. 1991, 20, 71–94.
- Fudenberg, D.; Tirole, J. Game Theory; MIT Press: Cambridge, MA, USA, 1991.
- Osborne, M.J.; Rubinstein, A. A Course in Game Theory; MIT Press: Cambridge, MA, USA, 1994.
- Allen, F.; Morris, S. Game theory models in finance. In Game Theory and Business Applications, 2nd ed.; Chatterjee, K., Samuelson, W., Eds.; Springer: New York, NY, USA, 2014; pp. 17–41. [CrossRef]
- Campiglio, E.; Dafermos, Y.; Monnin, P.; Ryan-Collins, J.; Schotten, G.; Tanaka, M. Climate change challenges for central banks and financial regulators. Nature Climate Change. 2018, 8, 462–468. [CrossRef]
- Simon, H.A. A behavioral model of rational choice. The Quarterly Journal of Economics. 1955, 69, 99–118. [CrossRef]
- Kahneman, D.; Tversky, A. Prospect theory: An analysis of decision under risk. Econometrica. 1979, 47, 263–291. [CrossRef]
- Rubinstein, A. Instinctive and cognitive reasoning: A study of response times. The Economic Journal. 2007, 117, 1243–1259. [CrossRef]
- Noe, T.H. Capital structure and signaling game equilibria. The Review of Financial Studies. 1988, 1, 331–355. [CrossRef]
- Fulghieri, P., & Lukin, D. Information production, dilution costs, and optimal security design. Journal of Financial Economics. 2021, 61(1), 3–42. [CrossRef]
- Deng, L., Cao, C., & Dai, J.. How do the carbon emission trading prices affect the financing decision of the supply chain considering carbon neutrality? Environmental Science and Pollution Research. 2023, 30(30), 76171–76191. [CrossRef]
- Zhu, X., Yan, Y., & Yang, G. Strategic financing options in a supply chain facing guarantee shortages and capital constraints under demand uncertainty. European Journal of Operational Research. 2025, 325(3), 444–456. [CrossRef]
- de la Fuente, G., & Velasco, P. Bank debt signalling and corporate sustainability: Does incongruence blur the message? Finance Research Letters. 2022, 46, 102288. [CrossRef]
- Morellec, E.; Schürhoff, N. Corporate investment and financing under asymmetric information. Journal of Financial Economics. 2011, 99, 262–288. [CrossRef]
- Ziegler, A. A game theory analysis of options: Corporate finance and financial intermediation in continuous time. Springer. 2021. [CrossRef]
- Saunders, A., & Song, K. Bank monitoring and CEO risk-taking incentives. Journal of Banking & Finance. 2018, 88, 225–240. [CrossRef]
- Dong, X., & Pan, J. Analysis of the profits of banks and supply chain enterprises under noncollaborative and collaborative financing. Mathematical Problems in Engineering. 2019, Article 6263480. [CrossRef]
- An, S., Li, B., Song, D., & Chen, X. Green credit financing versus trade credit financing in a supply chain with carbon emission limits. European Journal of Operational Research. 2021, 292(1), 125–142. [CrossRef]
- Battiston, S.; Monasterolo, I.; Riahi, K.; van Ruijven, B.J. Accounting for finance is key for climate mitigation pathways. Science 2021, 372, 918–920. [CrossRef]
- Pástor, Ľ.; Stambaugh, R.F.; Taylor, L.A. Dissecting green returns. Journal of Financial Economics. 2022, 146, 403–424. [CrossRef]
- Cui, H., Wang, R., & Wang, H. An evolutionary analysis of green finance sustainability based on multi-agent game. Journal of Cleaner Production. 2020, 269, Article 121799. [CrossRef]
- Carfì, D.; Schilirò, D. Coopetitive Games and Sustainability in Project Financing; MPRA Paper No. 32039; University Library of Munich: Munich, Germany, 2011.
- Tian, Z., & Hou, W. Research on stakeholder behavior strategy in green PPP project financing. Transactions on Economics, Business and Management Research.2024, 6, 33–45. [CrossRef]
- Shiller, R.J. From efficient markets theory to behavioral finance. Journal of Economic Perspectives. 2003, 17, 83–104. [CrossRef]
- Lo, A.W. Reconciling efficient markets with behavioral finance: The adaptive markets hypothesis. Journal of Investment Consulting. 2005, 7, 21–44.
- Liu, C., Cheong, C. S., & Zurbruegg, R. Rhetoric, reality, and reputation: Do CSR and political lobbying protect shareholder wealth against environmental lawsuits? Journal of Financial and Quantitative Analysis. 2020, 55(2), 679–706. [CrossRef]
- Persson, T.; Tabellini, G. Political Economics: Explaining Economic Policy; MIT Press: Cambridge, MA, USA, 2002.
- Weibull, J.W. Evolutionary Game Theory; MIT Press: Cambridge, MA, USA, 1995.
Figure 1.
Extensive-form decision tree for green debt instrument choice. Notes: The figure represents the sequential game in which the firm's initial instrument choice determines whether the investor subscription subgame is reached, followed by the bank's term-setting decision. Terminal pay-offs are assigned according to Table 2, by reference to the payoff definitions in Equations (7)–(9) for the firm, (10)–(11) for investors, and (13)–(14) for the bank. The equilibrium concept is SPNE, derived by backward induction. Source: authors' elaboration.
Figure 1.
Extensive-form decision tree for green debt instrument choice. Notes: The figure represents the sequential game in which the firm's initial instrument choice determines whether the investor subscription subgame is reached, followed by the bank's term-setting decision. Terminal pay-offs are assigned according to Table 2, by reference to the payoff definitions in Equations (7)–(9) for the firm, (10)–(11) for investors, and (13)–(14) for the bank. The equilibrium concept is SPNE, derived by backward induction. Source: authors' elaboration.
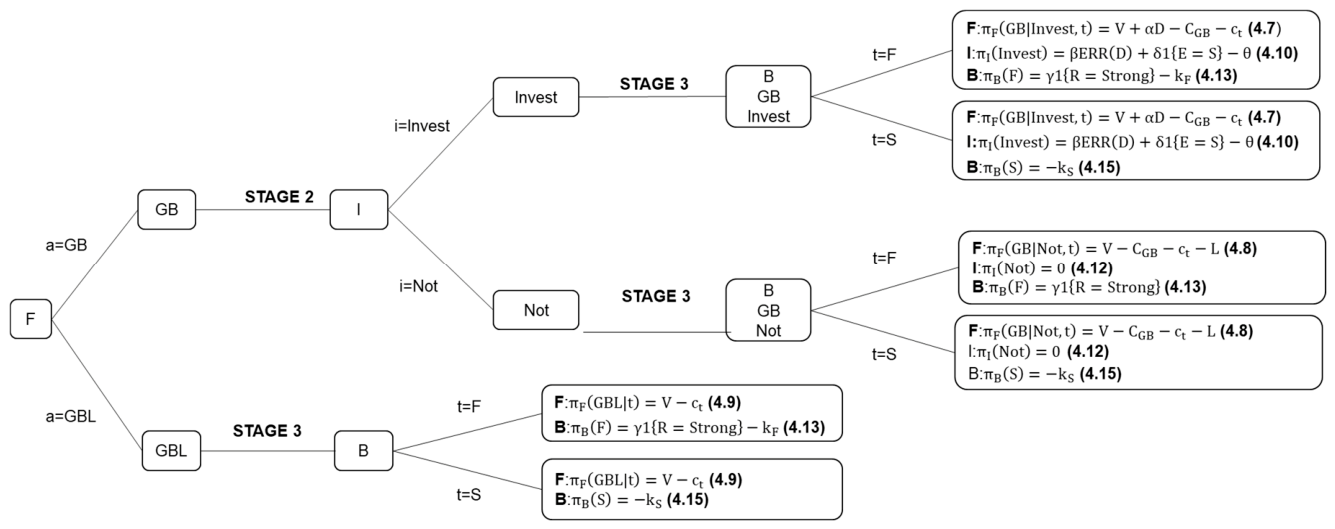
Figure 2.
Equilibrium regions of the sequential green-financing game in the (θ, CGB) plane. Notes: Each panel partitions the parameter space for one combination of the demand state D and the credibility state E, holding all remaining parameters at the baseline values of Table 3. The dotted vertical line is the participation threshold implied by Equation (12); the dashed horizontal line is the net-benefit threshold implied by Equation (17). The open circle marks the baseline parameterization. Source: authors' elaboration based on the numerical solution of Equations (7)–(15).
Figure 2.
Equilibrium regions of the sequential green-financing game in the (θ, CGB) plane. Notes: Each panel partitions the parameter space for one combination of the demand state D and the credibility state E, holding all remaining parameters at the baseline values of Table 3. The dotted vertical line is the participation threshold implied by Equation (12); the dashed horizontal line is the net-benefit threshold implied by Equation (17). The open circle marks the baseline parameterization. Source: authors' elaboration based on the numerical solution of Equations (7)–(15).
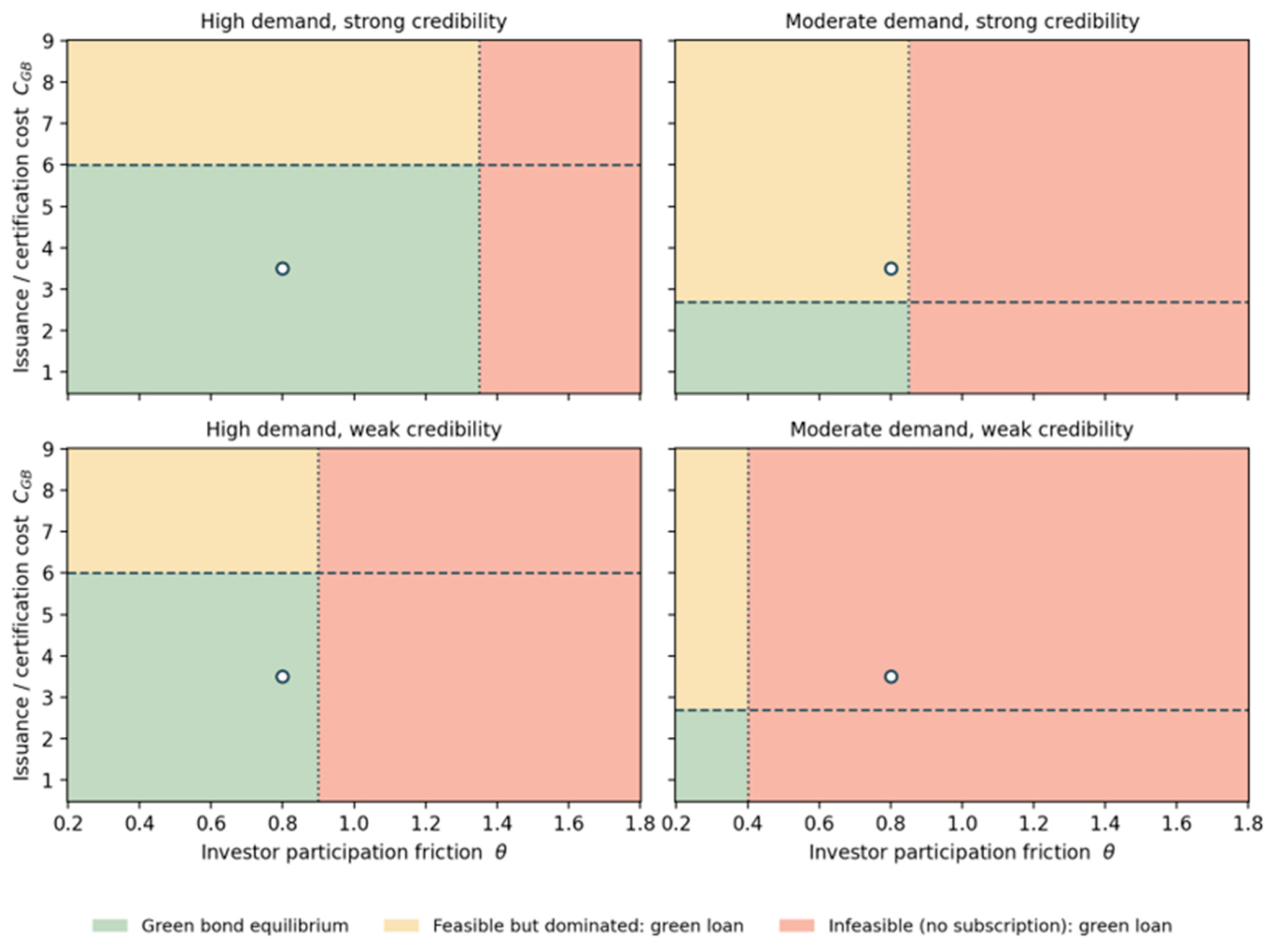
Figure 3.
Global sensitivity of green bond adoption and discontinuous switching at the participation threshold. Notes: Panel (a) reports the correlation between each model primitive and the equilibrium indicator for green bond choice, pooled over uniformly drawn states, N = 200,000. Panel (b) reports the share of draws yielding a green bond equilibrium as the participation friction θ varies continuously, holding the remaining parameters at their sampling distributions and the regulatory regime at Strong. Source: authors' elaboration based on the numerical solution of Equations (7)–(15).
Figure 3.
Global sensitivity of green bond adoption and discontinuous switching at the participation threshold. Notes: Panel (a) reports the correlation between each model primitive and the equilibrium indicator for green bond choice, pooled over uniformly drawn states, N = 200,000. Panel (b) reports the share of draws yielding a green bond equilibrium as the participation friction θ varies continuously, holding the remaining parameters at their sampling distributions and the regulatory regime at Strong. Source: authors' elaboration based on the numerical solution of Equations (7)–(15).
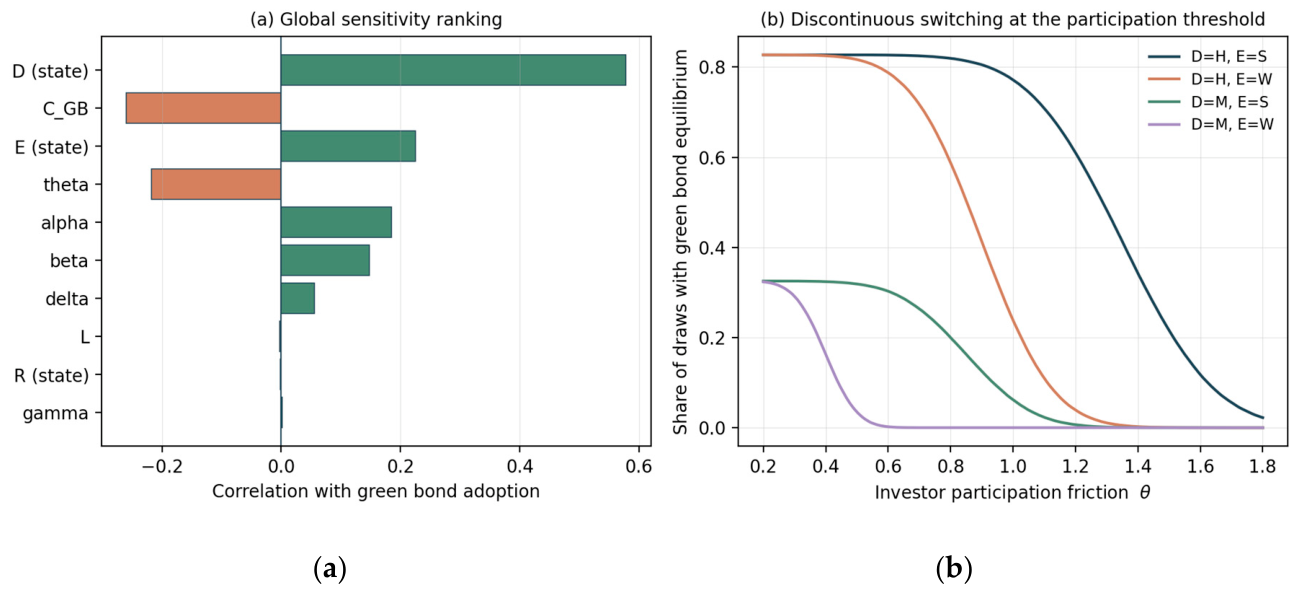
Table 1.
Notation and parameter summary.
| Meaning | Role / expected effect | |
| F, I, B | Players: Firm, Investors, Bank | Three-player extensive-form game |
| a | Firm's financing instrument choice, a ∈ {GB, GBL} | Decision variable |
| GB | Green bond financing (market-based) | Requires investor participation |
| GBL | Green bank loan financing (bilateral) | Investor stage is absent |
| i | Investor action under GB, i ∈ {Invest, Not} | Participation constraint |
| t | Bank loan-term choice, t ∈ {F, S} | Determines ct |
| F / S | Favorable (concessionary) / standard loan terms | Lower / baseline effective cost |
| D | Green bond demand state, D ∈ {H, M} | Higher D → higher ERR(D) and αD |
| E | Issuer environmental credibility, E ∈ {S, W} | Strong E → higher investor utility via δ |
| R | Regulatory incentives affecting banks, R ∈ {Strong, Weak} | Strong R → more likely t* = F |
| CGB | Fixed issuance, certification and verification cost, CGB > 0 | Higher CGB discourages GB |
| α | Sensitivity of GB net benefit to demand, α > 0 | Higher α favors GB |
| L | Execution loss if GB is attempted and not subscribed, L ≥ 0 | Higher L raises the cost of failure |
| ct | Firm's effective all-in borrowing cost under terms t | cF < cS |
| V | Baseline project value, common to GB and GBL | Normalization |
| β | Investor sensitivity to expected risk-adjusted return, β > 0 | Higher β favors Invest |
| δ | Investor weight on issuer credibility, δ > 0 | Higher δ favors Invest |
| θ | Investor perceived participation costs and risks, θ > 0 | Higher θ discourages Invest |
| γ | Bank sensitivity to regulatory incentives, γ > 0 | Higher γ favors F when R is strong |
| kF, kS | Bank cost of offering favorable / standard terms | kF ≥ kS ≥ 0 |
Notes: The model is an extensive-form sequential game with perfect information; the states (D, E, R) summarize market demand conditions, issuer credibility and the regulatory environment affecting bank incentives. Parameters are reduced-form primitives designed to capture key frictions emphasized in the green finance literature. The baseline project value V is held constant across instruments to isolate incremental financing incentives. Source: authors' elaboration.
Table 2.
Terminal payoff mapping.
| Branch and bank terms at Stage 3 | Investor: Invest | Investor: Not |
| Panel A. Firm chooses GB at Stage 1 | ||
| Favorable | Firm: (7); Investor: (10); Bank: (13) | Firm: (8); Investor: (11); Bank: (13) |
| Standard | Firm: (7); Investor: (10); Bank: (14) | Firm: (8); Investor: (11); Bank: (14) |
| Panel B. Firm chooses GBL at Stage 1 | Terminal pay-offs | |
| Favorable | Firm: (9); Bank: (13) | — |
| Standard | Firm: (9); Bank: (14) | — |
Notes: The table links each terminal history of the game to the payoff expressions specified in Section 3.2, using equation references rather than restating functional forms. Investors’ pay-offs are not reported in the green loan branch because the investor has no decision node and no payoff relevance in that subgame. Source: authors' elaboration.
Table 3.
Baseline calibration and Monte Carlo sampling distributions.
| Parameter | Baseline value | Sampling distribution |
| V (project value) | 100.00 | fixed |
| D (high / moderate) | 1.00 / 0.45 | fixed |
| ERR(D) (high / moderate) | 0.90 / 0.40 | fixed |
| α (demand sensitivity) | 6.00 | lognormal(ln 6.00, 0.35) |
| CGB (issuance cost) | 3.50 | lognormal(ln 3.50, 0.45) |
| L (execution loss) | 4.00 | lognormal(ln 4.00, 0.40) |
| β (return sensitivity) | 1.00 | normal(1.00, 0.20), truncated at 0.10 |
| δ (credibility weight) | 0.45 | normal(0.45, 0.15), truncated at 0 |
| θ (participation friction) | 0.80 | normal(0.80, 0.22), truncated at 0.05 |
| γ (bank incentive intensity) | 0.60 | normal(0.60, 0.20), truncated at 0 |
| kF / kS (bank costs) | 1.00 / 0.55 | fixed |
| cF / cS (borrowing costs) | 2.00 / 3.20 | fixed |
Notes: Values are expressed in normalized units and are illustrative; they are chosen so that the reference point lies in a region of the parameter space in which neither instrument dominates across all states. They are not estimates from market data. Monte Carlo draws: N = 200,000; seed = 20260718. Source: authors' elaboration.
Table 4.
Deterministic equilibrium at the baseline calibration, by state.
| D | E | R | Subscribe | Bank terms | Instrument | πF | ΔπF |
| H | S | Strong | Yes | F | GB | 100.50 | +2.50 |
| H | S | Weak | Yes | S | GB | 99.30 | +2.50 |
| H | W | Strong | Yes | F | GB | 100.50 | +2.50 |
| H | W | Weak | Yes | S | GB | 99.30 | +2.50 |
| M | S | Strong | Yes | F | GBL | 98.00 | −0.80 |
| M | S | Weak | Yes | S | GBL | 96.80 | −0.80 |
| M | W | Strong | No | F | GBL | 98.00 | −7.50 |
| M | W | Weak | No | S | GBL | 96.80 | −7.50 |
Notes: πF is the firm's equilibrium payoff; ΔπF is the payoff of the green bond route minus the payoff of the green loan route, evaluated at the bank's equilibrium stance, as given by Equation (16) when investors subscribe and by Equation (18) when they do not. All figures are deterministic solutions of the model at the calibration of Table 3 and are not empirical estimates. Source: authors' elaboration.
Table 5.
Monte Carlo equilibrium probabilities by state (N = 200,000 draws).
| D | E | R | P(subscribe) | P(favorable terms) | P(green bond) | P(green bond | subscribe) |
| H | S | Strong | 0.957 | 0.772 | 0.792 | 0.827 |
| H | S | Weak | 0.957 | 0.000 | 0.792 | 0.827 |
| H | W | Strong | 0.638 | 0.772 | 0.528 | 0.827 |
| H | W | Weak | 0.638 | 0.000 | 0.528 | 0.827 |
| M | S | Strong | 0.570 | 0.772 | 0.186 | 0.326 |
| M | S | Weak | 0.570 | 0.000 | 0.186 | 0.326 |
| M | W | Strong | 0.044 | 0.772 | 0.015 | 0.332 |
| M | W | Weak | 0.044 | 0.000 | 0.015 | 0.332 |
Notes: Probabilities are shares of N = 200,000 parameter draws from the distributions in Table 3 for which the stated equilibrium outcome obtains. They are properties of the model under the stated parameterization and must not be interpreted as measured frequencies in any real market. The pooled share of draws yielding a green bond equilibrium, with states drawn uniformly, is 0.381. Seed = 20260718. Source: authors' elaboration.
Disclaimer/Publisher’s Note: The statements, opinions and data contained in all publications are solely those of the individual author(s) and contributor(s) and not of MDPI and/or the editor(s). MDPI and/or the editor(s) disclaim responsibility for any injury to people or property resulting from any ideas, methods, instructions or products referred to in the content. |
© 2026 by the authors. Licensee MDPI, Basel, Switzerland. This article is an open access article distributed under the terms and conditions of the Creative Commons Attribution (CC BY) license (http://creativecommons.org/licenses/by/4.0/).
Copyright: This open access article is published under a Creative Commons CC BY 4.0 license, which permit the free download, distribution, and reuse, provided that the author and preprint are cited in any reuse.


