

Submitted:
29 July 2026
Posted:
31 July 2026
You are already at the latest version
Abstract
Manual sinus magnetic resonance imaging (MRI) annotations are valuable but difficult to scale. We evaluated PARASIDE, an nnU-Net-based framework for automated sinus compartment segmentation on T1-weighted MRI, against independent manual and radiological assessments from the Study of Health in Pomerania. We linked 12,867 sinus sides from 3,217 participants. Analyses defined before outcome modelling evaluated soft-tissue fraction for healthy versus abnormal sides, inferior soft-tissue centroid position for basal versus apical maxillary opacification, and total frontal volume for aplasia/hypoplasia. Soft-tissue fraction discriminated abnormal sides in frontal (area under the receiver operating characteristic curve [AUC] 0.850, 95% confidence interval [CI] 0.834–0.866) and maxillary sinuses (AUC 0.828, 95% CI 0.818–0.839). The topographic marker discriminated basal from apical opacification (AUC 0.746 left; 0.782 right). Total frontal volume discriminated historical aplasia/hypoplasia ratings (AUC 0.988); a previously established near-absence threshold was highly specific but insensitive. Historical maxillary volumetric masks showed strong overlap and volume association for total and aerated compartments, whereas frontal comparisons reflected a predefined caudal boundary. The historical polyposis rating category remained weakly separable, and surgery-related features corresponded more closely to visible postoperative morphology than to self-reported surgery. PARASIDE reproduced anatomically measurable MRI phenotypes, whereas morphology-specific constructs required dedicated reference standards.
Keywords:
medical image segmentation
; computational phenotyping
; magnetic resonance imaging
; paranasal sinuses
; population imaging
; automated image analysis
; validation
1. Introduction
Large population-based MRI cohorts contain substantial imaging information beyond the primary targets of the original study protocols. When craniofacial coverage includes the paranasal sinuses, these datasets can provide information on sinonasal morphology, mucosal changes, anatomical variation, and incidental abnormalities. Manual review of sinus findings, however, is time-consuming, observer-dependent, and difficult to scale across large imaging datasets. Automated sinus segmentation and quantitative opacification analysis may therefore complement and standardise epidemiological imaging assessment.
Magnetic resonance imaging offers a radiation-free opportunity to assess sinonasal morphology and mucosal changes in population-based cohorts [1,2,3]. Because population MRI is usually not acquired for dedicated rhinological assessment, paranasal sinus findings should be interpreted as imaging phenotypes rather than clinical chronic rhinosinusitis (CRS). Contemporary CRS definitions require symptoms and objective clinical or endoscopic evidence of inflammation [4,5].
Independent reference information in epidemiological imaging cohorts exists at different levels of granularity. Here, the term reference layer denotes a source of comparison data with a specific anatomical scope and level of aggregation. Side-specific specialist assessments may encode anatomical categories such as basal or apical opacification, aplasia/hypoplasia, polyposis, or visible postoperative morphology. Historical manual volumetric masks represent three-dimensional compartment definitions, whereas radiological short assessments during whole-body MRI reading provide broader overview-level information. These layers are informative, but they do not necessarily represent the same construct.
Recent work in rhinology has increasingly explored artificial intelligence and automated image analysis for sinonasal segmentation, scoring, and classification [6,7,8]. Radiomics and texture-analysis frameworks provide additional quantitative descriptors of shape, intensity, and spatial heterogeneity [9,10,11]. PARASIDE is an nnU-Net-based framework for automated paranasal sinus segmentation and quantitative phenotyping on T1-weighted MRI [6,12]. The original PARASIDE work established automated segmentation and global score prediction. The present study addressed the complementary question of which structured epidemiological sinus MRI assessment categories and reference layers can be reproduced by predefined PARASIDE-derived quantitative features. Primary analyses focused on broad abnormality, basal versus apical maxillary opacification, and frontal aplasia/hypoplasia plausibility. Secondary analyses evaluated historical manual volumetric masks, radiological short assessments, and surgery-related morphology. The historical maxillary polyposis rating category was treated as an exploratory boundary phenotype.
2. Materials and Methods
2.1. Study Design and Participants
This cross-sectional imaging-methods validation study used data from the Study of Health in Pomerania (SHIP), a population-based cohort study in north-eastern Germany [13,14]. Two independent, non-overlapping SHIP examination blocks were included: SHIP-START second follow-up (START-2; 2008–2012) and SHIP-TREND baseline (TREND-0; 2008–2012).
Eligible examinations had craniofacial T1-weighted MRI, structured manual maxillary and frontal sinus MRI assessments, and PARASIDE-derived quantitative MRI features. Analyses were performed at sinus-side level. Each participant could contribute up to four maxillary or frontal sinus-side observations. The final linked dataset comprised 3,217 participants and 12,867 maxillary or frontal sinus-side observations before endpoint-specific exclusions.
The study was approved by the Ethics Committee of University Medicine Greifswald (SHIP-TREND-0: protocol code BB 39/08, approved on 19 June 2008; SHIP-START-2: protocol code BB 80/09, approved on 2 October 2009). All participants provided written informed consent. Data access was approved through the formal SHIP data-use procedure. The study was conducted in accordance with the Declaration of Helsinki and relevant institutional guidelines.
2.2. MRI Acquisition and Automated PARASIDE Feature Extraction
Cranial MRI was acquired within the standardised SHIP imaging programme on 1.5 T systems (Magnetom Avanto, Siemens Healthcare, Erlangen, Germany), as previously described [13,14]. The non-contrast T1-weighted sequence (Kopf_T1_mpr_tra_iso_p2) used a repetition time of 1900 ms, an echo time of 3.37 ms, and isotropic 1 mm voxel spacing. Images were acquired under non-targeted population-imaging conditions; the protocol was not optimised for dedicated sinonasal assessment, but the paranasal sinuses were sufficiently covered for compartment-based feature extraction.
Paranasal sinus segmentation and feature extraction were performed automatically using PARASIDE [6]. PARASIDE is an nnU-Net-based framework for T1-weighted MRI that segments sinus air and soft-tissue compartments and derives quantitative features describing sinus size, soft-tissue burden, spatial distribution, morphology, intensity, and texture [6,12]. The analyses used frozen PARASIDE segmentation and feature tables generated before endpoint modelling. The public implementation (PARASIDE v1.1.0) and released model weights are available at https://github.com/Hendrik-code/paraside. The PARASIDE development cohort and the present evaluation cohort were both drawn from the longitudinal SHIP imaging population. Consequently, participants and, in some cases, examinations used during PARASIDE development were also included in the present analysis population. However, the structured ratings and historical volumetric masks, the radiological short-assessment variables, and the surgery-related reference information evaluated in the present study were not used for segmentation-model training, model selection, or feature definition. Independence in this study therefore refers to the reference annotations and assessment variables rather than to complete participant- or image-level separation from the original PARASIDE development cohort.
For the primary endpoints, three predefined anatomically interpretable markers were used. Soft-tissue fraction was defined as the proportion of segmented sinus content represented by soft tissue. Soft-tissue fraction was treated as undefined when the segmented denominator volume was zero. The inferior spatial-relation component was defined as the inferior component of the soft-tissue centroid vector, with larger values indicating a more inferior or basal soft-tissue position. Total sinus volume was used as an anatomical marker for frontal aplasia/hypoplasia plausibility. Additional feature sets for secondary and exploratory analyses included radiomics descriptors, label-morphology features, centrality measures, first-order T1 intensity descriptors, wall-contact measures, and three-dimensional grey-level co-occurrence matrix (GLCM) texture features [9,10,11]. Features derived directly from class size or voxel count were not considered true texture features in the texture-only sensitivity analysis.
2.3. Structured Manual MRI Reference Assessments
Independent manual MRI assessments of the maxillary and frontal sinuses were derived from a historical side-specific epidemiological sinus MRI assessment framework [15]. The assessments were performed in MeVisLab, a visual medical image-analysis platform [16]. They were imaging-based prevalence assessments and did not incorporate symptoms, endoscopy, or contemporary clinical CRS criteria. They were therefore treated as structured manual reference assessments rather than definitive diagnostic ground truth. Formal inter-rater reliability estimates were not available for the complete dataset.
The harmonised reference assessment categories were: , technically not assessable; 0, healthy; 1, basal opacification or basal sinusitis; 2, apical opacification or apical sinusitis; 3, polyposis; 4, mucocele; 5, trauma or fracture; and 6, aplasia/hypoplasia. Endpoint handling of these categories is summarised in Supplementary Materials, Table S1.
2.4. Historical Manual Volumetric Annotations
Historical manual MeVisLab volumetric masks were analysed as a separate three-dimensional reference layer. These masks represented manual total and aerated sinus compartments rather than side-level categorical ratings. Raw images were linked to SHIP/PARASIDE examinations using canonical image-hash matching and were included only if a geometrically matching PARASIDE segmentation was available. Complete paired total-volume and aerated-volume masks were available for 95 combined maxillary sinus comparisons, 96 left frontal sinus comparisons, and 98 right frontal sinus comparisons. Cross-referencing of the 103 historically segmented examinations with the original PARASIDE development cohort, comprising 292 participants, identified nine shared participants. Five had the same participant–examination-block combination in both datasets, all within S2, and were treated as potential scan-level overlaps; four represented longitudinal participant overlap across different examination blocks. The primary volumetric analysis retained all eligible comparisons. Sensitivity analyses of the complete combined maxillary volumetric sample excluded first the shared participant–examination-block comparisons and then, more stringently, all participants shared with the development cohort. The historical reference masks themselves were not used for PARASIDE model training or model selection.
Maxillary volumetric masks were available as combined bilateral regions of interest and were therefore compared at the combined maxillary sinus level. Frontal sinus masks were side-specific but used a standardised historical inferior boundary: during axial manual segmentation, the frontal sinus region was horizontally cropped at the level of the superior border of the ocular globes to obtain a reproducible caudal limit. Frontal masks were therefore interpreted as standardised historical frontal sinus ROIs rather than unrestricted full-volume anatomical frontal sinus masks [15]. All historical manual masks were used in their archived form without retrospective contour correction. For comparison, they were transferred to the PARASIDE reference geometry using nearest-neighbour interpolation. Consequently, local contour irregularities or protrusions may reflect both the original slice-wise annotation procedure and the subsequent geometric harmonisation. All manual and PARASIDE masks were geometrically aligned and compared as three-dimensional volumes. The image plane used for qualitative illustration therefore did not affect the volumetric comparison.
The semantic interpretation of compartment masks was harmonised before analysis. Manual total volume was compared with PARASIDE total volume, manual aerated volume with PARASIDE air volume, and manual-mask-derived opacified volume, calculated as total minus aerated volume, with PARASIDE soft-tissue volume [15]. Volumetric agreement was assessed descriptively using overlap metrics, volume correlations, compartment fractions, and the proportion of PARASIDE-derived volume located outside the corresponding historical manual compartment or total-volume ROI. These analyses were interpreted as volumetric plausibility and continuity assessments, not as definitive anatomical ground-truth comparisons.
2.5. Radiological Short Assessments and Surgery-Related Variables
Brief radiological middle-face assessments performed during standardised SHIP whole-body MRI reading were evaluated as participant-examination-level overview reference variables. These assessments were not dedicated rhinological reviews and were not side-specific sinus annotations. They included broad abnormality, sinusitis-related findings, polyp-related findings, tumour-related findings, and clarification flags. PARASIDE-derived sinus features were aggregated to participant-examination-level to match the granularity of this reference layer. Conditional detail variables were interpreted cautiously and were not treated as prevalence-defining primary outcomes. The radiological short-assessment analysis used a separate PARASIDE-linked examination population and was not restricted to the 3,217 examinations with available structured side-specific sinus ratings.
Surgery-related constructs were analysed exploratorily using two non-equivalent reference sources: side-specific image-rated postoperative morphology from the structured sinus MRI assessments and participant-examination-level self-reported previous sinus surgery from the SHIP questionnaires. Self-reported sinus surgery was defined exclusively by the sinus-operation variable self_sinus_op; reports of external nasal surgery, maxillary lavage, and composite sinonasal-procedure variables were not included in this endpoint. At participant-examination level, image-rated postoperative morphology was defined as at least one positive left or right maxillary sinus side. Neither reference source was treated as ground truth for the other.
PARASIDE-derived maxillary features were screened for associations with both reference constructs. Candidate features described soft-tissue burden, soft-to-air relationships, wall contact, surface involvement, air-compartment shape, and spatial distribution. Side-specific features were analysed directly against image-rated side-level morphology and were additionally aggregated bilaterally for participant-examination-level analyses. An enriched subset of discrepant or morphology-extreme maxillary sides underwent targeted visual re-review. Additional air-contact sensitivity analyses examined whether the postoperative-like signal could be explained by a simple open-air-contact phenotype.
2.6. Validation Endpoints
Primary validation endpoints and their anatomically interpretable markers were defined before outcome modelling according to the expected anatomical relationship between each structured sinus MRI assessment category and the corresponding PARASIDE-derived marker.
First, broad abnormality compared manually healthy sinus sides with abnormal sinus sides. Categories 1–4 were classified as abnormal, category 0 as healthy, and categories , 5, and 6 were excluded. This endpoint was analysed separately for frontal and maxillary sinus sides using soft-tissue fraction as the predefined marker.
Second, basal versus apical maxillary opacification compared category 1 with category 2 in the maxillary sinus. Healthy sides, polyposis, mucocele, trauma or fracture, aplasia/hypoplasia, and technically non-assessable sides were excluded. The predefined marker was the inferior spatial-relation component, with larger values expected to indicate more basal or inferior soft-tissue distribution.
Third, frontal aplasia/hypoplasia plausibility compared category 6 with category 0 in the frontal sinus using total sinus volume. This endpoint was interpreted as an anatomical plausibility analysis rather than as a regression-based diagnostic classification task. Maxillary aplasia/hypoplasia was not emphasised because of the small number of observations.
Secondary analyses evaluated multifeature healthy-versus-abnormal discrimination and robustness of burden-based assessment reproduction. Participant-level leakage-protected out-of-fold radiomics scores were generated for broad abnormality detection and compared with soft-tissue fraction. Additional sensitivity analyses assessed participant-level congruence between PARASIDE-derived burden measures and Lund–Mackay-style aggregate scores, leave-one-block-out transportability between SHIP-START-2 and SHIP-TREND-0, and residualised radiomics-score associations after removing the linear dependence of the out-of-fold radiomics score on soft-tissue fraction.
Historical manual volumetric masks were analysed as a descriptive manual volumetric reference layer. Within abnormal maxillary sinus sides, one-versus-rest analyses assessed separability of basal opacification, apical opacification, and polyposis. The historical maxillary polyposis rating category was additionally analysed in an exploratory boundary analysis comparing category 3 with categories 1 and 2. This analysis was not considered a primary diagnostic classification endpoint because non-contrast T1-weighted MRI and sinus air/soft-tissue compartment features were expected to encode burden, distribution, and coarse morphology more directly than polypoid architecture.
Radiological short assessments were analysed at participant-examination-level using aggregated PARASIDE-derived features. Surgery-related analyses evaluated associations with side-specific image-rated postoperative morphology and participant-level self-reported previous sinus surgery. A targeted enriched re-review subset was used for qualitative plausibility checking of selected historical assessment categories, particularly aplasia/hypoplasia stability, polyposis label ambiguity, and surgery-related morphology. This subset was deliberately enriched and was not considered prevalence-representative.
2.7. Statistical Analysis
Dataset and reference-layer counts were summarised at the participant-examination and sinus-side levels before endpoint-specific exclusions. Demographic variables were summarised at the participant-examination level. Historical side-level rating categories were summarised across all linked sinus-side observations. Additional contextual reference layers were summarised separately: radiological middle-face short assessments were linked at participant-examination level, whereas the historical manual volumetry subset was linked by exact image identity and summarised at the scan and mask-kind levels. Endpoint-specific analysis counts were derived after applying the predefined category inclusions and exclusions. Statistical analyses were performed using Python 3.12.3 (Python Software Foundation, Wilmington, DE, USA), NumPy 2.4.4, pandas 3.0.2, SciPy 1.17.1, scikit-learn 1.8.0, and statsmodels 0.14.6.
Discrimination of predefined predictors was assessed using receiver operating characteristic analysis [17]. For the primary sinus-side-level analyses, AUC confidence intervals were estimated using 2,000 non-parametric observation-level bootstrap samples with percentile limits and a fixed random seed of 42. Because participants could contribute more than one sinus side, these confidence intervals were interpreted descriptively. Sensitivity and specificity were calculated at Youden-derived thresholds [18]. These thresholds summarised discrimination within the epidemiological MRI assessment framework and were not intended as clinical diagnostic cut-offs. The Youden thresholds and their corresponding sensitivity and specificity estimates were derived in the same endpoint-specific datasets and therefore represent apparent in-sample operating characteristics that may be optimistic.
Adjusted associations were estimated using logistic generalised estimating equation models with a logit link, exchangeable working correlation structure, and clustering by participant identifier [19]. Models were adjusted for age, sex, and examination block. Odds ratios were reported per 10-percentage-point increase in soft-tissue fraction or per 1-mm increase in the inferior spatial-relation component. P-values below 0.001 were reported as .
Before cross-validation, radiomics candidates were globally restricted using outcome-independent criteria to rad_ features with at least 60% non-missing observations and at least two distinct values. Five-fold participant-grouped cross-validation was then used to generate out-of-fold multifeature radiomics scores. Sinus sides from the same participant were assigned to the same fold. Within each training fold, candidate features were ranked by oriented univariable training AUC, and the ten highest-ranking features were retained. Median imputation, standardisation, and model fitting were performed using the training fold only and subsequently applied to the held-out fold. Logistic regression used L2 penalisation, a regularisation parameter of 1.0, the liblinear solver, balanced class weighting, and a maximum of 2,000 iterations. No inner cross-validation or hyperparameter optimisation was performed. False-discovery-rate correction was used for univariable feature screening [20]. The out-of-fold radiomics score was interpreted as a leakage-protected multifeature quantitative imaging score rather than as an independent etiological biomarker.
For each broad-abnormality endpoint, the out-of-fold radiomics score was standardised and residualised against soft-tissue fraction using linear regression. The resulting residuals were standardised and entered together with soft-tissue fraction, age, sex, and examination block into participant-clustered GEE models. The residualisation was performed after generation of the out-of-fold scores in the complete endpoint-specific dataset. This residualised-score analysis was performed as an association sensitivity analysis and did not constitute a fully cross-fitted or independently validated prediction model.
For the historical manual volumetric comparison, analyses were restricted to complete paired manual and PARASIDE masks. Spatial overlap was summarised using the Dice similarity coefficient for corresponding binary compartments. Paired volumes and fractions were compared using Pearson and Spearman correlation coefficients. Paired differences were additionally summarised by the mean PARASIDE-minus-manual bias and 95% limits of agreement, calculated as the mean difference ± 1.96 standard deviations of the paired differences [21]. Median absolute and manual-referenced relative differences were reported as complementary descriptive measures. Manual opacified volume was calculated as manual total volume minus manual aerated volume and compared with PARASIDE soft-tissue volume. Outside-manual fractions were calculated relative to the explicitly specified historical manual compartment or total-volume ROI. These analyses were interpreted as method-comparison and anatomical-coverage analyses rather than diagnostic accuracy tests. To assess the potential influence of overlap with the original PARASIDE development cohort, the complete combined maxillary volumetric analysis was repeated in three datasets: all complete paired comparisons, comparisons remaining after exclusion of shared participant–examination-block examinations, and comparisons remaining after exclusion of all participants shared with the development cohort. For each dataset, the number of complete comparisons, median Dice coefficients for total, aerated, and soft-tissue volumes, Pearson correlations for total volume, aerated volume, soft-tissue volume, and soft-tissue fraction, and mean PARASIDE-minus-manual biases were recalculated using the same definitions as in the primary analysis.
For aplasia/hypoplasia, a supplementary threshold analysis applied the previously established PARASIDE near-absence threshold of 70 segmented voxels, corresponding to a total sinus volume of 0.070 mL at isotropic 1-mm voxel spacing [6]. This empirical threshold had matched all seven expert-identified frontal sinus aplasia cases in the original PARASIDE development cohort. In the present study, it was applied without re-estimation to the historical structured aplasia/hypoplasia ratings. Because the historical category was expected to include both aplasia and marked hypoplasia, the analysis was interpreted as anatomical plausibility evidence rather than as a definitive diagnostic rule.
Analyses of radiological short assessments and surgery-related constructs were considered secondary or exploratory. Participant-examination-level radiological analyses used aggregated PARASIDE features to match the granularity of the reference variables. Surgery analyses included the side-level comparison of image-rated postoperative morphology with corresponding side-specific features and participant-examination-level comparisons with image-rated and self-reported reference constructs. Fifteen bilateral maxillary base features were aggregated using the maximum, mean, and sum, yielding 45 candidate variables per participant-level target. Exploratory feature screening included AUC, average precision, group-specific medians and interquartile ranges, Cliff’s delta, Mann–Whitney tests, and Benjamini–Hochberg false-discovery-rate correction within each target. For the ten highest-ranking participant-level features per target, AUC confidence intervals were estimated using 2,000 participant-level bootstrap samples with a fixed random seed of 42. These estimates did not account fully for uncertainty arising from selection among the candidate aggregations and were therefore interpreted as exploratory.
The targeted surgery-related visual re-review comprised 16 deliberately enriched discrepant or morphology-extreme maxillary sides and was interpreted qualitatively. Air-contact sensitivity analyses were performed at side level; contact features were additionally residualised against log-transformed air volume and soft-tissue fraction to assess whether the postoperative-like signal reflected simple air-contact anatomy.
3. Results
3.1. Cohort and Reference-Layer Structure
The linked analysis dataset comprised 3,217 participants and 12,867 maxillary/frontal sinus-side observations after linkage of historical sinus-side MRI ratings with PARASIDE-derived MRI features (Table 1). Of these, 1,135 participants were from SHIP-START-2 and 2,082 from SHIP-TREND-0. The median age was 53 years (IQR, 43–64), and 1,648 participants (51.2%) were female. The dataset contained 6,434 maxillary and 6,433 frontal sinus-side observations.
Additional reference layers were available for contextual, volumetric, and surgery-related validation. Historical manual volumetry comprised 103 linked raw scans, of which 102 had geometrically usable PARASIDE segmentations. Complete paired historical total and aerated-volume masks were available for 95 combined maxillary, 96 left frontal, and 98 right frontal comparisons. Routine radiological middle-face short assessments were available as participant-examination-level contextual reference information. This reference layer used a separate PARASIDE-linked analysis population and was not restricted to examinations with structured side-specific sinus ratings. Surgery-related reference information comprised side-specific image-rated postoperative-morphology fields and participant-level self-reported paranasal sinus surgery; these layers were not treated as interchangeable primary sinus-side endpoints.
Endpoint-specific analysis populations were derived by applying predefined category exclusions to this linked dataset (Supplementary Materials, Table S2). Broad healthy-versus-abnormal analyses used manual categories 0 versus 1–4 and excluded technically unreadable sinus sides, trauma/fracture, and aplasia/hypoplasia categories. Frontal aplasia/hypoplasia analyses separately compared manual category 6 against healthy frontal sinuses.
Analyses were organised according to the granularity and construct represented by each reference layer. The primary reference layer consisted of side-specific structured maxillary and frontal sinus MRI assessments, which were used to test whether predefined PARASIDE-derived markers reproduced categories reflecting soft-tissue burden, vertical topography, and gross anatomy. Additional reference layers included historical volumetric masks, radiological short assessments during whole-body MRI reading, side-specific image-rated postoperative-morphology fields, and participant-level self-reported sinus surgery. The analysis structure, reference-layer granularity, and corresponding PARASIDE-derived readouts are summarised in Figure 1.
3.2. Predefined PARASIDE Markers Reproduced Burden, Topography, and Gross Anatomy
Soft-tissue fraction reproduced broad structured abnormality assessments in both frontal and maxillary sinuses. In the frontal sinus, discrimination of healthy from abnormal sides yielded an AUC of 0.850 (95% CI 0.834–0.866; ; 630 abnormal events), with sensitivity 0.846 and specificity 0.713. In the maxillary sinus, the corresponding AUC was 0.828 (95% CI 0.818–0.839; ; 2,631 abnormal events), with sensitivity 0.718 and specificity 0.795. In adjusted GEE models, each 10-percentage-point increase in soft-tissue fraction was associated with higher odds of an abnormal structured MRI assessment in the maxillary sinus (OR 5.74, 95% CI 5.01–6.57; ) and frontal sinus (OR 2.21, 95% CI 2.00–2.45; ).
The inferior spatial-relation component yielded an AUC of 0.746 (95% CI 0.702–0.789; ; 1,101 basal events) for the left maxillary sinus and 0.782 (95% CI 0.739–0.820; ; 1,088 basal events) for the right maxillary sinus. Higher inferior spatial-relation values were associated with higher odds of basal rather than apical opacification on both sides: left OR 1.28 per 1 mm (95% CI 1.22–1.35; ) and right OR 1.31 per 1 mm (95% CI 1.24–1.39; ).
Frontal aplasia/hypoplasia assessments were strongly congruent with total segmented frontal sinus volume. Total frontal sinus volume discriminated aplasia/hypoplasia assessments from healthy assessments with an AUC of 0.988 (95% CI 0.983–0.992; ; 139 events), with sensitivity 0.986 and specificity 0.947. Application of the previously established PARASIDE near-absence threshold of 0.070 mL identified a highly specific subset: 31 true positives, 14 false positives, 108 false negatives, and 5,244 true negatives; sensitivity 0.223, specificity 0.997, positive predictive value 0.689, and negative predictive value 0.980. Thus, the original aplasia/hypoplasia category was strongly volume-related but broader than a strict near-absence definition. Primary endpoint performance, including marker direction and threshold values used for the reported sensitivity and specificity estimates, is summarised in Figure 2 and Table 2.
3.3. Multifeature Models Supported Robust Burden-Based Assessment Reproduction
The participant-level leakage-protected out-of-fold multifeature models showed higher AUCs than the corresponding single-marker estimates. In the frontal sinus, the out-of-fold multifeature AUC was 0.886, compared with a single-marker estimate of 0.850. In the maxillary sinus, the corresponding values were 0.934 and 0.828, respectively, with average precision increasing from 0.815 to 0.926. Leave-one-block-out analyses showed transportability between SHIP-TREND-0 and SHIP-START-2, with radiomics AUCs of 0.914/0.885 for frontal abnormality and 0.939/0.933 for maxillary abnormality.
The multifeature score supported the robustness of burden-based assessment reproduction, but it did not alter the primary interpretation. Selected features were dominated by burden-correlated volume, surface, and fraction descriptors, and participant-level aggregate-score congruence was strong: mean side-level soft-tissue fraction correlated with the quantitative opacification score (QOS; Spearman’s ), quantitative Lund–Mackay score (QLMS; ), and predicted total Lund–Mackay score (; all ). After residualising the out-of-fold radiomics score against soft-tissue fraction, the residualised score remained associated with abnormal structured MRI assessments in adjusted GEE models for the frontal sinus (OR 2.61, 95% CI 2.29–2.97; ) and maxillary sinus (OR 6.23, 95% CI 5.60–6.93; ). The radiomics score was therefore interpreted as a refined multifeature burden index rather than an independent biological biomarker. Additional sensitivity analyses are provided in Supplementary Materials, Table S3.
3.4. The Historical Polyposis Rating Category Remained an Exploratory Boundary Phenotype
Within abnormal maxillary sinus sides, apical opacification yielded a one-versus-rest AUC of 0.858, basal opacification an AUC of 0.763, and the historical category of maxillary sinus sides rated as polyposis an AUC of 0.574. A dedicated exploratory boundary analysis comparing maxillary sinus sides historically rated as polyposis () with sides rated as basal or apical non-polypoid opacification () yielded weak discrimination across all model families, with AUCs ranging approximately from 0.55 to 0.64. The participant-grouped all-candidate model with fold-wise top-10 feature selection reached an AUC of 0.641, a positive predictive value of 0.067, and a negative predictive value of 0.971. The high negative predictive value primarily reflected the low prevalence of historical polyposis ratings and should not be interpreted as clinically useful exclusion performance.
Single-feature screening also showed only weak discrimination. The best centrality/T1 feature was the 10th percentile of first-order soft-tissue T1 intensity, with AUC 0.611 and FDR-adjusted . True GLCM texture features remained close to chance, with the highest texture-only AUCs observed for GLCM correlation and contrast, both with AUC 0.528. Full exploratory polyposis boundary results are provided in Supplementary Materials, Table S4 and Figure S1; true GLCM texture-only screening is provided in Supplementary Materials, Table S5.
A targeted enriched re-review subset supported the category-specific interpretation. All eight original aplasia assessments were confirmed as aplasia in the new review. In contrast, only one of six original polyposis assessments was confirmed as polyposis, and most newly assigned polyposis assessments had originally been assessed as basal opacification. The subset was therefore used as qualitative plausibility evidence, not as an estimate of population prevalence or diagnostic accuracy. Detailed targeted re-review results are provided in Supplementary Materials, Table S6.
3.5. Historical Manual Volumetry Showed Compartment-Dependent Spatial Overlap, Strong Volume Association, and Systematic Scale Differences
Historical raw scans were linked to 103 SHIP/PARASIDE participant examinations; 102 had geometrically usable PARASIDE segmentations. Complete paired total- and aerated-volume masks were available for 95 combined maxillary, 96 left frontal, and 98 right frontal comparisons.
In the combined maxillary sinus, historical manual volumetry and PARASIDE showed strong spatial overlap for the total and aerated compartments and strong volume association across all evaluated compartments, with systematic scale differences between the historical ROI protocol and the automated compartment definition. For total volume, the median Dice coefficient was 0.852 [0.837; 0.869], with Pearson’s and Spearman’s . PARASIDE volumes were systematically smaller, with a mean PARASIDE-minus-manual bias of mL and 95% limits of agreement from to mL. Aerated-volume overlap was similarly high (median Dice 0.896 [0.882; 0.908]; Pearson’s ; Spearman’s ), with a mean bias of mL.
Derived maxillary soft-tissue volume showed lower spatial overlap but retained strong volume association (median Dice 0.349 [0.202; 0.491]; Pearson’s ; Spearman’s ). Soft-tissue fraction was also strongly associated between methods (Pearson’s ; Spearman’s ), although PARASIDE yielded lower values than the historical manual derivation. These findings indicate that voxel-wise overlap and volumetric association represent complementary but non-interchangeable properties. Bias, limits of agreement, and manual-referenced relative differences are reported in Supplementary Materials, Table S7.
Among the 95 complete combined maxillary comparisons, four shared participant–examination-block examinations, treated as potential scan-level overlaps, and eight participants shared with the original PARASIDE development cohort were represented. Exclusion of the four potential scan-level overlaps () and, more stringently, of all eight shared participants () did not materially change Dice, correlation, or bias estimates (Supplementary Materials, Table S7, Panel F).
For frontal sinus comparisons, the median proportion of PARASIDE total volume outside the historical manual total ROI was 23.4% on the left and 23.7% on the right, consistent with the deliberately cropped inferior boundary of the historical frontal ROI at the superior border of the ocular globes. For the soft-tissue compartment, the median proportions of PARASIDE volume outside the derived historical soft-tissue ROI were 100.0% on the left and 99.6% on the right. However, the historical soft-tissue ROI was calculated as total minus aerated volume within the caudally cropped historical total ROI, whereas PARASIDE soft tissue was defined within the automated full-volume compartment. The two soft-tissue masks were therefore not semantically equivalent, and the near-complete outside fractions were not interpreted as direct estimates of segmentation error. Detailed compartment-specific estimates with explicit reference masks and denominators are reported in Supplementary Materials, Table S7. Representative qualitative examples of maxillary spatial overlap and frontal inferior outside-mask extension are shown in Figure 3. The fraction-level maxillary soft-tissue association is illustrated in Supplementary Materials, Figure S2.
Visual comparison showed substantial correspondence within the main frontal sinus body, but also local medial or central contour extensions in some historical manual masks that were not reproduced by the PARASIDE-derived compartment. These local differences occurred in addition to the protocol-defined caudal limitation of the historical frontal ROI.
3.6. PARASIDE Captured Radiological Short Assessments During Whole-Body MRI Reading
Radiological short assessments of middle-face findings during whole-body MRI reading provided an overview-level participant-examination reference layer rather than a dedicated side-specific rhinological reference standard. Of 3,554 processed radiological middle-face assessment records, 3,392 were linkable to PARASIDE participant-examination rows. Target-specific availability differed because individual radiological short-assessment fields were conditional or missing; the broad middle-face abnormality flag was available for 3,218 participant examinations. This field was positive in 1,692 participant examinations, corresponding to 49.9% of the linked participant-examination denominator. Sinusitis-related ratings were positive in 717 participant examinations, corresponding to 21.1% of the complete linked radiological population and 43.3% of examinations with an available sinusitis-related field. Inflammation-related detail ratings were available mainly as conditional subratings and were therefore interpreted cautiously.
Aggregated PARASIDE-derived sinus features captured the signal of this overview-level radiological appraisal primarily through maxillary and global soft-tissue burden. The broad middle-face abnormality flag was best represented by maxillary soft-tissue volume and related burden features, with discrimination around AUC 0.82. In contrast, inflammation and sinusitis-related detail fields required cautious interpretation: the inflammation field was almost universally positive within the available abnormality subset, whereas the sinusitis-related field behaved as a more specific but less sensitive radiological subrating. These findings indicate that automated quantitative sinus measurements reproduced the main imaging burden underlying brief radiological middle-face assessment, but that this layer was coarser and less anatomically specific than the structured side-specific specialist assessments.
Polyp-related fields in the radiological short assessment showed limited agreement with side-specific specialist polyposis assessments. This supported the interpretation that overview-level radiological polyp fields and structured sinus-side polyposis annotations represented different reference constructs. Results of the radiological short-assessment analyses are summarised in Supplementary Materials, Table S8.
3.7. Surgery-Related Features Aligned More Strongly with Visible Postoperative Morphology than with Self-Reported Surgery
Surgery-related morphology was rare in the side-specific structured MRI assessments. No frontal sinus side was positive for image-rated postoperative morphology, whereas 42 maxillary sinus sides from 24 participant examinations were positive for image-rated postoperative morphology. Among 3,189 participant examinations with both reference sources available, 24 were image-rating positive and 107 had self-reported previous sinus surgery. Twenty examinations were positive in both reference layers, four were image-rating positive but self-report negative, 87 were self-report positive but image-rating negative, and 3,078 were negative in both. Thus, 20 of 24 image-positive examinations (83.3%) were also self-report positive, whereas only 20 of 107 self-report-positive examinations (18.7%) showed visible image-rated postoperative maxillary morphology.
In the side-level feature screen, image-rated postoperative morphology was associated with soft-tissue burden, soft-to-air ratio, wall contact, surface involvement, and altered air-compartment shape, with directional AUCs up to 0.843. At participant-examination level, the bilateral sum of middle-wall contact area showed the strongest association with image-rated postoperative maxillary morphology (directional AUC 0.846, 95% participant-level bootstrap CI 0.787–0.903; average precision 0.046). By comparison, associations with self-reported previous sinus surgery were weaker; the strongest feature was lower mean air-compartment sphericity (directional AUC 0.644, 95% CI 0.589–0.698). PARASIDE-derived features therefore aligned more strongly with currently visible postoperative-like morphology than with the broader self-reported history of previous sinus surgery.
In an enriched targeted re-review of 16 discrepant or morphology-extreme maxillary sides, intervention-related morphology was considered likely in 14 cases, absent in one case, and indeterminate in one case. Because this subset was deliberately enriched, the findings were interpreted qualitatively and not as estimates of diagnostic accuracy. Residualised air-contact features showed only weak discrimination for image-rated postoperative morphology, with a maximum directional AUC of 0.645, substantially below the burden-, wall-contact-, and shape-related signals. The postoperative-like PARASIDE signal was therefore not explained by a simple open-air-contact phenotype. All surgery-related analyses were considered exploratory and were not interpreted as detection of historical surgery. Detailed results are provided in Supplementary Materials, Table S9.
4. Discussion
4.1. Principal Findings
This study evaluated whether automated PARASIDE-derived MRI features can reproduce structured sinus MRI reference layers in a large population-based imaging setting. The main finding was construct-specific reproducibility rather than uniform agreement across all labels. Side-specific assessment categories with direct anatomical correlates were quantitatively reproduced: broad abnormality by soft-tissue fraction, basal versus apical maxillary opacification by the inferior spatial-relation component, and frontal aplasia/hypoplasia by total frontal sinus volume. Historical manual volumetric masks provided a complementary three-dimensional reference layer. Combined maxillary total and aerated compartments showed strong spatial overlap and volume association, whereas derived soft-tissue measures showed lower spatial overlap but retained strong volume association; all comparisons demonstrated systematic scale differences between the historical ROI protocol and the automated compartment definition. PARASIDE-derived aggregate features also captured the main signal of radiological short assessments during whole-body MRI reading. In contrast, the historical category of maxillary sinus sides rated as polyposis remained weakly separable from non-polypoid opacification, and surgery-related morphology aligned better with visible postoperative-like change than with participant-level self-reported surgery.
These findings support a reference-layer view of epidemiological sinus MRI assessment. Manual side-specific categories, historical volumetric segmentations, radiological short assessments, side-specific image-rated postoperative-morphology fields, and questionnaire-based surgery history are informative but do not represent the same target construct. Automated phenotyping should therefore be judged against the granularity and meaning of each reference layer rather than against an undifferentiated concept of manual ground truth.
4.2. Structured Sinus MRI Categories and Quantitative Reproducibility
The strongest reproducibility was observed for structured categories with clear anatomical correlates. The healthy-versus-abnormal endpoint was captured well by soft-tissue fraction in both maxillary and frontal sinuses, consistent with an assessment framework primarily based on visible opacification, mucosal thickening, or sinus content abnormality. The adjusted GEE models showed that this relationship was not explained by age, sex, or examination block. However, this endpoint remains an imaging-defined abnormality construct and should not be interpreted as clinical CRS, which requires symptoms and appropriate clinical or endoscopic context [4,5].
Basal versus apical maxillary opacification was reproduced by the inferior spatial-relation component. This shows that automated features can capture not only global opacification burden but also the spatial distribution of soft tissue within the sinus compartment. Such spatially resolved phenotypes may be useful for future analyses of drainage-related disease patterns, localised mucosal reactions, postoperative anatomy, or compartment-specific inflammatory burden.
Frontal aplasia/hypoplasia showed the clearest anatomical relationship, with near-complete separation from healthy frontal sinuses by total sinus volume. The strict near-absence threshold identified only a highly specific subset, indicating that the historical assessment category likely combined true aplasia with marked hypoplasia. Quantitative thresholds can therefore clarify the anatomical content of historical categories, but they do not necessarily replace the broader semantic meaning of the original assessment.
4.3. Radiomics Robustness and the Polyposis Boundary
The multifeature radiomics analyses strengthened the broad abnormality endpoint but did not change the primary interpretation. Cross-cohort analyses showed that radiomics and soft-tissue fraction transported between SHIP-START-2 and SHIP-TREND-0, supporting robustness across the two non-overlapping SHIP cohorts. Residualised radiomics analyses indicated that the out-of-fold score retained information beyond linear soft-tissue fraction alone. Nevertheless, because the score was generated from related segmentation-derived features dominated by volume, surface, and fraction descriptors, it should be interpreted as a refined multifeature imaging predictor rather than as an independent biological or etiological biomarker.
This differs from clinical AI-based sinus CT studies that primarily aim to reproduce or improve visual CT scoring and relate automated opacification measures to clinical outcomes [7,8]. In the present population-MRI setting, radiomics was used to test whether the automated feature space added robust quantitative information beyond predefined burden markers, not to create a standalone diagnostic classifier.
The historical maxillary polyposis rating category defined the clearest boundary of reliable automated interpretation in the present feature space. Despite radiomics, morphology, centrality, first-order T1 intensity, and true grey-level co-occurrence matrix texture features, maxillary sinus sides historically rated as polyposis remained only weakly separable from sides rated as basal or apical non-polypoid opacification. This is consistent with the clinical concept that nasal polyps are not defined by sinus opacification burden alone, but by nasal-cavity findings, endoscopy, and clinical context [4,5]. The available reference data did not include dedicated ethmoid or nasal-cavity assessments, although these regions are central to the clinical and endoscopic characterisation of nasal polyposis. The targeted re-review supported this interpretation by showing stable aplasia/hypoplasia assessments but marked instability of historical polyposis ratings. The historical polyposis rating category should therefore not be treated as a definitive automated classification endpoint using non-contrast T1 sinus-compartment features alone.
4.4. Historical Manual Volumetry as a Complementary Reference Layer
The historical manual volumetric masks addressed a different validation question from the categorical side-level ratings. Structured side-specific ratings tested whether semantic assessment categories could be reproduced by predefined quantitative features, whereas the volumetric mask comparison tested whether PARASIDE-derived compartments were spatially and volumetrically consistent with historical manual sinus definitions. This distinction is important because manual masks represent explicit anatomical regions and compartments, whereas categorical ratings represent higher-level assessment decisions.
In the combined maxillary sinus, the comparison supported continuity between time-intensive manual volumetry and scalable automated PARASIDE-derived compartment phenotyping, particularly for total and aerated sinus compartments. Derived soft-tissue measures showed lower spatial overlap but retained strong volume association, indicating that voxel-wise overlap and volumetric association should be interpreted as complementary rather than interchangeable agreement measures. Bland–Altman agreement analysis further indicated systematic scale differences between the historical ROI protocol and the automated compartment definition. The two approaches should therefore be interpreted as closely related but not interchangeable measurement protocols.
The frontal sinus comparison illustrated the importance of operational reference definitions. The historical manual protocol used a standardised inferior boundary at the superior border of the ocular globes, whereas PARASIDE applies an automated full-volume compartment definition across the available frontal sinus anatomy. The observed total-volume outside-mask fractions therefore primarily reflect differences in anatomical reference definition, especially in inferior or drainage-related frontal regions, rather than simple segmentation failure. The near-complete outside fractions observed for frontal soft tissue represent a more pronounced manifestation of the same non-equivalence: the historical soft-tissue ROI was a derived compartment constrained by the cropped manual total ROI, whereas PARASIDE soft tissue was defined within the automated full-volume compartment. These values should therefore be interpreted as evidence of differing compartment definitions rather than as direct measures of segmentation error.
The frontal comparison was additionally affected by differences in annotation procedure. The archived historical masks were generated by slice-wise manual contouring according to a standardised ROI protocol, whereas PARASIDE delineated a three-dimensional automated sinus compartment. Some historical masks contained local medial or central contour extensions that did not correspond to the PARASIDE boundary. Such discrepancies may reflect historical inclusion conventions, partial-volume handling, slice-wise contouring, and resampling to a common geometry. The observed disagreement should therefore not be attributed exclusively to automated segmentation error.
This segmentation comparison adds an important layer to the manuscript. It shows that PARASIDE can reproduce key constructs of historical manual three-dimensional volumetry while also defining where automated full-volume segmentation and historical manual ROI definitions diverge. For future cohort analyses, this divergence may be useful rather than problematic, provided that anatomical definitions are reported transparently and interpreted as imaging phenotypes rather than interchangeable ground-truth masks.
4.5. Surgery-Related Constructs and Non-Equivalent Reference Information
Surgery-related analyses further demonstrated the importance of reference-layer granularity. Twenty of 24 participant examinations with visible image-rated postoperative maxillary morphology were also positive for self-reported surgery, whereas only 20 of 107 self-report-positive examinations showed visible postoperative maxillary morphology. Image-rated morphology therefore represented a narrower, morphologically defined subset of the broader self-reported surgery construct.
This asymmetry is plausible because questionnaire data do not encode side, procedure type, anatomical region, extent, timing, or persistence of visible postoperative change. Self-report may also include minor procedures, puncture or lavage, remote interventions, or operations affecting regions not represented by the maxillary image-rating field. Conversely, the image-based reference recorded only morphology considered visible on the available T1-weighted MRI.
PARASIDE-derived features showed stronger associations with visible postoperative-like morphology than with self-reported surgery, particularly for wall contact, soft-tissue burden, soft-to-air relationships, and altered air-compartment shape. However, the low prevalence of the image-rated endpoint and the low average precision of the exploratory feature screen preclude interpretation as a clinical prediction model. The targeted visual review was deliberately enriched, and the air-contact sensitivity analysis only showed that the stronger morphology signal was not explained by a simple open-air-contact feature. PARASIDE-derived postoperative-like features should therefore be interpreted as quantitative markers of visible complex maxillary morphology, not as standalone determinants of historical surgery.
4.6. Strengths and Limitations
Strengths of this study include the large population-based MRI dataset, side-level maxillary and frontal sinus assessments, predefined anatomically interpretable primary markers, participant-level leakage protection for multifeature analyses, and adjusted GEE models accounting for within-participant correlation. The study also integrated multiple reference layers rather than treating manual assessment as a single homogeneous ground truth, allowing direct comparison of structured side-specific categories, historical manual volumetry, participant-level radiological short assessments, image-based postoperative morphology, and self-reported surgery history.
Several limitations need to be considered. The original structured sinus MRI assessments were historical single-reader epidemiological assessments, and complete inter-rater reliability estimates were not available. The imaging protocol used non-contrast T1-weighted population MRI rather than dedicated sinonasal MRI, CT, or endoscopy. Symptoms, endoscopic findings, surgical details, and longitudinal clinical information were not part of the reference framework. Only maxillary and frontal sinus assessments were available; dedicated ethmoid and nasal-cavity reference assessments were absent, limiting the evaluation of polyposis-related morphology. Rare categories require cautious interpretation, particularly maxillary aplasia/hypoplasia, surgery-related morphology, and polyposis. The targeted re-review subset was deliberately enriched and was not prevalence-representative. The participant-level surgery feature screening was exploratory, and candidate aggregation and performance estimation were performed in the same dataset; the bootstrap confidence intervals therefore did not fully account for feature-selection uncertainty. The primary sinus-side AUC confidence intervals were based on observation-level rather than participant-clustered bootstrap resampling and were interpreted descriptively. Surgery-related image ratings and self-reported surgery represented non-equivalent reference constructs, neither of which constituted a definitive surgical ground truth. The historical volumetric masks were manual annotations with their own operational definitions, and the combined bilateral maxillary masks did not allow side-specific maxillary volumetric comparison without an additional post hoc splitting step. Finally, PARASIDE-derived features should be interpreted as quantitative imaging phenotypes rather than clinical diagnoses. Because the PARASIDE development cohort and the present evaluation cohort originated from the same longitudinal SHIP imaging population, the study was not a fully external image-level validation. However, the reference annotations and assessment variables evaluated here were not used for PARASIDE training, model selection, or feature definition. For the historical volumetric comparison, exclusion of potential scan-level and participant-level overlap did not materially alter Dice, correlation, or bias estimates.
4.7. Implications for Automated Population Imaging
The results support automated sinus MRI phenotyping as a scalable approach for epidemiological imaging cohorts. The main value is not replacement of expert clinical interpretation in individual patients, but translation of time-consuming manual review and manual volumetry into reproducible quantitative imaging phenotypes. PARASIDE-derived variables such as sinus volume, air volume, soft-tissue fraction, spatial opacification pattern, wall contact, and morphology-related descriptors can be applied uniformly across participants, examination blocks, and future cohort waves.
At the same time, automated phenotyping should not convert every historical assessment field into a clinical diagnosis. Incidental paranasal sinus opacification is common in population imaging and can be difficult to interpret without symptoms or endoscopy [3]. CRS and CRSwNP remain clinical entities requiring symptom criteria and objective evidence of inflammation, and nasal polyps are not defined by sinus opacification burden alone [4,5]. PARASIDE is therefore most useful where the target construct is anatomically measurable: sinus size, air and soft-tissue compartments, opacification burden, spatial distribution, and selected morphology-related patterns. More ambiguous constructs, including polyposis and historical surgery status, require dedicated clinical, endoscopic, surgical, or multimodal reference standards before being used as definitive automated classification targets.
Future work should extend this framework to nasal-cavity structures, T2-weighted MRI, CT, endoscopic or surgical reference standards, symptom data, biomarkers, and longitudinal outcomes. Such multimodal validation will be particularly important for phenotypes such as polyposis and postoperative anatomy, where sinus-compartment burden alone is insufficient.
5. Conclusions
PARASIDE-derived quantitative MRI features reproduced structured epidemiological sinus MRI assessment categories when these reflected soft-tissue burden, vertical topography, or gross anatomy. Broad abnormality, basal versus apical maxillary opacification, and frontal aplasia/hypoplasia were therefore well represented by predefined interpretable imaging markers. Historical volumetric masks provided a complementary manual three-dimensional reference layer: combined maxillary total and aerated compartments showed strong spatial overlap and volume association with PARASIDE, whereas derived soft-tissue measures showed lower spatial overlap but retained strong volume association. Bias and limits-of-agreement metrics demonstrated systematic scale differences between the historical ROI protocol and the automated compartment definition. Frontal sinus mask comparisons further reflected differences between manually standardised frontal ROIs and automated full-volume segmentation.
In contrast, the historical maxillary polyposis rating category and surgery-related constructs remained limited by morphology-specific or non-equivalent reference information. Maxillary sinus sides historically rated as polyposis were weakly separable from sides rated as non-polypoid opacification using non-contrast T1 sinus-compartment features alone, and PARASIDE-derived features aligned more closely with visible postoperative-like maxillary morphology than with participant-reported previous surgery and should not be interpreted as standalone determinants of surgical history. These findings support PARASIDE as a scalable tool for quantitative sinonasal MRI phenotyping in population cohorts while defining the reference-layer-specific limits of automated interpretation. PARASIDE-derived features should therefore be interpreted as reproducible quantitative imaging phenotypes rather than as standalone clinical diagnoses.
Supplementary Materials
The following supporting information can be downloaded at the website of this paper posted on Preprints.org, Table S1: Harmonised structured MRI assessment categories; Table S2: Endpoint-specific analysis counts; Table S3: Additional construct, transportability, and residualised-model sensitivity analyses; Table S4: Exploratory maxillary polyposis boundary model performance; Table S5: True GLCM texture-only feature screening for maxillary polyposis; Table S6: Targeted re-review subset; Table S7: Historical volumetric mask comparisons; Table S8: Radiological short-assessment analyses; Table S9: Surgery-related reference-layer analyses, including image-rated morphology, self-reported surgery, targeted re-review, and air-contact sensitivity analyses; Figure S1: Exploratory boundary analysis of the historical maxillary polyposis rating category; Figure S2: Quantitative association between historical manual volumetry and automated PARASIDE-derived maxillary soft-tissue fraction.
Author Contributions
Conceptualization, F.P. and A.G.B.; Methodology, F.P. and M.B.; Software, H.M. and F.P.; Validation, F.P. and M.B.; Formal Analysis, F.P.; Investigation, F.P.; Resources, L.S. and T.I.; Data Curation, F.P., M.B., L.S. and T.I.; Writing–Original Draft Preparation, F.P.; Writing–Review and Editing, B.F., H.M., V.W., L.S., T.I., C.-J.B., C.S., M.B. and A.G.B.; Visualization, F.P.; Supervision, C.S. and A.G.B. All authors have read and agreed to the published version of the manuscript.
Funding
This research was funded by the Deutsche Forschungsgemeinschaft (DFG, German Research Foundation), project number 493623784, and the Gerhard Domagk Nachwuchsförderprogramm (Clinician Scientist Program Rural_Age support to F.P. and V.W.). The Study of Health in Pomerania is part of the Community Medicine Research Network of University Medicine Greifswald, supported by the German Federal Ministry of Education and Research, the Ministry of Cultural Affairs of the State of Mecklenburg–Western Pomerania, and the Greifswald Approach to Individualized Medicine (GANI_MED) network. The article processing charge was funded by the Department of Otorhinolaryngology, Head and Neck Surgery, University Medicine Greifswald.
Institutional Review Board Statement
The study was conducted in accordance with the Declaration of Helsinki and approved by the Ethics Committee of University Medicine Greifswald (SHIP-TREND-0: protocol code BB 39/08, approved on 19 June 2008; SHIP-START-2: protocol code BB 80/09, approved on 2 October 2009).
Informed Consent Statement
Informed consent was obtained from all subjects involved in the study. The manuscript does not contain identifiable individual-level participant information.
Data Availability Statement
Restrictions apply to the availability of the data used in this study. The data were obtained from the Study of Health in Pomerania and are available through the formal SHIP data-use and access procedure, subject to approval by the responsible SHIP data committee and applicable data-use agreements. The PARASIDE source code and released model weights are publicly available at https://github.com/Hendrik-code/paraside under the Apache License 2.0. The SHIP-specific statistical analysis code depends on protected SHIP data structures and participant-level variables and is not publicly released; access may be considered by the corresponding author subject to SHIP data-governance requirements.
Acknowledgments
The authors thank the Study of Health in Pomerania research team and participants for their valuable contributions. During preparation of this manuscript, the authors used ChatGPT (OpenAI) for linguistic revision, formatting support, editorial refinement, and consistency checks of author-generated text. The tool was not used to generate study data or perform statistical analyses. The authors reviewed and edited all outputs and take full responsibility for the content of this publication.
Conflicts of Interest
C.-J.B. declares consulting fees, lecture honoraria, travel support, and advisory-board participation from AstraZeneca, GSK, and Sanofi-Aventis. F.P. reports honoraria from AstraZeneca for recorded educational videos and non-financial support from Stryker and Cochlear for educational course attendance, outside the submitted work. The remaining authors declare no conflicts of interest. The funders had no role in the design of the study; in the collection, analyses, or interpretation of data; in the writing of the manuscript; or in the decision to publish the results.
Abbreviations
The following abbreviations are used in this manuscript:
| AI | Artificial intelligence |
| AP | Average precision |
| AUC | Area under the receiver operating characteristic curve |
| CI | Confidence interval |
| CRS | Chronic rhinosinusitis |
| CRSwNP | Chronic rhinosinusitis with nasal polyps |
| CT | Computed tomography |
| CV | Cross-validation |
| FDR | False-discovery rate |
| GEE | Generalised estimating equations |
| GLCM | Grey-level co-occurrence matrix |
| IQR | Interquartile range |
| MRI | Magnetic resonance imaging |
| NPV | Negative predictive value |
| OOF | Out-of-fold |
| OR | Odds ratio |
| PPV | Positive predictive value |
| QLMS | Quantitative Lund–Mackay score |
| QOS | Quantitative opacification score |
| ROC | Receiver operating characteristic |
| ROI | Region of interest |
| S2 | SHIP-START second follow-up |
| SHIP | Study of Health in Pomerania |
| T0 | SHIP-TREND baseline |
References
- Gregurić, T.; Prokopakis, E.P.; Vlastos, I.; Doulaptsi, M.; Cingi, C.; Košec, A.; Zadravec, D.; Kalogjera, L. Imaging in chronic rhinosinusitis: A systematic review of MRI and CT diagnostic accuracy and reliability in severity staging. J. Neuroradiol. 2021, 48, 277–281. [Google Scholar] [CrossRef] [PubMed]
- Parker, M.; Beyea, S.; Rioux, J.; King, B.; Abdolell, M.; Reeve, S.; Lieuwen, B.; Bowen, C.; Volders, D. 0.5T MRI as a competitor to CT for sinus imaging. Sci. Rep. 2024, 14, 31774. [Google Scholar] [CrossRef] [PubMed]
- Hansen, A.G.; Helvik, A.S.; Thorstensen, W.M.; Nordgård, S.; Langhammer, A.; Bugten, V.; Stovner, L.J.; Eggesbø, H.B. Paranasal sinus opacification at MRI in lower airway disease (the HUNT study-MRI). Eur. Arch. Oto-Rhino-Laryngol. 2016, 273, 1761–1768. [Google Scholar] [CrossRef] [PubMed]
- Fokkens, W.J.; Lund, V.J.; Hopkins, C.; Hellings, P.W.; Kern, R.; Reitsma, S.; Toppila-Salmi, S.; Bernal-Sprekelsen, M.; Mullol, J.; Alobid, I.; et al. European Position Paper on Rhinosinusitis and Nasal Polyps 2020. Rhinology 2020, 58, 1–464. [Google Scholar] [CrossRef] [PubMed]
- Orlandi, R.R.; Kingdom, T.T.; Smith, T.L.; Bleier, B.; DeConde, A.; Luong, A.U.; Poetker, D.M.; Soler, Z.M.; Welch, K.C.; Wise, S.K.; et al. International consensus statement on allergy and rhinology: rhinosinusitis 2021. Int. Forum Allergy Rhinol. 2021, 11, 213–739. [Google Scholar] [CrossRef] [PubMed]
- Möller, H.; Krautschick, L.; Graf, R.; Atad, M.; Busch, C.J.; Beule, A.G.; Scharf, C.; Kaderali, L.; Menze, B.; Rueckert, D.; et al. PARASIDE: An automatic paranasal sinus segmentation and structure analysis tool for magnetic resonance imaging. Comput. Biol. Med. 2026, 204, 111511. [Google Scholar] [CrossRef] [PubMed]
- Shen, Z.; Wei, Y.; Liu, K.; Ma, Z.; Zhang, Z.; Wang, X.; Li, Y.; Shi, F.; Ding, Z. Deep Learning-Derived Quantitative Scores for Chronic Rhinosinusitis Assessment: Correlation With Quality of Life Outcomes. Am. J. Rhinol. Allergy 2025, 39, 187–196. [Google Scholar] [CrossRef] [PubMed]
- Massey, C.J.; Humphries, S.M.; Mace, J.C.; Smith, T.L.; Soler, Z.M.; Ramakrishnan, V.R. Multi-institutional validation of an AI-based sinus CT analytic platform with olfactory assessments. Int. Forum Allergy Rhinol. 2024, 14, 1806–1809. [Google Scholar] [CrossRef] [PubMed]
- Zwanenburg, A.; Vallières, M.; Abdalah, M.A.; Aerts, H.J.W.L.; Andrearczyk, V.; Apte, A.; Ashrafinia, S.; Bakas, S.; Beukinga, R.J.; Boellaard, R.; et al. The Image Biomarker Standardisation Initiative: Standardized quantitative radiomics for high-throughput image-based phenotyping. Radiology 2020, 295, 328–338. [Google Scholar] [CrossRef] [PubMed]
- van Griethuysen, J.J.M.; Fedorov, A.; Parmar, C.; Hosny, A.; Aucoin, N.; Narayan, V.; Beets-Tan, R.G.H.; Fillion-Robin, J.C.; Pieper, S.; Aerts, H.J.W.L. Computational Radiomics System to Decode the Radiographic Phenotype. Cancer Res. 2017, 77, e104–e107. [Google Scholar] [CrossRef] [PubMed]
- Haralick, R.M.; Shanmugam, K.; Dinstein, I. Textural features for image classification. IEEE Trans. Syst. Man. Cybern. 1973, SMC-3, 610–621. [Google Scholar] [CrossRef]
- Isensee, F.; Jaeger, P.F.; Kohl, S.A.A.; Petersen, J.; Maier-Hein, K.H. nnU-Net: A self-configuring method for deep learning-based biomedical image segmentation. Nat. Methods 2021, 18, 203–211. [Google Scholar] [CrossRef] [PubMed]
- Völzke, H.; Alte, D.; Schmidt, C.O.; Radke, D.; Lorbeer, R.; Friedrich, N.; Aumann, N.; Lau, K.; Piontek, M.; Born, G.; et al. Cohort Profile: The Study of Health in Pomerania. Int. J. Epidemiol. 2011, 40, 294–307. [Google Scholar] [CrossRef] [PubMed]
- Völzke, H.; Schössow, J.; Schmidt, C.O.; Jürgens, C.; Richter, A.; Werner, A.; Werner, N.; Radke, D.; Teumer, A.; Ittermann, T.; et al. Cohort Profile Update: The Study of Health in Pomerania (SHIP). Int. J. Epidemiol. 2022, 51, e372–e383. [Google Scholar] [CrossRef] [PubMed]
- Schneider, L. Geschlechtsspezifische Prävalenz und Charakteristika von Verschattungen der Nasennebenhöhlen im MRT – Sinus maxillaris versus Sinus frontalis. Doctoral thesis, Published in the Greifswald University Repository. University Medicine Greifswald / University of Greifswald, Greifswald, Germany, 2017. [Google Scholar]
- Ritter, F.; Boskamp, T.; Homeyer, A.; Laue, H.; Schwier, M.; Link, F.; Peitgen, H.O. Medical image analysis: A visual approach. IEEE Pulse 2011, 2, 60–70. [Google Scholar] [CrossRef] [PubMed]
- Hanley, J.A.; McNeil, B.J. The meaning and use of the area under a receiver operating characteristic curve. Radiology 1982, 143, 29–36. [Google Scholar] [CrossRef] [PubMed]
- Youden, W.J. Index for rating diagnostic tests. Cancer 1950, 3, 32–35. [Google Scholar] [CrossRef]
- Liang, K.Y.; Zeger, S.L. Longitudinal data analysis using generalized linear models. Biometrika 1986, 73, 13–22. [Google Scholar] [CrossRef]
- Benjamini, Y.; Hochberg, Y. Controlling the false discovery rate: A practical and powerful approach to multiple testing. J. R. Stat. Soc. Ser. B 1995, 57, 289–300. [Google Scholar] [CrossRef]
- Bland, J.M.; Altman, D.G. Statistical Methods for Assessing Agreement between Two Methods of Clinical Measurement. The Lancet 1986, 327, 307–310. [Google Scholar] [CrossRef]
Figure 1.
Reference-layer validation framework. The figure summarises the analysis blocks, reference layers, and corresponding PARASIDE-derived quantitative readouts used in this study. Structured sinus-side MRI assessments provided the basis for the primary predefined marker analyses, multifeature burden analyses, and the maxillary polyposis boundary analysis. Historical volumetric masks were analysed as a separate manual volumetric reference layer. Radiological short assessments during whole-body MRI reading and surgery-related information from side-specific image-rated postoperative-morphology fields and participant self-report were treated as additional reference layers with distinct granularity and target constructs. GLCM, grey-level co-occurrence matrix; MRI, magnetic resonance imaging.
Figure 1.
Reference-layer validation framework. The figure summarises the analysis blocks, reference layers, and corresponding PARASIDE-derived quantitative readouts used in this study. Structured sinus-side MRI assessments provided the basis for the primary predefined marker analyses, multifeature burden analyses, and the maxillary polyposis boundary analysis. Historical volumetric masks were analysed as a separate manual volumetric reference layer. Radiological short assessments during whole-body MRI reading and surgery-related information from side-specific image-rated postoperative-morphology fields and participant self-report were treated as additional reference layers with distinct granularity and target constructs. GLCM, grey-level co-occurrence matrix; MRI, magnetic resonance imaging.
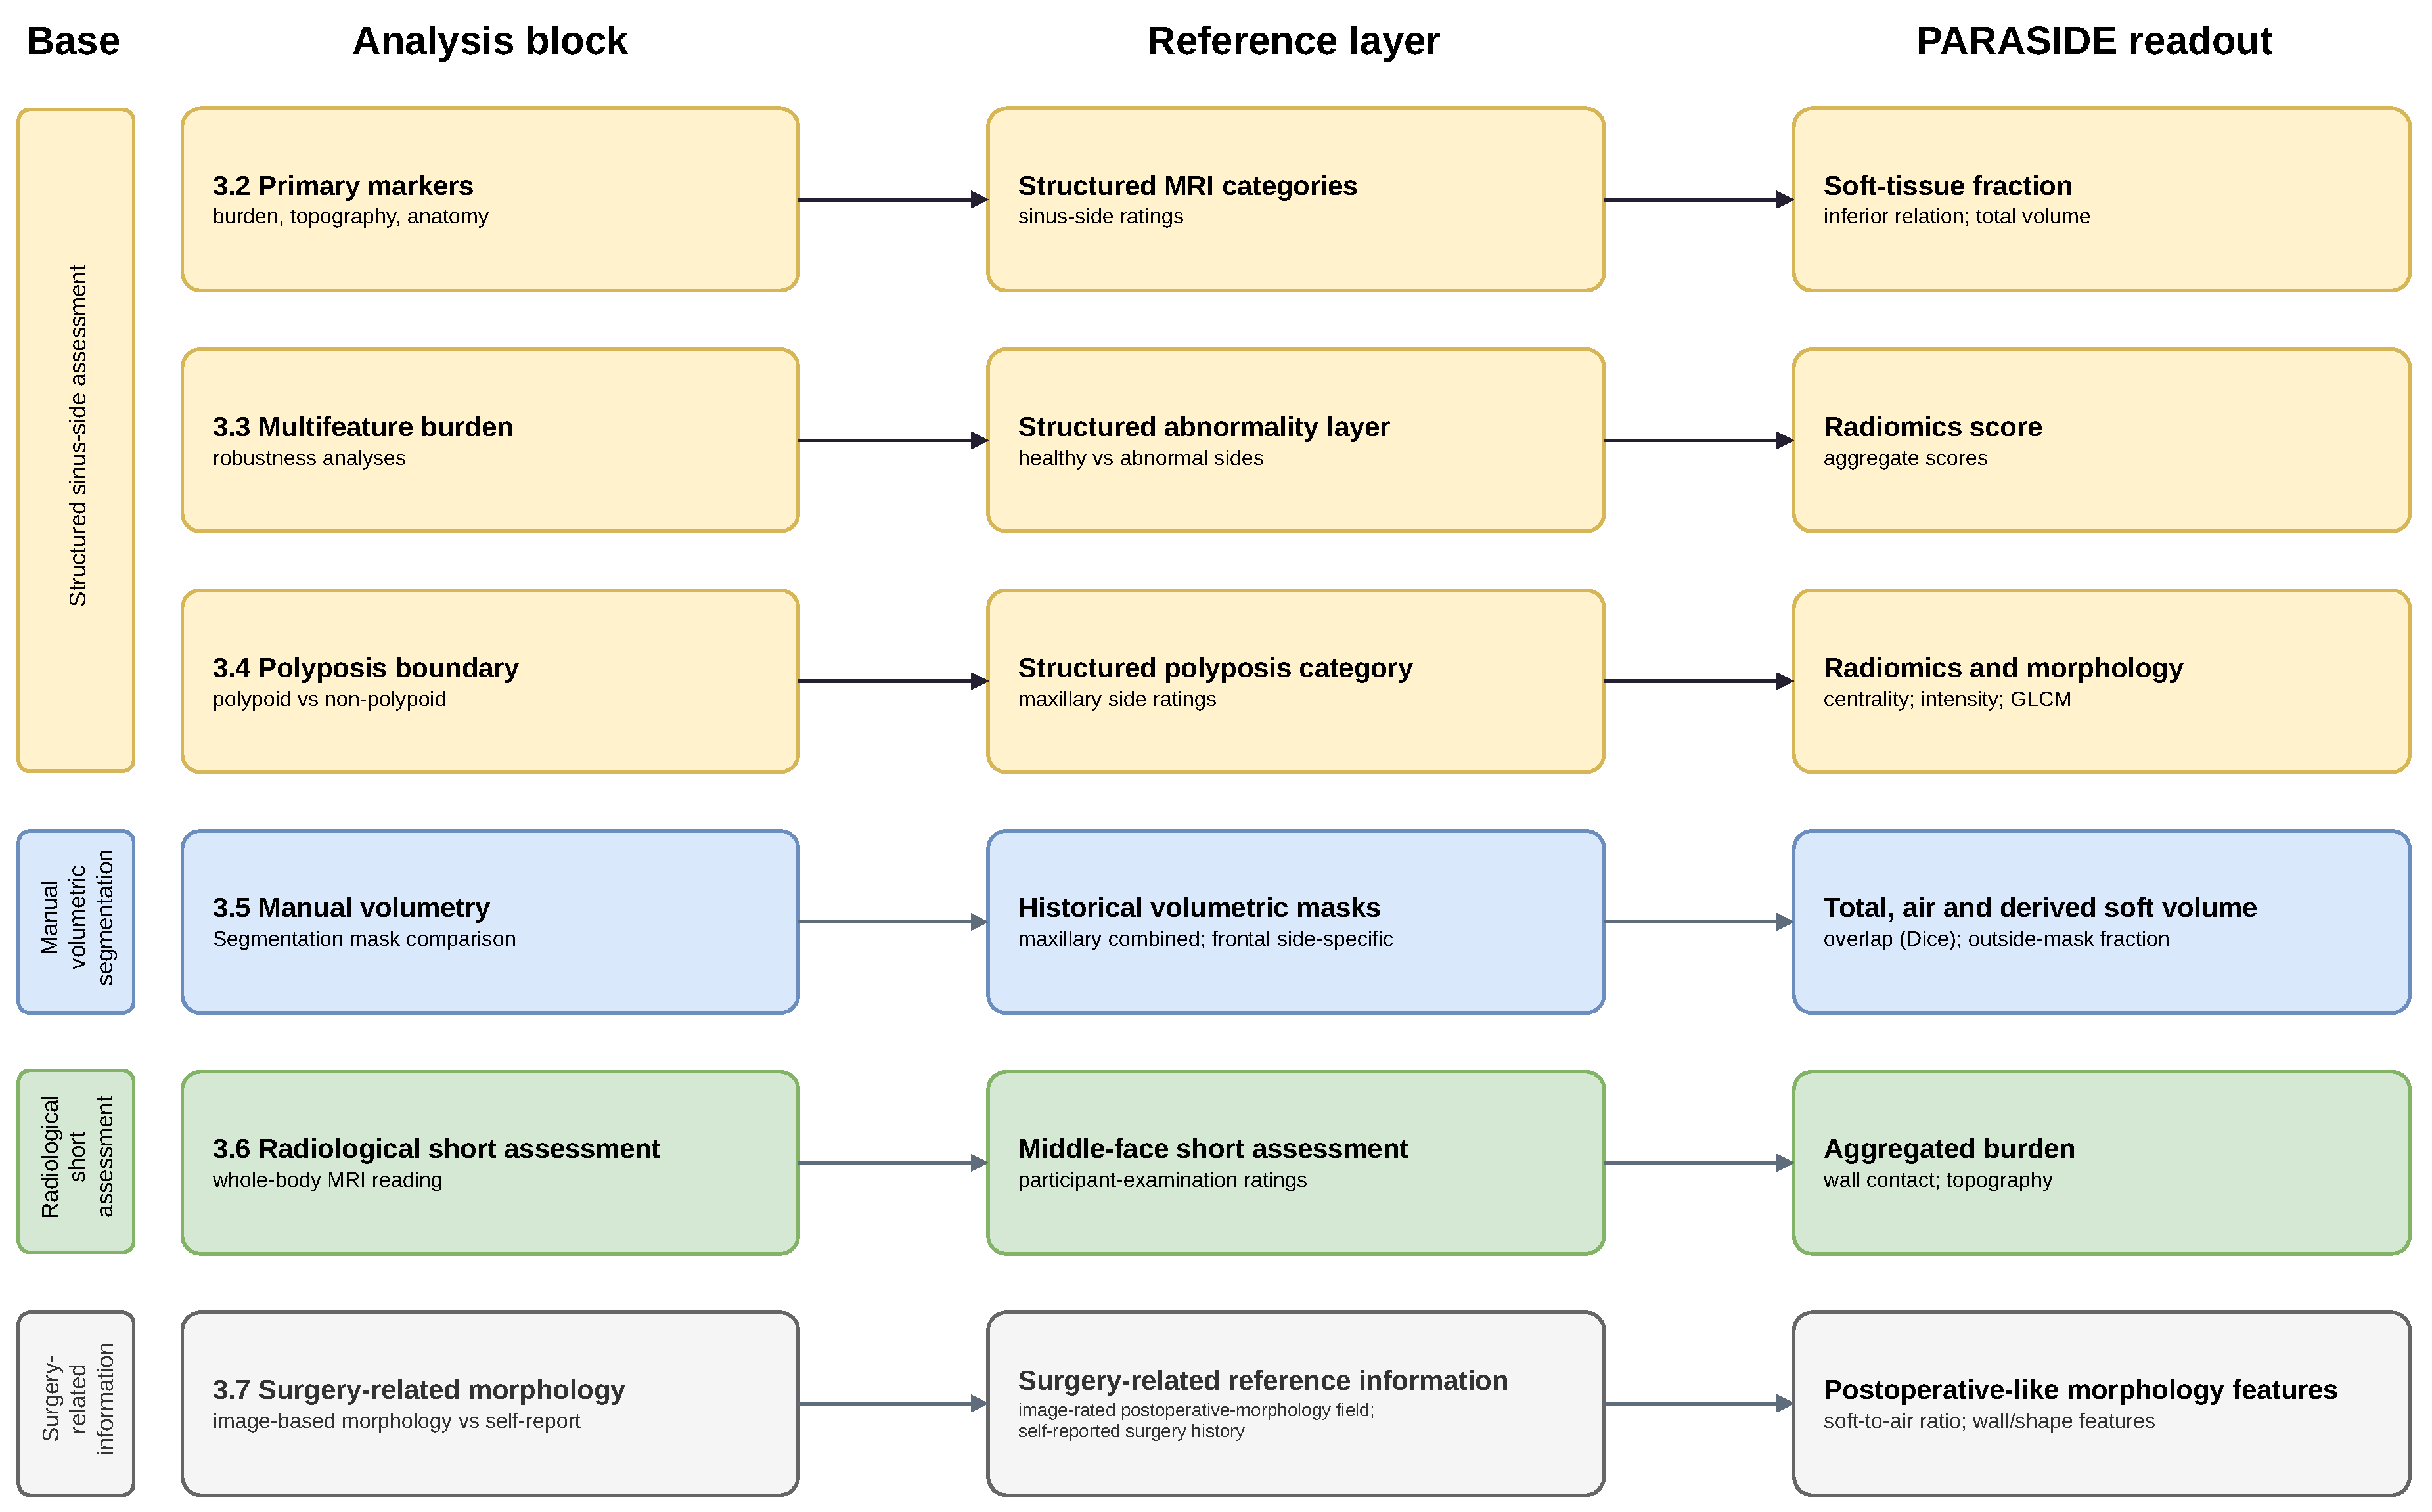
Figure 2.
Discrimination of predefined PARASIDE-derived markers for structured epidemiological sinus MRI assessment categories. Points show AUC estimates and horizontal lines indicate 95% confidence intervals. Colours denote the predefined feature families of burden, topography, and gross anatomy. Burden-based abnormality endpoints were assessed using soft-tissue fraction, topographic basal-versus-apical maxillary endpoints using the inferior spatial-relation component, and frontal aplasia/hypoplasia plausibility using total sinus volume. The dashed vertical line denotes an AUC of 0.50. AUC, area under the receiver operating characteristic curve.
Figure 2.
Discrimination of predefined PARASIDE-derived markers for structured epidemiological sinus MRI assessment categories. Points show AUC estimates and horizontal lines indicate 95% confidence intervals. Colours denote the predefined feature families of burden, topography, and gross anatomy. Burden-based abnormality endpoints were assessed using soft-tissue fraction, topographic basal-versus-apical maxillary endpoints using the inferior spatial-relation component, and frontal aplasia/hypoplasia plausibility using total sinus volume. The dashed vertical line denotes an AUC of 0.50. AUC, area under the receiver operating characteristic curve.
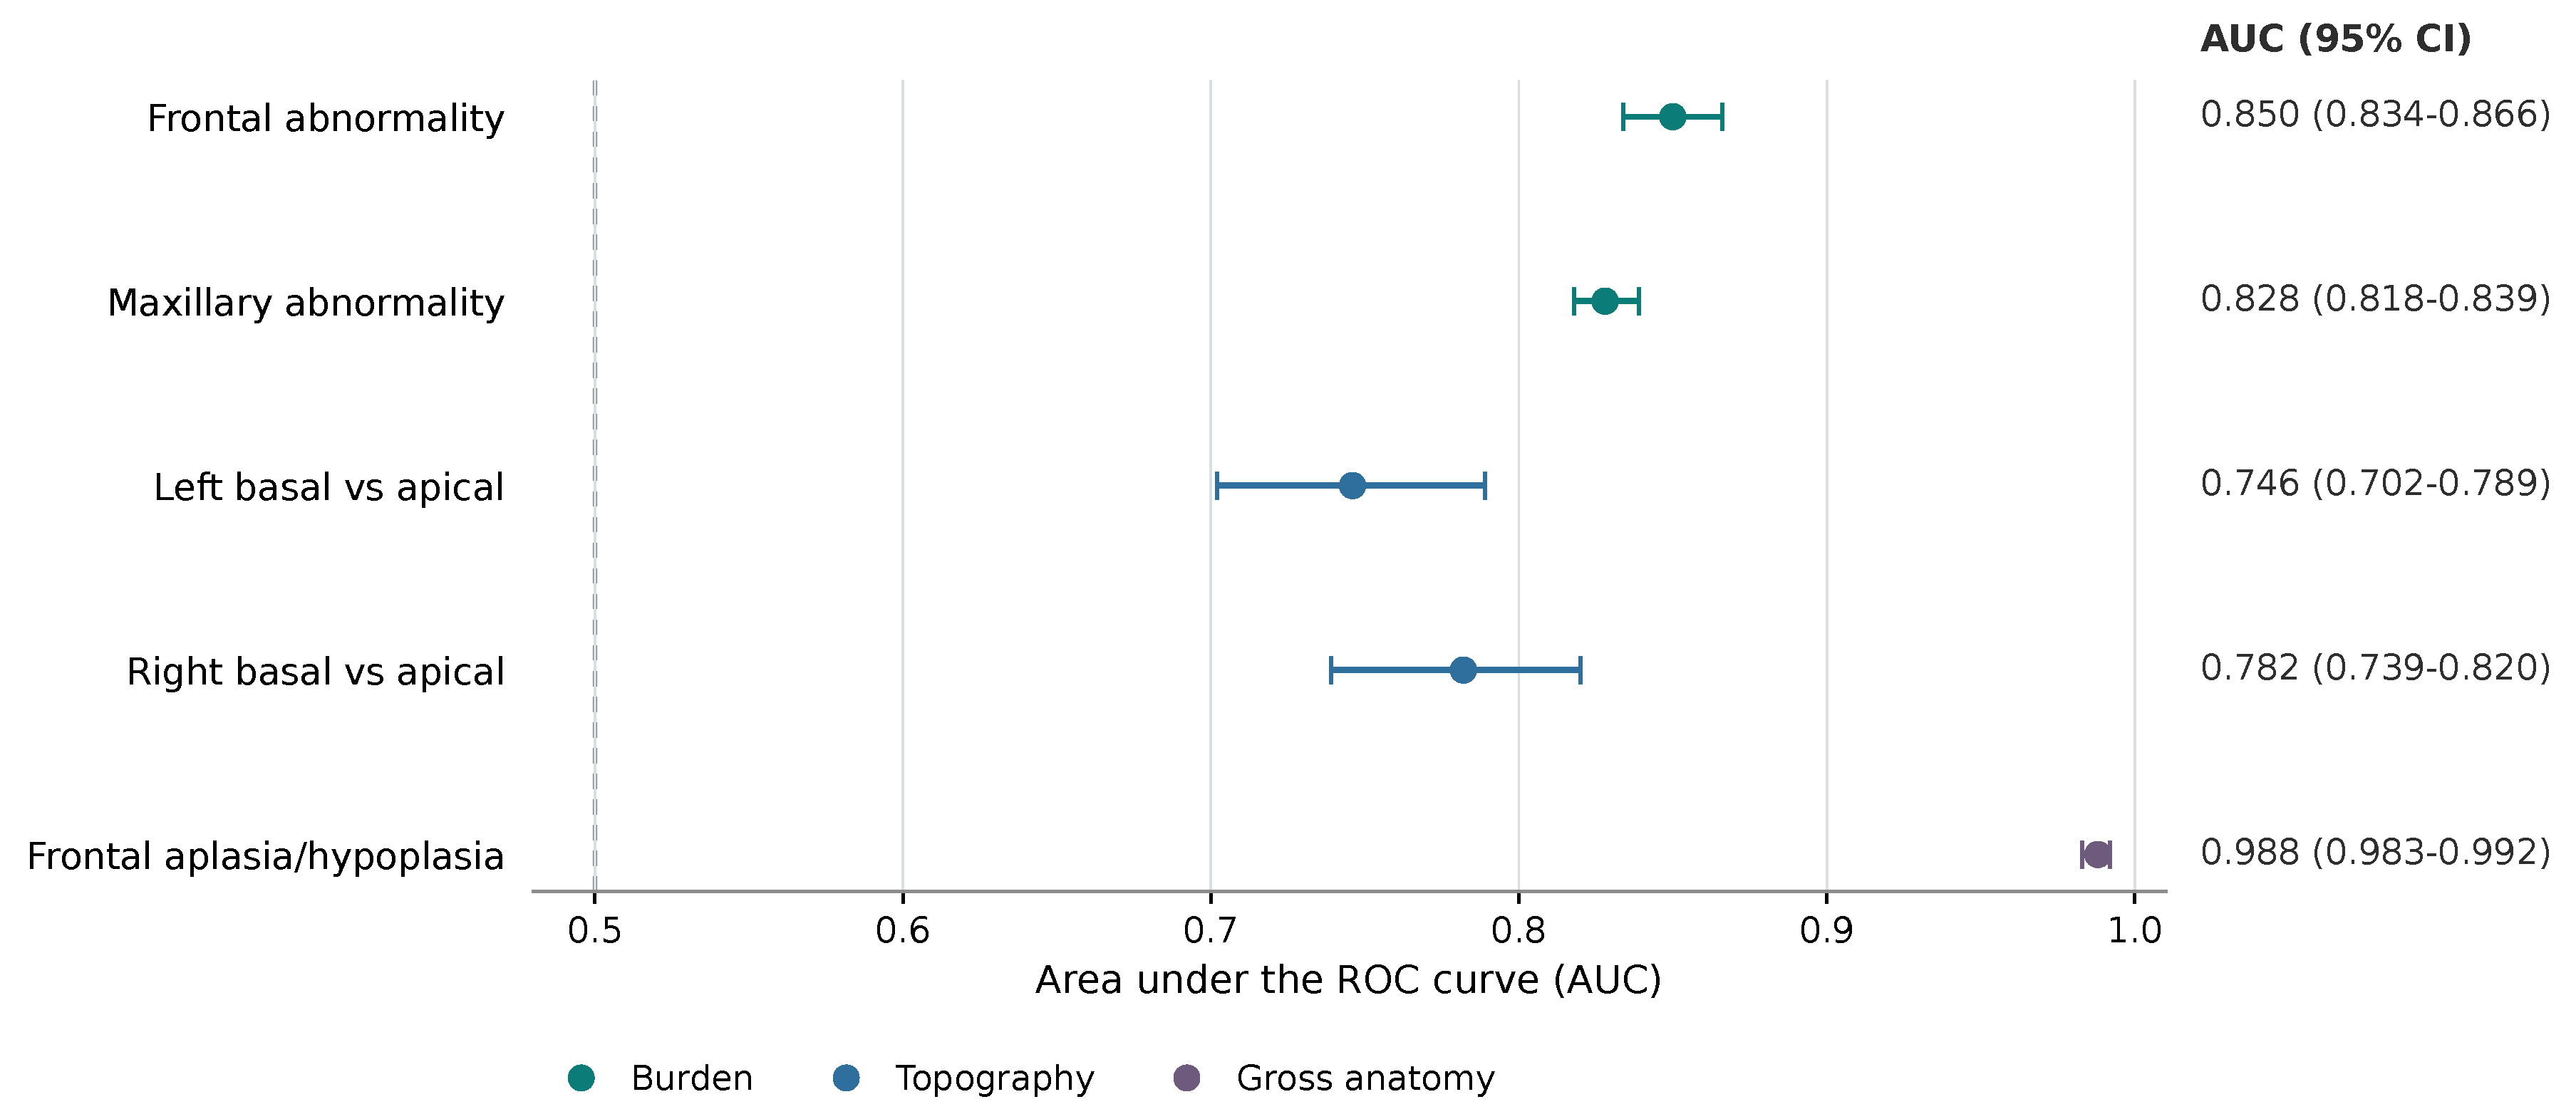
Figure 3.
Historical manual volumetry and automated PARASIDE segmentation. Selected coronal and axial T1-weighted MRI sections illustrate the relationship between historical manual volumetric masks and automated PARASIDE-derived total sinus compartments. (A–D) Coronal combined maxillary sinus examples show close spatial overlap between the historical manual total ROI and the PARASIDE-derived total compartment. (E–H) Coronal frontal sinus views show overlap within the main frontal sinus body, while PARASIDE additionally captures inferior or drainage-related extensions beyond the standardised caudal boundary of the historical frontal ROI. (I–L) Axial views of the same frontal sinus cases illustrate the in-plane relationship between both masks; for each case, the axial section with the highest two-dimensional Dice among sections containing at least 20% of the case-specific maximum manual axial ROI area was selected. The axial examples also demonstrate local differences in contour extent, including medial or central extensions of some historical manual masks. Historical masks were retained without retrospective contour correction after transfer to the common image geometry. The displayed cases were selected for qualitative illustration of typical agreement and protocol-related differences; all quantitative volumetric results were calculated across the complete paired datasets. Cyan contour: historical manual total ROI; red contour: PARASIDE-derived total compartment; yellow fill: PARASIDE-derived total compartment outside the historical manual total ROI. MRI, magnetic resonance imaging; ROI, region of interest.
Figure 3.
Historical manual volumetry and automated PARASIDE segmentation. Selected coronal and axial T1-weighted MRI sections illustrate the relationship between historical manual volumetric masks and automated PARASIDE-derived total sinus compartments. (A–D) Coronal combined maxillary sinus examples show close spatial overlap between the historical manual total ROI and the PARASIDE-derived total compartment. (E–H) Coronal frontal sinus views show overlap within the main frontal sinus body, while PARASIDE additionally captures inferior or drainage-related extensions beyond the standardised caudal boundary of the historical frontal ROI. (I–L) Axial views of the same frontal sinus cases illustrate the in-plane relationship between both masks; for each case, the axial section with the highest two-dimensional Dice among sections containing at least 20% of the case-specific maximum manual axial ROI area was selected. The axial examples also demonstrate local differences in contour extent, including medial or central extensions of some historical manual masks. Historical masks were retained without retrospective contour correction after transfer to the common image geometry. The displayed cases were selected for qualitative illustration of typical agreement and protocol-related differences; all quantitative volumetric results were calculated across the complete paired datasets. Cyan contour: historical manual total ROI; red contour: PARASIDE-derived total compartment; yellow fill: PARASIDE-derived total compartment outside the historical manual total ROI. MRI, magnetic resonance imaging; ROI, region of interest.
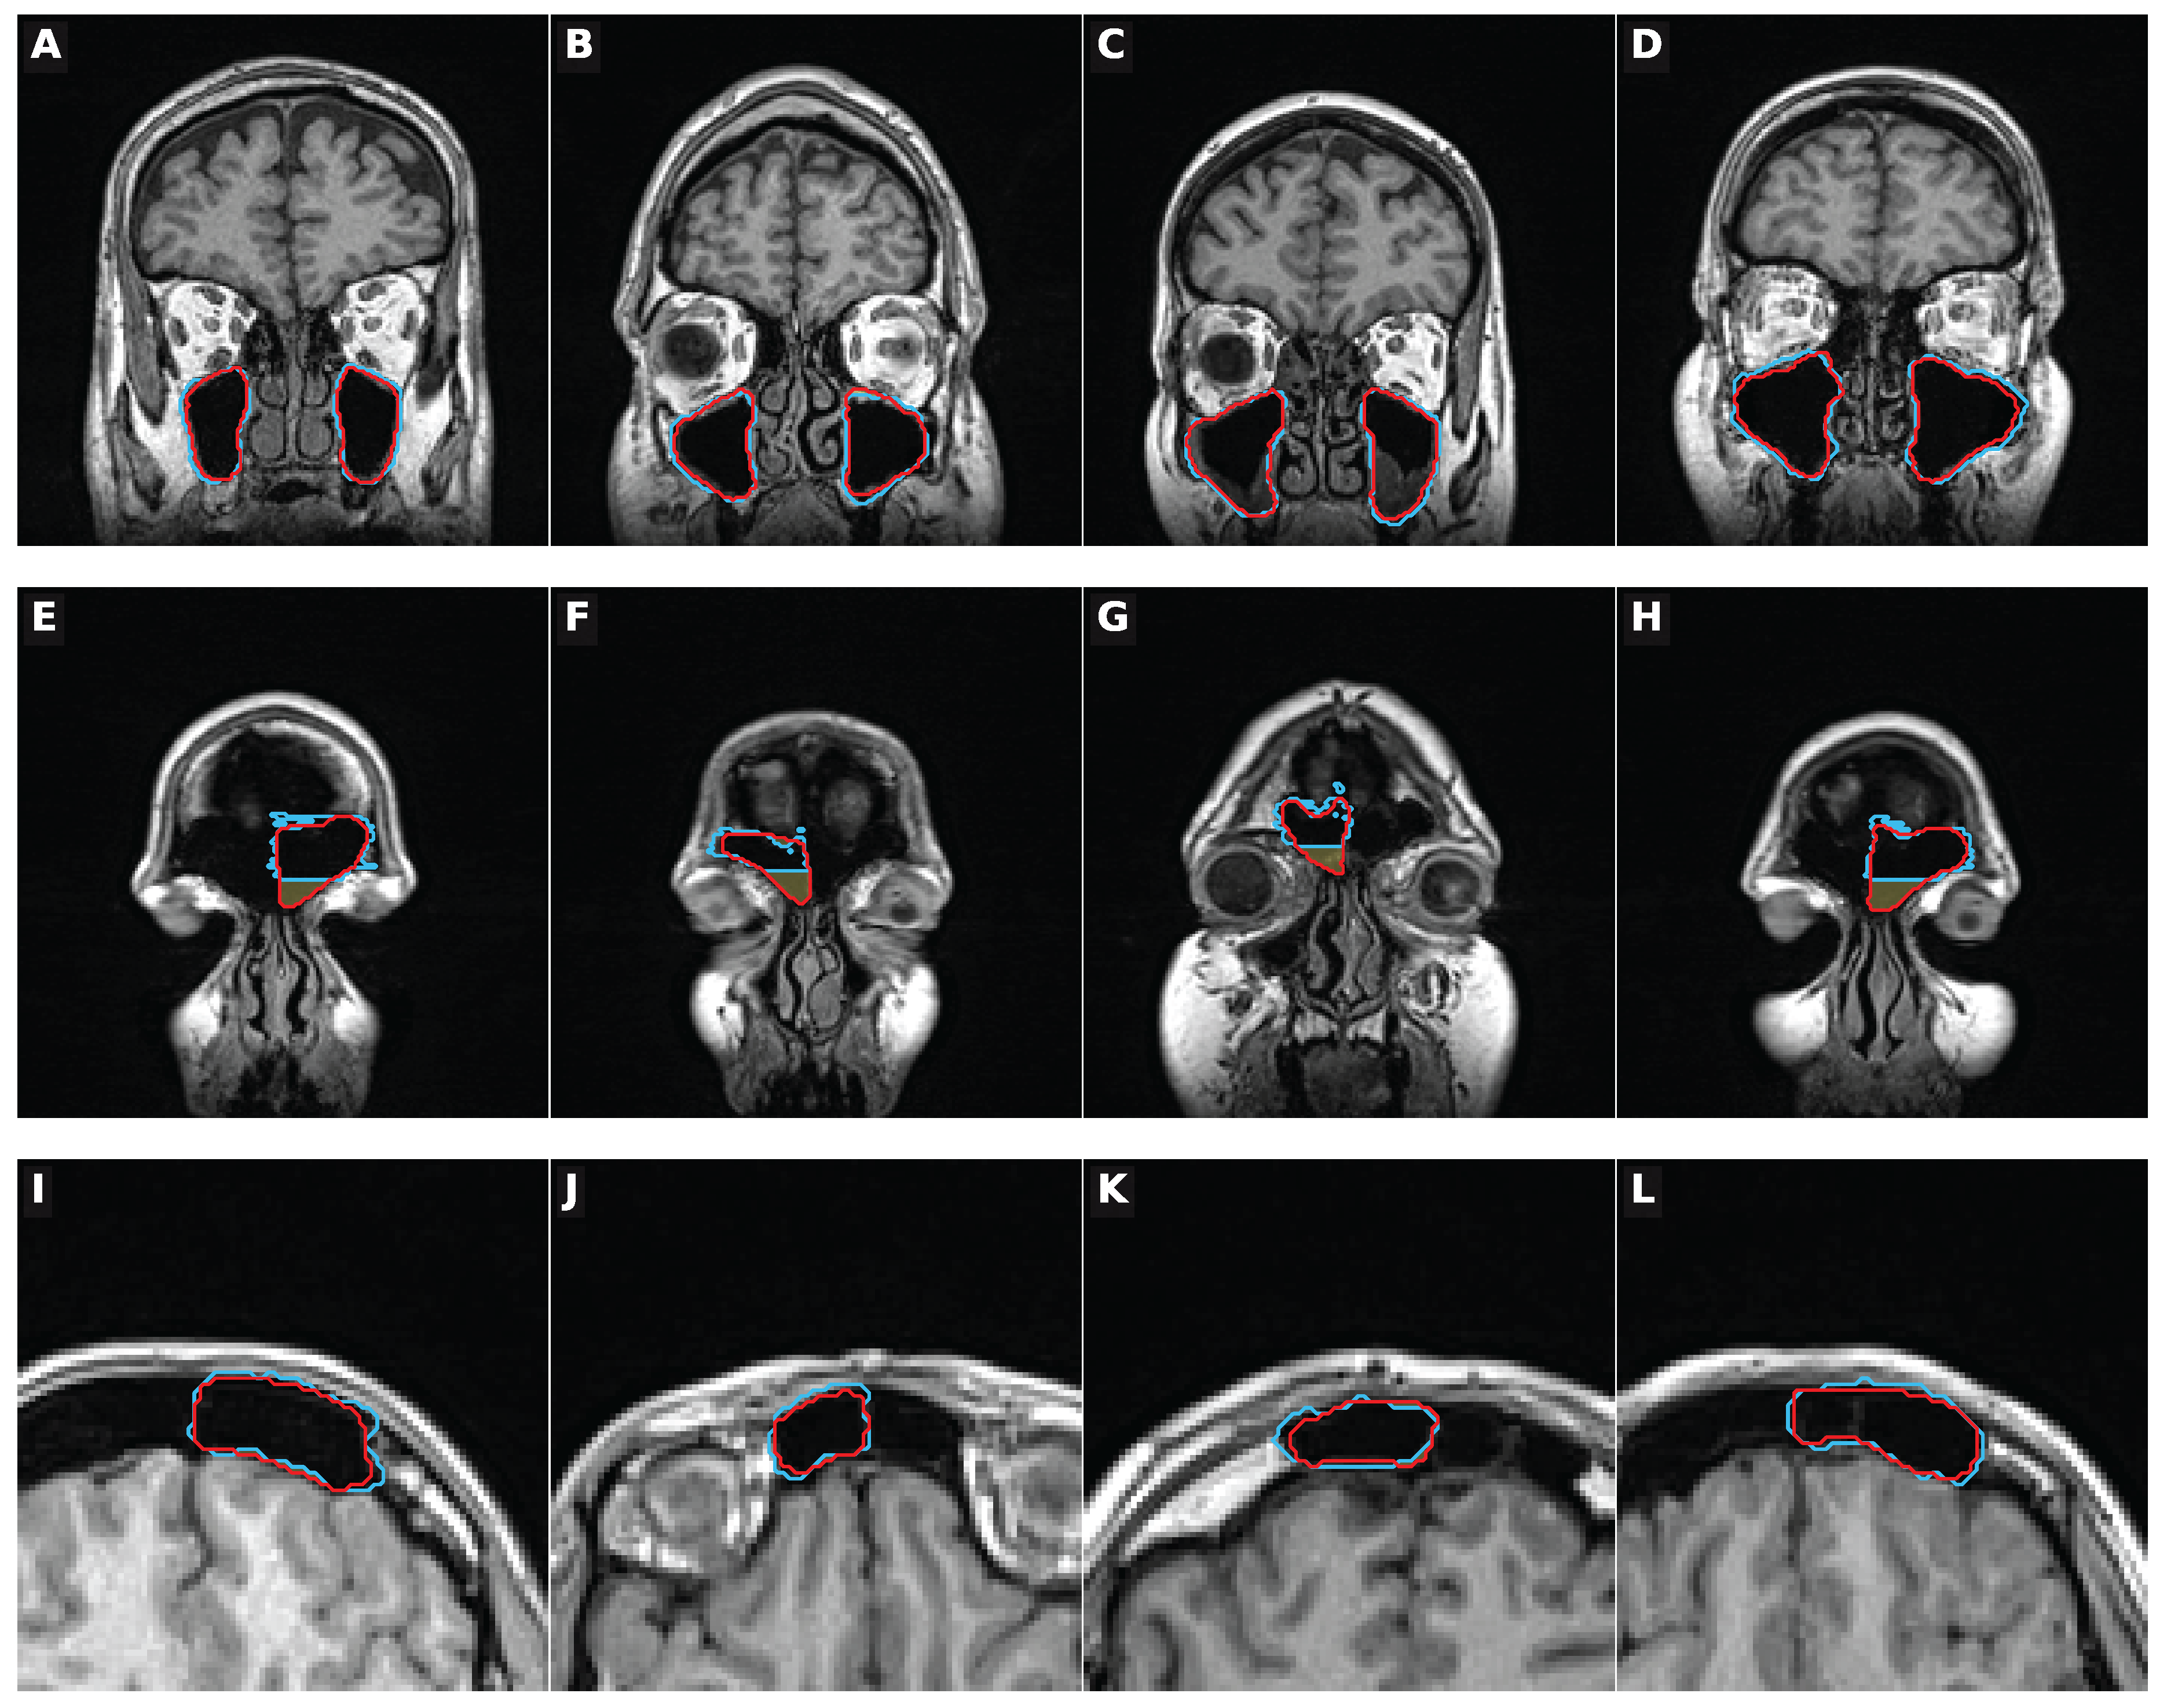

Table 1.
Dataset and reference-layer description. The table summarises the linked PARASIDE analysis dataset, demographic covariates, sinus-side observations, and additional historical, radiological, and surgery-related reference layers.
Table 1.
Dataset and reference-layer description. The table summarises the linked PARASIDE analysis dataset, demographic covariates, sinus-side observations, and additional historical, radiological, and surgery-related reference layers.
| Characteristic | Overall | By block / subset |
|---|---|---|
| Linked analysis dataset | ||
| Participant examinations, n | 3,217 | S2: 1,135; T0: 2,082 |
| Unique participants, n | 3,217 | S2: 1,135; T0: 2,082 |
| Sinus-side observations, n | 12,867 | S2: 4,539; T0: 8,328 |
| Maxillary / frontal sinus-side observations, n | 6,434 / 6,433 | Maxillary: 2,270/4,164; frontal: 2,269/4,164 |
| Demographics | ||
| Age, years, median [IQR] | 53.0 [43.0; 64.0] | S2: 56.0 [45.0; 66.0]; T0: 52.0 [41.0; 62.0] |
| Female / male sex, n (%) | 1,648 (51.2%) / 1,569 (48.8%) | S2: 581/554; T0: 1,067/1,015 |
| Historical sinus-side MRI ratings | ||
| Assessable healthy/inflammatory categories, rows | 11,920 | S2: 4,106; T0: 7,814 |
| Healthy ratings, rows | 8,659 (67.3%) | S2: 3,189; T0: 5,470 |
| Abnormal inflammatory ratings, rows | 3,261 (25.3%) | S2: 917; T0: 2,344 |
| Technically unreadable ratings, rows | 804 (6.2%) | S2: 356; T0: 448 |
| Trauma/fracture ratings, rows | 2 (0.0%) | S2: 2; T0: 0 |
| Aplasia/hypoplasia ratings, rows | 141 (1.1%) | S2: 75; T0: 66 |
| PARASIDE features | ||
| Soft-tissue fraction defined, rows | 12,859 | S2: 4,536; T0: 8,323 |
| Air, soft-tissue, and total volume available, rows | 12,867 | S2: 4,539; T0: 8,328 |
| Historical manual volumetry | ||
| Raw scans linked to SHIP/PARASIDE, n | 103 | S2: 82; T0: 21 |
| Geometrically usable PARASIDE segmentations, n | 102 | 1 linked scan excluded |
| Paired manual volumetry comparisons, n | 95 maxillary; 96 left frontal; 98 right frontal | Total and aerated-volume ROIs |
| Manual volumetry subset demographics | Age 55.0 [44.0; 65.0] | Female/male: 49/53 |
| Radiological middle-face short assessment–separate analysis population | ||
| PARASIDE-linked participant examinations, n | 3,392 | Separate radiological reference-layer population |
| Broad abnormality field available / positive, n | 3,218 / 1,692 | Field-specific availability |
| Sinusitis-related / polyp-related fields positive, n | 717 / 851 | Conditional or overview-level fields |
| Surgery-related reference layers | ||
| Maxillary sinus sides with image-rated postoperative morphology, n | 42 | 24 participant-examinations; frontal: 0 |
| Self-reported paranasal sinus surgery, n | 107 | Among 3,189 participant-examinations |
S2 denotes SHIP-START-2 and T0 denotes SHIP-TREND-0. Historical inflammatory sinus-side categories comprised basal opacification, apical opacification, polyposis, and mucocele (manual categories 1–4). Manual category denoted technically unreadable sinus sides and was treated separately from category 6, which denoted aplasia/hypoplasia; category 5 denoted trauma/fracture. Percentages for historical sinus-side rating rows refer to the full linked sinus-side dataset unless otherwise stated. Soft-tissue fraction was undefined for 8 frontal sinus-side observations with zero segmented denominator volume, while volume fields were available for all 12,867 rows. Of these eight observations, only one met the category criteria for the frontal broad-abnormality endpoint. The radiological short-assessment population was separately linked and was not restricted to the 3,217 participant examinations with structured side-specific sinus ratings. Radiological short assessments and surgery-related reference layers were analysed as contextual, non-primary reference information. IQR, interquartile range; ROI, region of interest; SHIP, Study of Health in Pomerania.
Table 2.
Primary validation endpoints, thresholds, and adjusted associations.
| Endpoint / marker | Region | n/events | Marker direction | Threshold | AUC (95% CI) | Sens./spec. | Adjusted effect |
|---|---|---|---|---|---|---|---|
| Broad abnormality / soft-tissue fraction | Frontal | 5,887/630 | Higher = abnormal | ≥ 6.9% | 0.850 (0.834–0.866) | 0.846/0.713 | OR 2.21 (2.00–2.45); |
| Broad abnormality / soft-tissue fraction | Maxillary | 6,032/2,631 | Higher = abnormal | ≥ 10.2% | 0.828 (0.818–0.839) | 0.718/0.795 | OR 5.74 (5.01–6.57); |
| Basal vs. apical / inferior spatial-relation | Left maxillary | 1,254/1,101 | Higher = basal | ≥ 5.59 mm | 0.746 (0.702–0.789) | 0.766/0.654 | OR 1.28 (1.22–1.35); |
| Basal vs. apical / inferior spatial-relation | Right maxillary | 1,259/1,088 | Higher = basal | ≥ 5.76 mm | 0.782 (0.739–0.820) | 0.772/0.702 | OR 1.31 (1.24–1.39); |
| Frontal aplasia/hypoplasia / total sinus volume | Frontal | 5,397/139 | Lower = aplasia/hypoplasia | ≤ 1.014 mL | 0.988 (0.983–0.992) | 0.986/0.947 | – |
| Strict near-absence / total sinus volume | Frontal | 5,397/139 | Lower = near-absence | ≤ 0.070 mL | – | 0.223/0.997 | PPV 0.689; NPV 0.980 |
AUC: area under the receiver operating characteristic curve; CI: confidence interval; GEE: generalised estimating equations; NPV: negative predictive value; OR: odds ratio; PPV: positive predictive value; Sens./spec.: sensitivity/specificity. Thresholds are Youden-derived unless otherwise stated. Soft-tissue fraction thresholds are shown as percentages. Inferior spatial-relation thresholds are reported in millimetres. Frontal sinus volume thresholds are reported in millilitres after conversion from segmented cubic millimetres. Adjusted models used logistic generalised estimating equations clustered by participant and adjusted for age, sex and examination block. Odds ratios are reported per 10-percentage-point increase for soft-tissue fraction and per 1-mm increase for the inferior spatial-relation component. The frontal aplasia/hypoplasia endpoint was analysed descriptively because of near-separation. The strict near-absence threshold of 0.070 mL corresponded to the previously established empirical PARASIDE threshold of 70 segmented voxels and was applied without re-estimation in the present dataset; it was not a Youden-derived threshold.
Disclaimer/Publisher’s Note: The statements, opinions and data contained in all publications are solely those of the individual author(s) and contributor(s) and not of MDPI and/or the editor(s). MDPI and/or the editor(s) disclaim responsibility for any injury to people or property resulting from any ideas, methods, instructions or products referred to in the content. |
© 2026 by the authors. Licensee MDPI, Basel, Switzerland. This article is an open access article distributed under the terms and conditions of the Creative Commons Attribution (CC BY) license (http://creativecommons.org/licenses/by/4.0/).
Copyright: This open access article is published under a Creative Commons CC BY 4.0 license, which permit the free download, distribution, and reuse, provided that the author and preprint are cited in any reuse.