
Submitted:
27 July 2026
Posted:
30 July 2026
You are already at the latest version
Abstract
This study aims to identify the financial and non-financial factors affecting audit opinions by using explainable artificial intelligence (XAI) models, which provide an important advantage in terms of transparency in the auditing sector. In this context, 2,415 firm-year observations from 238 manufacturing firms listed on Borsa Istanbul for the period 2010–2024 were used. In the study, the independent audit opinion was used as the dependent variable, while 18 financial and non-financial attributes were employed as independent variables. Descriptive statistics and a correlation heatmap analysis were conducted. To identify the most influential factors affecting audit opinions and to comparatively reveal which factors are more important across different models, explainable predictive models were developed using logistic regression, decision tree, random forest, XGBoost, LightGBM, and CatBoost models. Three different analyses were performed: permutation feature importance analysis, SHapley Additive exPlanations (SHAP) analysis, and SHAP beeswarm plot analysis. The built-in feature importance heatmap and the SHAP feature importance heatmap for all models were presented comparatively. A final heatmap was then constructed based on the averages of the built-in feature importance scores and SHAP values. According to the results of the final heatmap, the type of audit opinion in the previous year (X17) was identified as the most influential factor with a score of 0.78, followed by asset turnover ratio (X7) with 0.57, operating sector (X18) with 0.54, current ratio (X1) with 0.54, acid-test ratio (X2) with 0.51, and the natural logarithm of total assets (X10) with 0.50, all of which were found to have the highest explanatory power. The final comparison table, constructed by averaging both the models’ built-in importance scores and SHAP values, indicates that the results are not random but are based on a robust foundation. The findings of this study make significant contributions to both the academic literature and practitioners by guiding decision-makers in identifying the factors that should be prioritized.
Keywords:
auditing
; independent audit opinion
; financial and non-financial variables
; feature importance
; feature selection
; explainable artificial intelligence (XAI)
; SHAP analysis
1. Introduction
The fundamental role of independent auditing is to ensure that a company’s financial statements reliably reflect its financial position for decision-makers. However, international accounting scandals involving companies such as Enron, WorldCom, and Parmalat have increased the importance of the audit opinion. Accordingly, with the growing demand for reliable financial data, the audit opinion has become critically important in ensuring the credibility of financial information.
According to Turkish Standards on Auditing (TSAs), there are two main types of audit opinions: an unmodified opinion and opinions other than an unmodified opinion. Under TSA 700, the auditor expresses an unmodified opinion when the auditor concludes that the financial statements are prepared, in all material respects, in accordance with the applicable financial reporting framework (KGK, 2025a). Under TSA 705, the auditor expresses an opinion other than an unmodified opinion when the auditor concludes that the financial statements contain material misstatements or when the auditor is unable to obtain sufficient appropriate audit evidence. Opinions other than an unmodified opinion are classified into three subtypes: a qualified opinion, an adverse opinion, and a disclaimer of opinion (KGK, 2025b).
Several factors may affect the preparation of audit reports. These factors include auditor size, audit firm change, audit report lag, the type of audit opinion in the previous year, the company’s operating sector, liquidity, profitability, turnover, financial structure, firm size, and financial distress indicators. Such factors may influence the type of audit opinion issued. Considering the importance of the information contained in financial reports and the factors that may affect this information, analyzing the factors associated with the type of audit opinion is of considerable importance. Examining the effects of financial and non-financial factors can assist auditors and financial statement users in identifying these factors and supporting their decision-making processes. This study reveals which of the examined factors have the greatest importance in explaining the audit opinion.
A review of the literature shows that studies aimed at predicting independent audit opinions generally rely on financial and non-financial variables (Büyüktanir & Toraman, 2020; Kardeş & Kandemir, 2025; Kucur et al., 2025; Yaşar et al., 2015). However, the limited number of studies explaining the effects of these variables on audit opinions (Habib, 2013; Mat & Önal, 2019; Özcan, 2016), together with their limited interpretability, indicates a clear research gap. The literature shows that classical statistical methods, such as logistic regression and logit models, have commonly been used as methodological approaches. Recent developments in explainable artificial intelligence (XAI) have demonstrated the potential to enrich the literature by addressing transparency and interpretability issues. XAI models complement the traditional logistic regression approach by facilitating the understanding of decisions generated by complex, black-box artificial intelligence models. In this way, they make model outputs more interpretable and trustworthy while providing understandable insights into model predictions. Therefore, explainable artificial intelligence models have increasingly been used in accounting and auditing research to improve model interpretability (Todorovic et al., 2023; Zhang et al., 2022; Zhong & Goel, 2024). Despite these advances, there remains a gap in the Turkish context regarding the transparent and interpretable identification of financial and non-financial factors affecting audit opinions.
Within the scope of this study, the following research question is addressed: Which financial and non-financial factors have the greatest effect on audit opinions according to explainable artificial intelligence models?
This study aims to contribute to the identification of the most influential factors affecting audit opinions by employing logistic regression analysis together with explainable artificial intelligence models, including decision tree, random forest, XGBoost, LightGBM, and CatBoost.
2. Literature Review
The effects of financial and non-financial factors on independent audit opinions have been examined in the literature from different perspectives. In this section, the main relevant studies are presented in chronological order.
Spathis (Spathis, 2003) examined data from 100 publicly listed Greek manufacturing firms and developed a logistic regression model using financial ratios and non-financial information. The study identified company litigation, financial distress measured by the Z-score, and current-year losses as significant factors in determining opinions other than unmodified audit opinions.
Ireland (Ireland, 2003) investigated the determinants of audit reports in the United Kingdom. The relationship between audit reports and company characteristics for public and private companies was analyzed using a multinomial logistic regression model. The findings showed that large companies with high liquidity and dividend-paying companies were less likely to receive opinions other than an unmodified opinion related to going concern. In contrast, companies with high leverage, contingent liabilities, prior-period losses, and opinions other than an unmodified opinion in the previous period were more likely to receive opinions other than an unmodified opinion containing going-concern uncertainty.
Caramanis and Spathis (Caramanis & Spathis, 2006) analyzed a sample of 185 Greek companies listed on the Athens Stock Exchange to predict audit opinions using financial and non-financial variables through logistic and ordinary least squares regression models. The study found that operating profit to total assets and the current ratio were significant variables in the issuance of opinions other than unmodified opinions. It also revealed that audit fees and audit firm type did not affect the issuance of opinions other than unmodified opinions.
Habib (Habib, 2013) conducted a meta-analysis by synthesizing 73 studies published between 1982 and 2011 to examine the factors affecting the issuance of audit opinions other than unmodified opinions. The study classified the explanatory variables into two main groups: auditor- and audit-specific variables and firm-specific variables. A positive relationship was found between opinions other than unmodified opinions and audit firm size and audit report lag, while a negative relationship was identified with non-audit fees, particularly in studies outside the United States. Among firm-specific variables, firm size, leverage, profitability, default status, and bankruptcy probability were found to be significant in the issuance of opinions other than unmodified opinions.
Yaşar et al. (Yaşar et al., 2015) used discriminant analysis, logistic regression, and the C5.0 decision tree method to predict opinions other than unmodified audit opinions for companies listed in the Borsa Istanbul industrial index using twelve financial ratios. The study analyzed 110 firm-year observations for the 2010–2013 period and found that the ratio of retained earnings to total assets was the most important variable across all models.
Yaşar (Yaşar, 2016) examined the factors affecting opinions other than unmodified opinions using data from industrial companies listed on Borsa Istanbul for the 2011–2014 period and applying the C5.0, CART, and GRI algorithms. The results revealed that the previous year’s audit opinion was the most influential factor in predicting opinions other than unmodified audit opinions across all three models.
Özcan (Özcan, 2016) developed a logit model using financial and non-financial variables to identify the factors affecting the audit opinions of 180 manufacturing firms listed on Borsa Istanbul between 2005 and 2014. The analysis showed that firms receiving unmodified audit opinions generally had higher liquidity, profitability, operational efficiency, growth rates, higher proportions of outside board members, and lower debt-to-total-assets ratios.
Byström and Torung (Byström & Torung, 2016) examined the factors affecting auditors’ decisions to issue opinions other than unmodified audit opinions by analyzing data from 850 Swedish companies, consisting of 425 companies with unmodified opinions and 425 companies with opinions other than unmodified opinions. Using Pearson’s chi-square test and logistic regression analysis, the study found that larger clients were significantly less likely to receive opinions other than unmodified opinions. However, no significant relationship was found with audit firm size, audit fees, or financial risk.
Moalla (Moalla, 2017) investigated the effect of financial variables on predicting audit report qualifications, namely qualified audit opinions, and audit report modifications, namely qualified opinions or unmodified opinions with explanatory paragraphs. The study analyzed 545 audit reports from 76 non-financial publicly listed companies in Tunisia over an eleven-year period from 2005 to 2015. The logistic regression results showed a positive and significant relationship between qualified audit reports and liquidity, current-year losses, and previous-year losses.
Sultanoglu et al. (Sultanoglu et al., 2018) examined how financial distress, client size, auditor type, and crisis type affected opinions other than unmodified audit opinions issued in Turkey during the 2000–2002 local crisis and the 2007–2009 global financial crisis. For this purpose, logistic regression analysis was applied to 1,311 firm-year observations. The study found that greater financial distress and smaller firm size increased the likelihood of receiving an opinion other than an unmodified audit opinion. It also revealed that auditors issued opinions other than unmodified audit opinions at a higher rate during the local crisis than during the global crisis.
Mat and Önal (Mat & Önal, 2019) used binary and multinomial logistic regression analysis to identify the factors affecting opinions other than unmodified audit opinions for Borsa Istanbul manufacturing companies during the 2013–2017 period. The results showed that financial and non-financial variables affected opinions other than unmodified audit opinions.
Sakin (Sakin, 2019) examined the factors affecting independent audit opinions in industrial and service sector companies listed on Borsa Istanbul. The study analyzed 1,035 firm-year observations covering the 2013–2017 period and used logistic regression analysis. The main findings revealed that opinions other than unmodified opinions issued in previous periods tended to lead to similar opinions in subsequent periods.
Büyüktanir and Toraman (Büyüktanir & Toraman, 2020) developed a machine learning model to evaluate the accuracy of independent audit opinions and predict audit opinions for the following period. The study used a dataset consisting of 52 attributes from Borsa Istanbul companies for the 2009–2019 period. The results showed that the XGBoost algorithm achieved the highest performance with an F1-score of 94.7%, suggesting that it could be used as a supporting tool in independent auditors’ risk assessment and quality control activities.
Baskan (Baskan, 2020) examined Independent Standard on Auditing 700 within a conceptual framework and analyzed audit reports from companies in the BIST 50 index for the 2011–2018 period to identify the factors affecting opinions in audit reports. The results showed that being audited by a Big Four audit firm, the firm’s debt structure, growth rates, and net working capital affected audit opinions.
Barreto Sullca and Chapilliquén Peña (Barreto Sullca & Chapilliquén Peña, 2020) examined the factors affecting the type of audit opinion in 177 Peruvian companies. The results revealed that auditor type and company size were the most important determinants of audit outcomes.
Do Quynh (Do Quynh, 2021) examined the relationship between audit opinions and non-financial factors using a logit model for 199 companies listed on the Vietnamese stock market between 2010 and 2019. The results showed that audit report lag and the previous year’s audit opinion were important factors affecting audit opinions.
Lam and Dat (Lam & Dat, 2025) examined the determinants of independent auditor opinions for 413 companies listed on the Ho Chi Minh Stock Exchange (HOSE) between 2020 and 2024. The study used logistic regression to analyze nine financial and non-financial variables based on 2,065 firm-year observations. Six factors were found to have a significant effect on auditor opinions: current ratio, fixed asset turnover, inventory turnover, debt ratio, audit firm size, and board independence.
Pereira and Dantas (Pereira & Dantas, 2025) analyzed the determinants of changes in audit opinions in 233 Brazilian public companies using a logit model. The findings showed that changes in audit opinions in Brazilian public companies were positively associated with audit delay, financial dependence, and company size.
Stanković et al. (Stanković et al., 2025) analyzed 52 companies in Serbia for the 2020–2022 period using the chi-square test and logistic regression to identify the factors affecting the type of audit opinion. The findings revealed a statistically significant relationship between the type of audit opinion issued by auditors and profitability, liquidity, company size, growth, and auditor size, whereas leverage did not show a significant relationship.
Kardeş and Kandemir (Kardeş & Kandemir, 2025) compared 12 data mining classification methods for predicting auditor opinions using financial and non-financial variables based on 2,093 firm-year observations from 161 companies listed on Borsa Istanbul between 2010 and 2022. The Random Forest model achieved the best performance with an accuracy rate of 96.68%. The results showed that the combined use of financial and non-financial variables provided high predictive success in audit opinion prediction and that the model could be used as a decision-support tool.
Özbay (Özbay, 2025) examined the financial statements of 37 firms included in the Borsa Istanbul SME Industrial Index between 2018 and 2022 to determine the effects of their financial ratios on audit opinions. The logit regression analysis found significant relationships between audit opinions and net profit margin, current ratio, acid-test ratio, return on assets, asset turnover, return on equity, and net sales growth.
Yiannoulis et al. (Yiannoulis et al., 2025) examined the factors affecting audit opinions for companies listed on the Athens Stock Exchange between 2018 and 2022. Using 450 firm-year observations, the study applied a logit regression model to analyze the relationship between 11 financial ratios and non-financial factors such as auditor quality, auditor change, and corporate performance. The results revealed that auditor characteristics, particularly auditor quality, were an important factor affecting audit opinions.
A review of the literature indicates that numerous studies have been conducted both in Turkey and internationally to identify the factors affecting independent audit opinions. These studies show that there is no complete consensus regarding the factors affecting independent audit opinions. This study contributes to the expansion of the literature by increasing transparency and interpretability through the use of XAI analysis in identifying the factors affecting independent audit opinions in Turkey.
To the best of our knowledge, there is no study in the field of audit opinion determination that comparatively presents SHAP analysis and built-in feature importance analysis. To fill this gap in the literature, this study analyzes the relevant methods using logistic regression, decision tree, random forest, XGBoost, LightGBM, and CatBoost explainable artificial intelligence models.
3. Methodology
This section presents the study dataset, the research model used, and the variables examined.
3.1. Data
This study uses a dataset consisting of 2,415 firm-year observations from 238 manufacturing firms listed on Borsa Istanbul for the period 2010–2024. In the study, the audit opinion is used as the dependent variable, while 18 attributes are used as independent variables. The data used in the research were obtained from annual reports and financial reports published on the Public Disclosure Platform (KAP). Financial statement data were compiled from the İş Yatırım database. The distribution of audit opinions included in the independent audit reports is presented in Table 1.
Table 1 shows the distribution of a total of 2,415 audit opinions. The fact that 91.51% of the audit opinions are unmodified opinions indicates that unmodified opinions are issued in most audit reports. In contrast, opinions other than unmodified opinions account for 8.49% of the sample. This distribution shows that unmodified audit opinions are clearly dominant compared with opinions other than unmodified opinions.
Table 2 presents the distribution of the 238 manufacturing firms included in the study sample by operating sub-sector.
When the distribution of the 238 manufacturing firms in the study sample is examined by operating sub-sector, the food, beverages, and tobacco sector and the chemicals, pharmaceuticals, petroleum, rubber, and plastic products sector each have the highest share in the sample, with 19.34%. These sectors are followed by fabricated metal products, machinery, electrical equipment, and transportation vehicles, with 18.11%. In addition, non-metallic mineral products, the basic metal industry, and textiles, wearing apparel, and leather each account for approximately 11% of the sample. The paper and paper products, printing sector has a lower share, with 5.76%, while wood products and furniture account for 2.47%, and other manufacturing industries have the lowest share, with 0.41%. This distribution indicates that a large proportion of the manufacturing firms in the sample are concentrated in the food, beverages, and tobacco; chemicals, pharmaceuticals, petroleum, rubber, and plastic products; and fabricated metal products, machinery, electrical equipment, and transportation vehicles sectors.
3.2. Research Model
The research model aims to systematically examine the factors affecting the type of audit opinion. The research model is presented in Figure 1.
The main objective of the study is to examine the financial and non-financial factors that may affect audit opinion types by considering the type of audit opinion, namely unmodified opinions and opinions other than unmodified opinions, as the dependent variable. The independent variables are divided into two main groups: financial variables and non-financial variables. Financial variables include liquidity, profitability, turnover, financial leverage, financial structure, firm size, and financial distress factors that reflect the financial position and performance of the firm. Non-financial variables consist of auditor size, audit firm change, audit report lag, the type of audit opinion in the previous year, and operating sector, reflecting factors related to the audit process and firm structure.
3.3. Variables
Although there is no definitive list of variables in the literature regarding the factors affecting independent audit opinions, existing studies use different financial and non-financial variables to examine the determinants of independent audit opinions. The variables used in this study are presented in Table 3, in line with the literature.
Table 3 provides the descriptions of the financial and non-financial variables affecting audit opinions. The dependent variable, audit opinion type, consists of two classes: unmodified opinions and opinions other than unmodified opinions. The independent variables consist of a total of 18 variables, including 13 financial variables and 5 non-financial variables. Financial variables are defined as liquidity ratios, namely current ratio, acid-test ratio, and cash ratio; profitability ratios, namely return on equity, return on assets, and net profit margin; turnover analysis variables, namely asset turnover ratio and inventory turnover ratio; financial leverage, represented by the debt-to-equity ratio; firm size, measured by the natural logarithm of total assets; and financial distress scores, namely the Zmijewski, Altman Z, and Springate scores. Non-financial variables are defined as auditor size, audit firm change, audit report lag, the type of audit opinion in the previous year, and the firm’s operating sector. These variables provide a comprehensive framework for examining how audit opinions are shaped by financial performance, firm structure, auditor characteristics, and sectoral differences.
4. Research Findings
4.1. Descriptive Statistics of Variables
To provide an overview of the main characteristics of the study variables, the descriptive statistics, including the number of observations, mean, standard deviation, minimum, and maximum values, are presented in Table 4.
Overall, the descriptive statistics indicate considerable heterogeneity among the variables examined, as reflected in the wide dispersion of mean values, standard deviations, and extreme values. In particular, some variables such as X4, X5, X6, and X8 exhibit high standard deviations and extreme minimum and maximum values. This suggests the presence of outliers or observations affected by firm-specific conditions. Negative values are also observed in the distributions of certain variables, such as X6, X8, and X11. These descriptive statistics provide a preliminary overview of the distributional characteristics of the dataset.
4.2. Heatmap of the Variables
The correlation coefficients among the variables are presented in Figure 2.
In the heatmap, dark red indicates a strong positive relationship, whereas dark blue indicates a strong negative relationship. The correlation coefficients show the linear relationship between each independent variable (X1–X18) and the target variable Y. These coefficients range from to 1. Positive values indicate a direct positive linear relationship, while negative values indicate an inverse linear relationship. The magnitude of each coefficient represents the strength of this linear relationship.
The variables with the strongest positive correlations with the target variable are X10 (0.15), X14 (0.12), X7 (0.11), and X12 (0.10). These variables have the most pronounced positive linear associations with the target variable Y. In contrast, X17 (−0.34) and X11 (−0.14) are negatively correlated with Y, with X17 showing a notably stronger inverse linear relationship.
4.3. Analysis Results
The model performance summary of the six models used in the study is presented in Table 5.
The model performance results presented in Table 5 show that XGBoost (92.1%) and CatBoost (91.9%) achieved the highest accuracy rates in predicting audit opinions. An accuracy rate of 92.1% indicates a strong predictive performance in the audit opinion process, which also involves professional judgment. The recall values of Random Forest (98.8%) and XGBoost (98.4%) demonstrate the models’ success in identifying unmodified audit opinions. Such high recall rates indicate that the risk of missing unmodified opinions is low. The traditional logistic regression model showed the lowest performance, with an accuracy rate of 76.1%. This result indicates that explainable artificial intelligence models outperform the traditional logistic regression model. Across all models, precision ranges between 92% and 95%, while recall ranges between 78% and 98%. This suggests that, despite the class imbalance in the dependent variable, namely unmodified opinions versus opinions other than unmodified opinions, the models do not exhibit clear signs of overfitting.
The logistic regression analysis results summarize how strongly the model relies on each variable and how these variables affect the decision mechanism from three different perspectives.
Figure 3 shows that the built-in feature importance analysis of the logistic regression model identifies X17 as the most important variable. Other variables with strong effects on the model are X14, X7, X15, and X13, respectively.
Figure 4 presents the SHAP global importance analysis for logistic regression and shows the extent to which each variable changes the model prediction on average. According to the SHAP analysis, the most important variable is X14, followed by X5, X11, X18, and X13. Although X17 has a large coefficient, the distribution of X14 in the dataset suggests that it contributes more consistently to the model’s predictive performance.
Figure 5 provides a more detailed interpretation of the logistic regression model through the SHAP beeswarm analysis. In this analysis, red points indicate high feature values, while blue points indicate low feature values. The position of each point shows its effect on the prediction: points on the right increase the probability of an unmodified opinion, whereas points on the left decrease it.
For X14, representing auditor size, the concentration of red points on the right indicates that audits conducted by Big Four audit firms statistically increase the probability of issuing an unmodified audit opinion; in other words, there is a positive relationship. For X11, representing the Zmijewski score, the concentration of blue points on the right indicates that as the Zmijewski score increases, the probability of an unmodified audit opinion statistically decreases; in other words, there is a negative relationship. Since a higher Zmijewski score indicates a higher probability of financial failure, the model clearly confirms the theoretical expectation with the empirical data.
When the variable importance results of the logistic regression model are evaluated across the three analyses, X14, X5, X11, and X17 emerge as the most important variables.
The decision tree analysis results summarize how strongly the model relies on each variable and how these variables affect the decision mechanism from three different perspectives.
Figure 6 shows that X17 is again identified as the most important variable in the built-in feature importance analysis of the decision tree model. Other variables with strong effects on the model are X3, X9, X2, X7, X12, and X1, respectively. The decision tree model identifies these variables as the most effective variables for splitting the data into branches.
Figure 7 shows that the SHAP global importance analysis of the decision tree model identifies X2, X17, and X18 as the most important variables.
Figure 8 presents the SHAP beeswarm analysis of the decision tree model. For X2, representing the acid-test ratio, the formation of a right-side tail by red points indicates that as the value of X2 increases, the probability of issuing an unmodified opinion statistically increases.
When the variable importance results of the decision tree model are evaluated across the three analyses, X2 and X17 appear to be the most important variables.
The random forest analysis results summarize how strongly the model relies on each variable and how these variables affect the decision mechanism from three different perspectives.
Figure 9 shows that the built-in feature importance analysis of the random forest model also identifies X17 as the most important variable. Other variables with strong effects on the model are X2 and X1, respectively.
Figure 10 shows that the SHAP global importance analysis of the random forest model identifies X17 as the most important variable. It is followed by X2, X1, X10, and X18, respectively.
Figure 11 presents the SHAP beeswarm analysis of the random forest model. For X17, representing the previous year’s audit opinion change, the formation of a left-side tail by red points, which indicate high values, shows that firms whose audit opinion changed in the previous year are statistically less likely to receive an unmodified opinion in the current period. This suggests that a change in the previous year’s audit opinion is perceived by the auditor as a risk signal.
For the liquidity ratios X2, representing the acid-test ratio, and X1, representing the current ratio, the clustering of red points on the right indicates that higher values of these ratios statistically increase the probability of receiving an unmodified audit opinion. This finding demonstrates that as firms’ short-term debt-paying capacity increases, financial failure risk decreases, and the probability of receiving an unmodified audit opinion rises significantly.
When the results of the random forest model are examined, X17, X2, and X1 stand out as the most important factors determining the model output.
The XGBoost analysis results summarize how strongly the model relies on each variable and how these variables affect the decision mechanism from three different perspectives.
Figure 12 shows that the built-in feature importance analysis of the XGBoost model clearly identifies X17 as the most important variable. Other variables with strong effects on the model are X2, X16, and X14, respectively.
Figure 13 shows that, according to the SHAP global importance analysis of the XGBoost model, the most important variables are X1, X18, and X17. This indicates that the current ratio, one of the liquidity ratios, plays a critical role in the model’s predictive success.
Figure 14 presents the SHAP beeswarm analysis of the XGBoost model. For X1, representing the current ratio, the wide spread of red points, indicating high values, on the right side shows that firms with higher current ratios are more likely to receive unmodified opinions; in other words, there is a positive relationship.
When the variable importance results of the XGBoost model are evaluated across the three analyses, X1, X18, and X17 appear to be the most important variables.
The LightGBM analysis results summarize how strongly the model relies on each variable and how these variables affect the decision mechanism from three different perspectives.
Figure 15 shows that the built-in feature importance analysis of the LightGBM model identifies X8 as the most important variable. Other variables with strong effects on the model are X7, X3, and X10, respectively. LightGBM follows a leaf-wise growth strategy when constructing trees. This suggests that X8 is statistically more efficient in splitting the data into smaller subgroups.
Figure 16 shows that, according to the SHAP global importance analysis of the LightGBM model, X7, X16, and X1 are the three most influential factors.
Figure 17 presents the SHAP beeswarm analysis of the LightGBM model. For X7, representing the asset turnover ratio, the spread of red points, indicating high values, on the right shows that as asset turnover increases, the probability of receiving an unmodified audit opinion statistically increases. For X17, representing the previous year’s audit opinion change, red points form a wide left-side tail in the range of approximately to . This confirms that the LightGBM model evaluates this variable as one of the strongest barriers to receiving an unmodified audit opinion.
When the variable importance results of the LightGBM model are evaluated across the three analyses, X7, X16, X1, and X8 appear to be the most important variables.
The CatBoost analysis results summarize how strongly the model relies on each variable and how these variables affect the decision mechanism from three different perspectives.
Figure 18 shows that the built-in feature importance analysis of the CatBoost model identifies X8 as the most important variable. This result shows a pattern similar to that of the LightGBM model. Other variables with strong effects on the model are X10, X18, and X7, respectively.
Figure 19 shows that, according to the SHAP global importance analysis of the CatBoost model, X14, representing auditor size, is the most important factor. This result is consistent with the logistic regression model. X14 is followed by X16, X17, and X10.
Figure 20 presents the SHAP beeswarm analysis of the CatBoost model. For X14, representing auditor size, the concentration of red points, indicating Big Four audits, on the right shows that audits conducted by Big Four audit firms statistically increase the probability of issuing an unmodified audit opinion; in other words, there is a positive relationship. This result is consistent with the logistic regression model.
When the variable importance results of the CatBoost model are evaluated across the three analyses, X14, X16, X17, and X8 appear to be the most important variables.
4.4. Comparison of Analysis Results
The built-in feature importance heatmap of the six models used in the study is presented in Figure 21.
In the heatmap, X17 appears as the most important variable with a full score of 1.00 in the logistic regression, decision tree, random forest, and XGBoost models. In these models, whether the firm’s audit opinion changed in the previous year is identified as the most decisive factor in predicting the audit opinion to be issued in the current year. LightGBM and CatBoost identify X8 as the most important variable, with a full score of 1.00. These models appear to prioritize the firm’s financial ratios, particularly X10 and X7.
The global SHAP importance heatmap of the six models used in the study is presented in Figure 22. Figure 22 comparatively presents the weights of the variables in the decision-making processes of the models.
Logistic regression identifies X14, decision tree identifies X2, random forest identifies X17, XGBoost identifies X1, LightGBM identifies X7, and CatBoost identifies X14 as the most important variables, each with a full score of 1.00. The SHAP analysis shows that the models assign importance to the previous year’s audit opinion (X17), operating sector (X18), the current ratio (X1) and acid-test ratio (X2), which reflect the firm’s liquidity structure, auditor size (X14), and asset turnover ratio (X7), which reflects firm efficiency. According to the average SHAP values, X17, X18, and X1 are identified as the three most consistent variables with the highest explanatory power. These findings demonstrate that audit opinions are multidimensionally affected by both financial and non-financial variables.
The comparison of the averages of built-in feature importance and global SHAP importance is presented in Figure 23.
The grand consensus analysis presents both the algorithmic hierarchy of the factors affecting independent audit opinions, based on built-in importance, and their marginal effects on prediction outputs, based on SHAP. X17 is identified as the most influential factor, with the highest scores in both the built-in importance average (0.791) and the SHAP average (0.774), resulting in a final average score of 0.782. This finding indicates that the previous year’s audit opinion is the most important factor determining the type of audit opinion in the current year. Although X18 has relatively low built-in importance (0.348), it has high SHAP importance (0.742) and is identified as the third most important factor, with a final average score of 0.545. In the final average ranking, X7 (0.578), X1 (0.542), X2 (0.512), and X10 (0.509) are identified as important financial indicators. At the lower end of the scores, X15 (0.076), X4 (0.172), X6 (0.175), X13 (0.226), X5 (0.241), X11 (0.286), X9 (0.361), and X3 (0.384) remain below 0.4 in both methods and are therefore identified as the variables contributing least to the model.
5. Discussion
The findings obtained from the comparative heatmap analysis conducted on six different models reveal that the models assign different levels of importance to the variables. The logistic regression model assigns the greatest importance to X14. The decision tree, random forest, and XGBoost models indicate that X17 is the variable with the highest explanatory power for audit opinions. According to the comparison of the averages of built-in feature importance and global SHAP importance, the five most influential variables are identified as X17 (0.782), X7 (0.578), X18 (0.545), X1 (0.542), and X2 (0.512). According to the correlation analysis results, the five most influential variables are X17 (−0.34), X10 (0.15), X11 (−0.14), X14 (0.12), and X7 (0.11). The LightGBM and CatBoost models assign the greatest importance to the turnover ratios, namely X7 and X8.
In this study, X17 is identified as the most influential determinant. This result indicates that the previous year’s audit opinion is an important determinant of the current year’s audit opinion and is consistent with several findings in the literature (Do Quynh, 2021; Sakin, 2019; Yaşar, 2016). For example, Mutchler (1985) shows that firms receiving a going-concern opinion in the previous year are substantially more likely to receive the same opinion again in the current year.
In the built-in feature importance analysis, X17 is identified as the most important factor in the logistic regression, decision tree, random forest, and XGBoost models. This finding suggests that the results are not random but empirically robust. In these models, having an opinion other than an unmodified opinion in the previous year is found to be the factor that most strongly reduces the probability of receiving an unmodified opinion. In contrast, in the LightGBM and CatBoost models, X8, representing the inventory turnover ratio, is identified as the most influential factor.
The most important factors differ in the SHAP global importance analysis. X14 is identified as the most influential variable in the logistic regression and CatBoost models, X2 in the decision tree model, X17 in the random forest model, X1 in the XGBoost model, and X7 in the LightGBM model. The identification of X14, representing auditor size, as the most influential factor in the logistic regression and CatBoost models indicates that audits conducted by Big Four audit firms are statistically associated with a higher probability of receiving an unmodified audit opinion. The identification of X1 and X2, representing liquidity ratios, as the most important factors in the decision tree and XGBoost models indicates that as liquidity ratios increase, the probability of receiving an unmodified opinion also increases statistically.
Overall, the model results indicate that firms with an unmodified audit opinion in the previous year and a strong liquidity structure are more likely to receive an unmodified audit opinion.
6. Conclusion
This study aims to identify the financial and non-financial factors affecting the audit opinions of manufacturing firms listed on Borsa Istanbul during the 2010–2024 period by using explainable artificial intelligence (XAI) models. To determine the most influential factors affecting audit opinions and to comparatively reveal which factors are more important across different models, explainable predictive models were developed using logistic regression, decision tree, random forest, XGBoost, LightGBM, and CatBoost algorithms.
The results of the study show that XAI models provide high performance and transparency in identifying the factors affecting independent audit opinions. Based on the comparative analysis conducted using built-in feature importance and SHAP global importance values, the most important factors determining the probability of receiving an unmodified audit opinion are the previous year’s audit opinion (X17), asset turnover ratio (X7), operating sub-sector (X18), and liquidity ratios reflecting short-term debt-paying capacity (X1 and X2). The findings indicate that these five variables are among the key factors affecting audit opinions.
The analysis results reveal that X17 ranks among the most important variables in almost all models. This finding empirically supports the view that auditors consider the previous year’s audit opinion significantly in their decision-making processes, in addition to financial indicators. The model results show that auditors take into account not only financial ratios but also information related to previous audit reports during the risk assessment process.
When model performances are examined, XGBoost (92.1%) and CatBoost (91.9%) achieve the highest accuracy rates. By making these models more transparent through XAI methods, the models not only generate predictions but also reveal the relative importance of the variables affecting prediction outcomes. In this respect, the developed models have the potential to serve as decision-support systems for audit firms by enabling more efficient allocation of resources and reducing the margin of error in decision-making processes. They may also serve as important tools for financial statement users, company managers, regulatory institutions, academics, and researchers in identifying the factors affecting audit opinions.
Unlike similar studies in the literature, this research contributes to the literature by using XAI analyses to increase transparency and interpretability in identifying the factors affecting independent audit opinions in Turkey.
Nevertheless, this study has certain limitations. Since the research covers only manufacturing firms listed on Borsa Istanbul during the 2010–2024 period, the sample size is limited. This constitutes one of the main limitations of the study.
Future studies may include additional independent variables, such as financial performance indicators, corporate governance variables, and sustainability measures, to examine the factors affecting audit opinions more comprehensively. In addition, the scope of the research may be expanded to cover longer time periods and different sectors. Furthermore, the application and comparison of different explainable artificial intelligence techniques may be considered as important research directions for future studies.
Conflicts of Interest
The authors declare no conflicts of interest.
References
- Barreto Sullca, M. J., & Chapilliquén Peña, K. M. (2020). Análisis de los factores que influyen en la emisión de informes de auditoría modificado o no modificado en las distintas empresas que cotizan en la Superintendencia del Mercado de Valores (SMV) del Perú entre los años 2011–2016 (thesis). Universidad de Piura.
- Baskan, T. D. (2020). BDS-700 finansal raporlara ilişkin görüş oluşturma ve raporlama standardının BİST-50 endeksi kapsamındaki firmalara etkilerinin değerlendirilmesi. Turkish Studies-Economics, Finance, Politics, 15(2). [CrossRef]
- Byström, L., & Torung, M. (2016). The likelihood of modified audit opinions: What factors may influence it? (Doctoral dissertation, Uppsala universitet). Available online: https://www.diva-portal.org/smash/record.jsf?pid=diva2:940886 (accessed on 2026-04-08).
- Büyüktanir, T., & Toraman, T. (2020). Auditor’s opinions prediction with machine learning algorithms. In 2020 28th Signal Processing and Communications Applications Conference (SIU) (pp. 1–4). IEEE. Available online: https://ieeexplore.ieee.org/abstract/document/9302441/ (accessed on 2026-04-08).
- Caramanis, C., & Spathis, C. (2006, December). Auditee and audit firm characteristics as determinants of audit qualifications: Evidence from the Athens stock exchange. Managerial Auditing Journal, 21(9), 905–920. Available online: http://www.emerald.com/maj/article/21/9/905-920/280935 (accessed on 2026-01-20). [CrossRef]
- Do Quynh, C. (2021, June). Opinion audit and non-financial factors: Evidence from Vietnam. VNU Journal of Economics and Business, 1(1). Available online: https://js.vnu.edu.vn/EAB/article/view/4493 (accessed on 2025-12-21). [CrossRef]
- Habib, A. (2013, March). A meta-analysis of the determinants of modified audit opinion decisions. Managerial Auditing Journal, 28(3), 184–216. Available online: http://www.emerald.com/maj/article/28/3/184-216/287327 (accessed on 2025-12-28). [CrossRef]
- Ireland, J. C. (2003, September). An empirical investigation of determinants of audit reports in the UK. Journal of Business Finance & Accounting, 30(7-8), 975–1016. Available online: https://onlinelibrary.wiley.com/doi/10.1111/1468-5957.05417 (accessed on 2026-04-08). [CrossRef]
- Kardeş, Z., & Kandemir, T. (2025). Audit opinion prediction with data mining methods: evidence from Borsa Istanbul (BIST). El-Cezeri, 12(3), 395–409. Available online: https://dergipark.org.tr/en/pub/ecjse/issue/95086/1679862 (accessed on 2026-04-08).
- KGK. (2025a). Bağımsız denetim standardı 700: Bağımsız denetçi raporunun oluşturulması ve finansal tablolar hakkında görüş bildirilmesi. Available online: https://www.kgk.gov.tr/Portalv2Uploads/files/Duyurular/v2/TDS/TDS_2025_Seti/BDS%20700_2025.pdf (accessed on 2026-04-08).
- KGK. (2025b). Bağımsız denetim standardı 705: Bağımsız denetçi raporunda olumlu görüş dışında bir görüş bildirilmesi. Available online: https://www.kgk.gov.tr/Portalv2Uploads/files/Duyurular/v2/TDS/TDS_2025_Seti/BDS%20705_2025.pdf (accessed on 2026-04-08).
- Kucur, E. N., Aktürk, B., Yilmaz, E., Büyüktanır, T., & Yıldız, K. (2025). Multi-Level Classification of Audit Opinions Using Ensemble Learning Methods with Encrypted Financial Data. Bilişim Teknolojileri Dergisi, 18(3), 269–282.
- Lam, N. T., & Dat, N. T. (2025). Determinants of Independent Audit Opinions: Evidence From Hose-Listed Firms. International Journal of Trends in Accounting Research, 6(1), 1–13. Available online: https://www.jurnal.adai.or.id/index.php/ijtar/article/view/983 (accessed on 2026-01-02).
- Mat, M., & Önal, S. (2019). Bağımsız Denetim Raporlarında Denetim Görüşünü Etkileyen Faktörlerin Belirlenmesi: Borsa İstanbul İmalat Sanayi Sektörü Şirketleri Üzerine Bir Uygulama. Muhasebe Bilim Dünyası Dergisi, 21(3), 733–760. Available online: https://dergipark.org.tr/en/download/article-file/820670 (accessed on 2026-01-02). [CrossRef]
- Moalla, H. (2017). Audit report qualification/modification: Impact of financial variables in Tunisia. Journal of Accounting in Emerging Economies, 7(4), 468–485. Available online: https://www.emerald.com/jaee/article/7/4/468/192230 (accessed on 2026-04-08).
- Pereira, V. A. d. S., & Dantas, J. A. (2025). Audit opinion determinants in Brazilian State-owned companies. Revista Contabilidade & Finanças, 36(97), e2055. Available online: https://www.scielo.br/j/rcf/a/jKtsPR5STb775NKjQnJVBwr/?lang=en (accessed on 2026-04-08).
- Sakin, İ. (2019). Bağımsız denetim görüşünü etkileyen faktörlerin tespiti: Borsa İstanbula kayıtlı işletmeler üzerine bir uygulama (Master’s thesis). Çukurova Üniversitesi, Yükseköğretim Kurulu Ulusal Tez Merkezi.
- Spathis, C. T. (2003, March). Audit Qualification, Firm Litigation, and Financial Information: an Empirical Analysis in Greece. International Journal of Auditing, 7(1), 71–85. Available online: https://onlinelibrary.wiley.com/doi/10.1111/1099-1123.00006 (accessed on 2026-01-22). [CrossRef]
- Stanković, P., Jovković, B., & Marić, A. R. (2025). Analysis of factors influencing the type of audit opinion. Economic Annals, 70(247), 153–184. Available online: https://www.ceeol.com/search/article-detail?id=1390764 (accessed on 2026-04-08).
- Sultanoglu, B., Mugan, C. S., Sekerdag, U., & Oran, A. (2018). The auditor’s opinion modifications around domestic and global financial crises. Meditari Accountancy Research, 26(4), 622–639. Available online: https://www.emerald.com/medar/article-abstract/26/4/622/458752 (accessed on 2026-04-08).
- Todorovic, M., Stanisic, N., Zivkovic, M., Bacanin, N., Simic, V., & Tirkolaee, E. B. (2023). Improving audit opinion prediction accuracy using metaheuristics-tuned XGBoost algorithm with interpretable results through SHAP value analysis. Applied Soft Computing, 149, 110955. Available online: https://www.sciencedirect.com/science/article/pii/S1568494623009730?casa_token=iwTKdkCCRH8AAAAA:i_MAopaCVXwiNg56Xuw4dpsrnzrT_tREOHy_esjnh4-aOeTZdBk3WtCBDtKkV1oe3VG1iWt6TA (accessed on 2026-04-08).
- Yaşar, A. (2016). Olumlu görüş dışındaki denetim görüşlerinin veri madenciliği yöntemleriyle tahminine ilişkin karar ve birliktelik kuralları. Mali Cozum Dergisi, 26(133).
- Yaşar, A., Yakut, E., & Gutnu, M. M. (2015). Predicting qualified audit opinions using financial ratios: Evidence from the Istanbul Stock Exchange. International Journal of Business and Social Science, 6(8), 57–67. Available online: https://www.researchgate.net/profile/Emre-Yakut/publication/283496880_Predicting_Qualified_Audit_Opinions_Using_Financial_Ratios_Evidence_from_the_Istanbul_Stock_Exchange/links/563b1c1108ae45b5d284c932/Predicting-Qualified-Audit-Opinions-Using-Financial-Ratios-Evidence-from-the-Istanbul-Stock-Exchange.pdf (accessed on 2026-04-08).
- Yiannoulis, Y., Vortelinos, D., & Passas, I. (2025). Exploring audit opinions: A deep dive into ratios and fraud variables in the Athens exchange. Accounting and Auditing, 1(1), 3. Available online: https://www.mdpi.com/3042-6618/1/1/3 (accessed on 2026-04-08).
- Zhang, C. A., Cho, S., & Vasarhelyi, M. (2022). Explainable artificial intelligence (XAI) in auditing. International Journal of Accounting Information Systems, 46, 100572. Available online: https://www.sciencedirect.com/science/article/pii/S1467089522000240?casa_token=-S4a5YmKOooAAAAA:X8i2el7UD50G37pZM5BH2LcFTw7MA6KAL_SYa2nIkQoCWFsyjLPmmItKFho3RtcXp5ACWBXG0g (accessed on 2026-04-08).
- Zhong, C., & Goel, S. (2024). Transparent AI in auditing through explainable AI. Current Issues in Auditing, 18(2), A1–A14. Available online: https://publications.aaahq.org/cia/article/18/2/A1/12271 (accessed on 2026-04-08).
- Özbay, Ş. (2025). Denetim görüşünü etkileyen finansal faktörler: BİST KOBİ endeksi örneği (Master’s thesis). Afyon Kocatepe University.
- Özcan, A. (2016). Determining factors affecting audit opinion: Evidence from Turkey. International Journal of Accounting and Financial Reporting, 6(2), 45–62. Available online: https://www.academia.edu/download/95615410/7992.pdf (accessed on 2026-01-02). [CrossRef]
Figure 1.
Research Model.
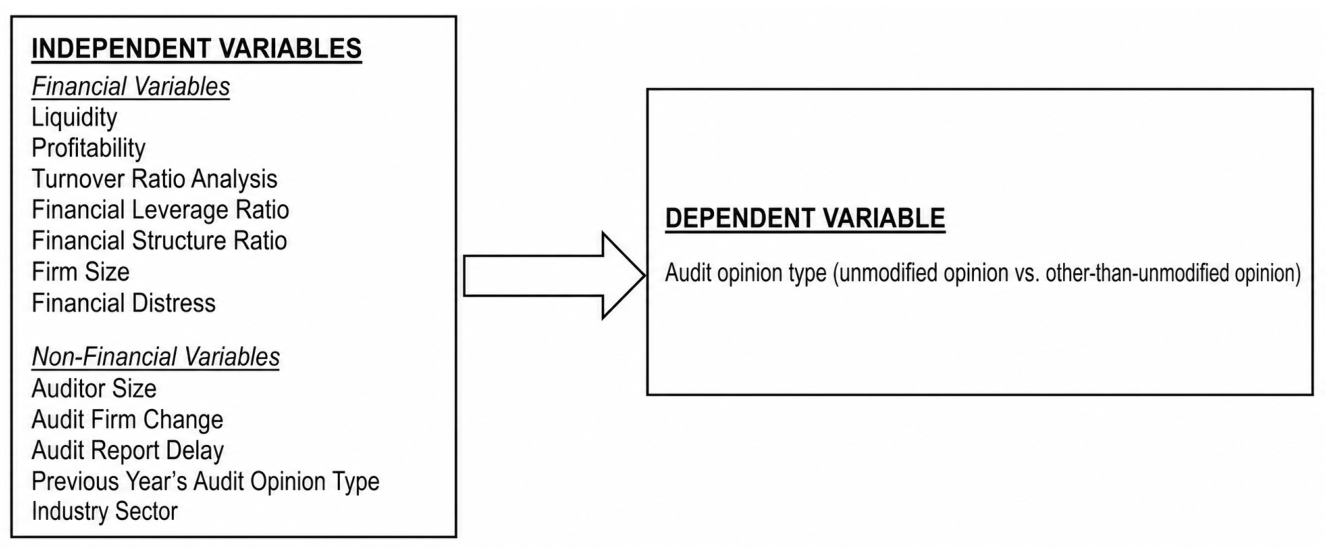
Figure 2.
Correlation Heatmap of Research Variables.
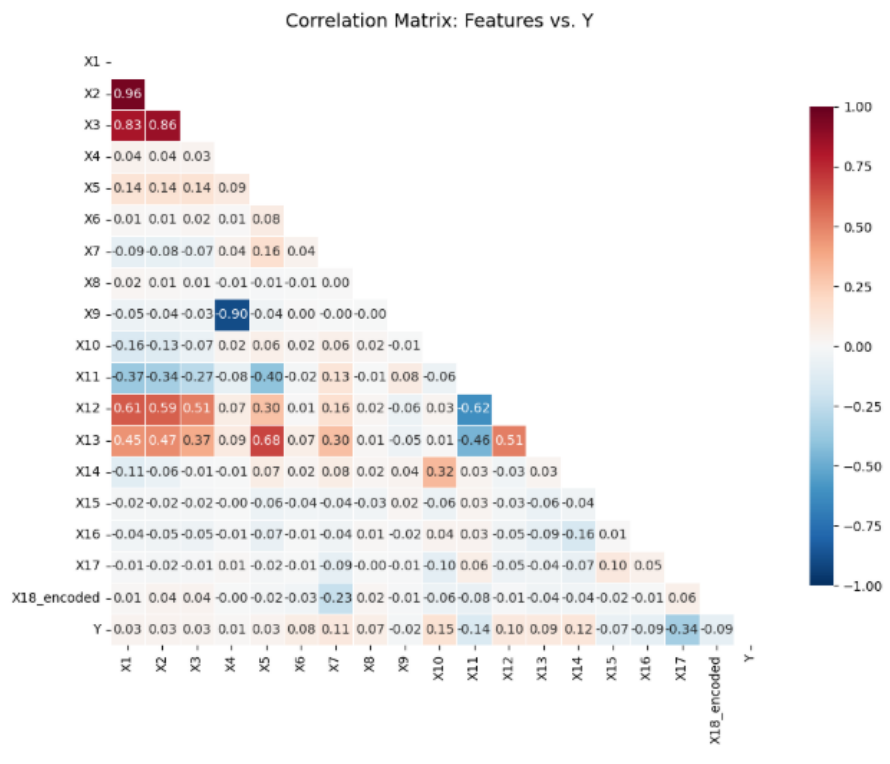
Figure 3.
Built-in Feature Importance: Logistic Regression.
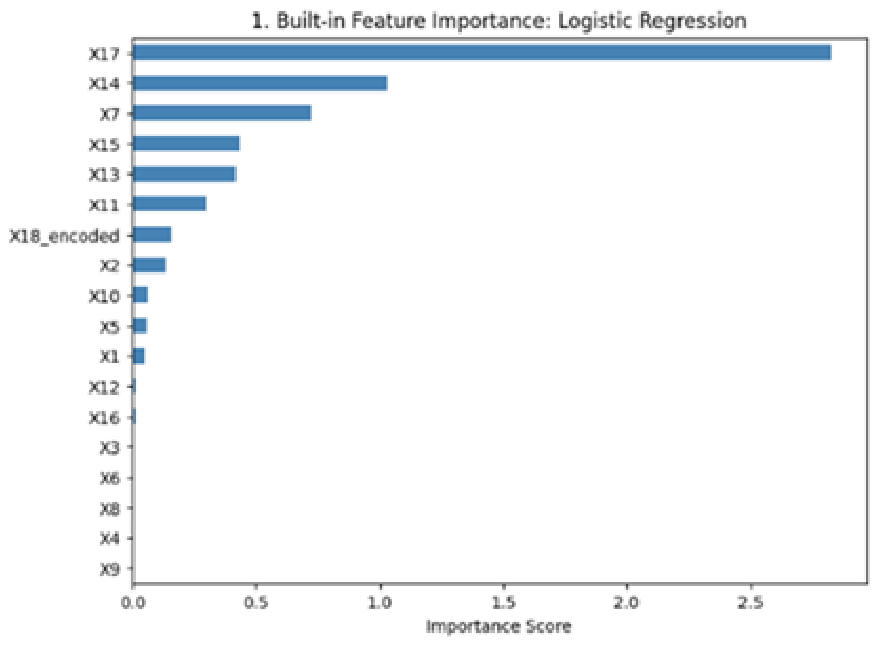
Figure 4.
SHAP Global Importance: Logistic Regression.
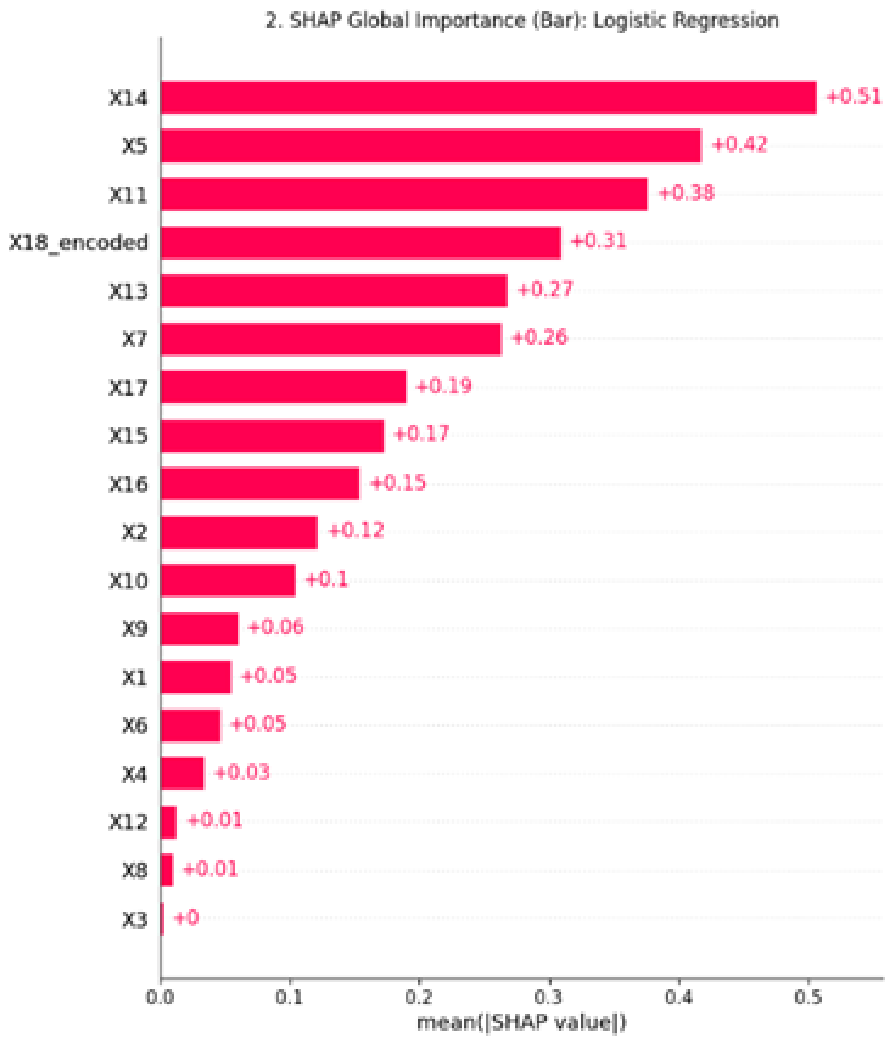
Figure 5.
SHAP Beeswarm: Logistic Regression.
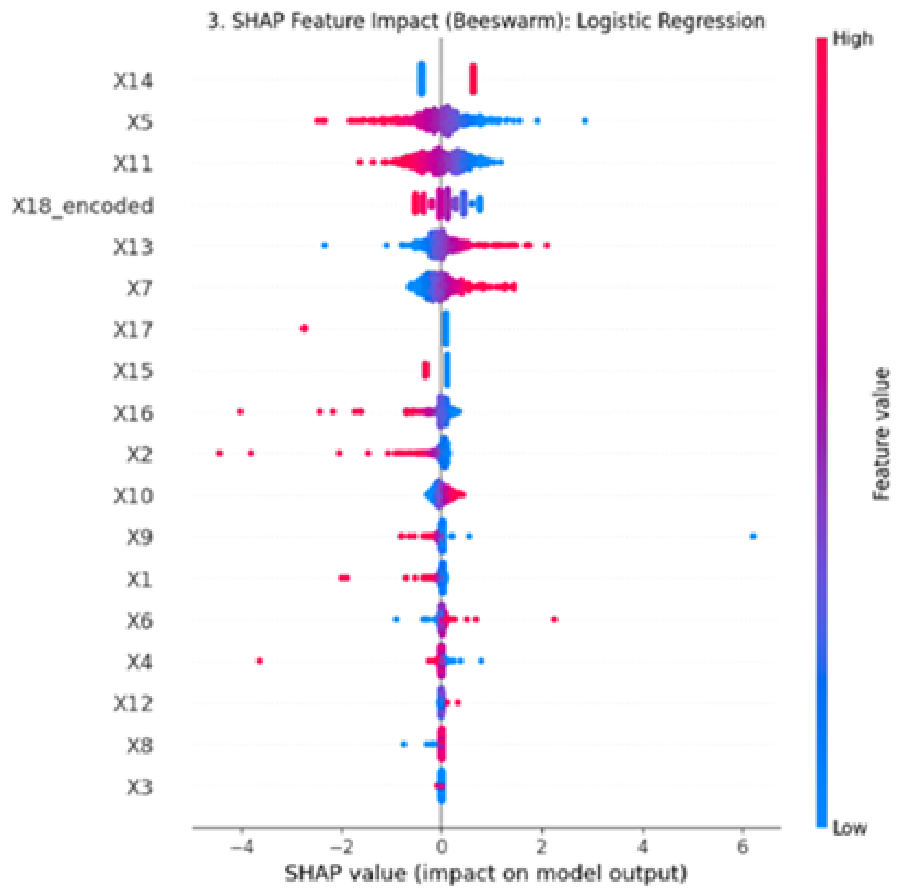
Figure 6.
Built-in Feature Importance: Decision Tree.
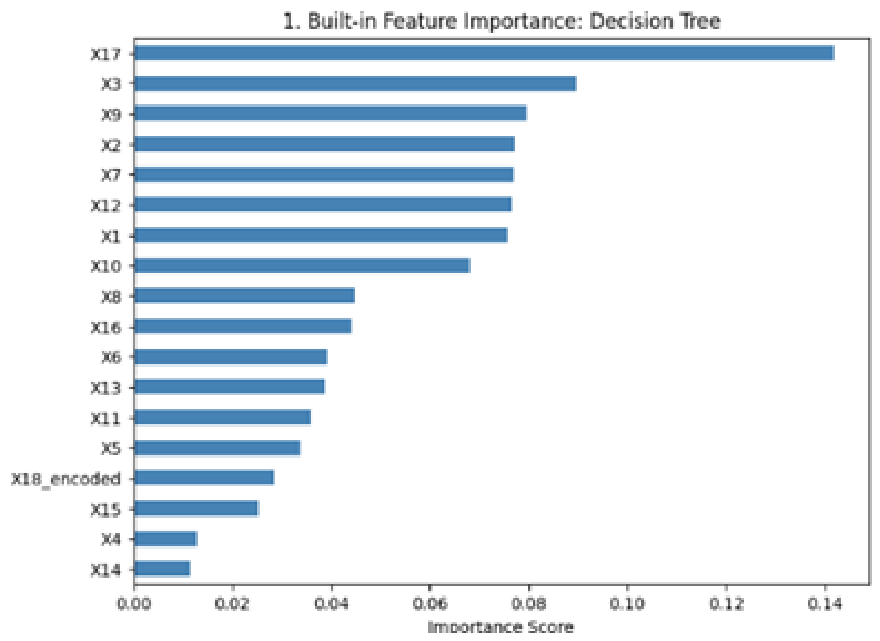
Figure 7.
SHAP Global Importance: Decision Tree.
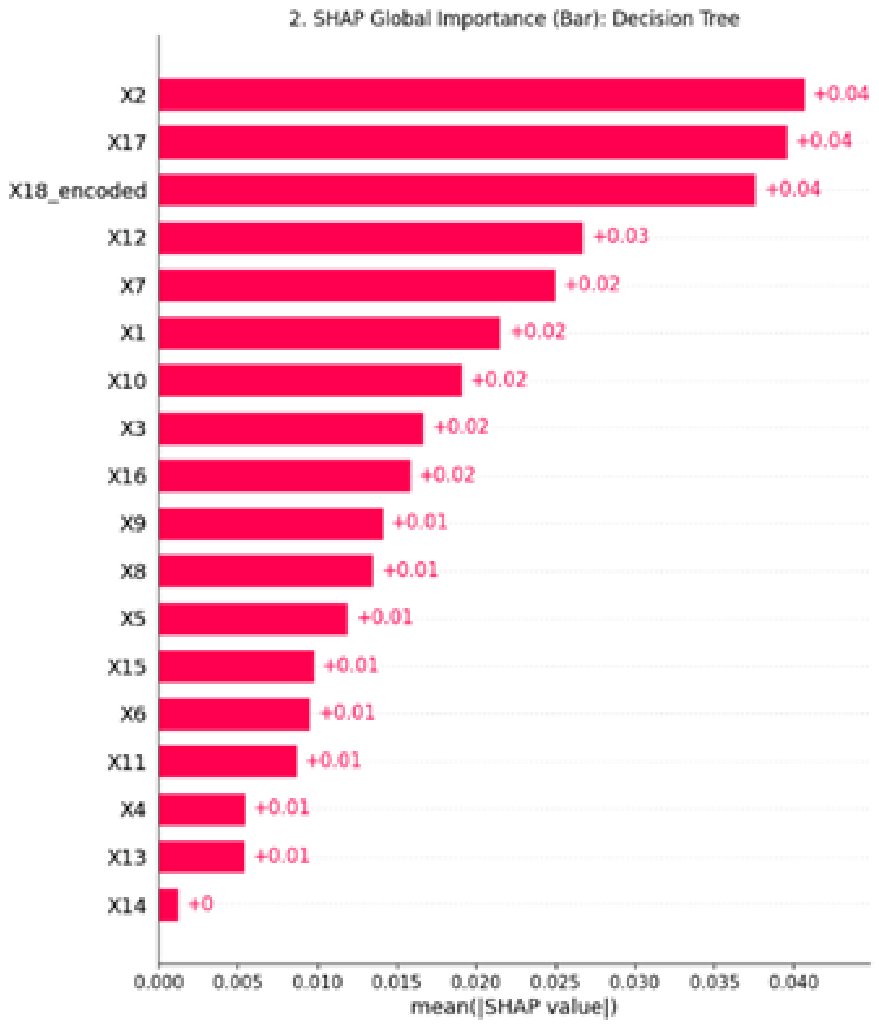
Figure 8.
SHAP Beeswarm: Decision Tree.
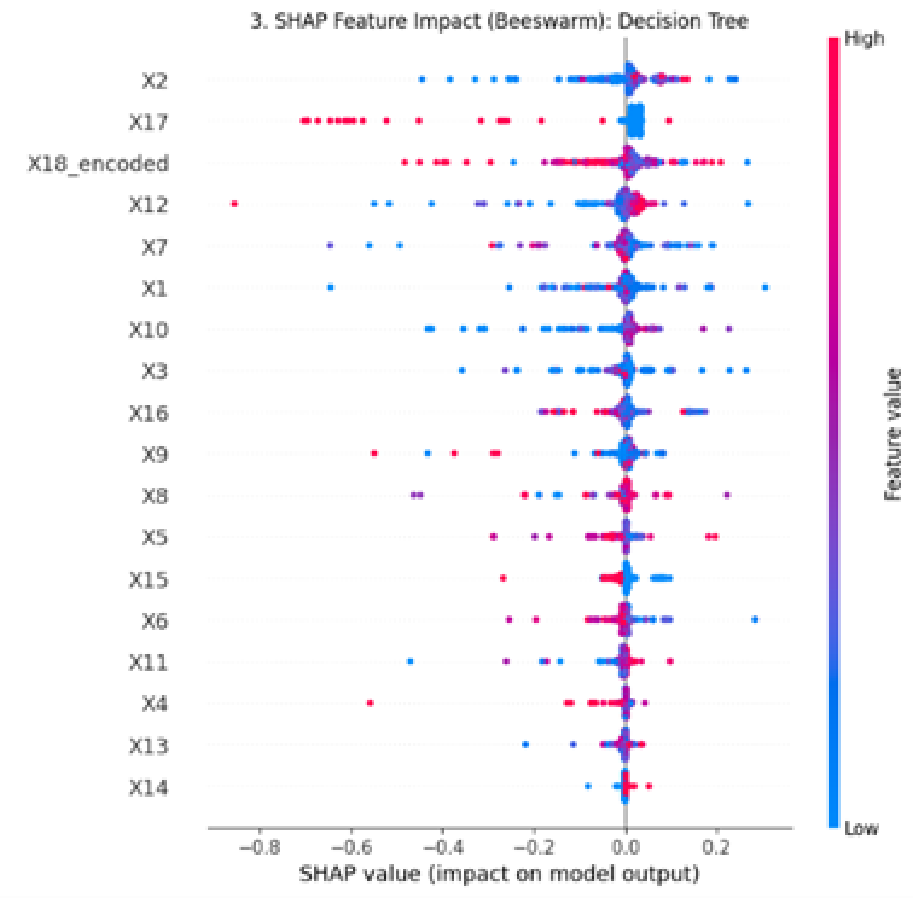
Figure 9.
Built-in Feature Importance: Random Forest.
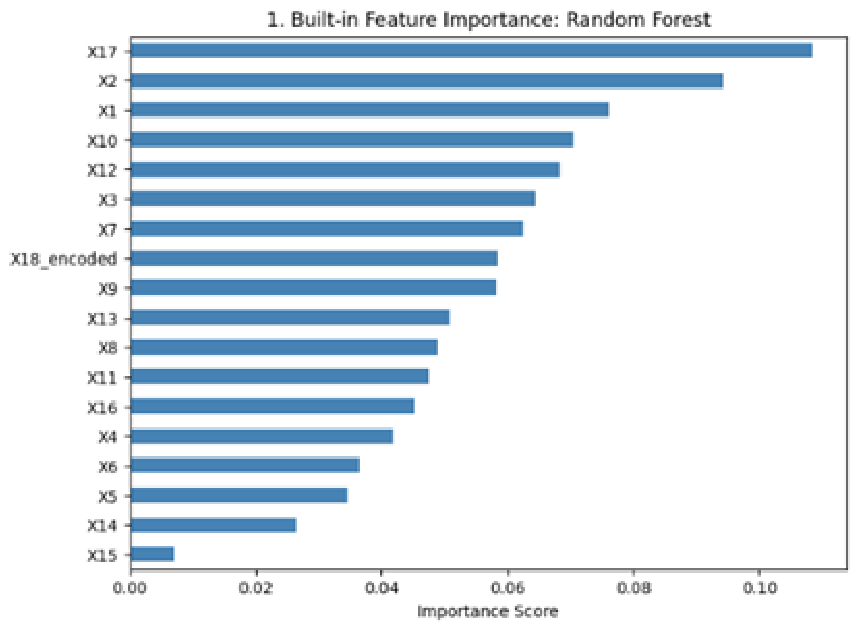
Figure 10.
SHAP Global Importance: Random Forest.
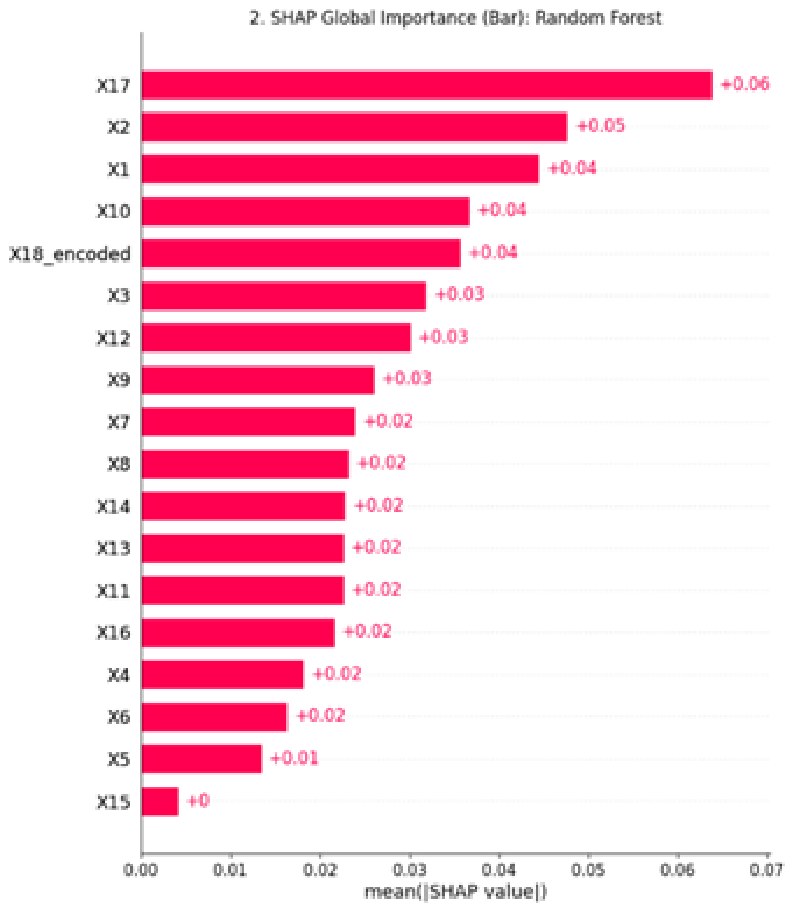
Figure 11.
SHAP Beeswarm: Random Forest.
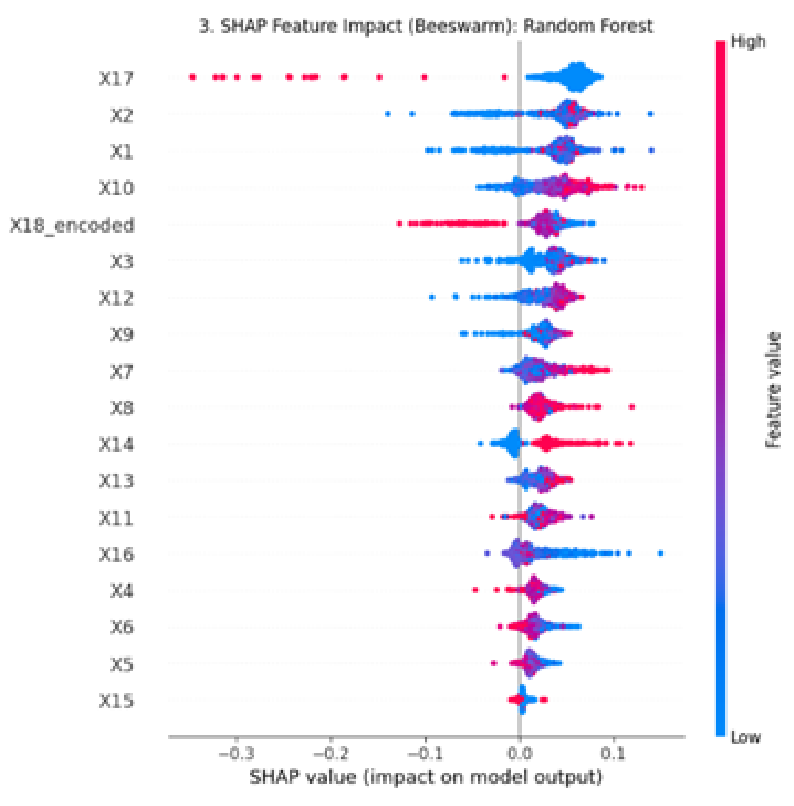
Figure 12.
Built-in Feature Importance: XGBoost.
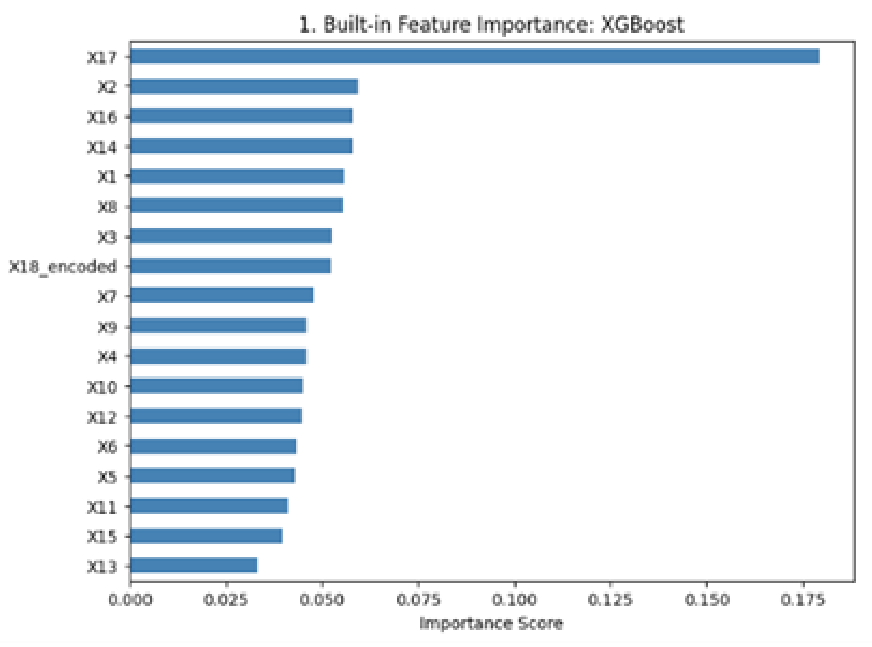
Figure 13.
SHAP Global Importance: XGBoost.
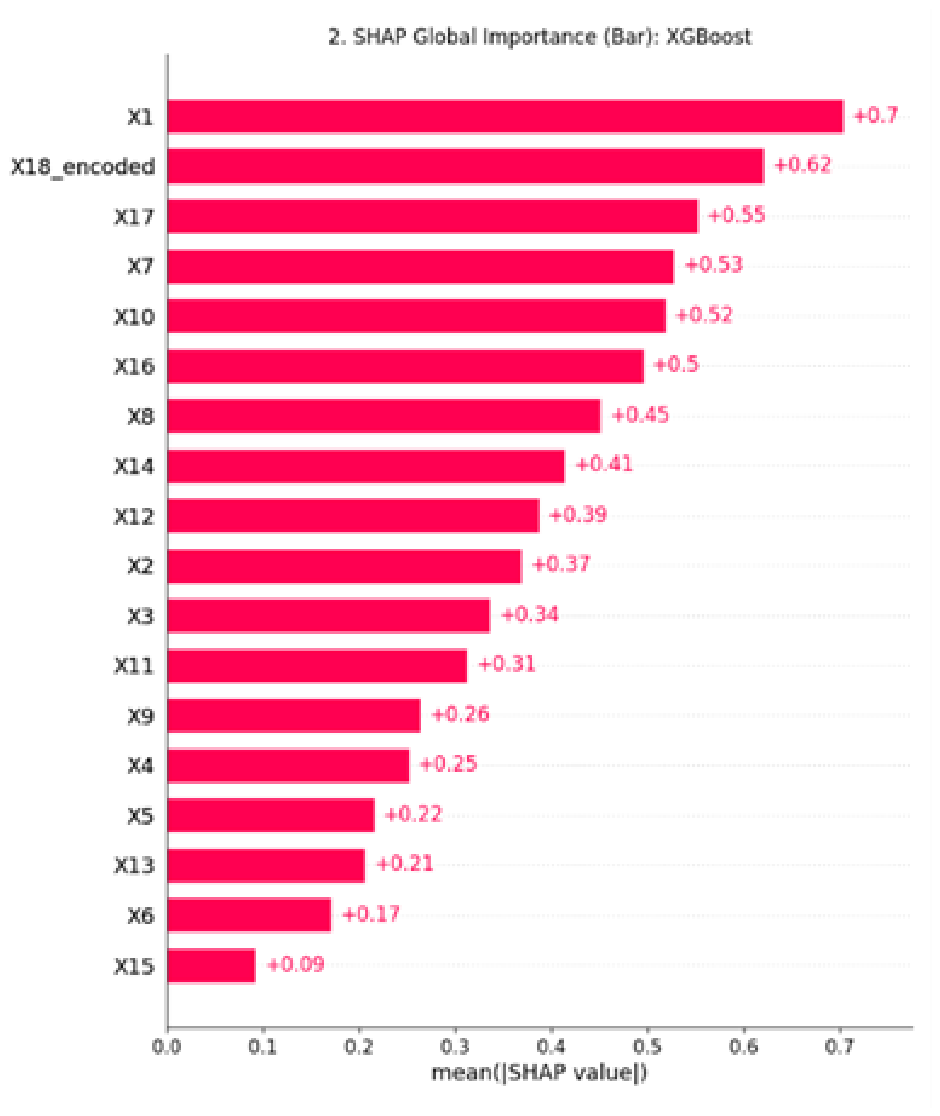
Figure 14.
SHAP Beeswarm: XGBoost.
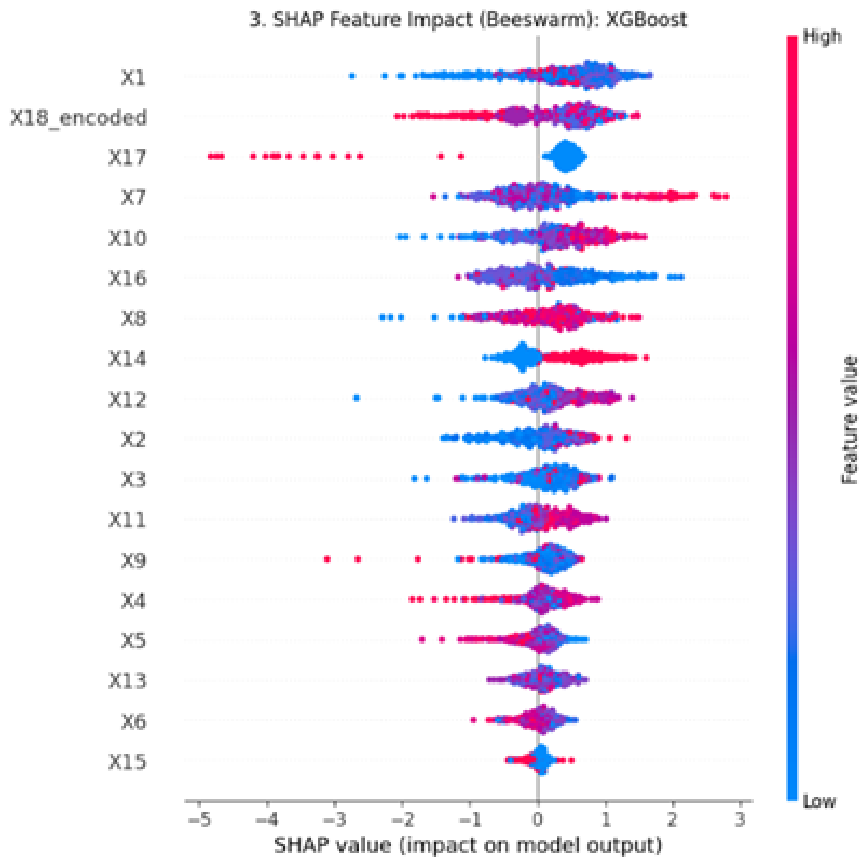
Figure 15.
Built-in Feature Importance: LightGBM.
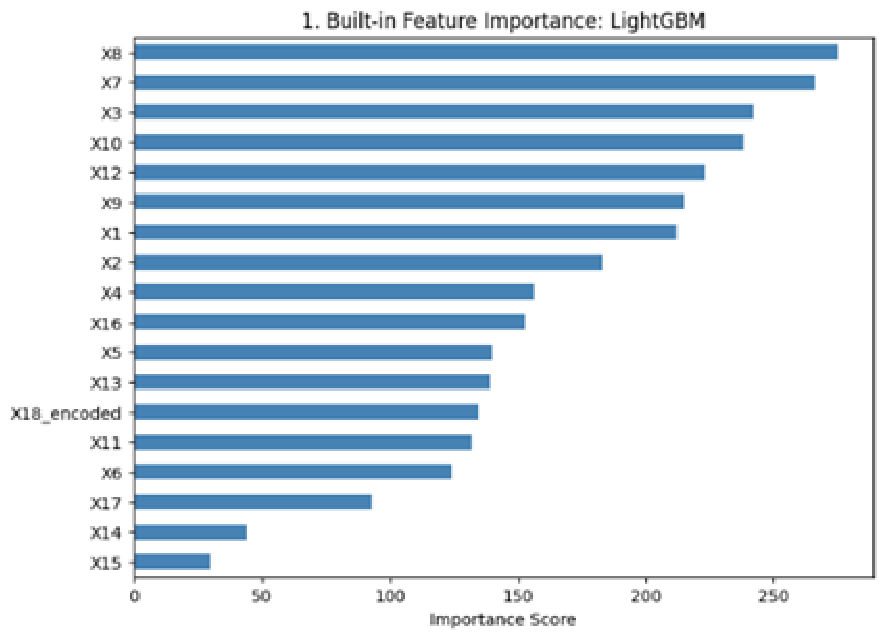
Figure 16.
SHAP Global Importance: LightGBM.
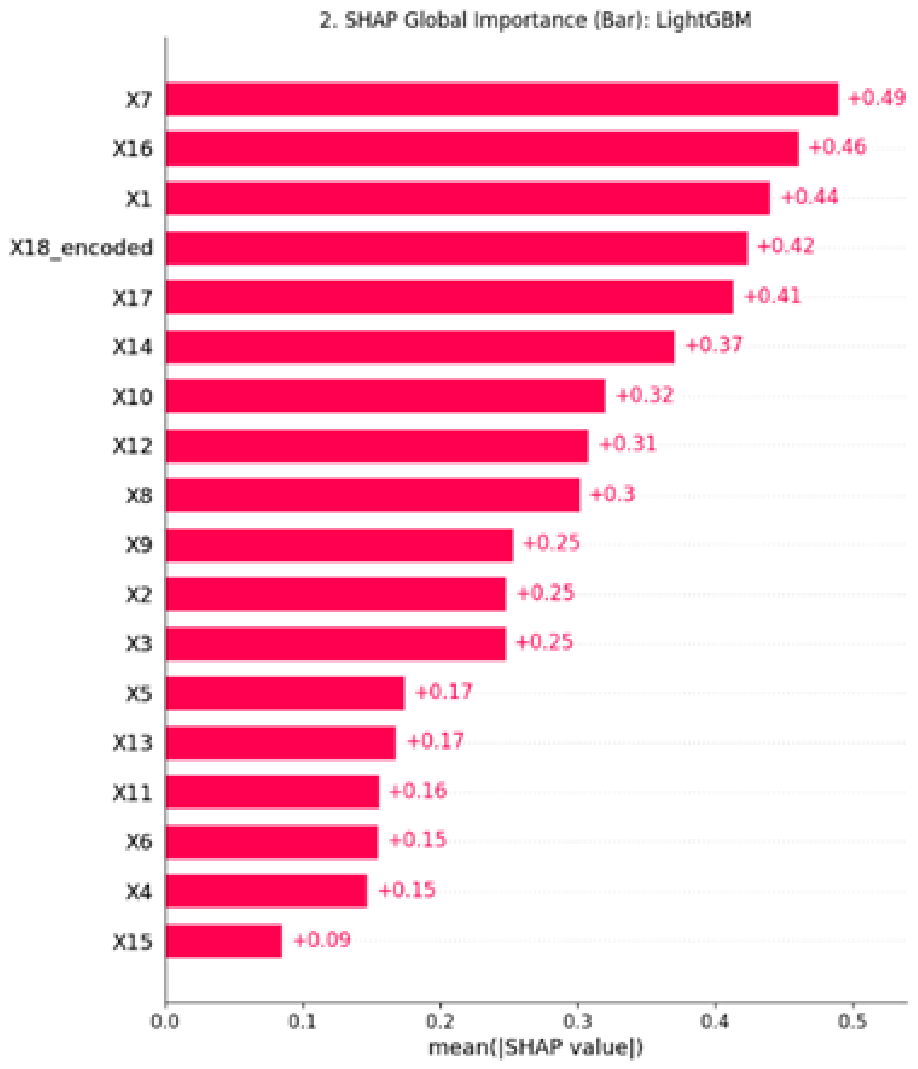
Figure 17.
SHAP Beeswarm: LightGBM.
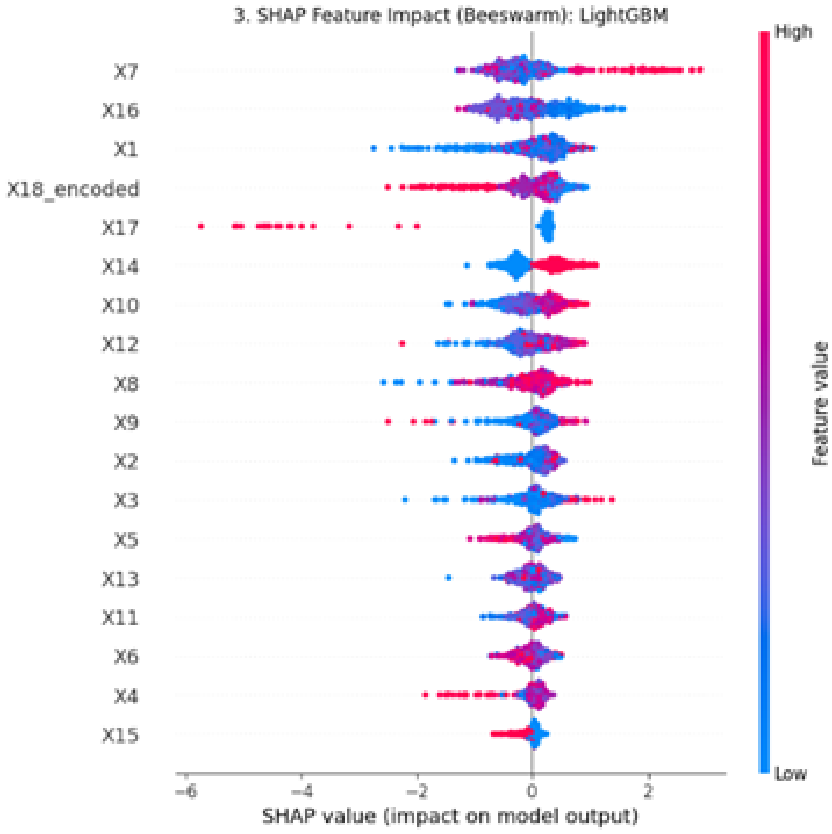
Figure 18.
Built-in Feature Importance: CatBoost.
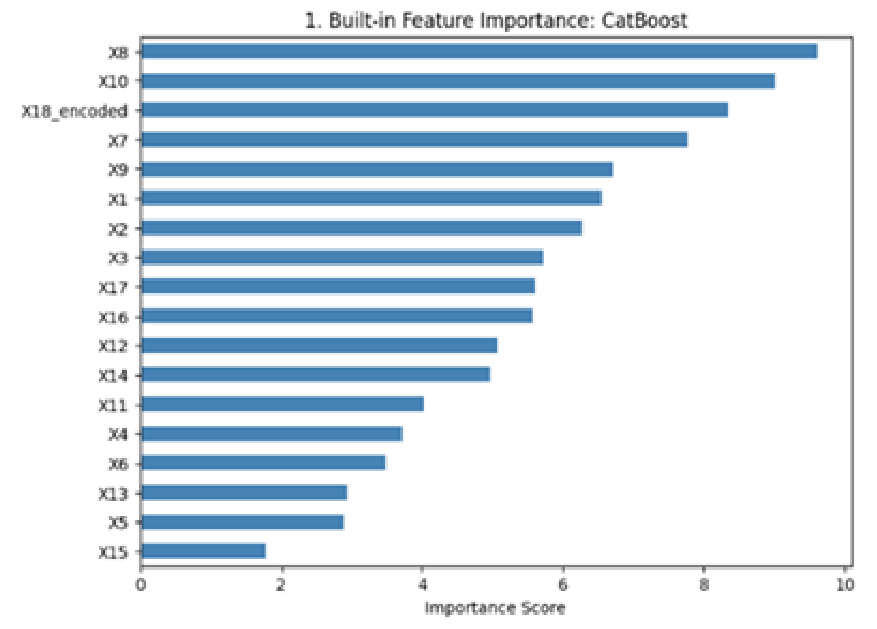
Figure 19.
SHAP Global Importance: CatBoost.
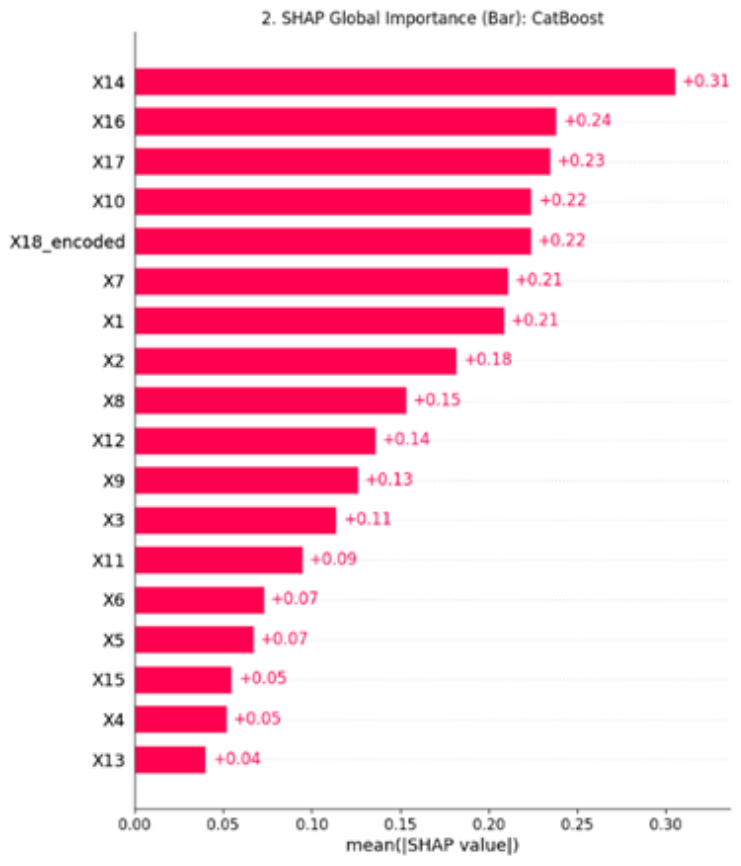
Figure 20.
SHAP Beeswarm: CatBoost.
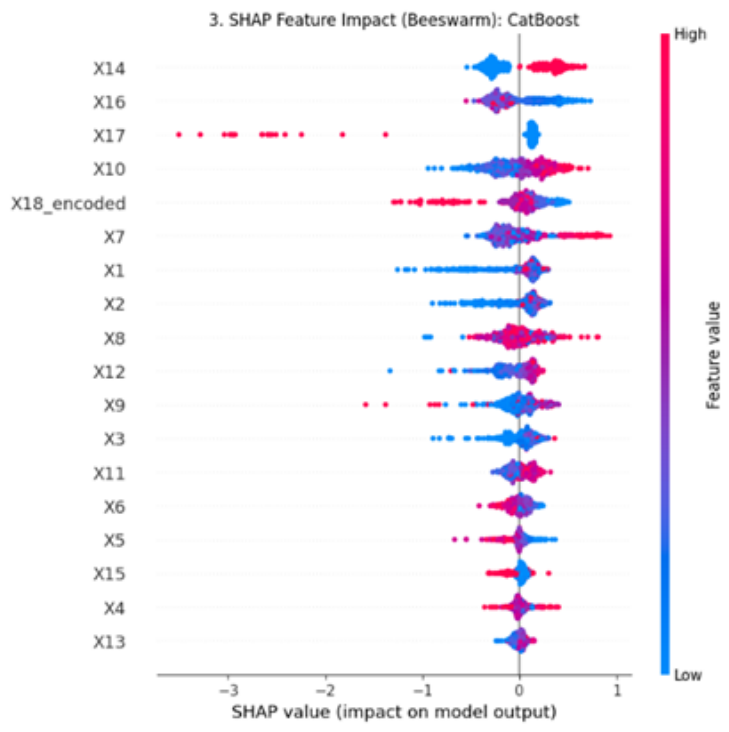
Figure 21.
All Models: Built-in Feature Importance Heatmap.
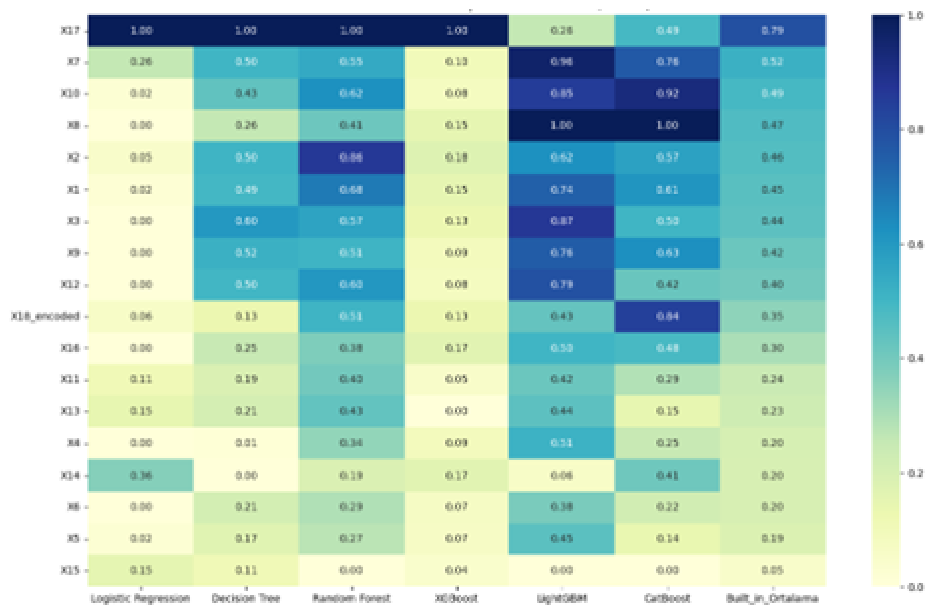
Figure 22.
All Models: Global SHAP Importance Heatmap.
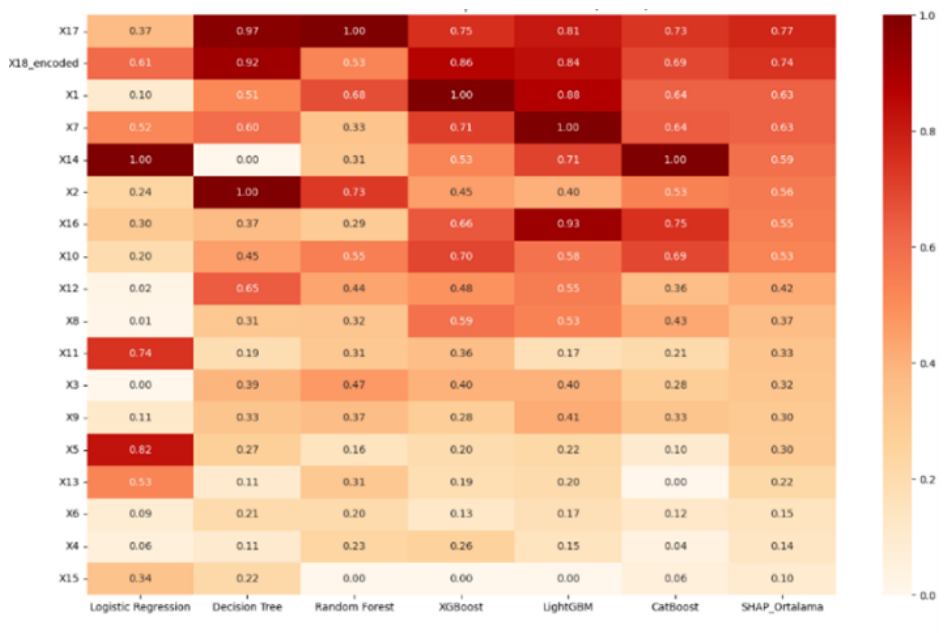
Figure 23.
Built-in Feature Importance and Global SHAP Importance Comparison.
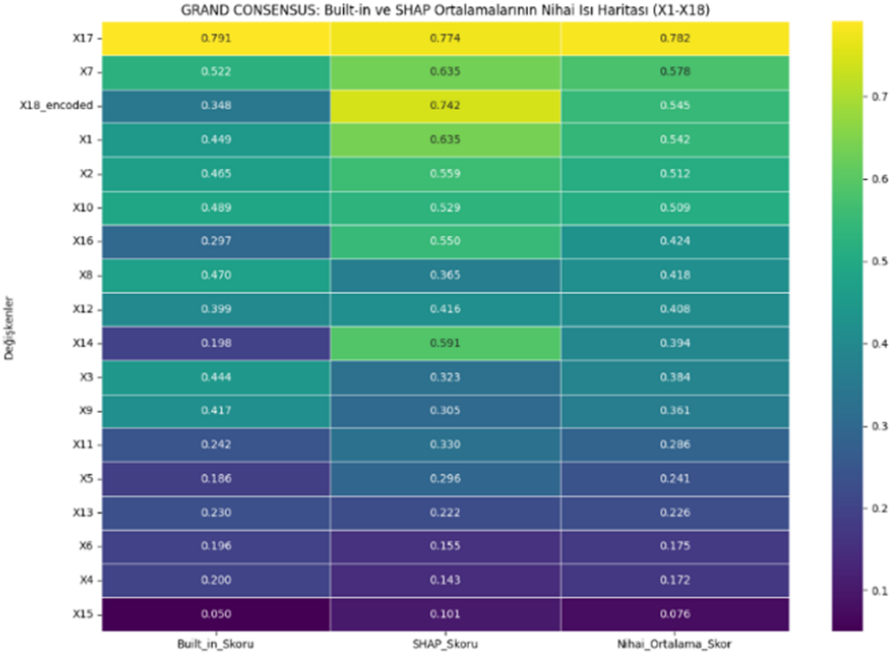

Table 1.
Distribution of Audit Opinions.
| Type of Audit Opinion | Number | Percentage (%) |
|---|---|---|
| Unmodified Opinion | 2,210 | 91.51% |
| Opinion Other than Unmodified Opinion | 205 | 8.49% |
| Total | 2,415 | 100% |
Table 2.
Distribution of the Sample by Operating Sector.
| No. | Operating Sector | Number of Firms | Percentage (%) |
|---|---|---|---|
| 1 | Food, beverages, and tobacco | 46 | 19.34% |
| 2 | Chemicals, pharmaceuticals, petroleum, rubber, and plastic products | 46 | 19.34% |
| 3 | Fabricated metal products, machinery, electrical equipment, and transportation vehicles | 43 | 18.11% |
| 4 | Non-metallic mineral products | 28 | 11.52% |
| 5 | Basic metal industry | 27 | 11.93% |
| 6 | Textiles, wearing apparel, and leather | 27 | 11.11% |
| 7 | Paper and paper products, printing | 14 | 5.76% |
| 8 | Wood products and furniture | 6 | 2.47% |
| 9 | Other manufacturing industries | 1 | 0.41% |
| Total Manufacturing Sector | 238 | 100% | |
Table 3.
Variable Descriptions.
| Variables | Symbol | Descriptions |
|---|---|---|
| Dependent Variable | ||
| Audit Opinion | Y | Unmodified Opinion (1) vs. Opinion Other than Unmodified Opinion (0) |
| Independent Variables | ||
| Financial Variables | ||
| Liquidity | X1 | Current Ratio |
| X2 | Acid-Test Ratio | |
| X3 | Cash Ratio | |
| Profitability | X4 | Return on Equity |
| X5 | Return on Assets | |
| X6 | Net Profit Margin | |
| Turnover Analysis | X7 | Asset Turnover Ratio |
| X8 | Inventory Turnover Ratio | |
| Debt-to-Equity Ratio | X9 | Total Debt / Total Equity |
| Firm Size | X10 | Natural logarithm of total assets |
| Financial Distress | X11 | Zmijewski Score |
| X12 | Altman Z-Score | |
| X13 | Springate Score | |
| Non-Financial Variables | ||
| Auditor Type / Size | X14 | Big Four (1) vs. Non-Big Four (0) |
| Audit Firm Change | X15 | Auditor changed (1) vs. did not change (0) |
| Audit Report Lag | X16 | Number of days between the fiscal year-end and the audit report date |
| Previous Year’s Audit Opinion | X17 | Opinion other than unmodified opinion in the previous year (1) vs. unmodified opinion in the previous year (0) |
| Operating Sector | X18 | Manufacturing sub-sector of the firm: food, beverages, and tobacco; textiles, apparel, and leather; wood products and furniture; paper and printing; chemicals, petroleum, and plastics; non-metallic mineral products; basic metals; fabricated metal products, machinery, and transportation vehicles; and other manufacturing industries. |
Table 4.
Descriptive Statistics of Research Variables.
| Variables | Count | Mean | Std. Dev. | Min | Max |
|---|---|---|---|---|---|
| X1 | 2,415 | 2.021 | 2.185 | 0.032 | 43.864 |
| X2 | 2,415 | 1.268 | 1.745 | 0.020 | 33.452 |
| X3 | 2,415 | 0.440 | 1.093 | 0.000 | 18.701 |
| X4 | 2,415 | 1.053 | 154.127 | −4.885 | 2.419 |
| X5 | 2,415 | 3.936 | 18.381 | −205.096 | 680.457 |
| X6 | 2,415 | −12.267 | 668.723 | −32.702 | 624.885 |
| X7 | 2,415 | 0.907 | 0.528 | 0.000 | 4.742 |
| X8 | 2,415 | −22.666 | 729.090 | −35.696 | 0.000 |
| X9 | 2,415 | 181.558 | 1.310 | −17.382 | 55.487 |
| X10 | 2,415 | 20.414 | 2.052 | 15.483 | 27.068 |
| X11 | 2,415 | −1.557 | 2.358 | −6.444 | 44.461 |
| X12 | 2,415 | 2.388 | 2.502 | −57.242 | 34.932 |
| X13 | 2,415 | 0.969 | 1.240 | −7.949 | 24.471 |
| X14 | 2,415 | 0.434 | 0.496 | 0.000 | 1.000 |
| X15 | 2,415 | 0.264 | 0.441 | 0.000 | 1.000 |
| X16 | 2,415 | 68.658 | 26.922 | 21.000 | 493.000 |
| X17 | 2,415 | 0.046 | 0.209 | 0.000 | 1.000 |
Table 5.
Model Performance Summary.
| Model | Accuracy | Precision | Recall | F1-Score | AUC |
|---|---|---|---|---|---|
| XGBoost | 0.921 | 0.933 | 0.984 | 0.958 | 0.866 |
| CatBoost | 0.919 | 0.935 | 0.979 | 0.956 | 0.822 |
| Random Forest | 0.917 | 0.925 | 0.988 | 0.956 | 0.845 |
| LightGBM | 0.917 | 0.935 | 0.977 | 0.955 | 0.858 |
| Decision Tree | 0.884 | 0.946 | 0.925 | 0.935 | 0.682 |
| Logistic Regression | 0.761 | 0.952 | 0.778 | 0.856 | 0.684 |
Disclaimer/Publisher’s Note: The statements, opinions and data contained in all publications are solely those of the individual author(s) and contributor(s) and not of MDPI and/or the editor(s). MDPI and/or the editor(s) disclaim responsibility for any injury to people or property resulting from any ideas, methods, instructions or products referred to in the content. |
© 2026 by the authors. Licensee MDPI, Basel, Switzerland. This article is an open access article distributed under the terms and conditions of the Creative Commons Attribution (CC BY) license (http://creativecommons.org/licenses/by/4.0/).
Copyright: This open access article is published under a Creative Commons CC BY 4.0 license, which permit the free download, distribution, and reuse, provided that the author and preprint are cited in any reuse.


