
Submitted:
28 July 2026
Posted:
29 July 2026
You are already at the latest version
Abstract
Oil-based mud filtrate (OBMF) invasion significantly alters the petrophysical response of nuclear magnetic resonance (NMR) logging, severely compromising the accuracy of reservoir fluid identification and petrophysical evaluation. However, the NMR relaxation behavior of OBMF under elevated temperatures (up to 100 °C) and low-frequency (< 2MHz) conditions remains poorly understood. In this study, temperature-dependent NMR experiments were conducted from 30°C to 100°C at a fixed frequency of 21MHz, while frequency-dependent experiments were performed from 1 MHz to 21MHz at 30°C. Using combined analysis of T₂ spectra and T₂-T₁ two-dimensional spectra, the effects of temperature and magnetic field frequency on the relaxation characteristics of OBMF were investigated under the conditions of this study. The results show that increasing temperature shifts the T₂ distribution toward longer relaxation times, increases T₁ values, and decreases the T₁/T₂ ratio. In contrast, decreasing frequency leads to prolonged T₂ relaxation times, shortened T₁ relaxation times, and a decreased T₁/T₂ ratio. Based on these experimental findings, a dual-parameter model incorporating both temperature and frequency was established for OBMF. The proposed model serves as a theoretical reference for the analysis and correction of NMR logging data acquired under oil-based mud invasion conditions.
Keywords:
oil-based mud filtrate
; nuclear magnetic resonance
; temperature dependence
; frequency dependence
; T₂ spectrum
; T₂-T₁ two-dimensional NMR
0. Introduction
As deep, ultra-deep and unconventional hydrocarbon resources—including shale oil and tight sandstone gas—have become the primary frontier for global energy replacement[1], oil-based mud (OBM) has emerged as the preferred drilling fluid system for such complex formations, owing to its superior wellbore stability, excellent lubricity, and high-temperature resistance[2,3,4]. However, the severe interference caused by OBM filtrate invasion on nuclear magnetic resonance (NMR) logging responses has become a critical bottleneck that constrains the accuracy of fluid identification and petrophysical property evaluation[5,6].
Early investigations focused on the physical mechanisms governing OBM invasion and its underlying NMR response characteristics. In 2018, Hursan et al. systematically examined the influence of oil-based mud filtrate (OBMF) invasion on NMR logging responses, demonstrating that the degree of invasion is jointly controlled by multiple factors—including rock mineral composition, pore microstructure, mud properties, and differential pressure—thereby establishing an experimental foundation for subsequent research[7]. In the same year, Kesserwan et al. employed NMR relaxometry combined with core-flooding experiments to monitor the differential effects of OBM solid–liquid two-phase invasion on reservoir petrophysical properties. Their study further revealed that because OBMF exhibits a long relaxation time, its invasion shifts the free-fluid peak of the NMR T₂ spectrum towards longer relaxation times, consequently compromising accurate reservoir fluid identification[8].As OBM drilling expanded in scale, research efforts shifted towards quantitative correction and multi-factor experimental analysis. In 2021, Sun et al. proposed a novel T₂ spectrum morphology correction method based on a multi-dimensional matrix approach for low-porosity, low-permeability sandstone gas reservoirs in the East China Sea. By comparing NMR responses between OBM wells and adjacent water-based mud wells, they classified reservoir rocks into four categories according to pore structure and established a permeability correction model, reducing the relative error of permeability calculations from 779.37% to 34.32%—substantially improving reservoir evaluation accuracy[9]. In 2023, Zhang et al. conducted a systematic petrophysical experimental study on ultra-deep tight conglomerate reservoir cores from the southern margin of the Junggar Basin, examining six controlling factors: rock physical properties, drilling fluid composition, oil–water ratio, invasion time, and temperature. They found that after OBM base fluid invaded the formation under differential pressure and capillary forces, the micropore T₂ peak (<10 ms) shifted leftward, whereas the mesopore T₂ peak (>100 ms) shifted rightward with an increased area. The rate of these changes was primarily governed by permeability, invasion time, and temperature[10]. In the same year, Wu et al. reported in their application of logging-while-drilling (LWD) NMR in the western South China Sea that OBM invasion alters formation wettability and causes pronounced T₂ spectral distortion, highlighting the complex challenges faced by NMR logging under LWD conditions[11].In recent years, the research focus has evolved from single T₂ spectrum analysis towards multi-dimensional NMR response feature extraction and intelligent interpretation. In 2024, Gao and Xiao et al. published a study in SPE Journal that clarified the differential NMR response mechanisms of OBM invasion in oil-bearing versus water-bearing zones within heterogeneous conglomerate reservoirs: when invading water-bearing zones, the T₂ spectrum exhibits a unimodal or bimodal distribution, whereas a trimodal distribution may appear in oil-bearing zones. By extracting sensitive parameters—including the fractional populations of micropores, mesopores, and macropores—they established a fluid-typing discriminant factor, providing a quantitative criterion for fluid identification in OBM wells[12]. In 2025, Akomolafe et al. revealed the substantial influence of drilling-fluid bulk relaxation on NMR T₂ interpretation, demonstrating that filtrate relaxation properties govern the apparent response of formation fluids; however, that study was limited to water-based systems, leaving the behavior of OBMF at high temperatures unresolved[13]. Meanwhile, Zhou et al. reviewed advances in pore-fluid research in shales from a multi-scale NMR perspective, emphasizing that the frequency dependence of relaxation mechanisms serves as a critical bridge between laboratory and well-log-scale data[14]. In 2026, Guo et al. and Pang et al. respectively reported numerical simulations of two-dimensional NMR T₁–T₂ responses under OBMF invasion in tight gas reservoirs and a new method for identifying pore fluids under OBM drilling conditions based on NMR logging[15,16]. In the same year, Ishag introduced a three-dimensional statistical algorithm for fluid identification and response analysis in tight sandstone reservoirs under OBM invasion[17], marking a move towards greater refinement and intelligence in the field. Nevertheless, the high-temperature, low-frequency NMR parameters of OBMF required by these numerical simulations remain assumptions that have yet to be experimentally validated.
A synthesis of recent studies reveals that three critical gaps continue to limit the accuracy of NMR logging under OBM drilling conditions. First, most existing temperature-correction models have been developed for carbonate rocks or water-based mud systems, leaving the quantitative relationship between temperature and T₂ relaxation for oil-based mud filtrate under high-temperature (>100°C) conditions largely undefined. Second, the operating frequencies of current LWD-NMR tools are predominantly concentrated around 2 MHz, yet the frequency dependence of filtrate relaxation mechanisms in the ultra-low-frequency regime below 2 MHz remains virtually unexplored. Finally, although temperature-correction charts have been proposed conceptually, systematic experimental data on the fundamental NMR petrophysical parameters of OBMF—particularly under high-temperature and variable-frequency conditions—remain scarce. This paucity of data severely constrains the accurate evaluation of deep and ultra-deep reservoirs drilled with oil-based mud, thereby compromising the reliability of porosity, permeability, and fluid saturation calculations.
To address the above limitations, this study conducted NMR experiments on OBMF under high-temperature and variable-frequency conditions (from 21 MHz down to the ultra-low frequency of 1 MHz). The differentiated effects of increasing temperature and decreasing frequency on the relaxation times were quantitatively revealed, and a dual-parameter empirical model incorporating both temperature and frequency was established. The results can provide direct experimental constraints and preliminary quantitative relationships for the correction of NMR logging data under oil-based mud drilling conditions.
1. Experimental Method
1.1. Sample Preparation
To replicate authentic drilling conditions, the experimental samples were obtained from drilling fluid collected at the CNOOC Chunxiao Oilfield well site. The base fluid comprised No. 3 white oil, supplemented primarily with calcium chloride solution and emulsifier. To isolate the oil-based mud filtrate, the mud samples were centrifuged at 4,500 rpm for 15 minutes. After centrifugation, the supernatant was collected and subjected to preliminary filtration through gauze to remove larger residual solid particles. To further enhance filtrate purity, the filtered mud filtrate underwent an additional round of centrifugation and filtration. The final OBMF product was a solid-free pure fluid. A schematic of the sample preparation workflow is shown in Figure 1.
1.2. Experiment Design
To investigate the temperature and frequency dependence of NMR relaxation behavior in oil-based mud filtrate, two sets of experiments were designed: variable-temperature measurements conducted under a high-frequency condition, and multi-frequency measurements performed at ambient temperature. To meet the requirements of NMR measurements at elevated temperatures, a dedicated high-temperature, high-pressure NMR testing system was employed. The complete experimental setup is illustrated in Figure 2.
For the variable-temperature experiments, conventional glass vials were avoided due to the risk of failure at elevated temperatures. Instead, sample holders were fabricated from polyether ether ketone (PEEK)—a material with high thermal resistance and a low NMR background signal. The NMR background signal of PEEK is substantially weaker than that of OBMF, allowing the two signals to be clearly distinguished in the T₂ spectrum and facilitating straightforward background subtraction during subsequent data processing. The experimental procedures were as follows: (1) High-frequency variable-temperature experiments. The prepared OBMF was injected into a PEEK sample holder, which was then wrapped with heat-shrink tubing to prevent penetration of the confining fluid. The sealed assembly was placed in a 21 MHz NMR core analyzer. Confining pressure was set to 3 MPa and displacement pressure to 1 MPa. Temperature was sequentially set to 30, 40, 50, 60, 70, 80, 90, and 100 °C. At each temperature step, after stabilizing for 30 min, T₂ spectra and T₂–T₁ two-dimensional correlation maps were acquired. To evaluate the reversibility of heating-induced changes in the relaxation characteristics, the system was subsequently cooled in a controlled manner following the completion of measurements at 100 °C; T₂ and T₂–T₁ measurements were repeated after stabilizing at 80 °C and 50 °C, respectively. (2) Ambient-temperature multi-frequency experiments. At room temperature, the PEEK sample holder containing OBMF was placed in NMR core analyzers operating at different Larmor frequencies. T₂ spectra and T₂–T₁ two-dimensional correlation maps were acquired successively at 21, 12, 2, and 1 MHz.
It should be noted that NMR measurements under each condition in this study were performed as single acquisitions, and systematic replicate measurements were not conducted. To indirectly verify the reliability of the experimental data, we performed heating–cooling cycle measurements at 50 °C and 80 °C at 21 MHz.
1.3. Experiment Parameters
To eliminate potential bias arising from differences in acquisition parameters, identical measurement settings were adopted across the four NMR core analyzers operating at distinct Larmor frequencies (21, 12, 2, and 1 MHz). T₂ measurements were performed using the CPMG pulse sequence with the following acquisition parameters: waiting time (TW) = 6,000 ms, echo spacing (TE) = 0.2 ms, and number of echoes (NECH) = 12,000. T₂–T₁ two-dimensional measurements were conducted using the IR-CPMG pulse sequence, with 15 inversion time points, TE = 0.2 ms, TW = 6,000 ms, and NECH = 12,000. To ensure adequate signal-to-noise ratio (SNR) under low-frequency conditions, the number of signal accumulations was set to 8 at 21 and 12 MHz, and to 64 at 2 and 1 MHz.

Table 1.
NMR measurement parameters.
| Frequency | TW/ms | TE/ms | NECH | Scans |
| 21MHz | 6000 | 0.2 | 12000 | 8 |
| 12MHz | 6000 | 0.2 | 12000 | 8 |
| 2MHz | 6000 | 0.2 | 12000 | 64 |
| 1MHz | 6000 | 0.2 | 12000 | 64 |
2. Experimental Results
2.1. Temperature Dependence
Variable-temperature NMR measurements were performed on the oil-based mud filtrate, and the resulting T₂ spectra are presented in Figure 3. At 30 °C, the spectral peak center of the OBMF was located at T₂ = 35 ms. When the temperature was raised to 40 °C, the peak center shifted rightward to T₂ = 43 ms, accompanied by a decrease in the peak signal amplitude. With further increases in temperature, the T₂ spectrum continued to shift towards longer relaxation times, while the peak amplitude progressively declined. These results indicate that, as temperature increases, the NMR relaxation signal of OBMF migrates towards longer T₂ times, and the signal intensity exhibits a gradually diminishing trend.
Figure 4 presents the T₂–T₁ two-dimensional correlation maps of OBMF acquired at different temperatures following static calibration. Across the tested temperature range, the T₂ and T₁ values corresponding to the OBMF signal peak exhibited a progressive increase with rising temperature, manifested as a pronounced shift of the entire signal towards the upper-right region of the correlation map.
As shown in Figure 5, when the temperature was reduced to 80 °C and 50 °C, respectively, both the peak center and spectral width of the OBMF T₂ distribution were largely consistent with those obtained at the corresponding temperatures during the heating phase, indicating that the modulation of the T₂ relaxation time by temperature is reversible. However, the signal amplitude measured during the cooling phase was markedly lower than that recorded during the heating phase.
Figure 6 presents the T₂–T₁ two-dimensional correlation maps of OBMF, acquired after static calibration at 80 °C and 50 °C during both the heating and cooling phases. When the temperature was reduced to 80 °C and 50 °C, respectively, both the T₂ and T₁ values of the OBMF were in complete agreement with those obtained at the corresponding temperatures during the heating phase. However, the signal amplitude was notably lower than that recorded during heating. These observations further confirm that the modulation of the T₂ relaxation time of OBMF by temperature is reversible.
In summary, the T₂ and T₁ values of OBMF exhibit a pronounced temperature dependence: both increase with rising temperature across the tested range, and this variation is reversible.
2.2. Frequency dependence
Figure 7 compares the T₂ spectra of OBMF acquired at different Larmor frequencies under a constant temperature of 30 °C. As the frequency decreased, the peak center of the OBMF T₂ distribution shifted towards longer relaxation times. Specifically, when the frequency was reduced from 21 MHz to 1 MHz, the T₂ value increased from 35 ms to 80 ms, demonstrating a pronounced frequency dependence.
Figure 8 compares the T₂–T₁ two-dimensional correlation maps of OBMF acquired at different Larmor frequencies under ambient-temperature conditions. The results show that, as the Larmor frequency decreased, the T₂ values of OBMF progressively increased, whereas the T₁ values decreased. On the two-dimensional correlation map, this behavior was manifested as a downward-rightward shift of the signal peak. These observations indicate that both the T₂ and T₁ values of OBMF are influenced by the Larmor frequency, and that their responses to frequency variation follow opposing trends.
3. Results Discussion
3.1. Theoretical Analysis
NMR relaxation in hydrogen-bearing fluids originates from the coupling between nuclear spins and randomly fluctuating magnetic fields generated by surrounding molecular dynamic processes. Intramolecular dipole–dipole interactions play a decisive role in this process and constitute the dominant factor influencing both the longitudinal (T₁) and transverse (T₂) relaxation times. According to the classical Bloembergen–Purcell–Pound (BPP) relaxation theory, the relaxation behavior of T₁ and T₂ can be described as a function of key parameters, including the Larmor frequency and the molecular rotational correlation time[18].
where K is a constant associated with the spinning nucleus, is the molecular rotational correlation time, and is the Larmor frequency. The correlation time is closely related to both temperature and viscosity, and its expression is given by Equation (3):
where η is the viscosity of the fluid at temperature T, a is the molecular radius, and is the Boltzmann constant.
Synthesis of the BPP theory and the correlation time formalism indicates that the magnetic field frequency directly influences the T₁ and T₂ relaxation rates through the frequency-dependent coupling term . Concurrently, variations in temperature alter the viscosity–temperature ratio η/T, which in turn modulates the molecular rotational correlation time , ultimately affecting the relaxation times.
3.2. T2 Relaxation Time's Dependence on Temperature and Frequency
The geometric mean of T₂ (T2gm) provides a single numerical descriptor that captures the overall position of the T₂ distribution, making it well suited for quantitative characterization of the NMR relaxation behavior of a single fluid[19,20]. For OBMF, T2gm effectively represents the overall relaxation characteristics of molecular motion within the system, and is calculated as follows:
where i denotes the i-th sampling point on the T₂ spectrum, T₂ᵢ and ϕᵢ represent the T₂ relaxation time and the corresponding signal amplitude at the i-th sampling point, respectively, and is the cumulative sum of the signal amplitudes over all sampling points in the T₂ spectrum.
The T2gm of OBMF was calculated under two sets of conditions: (i) at a fixed Larmor frequency of 21 MHz across the full range of measurement temperatures, and (ii) at ambient temperature (30 °C) across the full range of measurement frequencies. The results are presented in Figure 9. Fitting the variable-temperature data at a fixed frequency revealed a robust exponential relationship between T2gm and temperature, with a correlation coefficient of 0.996. Meanwhile, at a fixed temperature, T2gm
exhibited a clear power-law dependence on frequency, yielding a correlation coefficient of 0.9756:
According to the BPP model, the T₂ relaxation time generally follows a power-law decay with respect to frequency, while being inversely proportional to viscosity—which itself decreases with increasing temperature. Therefore, the observed exponential increase in T₂ relaxation time with rising temperature is consistent with theoretical expectations. From a mechanistic standpoint, temperature primarily influences the relaxation process by altering fluid dynamic properties—namely, viscosity and molecular diffusion—whereas frequency modulates relaxation through the strength of the magnetic-field–diffusion coupling. These two mechanisms operate independently and without mutual interference. Consequently, the dependence of the T₂ relaxation time on temperature and frequency satisfies a separable product model, which can be described by a unified mathematical expression:
where A is the model coefficient, T is the temperature, and f is the frequency. Using the experimental result obtained at T = 30 °C and f = 21 MHz as a cross-validation reference, the model coefficient A was determined to be 47.49. Accordingly, the relationship between the transverse relaxation time of OBMF, temperature, and frequency can be expressed as:
Figure 10 presents a visualization of the proposed model, illustrating that the T₂ of OBMF increases with both rising temperature and decreasing frequency. This behavior provides a useful reference for correcting NMR logging data acquired downhole for the effects of temperature and operating frequency. Furthermore, by comparing the model-calculated values with the measured data (Table 2), the maximum absolute error is within 7 ms and the relative error is less than 11%. It should be noted that, in the absence of a complete dataset of crossed temperature–frequency measurements, the separability assumption has not been sufficiently demonstrated. The model should therefore be presented as a preliminary empirical relationship with clearly stated limitations.
3.3. Analysis of 2D Experiment Results
Projecting the measured T₂–T₁ two-dimensional correlation maps of OBMF onto the respective axes yields the corresponding T₂ and T₁ spectra (Figure 11). The geometric mean of the can be used as an approximate representative value of the T₁ relaxation time. To visually characterize the overall variation trends of T₂ and T₁, as well as their relative relationship, the relaxation time ratio R = T₁/T₂ is commonly employed as a quantitative metric[21,22].
The of OBMF was calculated under two sets of conditions: (i) at a fixed Larmor frequency of 21 MHz across the full range of measurement temperatures, and (ii) at ambient temperature (30 °C) across the full range of measurement frequencies. The results are presented in Figure 12. Fitting the data revealed that T₁ exhibits a power-law relationship with both temperature and frequency, yielding correlation coefficients of 0.9932 and 0.9793, respectively:
Following the methodology described in Section 3.2, a comprehensive model describing the dependence of the T₁ relaxation time of OBMF on both frequency and temperature can be established:
Based on this relational model, a chart illustrating the variation of the OBMF R with frequency and temperature was constructed, as presented in Figure 13. The chart visually demonstrates that T₁ increases with both rising temperature and increasing frequency. A comparison between the model-predicted values and the experimental measurements is provided in Table 3. The results indicate that the maximum absolute error is 25.64 ms and the maximum relative error is within 11%, demonstrating that the proposed model achieves reasonably good predictive performance.
Based on the calculated and data, the variation of R with frequency and temperature was obtained. As shown in Figure 14, at a fixed frequency, R exhibits a strong linear relationship with temperature (correlation coefficient = 0.9888); at a fixed temperature, R follows a power-law relationship with frequency (correlation coefficient = 0.9967):
Considering the combined effects of frequency and temperature on R, a comprehensive relationship model of R as a function of frequency and temperature was established:
Figure 15 presents a comprehensive chart of the OBMF R as a function of both frequency and temperature, established on the basis of the proposed model. The chart visually demonstrates that R decreases with increasing temperature and increases with increasing frequency. As shown in Table 4, the model-calculated values are in good agreement with the measured data, with absolute errors all below 1 and relative errors within 7%.
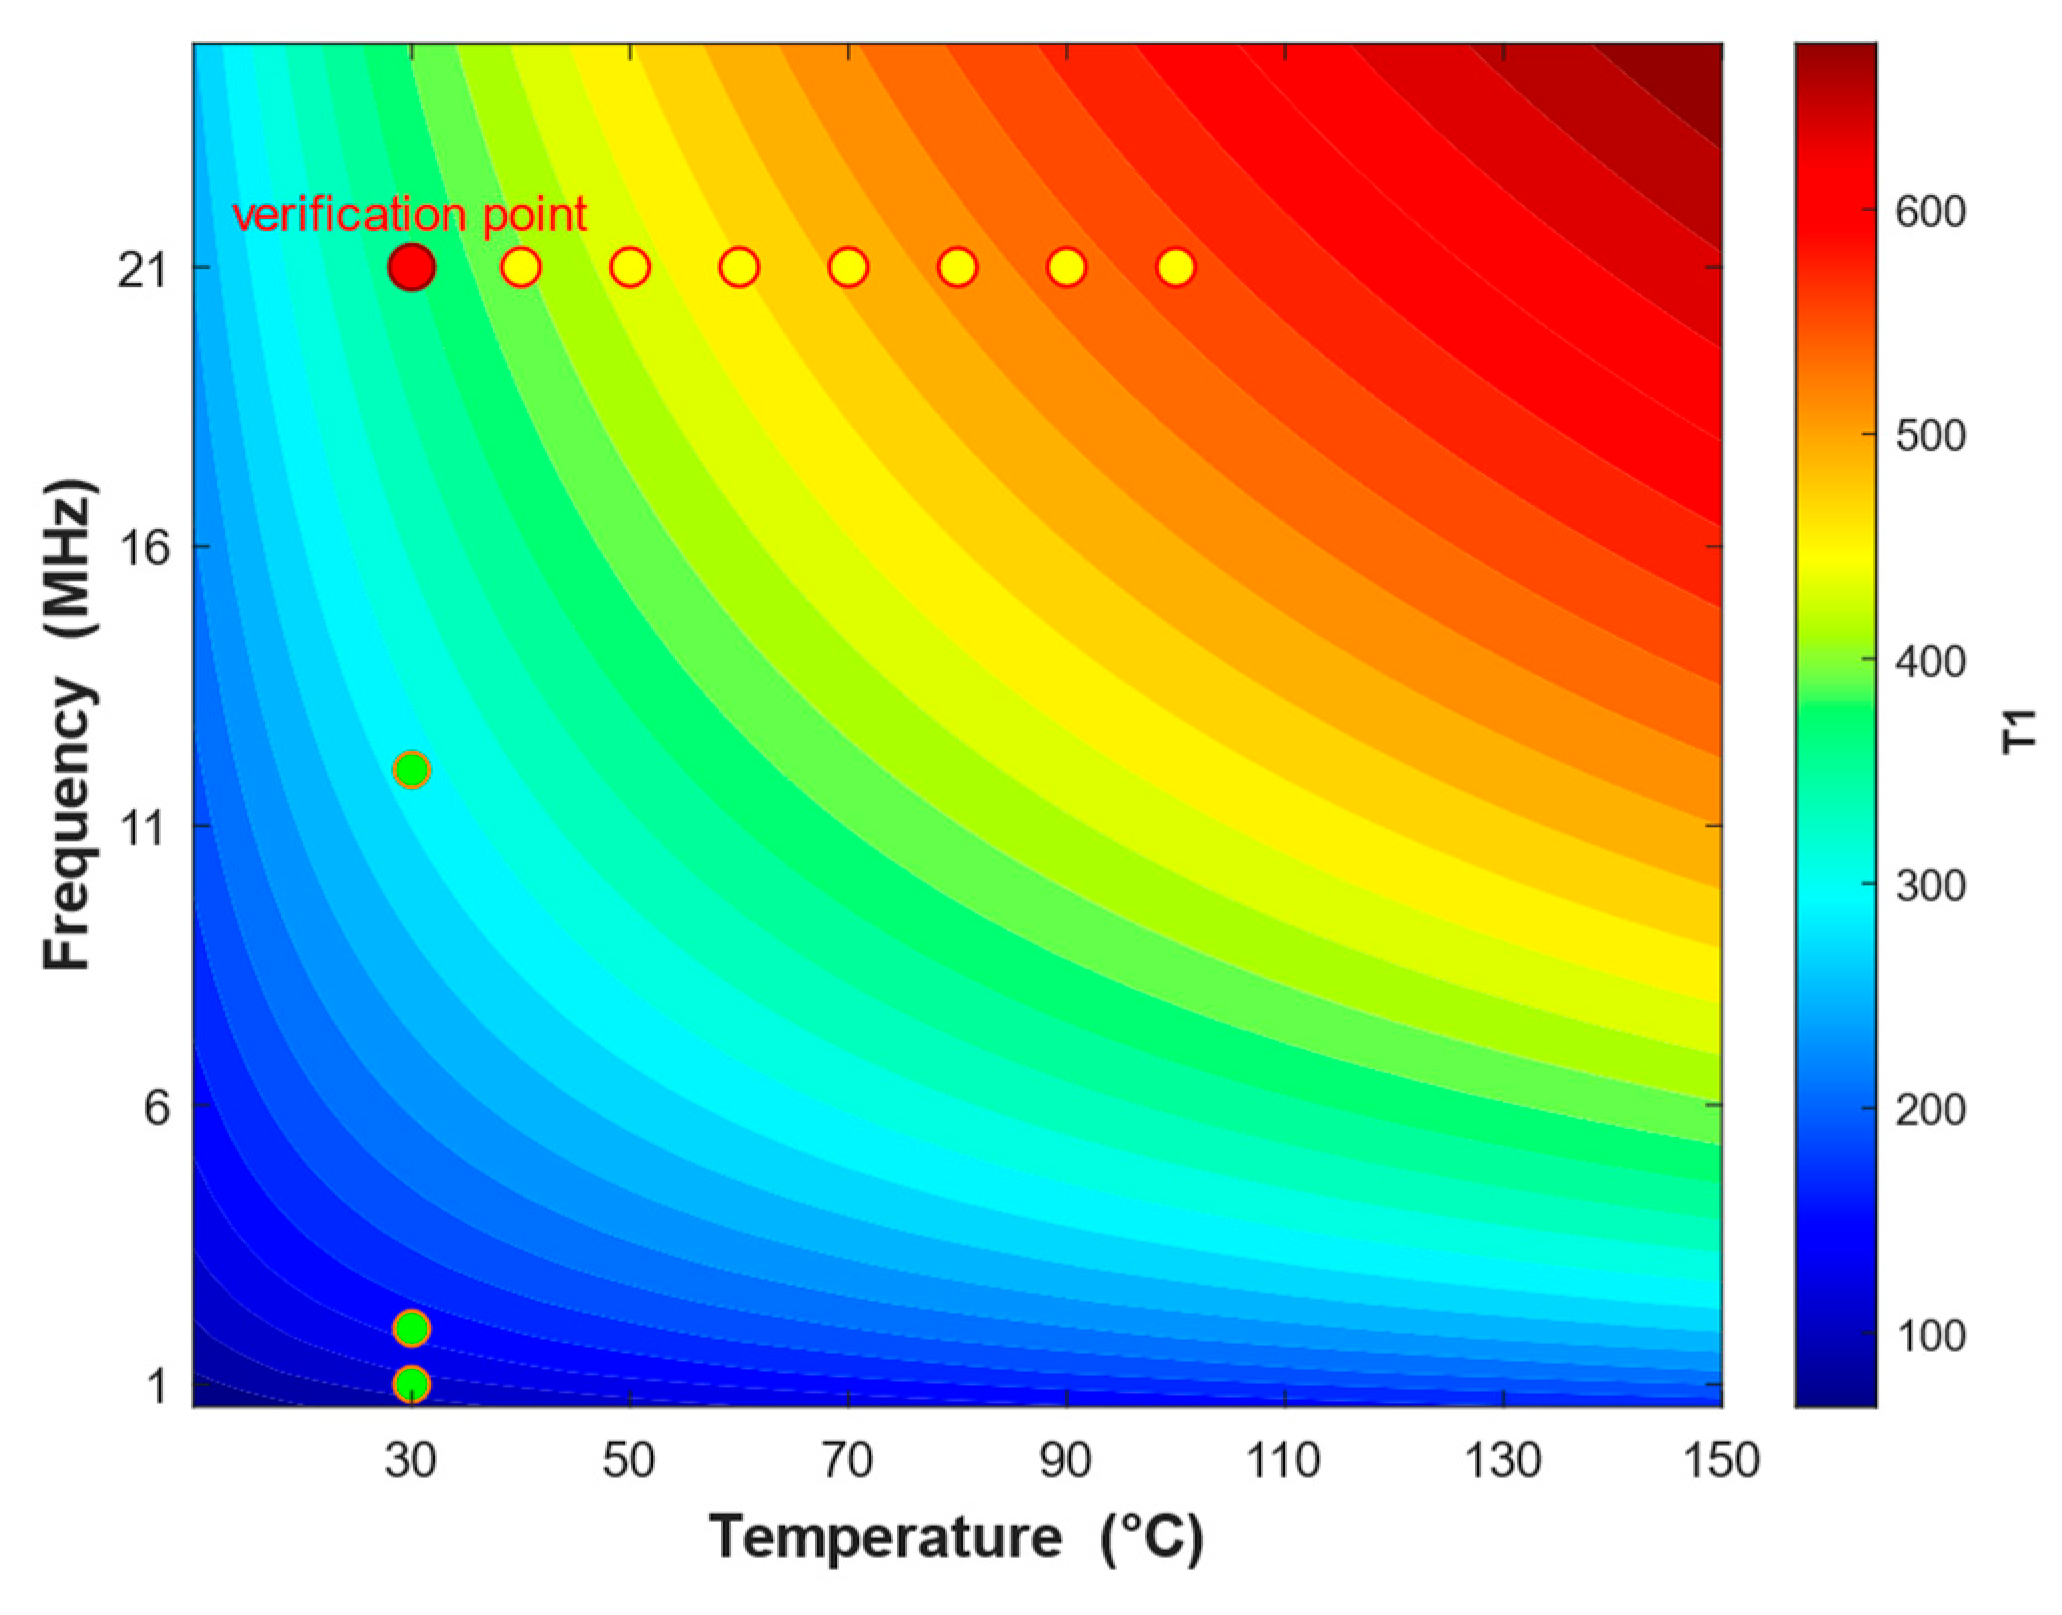
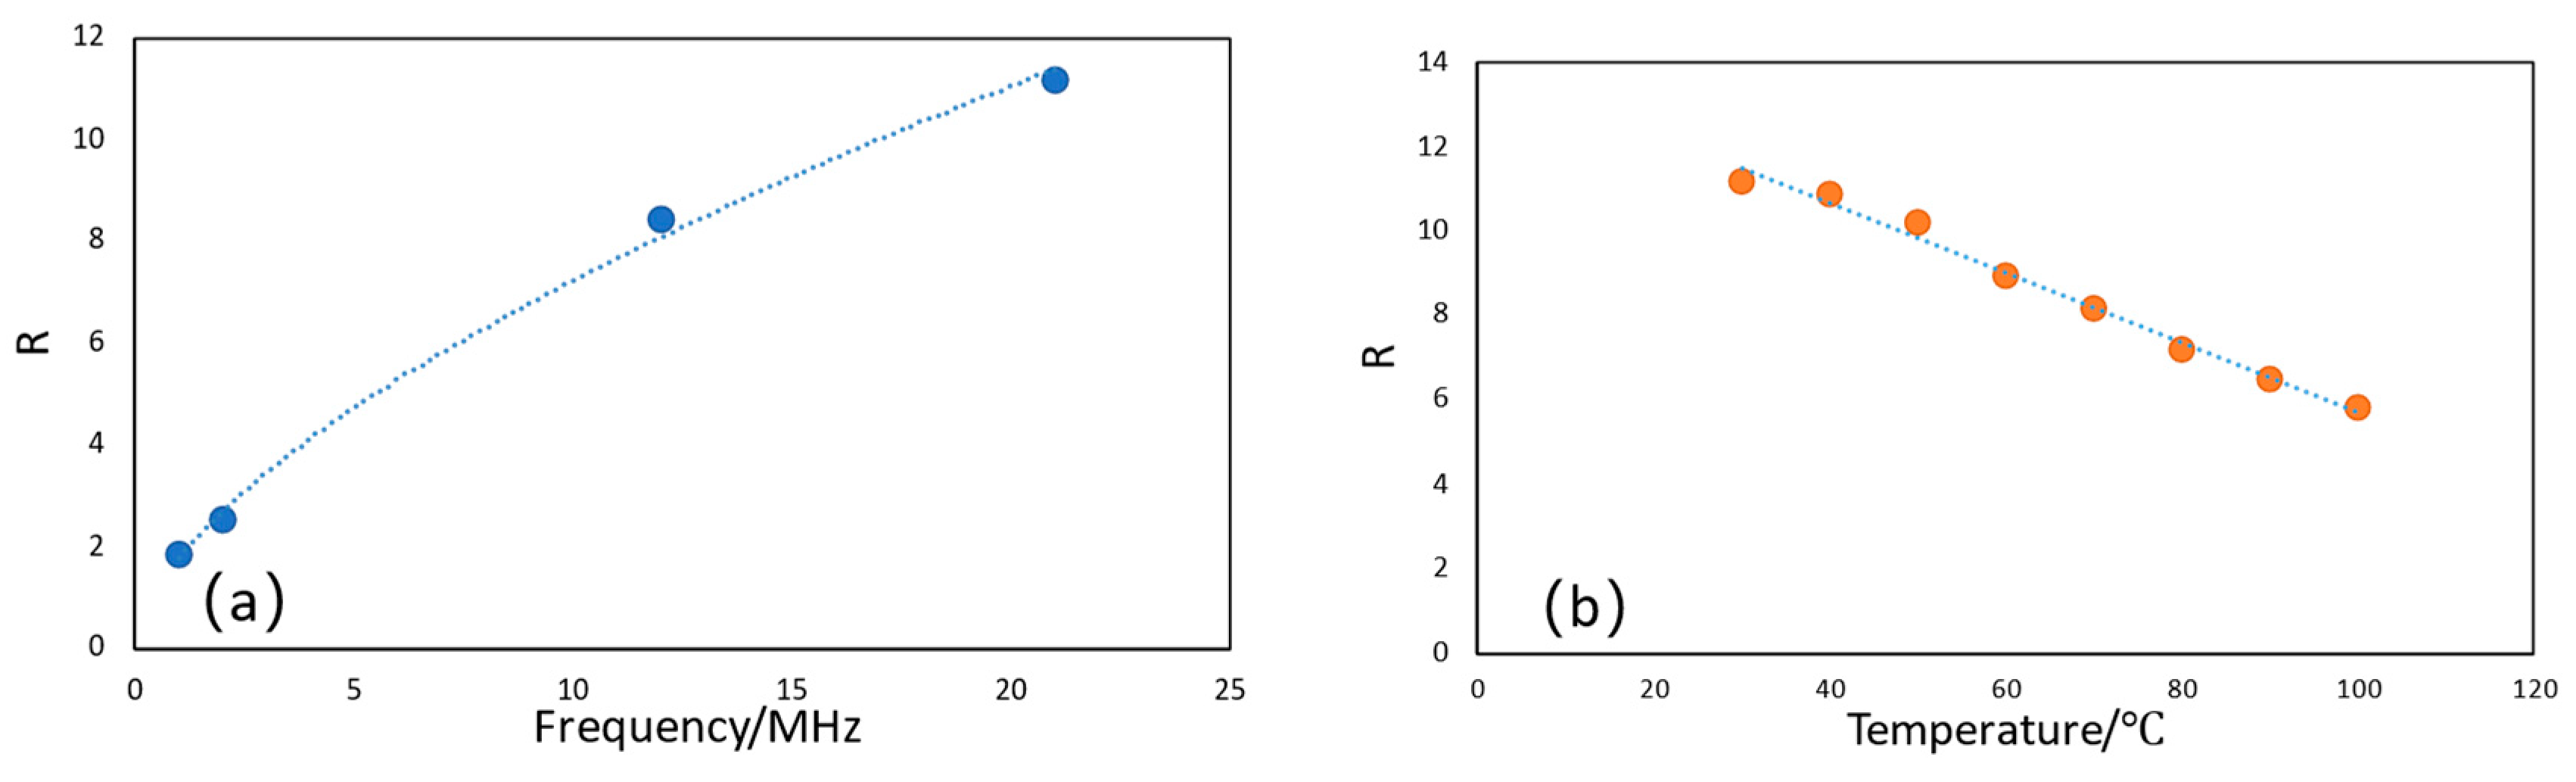
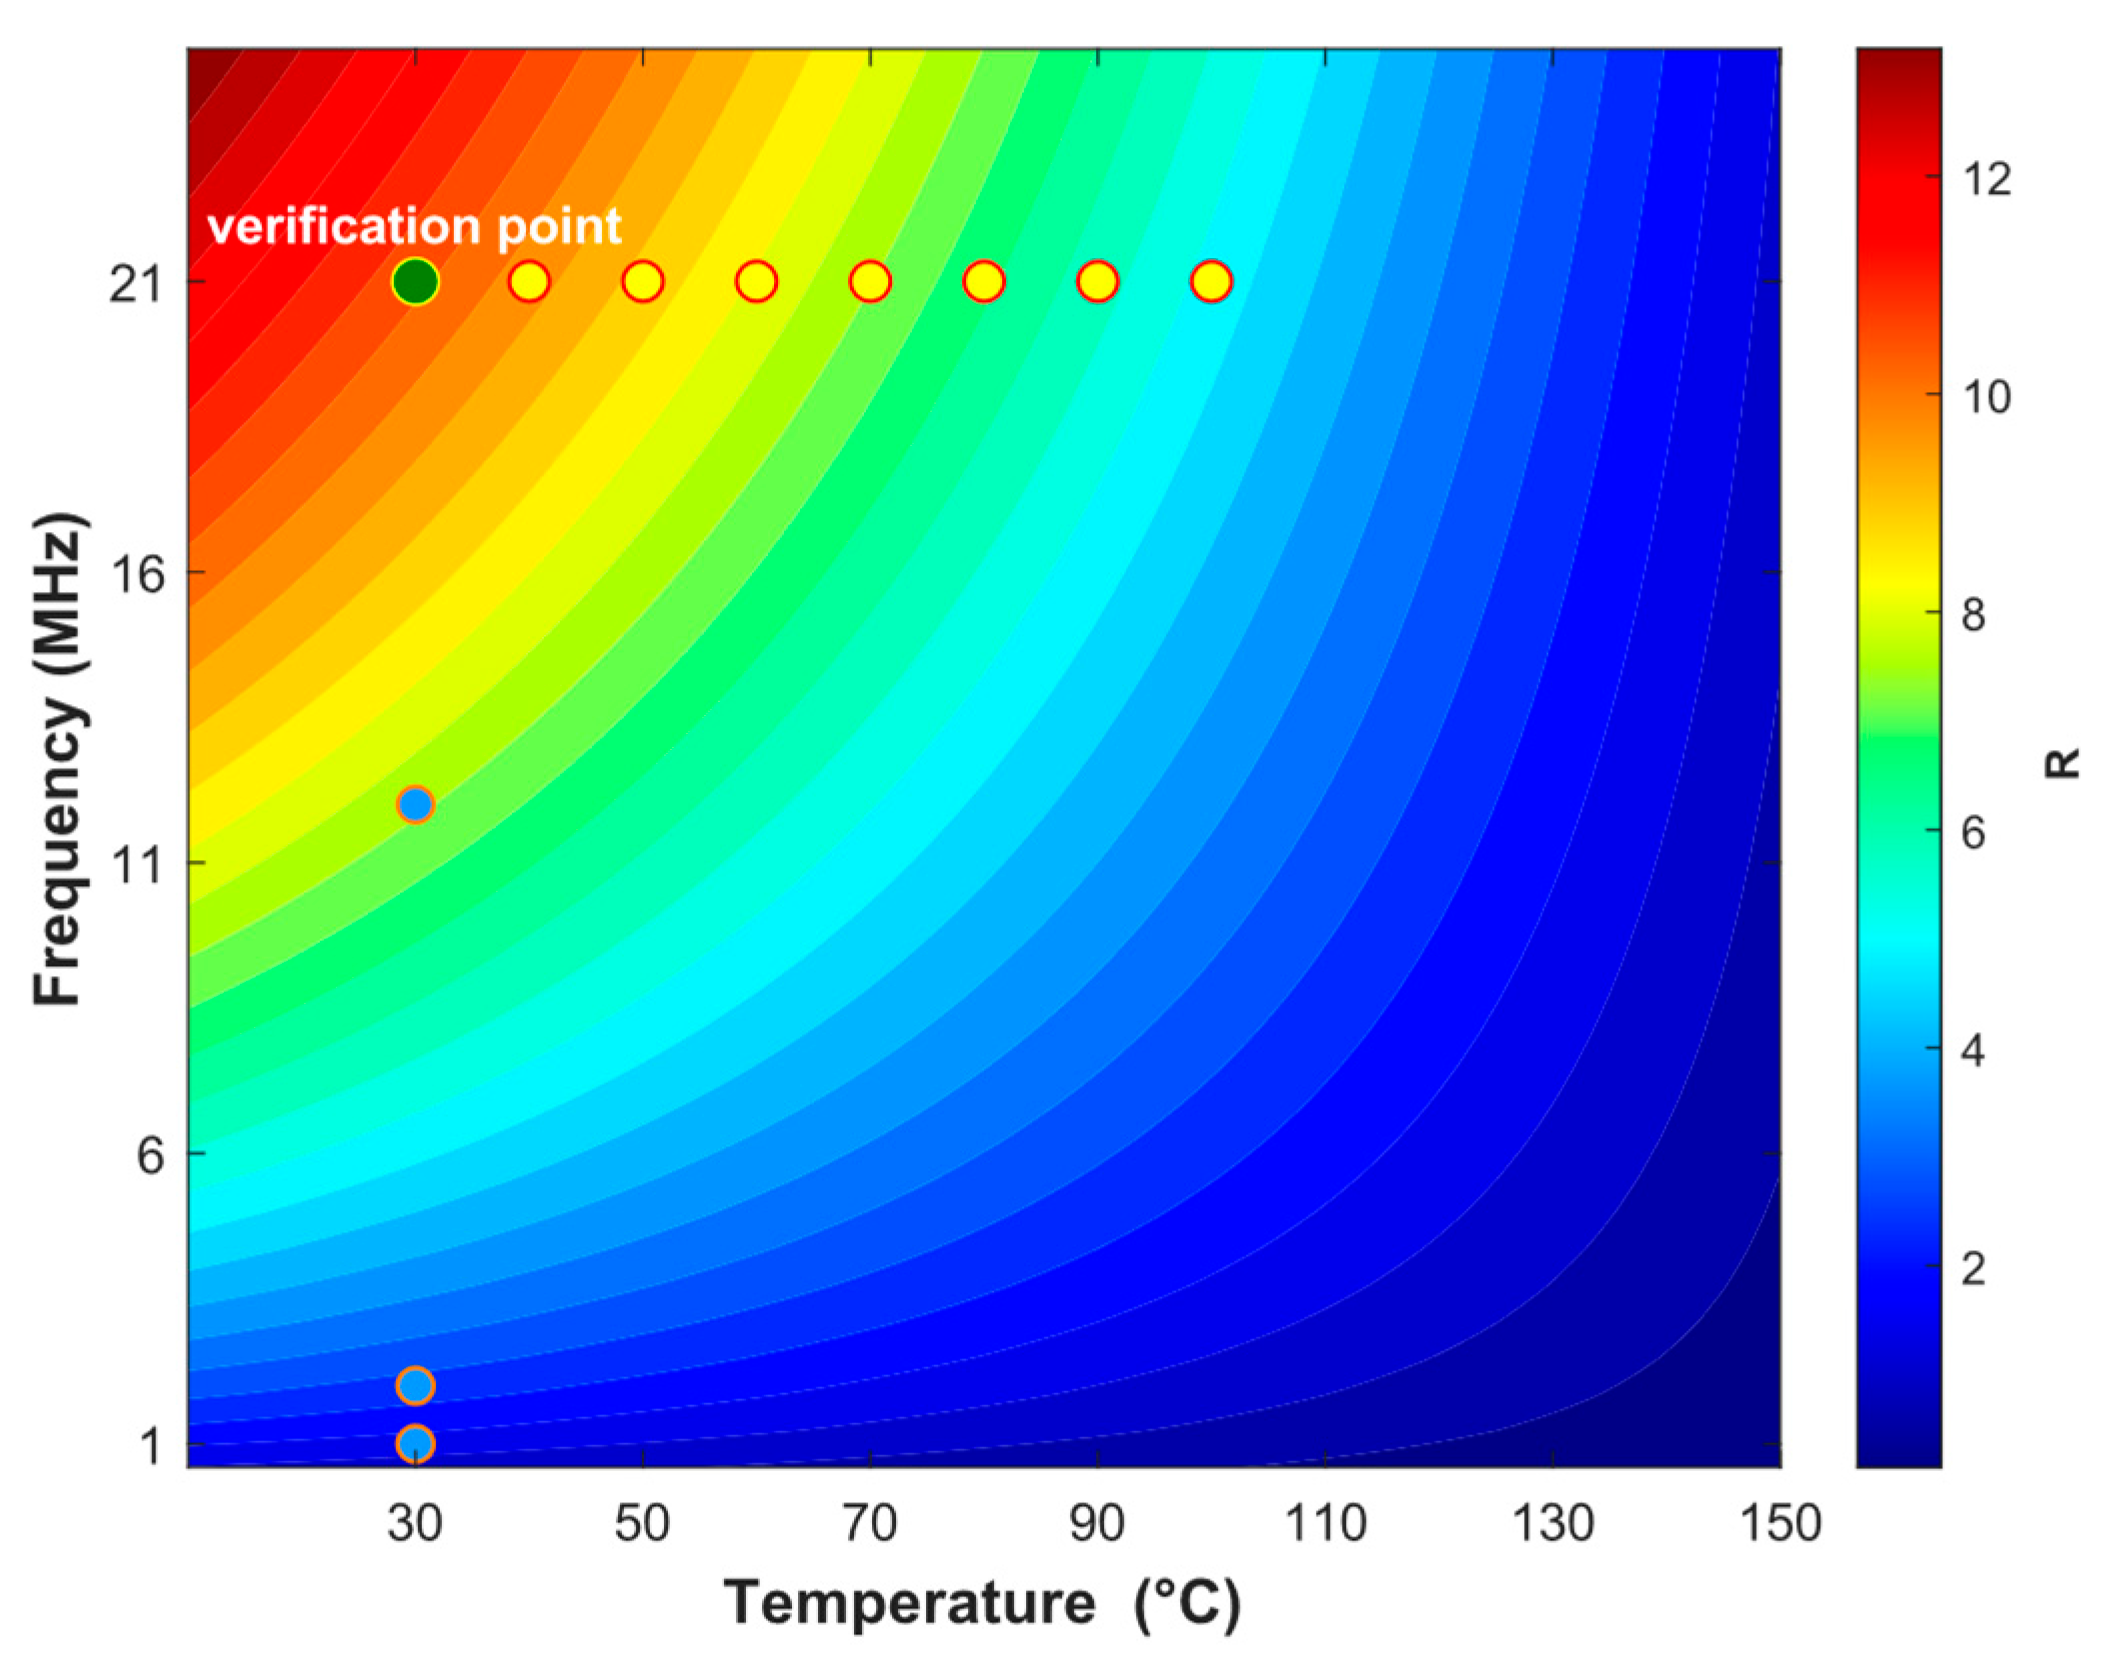
Figure 13.
T₁ of oil-based mud filtrate versus frequency and temperature.
Figure 14.
Variation of R (T₁/T₂ ratio) of oil-based mud filtrate with frequency (a) and temperature (b).
Figure 14.
Variation of R (T₁/T₂ ratio) of oil-based mud filtrate with frequency (a) and temperature (b).
Figure 15.
R (T₁/T₂ ratio) of oil-based mud filtrate versus frequency and temperature.
3.4. Model Validation
To validate the accuracy of the temperature–frequency relational model established above, supplementary NMR experiments were conducted at a Larmor frequency of 12 MHz under three temperature conditions: 50 °C, 60 °C, and 90 °C. The one-dimensional T₂ spectra and two-dimensional correlation maps obtained from these verification experiments are presented in Figure 16 and Figure 17.
Table 5 lists the comparison between the predicted values from the T₂, T₁, and R models and the corresponding experimental measurements at three temperature points. The results show that the errors of all three models fall within the permissible range, confirming that the established models possess good applicability and consistency within the tested temperature interval.
4. Conclusions
In this study, variable-temperature NMR experiments were conducted on OBMF at a fixed frequency of 21 MHz over a temperature range of 30 °C to 100 °C, along with frequency-variable experiments from 1 MHz to 21 MHz. The effects of temperature and magnetic field frequency on the relaxation characteristics of OBMF were investigated, and quantitative relationship models were established. The main conclusions are as follows:
(1) Increasing temperature reduces the viscosity of OBMF and alters the molecular rotational correlation time, causing the T₂ relaxation time to shift toward longer relaxation times and the T₁ value to increase, while the T₁/T₂ ratio gradually decreases. Heating–cooling cycle experiments confirm that the regulatory effect of temperature on T₂ and T₁ relaxation times is reversible.
(2) Decreasing frequency prolongs the T₂ relaxation time, shortens the T₁ relaxation time, and significantly decreases the T₁/T₂ ratio, accompanied by a downward and rightward shift of the 2D spectral signal peak, revealing the asymmetric response mechanisms of T₁ and T₂ to magnetic field frequency.
(3) Based on the experimental data, preliminary temperature–frequency dual-parameter empirical models for T₂, T₁, and R were established. Validation calculations using the experimental dataset indicate that the errors fall within acceptable ranges under the tested conditions.
However, it must be clearly stated that the model was derived from a single OBMF formulation and a limited number of temperature–frequency combinations. Consequently, the assumption that temperature and frequency effects are fully independent and separable has not been rigorously validated under the present experimental conditions, and the generalizability of the model is subject to significant constraints. Future work will be directed toward systematic crossed temperature–frequency measurements using OBMF samples of different compositions, aiming to test the separability assumption and expand the model's applicability.
Conflicts of Interest
The authors declare no conflict of interest.
References
- Tang L, Zhang Y, Chen X, et al. Multiscale gas flow mechanisms in ultra-deep fractured tight sandstone reservoirs with water invasion[J]. Processes, 2025, 13(11): 3596. [CrossRef]
- Soliman A, Deng L, Elabsy E, et al. Mitigating Drilling Risks with NMR Technology and Oil-Based Mud: A Case Study from Abu Dhabi[C]//Abu Dhabi International Petroleum Exhibition and Conference. SPE, 2024.
- Yao X, Sun X, Feng Q, et al. Application in oil field drilling with temperature-resistant natural modified filtrate reducer: A review[J]. Chemistry and Technology of Fuels and Oils, 2023, 59(1): 146-165. [CrossRef]
- Jamrozik A, Protasova E, Gonet A, et al. Characteristics of oil based muds and influence on the environment[J]. AGH Drilling, Oil, Gas, 2016, 33(4). [CrossRef]
- Shafer J, Chen J, Flaum M, et al. Core And Log NMR Measurements Indicate Reservoir Rock Is Altered By OBM Filtrate[C]//SPWLA Annual Logging Symposium. SPWLA, 2004: SPWLA-2004-CC.
- Chen J, Hirasaki G J, Flaum M. NMR wettability indices: Effect of OBM on wettability and NMR responses[J]. Journal of Petroleum Science and Engineering, 2006, 52(1-4): 161-171. [CrossRef]
- Hursan G, Ma S M, Valori A, et al. Study of OBM invasion on NMR logging-mechanisms and applications[C]//SPE Kingdom of Saudi Arabia Annual Technical Symposium and Exhibition. SPE, 2018: SPE-192218-MS.
- Kesserwan H, Al Tawat N, Jin G. Use of NMR and core flow to study the solid invasion in sedimentary rocks–Insights on drilling mud design[C]//SPE Kingdom of Saudi Arabia Annual Technical Symposium and Exhibition. SPE, 2018: SPE-192308-MS.
- Sun J, Cai J, Feng P, et al. Study on Nuclear Magnetic Resonance Logging T 2 Spectrum Shape Correction of Sandstone Reservoirs in Oil-Based Mud Wells[J]. Molecules, 2021, 26(19): 6082. [CrossRef]
- Zhang H, Ni L, Luo G, et al. Experimental Study on the Effect of Oil-based Drilling Fluid Invasion on NMR Logging[J]. Science Technology and Engineering, 2023,23(12):5013-5021.
- Wu J, Du K, Wang F, et al. Application of Nuclear Magnetic Resonance Logging While Drilling Technology in Development Wells in Western South China Sea Oilfield[J]. OffshoreOil,2024,44(3):94-98+104.
- Gao F, Xiao L. A method to identify pore fluids in heterogeneous conglomerate reservoirs using a nuclear magnetic resonance log with oil-based mud invasion[J]. SPE Journal, 2024, 29(08): 4043-4053. [CrossRef]
- Akomolafe F, El-Husseiny A, Adebayo A, et al. A systematic investigation of drilling fluid bulk relaxation impact on NMR interpretation for formation evaluation[J]. Petroleum, 2025, 11(3): 308-319. [CrossRef]
- Zhou L, Liao G, Fan R, et al. Multiscale NMR Characterization in Shale: From Relaxation Mechanisms to Porous Media Research Frontiers[J]. Energy Science & Engineering, 2025, 13(11): 5777-5798. [CrossRef]
- Guo J, Wan Q, Wang Y, et al. Numerical Investigations on Nuclear Magnetic Resonance T1-T2 Responses in Tight Gas Reservoirs with Oil-Based Mud Filtrate Invasion[J]. SPE Journal, 2026, 31(06): 3910-3925. [CrossRef]
- Pang Z, Li J, Jia C, et al. A Novel Method to Identify Pore Fluids Using Nuclear Magnetic Resonance (NMR) Logging in Tight Reservoirs During Oil-Based Mud (OBM) Drilling[C]//SPE Kuwait Oil and Gas Show and Conference. SPE, 2026.
- Ishag M, Ge X, Fan Y, et al. Three-dimensional simulation insights into NMR responses of fluid constituents in tight sandstone reservoirs: Effects of oil-based mud invasion and wettability[J]. Geophysics, 2026, 91(4): J1-J20. [CrossRef]
- Bloembergen N, Purcell E M, Pound R V. Relaxation effects in nuclear magnetic resonance absorption[J]. Physical review, 1948, 73(7): 679. [CrossRef]
- Coates G R, Xiao L, Prammer M G. NMR Logging Principles and Applications[M]. Houston: Halliburton Energy Services, 1999.
- Liu M, Xie R, Li C, et al. A new method for determining tight sandstone permeability based on the characteristic parameters of the NMR T2 distribution[J]. Applied Magnetic Resonance, 2017, 48(10): 1009-1029. [CrossRef]
- Kleinberg R L, Farooqui S A, Horsfield M A. T1/T2 ratio and frequency dependence of NMR relaxation in porous sedimentary rocks[J]. Journal of Colloid and Interface Science, 1993, 158(1): 195-198. [CrossRef]
- Sun B, Skalinski M, Brantjes J G, et al. Accurate NMR fluid typing using functional T1/T2 ratio and fluid component decomposition[C]//International Petroleum Technology Conference. IPTC, 2008: IPTC-12837-MS.
Figure 1.
Schematic of the sample preparation process.
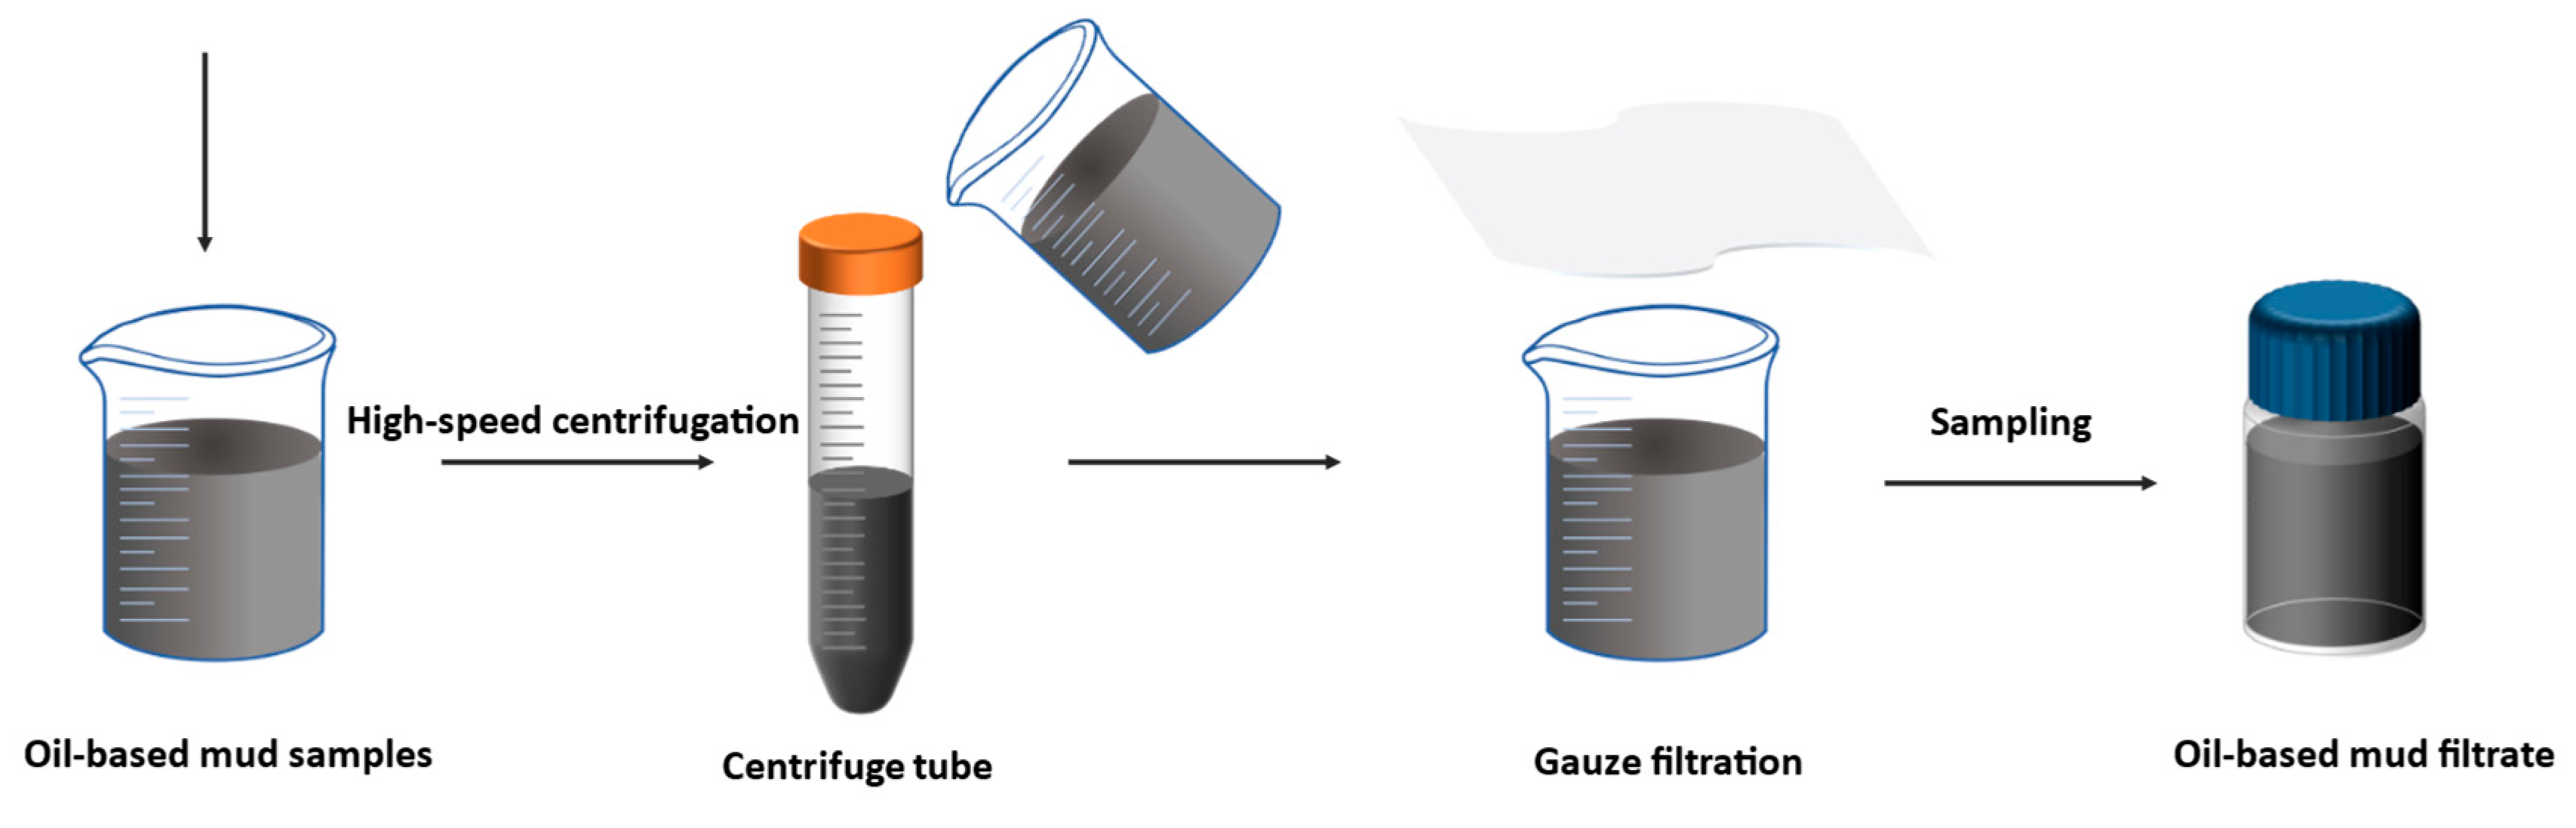
Figure 2.
Schematic of the experimental setup.
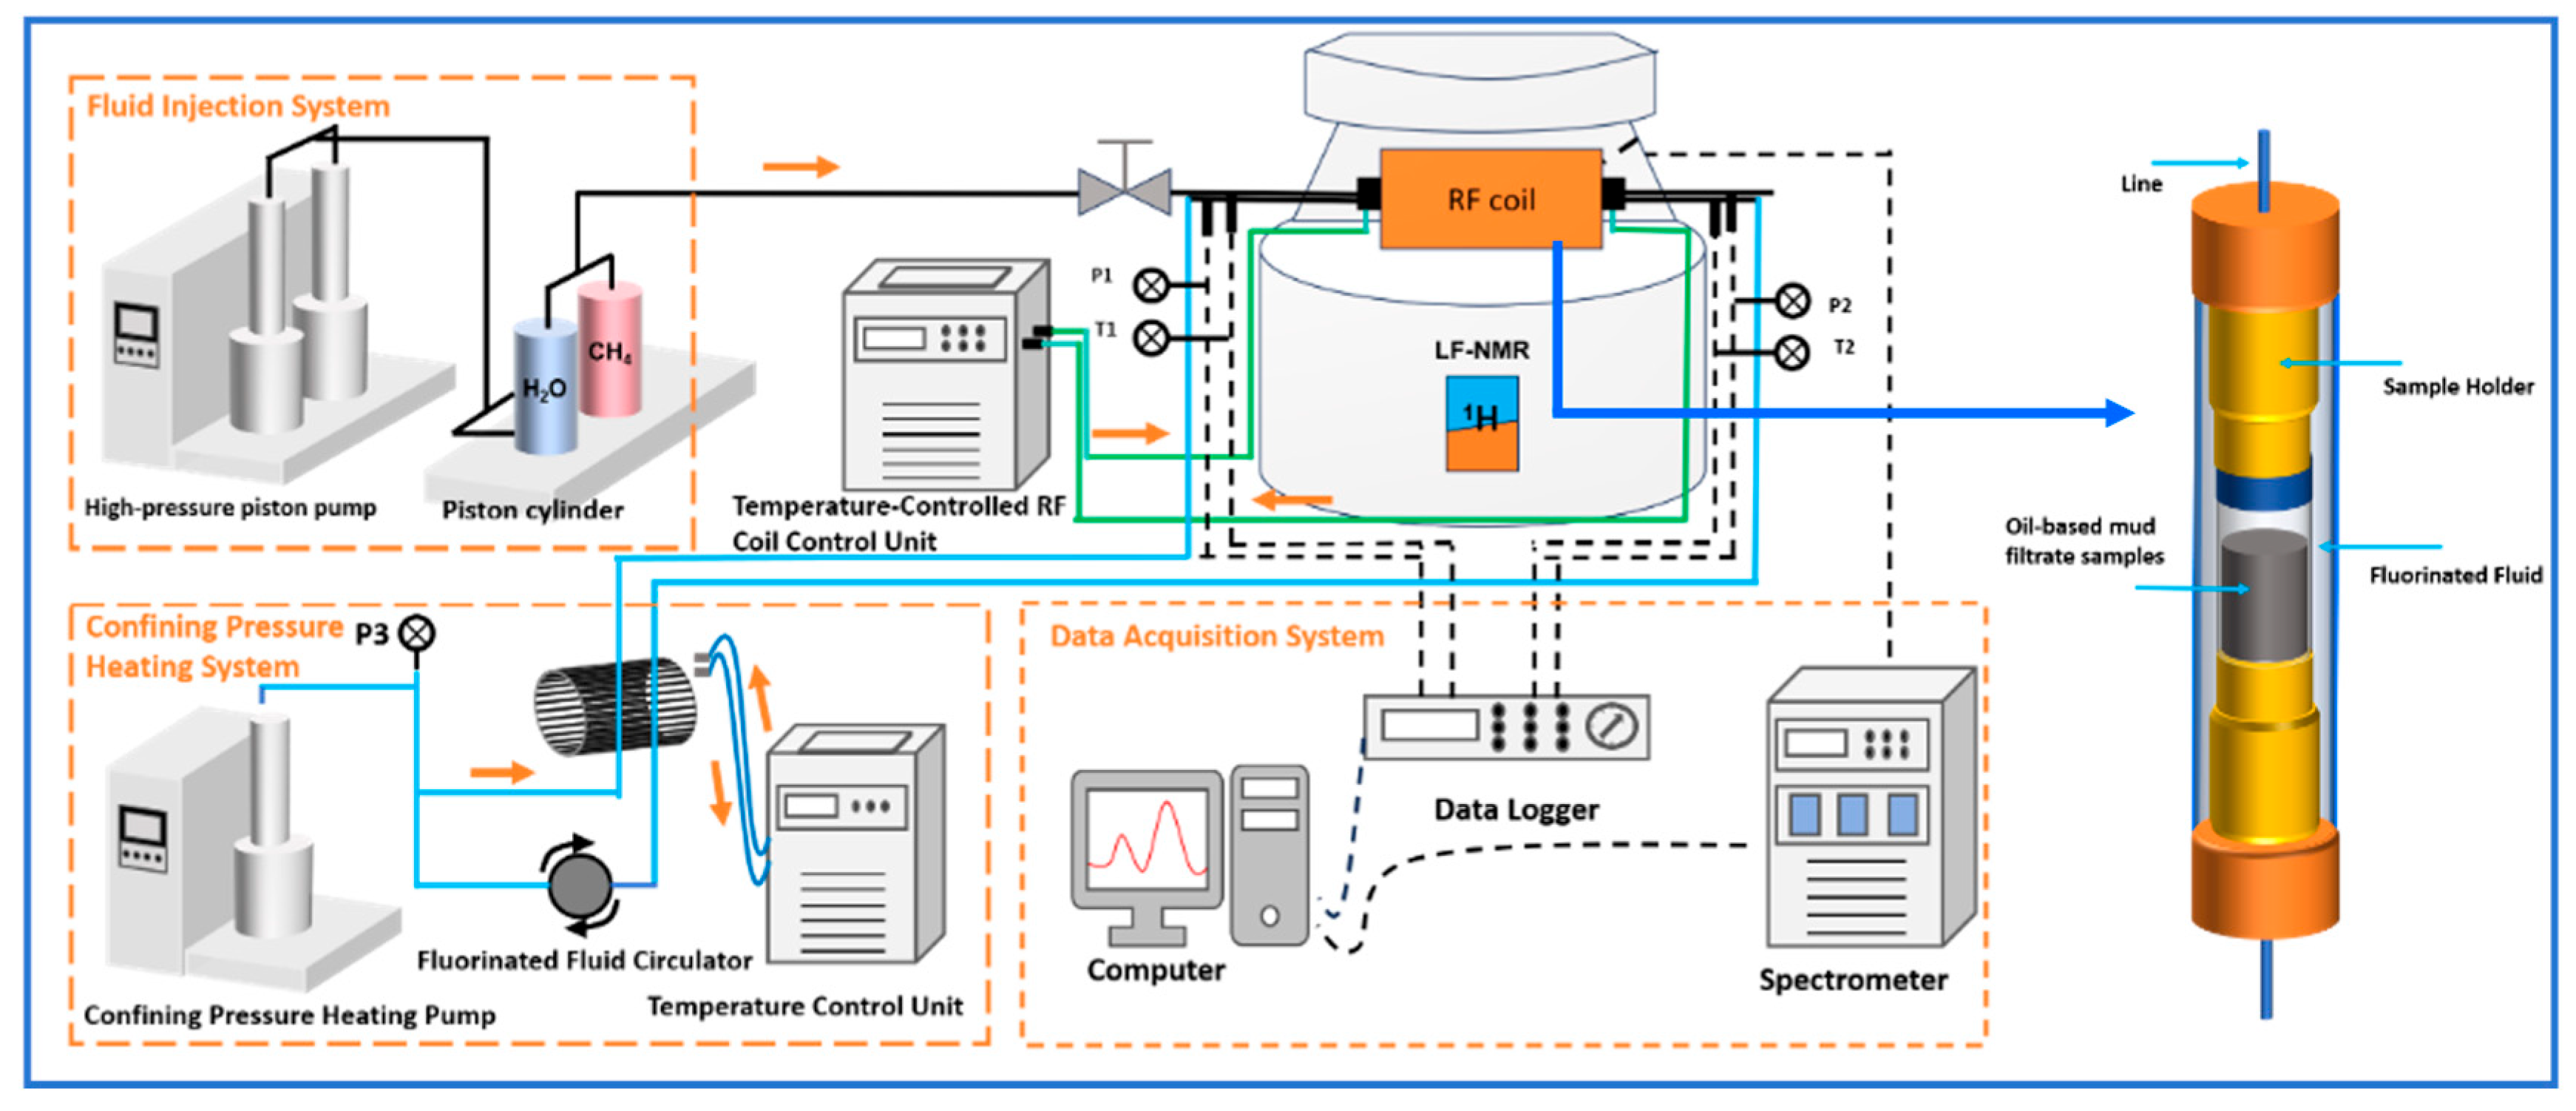
Figure 3.
T₂ spectra of oil-based mud filtrate at different temperatures.
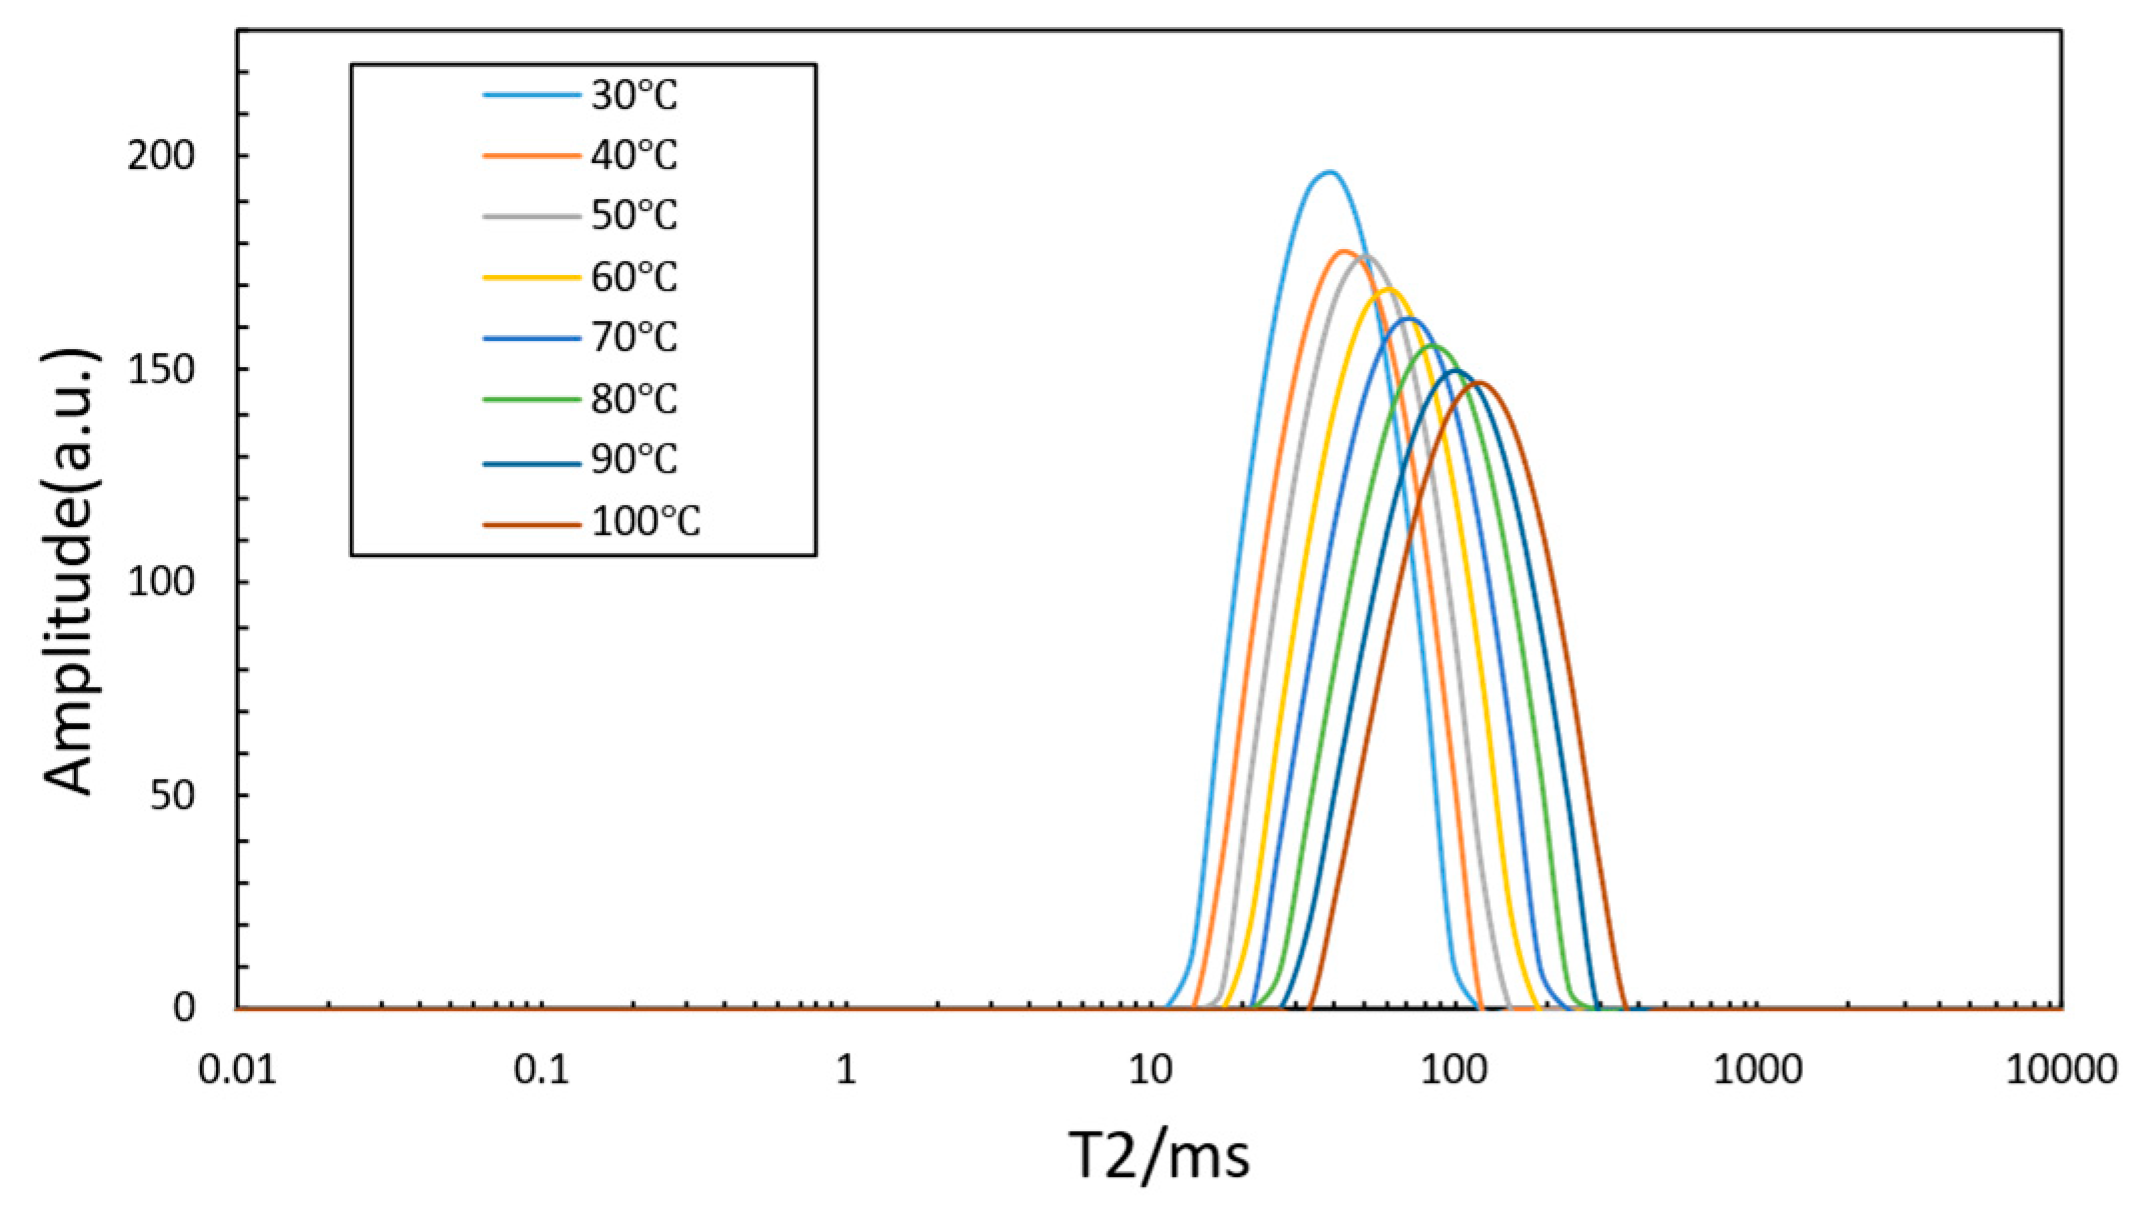
Figure 4.
T₂–T₁ spectra of oil-based mud filtrate at different temperatures.
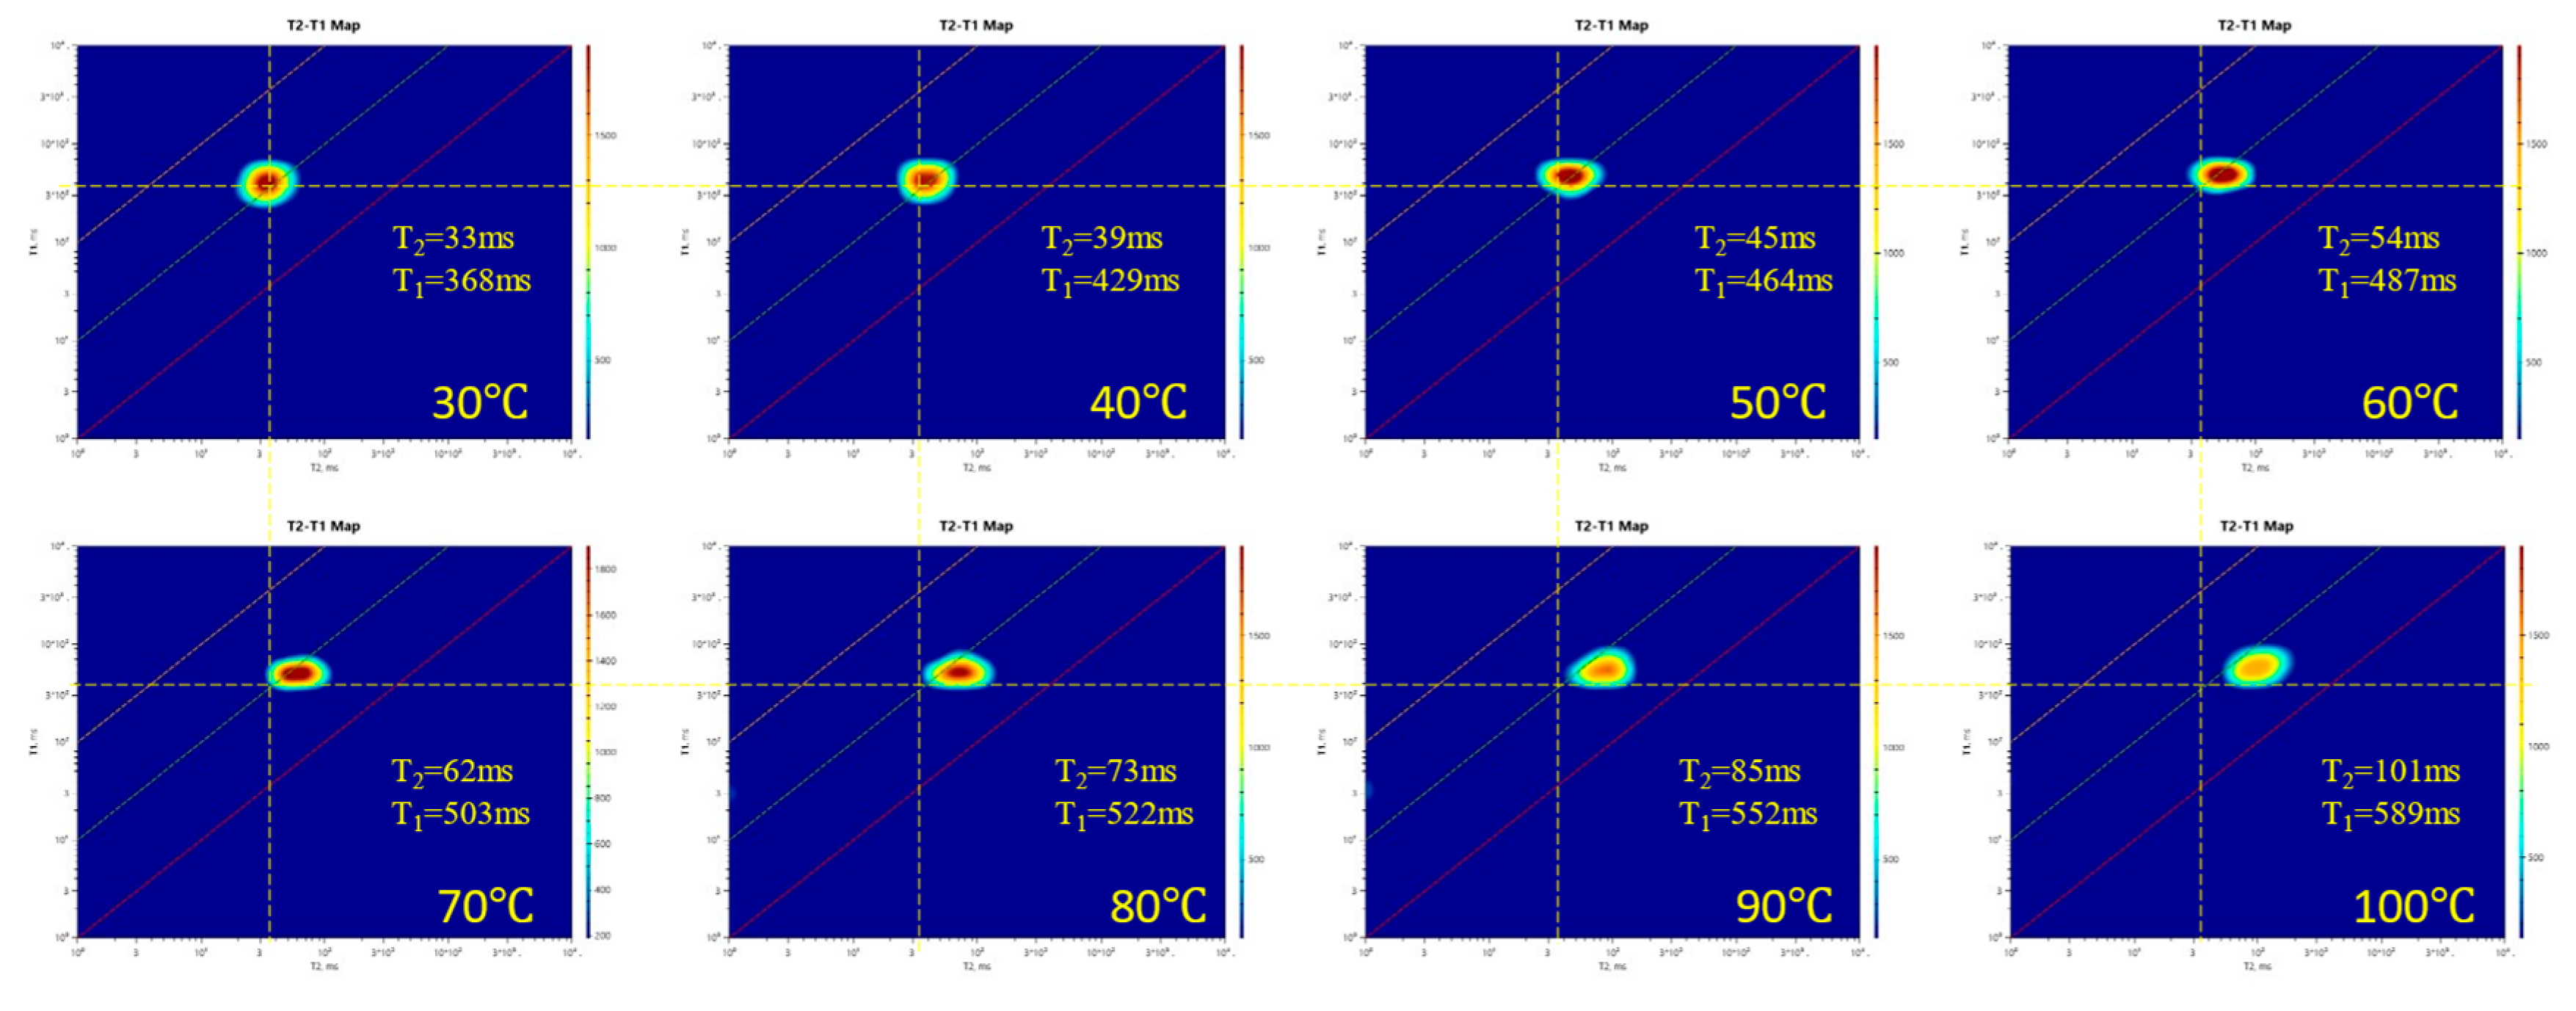
Figure 5.
Comparison of T₂ spectra of oil-based mud filtrate at 80 °C (a) and 50 °C (b) during heating and cooling.
Figure 5.
Comparison of T₂ spectra of oil-based mud filtrate at 80 °C (a) and 50 °C (b) during heating and cooling.
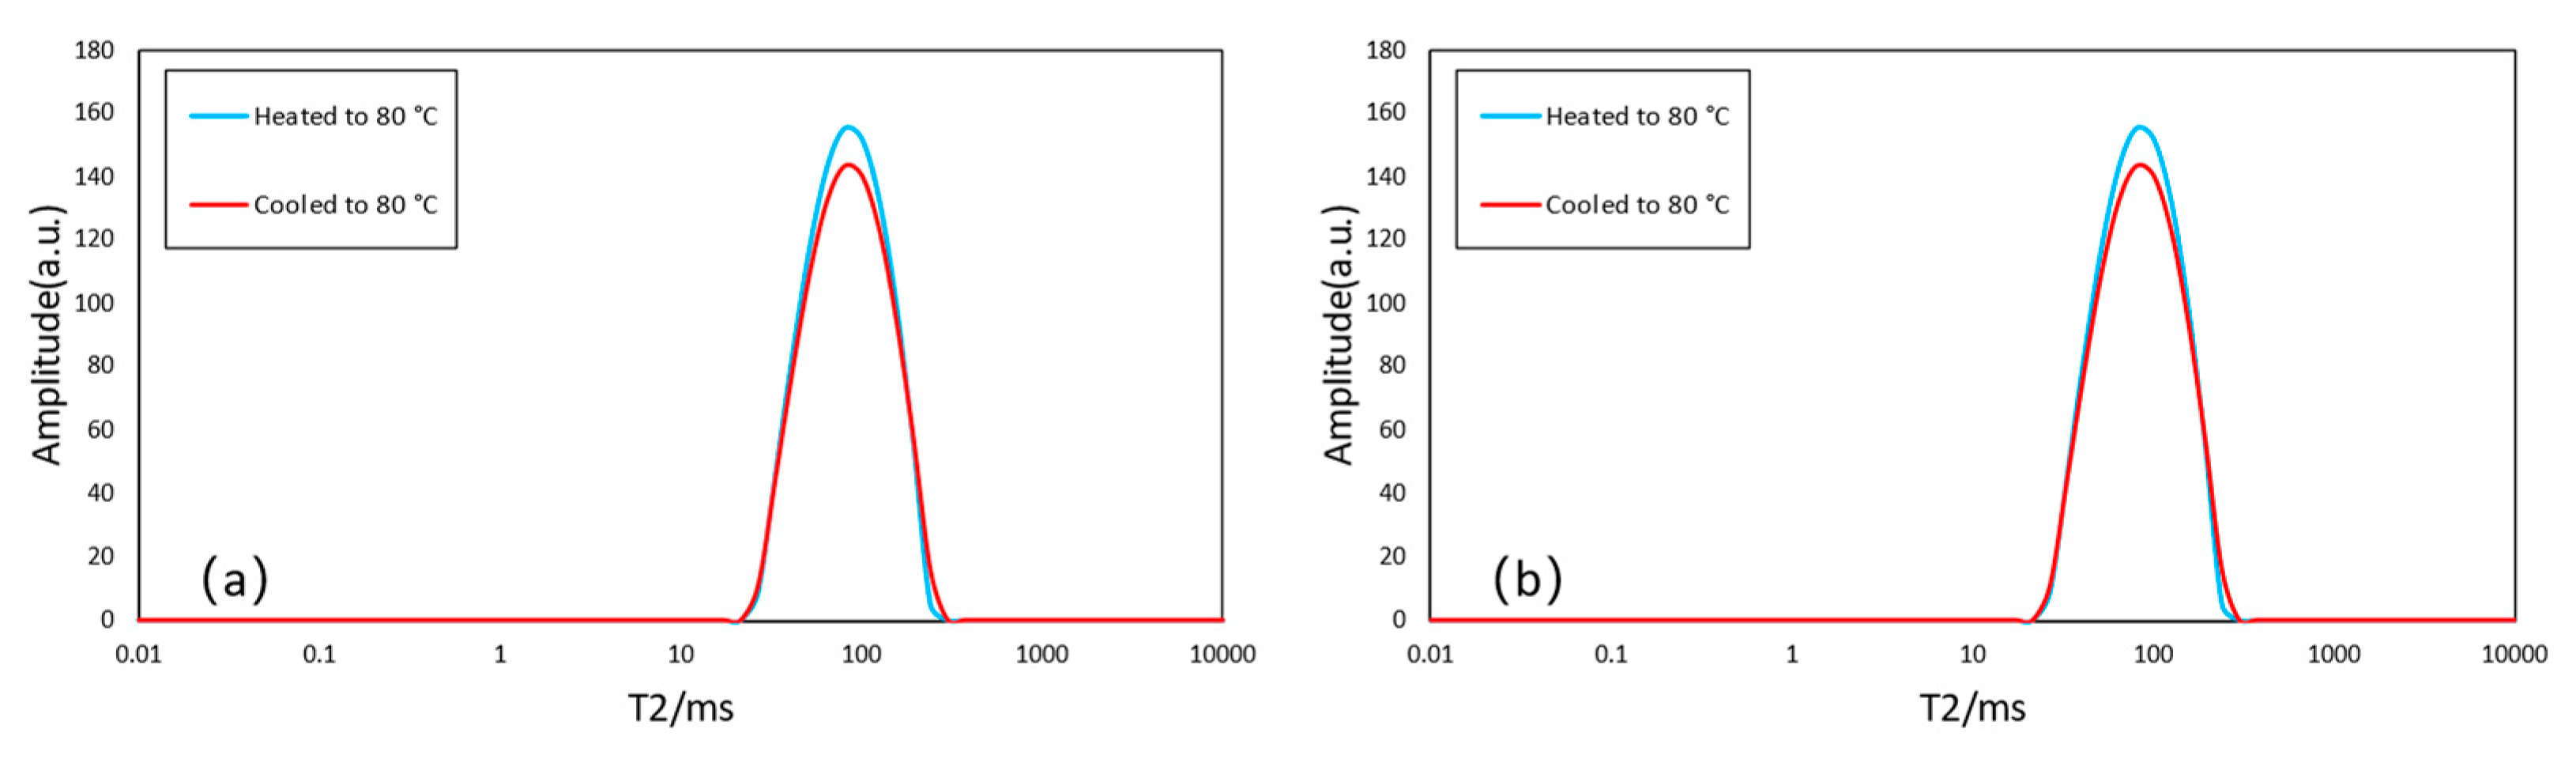
Figure 6.
Comparison of T₂–T₁ 2D maps of oil-based mud filtrate at 80 °C (a) and 50 °C (b) during heating and cooling.
Figure 6.
Comparison of T₂–T₁ 2D maps of oil-based mud filtrate at 80 °C (a) and 50 °C (b) during heating and cooling.
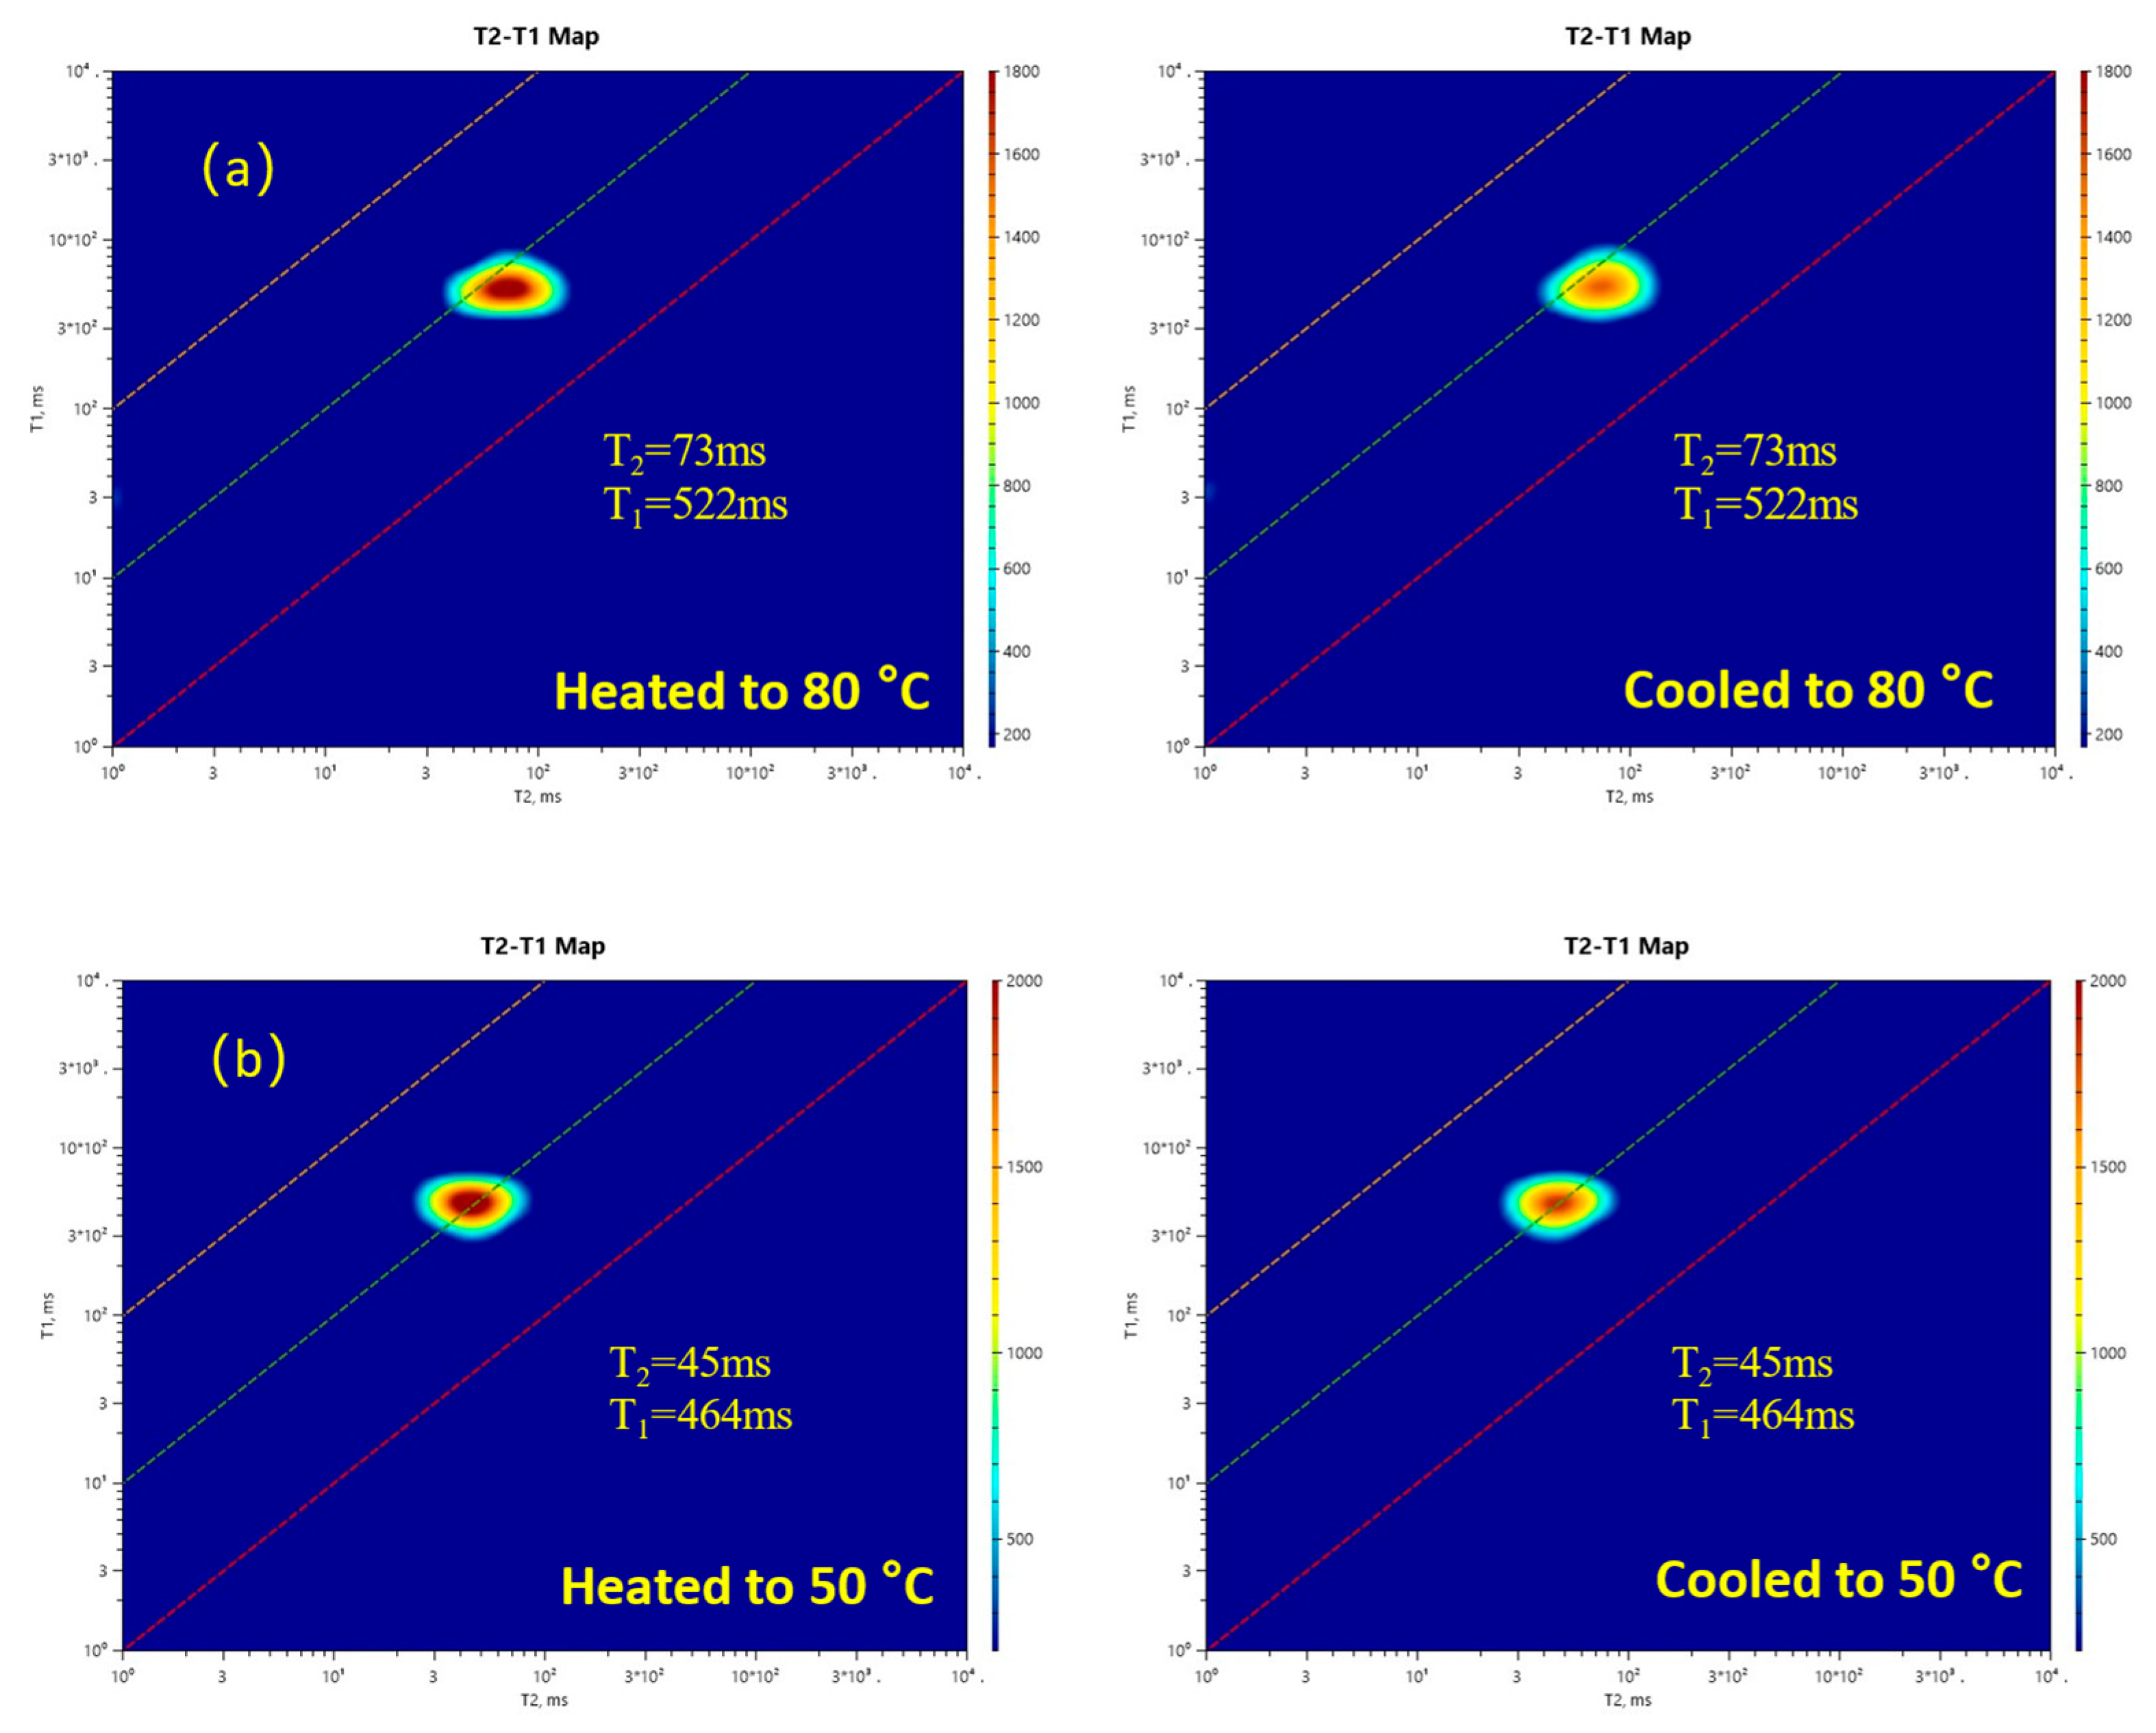
Figure 7.
T₂ spectra comparison of oil-based mud filtrate at various magnetic field frequencies.
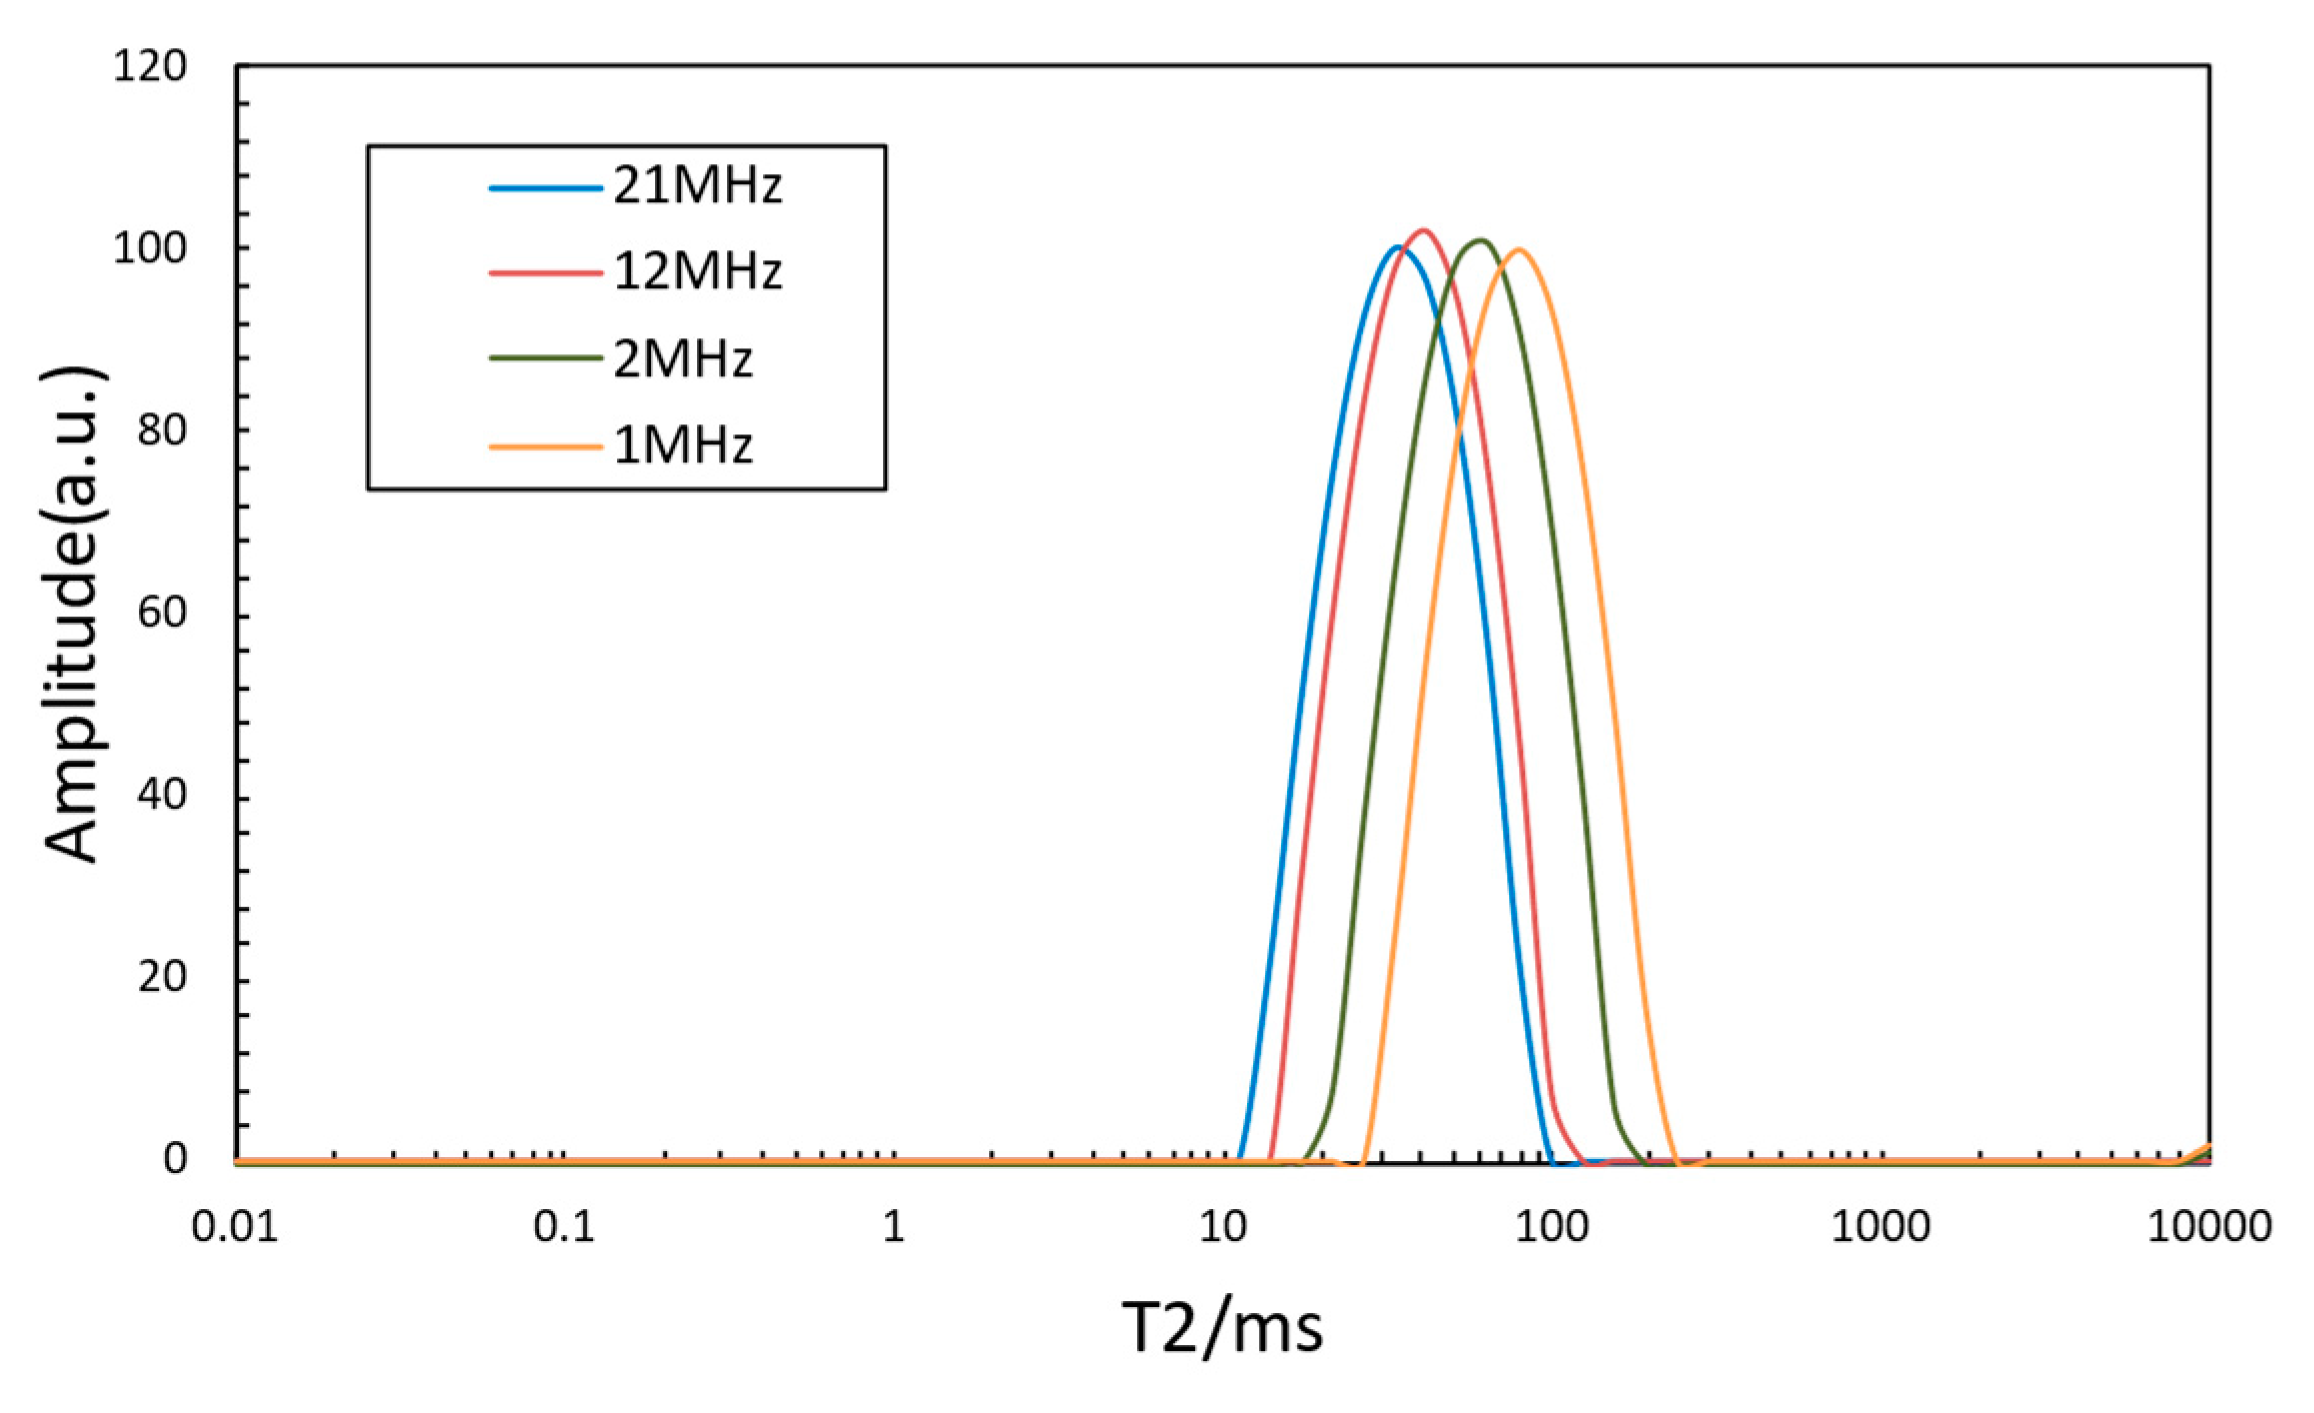
Figure 8.
T₂–T₁ 2D maps comparison of oil-based mud filtrate at various magnetic field frequencies.
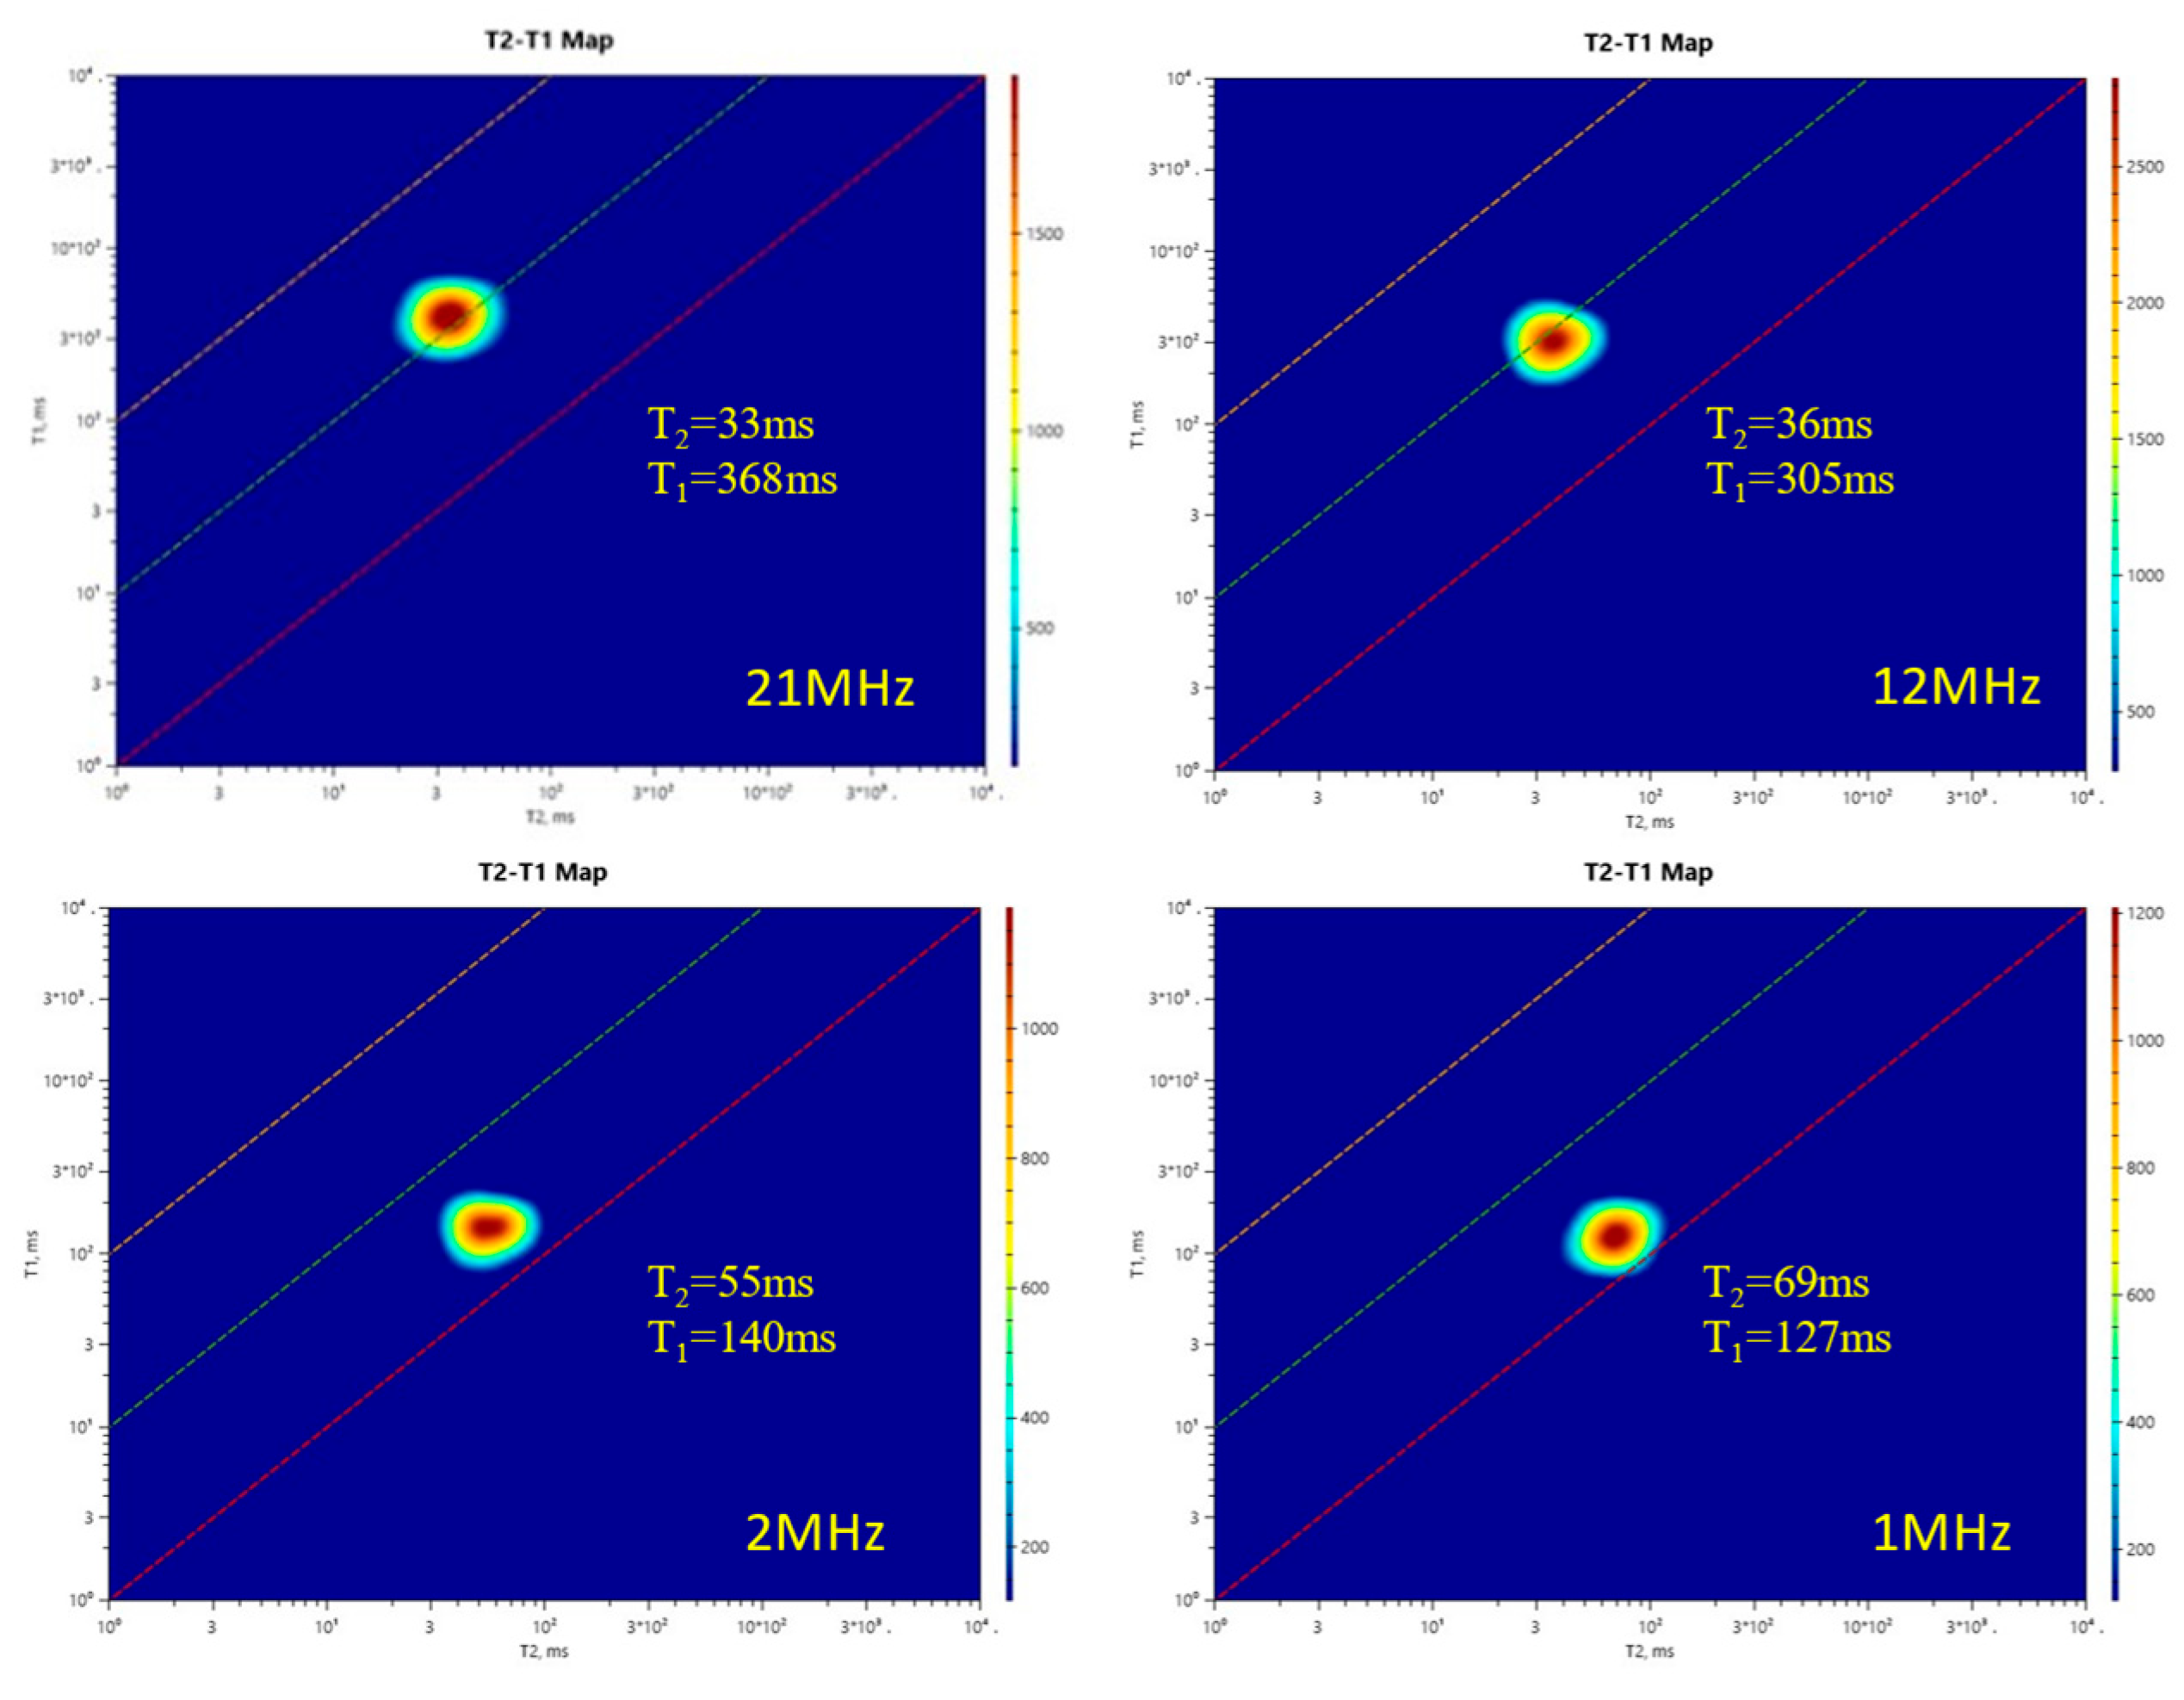
Figure 9.
Variation of T₂ of oil-based mud filtrate with frequency and temperature.
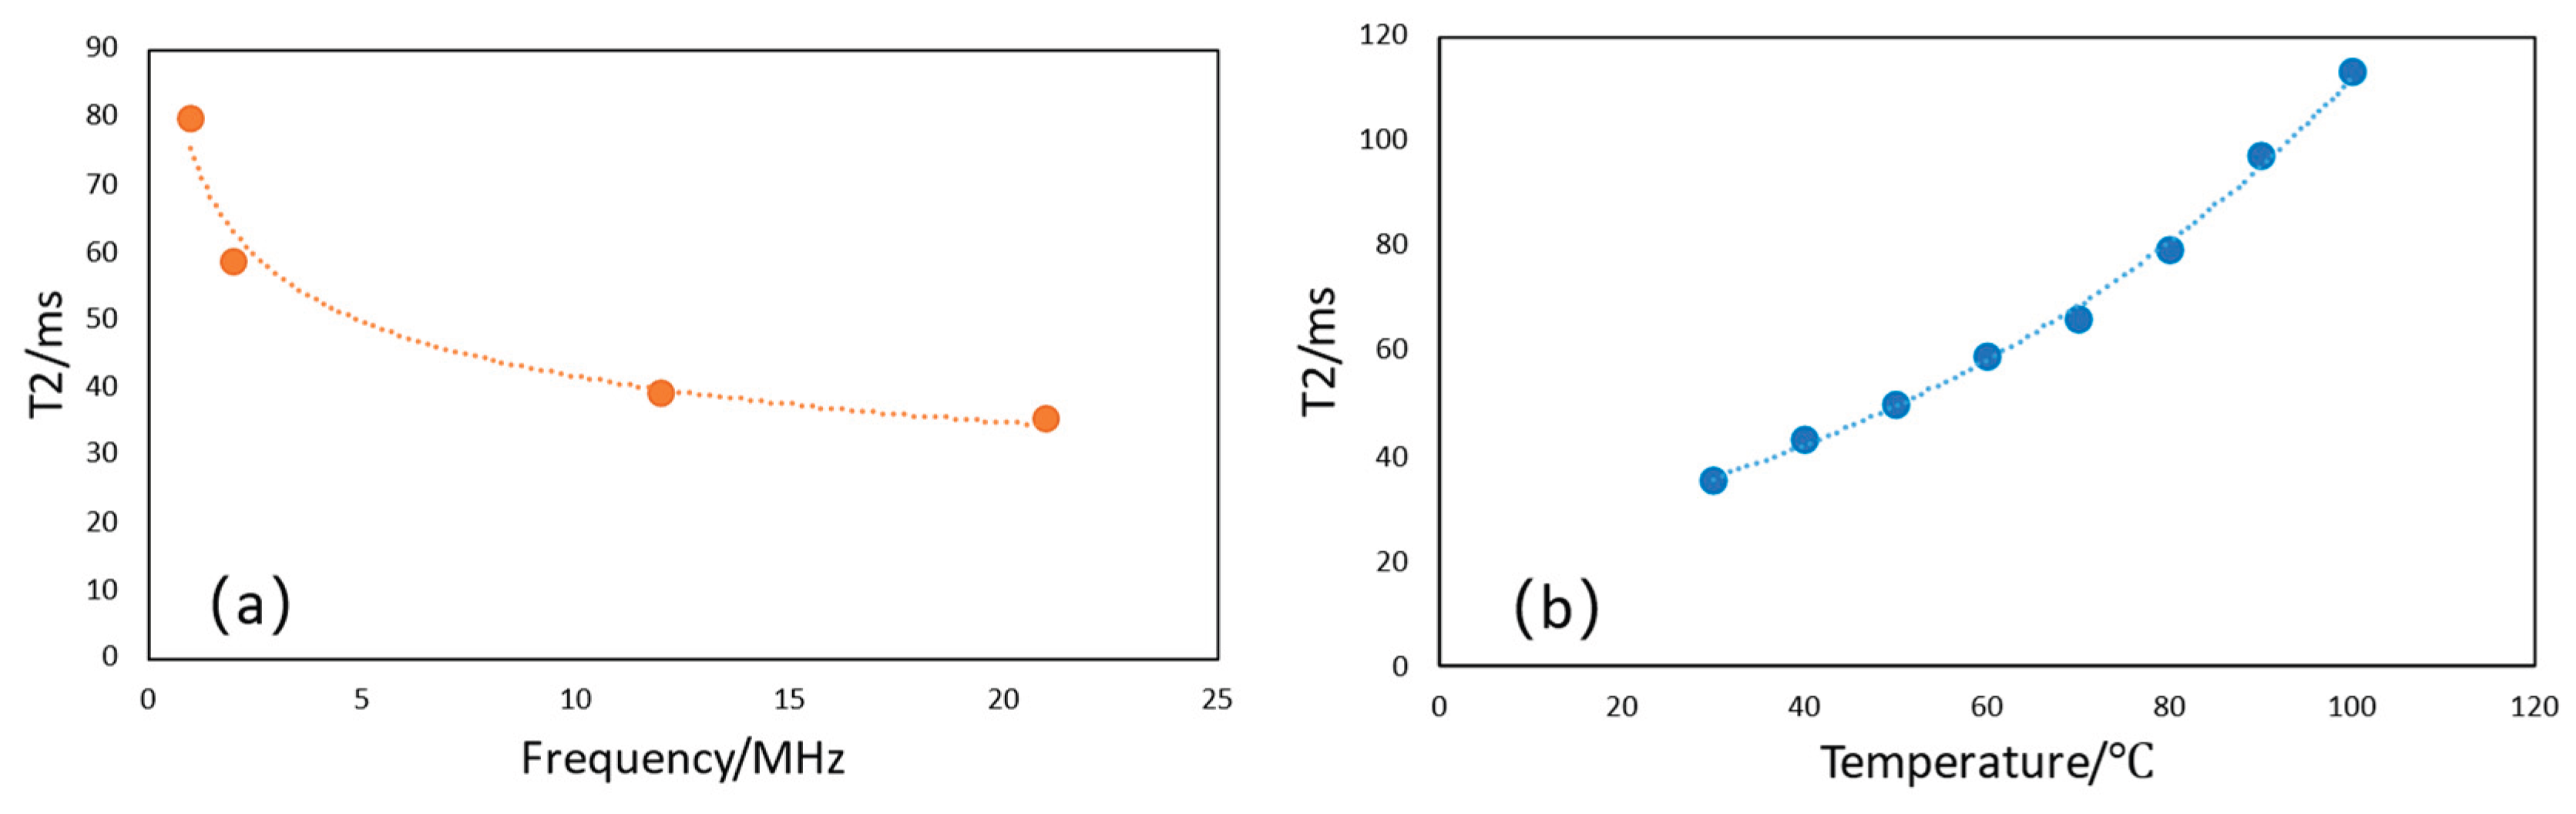
Figure 10.
T2 of oil-based mud filtrate versus frequency and temperature.
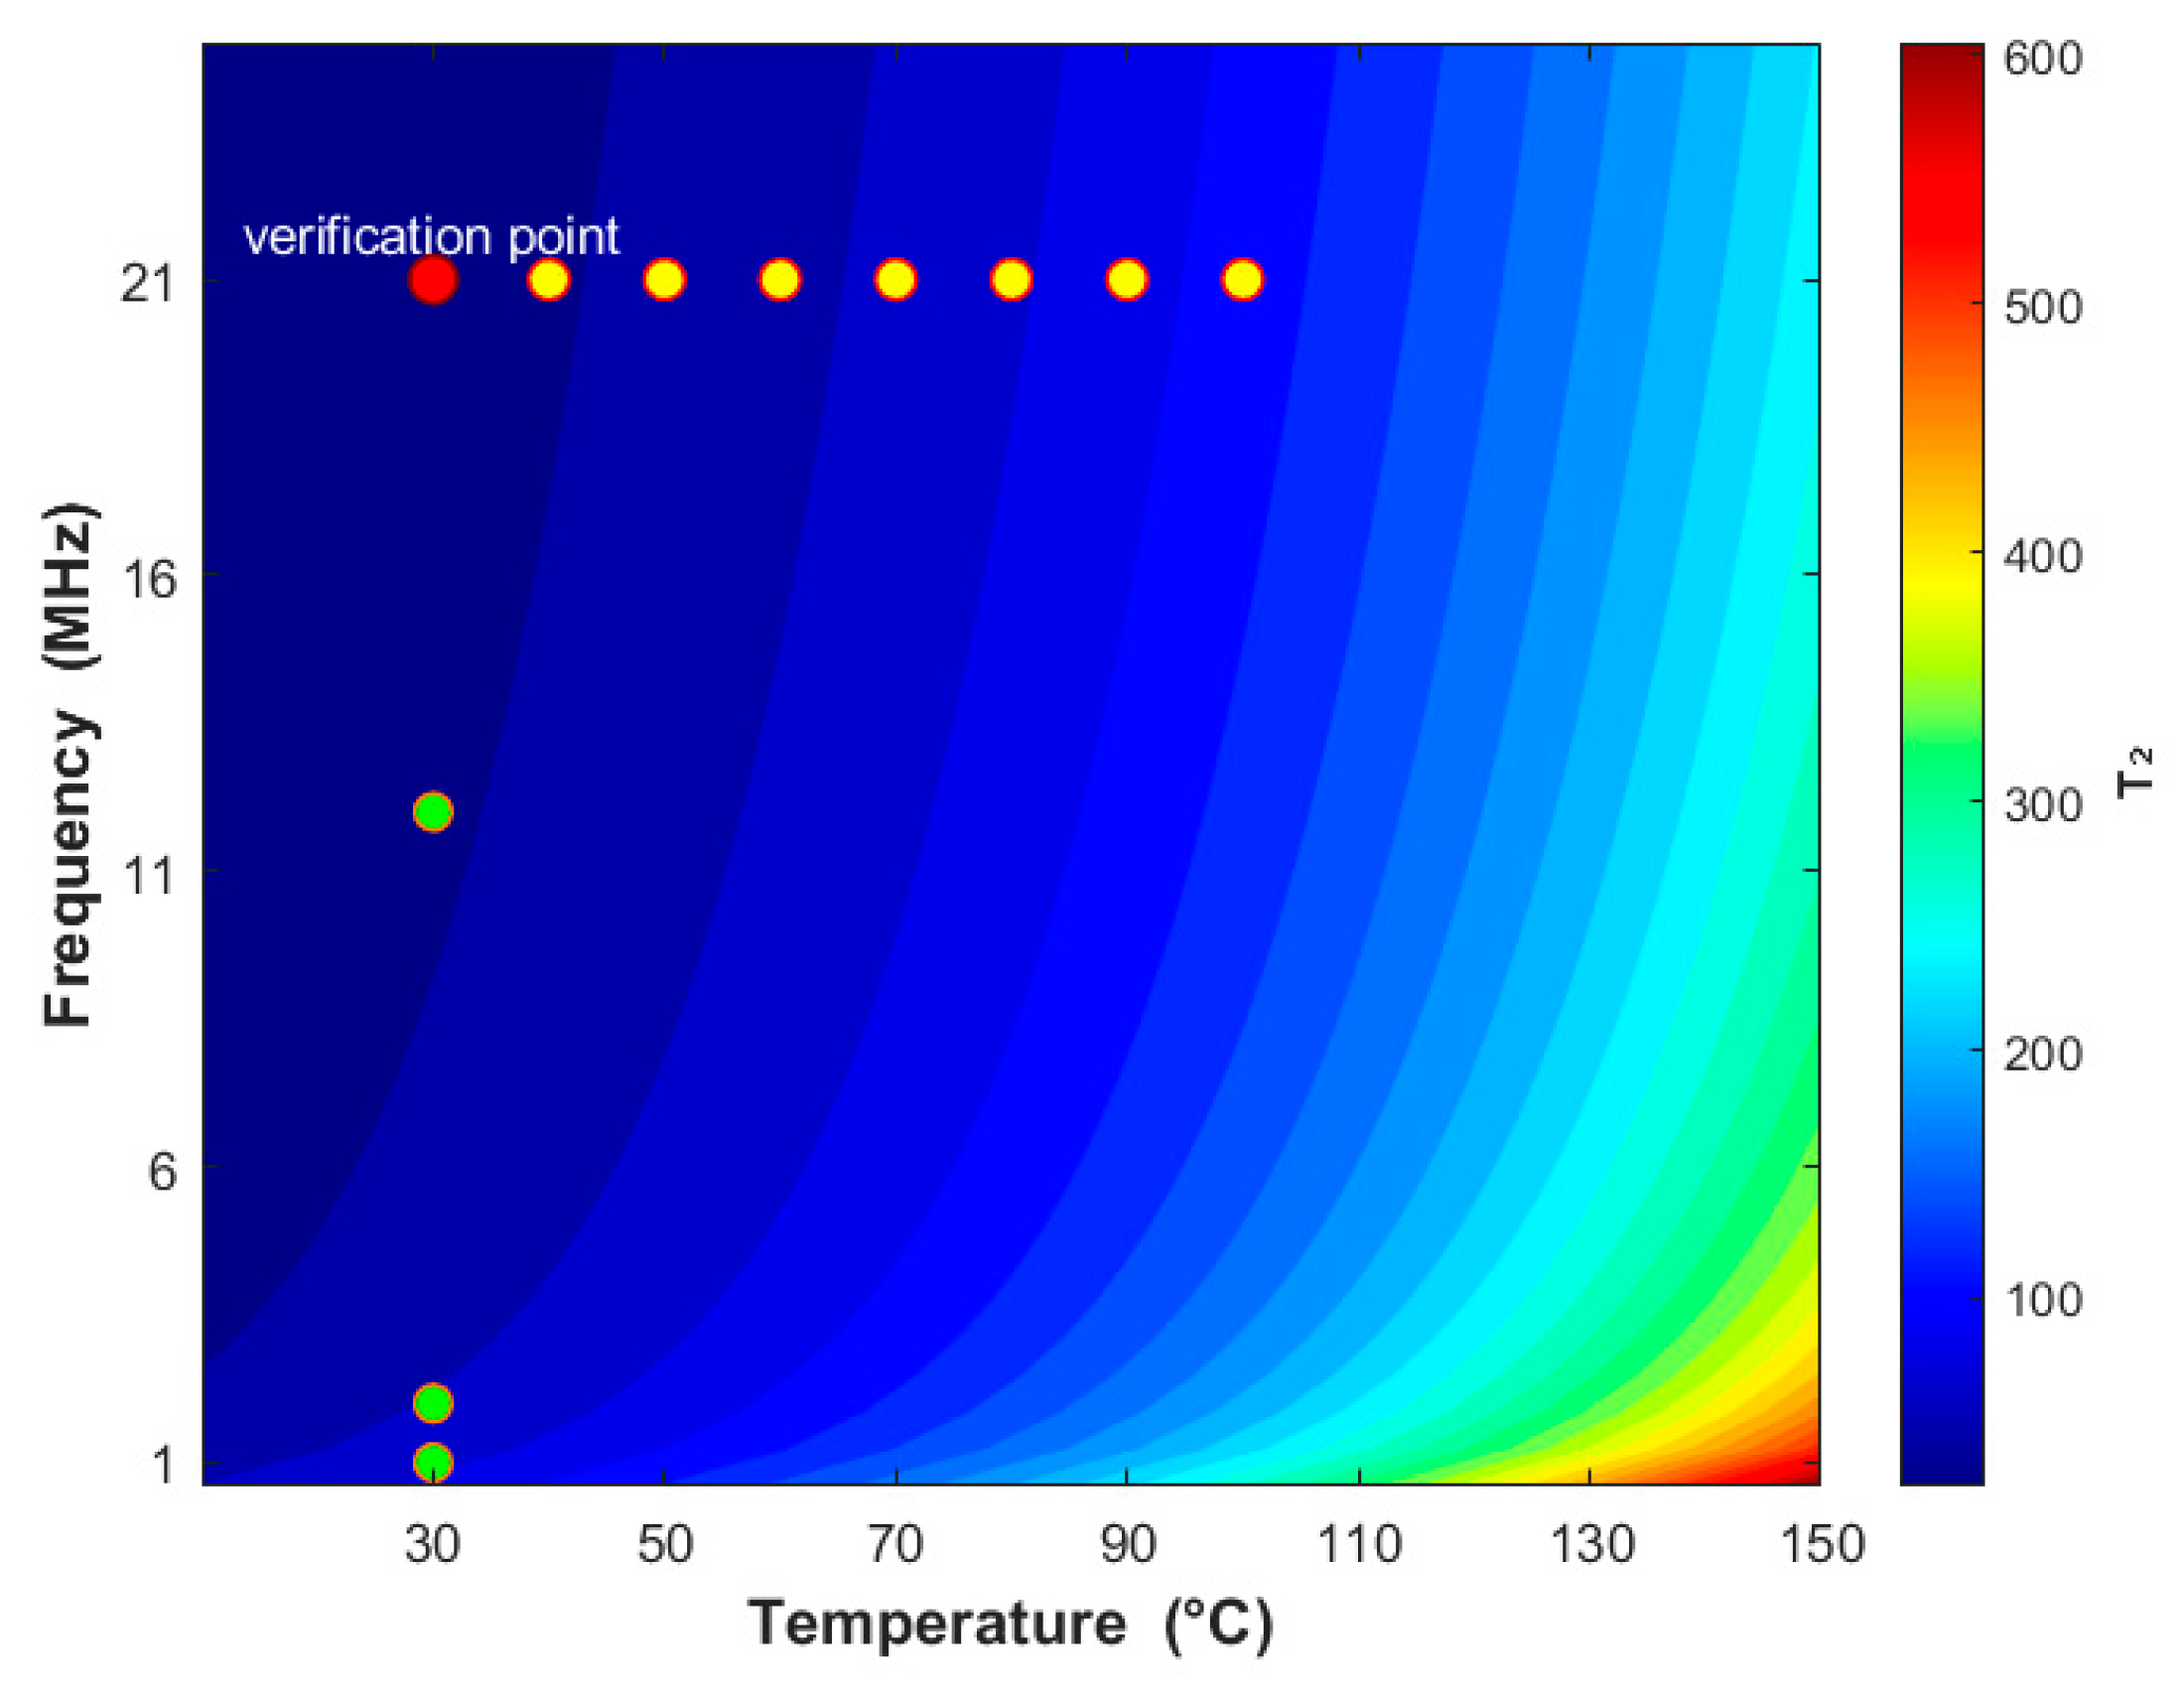
Figure 11.
Projection spectra of the 2D map along T₂ and T₁ directions.
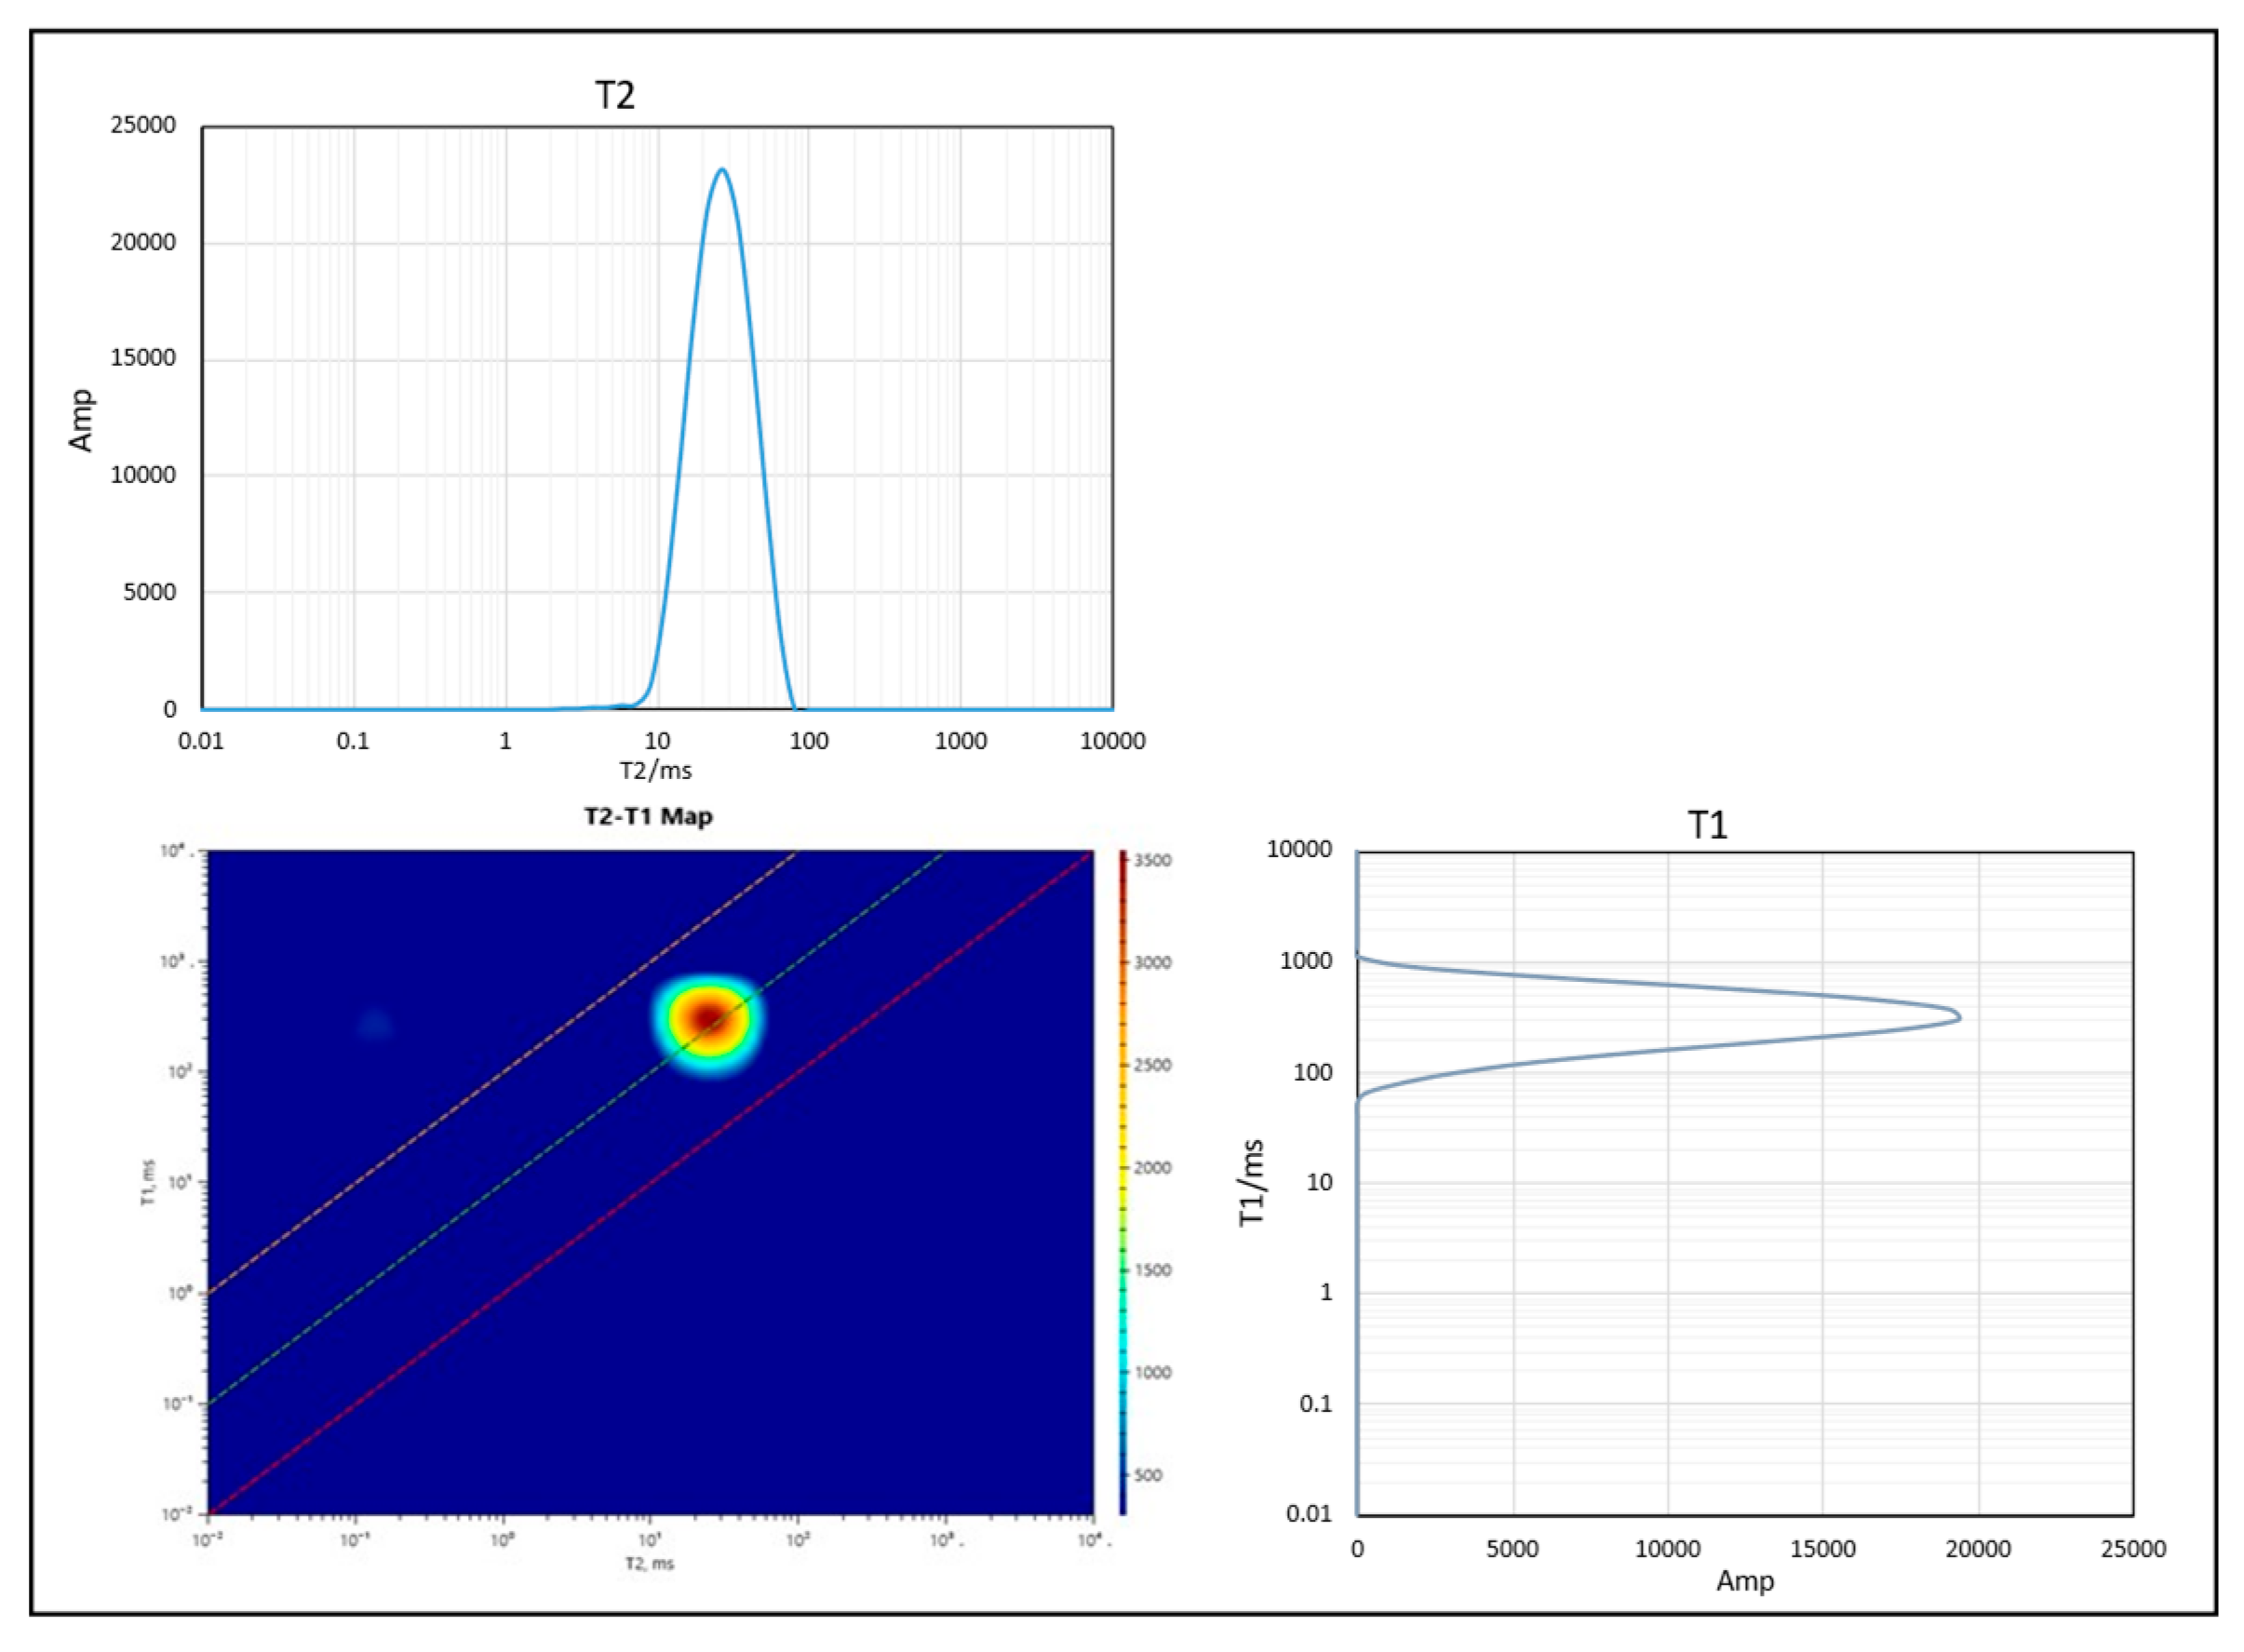
Figure 12.
Variation of T₁ of oil-based mud filtrate with frequency and temperature.
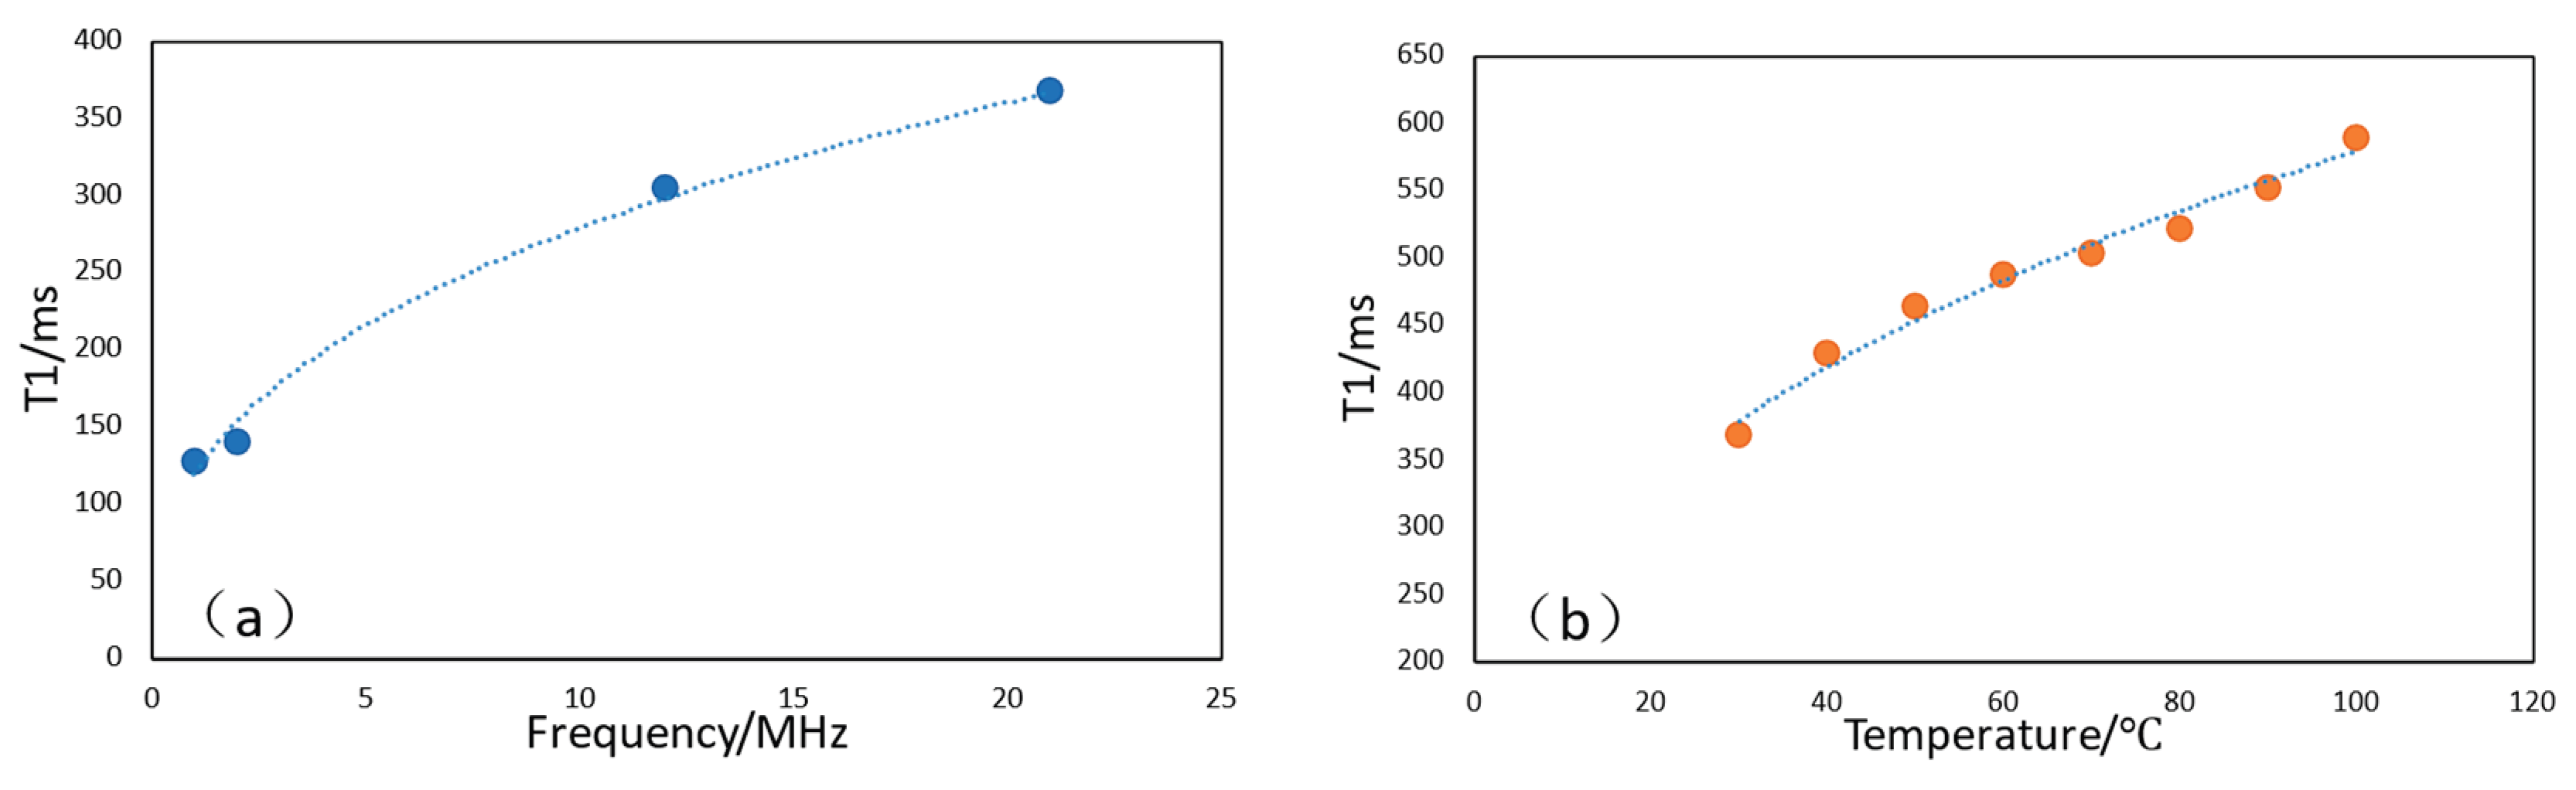
Figure 16.
One-dimensional T₂ spectra of oil-based mud filtrate at 12 MHz under 50 °C, 60 °C, and 90 °C.
Figure 16.
One-dimensional T₂ spectra of oil-based mud filtrate at 12 MHz under 50 °C, 60 °C, and 90 °C.
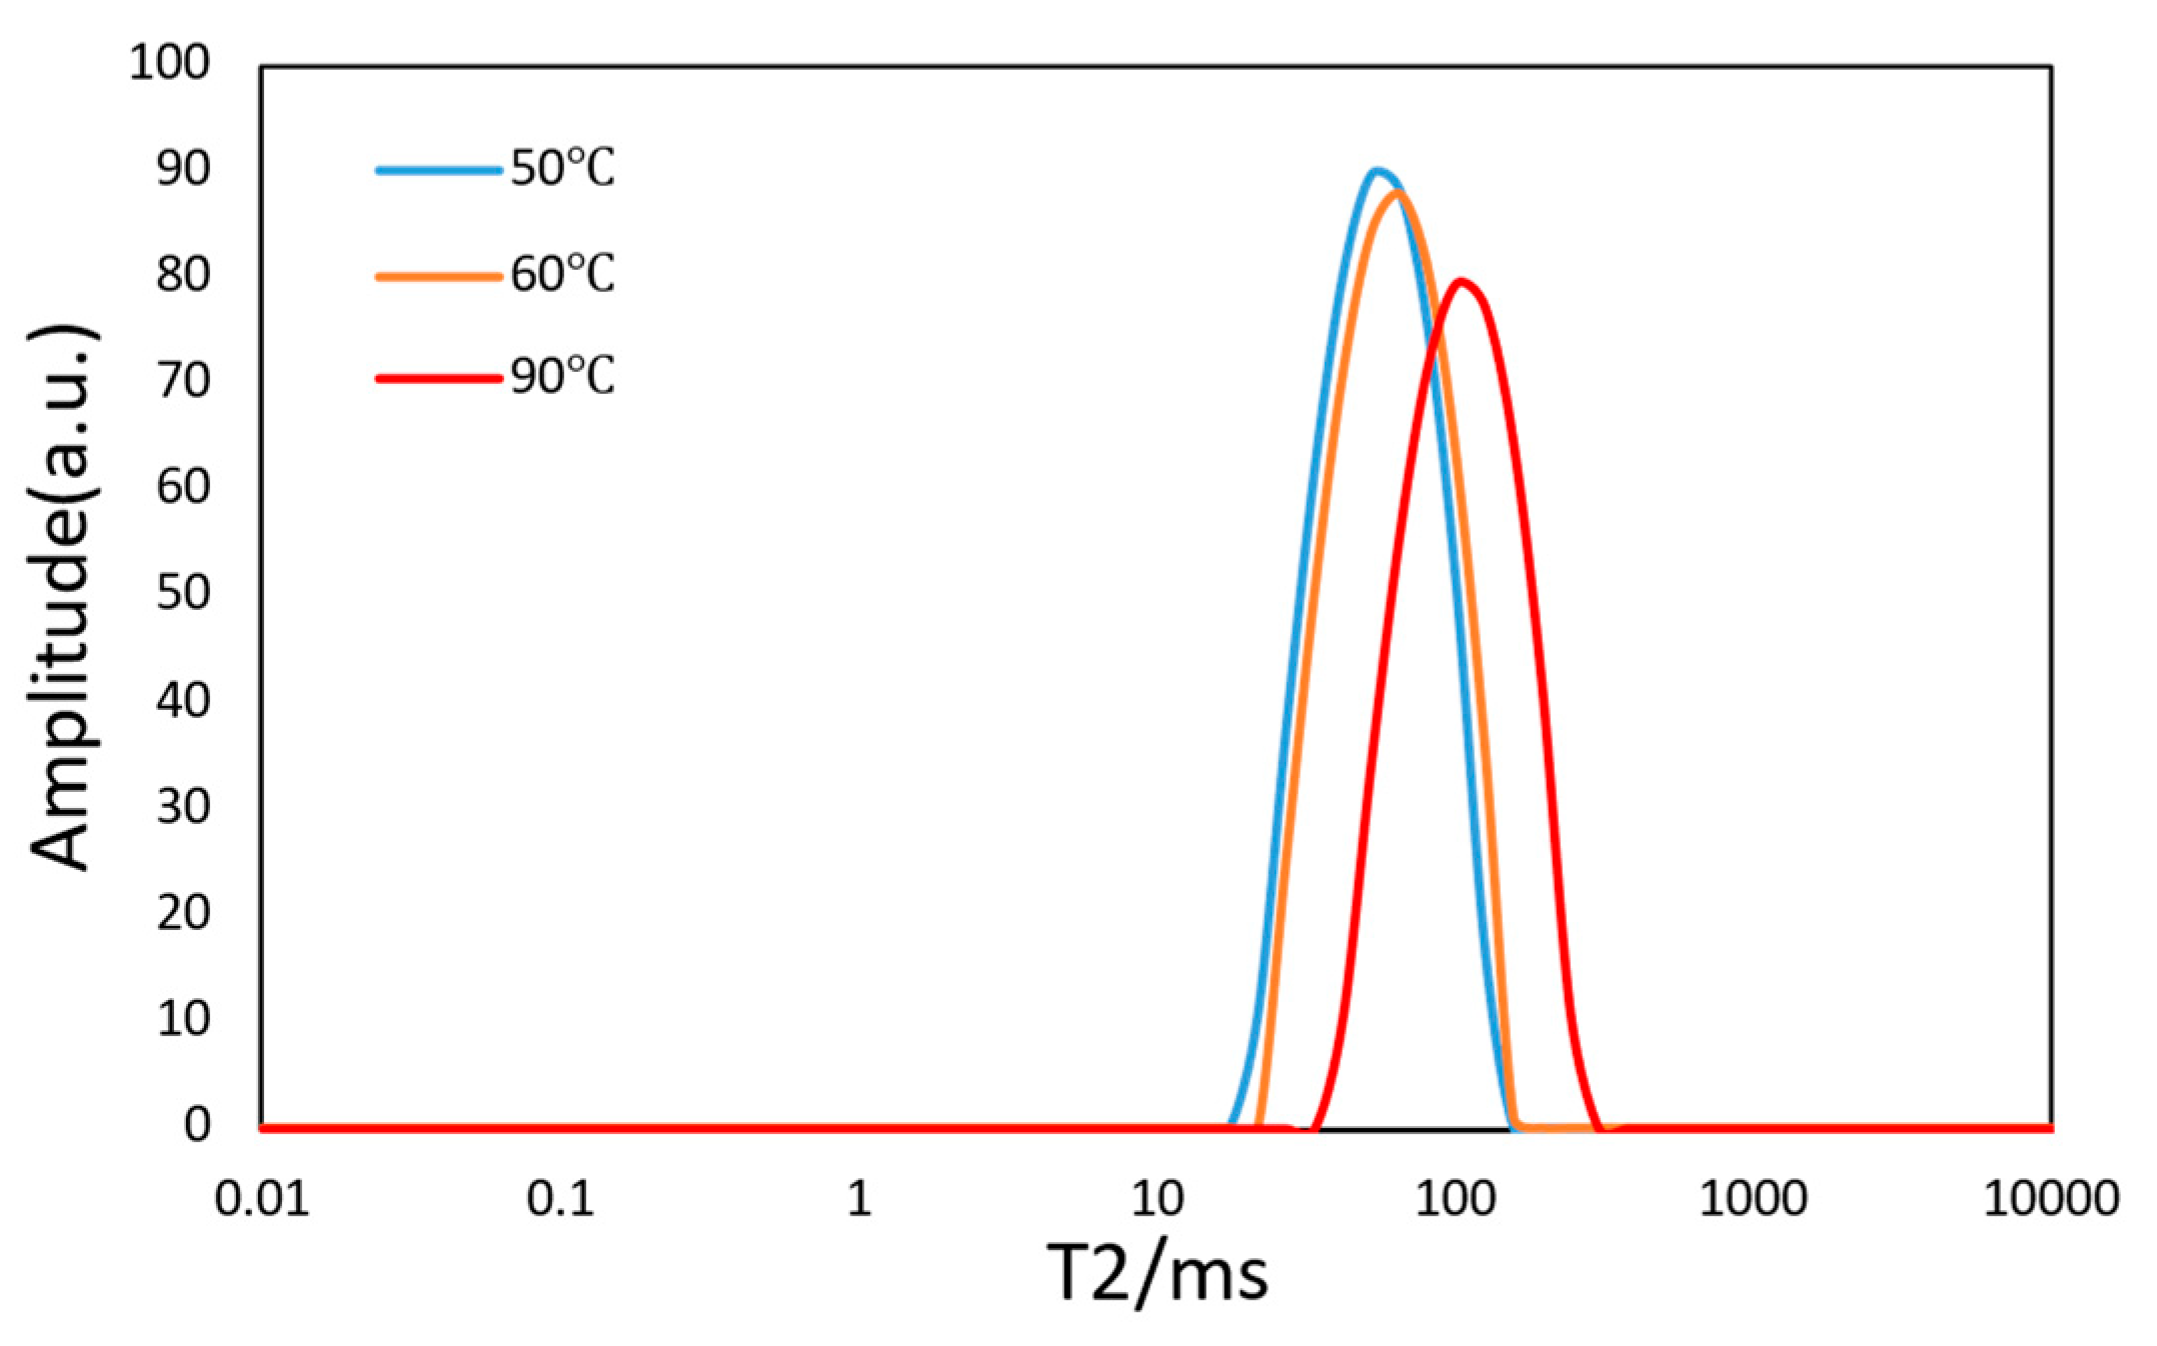
Figure 17.
T₂–T₁ 2D correlation maps of oil-based mud filtrate at 12 MHz under 50 °C, 60 °C, and 90 °C.
Figure 17.
T₂–T₁ 2D correlation maps of oil-based mud filtrate at 12 MHz under 50 °C, 60 °C, and 90 °C.
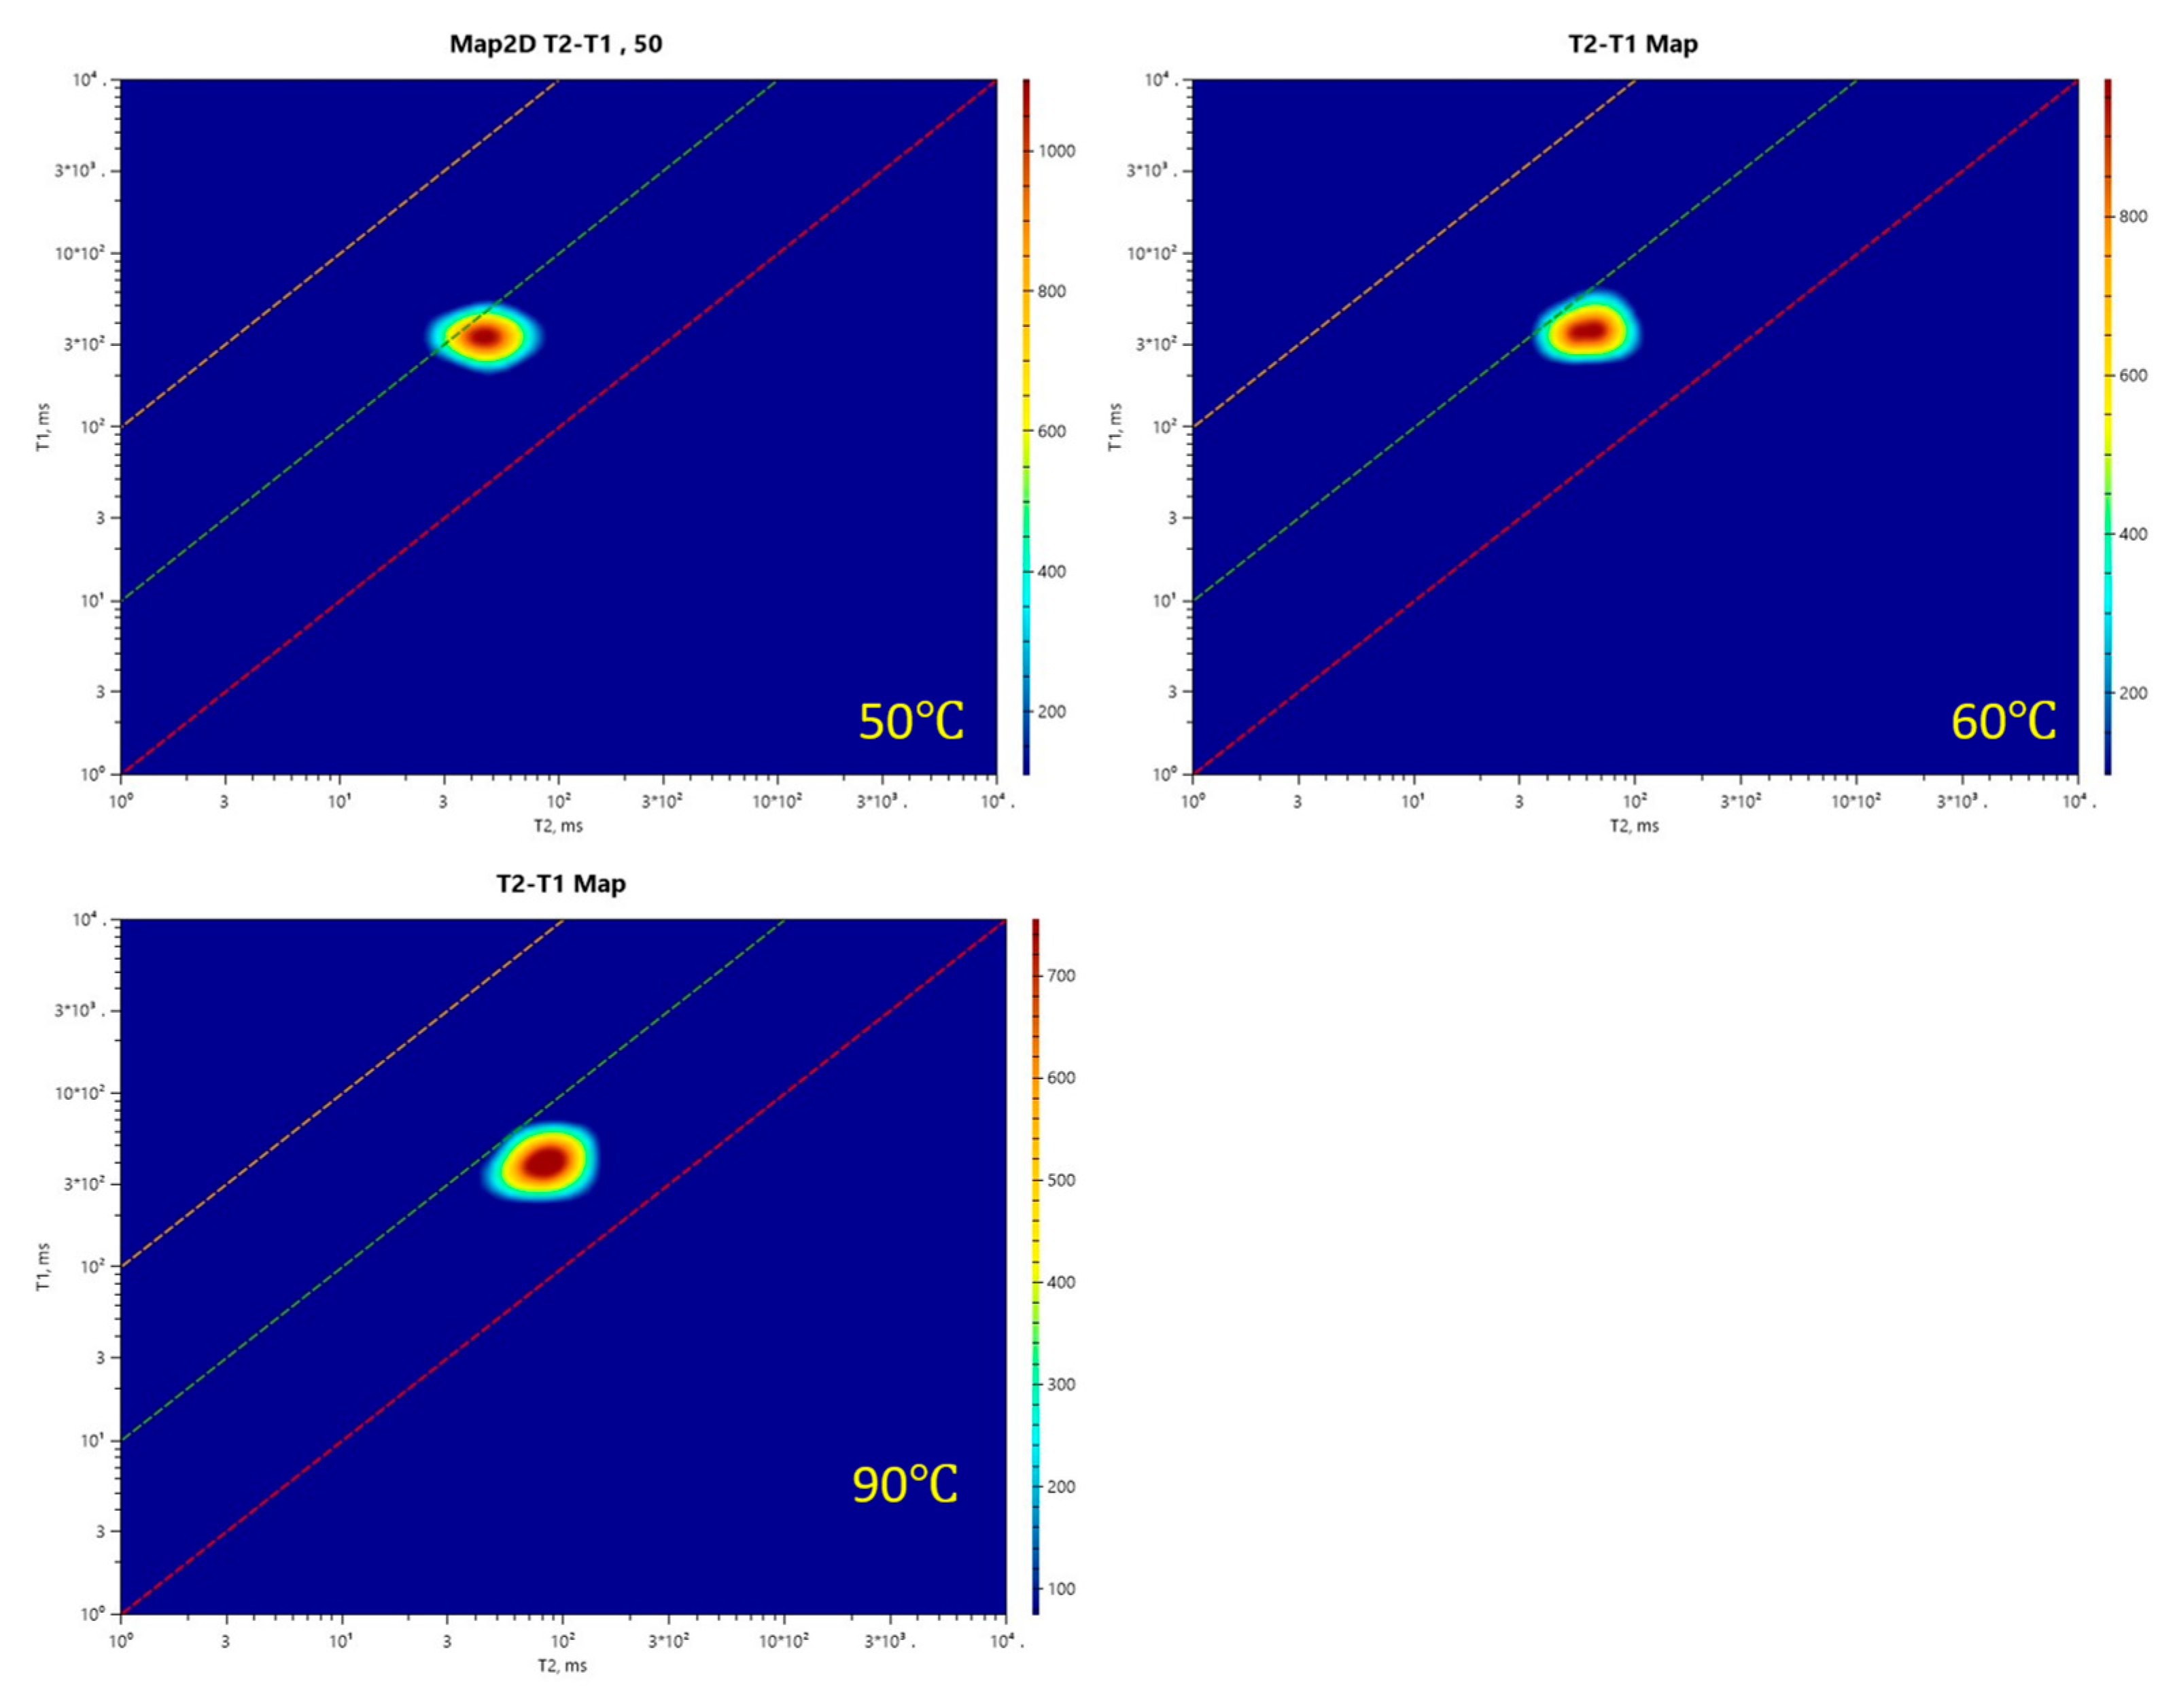
Table 2.
Comparison of T₂ model-calculated and measured values.
| Frequency MHz |
Temperature (°C) |
Calculated T₂ (ms) | Measured T2 (ms) | Absolute error (ms) | Relative error (%) |
| 21 | 30 | 35.41 | 35.41 | 0.00 | 0.00 |
| 21 | 40 | 41.68 | 43.20 | 1.52 | 3.51 |
| 21 | 50 | 49.06 | 49.86 | 0.80 | 1.60 |
| 21 | 60 | 57.75 | 59.02 | 1.27 | 2.16 |
| 21 | 70 | 67.97 | 66.13 | 1.84 | 2.78 |
| 21 | 80 | 80.00 | 79.29 | 0.71 | 0.90 |
| 21 | 90 | 94.17 | 97.28 | 3.11 | 3.20 |
| 21 | 100 | 110.84 | 113.23 | 2.39 | 2.11 |
| 12 | 30 | 40.89 | 39.20 | 1.69 | 4.31 |
| 2 | 30 | 64.80 | 58.64 | 6.16 | 10.51 |
| 1 | 30 | 77.44 | 79.76 | 2.32 | 2.91 |
Table 3.
Comparison of T₁ model-calculated and measured values.
| Frequency MHz |
Temperature (°C) |
Calculated T1 (ms) |
Measured T1 (ms) | Absolute error (ms) | Relative error (%) |
| 21MHz | 30 | 368.38 | 368.34 | 0.04 | 0.01 |
| 21MHz | 40 | 407.8 | 429.18 | 21.38 | 4.98 |
| 21MHz | 50 | 441.26 | 464.17 | 22.91 | 4.94 |
| 21MHz | 60 | 470.63 | 487.6 | 16.97 | 3.48 |
| 21MHz | 70 | 496.98 | 503.44 | 6.46 | 1.28 |
| 21MHz | 80 | 521.00 | 521.92 | 0.92 | 0.8 |
| 21MHz | 90 | 543.14 | 552.24 | 9.10 | 1.65 |
| 21MHz | 100 | 563.74 | 589.38 | 25.64 | 4.35 |
| 12MHz | 30 | 299.53 | 305.25 | 5.72 | 1.87 |
| 2MHz | 30 | 154.44 | 140.16 | 14.28 | 10.19 |
| 1MHz | 30 | 119.53 | 127.57 | 8.04 | 6.30 |
Table 4.
Comparison of R model-calculated and measured values.
| Frequency (MHz) |
Temperature (°C) |
Calculated R | Measured R | Absolute error | Relative error (%) |
| 21MHz | 30 | 11.15 | 11.18 | 0.03 | 0.29 |
| 21MHz | 40 | 10.35 | 10.87 | 0.53 | 4.83 |
| 21MHz | 50 | 9.55 | 10.21 | 0.66 | 6.44 |
| 21MHz | 60 | 8.75 | 8.94 | 0.19 | 2.15 |
| 21MHz | 70 | 7.95 | 8.17 | 0.22 | 2.67 |
| 21MHz | 80 | 7.15 | 7.19 | 0.04 | 0.61 |
| 21MHz | 90 | 6.35 | 6.49 | 0.14 | 2.17 |
| 21MHz | 100 | 5.55 | 5.82 | 0.27 | 4.64 |
| 12MHz | 30 | 7.91 | 8.44 | 0.53 | 6.25 |
| 2MHz | 30 | 2.64 | 2.53 | 0.11 | 4.34 |
| 1MHz | 30 | 1.72 | 1.84 | 0.12 | 6.27 |
Table 5.
Comparison of model-calculated and measured values.
| Model | Frequency (MHz) |
Temperature (°C) |
Model-calculated values | Measured values | Absolute error | Relative error (%) |
| T₂ | 12 | 50 | 56.65 ms | 53.95 ms | 2.70 ms | 5.00 |
| T₂ | 12 | 60 | 66.68 ms | 60.10 ms | 6.58 ms | 10.95 |
| T₂ | 12 | 90 | 108.73 ms | 102.30 ms | 6.43 ms | 6.29 |
| T₁ | 12 | 50 | 358.80 ms | 333.48 ms | 25.32 ms | 7.60 |
| T₁ | 12 | 60 | 382.67 ms | 353.28 ms | 29.39 ms | 8.32 |
| T₁ | 12 | 90 | 441.63 ms | 412.57 ms | 29.06 ms | 7.04 |
| R | 12 | 50 | 6.78 | 7.15 | 0.37 | 5.24 |
| R | 12 | 60 | 6.21 | 6.09 | 0.12 | 1.93 |
| R | 12 | 90 | 4.51 | 4.99 | 0.48 | 9.67 |
Disclaimer/Publisher’s Note: The statements, opinions and data contained in all publications are solely those of the individual author(s) and contributor(s) and not of MDPI and/or the editor(s). MDPI and/or the editor(s) disclaim responsibility for any injury to people or property resulting from any ideas, methods, instructions or products referred to in the content. |
© 2026 by the authors. Licensee MDPI, Basel, Switzerland. This article is an open access article distributed under the terms and conditions of the Creative Commons Attribution (CC BY) license (http://creativecommons.org/licenses/by/4.0/).
Copyright: This open access article is published under a Creative Commons CC BY 4.0 license, which permit the free download, distribution, and reuse, provided that the author and preprint are cited in any reuse.