

Submitted:
28 July 2026
Posted:
29 July 2026
You are already at the latest version
Abstract
Background: Liver fibrosis staging plays a key role in the prognosis and management of chronic liver disease. Liver biopsy remains the reference standard for fibrosis assessment but is limited by its invasiveness and risk of complications, while magnetic resonance elastography, though also considered a gold standard, is constrained by cost and limited availability. Ultrasound-based elastography techniques — vibration-controlled transient elastography (VCTE), point shear wave elastography (pSWE), and two-dimensional shear wave elastography (2D SWE) — have emerged as accessible non-invasive alternatives. This narrative review aimed to summarise the principles, diagnostic performance, advantages, and limitations of these three techniques across a range of aetiologies. Methods: A comprehensive literature search was conducted across Scopus, PubMed, Embase, CINAHL, the Cochrane Library, Informit, and the JBI Database of Systematic Reviews and Implementation Reports, covering January 2015 to February 2026. Search terms included “vibration-controlled transient elastography,” “point shear wave elastography,” “two-dimensional shear wave elastography,” “liver stiffness measurement,” “non-invasive assessment,” and “chronic liver disease.” International guidelines, systematic reviews and meta-analyses, large observational cohort studies, and narrative reviews were included in the synthesis. Results: VCTE, pSWE, and 2D SWE all demonstrated good diagnostic performance for detecting advanced fibrosis and cirrhosis across multiple aetiologies. VCTE was the most extensively validated technique, with standardised cut-offs endorsed by major international guidelines. pSWE and 2D SWE showed comparable diagnostic accuracy and can be integrated into conventional ultrasound systems, enabling simultaneous structural and stiffness assessment, although validated cut-off values for these two techniques are not yet established in current guidelines. Obesity, inflammation, steatosis, and recent food intake were identified as factors affecting measurement accuracy across all three techniques. Conclusions: Ultrasound-based elastography techniques offer effective, non-invasive alternatives to liver biopsy for fibrosis assessment. VCTE remains the most validated option despite cost and availability constraints, while pSWE and 2D SWE offer comparable accuracy with practical integration advantages. Future research should focus on standardising cut-off values, addressing confounding factors, and combining elastography with biomarkers and AI-driven models.
Keywords:
vibration-controlled transient elastography
; point shear wave elastography
; two-dimensional shear wave elastography
; liver stiffness measurement
; non-invasive assessment
; chronic liver disease
1. Introduction
Chronic liver injury from a range of aetiologies—including alcohol-related liver disease, metabolic dysfunction-associated steatotic liver disease (MASLD), autoimmune liver disease, and chronic hepatitis B and C—can lead to progressive fibrosis and cirrhosis, which carry substantial morbidity and mortality [1,2,3] and account for approximately 1.5 million deaths each year [1].
Assessing the severity of liver fibrosis and portal hypertension is important for the management and prognostication of chronic liver disease [4,5]. Fibrosis staging also informs treatment decisions, and appropriate treatment may halt or even reverse fibrosis progression [2]. Liver biopsy is the gold-standard investigation for fibrosis assessment [1]; however, its use has declined because it is invasive and painful and carries risks such as bleeding and infection [1,5,6,7]. Moreover, a biopsy samples only a tiny fraction of the liver (about 1/50,000), which can lead to diagnostic inaccuracy, particularly in early-stage fibrosis [7].
Non-invasive methods—serum biomarkers and elastography-based measures of liver stiffness—have emerged as alternatives that reduce the need for biopsy [3,5]. Serum biomarkers are most useful in severe fibrosis, and their accuracy is limited in mild-to-moderate disease [7]. Elastography measures liver elasticity, which reflects the amount of fibrotic tissue present [2,4]. US-based elastography techniques fall into two categories: strain imaging-based methods and shear wave imaging-based methods. Strain imaging-based methods include strain elastography and acoustic radiation force impulse (ARFI) strain imaging, whereas shear wave imaging-based methods include VCTE, pSWE, and 2D SWE [1,8].
Transient elastography (TE) for liver stiffness measurement was first introduced in 2003. Image-guided US elastography systems, using standard probes with multiple transducer elements, were subsequently developed [2]. In 2008, the integration of shear wave elastography (SWE) into ultrasound systems further improved feasibility. Since then, a range of elastography technologies has emerged, together with classification frameworks such as that proposed by the European Federation of Societies for Ultrasound in Medicine and Biology (EFSUMB) [4]. Some studies have also combined elastography with serum markers to improve accuracy, because serum markers alone have low specificity for fibrosis and imaging techniques show measurement variability [7].
A comprehensive literature search was conducted across Scopus, PubMed, Embase, CINAHL, the Cochrane Library, Informit, and the JBI Database of Systematic Reviews and Implementation Reports, covering January 2015 to February 2026. The search combined the following MeSH terms and keywords: “Vibration-controlled transient elastography”, “Point shear wave elastography”, “Two-dimensional shear wave elastography”, “Liver stiffness measurement”, “Non-invasive assessment”, and “Chronic liver disease”. International guidelines, systematic reviews and meta-analyses, large observational cohort studies, and narrative reviews were included in the synthesis.
This review focuses on the three shear wave elastography techniques—pSWE, VCTE, and 2D SWE—for the assessment of liver fibrosis. We provide a comprehensive overview of their principles, diagnostic performance, and comparative utility in clinical practice, and highlight their evolving role in the evaluation and monitoring of chronic liver disease.
2. Principles of Elastography Techniques
Liver elasticity reflects the amount of fibrotic tissue within the liver and is what elastography techniques quantify. Both US-based and MR-based methods are available; MR-based elastography has the higher diagnostic accuracy but is not used routinely because of its high cost and limited availability [1].
US-based elastography techniques are of two broad types: strain-wave and shear-wave elastography. In strain elastography, the operator applies gentle manual compression with the probe and the system measures the resulting tissue strain or displacement, on the principle that softer tissue deforms more than stiffer, fibrotic tissue; this yields a qualitative, colour-coded output. Shear-wave systems instead generate mechanical vibrations or ARFI excitations that produce shear waves within the liver (Figure 1). The speed of these shear waves is measured, on the principle that they travel faster through stiffer tissue, so their velocity correlates with liver stiffness [9].
- Vibration Controlled Transient Elastography (VCTE)
TE is performed with a device that combines a low-frequency mechanical vibrator with an ultrasonic transducer [8]. Early TE systems had several limitations, including high measurement variability, owing to the use of a single transducer element and the absence of real-time image guidance, which made it difficult to target regions of homogeneous liver tissue accurately [2].
VCTE was developed as an advanced form of TE to overcome these limitations [2]. In VCTE, a mechanical vibrator generates low-frequency shear waves that propagate through the liver, and an ultrasound pulse-echo system measures their velocity; because shear wave velocity reflects tissue stiffness, VCTE provides a more accurate assessment of elasticity [8,9]. FibroScan® is the most widely used VCTE device. VCTE can assess both liver and spleen stiffness and is regarded as a reliable method across various aetiologies [10,11]. It also derives the controlled attenuation parameter (CAP) to estimate hepatic fat content.
VCTE is more accurate in advanced than in early fibrosis. Numerous studies and meta-analyses comparing VCTE with liver biopsy have found good accuracy for significant fibrosis and the best accuracy for the detection of cirrhosis [5].
Liver stiffness is reported in kilopascals (kPa), ranging from 1.5 to 75.0 kPa, with normal values around 5 kPa. Paediatric and adult probes are available; the adult probes operate at 50 Hz and come in different sizes (the M probe and the XL probe for a BMI greater than 30). Measurements are taken with the patient supine [9]. A dedicated splenic probe operating at 100 Hz is used to measure spleen stiffness (SSM).
- 2D Shear wave elastography (2D SWE)
2D SWE uses ARFI excitations across multiple focal zones to generate shear waves and quantify their speed. The shear wave speed, measured in metres per second, is converted to kilopascals (kPa) using Young’s modulus [12]. It also produces a real-time, colour-coded stiffness map over a relatively large area of the liver, typically about 2 cm × 2 cm, and stiffness can be sampled at multiple locations within the selected region of interest (ROI) [9]. Concurrent B-mode imaging helps identify the ROI and avoid artefacts [6,9].
- Point shear wave elastography (pSWE)
pSWE is likewise a validated method for detecting liver fibrosis of various aetiologies [11]. It uses ARFI excitation at a single focal location to generate shear waves and measure their speed in metres per second, which is then converted to kPa using Young’s modulus [13]. Measurements are taken over a smaller area (approximately 1.0 cm × 0.5 cm) than with VCTE or 2D SWE [8,9], with the ROI selected by the operator under B-mode guidance [2,8].
3. Stage-Wise Diagnostic Accuracy of Liver Elastography Techniques
Fibrosis staging is essential for the management of patients with chronic liver disease (CLD). In this review, fibrosis assessed by VCTE, pSWE, and 2D SWE is reported using the METAVIR system, with stages grouped as none/mild fibrosis (F0–F1), significant fibrosis (≥F2), advanced fibrosis (≥F3), and cirrhosis (F4).
- VCTE
Multiple studies and meta-analyses have evaluated the diagnostic performance of VCTE across fibrosis stages. A 2024 meta-analysis of 19,199 patients with MASLD reported AUROCs of 0.83 for any fibrosis (≥F1), 0.83 for significant fibrosis, 0.87 for advanced fibrosis, and 0.94 for cirrhosis (Table 1), confirming that VCTE is highly reliable for detecting advanced fibrosis and cirrhosis [14]. In 230 patients with biopsy-proven MASLD, a systematic review and pooled analysis reported AUROCs of 0.82 for ≥F1, 0.87 for ≥F2, 0.84 for ≥F3, and 0.84 for F4 [15]. A meta-analysis of 6159 patients with MASLD found that, as a point-of-care test, VCTE had a pooled sensitivity of 76–89% and a pooled specificity of 67–73% across stages F1 to F4 [16].
VCTE has also been extensively evaluated in chronic hepatitis B. A meta-analysis of 4386 patients with chronic hepatitis B reported AUROCs of 0.91 and 0.93 for detecting advanced fibrosis and cirrhosis, respectively [17]. A meta-analysis of 8 studies and 2003 antiviral treatment-naïve patients with chronic hepatitis B found an AUROC of 0.81 for detecting significant fibrosis [18]. In that population of 2003 patients, VCTE had a pooled sensitivity of 0.78 and a summary specificity of 0.72 for significant fibrosis—consistent with earlier meta-analyses that reported sensitivities of 0.73–0.81 and specificities of 0.66–0.82 [18,19,20,21].
VCTE also performs well in autoimmune liver disease [22]. A meta-analysis of patients with autoimmune liver diseases (599 with primary biliary cholangitis [PBC], 388 with autoimmune hepatitis [AIH], and 151 with primary sclerosing cholangitis [PSC]) reported an AUROC greater than 0.85 across all fibrosis stages [22].
VCTE also compares favourably with serum biomarkers. In a meta-analysis of five non-invasive markers (liver stiffness by VCTE, FIB-4, the MASLD Fibrosis Score, the AST-to-platelet ratio index, and the AST/ALT ratio), VCTE showed the highest diagnostic performance, with an AUROC of 0.85 [16].
Despite this good accuracy, the performance of VCTE depends on patient-related factors and operator experience, which may limit its reliability in some settings.
- 2D SWE
2D SWE has also shown good accuracy for detecting liver fibrosis across multiple aetiologies and stages [6]. In a large meta-analysis of 1134 patients, 2D SWE achieved AUROCs of 0.863, 0.906, and 0.855 for significant fibrosis and 0.929, 0.955, and 0.917 for cirrhosis in patients with hepatitis C, hepatitis B, and MASLD, respectively (Table 1) [23]. Uchikawa et al. reported AUROCs of 0.652, 0.732, and 0.761 for F1, F2, and F3, respectively, in 85 patients with fibrosis of mixed aetiology [24].
More recent meta-analyses confirm the strong diagnostic performance of 2D SWE. A 2025 meta-analysis of 20 studies (2223 patients) reported pooled AUROCs of 0.82, 0.82, 0.86, and 0.89 for ≥F1, ≥F2, ≥F3, and F4, respectively [25]. Studies using the Canon ultrasound system reported an AUROC above 0.8 at every fibrosis stage in MASLD [26,27]. A meta-analysis of 5216 patients with chronic hepatitis B reported AUROCs of 0.93 for advanced fibrosis and 0.94 for cirrhosis [28], and a further meta-analysis of 11 studies (2623 patients with chronic hepatitis B) found good performance for significant fibrosis, with an AUROC of 0.92, a summary sensitivity of 88%, and a summary specificity of 83% [29].
Comparative studies show a strong correlation between 2D SWE liver stiffness and histological stage. In an evaluation of 13 non-invasive tools against liver biopsy in chronic hepatitis B, the strongest correlation was with 2D SWE (r = 0.779, p < 0.001), followed by VCTE (r = 0.719, p < 0.001) [7].
In patients with chronic hepatitis, liver stiffness by 2D SWE correlated significantly with both fibrosis stage and FIB-4 score (p < 0.001). Diagnostic accuracy was high, with AUROCs of 0.956 for significant fibrosis (cut-off 8.2 kPa; sensitivity 92.6%, specificity 78.8%) and 0.978 for severe fibrosis (cut-off 10.1 kPa; sensitivity 92.9%, specificity 96.4%) (Table 2), underscoring its value for detecting fibrosis and monitoring treatment response [30].
Combining serum biomarkers with 2D SWE improves accuracy: one study reported a higher AUROC for the combination (0.889) than for 2D SWE alone (0.805) [31], and Zhang et al. similarly found that 2D SWE plus serum markers outperformed 2D SWE alone (AUROC 0.889 vs. 0.851) [7].
- pSWE
Several meta-analyses have assessed the accuracy of pSWE for fibrosis staging. In a meta-analysis of 28 studies, Schambeck et al. reported a pooled sensitivity of 86% and specificity of 88% for significant fibrosis (Table 2), with an AUROC of 0.93, and concluded that pSWE is a good method for fibrosis assessment [32].
pSWE has also been compared directly with VCTE. A meta-analysis of nine pSWE studies (982 patients) and eleven VCTE studies (1753 patients) reported comparable performance in MASLD: pooled AUROCs for pSWE were 0.86, 0.94, and 0.95 for significant fibrosis, advanced fibrosis, and cirrhosis, versus 0.85, 0.92, and 0.94 for VCTE. Both techniques performed better for advanced fibrosis (≥F3) and cirrhosis (F4) than for significant fibrosis (≥F2), and the measurement failure rate was more than ten times higher with the VCTE M probe than with pSWE [8]. Losurdo et al. reported a pSWE AUROC of 0.98 for advanced fibrosis, falling to 0.88 for values below 6 kPa [33].
Further evidence supports the accuracy of pSWE in MASLD. A meta-analysis in MASLD reported an AUROC of 0.89 (sensitivity 85%, specificity 83%) for significant fibrosis (≥F2) and an AUROC of 0.94 (sensitivity 90%, specificity 95%) for cirrhosis [11].
In another study, pSWE showed significantly higher liver stiffness in patients with MASLD (mean 10 ± 5.1 kPa) than in healthy individuals (mean 4.4 ± 0.7 kPa; p < 0.001), with stiffness rising across grades of fatty liver—supporting pSWE as a useful tool for fibrosis assessment, monitoring, and tracking disease progression [34].
Newer devices have also been evaluated. A study of a new pSWE device (X+pSWE) reported AUROCs of 0.89 for significant fibrosis, 0.98 for severe fibrosis, and 0.90 for cirrhosis, using liver biopsy as the reference standard [35].
4. Comparative Diagnostic Accuracy of VCTE, pSWE, and 2D SWE
- VCTE vs. pSWE vs. 2D SWE
The most recent meta-analysis (2026), which included 29 studies (4552 participants) and evaluated all US elastography techniques (VCTE, 2D SWE, and pSWE), reported a pooled AUROC of 0.932 (Table 3), a sensitivity of 88.8%, and a specificity of 89.2% (Table 4), confirming that US elastography is a highly effective non-invasive tool for fibrosis assessment [36].
Selvaraj et al., in a meta-analysis of 82 studies (14,609 patients with MASLD) comparing elastography techniques, found that pSWE had a superior summary AUROC to the other two techniques for significant fibrosis. AUROCs for significant fibrosis were 0.83, 0.75, and 0.86 for VCTE, 2D SWE, and pSWE, respectively; for advanced fibrosis, 0.85, 0.72, and 0.89; and for cirrhosis, 0.89, 0.88, and 0.90 [37].
A meta-analysis of 15 studies compared pSWE, 2D SWE, and VCTE. For significant fibrosis (≥F2), pooled sensitivity and specificity were 0.68 and 0.75 for pSWE, 0.85 and 0.72 for 2D SWE, and 0.79 and 0.73 for VCTE. On the basis of their 95% prediction intervals, VCTE and 2D SWE had similar overall accuracy for ≥F2 fibrosis, whereas pSWE had lower sensitivity but comparable specificity. For more advanced (≥F3) or early (≥F1) fibrosis, VCTE was more accurate than both SWE modalities, with pSWE performing least well. These findings suggest that 2D SWE and VCTE are preferable for non-invasive fibrosis assessment, while pSWE may be less sensitive at moderate stages [38].
Inconsistencies in the reported performance figures across studies probably reflect heterogeneity in study populations, operator expertise, technical factors, and fibrosis prevalence.
- 2D SWE vs. VCTE
A meta-analysis of 64 articles (13,046 patients with MASLD) found that SWE and MR elastography (MRE) outperformed other non-invasive tests, including VCTE. The summary sensitivity and specificity were 0.90 and 0.93 for SWE and 0.87 and 0.79 for VCTE, and the summary AUROCs were 0.88, 0.85, and 0.95 for the FibroScan M probe, XL probe, and SWE, respectively [39].
Herrmann et al., in a meta-analysis of 1134 patients with chronic hepatitis C (n = 379), hepatitis B (n = 400), and MASLD (n = 156), reported that 2D SWE had significantly higher diagnostic accuracy than VCTE, with AUROCs of 0.863, 0.906, and 0.855 for significant fibrosis (AUROC difference 0.022–0.084; p = 0.001) and 0.929, 0.955, and 0.917 for cirrhosis (AUROC difference 0.003–0.084; p = 0.022), respectively [40].
Another meta-analysis of 8 studies (1301 patients with chronic viral hepatitis) found comparable accuracy for advanced fibrosis and cirrhosis, with AUROCs of 0.93 (2D SWE) and 0.91 (VCTE) for advanced fibrosis and 0.97 and 0.95, respectively, for cirrhosis [3].
Karagiannakis et al. showed that liver stiffness by 2D SWE correlated strongly with VCTE (p < 0.001) across aetiologies, fibrosis stages, patient characteristics, and degrees of steatosis, supporting 2D SWE as a reliable alternative to VCTE; the correlation held when distinguishing severe fibrosis (≥F3) and cirrhosis from lesser disease [5]. Zhang et al., comparing 2D SWE and VCTE in chronic hepatitis B and C, found similar diagnostic accuracy, although some studies report higher accuracy for 2D SWE [7,41]. Kobayashi et al. reported a strong positive correlation between 2D SWE and VCTE for liver stiffness measurement (LSM) (r = 0.78, p < 0.001), suggesting that 2D SWE can substitute for VCTE [6].
Zhang et al. also noted that, in chronic hepatitis B, VCTE and 2D SWE have similar accuracy, and that combining either technique with serum markers further improves performance, particularly for the advanced fibrosis stages that warrant clinical intervention [7].
In a study of 116 patients, 2D SWE showed excellent reliability (ICC 0.994) and correlated with histological fibrosis (r = 0.601, p < 0.001). AUROCs were 0.851 for ≥F2 fibrosis (cut-off 5.8 kPa) and 0.889 for cirrhosis (cut-off 9.6 kPa), comparable to VCTE, indicating that both are reliable non-invasive tools [42].
In another comparison of 2D SWE and VCTE in patients with liver disease, correlations varied by aetiology: alcohol-related liver disease (ALD; r = 0.53), MASLD (r = 0.87), hepatitis B (r = 0.50), and hepatitis C (r = 0.76), all with p < 0.001 except ALD (p = 0.03) [43].
Del Valle et al., comparing VCTE with endoscopic ultrasound (EUS)-guided 2D SWE, found that EUS-2D SWE had higher diagnostic accuracy than VCTE, especially for assessing fibrosis in the left lobe [1].
The higher performance seen in some studies may reflect the ability of 2D SWE to provide real-time B-mode guidance and to sample a larger ROI than VCTE.
- pSWE vs. 2D SWE
Mulazzani et al. found that the correlation between pSWE and 2D SWE was stronger at lower than at higher liver stiffness values (≥15.2 kPa); this has limited clinical impact, however, because values above that threshold generally indicate cirrhosis, whereas the lower ranges are more relevant to treatment decisions. A comparable study of 26 patients using FibroScan® reported good correlation with both pSWE and 2D SWE (p < 0.001) [4].
A meta-analysis of 13 studies (1527 patients with MASLD) compared pSWE and 2D SWE. For pSWE, summary AUROCs were 0.84, 0.91, and 0.94 for significant fibrosis (≥F2), advanced fibrosis (≥F3), and cirrhosis (F4), with sensitivities of 0.71, 0.81, and 0.81 and specificities of 0.83, 0.87, and 0.91. For 2D SWE, AUROCs were 0.83, 0.85, and 0.89, with sensitivities of 0.77, 0.80, and 0.92 and specificities of 0.76, 0.76, and 0.83. Overall, 2D SWE had slightly higher sensitivity and pSWE higher specificity, though the differences were not statistically significant [44].
A study assessing the correlation between a new pSWE device (X+pSWE) and 2D SWE found good agreement between their LSM values (p < 0.001) [35]; however, 2D SWE had greater sensitivity and specificity than pSWE for ≥F2 and ≥F3 fibrosis when biopsy was the reference standard [35].
In a further comparison in MASLD, both techniques were accurate—particularly for significant fibrosis (AUROC 0.872 for pSWE vs. 0.965 for 2D SWE) and cirrhosis (0.886 vs. 0.994)—but 2D SWE showed higher accuracy, sensitivity (≥F2: 96.7% vs. 75.9%; F4: 100% vs. 76.5%), specificity (≥F2: 95.9% vs. 87.8%; F4: 95.1% vs. 91.8%), and reliability than pSWE [45].
- VCTE vs. pSWE
In a comparison of elastography point quantification (EPQ) and VCTE in 353 patients with MASLD, EPQ was highly accurate, with AUROCs of 0.94 for significant fibrosis, 0.949 for advanced fibrosis, and 0.949 for cirrhosis and well-balanced sensitivity and specificity at the optimal cut-offs—comparable to VCTE, which also performed strongly for advanced fibrosis and cirrhosis. A strong positive correlation (Pearson’s r = 0.87) and high concordance (concordance correlation coefficient 0.792) were observed between the two methods [11].
A meta-analysis of nine pSWE studies (982 patients) and eleven VCTE studies (1753 patients) reported similar performance in MASLD: AUROCs for pSWE were 0.86, 0.94, and 0.95 for significant fibrosis, advanced fibrosis, and cirrhosis, versus 0.85, 0.92, and 0.94 for VCTE. Measurement failure was more than ten times more frequent with the VCTE M probe. Overall, both provide accurate non-invasive staging, with pSWE showing lower failure rates [8].
In another comparison, pSWE correlated strongly with VCTE at higher fibrosis stages (r = 0.79) but weakly at lower stages (r = 0.19), and the correlation varied by aetiology (r = 0.67 for HBV, 0.99 for ALD, 0.91 for HCV, 0.62 for MASLD, and 0.50 for AIH) [33].
Despite its favourable performance, pSWE samples only a small ROI, which may not adequately capture the heterogeneous distribution of liver fibrosis.
5. Elastography Techniques in Different Aetiologies of Liver Fibrosis
- Alcohol related liver disease
ALD is a major cause of liver-related morbidity and mortality, as affected patients often present with advanced disease and higher rates of complications. Non-invasive fibrosis testing is important, because early detection can prompt alcohol abstinence and halt progression. VCTE has the strongest evidence base in ALD, with excellent accuracy for advanced fibrosis (AUROC > 0.90) and good accuracy for significant fibrosis (AUROC 0.85), although pSWE and 2D SWE are alternatives. According to European Association for the Study of the Liver (EASL) standards for ALD, VCTE values below 8–10 kPa rule out advanced fibrosis, whereas values ≥ 12–15 kPa rule it in [46].
The American Gastroenterological Association (AGA) 2017 guidelines recommend a cut-off of 12.5 kPa to diagnose cirrhosis in ALD [47].
- MASLD
Early identification of patients at risk of progressive fibrosis in MASLD—particularly those at F2–F3 or with an LSM ≤ 8 kPa—allows timely initiation of therapy that can delay or prevent cirrhosis and reduce the global liver-related burden of MASLD [48]. Patients with MASLD and advanced fibrosis (F3–F4) are at higher risk of progression and adverse outcomes [23].
The American Association for the Study of Liver Diseases (AASLD) provides VCTE cut-offs of ≥ 12 kPa for advanced fibrosis and ≥20 kPa for cirrhosis and regards VCTE as a point-of-care test; for SWE, the advanced-fibrosis cut-offs are similar but less well validated [49].
The EASL 2021 guidelines note that non-invasive tests still have imperfect accuracy and that liver biopsy remains the gold standard in MASLD. pSWE and 2D SWE show similar accuracy but with less supporting data, whereas VCTE is the most extensively validated technique, with good performance for advanced fibrosis; MRE is the most accurate imaging method, though its availability and cost limit use. Per EASL, a VCTE value below 8 kPa rules out advanced fibrosis, while values above 12–15 kPa indicate advanced fibrosis [46]. In a meta-analysis of 63 studies (19,199 patients with MASLD), the optimal cut-off to rule out advanced fibrosis was 7.1–7.9 kPa (AUROC 0.90; sensitivity 89%, specificity 67%) [14].
The AGA 2017 guidelines made no recommendation on the use of VCTE in MASLD, reflecting an evidence gap at the time; this was addressed in subsequent guidelines [47].
Although guidelines recommend a modality-independent 8 kPa threshold as the low-risk cut-off for advanced fibrosis, a recent MASLD meta-analysis found that <8 kPa provided only 70–80% sensitivity for advanced fibrosis with 2D SWE and VCTE, and lower with pSWE. Higher sensitivity (~90%) was achievable with modality-specific cut-offs of 3 kPa (pSWE), 5 kPa (2D SWE), and 7 kPa (VCTE), while a 13 kPa threshold ruled in fibrosis (~90% specificity). These align with Society of Radiologists in Ultrasound (SRU) recommendations of ≤5 kPa to rule out and 5–13 kPa as indeterminate [25].
In a recent meta-analysis of 20 studies (2223 patients with MASLD), the optimal 2D SWE cut-offs were 6.43 kPa (≥F1), 8.17 kPa (≥F2), 9.42 kPa (≥F3), and 11.55 kPa (F4). Overall, 2D SWE showed excellent performance for fibrosis staging in MASLD, supporting the feasibility of standardised cut-offs [50].
- Chronic hepatitis B and C
Fibrosis staging is crucial in chronic viral hepatitis for guiding treatment and monitoring outcomes; a stage of ≥F2 is an indication to start antiviral therapy [7].
The AGA recommends VCTE cut-offs of 12.5 kPa for cirrhosis in chronic hepatitis C and 11.0 kPa for cirrhosis in chronic hepatitis B [47].
The EASL 2025 guidelines give VCTE cut-offs for significant fibrosis, advanced fibrosis, and cirrhosis in chronic hepatitis B of >7 kPa, >8 kPa, and >11 kPa, respectively [51]. The EASL 2020 guidelines set the hepatitis C cut-offs at 10 kPa for F3 and 13 kPa for F4, and the EASL 2021 guidelines strongly advise against applying untreated-HCV cut-offs to patients who have achieved a sustained virological response [46].
Some meta-analyses report that the optimal cut-off for significant fibrosis is lower in patients who have not received antiviral therapy (7.15 kPa) than in those who have (8.87 kPa) [30].
Kavak et al. reported that 2D SWE LSM values were highly accurate for assessing liver stiffness and could help avoid unnecessary biopsies; the technique may also aid follow-up and assessment of antiviral treatment response in chronic hepatitis B, with potential for routine monitoring [31].
- Autoimmune disease
Fibrosis assessment is crucial in autoimmune liver disease for diagnosis, prognostication, and guiding and monitoring treatment; accurate tracking of fibrosis helps gauge treatment response and disease progression. Non-invasive methods such as VCTE are increasingly used because they are safe and suitable for repeated monitoring [22].
However, VCTE has recognised limitations in autoimmune-related cirrhosis, and different studies have proposed varying cut-offs derived from relatively small cohorts [22].
In PBC, advanced fibrosis carries a poor prognosis, so fibrosis assessment is essential for risk stratification. VCTE has high accuracy here (AUROC >0.85), and a cut-off of approximately 9.9–10.7 kPa is considered appropriate for detecting advanced fibrosis, consistent with European guidelines [22].
Although hepatic inflammation may overestimate liver stiffness, particularly early after starting therapy, VCTE corresponds with the histological fibrosis stage and can be used to monitor disease progression [45].
The EASL 2021 guidelines note that 2D SWE shows promising results but limited disease-specific evidence, whereas pSWE has moderate accuracy [46]. The latest EASL 2025 guideline recommends VCTE for serial fibrosis assessment in AIH, with cut-offs of 9 kPa for severe fibrosis and 12.5–16 kPa for cirrhosis [52].
These inconsistent cut-offs highlight the need for aetiology-specific thresholds, because liver stiffness can be influenced by steatosis, inflammation, and cholestasis.
6. Factors Affecting Diagnostic Performance
- Patient-related factors
The diagnostic accuracy of non-invasive measures of liver fibrosis can be affected by several patient-related factors, including the location of the ROI, the skin-to-liver-capsule distance, and the body mass index (BMI)., liver fat content, and the type of probe used [10]. The XL probe with lower-frequency waves was introduced to allow deeper tissue assessment [8,53]. The impact of obesity on pSWE measurements appears to be less pronounced [8].
This is particularly relevant in MASLD, where obesity and increased subcutaneous fat thickness are common and may interfere with reliable measurement [53].
- Technique-related factors
The performance of VCTE can also be influenced by technique-related factors, such as the choice of probe (M vs. XL), the number and depth of valid measurements, the interquartile-range-to-median ratio of the readings, operator experience, and the interval since device calibration.
Such factors can lead to over- or under-estimation of liver stiffness and thereby affect clinical judgement when elastography is used diagnostically.
7. Reproducibility, Reliability and Feasibility
- VCTE
VCTE shows excellent intra- and inter-observer reproducibility, with an intraclass correlation coefficient (ICC) of 0.98 in patients with liver disease of various aetiologies [9].
In a large study of 7261 patients and more than 13,000 examinations, VCTE failed to obtain a measurement in 3% of cases and produced unreliable results in a further 15.8%—mainly because of obesity and operator inexperience—giving an overall applicability of 81%. Introduction of the XL probe improved applicability to over 95% in patients with MASLD. Reported unreliable-result rates of around 15–20% nonetheless point to a limitation in feasibility [9].
- pSWE
pSWE has high repeatability and reproducibility, with consistent results on same-day measurement [13] and, in patients with liver disease of mixed aetiology, high inter-observer (ICC 0.81–0.85) and intra-observer (ICC 0.89–0.90) reproducibility [54,55].
In a study comparing the reliability of pSWE and 2D SWE, failure rates were low with both (1% for pSWE and 5% for 2D SWE), and inter-observer agreement was significantly better for pSWE than for 2D SWE (ICC 0.915 vs. 0.829) [9].
- 2D SWE
2D SWE also shows high intra-observer (ICC 0.93–0.95) and inter-observer (ICC 0.88) reproducibility, indicating good reliability for fibrosis assessment [13].
In a prospective cohort study of 2D SWE, 38 patients were examined separately to assess inter-observer reproducibility, yielding an ICC of 0.994 [42].
Lee et al. found that 2D SWE gave lower, less reliable results than pSWE in their study, possibly because the 2D SWE colour map helped the operator identify a clean ROI; they also noted that fewer acquisitions were needed with 2D SWE than with pSWE to obtain reliable results [45].
8. Advantages and Limitations
Each technique has particular advantages and limitations that shape its clinical applicability.
- VCTE
- Advantages
VCTE is well validated for fibrosis staging, with cut-offs established across many aetiologies, particularly in compensated cirrhosis [11,45].
It is non-invasive and simple and provides rapid results, making it a useful point-of-care test for routine management and for assessing treatment response [9]. The EASL guidelines note its good reproducibility and high accuracy in cirrhosis, with an AUROC exceeding 0.9 [46].
VCTE is the most commonly used technique because it is a quick, simple bedside test requiring minimal training [9], and patient compliance is higher than with other methods; one large prospective multicentre study found that about 99% of patients returned for repeat VCTE, reflecting good acceptability [16]. That said, some studies report a progressive decline in attendance for follow-up assessment—Tapper et al. reported 91.4% at 3 months but 53% at 6 months [56].
- Disadvantages
VCTE has several disadvantages, chief among them inaccurate results in patients with a high BMI: a large skin-to-liver-capsule distance and obesity lead to overestimation [11], although the XL probe reduces this to some extent [2,8,19]. Perihepatic ascites, narrow intercostal spaces, and hepatic inflammation can also produce inaccurate results [9,11,57].
In one study monitoring disease progression, an apparent improvement from stage F4 to stage F2 fibrosis within a year—regarded by the investigators as biologically implausible—was attributed to overestimation of the initial stage by VCTE in a patient with class 3 obesity [57]. The device also requires recalibration every 6–12 months to maintain technical integrity [13].
EASL notes that inaccurate results may arise with food intake, high alcohol intake, hepatic inflammation, hepatic congestion, and extrahepatic cholestasis, and that the applicability of VCTE is even lower than that of serum biomarkers [46].
VCTE requires a dedicated transient-elastography device and cannot be performed on a conventional ultrasound system. Older devices provide no B-mode imaging and therefore cannot target the ROI, although newer machines now offer B-mode probes. Its use is largely confined to referral centres because of the high cost and the inaccurate results in obese patients [10].
Staufer et al. reported that VCTE gave inaccurate results in 20% of patients even with the XL probe and that the technique was not consistently feasible [10]; other studies likewise found that the XL probe does not always provide accurate results at higher BMI [5,57]. To address this, Echosens has introduced the “SmartExam” feature, which improves VCTE accuracy in obese patients [57].
- pSWE
- Advantages
pSWE is validated for assessing liver fibrosis across multiple aetiologies [11,58], and, unlike VCTE, both pSWE and 2D SWE can be integrated into a conventional abdominal ultrasound system [9].
pSWE also allows the operator to select the ROI and measurement depth directly on B-mode imaging, enabling precise positioning and avoidance of large vessels and other structures [9]. Its values are less affected by obesity and ascites, giving it higher applicability than VCTE [30].
According to the EASL guidelines, the diagnostic performance of pSWE is similar to that of VCTE in advanced fibrosis and cirrhosis [46].
- Disadvantages
As with VCTE, pSWE LSM is affected by food intake, high alcohol intake, hepatic congestion, higher degrees of steatosis, and hepatic inflammation [30].
pSWE cut-offs for significant and advanced fibrosis in MASLD have not yet been validated [11], nor have its cut-offs been validated across other aetiologies in large-scale studies.
pSWE samples a small ROI, which may not represent the whole liver, and, unlike 2D SWE, it does not provide a colour-coded elasticity map, limiting the visualisation of tissue heterogeneity [9].
- 2D SWE
- Advantages
2D SWE can be integrated into a conventional ultrasound system without specialised probes or machines, making it more accessible [5,6], and its B-mode capability allows selection of the ROI [6,7].
Unlike VCTE and pSWE, 2D SWE can interrogate a large area of the liver without additional probes, even in patients with obesity or ascites [5]. Kavak et al. note that, in contrast to liver biopsy, which samples a single point, 2D SWE captures a larger area and provides measurements at multiple points within the ROI [10].
The EASL 2021 guidelines note that 2D SWE also has good applicability, with higher performance for significant fibrosis and cirrhosis [46].
- Disadvantage
Ultrasound systems equipped with 2D SWE are expensive, limiting availability in many hospitals [7], and the technique requires specific operator training [5]. Guidelines have not yet introduced 2D SWE-specific criteria, and, compared with VCTE, 2D SWE has fewer supporting studies and less well-validated cut-offs [30]. EASL notes that, as with pSWE and VCTE, 2D SWE LSM can be affected by hepatic inflammation, food intake, high alcohol consumption, hepatic congestion, and extrahepatic cholestasis [46].
9. Current Guidelines and Recommendations
International guidelines recommend VCTE for the non-invasive assessment of liver fibrosis in MASLD [11,38]. EFSUMB recommends VCTE, pSWE, and 2D SWE as first-line techniques for grading fibrosis and ruling out cirrhosis in MASLD, ALD, and chronic hepatitis B [33].
The EASL 2021 guidelines strongly recommend non-invasive tests—serum markers, fibrosis scores, elastography, and imaging—for risk-stratifying people with metabolic risk factors or harmful alcohol use to identify advanced fibrosis, as these perform better than clinical assessment alone [46].
EASL also identifies VCTE as useful for detecting patients at low risk of advanced fibrosis or cirrhosis [13]; its aetiology-specific recommendations are summarised above.
The AASLD highlights the role of elastography in identifying patients with suspected MASLD referred from primary care who are at risk of steatohepatitis (MASH); it regards MRE and VCTE as effective for detecting advanced fibrosis in MASLD [38]. Recent evidence also suggests interpreting LSM together with the CAP value from the same examination, to account for the effect of steatosis on stiffness and improve accuracy [10].
Compensated advanced chronic liver disease (cACLD), a term introduced by the Baveno VI consensus, spans the spectrum from advanced fibrosis to cirrhosis. The Baveno VII consensus introduced VCTE LSM cut-offs for cACLD: <10 kPa rules it out, 10–15 kPa suggests it, and >15 kPa makes it highly likely [59].
Baveno VII also notes that LSM is a practical non-invasive tool for identifying patients with cACLD at high risk of clinically significant portal hypertension and decompensation, underscoring its prognostic value. It introduced a “rule of 5” for VCTE LSM (10–15–20–25 kPa) denoting progressively higher risks of decompensation and liver-related death, irrespective of aetiology [59].
Although 2D SWE is widely used and highly accurate, most guidelines still regard VCTE as the reference method for LSM [5]. EASL reports that pSWE has accuracy comparable to VCTE, particularly in advanced fibrosis, but is less accurate in early fibrosis [46]. International guidelines have not yet provided specific cut-offs for 2D SWE or pSWE; were shear wave elastography to serve as an alternative to VCTE, it could improve access to fibrosis evaluation [38].
10. Discussion
The introduction of elastography—VCTE, 2D SWE, and pSWE—has transformed the assessment of liver fibrosis. By providing non-invasive, reproducible tools, it has substantially reduced the need for liver biopsy and has facilitated earlier recognition and intervention, risk stratification, and regular monitoring of treatment response.
VCTE is currently the most widely validated method, and international guidelines provide standard LSM cut-offs for fibrosis staging across aetiologies such as ALD, MASLD, AIH, and chronic viral hepatitis. Although 2D SWE and pSWE demonstrate comparable or superior performance, they still lack validated, standardised cut-offs in international guidelines. Crucially, both can be integrated into conventional ultrasound systems and, once standardised cut-offs are established, would allow simultaneous structural and stiffness assessment at a lower cost than VCTE.
Despite these advantages, real-world implementation remains challenging because of heterogeneous cut-offs, high cost, limited accessibility in resource-limited settings, and operator dependency. Confounding factors such as obesity, inflammation, and hepatic venous congestion can alter LSM values, and variability in cut-offs across modalities and studies hinders direct comparison and generalisability.
11. Future Directions
Future research should evaluate how confounding factors affect LSM and how their impact can be minimised. Technological refinements—including improved probe sensitivity and advanced imaging—may overcome current technical barriers, especially in obese patients or those with difficult anatomy. Standardised protocols and operator training may reduce between-study inconsistency. Diagnostic models combining elastography with serum biomarkers and emerging AI-based tools should also be explored, as these may improve accuracy and longitudinal monitoring. In time, elastography is likely to become more accessible, automated, and standardised, and greater affordability and portability may extend its use into primary care and low-resource settings.
12. Conclusions
Non-invasive techniques such as VCTE, 2D SWE, and pSWE are important tools for assessing liver fibrosis across aetiologies and have substantially reduced the need for liver biopsy, even though biopsy remains the gold standard. VCTE is the most extensively validated technique, with standard cut-offs provided by all major guidelines, though its high cost and limited availability remain constraints. 2D SWE and pSWE have shown accuracy comparable to VCTE, but validated stage-specific cut-offs are not yet included in current guidelines. Because both can be integrated into conventional ultrasound systems, the development of standardised cut-offs would enable simultaneous structural and stiffness assessment at reduced cost.
Supplementary Materials
The following supporting information can be downloaded at the website of this paper posted on Preprints.org. Figure S1: Types of US-based elastography techniques. Table S1: Comparison of meta-analyses on elastography techniques: AUROC values for stages of liver fibrosis. Table S2: Comparison of meta-analyses on elastography techniques: Summary sensitivity and specificity for stages of liver fibrosis. Table S3: Comparison of meta-analyses that compared two or more elastography techniques: AUROC values for stages of liver fibrosis. Table S4: Comparison of meta-analyses that compared two or more elastography techniques: Summary sensitivity and specificity for stages of liver fibrosis.
Author Contributions
APdeS conceptualised the paper. SH collected the data and drafted the manuscript. APdeS, MAN, and HJdeS critically revised the manuscript. All authors have read and agreed to the published version of the manuscript.
Funding
This research received no external funding.
Institutional Review Board Statement
Not applicable.
Informed Consent Statement
Not applicable.
Data Availability Statement
No new data were created or analyzed in this study. Data sharing is not applicable to this article.
Acknowledgments
During the preparation of this manuscript, the authors used a generative AI-based large language model to improve the language and readability of the text. The authors reviewed and edited the output and take full responsibility for the content of the publication.
Conflicts of Interest
The authors declare no conflicts of interest.
References
- Del Valle, R.; Cunto, D.; Puga-Tejada, M.; Egas-Izquierdo, M.; Arevalo-Mora, M.; Oleas, R.; et al. Comparative analysis of vibration-controlled transient elastography and EUS-shear wave elastography for liver stiffness measurement in cirrhosis. Endosc. Ultrasound 2025, 14, 57–64. [Google Scholar] [CrossRef] [PubMed]
- Bergsma, S.; van Gent, M.; Dam-Vervloet, A.J.; Lagerweij, M.C.M.; van der Wouden, E.J.; Nijholt, I.M.; et al. Image-guided point-shear-wave elastography: A valid and reliable technique for liver fibrotic staging. J. Ultrasound 2024, 27, 323–328. [Google Scholar] [CrossRef] [PubMed]
- Luo, Q.T.; Zhu, Q.; Zong, X.D.; Li, M.K.; Yu, H.S.; Jiang, C.Y.; et al. Diagnostic performance of transient elastography versus two-dimensional shear wave elastography for liver fibrosis in chronic viral hepatitis: Direct comparison and a meta-analysis. Biomed. Res. Int. 2022, 2022, 1960244. [Google Scholar] [CrossRef] [PubMed]
- Mulazzani, L.; Salvatore, V.; Ravaioli, F.; Allegretti, G.; Matassoni, F.; Granata, R.; et al. Point shear wave ultrasound elastography with Esaote compared to real-time 2D shear wave elastography with supersonic imagine for the quantification of liver stiffness. J. Ultrasound 2017, 20, 213–225. [Google Scholar] [CrossRef] [PubMed]
- Karagiannakis, D.S.; Voulgaris, T.; Angelopoulos, T.; Ioannidou, P.; Cholongitas, E.; Vlachogiannakos, J.; et al. Comparative utility of transient and 2D shear wave elastography for the assessment of liver fibrosis in clinical practice. J. Digit Imaging 2021, 34, 1342–1348. [Google Scholar] [CrossRef] [PubMed]
- Kobayashi, T.; Nakatsuka, T.; Sato, M.; et al. Diagnostic performance of two-dimensional shear wave elastography and attenuation imaging for fibrosis and steatosis assessment in chronic liver disease. J. Med. Ultrason 2025, 52, 95–103. [Google Scholar] [CrossRef] [PubMed]
- Zhang, Y.; Yang, J.; Wan, Q.; Gan, L.; Liu, J. Non-invasive assessment of liver fibrosis staging in chronic hepatitis B patients: Combining two-dimensional shear wave elastography with serum indicators. Front Med. 2026, 12, 1709007. [Google Scholar] [CrossRef] [PubMed]
- Jiang, W.; Huang, S.; Teng, H.; Wang, P.; Wu, M.; Zhou, X.; et al. Diagnostic accuracy of point shear wave elastography and transient elastography for staging hepatic fibrosis in patients with non-alcoholic fatty liver disease: A meta-analysis. BMJ Open 2018, 8, e021787. [Google Scholar] [CrossRef] [PubMed]
- Vranić, L.; Nadarevic, T.; Štimac, D.; Fraquelli, M.; Manzotti, C.; Casazza, G.; et al. Liver and spleen stiffness as assessed by vibration-controlled transient elastography for diagnosing clinically significant portal hypertension in comparison with other elastography-based techniques in adults with chronic liver disease. Cochrane Database Syst. Rev. 2022, CD015415. [Google Scholar] [CrossRef]
- Staufer, K.; Halilbasic, E.; Spindelboeck, W.; Eilenberg, M.; Prager, G.; Stadlbauer, V.; et al. Evaluation and comparison of six noninvasive tests for prediction of significant or advanced fibrosis in nonalcoholic fatty liver disease. United Eur. Gastroenterol. J. 2019, 7, 1113–1123. [Google Scholar] [CrossRef] [PubMed]
- Bauer, D.J.; Matic, V.; Mare, R.; Maiocchi, L.; Chromy, D.; Müllner-Bucsics, T.; et al. Point shear wave elastography by ElastPQ for fibrosis screening in patients with MASLD: A prospective, multicenter comparison to vibration-controlled elastography. Ultraschall Med. 2023, 44, 169–178. [Google Scholar] [CrossRef] [PubMed]
- Lee, S.; Choi, Y.H.; Cho, Y.J.; Lee, S.B.; Cheon, J.E.; Kim, W.S.; et al. The usefulness of noninvasive liver stiffness assessment using shear-wave elastography for predicting liver fibrosis in children. BMC Med. Imaging 2021, 21, 68. [Google Scholar] [CrossRef] [PubMed]
- Honda, Y.; Yoneda, M.; Imajo, K.; Nakajima, A. Elastography techniques for the assessment of liver fibrosis in non-alcoholic fatty liver disease. Int. J. Mol. Sci. 2020, 21, 4039. [Google Scholar] [CrossRef] [PubMed]
- Chon, Y.E.; Jin, Y.J.; An, J.; Kim, H.Y.; Choi, M.; Jun, D.W.; et al. Optimal cut-offs of vibration-controlled transient elastography and magnetic resonance elastography in diagnosing advanced liver fibrosis in patients with nonalcoholic fatty liver disease: A systematic review and meta-analysis. Clin. Mol. Hepatol. 2024, 30, S117–S133. [Google Scholar] [CrossRef] [PubMed]
- Hsu, C.; Caussy, C.; Imajo, K.; Chen, J.; Singh, S.; Kaulback, K.; et al. Magnetic resonance vs transient elastography analysis of patients with nonalcoholic fatty liver disease: A systematic review and pooled analysis of individual participants. Clin. Gastroenterol. Hepatol. 2019, 17, 630–637.e8. [Google Scholar] [CrossRef] [PubMed]
- Sarkar Das, T.; Meng, X.; Abdallah, M.; Bilal, M.; Sarwar, R.; Shaukat, A. An assessment of the feasibility, patient acceptance, and performance of point-of-care transient elastography for metabolic-dysfunction-associated steatotic liver disease (MASLD): A systematic review and meta-analysis. Diagnostics 2024, 14, 2478. [Google Scholar] [CrossRef] [PubMed]
- Li, Y.; Huang, Y.; Wang, Z.; et al. Systematic review with meta-analysis: The diagnostic accuracy of transient elastography for the staging of liver fibrosis in patients with chronic hepatitis B. Aliment Pharmacol. Ther. 2016, 43, 458–469. [Google Scholar] [PubMed]
- Kim, M.N.; An, J.; Kim, E.H.; Kim, H.Y.; Lee, H.A.; Yu, J.H.; et al. Vibration-controlled transient elastography for significant fibrosis in treatment-naïve chronic hepatitis B patients: A systematic review and meta-analysis. Clin. Mol. Hepatol. 2024, 30, S106–S116. [Google Scholar] [CrossRef] [PubMed]
- Li, M.; Wang, S.; Wang, X.; Li, Y.; Wu, B. Diagnostic performance of elastography on liver fibrosis in antiviral treatment-naive chronic hepatitis B patients: A meta-analysis. Gastroenterol. Rep. 2022, 10, goac005. [Google Scholar] [CrossRef]
- Li, Y.; Huang, Y.S.; Wang, Z.Z.; Yang, Z.R.; Sun, F.; Zhan, S.Y.; et al. Systematic review with meta-analysis: The diagnostic accuracy of transient elastography for the staging of liver fibrosis in patients with chronic hepatitis B. Aliment Pharmacol. Ther. 2016, 43, 458–469. [Google Scholar] [PubMed]
- Chon, Y.E.; Choi, E.H.; Song, K.J.; Park, J.Y.; Kim, D.Y.; Han, K.H.; et al. Performance of transient elastography for the staging of liver fibrosis in patients with chronic hepatitis B: A meta-analysis. PLoS ONE 2012, 7, e44930. [Google Scholar] [CrossRef] [PubMed]
- An, J.; Chon, Y.E.; Kim, G.; Kim, M.N.; Kim, H.Y.; Lee, H.A.; et al. Diagnostic accuracy of vibration-controlled transient elastography for staging liver fibrosis in autoimmune liver diseases: A systematic review and meta-analysis. Clin. Mol. Hepatol. 2024, 30, S134–S146. [Google Scholar] [CrossRef] [PubMed]
- Herrmann, E.; de Lédinghen, V.; Cassinotto, C.; Chu, W.C.; Leung, V.Y.; Ferraioli, G.; et al. Assessment of biopsy-proven liver fibrosis by two-dimensional shear wave elastography: An individual patient data-based meta-analysis. Hepatology 2018, 67, 260–272. [Google Scholar] [CrossRef] [PubMed]
- Uchikawa, S.; Kawaoka, T.; Fujino, H.; et al. The effect of the skin-liver capsule distance on the accuracy of ultrasound diagnosis for liver steatosis and fibrosis. J. Med. Ultrason 2022, 49, 443–450. [Google Scholar] [CrossRef]
- Wilson, M.P.; Singh, R.; Mehta, S.; Murad, M.H.; Fung, C.; Low, G. Comparing FIB-4, VCTE, pSWE, 2D-SWE, and MRE thresholds and diagnostic accuracies for detecting hepatic fibrosis in patients with MASLD: A systematic review and meta-analysis. Diagnostics 2025, 15, 1598. [Google Scholar] [CrossRef] [PubMed]
- Sugimoto, K.; Moriyasu, F.; Oshiro, H.; et al. The role of multiparametric US of the liver for the evaluation of nonalcoholic steatohepatitis. Radiology 2020, 296, 532–540. [Google Scholar] [CrossRef] [PubMed]
- Lee, D.H.; Cho, E.J.; Bae, J.S.; et al. Accuracy of two-dimensional shear wave elastography and attenuation imaging for evaluation of patients with nonalcoholic steatohepatitis. Clin. Gastroenterol. Hepatol. 2021, 19, 797–805. [Google Scholar] [CrossRef] [PubMed]
- Dong, B.; Lyu, G.; Chen, Y.; et al. Comparison of two-dimensional shear wave elastography, magnetic resonance elastography, and three serum markers for diagnosing fibrosis in patients with chronic hepatitis B: A meta-analysis. Expert Rev. Gastroenterol. Hepatol. 2021, 15, 1077–1089. [Google Scholar] [CrossRef] [PubMed]
- Wei, H.; Jiang, H.Y.; Li, M.; Zhang, T.; Song, B. Two-dimensional shear wave elastography for significant liver fibrosis in patients with chronic hepatitis B: A systematic review and meta-analysis. Eur. J. Radiol. 2020, 124, 108839. [Google Scholar] [CrossRef] [PubMed]
- Kavak, S.; Kaya, S.; Senol, A.; Sogutcu, N. Evaluation of liver fibrosis in chronic hepatitis B patients with 2D shear wave elastography with propagation map guidance: A single-centre study. BMC Med. Imaging 2022, 22, 50. [Google Scholar] [CrossRef] [PubMed]
- Mózes, F.E.; Lee, J.A.; Selvaraj, E.A.; Jayaswal, A.N.A.; Trauner, M.; Boursier, J.; et al. Diagnostic accuracy of non-invasive tests for advanced fibrosis in patients with MASLD: An individual patient data meta-analysis. Gut 2022, 71, 1006–1019. [Google Scholar] [CrossRef] [PubMed]
- Schambeck, J.P.L.; Forte, G.C.; Gonçalves, L.M.; Stuker, G.; Kotlinski, J.B.F.; Tramontin, G.; et al. Diagnostic accuracy of magnetic resonance elastography and point-shear wave elastography for significant hepatic fibrosis screening: Systematic review and meta-analysis. PLoS ONE 2023, 18, e0271572. [Google Scholar] [CrossRef] [PubMed]
- Losurdo, G.; Ditonno, I.; Novielli, D.; Celiberto, F.; Iannone, A.; Castellaneta, A.; et al. Comparison of transient elastography and point shear wave elastography for analysis of liver stiffness: A prospective study. Diagnostics 2024, 14, 604. [Google Scholar] [CrossRef] [PubMed]
- Patil, P.V.; Julakanti, S.; Dhadve, R.U. Point shear wave elastography for assessment of liver stiffness in normal individuals and in patients with non-alcoholic fatty liver disease. Cureus 2024, 16, e70711. [Google Scholar] [CrossRef] [PubMed]
- Garcovich, M.; Paratore, M.; Riccardi, L.; Zocco, M.A.; Ainora, M.E.; Mingrone, G.; et al. Correlation between a new point-shear wave elastography device (X+pSWE) with liver histology and 2D-SWE (SSI) for liver stiffness quantification in chronic liver disease. Diagnostics 2023, 13, 1743. [Google Scholar] [CrossRef] [PubMed]
- Gilani, S.A.; Farooq, S.M.Y.; Moazzam, M.; Hanif, A.; Uzair, M.; Iyaz, M.; et al. Ultrasound elastography to assess liver fibrosis: A systematic review and meta-analysis. J. Diagn. Med. Sonogr. 2026. [Google Scholar] [CrossRef]
- Selvaraj, E.A.; Mózes, F.E.; Jayaswal, A.N.A.; Zafarmand, M.H.; Vali, Y.; Lee, J.A.; et al. Diagnostic accuracy of elastography and magnetic resonance imaging in patients with MASLD: A systematic review and meta-analysis. J. Hepatol. 2021, 75, 770–785. [Google Scholar] [CrossRef] [PubMed]
- Yamaguchi, R.; Oda, T.; Nagashima, K. Comparison of the diagnostic accuracy of shear wave elastography with transient elastography in adult nonalcoholic fatty liver disease: A systematic review and network meta-analysis of diagnostic test accuracy. Abdom. Radiol. 2025, 50, 734–746. [Google Scholar] [CrossRef] [PubMed]
- Xiao, G.; Zhu, S.; Xiao, X.; Yan, L.; Yang, J.; Wu, G. Comparison of laboratory tests, ultrasound, or magnetic resonance elastography to detect fibrosis in patients with nonalcoholic fatty liver disease: A meta-analysis. Hepatology 2017, 66, 1486–1501. [Google Scholar] [CrossRef] [PubMed]
- Herrmann, E.; de Lédinghen, V.; Cassinotto, C.; Chu, W.C.; Leung, V.Y.; Ferraioli, G.; et al. Assessment of biopsy-proven liver fibrosis by two-dimensional shear wave elastography: An individual patient data-based meta-analysis. Hepatology 2018, 67, 260–272. [Google Scholar] [CrossRef] [PubMed]
- Ferraioli, G.; Tinelli, C.; Dal Bello, B.; Zicchetti, M.; Filice, G.; Filice, C. Accuracy of real-time shear wave elastography for assessing liver fibrosis in chronic hepatitis C: A pilot study. Hepatology 2012, 56, 2125–2133. [Google Scholar] [CrossRef] [PubMed]
- Yoo, H.W.; Kim, S.G.; Jang, J.Y.; Yoo, J.J.; Jeong, S.W.; Kim, Y.S.; et al. Two-dimensional shear wave elastography for assessing liver fibrosis in patients with chronic liver disease: A prospective cohort study. Korean J. Intern. Med. 2022, 37, 285–293. [Google Scholar] [CrossRef] [PubMed]
- Ayonrinde, O.T.; Zelesco, M.; Welman, C.J.; Abbott, S.; Adris, N. Clinical relevance of shear wave elastography compared with transient elastography and other markers of liver fibrosis. Intern. Med. J. 2022, 52, 640–650. [Google Scholar] [CrossRef] [PubMed]
- Xu, X.; Zhang, Y.; Zhu, Q.; Xie, Y.; Zhou, Y.; Dong, B.; et al. Diagnostic accuracy of two-dimensional shear wave elastography and point shear wave elastography in identifying different stages of liver fibrosis in patients with metabolic dysfunction-associated steatotic liver disease: A meta-analysis. Biomol. BioMed 2025, 25, 810–821. [Google Scholar] [CrossRef] [PubMed]
- Lee, S.M.; Ha, H.I.; Lee, I.J.; Lee, K.; Lee, J.W.; Park, J.W.; et al. Comparison between two-dimensional and point shear wave elastography techniques in evaluating liver fibrosis using histological staging as the reference standard: A prospective pilot study. Diagnostics 2023, 13, 1646. [Google Scholar] [CrossRef] [PubMed]
- European Association for the Study of the Liver. EASL clinical practice guidelines on non-invasive tests for evaluation of liver disease severity and prognosis. J. Hepatol. 2021, 75, 659–689. [Google Scholar] [CrossRef] [PubMed]
- Clinical Guidelines Committee of the American Gastroenterological Association; et al. American Gastroenterological Association Institute guideline on the role of elastography in the evaluation of liver fibrosis. Gastroenterology 2017, 152, 1536–1543. [Google Scholar] [CrossRef] [PubMed]
- Mettananda, C.; Egodage, T.; Dantanarayana, C.; Fernando, R.; Ranaweera, L.; Luke, N.; et al. Identification of patients with type 2 diabetes with non-alcoholic fatty liver disease who are at increased risk of progressing to advanced fibrosis: A cross-sectional study. BMJ Open 2023, 13, e063959. [Google Scholar] [CrossRef] [PubMed]
- Rinella, M.E.; Neuschwander-Tetri, B.A.; Siddiqui, M.S.; Abdelmalek, M.F.; Caldwell, S.; Barb, D.; et al. AASLD practice guidance on the clinical assessment and management of nonalcoholic fatty liver disease. Hepatology 2023, 77, 1797–1835. [Google Scholar] [CrossRef] [PubMed]
- Indre, M.G.; Leucuta, D.C.; Lupsor-Platon, M.; Turco, L.; Ferri, S.; Hashim, A.; et al. Diagnostic accuracy of 2D-SWE ultrasound for liver fibrosis assessment in MASLD: A multilevel random effects model meta-analysis. Hepatology 2025, 82, 454–469. [Google Scholar] [CrossRef] [PubMed]
- Cornberg, M.; Sandmann, L.; Jaroszewicz, J. EASL Clinical Practice Guidelines on the management of hepatitis B virus infection. J. Hepatol. 2025, 83, 502–583. [Google Scholar] [CrossRef]
- European Association for the Study of the Liver. EASL Clinical Practice Guidelines on the management of autoimmune hepatitis. J. Hepatol. 2025, 83, 453–501. [Google Scholar] [CrossRef] [PubMed]
- Bauer, D.J.; De Silvestri, A.; Maiocchi, L.; Raimondi, A.; Mare, R.; Mandorfer, M.; et al. Understanding confounding factors allows for accurate interpretation of liver stiffness measurements by ElastQ, a novel 2D shear wave elastography technique. Ultraschall Med. 2025, 46, 363–371. [Google Scholar] [CrossRef] [PubMed]
- Han, A.; Labyed, Y.; Sy, E.Z.; Boehringer, A.S.; Andre, M.P.; Erdman, J.W., Jr.; et al. Inter-sonographer reproducibility of quantitative ultrasound outcomes and shear wave speed measured in the right lobe of the liver in adults with known or suspected non-alcoholic fatty liver disease. Eur. Radiol. 2018, 28, 4992–5000. [Google Scholar] [CrossRef] [PubMed]
- Balakrishnan, M.; Souza, F.; Munoz, C.; Augustin, S.; Loo, N.; Deng, Y.; et al. Liver and spleen stiffness measurements by point shear wave elastography via acoustic radiation force impulse: Intraobserver and interobserver variability and predictors of variability in a US population. J. Ultrasound Med. 2016, 35, 2373–2380. [Google Scholar] [CrossRef] [PubMed]
- Tapper, E.B.; Challies, T.; Nasser, I.; Afdhal, N.H.; Lai, M. The performance of vibration controlled transient elastography in a US cohort of patients with nonalcoholic fatty liver disease. Am. J. Gastroenterol. 2016, 111, 677–684. [Google Scholar] [CrossRef] [PubMed]
- Woodard, J.S.; Velji-Ibrahim, J.; Alden, J.; Abrams, G.A. VCTE overestimates liver fibrosis due to abdominal-truncal adiposity and not hepatic steatosis: A case report. Case Rep. Gastrointest. Med. 2024, 2024, 7938701. [Google Scholar] [CrossRef] [PubMed]
- Bucsics, T.; Grasl, B.; Ferlitsch, A.; et al. Point shear wave elastography for non-invasive assessment of liver fibrosis in patients with viral hepatitis. Ultrasound Med. Biol. 2018, 44, 2578–2586. [Google Scholar] [CrossRef] [PubMed]
- de Franchis, R.; Bosch, J.; Garcia-Tsao, G.; Reiberger, T.; Ripoll, C. Baveno VII Faculty. Baveno VII—Renewing consensus in portal hypertension. J. Hepatol. 2022, 76, 959–974. [Google Scholar] [CrossRef] [PubMed]
- Hashemi, S.A.; Alavian, S.M.; Gholami-Fesharaki, M. Assessment of transient elastography (FibroScan) for diagnosis of fibrosis in non-alcoholic fatty liver disease: A systematic review and meta-analysis. Casp. J. Intern Med. 2016, 7, 242–252. [Google Scholar]
- Zhang, W.; Zhu, Y.; Zhang, C.; Ran, H. Diagnostic accuracy of 2-dimensional shear wave elastography for the staging of liver fibrosis: A meta-analysis. J. Ultrasound Med. 2019, 38, 733–740. [Google Scholar] [CrossRef] [PubMed]
- Zhou, X.; Rao, J.; Wu, X.; Deng, R.; Ma, Y. Comparison of 2-D shear wave elastography and point shear wave elastography for assessing liver fibrosis. Ultrasound Med. Biol. 2021, 47, 408–427. [Google Scholar] [CrossRef] [PubMed]
Figure 1.
Types of US-based elastography techniques.
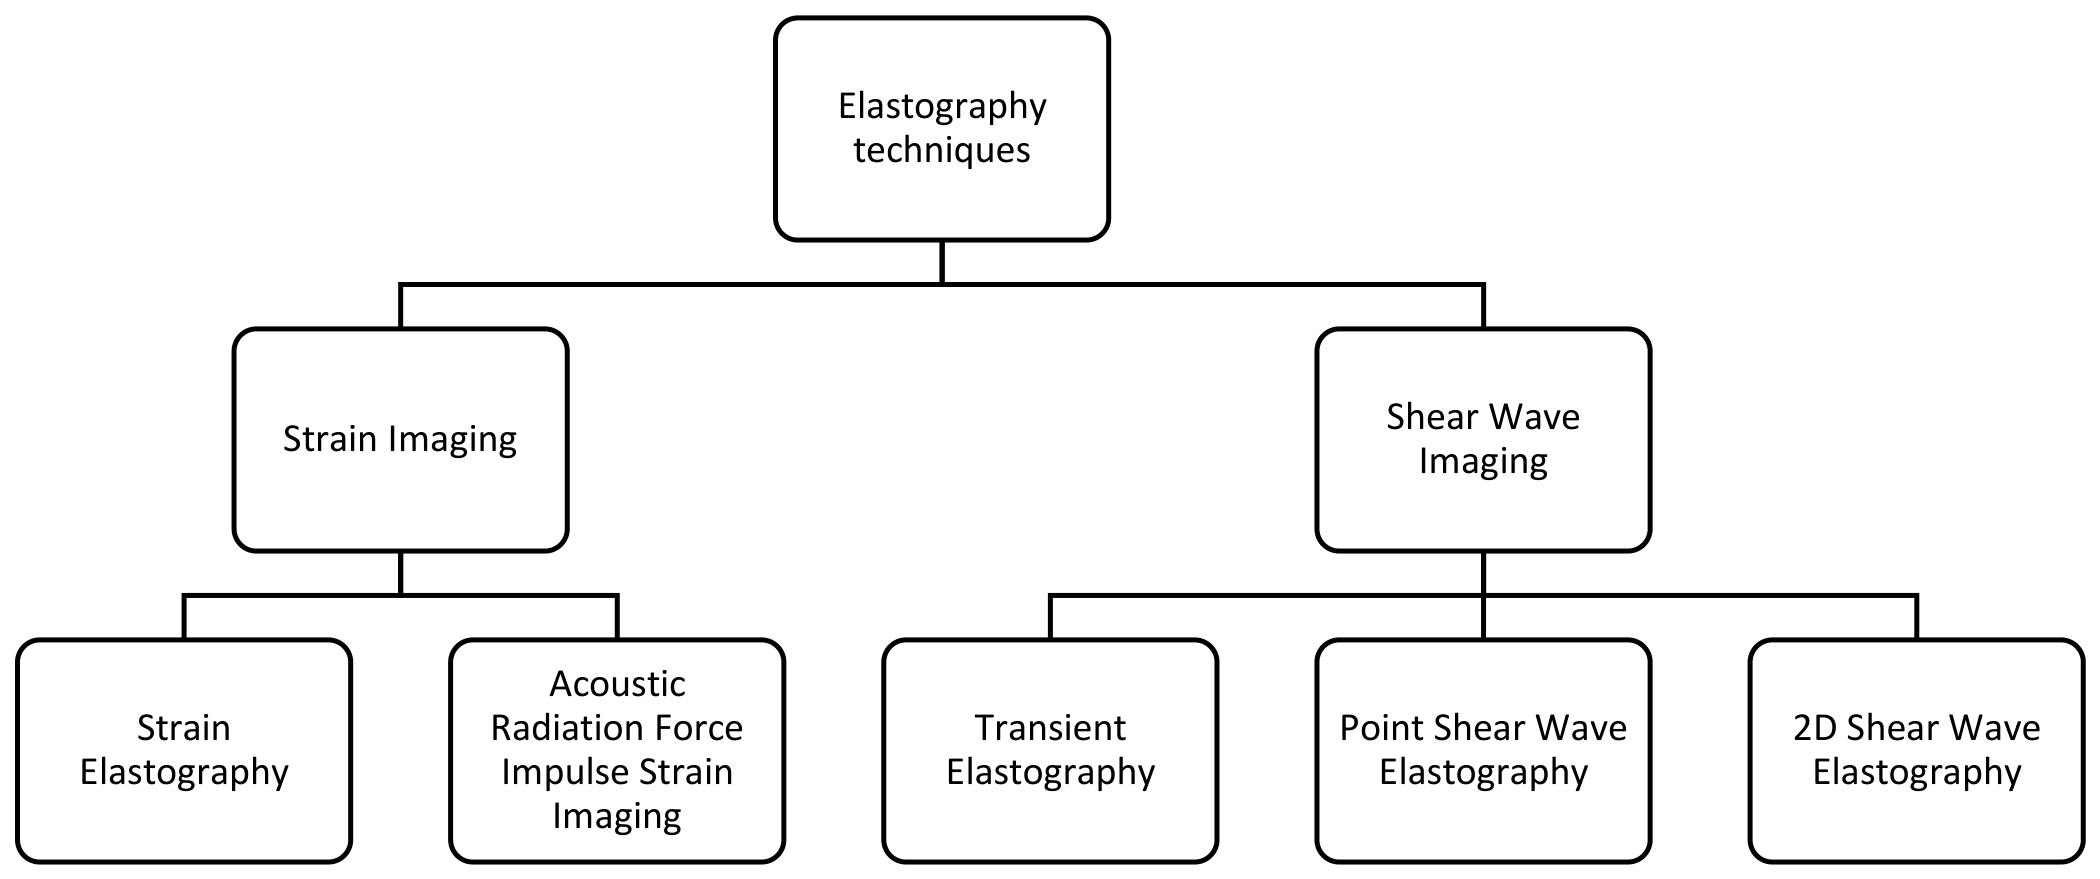

Table 1.
Comparison of meta-analyses on elastography techniques: AUROC values for stages of liver fibrosis.
Table 1.
Comparison of meta-analyses on elastography techniques: AUROC values for stages of liver fibrosis.
| Technique | Meta-Analysis | Aetiology | Fibrosis Stage | AUROC |
|---|---|---|---|---|
| VCTE | Mózes et al. | MASLD | ≥F3 | 0.85 |
| Chon et al. | MASLD | F1 | 0.83 | |
| ≥F2 | 0.83 | |||
| ≥F3 | 0.87 | |||
| F4 | 0.94 | |||
| Hsu et al. | MASLD | F1 | 0.82 | |
| ≥F2 | 0.87 | |||
| ≥F3 | 0.84 | |||
| F4 | 0.84 | |||
| Hashemi et al. | MASLD | F1 | 0.776–0.92 | |
| ≥F2 | 0.78–0.99 | |||
| ≥F3 | 0.7–1 | |||
| F4 | 0.94–0.99 | |||
| 2D SWE | Indre et al. | MASLD | F1 | 0.82 |
| ≥F2 | 0.82 | |||
| ≥F3 | 0.86 | |||
| F4 | 0.89 | |||
| Zhang et al. | Mixed | ≥F2 | 0.81 | |
| ≥F3 | 0.77 | |||
| F4 | 0.84 | |||
| Wei et al. | Chronic hepatitis B | ≥F2 | 0.92 | |
| Herrmann et al. | MASLD | ≥F2 | 0.855 | |
| F4 | 0.917 | |||
| Herrmann et al. | Chronic hepatitis B | ≥F2 | 0.906 | |
| F4 | 0.955 | |||
| Herrmann et al. | Chronic heptitis C | ≥F2 | 0.863 | |
| F4 | 0.929 | |||
| pSWE | Schambeck et al. | Mixed | ≥F2 | 0.93 |
AUROC, area under the receiver operating characteristic curve; MASLD, metabolic dysfunction-associated steatotic liver disease; VCTE, vibration-controlled transient elastography. Fibrosis stages: F1 = mild fibrosis; F2 = moderate fibrosis; F3 = severe fibrosis; F4 = cirrhosis. ≥denotes ‘at least’ the stated stage.
Table 2.
Comparison of meta-analyses on elastography techniques: Summary sensitivity and specificity for stages of liver fibrosis.
Table 2.
Comparison of meta-analyses on elastography techniques: Summary sensitivity and specificity for stages of liver fibrosis.
| Technique | Meta-Analysis | Aetiology | Fibrosis Stage | Cut-Off (kPa) | Sensitivity | Specificity |
|---|---|---|---|---|---|---|
| VCTE | Mózes et al. | MASLD | ≥F3 | 9.1 | 77% | 78% |
| Chon et al. | MASLD | F1 | 5–9.6 | 78% | 75% | |
| ≥F2 | 4.8–16.4 | 79% | 74% | |||
| ≥F3 | 7.1–7.9 | 81% | 79% | |||
| F4 | 6.9–20.1 | 88–91% | 87% | |||
| Hsu et al. | MASLD | F1 | 6.2 | 65.6% | 67.1% | |
| ≥F2 | 7.6 | 76.3% | 79.6% | |||
| ≥F3 | 8.8 | 77.2% | 78% | |||
| F4 | 11.8 | 80% | 81% | |||
| Hashemi et al. | MASLD | F1 | 5.35–5.9 | 83.7% | 78.2% | |
| ≥F2 | 5.35–7.4 | 87.5% | 78.4% | |||
| ≥F3 | 7.1–12.85 | 93.7% | 91.1% | |||
| F4 | 10.3–17.5 | 96.2% | 92.2% | |||
| 2D SWE | Indre et al. | MASLD | F1 | 6.4 | 76% | 76% |
| ≥F2 | 8.2 | 76% | 76% | |||
| ≥F3 | 9.4 | 79% | 79% | |||
| F4 | 11.6 | 82% | 82% | |||
| Zhang et al. | Mixed | ≥F2 | – | 85% | 79% | |
| ≥F3 | – | 90% | 85% | |||
| F4 | – | 89% | 92% | |||
| Wei et al. | Chronic hepatitis B | ≥F2 | 7.91 | 88% | 83% | |
| pSWE | Schambeck et al. | Mixed | ≥F2 | – | 85.26% | 89.46% |
AUROC, area under the receiver operating characteristic curve; MASLD, metabolic dysfunction-associated steatotic liver disease; VCTE, vibration-controlled transient elastography. Fibrosis stages: F1 = mild fibrosis; F2 = moderate fibrosis; F3 = severe fibrosis; F4 = cirrhosis. ≥denotes ‘at least’ the stated stage.
Table 3.
Comparison of meta-analyses that compared two or more elastography techniques: AUROC values for stages of liver fibrosis.
Table 3.
Comparison of meta-analyses that compared two or more elastography techniques: AUROC values for stages of liver fibrosis.
| Technique | Meta-Analysis | Aetiology | Fibrosis Stage | AUROC |
|---|---|---|---|---|
| 2D SWE | Zhou et al. | Mixed | ≥F2 | 0.89 |
| ≥F3 | 0.95 | |||
| F4 | 0.94 | |||
| pSWE | Zhou et al. | Mixed | ≥F2 | 0.85 |
| ≥F3 | 0.90 | |||
| F4 | 0.91 | |||
| pSWE | Xu et al. | MASLD | ≥F2 | 0.84 |
| ≥F3 | 0.91 | |||
| F4 | 0.94 | |||
| 2D SWE | Xu et al. | MASLD | ≥F2 | 0.83 |
| ≥F3 | 0.85 | |||
| F4 | 0.89 | |||
| VCTE | Selvaraj et al. | MASLD | ≥F2 | 0.83 |
| ≥F3 | 0.85 | |||
| F4 | 0.89 | |||
| pSWE | Selvaraj et al. | MASLD | ≥F2 | 0.86 |
| ≥F3 | 0.89 | |||
| F4 | 0.90 | |||
| 2D SWE | Selvaraj et al. | MASLD | ≥F2 | 0.75 |
| ≥F3 | 0.72 | |||
| F4 | 0.88 | |||
| pSWE | Jiang et al. | MASLD | ≥F2 | 0.86 |
| ≥F3 | 0.94 | |||
| ≥F4 | 0.95 | |||
| VCTE | Jiang et al. | MASLD | ≥F2 | 0.85 |
| ≥F3 | 0.92 | |||
| F4 | 0.94 | |||
| VCTE | Xiao et al. | MASLD | ≥F3 | 0.85 |
| 2D SWE | Xiao et al. | MASLD | ≥F3 | 0.95 |
AUROC, area under the receiver operating characteristic curve; MASLD, metabolic dysfunction-associated steatotic liver disease; VCTE, vibration-controlled transient elastography. Fibrosis stages: F1 = mild fibrosis; F2 = moderate fibrosis; F3 = severe fibrosis; F4 = cirrhosis. ≥denotes ‘at least’ the stated stage.
Table 4.
Comparison of meta-analyses that compared two or more elastography techniques: Summary sensitivity and specificity for stages of liver fibrosis.
Table 4.
Comparison of meta-analyses that compared two or more elastography techniques: Summary sensitivity and specificity for stages of liver fibrosis.
| Technique | Meta-Analysis | Aetiology | Fibrosis Stage | Cut-Off (kPa) | Sensitivity | Specificity |
|---|---|---|---|---|---|---|
| 2D SWE | Zhou et al. | Mixed | ≥F2 | – | 84% | 81% |
| ≥F3 | – | 90% | 87% | |||
| F4 | – | 89% | 87% | |||
| pSWE | Zhou et al. | Mixed | ≥F2 | – | 76% | 79% |
| ≥F3 | – | 83% | 83% | |||
| F4 | – | 85% | 84% | |||
| VCTE | Wilson et al. | MASLD | ≥F2 | 8.48 | 72% | 72% |
| ≥F3 | 9.74 | 75% | 75% | |||
| 2D SWE | Wilson et al. | MASLD | ≥F2 | 8.31 | 74% | 74% |
| ≥F3 | 9.58 | 77% | 77% | |||
| pSWE | Wilson et al. | MASLD | ≥F2 | 5.37 | 74% | 74% |
| ≥F3 | 6.43 | 78% | 78% | |||
| pSWE | Xu et al. | MASLD | ≥F2 | – | 71% | 83% |
| ≥F3 | – | 81% | 87% | |||
| F4 | – | 81% | 91% | |||
| 2D SWE | Xu et al. | MASLD | ≥F2 | – | 77% | 76% |
| ≥F3 | – | 80% | 76% | |||
| F4 | – | 92% | 83% | |||
| VCTE | Xiao et al. | MASLD | ≥F3 | – | 87% | 79% |
| 2D SWE | Xiao et al. | MASLD | ≥F3 | – | 90% | 93% |
| VCTE | Jiang et al. | MASLD | ≥F2 | – | 77% | 80% |
| ≥F3 | – | 79% | 89% | |||
| F4 | – | 90% | 91% | |||
| pSWE | Jiang et al. | MASLD | ≥F2 | – | 70% | 84% |
| ≥F3 | – | 89% | 88% | |||
| F4 | – | 89% | 91% | |||
| VCTE | Bota et al. | Mixed | ≥F2 | – | 78% | 84% |
| F4 | – | 89% | 87% | |||
| pSWE | Bota et al. | Mixed | ≥F2 | – | 74% | 83% |
| F4 | – | 87% | 87% |
AUROC, area under the receiver operating characteristic curve; MASLD, metabolic dysfunction-associated steatotic liver disease; VCTE, vibration-controlled transient elastography. Fibrosis stages: F1 = mild fibrosis; F2 = moderate fibrosis; F3 = severe fibrosis; F4 = cirrhosis. ≥denotes ‘at least’ the stated stage.
Disclaimer/Publisher’s Note: The statements, opinions and data contained in all publications are solely those of the individual author(s) and contributor(s) and not of MDPI and/or the editor(s). MDPI and/or the editor(s) disclaim responsibility for any injury to people or property resulting from any ideas, methods, instructions or products referred to in the content. |
© 2026 by the authors. Licensee MDPI, Basel, Switzerland. This article is an open access article distributed under the terms and conditions of the Creative Commons Attribution (CC BY) license (http://creativecommons.org/licenses/by/4.0/).
Copyright: This open access article is published under a Creative Commons CC BY 4.0 license, which permit the free download, distribution, and reuse, provided that the author and preprint are cited in any reuse.


