
Submitted:
27 July 2026
Posted:
28 July 2026
You are already at the latest version
Abstract
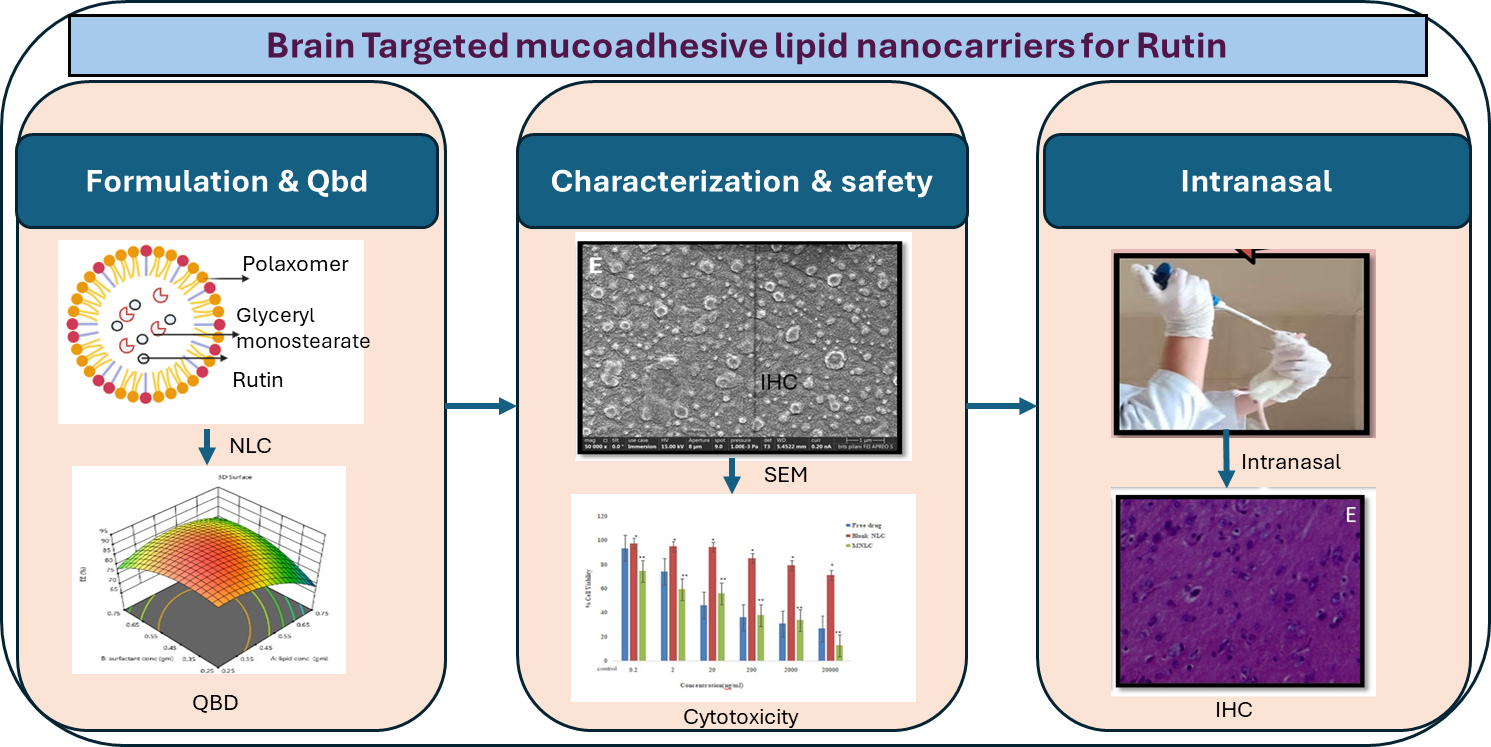
Introduction: Rutin, a glycoside flavonoid that has high neuroprotective efficacy in neurodegenerative diseases, is hindered by low aqueous solubility and poor oral bioavailability. The major challenge in routine delivery is across the blood brain barrier (BBB). So to resolve these problems, in present study we formulate mucoadhesive nano lipid carrier (MNLCs) for intra-nasal administration for the purpose of enhancing residence time in the nasal cavity and targeting in the brain by utilizing trigeminal and olfactory neuronal routes, thus avoiding the BBB. Methodology: MNLCs were prepared by melt emulsification and probe sonication technique and various formulation parameters such as lipid content, surfactant concentration and sonication time were optimized using quality by design (QbD). Results: Box-Behnken design based on particle size, entrapment efficiency and drug release was utilized. Optimized nano-carriers were coated with -cyclodextrin for imparting mucoadhesive properties. Result: The characteristics of nanocarriers showed that the optimized MNLCs have particle size of 150.8 42.5 nm, polydispersity index of 0.592 and zeta potential of -18.2 mV. In vitro release profile demonstrated a sustained release with 80% drug release over 48 h. SEM demonstrated the presence of-cyclodextrin coating on the surface of the nanocarrier. The in vivo studies revealed increased brain delivery and therapeutic effect through nasal administration. Conclusion: All the results indicate that the cyclodextrin coated MNLCs were successful in the delivery of rutin to brain by intra-nasal administration and have shown a sustained release profile with improved bioavailability and neuroprotection.
Keywords:
nasal route
; brain targeting
; box behnken design
; mucoadhesive
; in-vivo pharmacodynamic
; parkinson disease
1. Introduction
Parkinson’s disease (PD) has been ranked as one of the most rapidly progressive age-related neurological conditions, with their associated burdens of disability and mortality, even more so than other neurodegenerative disorders. Epidemiological data suggests a doubling of its global prevalence in the last two decades, corresponding to approximately 8.5 million people and 329,000 deaths in 2019, and 5.8 million disability-adjusted life years (DALYs). The pathophysiology of PD is characterized by a degeneration of dopaminergic neurons in the substantia nigra pars compacta (SNc), resulting in deficits in fundamental motor functions such as bradykinesia, postural instability, tremor, gait disturbance, speech impairment, and various non-motor neurological responses. [1]
While the exact cause and pathogenesis of PD remain poorly understood, key factors contributing to its development are oxidative stress, inflammation, and impaired mitochondrial function. Conventional treatments for PD are focused on symptom management by targeting dopaminergic pathways with medications like levodopa, dopamine agonists, monoamine oxidase-B (MAO-B) inhibitors, anti-cholinergic agents, and other supportive drugs aimed at improving quality of life. [2] However, the effectiveness of treatments for central nervous system (CNS) related disorders is uniquely limited due to the presence of the blood-brain barrier (BBB). This sophisticated functional and structural interface, composed of endothelial cells, pericytes, astrocytes, and glial cells, constitutes a neurovascular unit responsible for restricted permeability and high resistance to the passage of proteins, molecules, nutrients, and other supplements between the blood and the brain. Consequently, only approximately 2% of small-molecule therapeutics successfully reach the brain with sufficient concentration to exert therapeutic effects, leading to limited bioavailability and sub-optimal treatment outcomes in conditions such as PD.
Rutin (3,3,4,5,7-pentahydroxyflavone-3-rhamnoglucoside), also known as sophorin or rutoside, is a naturally occurring polyphenolic bioflavonoid extracted from various fruits such as lemons, grapes, berries, and peaches. Numerous studies indicate the potential of rutin as a neuroprotective agent in neurodegenerative diseases, attributed to its antioxidant properties that help preserve neuronal redox homeostasis, restore synaptic integrity in tauopathy models, and alleviate cognitive and behavioral deficits. This makes it a compelling candidate for Parkinson’s disease (PD). Nevertheless, its low water solubility and limited bioavailability restrict its ability to reach the brain for therapeutic purposes, less than 20% of the administered dose effectively reaches the CNS. To overcome this limitation, nanocarrier-based strategies have been developed for the delivery of molecules with poor brain penetration. These strategies utilize organic (lipids, polymers) and inorganic (gold, silver, silica) materials delivered via both invasive (intravenous administration, local intracranial implants, BBB disruption) and non-invasive (intranasal, oral) routes. Among these, intranasal (i.n.) delivery stands out as a promising approach that allows for direct delivery to the CNS by bypassing the BBB and first-pass metabolism in the liver, thus serving as a potential drug delivery method to the brain. [5] A significant challenge with nasal delivery, however, is mucociliary clearance, which rapidly removes drugs from the nasal cavity, leading to short contact times with the nasal mucosa and a reduced amount of active drug reaching the brain. To optimize intranasal drug delivery, mucoadhesive formulations are essential for prolonging nasal residence time and enhancing transmucosal permeation, thereby improving therapeutic outcomes in CNS disorders such as PD. [4]
This study aims to develop cyclodextrin-integrated mucoadhesive nanolipid carriers (MNLCs) for the controlled release of Rutin. To our knowledge, this is the first report of rutin-loaded MNLCs prepared for targeted brain delivery via intranasal route, addressing the current unmet need for improved CNS bioavailability for anti-Parkinson’s activity. The rutin-loaded MNLCs were formulated using the Quality by Design (QbD) framework, incorporating a systematic risk assessment and multivariate optimization to ensure consistent product quality and reproducibility. Molecular docking simulations were also performed to examine the binding interactions of Rutin with key proteins associated with neurodegenerative diseases, offering insights into its mechanism of action and therapeutic efficacy. Collectively, these strategies are designed to enhance the pharmacokinetic delivery of Rutin and validate its neuroprotective potential through computational and experimental design.
2. Materials & Methods
Rutin trihydrate (purity >95%), Oleic acid, β-cyclodextrin, and Ellman’s reagent were purchased from HiMedia laboratories (Mumbai, India), Polaxomer-407 and Sulphosalicylic acid were obtained from S.D. fine chemicals limited (Mumbai, India), Glyceryl monostearate was obtained from Croda Labs, Singapore. Thio barbituric acid was acquired from Fisher Scientific (Thermo Fisher Scientific; Massachusetts, USA), Rotenone was purchased from Orbit Scientific Products (Dundigal, India), EDTA and sodium sulfide were obtained from Sisco Research Laboratories Pvt. Ltd. (Mumbai, India). Other solvents and reagents were of analytical grade and obtained from local vendors.
2.1. Molecular Docking Studies
The 3D structures of rutin and levodopa (reference standard) were obtained in .sdf format from the PubChem database. 7 protein targets with anti-Parkinson’s activity were selected based on pathophysiology from the literature, and their Protein Data Bank (PDB) target IDs were imported into the Schrödinger Maestro platform (v13.0) for structural preparation. Protein structure was optimized by adding missing atoms, side chains/loops and removing non-essential hydrogen atoms, followed by receptor grid generation to define binding pockets. Ligand structure (levodopa and rutin) were subjected for energy minimization and prepared for docking using pyRx software (an open-source virtual screening software). Thereafter, docking simulations were performed to determine the binding interactions with binding affinity scores (in Kcal/mol) for rutin and levodopa across all the targets. The values obtained were compared with the Levodopa to determine the potential of rutin as a multi-target anti-Parkinson agent. [8]
2.2. Preparation of NLCs
Experimental design: The Quality Target Product Profile (QTPP) framework with the specific critical quality attributes (CQAs) is essential for ensuring the therapeutic performance and manufacturing scalability of rutin-loaded nanostructured lipid carriers (NLCs). Patient-centric CQAs were derived from the QTPP framework, focusing on physiochemical parameters such as small particle size (<250 nm for enhanced biodistribution and target site accumulation), high entrapment efficiency (to optimize dosing with maximal drug loading), and controlled drug release kinetics (for uniform drug dispersion and release across the in vivo environment). These QTPP and CQA parameters are summarized in Table 1.
A Box-Behnken Design was selected based on response surface methods (RSM) to optimize systematically optimize responses and variables for rutin-loaded nanostructured lipid carriers (RNLCs). A 17-run Box-Behnken Design with three factors at three levels were employed.
Wherein, the lipid concentration (A), surfactant concentration (B) sonication time (C) were chosen as independent variables and varied at three different levels of low, medium and high (-1, 0, +1) and Particle size (Y1), %Entrapment Efficiency (Y2), %Drug release (Y3) were selected as dependent variables as shown in Table 2. Additionally, 3 independent variables (A) lipid (glyceryl monostearate) concentration (0.25- 0.75g), (B) surfactant (poloxamer 407) concentration (0.25-0.75g), and (C) sonication time (20-40 min) were evaluated. Using the Design-Expert 13 software, a total of 17 runs with 5 center points for RNLCs formulations were prepared as shown in Table 3.
Rutin-loaded nano lipid carriers (RNLCs) were prepared using melt emulsification method. Briefly, the glyceryl monostearate (solid lipid) and oleic acid (liquid lipid) were combined in a 70 °C water bath to form a molten lipid phase. Thereafter, rutin (10 mg) was added to the melted lipid phase and allowed to dissolve. The aqueous phase containing poloxamer 407 (surfactant) was heated at 70 °C and gradually transferred to molten lipid phase with continuous stirring at 500 rpm for 30 min to form a primary emulsion. The emulsion was then rapidly cooled on an ice bath for 10 min, then subjected to probe sonication (UP 200s, ultras hall processor) at 40% amplitude and to yield RNLCs formulation. The RNLCs were stored at 4 °C until further use. Particle size distribution and polydispersity index (PDI) were determined using dynamic light scattering (DLS) with a Horiba nanoparticle size analyzer (Horiba SZ-100, Japan) through the photon correlation spectroscopy approach, assessing the light scattering caused by Brownian motion of the particle.
2.3. Entrapment Efficiency (%E.E.) (Y2)
The % entrapment efficiency (%EE) of rutin was determined using the simple UV-Visible spectroscopic method. Wherein, RNLCs dispersion (5 mL) was taken and then centrifuged at 5000 rpm for 5 min at 4 °C. The obtained supernatant was taken and %entrapment efficiency was calculated by measuring the quantity of rutin at λmax 269 nm. The % E.E. of rutin in RNLC was determined using the below formula:
%Entrapment efficiency=Total amount of drug -free drug /Total amount of drug × 100
Analytical Method development of drug: Analytical method for Rutin was developed on simple UV-Visible spectrophotometer (Shimadzu, Japan), wherein, 10 mg of rutin was weighed and solubilized into a 100 ml volumetric flask containing phosphate buffer (pH 6.4). Thereafter, a series of dilutions were prepared from the stock solution ranging from 2-14 µg/ml. The absorbance of solutions was determined at λmax 269 nm and calibration curve was plotted for absorbance versus concentration. Linear regression analysis confirmed the method’s precision, with a correlation coefficient (R²) ≥0.999, validating its suitability for rutin quantification in subsequent formulations.
2.4. Invitro Drug Release Studies (Y3)
In vitro drug release assay of rutin of the RNLCs was performed using a Franz diffusion cell method. The dialysis membrane with MWCO. 12kDa was utilized for the experimentation. The donor compartment contains RNLCs, and the receptor compartment was filled with a phosphate buffer solution (pH 6.4) to maintain the sink condition. The donor chamber was mounted on the assembly and consistent temperature (37 ± 0.5 °C) conditions were maintained. At specific intervals (0, 1, 2, 4, 6, 8, 10, 12, 24 h), aliquots (2 ml) were withdrawn from receptor compartment and replaced with the same amount of fresh buffer solution to maintain sink conditions. The concentration of rutin release was analyzed by U.V. spectrophotometer method. The percentage drug release was calculated and %cumulative drug release graph was plotted over time.
% CDR = Test Absorbance / Standard Absorbance X Standard Concentration X Dilution Factor X Volume of medium X Label claim / 1000 X 100.
2.5. Preparation of Mucoadhesive NLCs (MNLCs)
The RNLCs were used to prepare the mucoadhesive NLCs (MNLCs) containing β-cyclodextrin (β-CD) for improving nasal absorption through increased residence time in the nose. Wherein, initially β-CD solution was prepared by dissolving β-CD in deionized water overnight at 800 rpm followed by filtration through a 0.45 µm cellulose membrane to remove undissolved particles. The β-CD-coated RNLCs were prepared by adding series of different concentration of β-CD (0.1%, 0.25%, and 0.5% w/v) to RNLCs and stirred for 12 h under ambient conditions [11]. The obtained MNLCs were centrifuged at 5000 rpm for 5 min at 4 °C followed by the characterization.
2.6. Characterization of MNLCs
MNLCs were characterized by physicochemical properties, including particle size, polydispersity index (PDI), entrapment efficiency (EE%), and in vitro drug release profile using the similar procedures used for RNLCs. Further, these were also characterized by the following studies:
2.6.1. Zeta Potential
The zeta potential (ζ) of RNLCs and MNLCs were determined using disposable polystyrene capillary zeta potential cell on Horiba zeta sizer (Horiba SZ-100, Japan).
2.6.2. Mucoadhesive Strength
The mucin binding efficiency of MNLCs were determined to assess their bioadhhesive potential, wherein, MNLCs and RNLCs were incubated with 5 ml of porcine mucin solution (0.5 mg/ml in PBS pH 6.4) under physiological conditions (37 °C) for 60 min. The unbound mucin was separated using ultracentrifugation (60,000 rpm for 60 min). The amount of free mucin in the supernatant was determined at λ 220 nm using simple U.V. spectrophotometer [12]. The mucin binding efficiency of MNLCs determined using the below equation.
Mucin binding efficiency (%) = Cinitial mucin−Cfree mucin/Cinitial mucin ×100
Where, is the mucin concentration before incubation and is the concentration of unbound mucin in the supernatant after ultracentrifugation.
2.6.3. Surface Morphology by SEM
Scanning Electron Microscopy (SEM) was utilized to determine the surface morphology of RNLCs and MNLCs. The samples were prepared by adding samples on the glass cover slip and allowed air dry overnight. The dried glass cover slips were placed on a double-sided carbon tape were coated with gold under vacuum for 45 sec. The coated samples were analyzed, and their representative images were acquired using SEM.
2.6.4. Differential Scanning Calorimetry (DSC)
The thermal analysis was performed for free rutin, RNLCs, and MNLCs using differential scanning calorimetry (DSC; Mettler-Toledo/DSC1/500). Wherein, sample (10 mg) was added on to the aluminum pan and heated up to 300 °C at a heating rate of 100 °C/min under a nitrogen environment. The analysis performed was plotted for heat transmittance over temperature.
2.6.5. FT-IR Analysis
FTIR analyses were performed for MNLCs determine the surface functional groups and identifying the potential interactions between the drugs and lipids. Briefly the sample and potassium bromide (KBr) was mixed (1:10 w/w) and its pellet was prepared. The transmission mode was used to obtain the FTIR spectra ranging from 4000 to 400 cm-1.
2.6.6. X-Ray Diffraction (XRD) Studies
X-ray patterns of pure drug and MNLCs were determined using an X-ray diffractometer (Spectris Technologies Pvt. Ltd.) with the Cu-K line as a radiation source, operated at voltage of 40 kV and current of 25 mA. All samples were measured at a scanning rate of 30 °C/min and a step size of 0.02 in the 2Ɵ angle range between 100 and 700.
2.6.7. Ex Vivo Permeation Study
Ex vivo trans-mucosal permeation studies were performed using Franz diffusion apparatus to determine the nasal absorption potential of MNLCs. Wherein, freshly excised goat nasal mucosa was utilized as a membrane, mounted between donor and receptor compartments with permeation area of 2.5 cm2. Thereafter, the donor compartment was loaded with MNLCs, while the receptor chamber was filled with freshly prepared phosphate buffer solution (pH 6.4), and maintained at 37 ± 0.5 °C. Aliquots (2 ml) were withdrawn from receptor compartment at periodic intervals (0, 2, 4, 6, 8, 10, 12, and 24 h) and replaced with the same amount of fresh buffer solution to maintain the sink conditions. The amount of permeated rutin was determined using a U.V. visible spectrophotometer at λmax 269 nm. The permeability coefficient [P] was calculated using the following formula [13].
where dQ/dt: flux or permeability rate (mg/h), Co: initial concentration in donor compartment, A: effective surface area of the nasal mucosa.
P = dQ/dt /CoA
2.6.8. In Vitro Cytotoxicity Studies
The cytotoxicity of MNLCs were determined using MTT assay in HEK293 cells using MTT assay. Wherein, the cells were seeded in 96-well plate at a density of 2 × 10³ cells/well and incubated at 37 °C with 5% CO2. Subsequently, the cells were treated with rutin, blank NLCs, RNLCs and MNLCs at various concentrations (0.2, 20, 200, 2000, and 20,000 nM) for 72 h. After that the old media was discarded and new media containing MTT solution (1 mg/ml; 200 µl) was added and incubated for 4 h. Thereafter, the solution was decanted and fresh 200 µl of DMSO was added to solubilize the formazan crystals. The extent of metabolic activity was determined by using a microplate reader at 570 and 630 nm [14]. The percentage of viable cells was calculated using the following formula:
Cell Viability (%) = (mean absorbance value of drug-treated cells) / (mean absorbance value of the control) x 100
2.7. In Vivo Studies
The in vivo pharmacodynamic studies was performed after approval from the Institutional animal ethics committee with approval no CPCSEA/1677/SPMVV/IAEC/II-11 in compliance with the Committee for the Purpose of Control and Supervision of Experiments on Animals (CPCSEA) guidelines. Male Wistar rats weighing between 150 to 200 g were used with age of 6-8 weeks. Animals were kept under standard environmental conditions with 12 h day-night cycle and fed with standard food, water, ad libitum. For in vivo efficacy studies, animals were randomly divided into 5 groups (each group containing 6 animals), including, group I, treated with normal saline (Normal Control), group II disease control (induction with rotenone), group III (Induction with Rotenone + treatment with MNLCs through nasal route), group IV (Induction with Rotenone + treatment with MNLCs through oral route) and group V (Induction with Rotenone + treatment with Syndopa marketed tablet orally). The animals were administered with a dose equivalent to 10 mg/kg of rutin. Treatments were administered daily for 21 days, and the behavioral analysis was observed for 7,14, 21 days.
2.7.1. Behavioral Analysis: Locomotor Activity (Acto Photometer Test)
The spontaneous locomotor activity was determined as described by Lannert and Hoyer approach [15]. The animals were assessed at one at a time wherein, the individual animal was kept in an arena (square closed) (30 × 30 cm) for evaluating locomotor activity in dark, sound proofed, ventilated chamber and outfitted with photocells for 10 min (infrared-light sensitive) conditions. The number of movements were recorded. Each animal underwent three independent tests, and results were recorded as mean ± S.D. and analyzed for their movement across the arena.
2.7.2. Muscle Coordination (Rota Rod)
Muscle rigidity, a specific motor deficit in PD, primarily characterized by impaired neuromuscular coordination. Rota Rod apparatus was used, wherein the animals were placed individually on a horizontal rotating rod at a speed of 20 rpm, and the latency to fall was recorded as a function of neuromuscular coordination. Before the actual study, each rat underwent three pre-test trials to prevent bias. Each animal’s “fall off time,” which represents how long it took them to lose their grip on the moving rod, was noted [16].
2.7.3. Biochemical Estimation: The Brain Tissue of Euthanized Animals WAS isolated and Kept in Ice-Cold Conditions for Biochemical Evaluation
Tissue Preparation: The rats were euthanized by cervical decapitation under anesthesia and brains were quickly dissected out, homogenized in 50 mM phosphate buffer (pH 7.0) containing 0.1 mM disodium edentate (EDTA) to yield 5% (w/v) homogenate. The homogenate was centrifuged at 10,000 rpm for 10 min at 4 °C in cold centrifuge, the resulting supernatant was used for further analysis.
i)Thio barbituric Acid-Reactive Substances (TBARS)Estimation: Lipid peroxidation was estimated using TBARS method measuring malondialdehyde (MDA) as a marker of oxidative damage. Wherein, the rate of lipid peroxidation was determined by adding 2 ml of potassium chloride (0.15 M) with 2 ml of 10% brain homogenate and vortexed for 3 min. Thereafter, 1 ml of the homogenate was added into a test tube, and 0.5 ml of TCA (30%) and 0.5 ml of TBA (0.8%) were added. The mixture was incubated on ice-cold water for 30 min followed by heating at 80 °C for 30 min. This mixture was cooled and centrifuged for 15 min at 3,000 rpm. The obtained supernatant was collected in a test tube, and the absorbance was measured at 540 nm using a spectrophotometer, with MDA concentration calculated against a standard curve [17]. ii)Estimation of Reduced Glutathione (GSH): The reduced glutathione (GSH) was estimated in the brain homogenate using the previously described method [18]. Wherein, 0.75 ml of tissue homogenate (10%) homogenate stock was 5% was added with 0.75 ml of sulfosalicylic acid (4%) and centrifuged at 1200 rpm for 5 min at 4 °C. After that, 4.5 ml of 0.01 M DTNB (5,5-dithio-bis-(2-nitrobenzoic acid) solution was added to 0.5 ml of supernatant yielding a yellow-colored 5-thio-2-nitrobenzoic acid (TNB) complex. The produced yellow color was instantly measured at 412 nm using a UV-Vis spectrophotometer, with GSH concentration calculated against a standard curve.
iii)Estimation of Dopamine (DA): DA levels in rat brain were determined using a fluorometric assay. Rat brain samples were homogenized in ice cold HCl-butanol was employed (1:10 for 1 min) and centrifuged at 3000 rpm for 10 min. The obtained supernatant (1 ml) was added with 2.5 ml of hexane and 0.1 M HCl (0.3 mL). The aqueous layer (0.2 ml) at 0 °C was added with 0.1 M in an ethanol iodine solution (0.1 ml), 0.4 M HCl (0.05 ml), and sodium acetate buffer (pH 6.9). After 90 s, 0.1 ml of acetic acid (0.1 ml) was added and the reaction was quenched after 2 minutes by adding sodium sulfite solution (0.1 ml). The mixture was heated for 6 min to 100 °C. [19]. The excitation and emission spectra were read at 330-375nm using the spectrofluorometer and compared with the blank and DA concentration was interpolated from a standard curve.
2.8. Histopathological Studies
The brains of the experimental animals from all groups were isolated and kept in a 10% formalin solution. Sections of 5 µm thickness were cut, embedded in paraffin, and stained with hematoxylin and eosin. The histopathological analysis was performed and observed through an inverted microscope (Olympus BX53).
2.9. Statistical Analysis
The obtained data is represented as mean ± standard deviation. Statistical analysis of data was carried out by the software graph pad prism 9.0. The comparisons between different groups were done using one-way variance analysis (ANOVA). The p value of ˂0.05 was statistically significant.
3. Results & Discussion
3.1. Molecular Docking
The simulation for the ligand (Rutin) was conducted to assess the binding affinity against the target protein associated with anti-Parkinson activity, and the results are shown in Table 4. The 2D and 3D images of the protein exhibited strong interaction with interleukin-1 receptor-associated kinase 4 (IRAK4; PDB ID: 6O94), docking score as shown in Figure 1. IRAK4 plays a crucial role in the TLR signalling pathway, serving as the immediate component near toll-like receptors (TLRs) that initiates the activation of downstream molecules like cytokines and chemokines. This pathway is central to inflammatory responses, meaning that IRAK4 activity directly impacts the inflammatory cascade. When Rutin downregulates the IRAK4 expression, it inhibits its activity, potentially dampening this inflammatory response. This mechanism aligns with potential of rutin to mitigate neuroinflammation, a key contributor to dopaminergic neurodegeneration in PD. Furthermore, since it could exert its effects directly in the central and peripheral nervous systems. [20]. Docking score is to predict the binding affinity of both target and ligand once it is docked. Docking score of above -5 is considered as good binding affinity towards ligand.
3.2. Optimization of Nano Lipid Carrier System by BBD
BBD design has produced 17 runs for the prepared formulations with five center points that was used to optimize RNLCs using Design Expert® software. Table 2 has displayed the results obtained for 17 runs. The effect of independent variables like (A) lipid concentration, (B) surfactant concentration, and (C) sonication time are the critical material attributes (CMA) on responses of particle size (Y1), %entrapment efficiency (Y2), and %drug release (Y3) are presented on a 3D-graph Figure 2 (a, b.c). A three-factor and 3 levels BBD design were applied for the optimization of RNLCs. The quadratic model obtained for the formulation was suitably fitted. Desirability has shown 0.938 which shows better desirable characteristic features obtained for optimization of formulation. The model F value was 6.67(Y1), 18.70 (Y2), 7.03(Y3), and the p-value was < 0.0005, which signified that the model was significant for all three responses. P- values less than 0.05 indicated that the model terms are substantial. The model validity was confirmed with the help of the ANOVA test, indicating the suitability of applied model. Further, the statistical evaluation of the selected model resulted in higher values of R from 0.8956 (p <0.001) and 0.9004 (p <0.0001), and lack of fit (p >0.005) which was insignificant, thus indicating the suggested model is fit for the experimental data. Following the QbD-based methodology, the QTPP was defined by summarizing the quality attributes to achieve the highest therapeutic efficacy and appropriate patient safety. The CQAs for RNLCs were set aside to fulfill the intended QTPP objectives. The list of CQAs particle size, zeta potential, entrapment efficiency, and 80% drug release are summarized in Table 1.
3.3. Design of Experiment: Data Analysis
Particle size (Y1)
The particle sizes of different RNLCs ranged from 46.4 ± 9.3 nm to 969.2 ± 9.7 nm. The quadratic equation for particle size was obtained from DoE software and is shown in equation no 1
Y1 = +206.80+123.66 A – 12.75 B – 120.14 C +32.25 AB – 32.73AC +185.75 BC +175.6A2 +375.76 B2 +13.79 C2 …. (1)
The 3D response surface contour plots and quadratic equation of particle size (P.S.) (Eq. 1) (Figure 2a), suggest the increase in (A) lipid concentration shown an increased particle size at all levels which could be due to increased viscosity of the dispersed phase, leading to particle aggregation and gradual increase in size [21]. The (B) surfactant concentration and (C) sonication time have shown a negative effect on particle size, indicating decreased particle size at increased (B) surfactant concentration and increased (C) sonication time; this might be due to decreased interfacial tension between the aqueous phase and lipid resulted in particle partitioning and the excess destruction of the particle at high sonication time lead reduced particle size [22]. But at high levels, surfactant concentration and sonication time have shown positive effects as there may be an aggregation of particles after the optimum concentration of surfactant volume due to decreased surface tension extensively due to an increased erosion effect caused by sonication which might induce aggregation of particles in the liquid by increasing interactions and contact of nanocarriers on the surface of the large particle [23]. As a result, lipid concentration has a profound effect on particle size. The f value of particle size is 6.67, indicating that the model is significant.
%Entrapment Efficiency (%EE) (Y2)
The entrapment efficiency of RNLCs ranged from 66.3 ± 1.58 to 91.7 ± 2.3%. The quadratic equation for %E.E. was obtained from DoE software and shown in equation 2.
Y2 = +90.18 – 4.53 A + 0.35 B + 4.48 C + 5.28 AB – 4.48 AC + 2.73 BC – 5.83 A2 - 5.78 B2 - 4.38 C2 … (2)
As per the contour response plots and quadratic equation of Entrapment Efficiency (Eq. 2), as lipid concentration increases, the E.E. was found to be reduced, which could be attributed due to increased viscosity of the lipid phase which decreased the entry (diffusion) of the drug into NLCs [24]. The (B) surfactant concentration and (C) sonication time have been found to enhance the %entrapment efficiency (E.E.) at lower levels but reduced it at higher levels. This occurs because, at low concentrations, surfactants help stabilize the nanoparticles, improving drug entrapment. However, at higher concentrations, excess surfactant molecules may get incorporated into the nanostructured lipid carriers (NLCs) themselves, reducing the space available for drug loading. Similarly, while sonication helps in size reduction and better encapsulation at lower durations, excessive sonication can lead to structural disruptions and potential leakage of the drug, ultimately lowering the %entrapment efficiency [25]. At the ideal sonication period, these powerful pressures would have likely accelerated Rutin’s transport to the lipid matrix’s core and boosted the entrapment percentage. Upon increase in sonication time, the %entrapment efficiency was decreased due to an increase in the sonication period would have led to more agglomeration breakdown, which would have reduced the %entrapment efficiency and drug leakage from lipid carriers [26]. As a result, lipid concentration has a profound effect on entrapment efficiency. The explanation results of critical material attributes on %entrapment efficiency are depicted on the 3D response surface plots. The f value of 18.7 implies that the model is statistically significant.
% Drug release (%DR) (Y3)
In vitro, the drug release range in 24 h was from 28 ± 0.50 to 49.2 ± 1.52. The quadratic equation for %DR was obtained from DoE software and is shown in equation no. 3
Y3 = +44.30 – 2.65 A +1.45 B + 3.58 C – 5.80 AB + 0.25 AC + 0.85 BC – 1.93 A2 – 7.28 B2 – 0.52 C2 …. (3)
As per 3D response surface contour plots and quadratic equation 3. With the increase in lipid concentration, the percentage of drug release was decreased due to increased particle size and reduced effective surface area available to contact the release medium. Furthermore, as the particle size increased the duration of the diffusion of drug from the organic to the aqueous phase increased and led to a decrease in drug release [27]. Increased (B) surfactant concentration and (C) sonication time have shown increased drug release due to increased surface area resulting in increased drug diffusion release medium [28]. At higher levels of quadratic effects, three variables have shown a negative effect on drug release. The release kinetics model was applied based on R2 values. The drug was released at a zero-order rate. The good fit model is the Higuchi smodel and the diffusional release exponent values more than 0.45, indicated drug release by non ficky diffusion process. Zero order kinetics have a linear elimination phase once the system is saturated, followed by continuous drug removal regardless of plasma concentration. Higuchi equations, which describe how drugs diffuse from homogeneous and granular matrix systems, were the ones that the formulation was most closely matches.
Prediction error
The percentage prediction error was calculated between the predicted and experimental values for RNLCs are shown in supplementary Table 1. The %prediction error was less than 10% which was within the acceptable range (acceptable range is up to ± 15%) for the three responses, indicating that the observed values are nearer to the predicted values of RNLCs. Then RNLCs were used for mucoadhesion with β-CD to get MNLCs. The optimized formula concentrations were shown in ramp graphs Figure 3. Ramp graphs describe the optimized formulation formula utilized to show the desirability of various factors in an optimization process.
3.4. Characterization of MNLCs
a) Particle size, zeta potential, and %entrapment efficiency
With an increase in concentration (0.1%, 0.25%, and 0.5% w/v) of β-Cyclodextrin, increased particle size (150.8 ± 42.4, 255.8 ± 25.7, 309.2 ± 15.2, respectively) was observed. The β-CD with 0.1% w/v exhibited the particle size less than 200 nm was utilized for coating of prepared MNLCs for nose-to-brain delivery.
The average particle size, polydispersity index, and surface zeta potential was found to be 150.8 ± 42.5 nm, 0.592, and -18.2 mV, respectively, indicated narrow particle distribution, and Z.P. of indicated that prepared MNLCs were stable due to surface charge. The positive surface charge that gives rise to the negative sign of Z.P. indicates solid repulsion, which eventually prevents the aggregation of particles and improves the physical stability of the MNLCs formulation. The increase in the size of β-CD is due to mucoadhesive coating. Particle size and zeta plots for MNLCs were shown in Figure 4(a, b). The % entrapment efficiency for the MNLCs and RNLCs was 92.4 ± 1.42% and 90.4 ± 1.2%, respectively.
b) Mucoadhesive strength:
The mucoadhesive potential of MNLCs was determined to assess their capacity for improved nasal mucosa adherence for increased permeation and bioavailability. The mucoadhesive strength for RNLCs and MNLCs was estimated by calculating mucin binding efficiency to NLCs. The MNLCs demonstrated significantly higher mucoadhesion (81.7 ± 2.42%) compared to RNLCs (64.7 ± 4.42%), describing the impact of surface modifications optimizing mucin interaction. Mucoadhesive strength was found to be higher with MNLCs compared to RNLCs, confirming the potential of the MNLCs for prolonged absorption and retention time and of MNLCs, to overcome rapid mucosal clearance at the nasal mucosa site.
c) In vitro drug release studies:
The %drug release studies were performed for MNLCs and RNLCs for 48 h. The % drug release of MNLCs was found to be 88 ± 2.24%, and for RNLC, it was 82.2 ± 1.25% for 48 h, as shown in Figure 4c. The release kinetics was applied for various kinetic models for diffusion profile of RNLCs and MNLCs. Based on the comparison of R2 values between zero order and first order, it was observed that RNLCs and MNLCs released the drug at a zero-order rate. Based on its results, the release of Rutin from RNLCs and MNLCs was best fitted to the Higuchi model (R2 =0.988) via both diffusion and swelling-controlled methods, which aligns with the studies of Ge H et al. [29].
d) Surface Morphology by SEM:
The SEM images of RNLCs and MNLCs showed spherical shaped particles Figure 4(d, e) with separate individual particles without agglomeration. SEM image of MNLCs demonstrated the coating of β-CD on the surface of RNLCs, as shown in Figure 4e, using a field-emission SEM (instrument model, manufacturer) operated at an accelerating voltage of 10–15 kV which was supported by a slight increase in particle size of MNLCs compared to RNLCs.
e) Differential Scanning Calorimetry (DSC):
The DSC study was performed to determine the compatibility of the drug incorporated in the MNLCs. DSC thermogram of Rutin showed a sharp endothermic peak at 186.6 °C corresponding to its melting point, indicating the drug is crystalline and MNLCs showed a peak at 1410 C, shown in Figure 5(a), which is attributed to the fast melting of the drug along with lipid (M.P 66 °C) Figure 5(b). The depression in the melting point of rutin in MNLCs formulation was possibly due to lipids and surfactants, which produced a solubilization effect on the drug.
f) FTIR Analysis:
The FTIR spectra of rutin and MNLCs are shown in Figure 5(c,d).The FTIR spectrum of the rutin revealed the characteristic absorption bands at 3419.5 (O-H stretch), 2935 (C-H stretch), 1655 (C=C stretch), 1601 (H-N-H. bend), 1504 (cm-1) (N=O asymmetric stretch), 1456 (C-H bend), 1294 (N=O symmetric stretch), 1167, 1123, and 1063 (-N-C-N stretch), 879, 725 and 631 (N-H wag). While, for MNLCs absorption bands were observed at 3343 (C-H stretch), 2924 (C-H stretch), 1638 (N-H bend), and 1033 (C=O stretch) which depicted all the characteristic drug peaks. The absorption bands are almost the same at wave numbers in drug and MNLCs. FTIR spectra of pure drug and MNLCs suggested overlap of significant characteristic peaks hence found no chemical interactions are present.
g) X-Ray diffraction studies:
The Rutin showed sharp peaks at 2Ɵ of 10.69, 11.13, 12.45, 23.45, and 27.0, showed that the pure drug Rutin is crystalline shown in Figure 6(a). In contrast, MNLCs showed broad peaks and low intensity peaks at 2Ɵ of 19.16, and 23.4 with low intensity shown in XRD studies, indicating an amorphous state. The presence of amorphous signal confirms successful drug encapsulation within the lipid matrix, resulting in molecular dispersion and loss of long-range crystallinity. (Figure 6b) [30].
3.5. Ex Vivo Studies
Ex vivo permeation studies of MNLCs were performed using goat nasal mucosa as a barrier membrane to evaluate the transmucosal delivery potential. The MNLCs exhibited ~85.8±0.01% of rutin permeated after 24 h, with a steady state flux of 1.25 µg/cm²/h and permeability coefficient [P] of 0.171 cm2/h [31]. (Figure 7a). Thus, the high permeation efficiency favors the permeability capacity of MNLCs can improve the rapid drug penetration for intranasal delivery.
3.6. In Vitro Cytotoxicity Studies
Cytotoxicity analysis revealed a clear concentration-dependent decline in HEK293 cell viability across all formulations. Free drug maintained high viability at ≤20 µg/mL but caused pronounced cytotoxicity at higher concentrations (200–20,000 µg/mL) as shown in Figure 7b. Blank NLCs showed minimal toxicity at low doses, with viability remaining above ~85–90% up to 20 µg/mL, followed by a gradual reduction at higher concentrations. Rutin-loaded NLCs similarly preserved ≥80–90% viability at ≤20 µg/mL but exhibited a marked decrease in viability at higher doses. Likewise, Shadab M.D. et al. found that the treatment with 100 g/mL of NPs resulted in only 33.83% cell viability at 24 h [32]. These results indicate that all formulations are well tolerated at lower concentrations, while higher doses significantly reduce cell viability.
3.7. In-Vivo Studies
a) Pharmacodynamic studies:
i) Behavioral analysis: The behavioral analysis results were recorded and shown in supplementary Table 2, and Figure 8 (a, b).
Locomotor activity
A photo actometer test was conducted to assess the locomotor activity in animals. Locomotor activity gauges the central nervous system’s (CNS) attentiveness or wakefulness. The results indicated a significant disease control animals exhibited a marked reduction in locomotor counts (126.6 ± 0.7) compared to normal controls (205.5 ± 0.86; p < 0.001), as shown in Figure 8(a). However, intranasal administration of MNLCs (Group III: 183.3 ± 0.2) significantly restored the locomotor activity in animals, outperforming both oral MNLCs (Group IV: 166.0 ± 0.46; p < 0.01) and the standard treatment (Group V: 153.5 ± 0.53; p < 0.05). The improved locomotor activity is likely to be observed due to direct nose-to-brain delivery circumventing systemic metabolism, and improved the pathology of PD.
Muscle coordination
Motor coordination was determined using the rotarod test, measuring the latency to fall from a rotating rod. Wherein, the disease control animals (Group II: 46.33 ± 0.95 sec) exhibited significantly impaired coordination compared to normal controls (Group I: 167.74 ± 1.2 sec; p < 0.001), confirming successful PD model induction. While treatment with intranasal MNLCs (Group III: 123.7 ± 0.2 sec) restored the motor function more effectively compared to both oral MNLCs (Group IV: 89.74 ± 0.97 sec; p < 0.01) and standard group (Group V: 85.6 ± 0.02 sec; p < 0.01), as shown in Figure 12b. However, the oral MNLCs did not show any significant improvement in the muscle coordination compared to group V standard treatment alone.
A) Biochemical estimations
Biochemical analysis in the brain tissue homogenates was performed for oxidative stress and dopaminergic integrity through GSH, TBARS, and dopamine levels. are shown in supplementary Table 3 and Figure 8(c, d, e) [33].
TBARS levels: TBARS assay was used to determine the MDA levels in the brain homogenate. Wherein the diseased control animals (Group II: 0.73 ± 0.03 nmol/mg) exhibited a 10-fold increase in TBARS level compared to normal control animals (Group I: 0.072 ± 0.04 nmol/mg; p < 0.001), confirming oxidative stress. However, intranasal administration of MNLCs (Group III: 0.35 ± 0.04 nmol/mg) significantly reduced TBARS relative to Group II (disease control; p < 0.01), though levels remained elevated compared to the normal control animals (Group I). Similarly, the oral MNLCs (Group IV: 0.45 ± 0.04 nmol/mg) and standard group (Group V: 0.32 ± 0.07 nmol/mg) showed better outcome compared to the diseased animals. (Figure 8c). Thereby, indicating the protective action of rutin against the oxidative damage caused by rotenone in PD [34,35]
Reduced glutathione: The GSH levels in the brain homogenate of diseased animals (Group II: 0.252 ± 0.02 µmol/g) were significantly reduced compared to normal controls (Group I: 0.561 ± 0.09 µmol/g; p < 0.001), indicative of compromised oxidative defense (Figure 8d). While treatment with intranasal (Group III) and oral MNLCs (Group IV) restored GSH levels to 0.48 ± 0.05 and 0.41 ± 0.03 µmol/g, respectively (p < 0.01 vs Group II), demonstrating the potential of rutin to mitigate rotenone-induced glutathione depletion [34,35].
Dopamine Levels: The dopamine levels in diseased animals (Group II: 13.0 ± 3.2 ng/mg tissue) were significantly reduced compared to normal controls (Group I: 42.7 ± 1.05 ng/mg tissue; p < 0.001), reflecting the dopaminergic neuron degeneration focusing on PD pathophysiology. Therapeutic intervention with intranasal MNLCs (Group III: 38.5 ± 2.1 ng/mg) was found to be better than oral MNLCs (Group IV: 28.7 ± 1.8 ng/mg; p < 0.01) and standard group (Group V: 25.4 ± 1.5 ng/mg; p < 0.05), eventually restored the restored dopamine levels (Figure 8e). This improved efficacy of intranasal MNLCs is attributed due to direct nose-to-brain delivery, bypassing systemic metabolism and enhancing rutin bioavailability in the brain, thereby suppressing oxidative stress and apoptosis, thereby preserving dopaminergic neurons and neurotransmission.
B) Histopathological studies
The histopathological changes of brain tissue was determined using H&E staining, as shown in Figure 9, indicating that the diseased brain has shown prominent neuronal damage (Group II), characterized by pyknotic nuclei, eosinophilic cytoplasm, and neuropil vacuolation, confirming the PD induction. intranasal MNLC administration (Group III) restored the neuronal damage towards the normal, outperforming both oral MNLCs (Group IV) and standard therapy (Group V). As observed in Figure 9b, more neuronal damage was observed this confirms neuronal degeneration in contrast to other neuronal regeneration was observed. However, A&C has shown uniform distribution of cells.
Overall, these findings correlate with restored dopamine levels and motor function, underscoring intranasal delivery of rutin through MNLCs mitigates the neurodegeneration via enhanced brain bioavailability and antioxidant efficacy.
Conclusion
This study aims to design and characterization of mucoadhesive nanostructured lipid carriers (MNLCs) for rutin delivery based on the Box-Behnken design and to assess its in vitro and in vivo efficiency. The developed MNLCs showed increased mucoadhesivity, enhanced nasal permeation and sustained drug release profiles. In addition, after intranasal administration of MNLCs, rotenone-induced PD rats showed improvements in motor deficits, normalization of dopamine levels, and reduction of oxidative stress, as compared to the diseased control rats, confirming the enhanced efficacy of rutin in the pathophysiology of PD. The neuronal regeneration observed in the brain by histopathological studies correlated with the observed biochemical and motor functional improvement.
The enhanced therapeutic efficacy of intranasal MNLCs could be attributed to the direct nose-to-brain delivery and mucoadhesive that bypasses first-pass metabolism. Concurrently, molecular docking studies also confirmed the potential to bind rutin to the targets associated with PD, namely MAO-B and synuclein, which confirms the multi-targeted action of rutin in neuroprotection. Overall, MNLCs are identified as an effective, non-invasive strategy to overcome BBB barrier, systemic toxicity, and to target specific brain regions in PD patients. It is still recommended for extensive chronic toxicity, stability studies and clinical translation for effective utilization of these MNLCs.
Supplementary Materials
The following supporting information can be downloaded at the website of this paper posted on Preprints.org.
Funding
Sri Padmavathi MahilaVisvavidyalam, (SPMVV) Tirupati. India has issued liberal grants and facilities for the present research work. DST FIST and DST CURIE funds were received by Institute of Pharmaceutical Technology, SPMV V for all equipment used in this work.
Authors contributions
All authors contributed to the study conception and design. Poojitha Nalluri: data curation, validation methodology; project administration; software; writing original draft. Kavyasree Maravajjala; cell line studies and invitro cytotoxicity studies; review and editing. Prasanna S; supported in vivo studies. Sureshkumar R.V: supported animal handling and in in vivo studies. Vidyavathi Maruvajala: original concept designed, data curation and over all supervision.
Ethics approval
The in vivo studies were carried out in male albino Wistar rats(150-200g) after obtaining the permission from institutional animal ethics committee (IAEC) of the Sri Padmavathi MahilaVisvavidyalam, Tirupati, India, with their approval no CPCSEA/1677/SPMVV/IAEC/II-11. All national and institutional guidelines for the care and use of laboratory animals were followed.
Data availability
All data generated or analyzed in this study are included in this article (and its supplementary information files).
Acknowledgments
The authors are grateful to DBT FIST sanctioned to Institute of Pharmaceutical Technology and DBT BUILDER (level 1) , Govt. of India sanctioned to Sri Padmavati Mahila Visvavidyalayam, Tirupati, Andhra Pradesh, India for procurement of equipment used in the present study.
Conflicts of Interest
The authors declare that they have no competing interests.
References
- Gosselet F, Loiola RA, Roig A, Rosell A, Culot M. Central nervous system delivery of molecules across the blood-brain barrier. Neurochemistry International. 2021; 144:104952. [CrossRef]
- Jenner P, Jenner P. Oxidative stress as a cause of Parkinson’s disease. Acta Neurologica Scandinavica. 1991 ;84(S136):6-15. [CrossRef]
- Lee D, Minko T. Nanotherapeutics for nose-to-brain drug delivery: an approach to bypass the blood brain barrier. Pharmaceutics. 2021;13(12):2049. [CrossRef]
- Shah V, Sharma M, Parmar V, Upadhyay U. Formulation of sildenafil citrate loaded nasal microsphers: an in vitro, ex vivo characterization. International Journal of Drug Delivery. 2010 ;2(3).213-20. [CrossRef]
- Jug M, Becirevic-Lacan M. Screening of mucoadhesive microparticles containing hydroxypropyl-beta- cyclodextrin for the nasal delivery of risperidone. Combinatorial chemistry & high throughput screening. 2007;10(5):358-67. [CrossRef]
- Magalingam KB, Radhakrishnan AK, Haleagrahara N. Protective mechanisms of flavonoids in disease. Oxidative medicine and:314560 cellular longevity. 2015. [CrossRef]
- Miyake K, Arima H, Hirayama F, Yamamoto M, Horikawa T, Sumiyoshi H, Noda S, Uekama K. Improvement of solubility and oral bioavailability of rutin by complexation with 2-hydroxypropyl-β- cyclodextrin. Pharmaceutical development and technology. 2000 1;5(3):399-407. [CrossRef]
- Pattar SV, Adhoni Kamanavalli CM, Kumbar SS. In silico molecular docking studies and MM/GBSA analysis of coumarin-carbonodithioate hybrid derivatives divulge the anticancer potential against breast cancer. Beni-Suef University Journal of Basic and Applied Sciences. 2020 ; (1):1-10.SA, . [CrossRef]
- Khan SA, Rehman S, Nabi B, Iqubal A, Nehal N, Fahmy UA, Kotta S, BabootaS,Md S, Ali J. Boosting the brain delivery of Atazanavir through nanostructured lipid carrier-based approach for mitigating neuroaids. Pharmaceutics. 2020 6;12(11):1059. [CrossRef]
- Joshi AS, Patel HS, Belgamwar VS, Agrawal A, Tekade AR. Solid lipid nanoparticles ondansetron HCl for intranasal delivery: development, optimization and evaluation. Journal of Materials Science: Materials in Medicine.2012 ;23(9):2163-2175, . [CrossRef]
- Fangueiro JF, Andreani T, Egea MA, Garcia ML, Souto SB, Souto EB. Experimental factorial design applied to mucoadhesive lipid nanoparticles via multiple emulsion process. Colloids and surfaces B: Biointerfaces. 2012 ;100:84-9. [CrossRef]
- Cui F, Qian F, Yin C. Preparation and characterization of mucoadhesive polymer- coated nanoparticles. International journal of pharmaceutics. 2006 ;316(1-2):154-61. [CrossRef]
- Seju, U., A. Kumar, and K. K. Sawant. "Development and evaluation of olanzapine-loaded PLGA nanoparticles for nose-to-brain delivery. Actabiomaterialia 2011: 4169-76. [CrossRef]
- Maravajjala KS, Swetha KL, Sharma S, Padhye T, Roy A. Development of a size-tunable paclitaxel micelle using a microfluidic-based system and evaluation of its in-vitro efficacy and intracellular delivery. Journal of Drug Delivery Science and Technology. 2020 ;60:102041. [CrossRef]
- Bhosale U, Yegnanarayan R, Prachi P, Zambare M, Somani R.S. Study of CNS depressant and behavioral activity of an ethanol extract of Achyranthes Aspera (Chirchita) in mouse model.Annals of neurosciences. 2011 ;18(2):44-7. [CrossRef]
- Rozas G, López-Martın E, Guerra MJ, Labandeira-Garcıa JL. The overall rod performance test in the MPTP-treated-mouse model of Parkinsonism. Journal of neuroscience methods. 1998 ;83(2):165-75. [CrossRef]
- Kumar S, Ali J, Baboota S. Design Expert® supported optimization and predictive analysis selegiline nanoemulsion via the olfactory region with enhanced behavioural performance in ‘ ‘Parkinson’s disease. Nanotechnology. 2016 ;27(43):435101. [CrossRef]
- Jollow DJ, Mitchell JR, Zampaglione N, Gillette JR. Bromobenzene-induced liver necrosis. Protective role of glutathione and evidence for 3, 4-bromobenzene oxide as the hepatotoxic metabolite. Pharmacology. 1974;11(3):151-69. [CrossRef]
- Manikkoth S, Deepa B, Sequeira M, Joy AE, Rodrigue R. Assessment of brain dopamine levels to evaluate the role of tylophoraindicaethanolic extract on alcohol induced anxiety in Wistar albino rats. Journal of Young Pharmacists 2016;8(2):91-5. [CrossRef]
- Vollmer S, Strickson S, Zhang T, Gray N, Lee KL, Rao VR, Cohen P. The mechanism of activation of IRAK1 and IRAK4 by interleukin-1 and Toll-like receptor agonists. Biochemical Journal. 2017;474(12):2027-2038. [CrossRef]
- Abou Youssef NA, Kassem AA, Farid RM, Ismail FA, Magda Abd Elsamea EM, Boraie NA. A novel nasal almotriptan loaded solid lipid nanoparticles I mucoadhesive in situ gel formulation for brain targeting: preparation, characterization and in vivo evaluation. International journal of pharmaceutics. 2018 ;548(1):609-24. [CrossRef]
- Bnyan R, Khan I, Ehtezazi T, Saleem I, Gordon S, Neill F, Roberts M Surfactant effects on lipid-based vesicles properties. Journal of pharmaceutical sciences. 2018 ;107(5):1237-46. [CrossRef]
- Ghaderi S, Ghanbarzadeh S, Mohammadhassani Z, Hamishehkar H. Formulation of gammaoryzanol- loaded nanoparticles for potential application in fortifying food products. Advanced pharmaceutical bulletin. 2014 ;4(2):549-554. [CrossRef]
- Bhalekar M, Upadhaya P, Madgulkar A. Formulation and characterization of solid lipid nanoparticles for an anti-retroviral drug darunavir. Applied Nanoscience.2017 ;7(1):47-57. [CrossRef]
- Javed MN, Kohli K, Amin S. Risk assessment integrated QbD approach for development of optimized bicontinuous mucoadhesive limicubes for oral delivery of rosuvastatin. American Association of Pharmaceutical Scientists. 2018 ;19(3):1377-91. [CrossRef]
- Leong TS, Martin GJ, Ashokkumar M. Ultrasonic encapsulation–a review. Ultrasonics sonochemistry. 2017; 35:605-14. [CrossRef]
- Unnisa A, Chettupalli AK, Al Hagbani T, Khalid M, Jandrajupalli SB, Chandolu S, Hussain T. Development of Dapagliflozin Solid Lipid Nanoparticles as a Novel Carrier for Oral Delivery: Statistical Design, Optimization, In-Vitro and In-Vivo Characterization, and Evaluation. Pharmaceuticals. 2022;15(5):568. [CrossRef]
Figure 1.
Molecular Docking result of the a) 2D image and b)3D image of IRAK4 with Rutin.
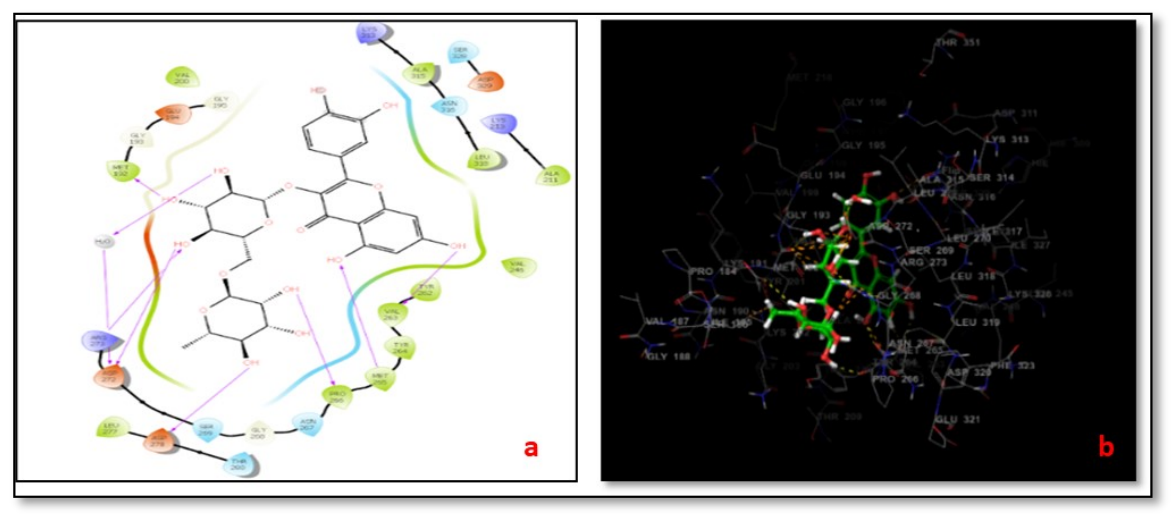
Figure 2.
3D Response surface plots showing the influence of independent variables on responses of a) Particle size, b) % Entrapment Efficiency c) % Drug release.
Figure 2.
3D Response surface plots showing the influence of independent variables on responses of a) Particle size, b) % Entrapment Efficiency c) % Drug release.
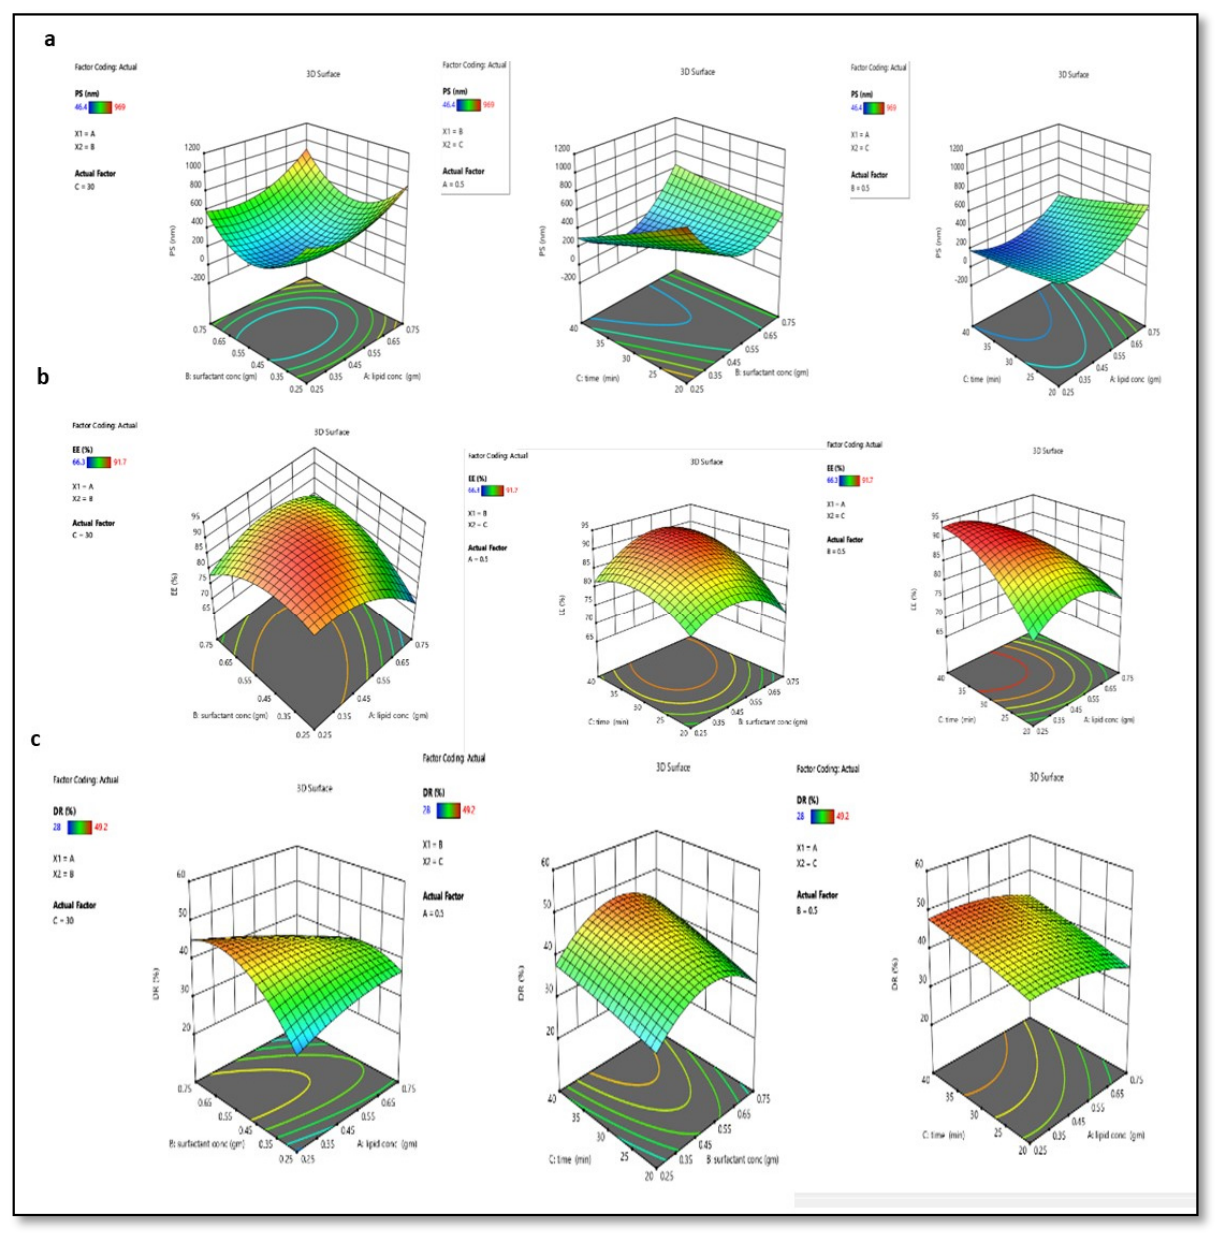
Figure 3.
Ramp solution analysis of optimized NLCs.
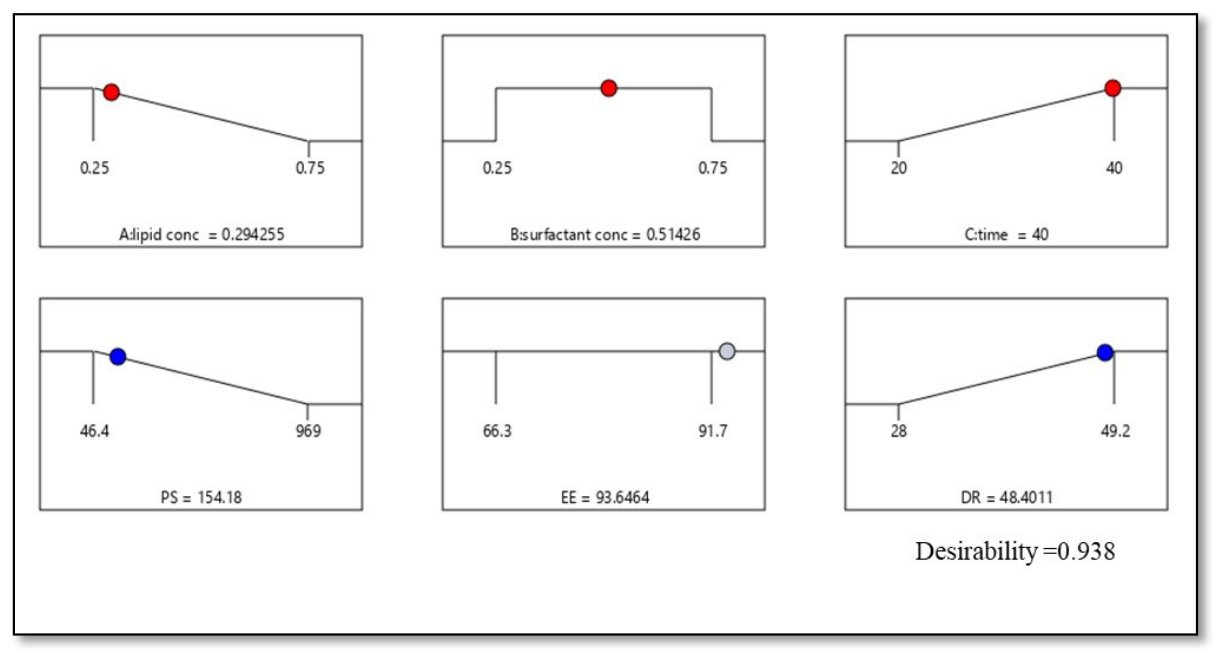
Figure 4.
Physicochemical characterization of NLC A) size distribution, B) zetapotential distribution of MNLCs C) In-vitro drug release profiles of MNLCs &ONLCs in release medium pH 7.4 over 48 h; mean± SD, n=3 and Surface morphology images D) ONLCs E) MNLCs.
Figure 4.
Physicochemical characterization of NLC A) size distribution, B) zetapotential distribution of MNLCs C) In-vitro drug release profiles of MNLCs &ONLCs in release medium pH 7.4 over 48 h; mean± SD, n=3 and Surface morphology images D) ONLCs E) MNLCs.
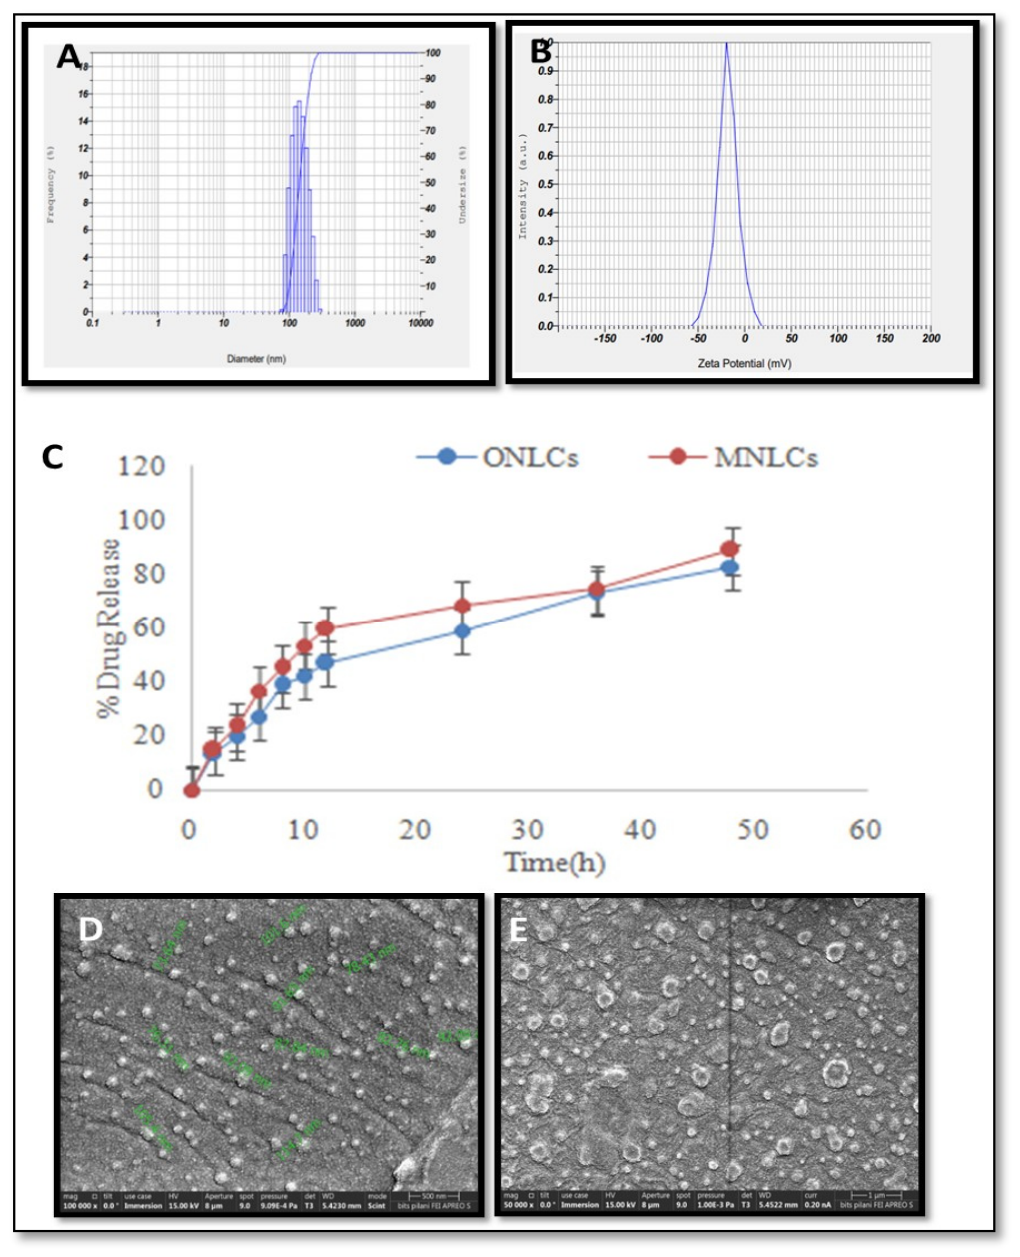
Figure 5.
DSC thermograms A) pure Rutin B) MNLCs and FTIR spectra of C) Pure Rutin D) MNLCs.
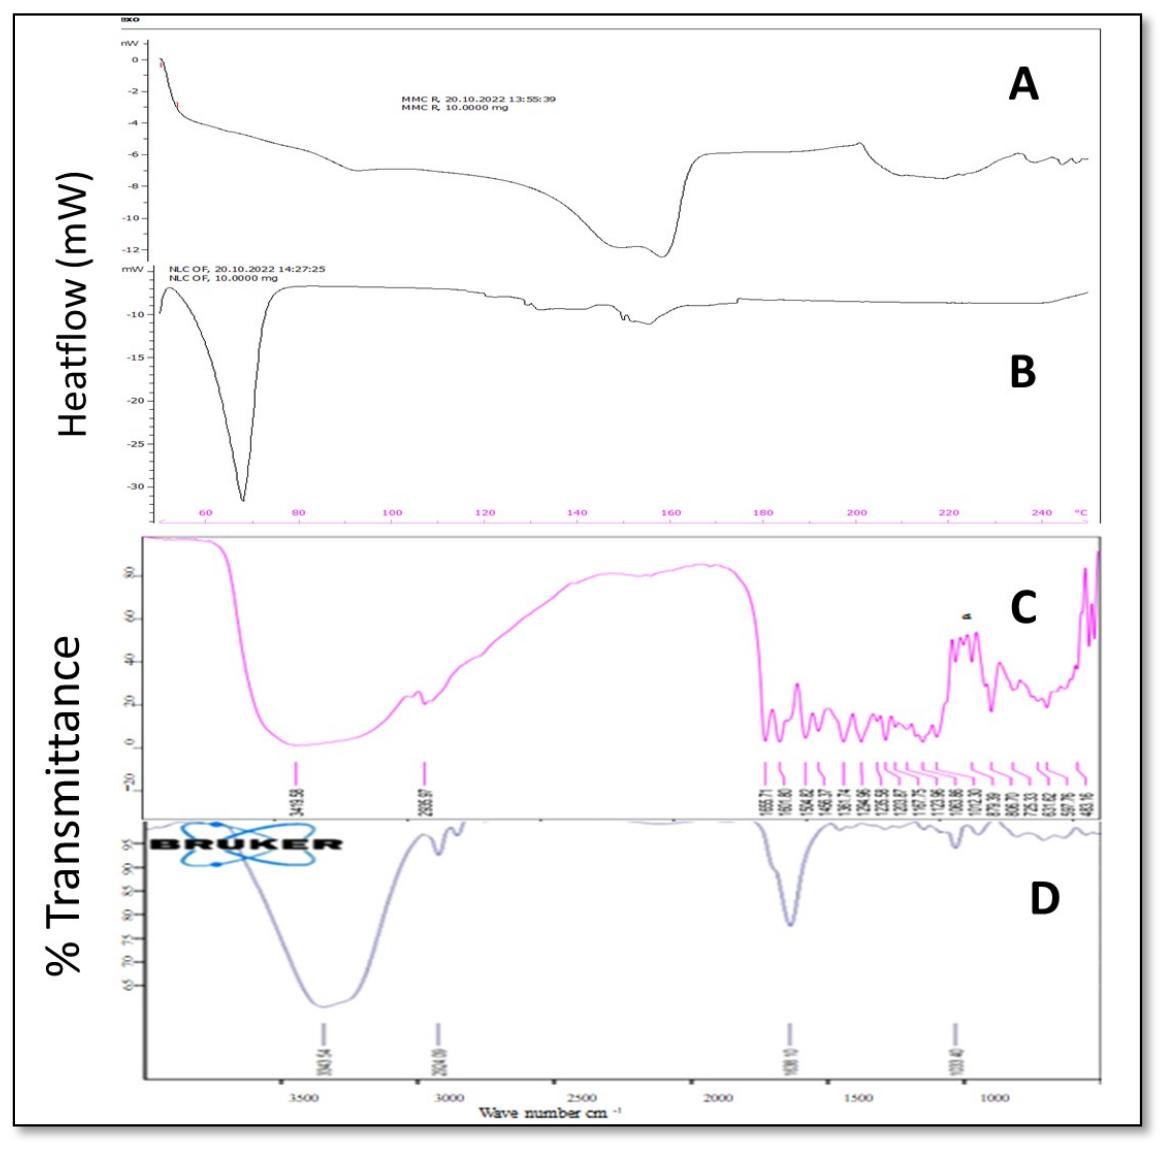
Figure 6.
XRD analysis of a) Pure Rutin b) MNLCs.
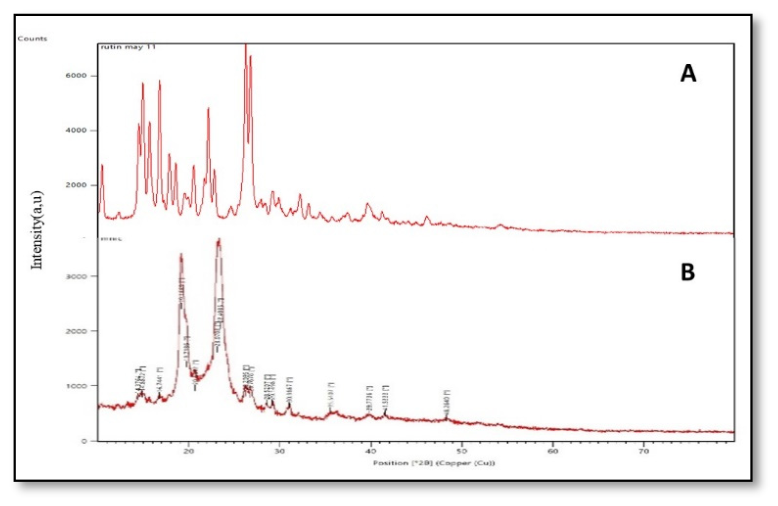
Figure 7.
A) Ex-vivo drug release profile from MNLCs, mean±SD, n=3, B) In vitro cytotoxicity of blank NLCs, MNLCs &free drug Values represent the mean ± SD (n = 3).
Figure 7.
A) Ex-vivo drug release profile from MNLCs, mean±SD, n=3, B) In vitro cytotoxicity of blank NLCs, MNLCs &free drug Values represent the mean ± SD (n = 3).
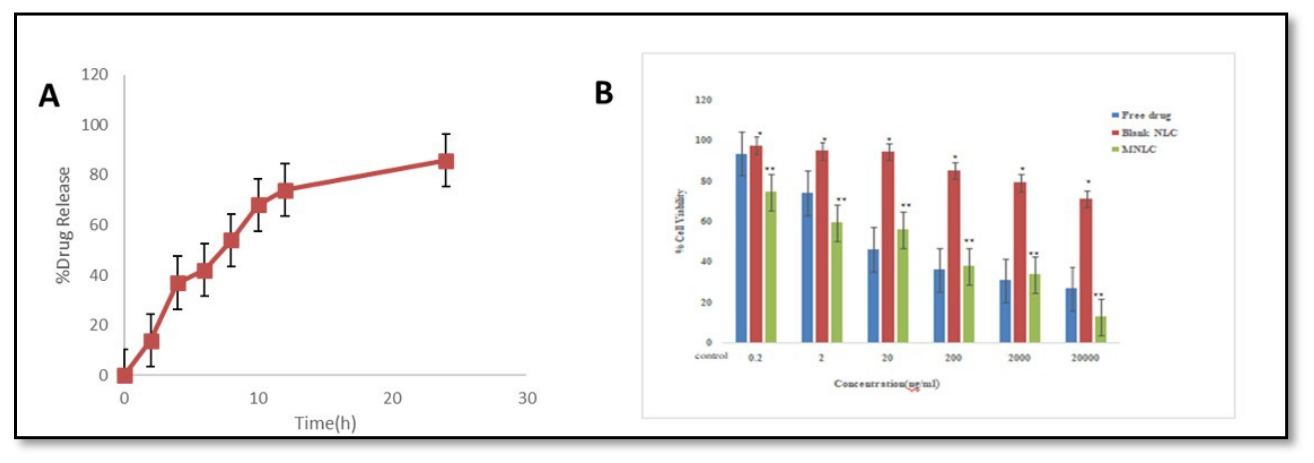
Figure 8.
Graph showing results of Behavioral studies on A) Locomotor activity B)muscular coordination (Rotenone induced rats (comparison between group II and other groups) Group I: treated with normal saline ; Group B: rotenone induced group (PD Model); Group C: Rotenone induced group treated with MNLCs intranasally; Group D: rotenone induced group treated with MNLCs orally; Group E: rotenone treated lesion group treated with oral syndopa).Results of Biochemical parameters in in vivo studies Effect of Rutin MNLCs formulation with different routes on C) TBARS level D) GSH level E) Dopamine levels (Comparison between group I and other groups).
Figure 8.
Graph showing results of Behavioral studies on A) Locomotor activity B)muscular coordination (Rotenone induced rats (comparison between group II and other groups) Group I: treated with normal saline ; Group B: rotenone induced group (PD Model); Group C: Rotenone induced group treated with MNLCs intranasally; Group D: rotenone induced group treated with MNLCs orally; Group E: rotenone treated lesion group treated with oral syndopa).Results of Biochemical parameters in in vivo studies Effect of Rutin MNLCs formulation with different routes on C) TBARS level D) GSH level E) Dopamine levels (Comparison between group I and other groups).
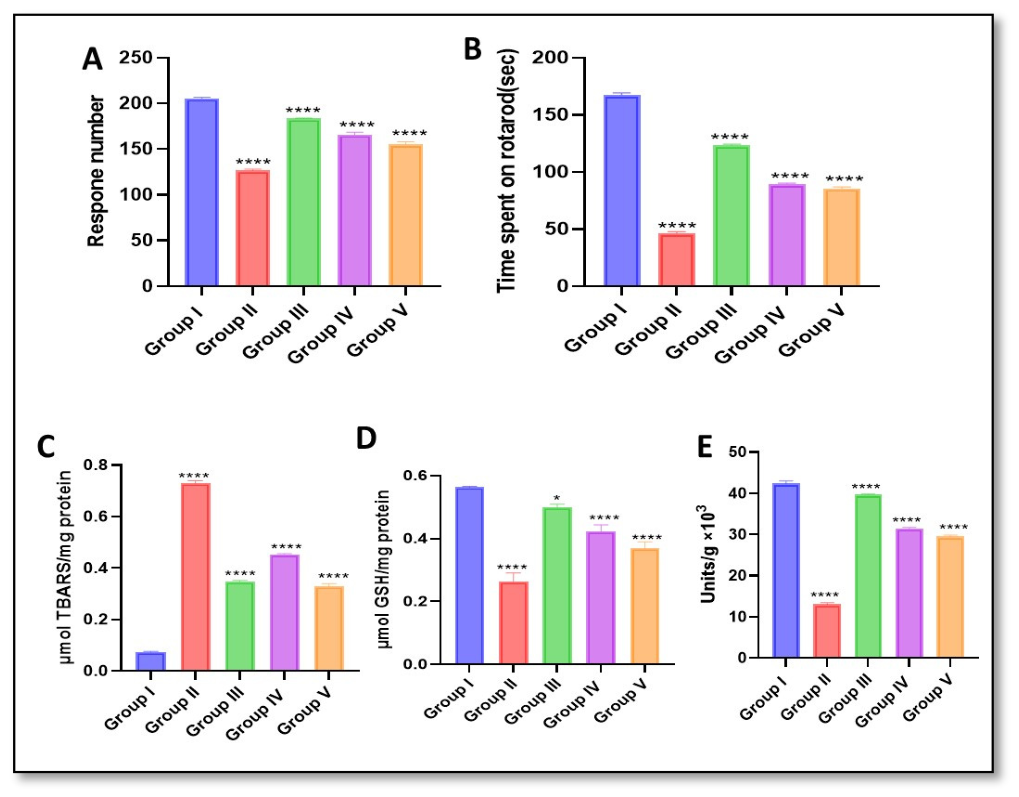
Figure 9.
The microscopic images demonstrate histopathological condition of rat brain(power(100x) magnification A) Normal control B) Disease control C) Test 1 treated with nasal route D) Test 2 treated with MNLCs oral route E) Standard treated with marketed formulation by oral route.
Figure 9.
The microscopic images demonstrate histopathological condition of rat brain(power(100x) magnification A) Normal control B) Disease control C) Test 1 treated with nasal route D) Test 2 treated with MNLCs oral route E) Standard treated with marketed formulation by oral route.
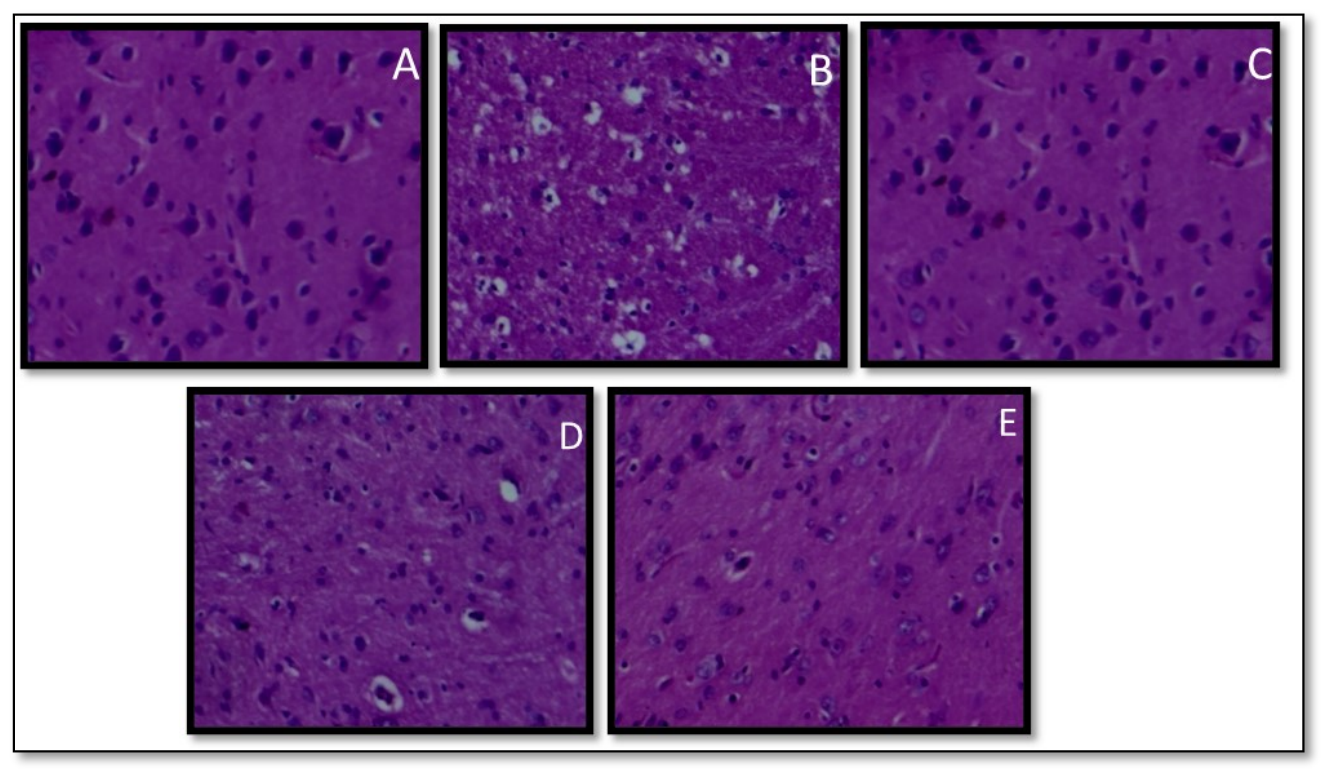

Table 1.
QTPP and CQA parameters for the development of NLC.
| QTPP parameter | Target | Justification |
| Dosage form | Colloidal drug delivery system | longer residence time for brain targeting and more capacity to escape the reticuloendothelial system. |
| Dosage design | NLC | NLC increases solubility, enhances bioavailability & therapeutic effect, and high drug loading capacity. |
| Administration route | Nasal route | Drug can directly reach the target site bypassing the first pass effect, and a low dose is applied when compared to other routes |
| CQA parameter | ||
| Particle size | Less than 250 nm | Particles with small size can easily penetrate brain capillaries for efficient accumulation at the target site. |
| % Entrapment Efficiency | >70% | To achieve maximum therapeutic efficacy |
| % Drug release | >60% | For the efficacy of treatment, it is a crucial parameter |
Table 2.
Docking Result analysis of Anti-Parkinson targets with Rutin.
| S. No | Protein name | PDB ID | Interacting amino acids | Docking Score KJ/mole |
| 1. | AKT1 | 4GV1 | GLU, LYS, ASP, GLY, ASN | -6.083 |
| 2. | C-ABI | 2E2B | GLU, SER, ASP, ARG, ILE | -7.016 |
| 3. | AADC | 3RCH | SER, HIE, ASP, LYS, TYR | -5.09 |
| 4. | APP | 6EJ2 | GLY, ASP, ILE | -4.776 |
| 5. | MAPK3 | 6GES | PRO, SER, ASN | -5.324 |
| 6. | IRAK4 | 6O94 | MET, PRO, ARG, ASP, VAL | -9.05 |
| 7. | ESRI | 7UJO | LYS, ASN, ASP | -5.906 |
Table 3.
Selection of independent and dependent Variables and their levels in Box-Behnken Design.
| Variables | Levels | ||
| Low (-1) | Medium (0) | High (+1) | |
| A: Lipid concentration (g) | 0.25 | 0.5 | 0.75 |
| B: surfactant concentration (g) | 0.25 | 0.5 | 0.75 |
| C: Sonication time (min) | 20 | 30 | 40 |
| Dependent variables | Goals | ||
| Particle Size – PS (nm)(Y1) | Minimize | ||
| Entrapment Efficiency – EE (%) (Y2) | Maximize | ||
| Drug Release (%) –DR (%) (Y3) | Maximize | ||
Table 4.
Formulation composition and effect of independent process variables on dependent variables.
Table 4.
Formulation composition and effect of independent process variables on dependent variables.
| Formulation code | A: lipid conc(g) | B: surfactant conc (g) | C: time (min) |
Y1: P.S. (nm) Mean ±S. D |
Y2: EE (%) Mean±S.D |
Y3: DR (%) Mean±S.D |
| RNLC 1 | 0.5 | 0.5 | 30 | 197.6±18.8 | 91.7±2.4 | 43.3±0.43 |
| RNLC 2 | 0.75 | 0.25 | 30 | 847.7±26.8 | 66.3±1.58 | 36.8±1.62 |
| RNLC 3 | 0.5 | 0.5 | 30 | 46.4±9.3 | 90.8±0.01 | 48±0.35 |
| RNLC 4 | 0.5 | 0.25 | 20 | 858.2±27.8 | 78±1.20 | 33.7±0.04 |
| RNLC 5 | 0.75 | 0.75 | 30 | 969.2±29.7 | 80.2±2.2 | 28±0.50 |
| RNLC 6 | 0.75 | 0.5 | 40 | 242.7±80.1 | 75± 1.72 | 44.5±0.42 |
| RNLC 7 | 0.25 | 0.5 | 40 | 113.7± 8.5 | 91.4±1.49 | 49.2±1.29 |
| RNLC 8 | 0.5 | 0.5 | 30 | 255.8±71.4 | 89.7±2.5 | 40±0.04 |
| RNLC 9 | 0.5 | 0.75 | 20 | 378.2±12.3 | 70.6±1.24 | 35.5±0.19 |
| RNLC 10 | 0.5 | 0.5 | 30 | 236.7±61.8 | 90.7±1.15 | 47.5±0.35 |
| RNLC11 | 0.25 | 0.25 | 30 | 612.4±17.5 | 87.5±0.40 | 30.6±0.35 |
| RNLC 12 | 0.5 | 0.5 | 30 | 299.9±73 | 88±0.25 | 42.7±0.04 |
| RNLC 13 | 0.75 | 0.5 | 20 | 745.6±49.4 | 77.5±0.25 | 34.2±0.19 |
| RNLC 14 | 0.25 | 0.75 | 30 | 605.0±55.6 | 80.3±1.6 | 45±0.20 |
| RNLC 15 | 0.5 | 0.25 | 40 | 443.8±72.6 | 84±0.45 | 36.3±1.62 |
| RNLC 16 | 0.5 | 0.75 | 40 | 706.9±66.1 | 87.5±0.64 | 41±1.57 |
| RNLC 17 | 0.25 | 0.5 | 20 | 484.2±45 | 76±0.2 | 39.7±0.04 |
| ONLCs | 0.294 | 0.514 | 40 | 145.7 ±57.5 | 90.4±0.35 | 51.5±1.37 |
| MNLCs | 0.294 | 0.514 | 40 | 150.8± 47.25 | 92.4±1.42 | 59.02±2.5 |
Disclaimer/Publisher’s Note: The statements, opinions and data contained in all publications are solely those of the individual author(s) and contributor(s) and not of MDPI and/or the editor(s). MDPI and/or the editor(s) disclaim responsibility for any injury to people or property resulting from any ideas, methods, instructions or products referred to in the content. |
© 2026 by the authors. Licensee MDPI, Basel, Switzerland. This article is an open access article distributed under the terms and conditions of the Creative Commons Attribution (CC BY) license (http://creativecommons.org/licenses/by/4.0/).
Copyright: This open access article is published under a Creative Commons CC BY 4.0 license, which permit the free download, distribution, and reuse, provided that the author and preprint are cited in any reuse.