

Submitted:
25 July 2026
Posted:
27 July 2026
You are already at the latest version
Abstract
Disproportionality analysis of spontaneous reporting systems is usually used to identify positive signals, meaning drug–event pairs reported more often than expected. The same statistical structure also has a lower-reporting side. A reporting odds ratio (ROR) above unity indicates higher-than-expected reporting, whereas an ROR below unity indicates lower-than-expected reporting. Neither result directly estimates incidence, absolute risk, or causality. Existing critiques of inverse disproportionality signals rightly warn against interpreting ROR < 1 as protection, risk reduction, a beneficial reaction, or therapeutic effect. The same caution applies to ROR > 1. Higher-than-expected reporting is not, by itself, causal evidence of harm. This narrative methodological review argues that positive and inverse disproportionality signals should be interpreted according to the same scientific principles. This does not imply symmetric regulatory action thresholds. In this review, “symmetric scientific standards” means that claims of the same strength require commensurate evidence in both directions; it does not mean identical case-level information, bias mechanisms, detectability, predictive value, regulatory priority, or follow-up procedures. Instead, it calls for interpretation that is consistent with the strength of the claim. To make this approach practical, the review outlines a symmetry check that asks whether critiques of inverse signals also apply to positive signals and whether they address descriptive reporting or causal interpretation. It also proposes a claim-strength framework in which the required evidence depends on the claim being made, not on the direction of the signal. Under this approach, inverse signals may be reported as lower-than-expected reporting. They may also support hypothesis generation or candidate prioritization for follow-up evaluation when robust to comparator and sensitivity analyses. Claims of protection or risk reduction require external validation.
Keywords:
pharmacovigilance
; disproportionality analysis
; inverse disproportionality signal
; lower-than-expected reporting
; reporting odds ratio
; claim-strength framework
; drug repurposing
; FDA Adverse Event Monitoring System (AEMS)/FDA Adverse Event Reporting System (FAERS)
; Japanese Adverse Drug Event Report database (JADER)
; VigiBase
1. Introduction
Disproportionality analysis of spontaneous reporting systems has become a central tool in pharmacovigilance [1,2,3]. Databases based on individual case safety reports, such as the FDA Adverse Event Monitoring System (AEMS; formerly the FDA Adverse Event Reporting System [FAERS]) [4], EudraVigilance [5], VigiBase [6], and national systems such as the Japanese Adverse Drug Event Report database (JADER) [7], are routinely used to identify drug–event pairs reported more frequently than expected against a chosen background. Measures such as the reporting odds ratio (ROR), proportional reporting ratio (PRR), information component (IC), and empirical Bayes geometric mean (EBGM) have therefore been developed and used mainly to detect positive signals, or potential safety concerns represented by higher-than-expected reporting of adverse events [1,2,3].
This positive-signal orientation is historically and practically understandable. Spontaneous reporting systems were created to support post-marketing safety surveillance, and regulatory signal management has traditionally focused on emerging or insufficiently characterized harms. A statistical disproportionality signal, however, does not directly indicate causation, incidence, or risk. Regulatory and methodological guidance consistently emphasizes that spontaneous reports lack reliable denominators, complete non-event information, and controlled exposure populations. For that reason, these reports cannot directly establish occurrence rates or causal effects [4,8,9]. These limitations are basic to the interpretation of all disproportionality analyses, regardless of signal direction.
However, the mathematical structure of disproportionality analysis is bidirectional. An ROR above unity indicates that the target event is reported more frequently among reports involving the drug of interest than among reference reports. An ROR below unity indicates that the target event is reported less frequently. The latter is not a methodological anomaly. It is the lower-reporting side of the same contrast. In this sense, positive and inverse disproportionality signals are formally symmetric as associations between reported drug exposure and reported events. Both represent reporting patterns. Neither represents incidence, absolute risk, or causality.
Despite this formal symmetry, inverse disproportionality signals have received less systematic methodological attention. When ROR < 1 is discussed, it is often accompanied by warnings against interpreting lower-than-expected reporting as protection, risk reduction, or beneficial drug effects. Such caution is appropriate. A statistically significant inverse disproportionality signal does not show that a drug prevents an event, lowers the true occurrence of a condition, or produces therapeutic benefit. READUS-PV explicitly discourages interpreting inverse disproportionality, or lower-than-expected reporting, as a protective drug-related effect [9]. Khouri et al. similarly warned against interpreting RORs below unity, or inverse disproportionality findings, as inverse causality or potential protective effects [10]. Related commentaries have cautioned against equating lower-than-expected reporting with risk reduction, fewer reported events with beneficial reactions, or spontaneous-reporting patterns with protective drug–drug interactions [11,12,13]. The methodological question is whether these cautions justify categorical dismissal of inverse signals or instead call for more precise language and proportionate validation requirements.
The warning that ROR < 1 should not be interpreted as protection is structurally analogous to the warning that ROR > 1 should not be interpreted as harm. Lower-than-expected reporting does not establish risk reduction, and higher-than-expected reporting does not establish risk increase. An inverse disproportionality finding is not a beneficial reaction, just as a positive disproportionality finding is not, by itself, an adverse drug reaction. The absence of denominators, reporting bias, comparator dependence, confounding by indication, and causal non-identifiability are not limitations unique to inverse signals. They apply to positive signals as well [4,8,9]. These limitations therefore do not justify accepting positive disproportionality for hypothesis generation while rejecting inverse disproportionality for the same purpose.
This narrative methodological review argues that positive and inverse disproportionality signals should be interpreted under symmetric scientific standards. Here, “symmetric scientific standards” means that claims of the same strength require commensurate evidence in both directions, while the analyses used to address bias may differ by direction. It does not imply equal case-level information, marginal frequency, detectability, prior probability, positive predictive value, regulatory priority, or follow-up procedures. It first describes the bidirectional structure of disproportionality analysis, examines common conceptual conflations regarding inverse signals, identifies the scope of existing critiques, and analyzes the inferential limits shared by both signal directions. It then proposes a concise symmetry check and a claim-strength framework for calibrating evidential requirements to the strength of the claim. The specific contribution is the integration of shared inferential limits, direction-specific artefacts, an operational symmetry check, and a claim-strength framework into one reporting and evaluation scheme. Finally, it reviews empirical precedents and discusses implications for reporting guidelines and practice.
This focused narrative methodological review used iterative, targeted identification of foundational methods, reporting guidance, published critiques, bias-methodology studies, and empirical inverse-signal examples, supplemented by citation tracking. It was not designed as a systematic review and does not estimate prevalence, yield, or predictive value. Within this defined scope, the review aims to provide a balanced and critical synthesis of supportive and critical perspectives.
The asymmetric treatment of inverse signals reflects, in part, the legitimate historical orientation of pharmacovigilance toward early detection of serious harms. The argument in this review concerns the scientific interpretation of descriptive patterns, not regulatory action thresholds. The regulatory implications of this distinction are discussed in Section 10.
2. Disproportionality Analysis Is Intrinsically Bidirectional
Disproportionality analysis is commonly presented as a method for detecting drug–event combinations that are reported more frequently than expected in spontaneous reporting systems. In practice, this usually means identifying drug–adverse event pairs for which the ROR, PRR, IC, EBGM, or related measure exceeds a predefined threshold [1,2,3]. This conventional use has contributed to the perception that disproportionality analysis is primarily concerned with positive signals. However, the underlying statistical structure of disproportionality analysis is not one-directional. It is intrinsically bidirectional.
In a standard case–non-case disproportionality analysis, reports are cross-classified according to whether they include the drug of interest and whether they include the target event. This produces a 2 × 2 table and the ROR formula shown in
Figure 1.
Bidirectional structure of disproportionality analysis. ROR > 1 indicates higher-than-expected reporting, whereas ROR < 1 indicates lower-than-expected reporting. Both directions are reporting associations rather than incidence or causal effects. Abbreviation: ROR, reporting odds ratio.
Figure 1.
Bidirectional structure of disproportionality analysis. ROR > 1 indicates higher-than-expected reporting, whereas ROR < 1 indicates lower-than-expected reporting. Both directions are reporting associations rather than incidence or causal effects. Abbreviation: ROR, reporting odds ratio.
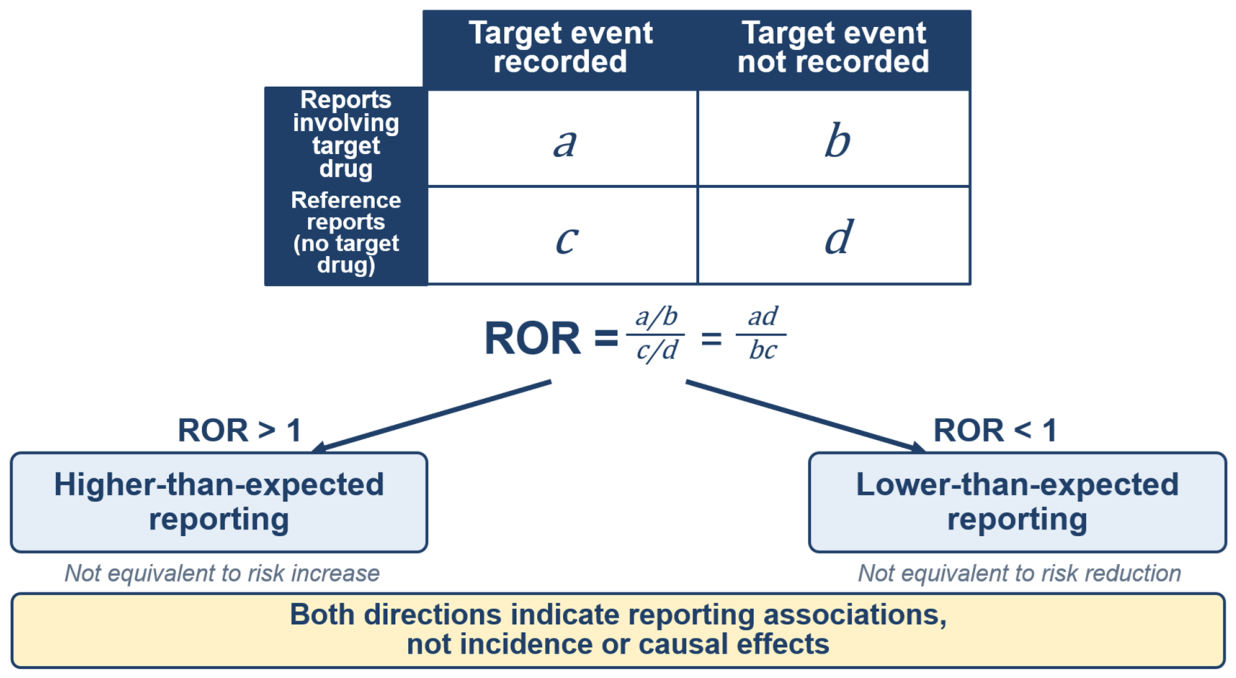
The ROR compares the odds of reporting the target event among reports involving the drug of interest with the odds of reporting the same event among reference reports. When ROR > 1, the target event is reported more frequently, in relative odds terms, among reports involving the drug of interest than among reports not involving that drug. When ROR < 1, the target event is reported less frequently, again in relative odds terms, among reports involving the drug of interest than among reference reports.
Thus, ROR > 1 and ROR < 1 are not different types of statistical entities. They are opposite directions of the same measure. ROR > 1 indicates relative overrepresentation of the target event in reports involving the drug of interest. ROR < 1 indicates relative underrepresentation of the target event in those reports. Both are reporting associations derived from the same 2 × 2 structure. Neither direction is mathematically privileged over the other. This algebraic statement does not imply equal marginal frequency, finite-sample detectability, or operating characteristics in broad screening.
Inverse disproportionality is sometimes implicitly treated as if it were inference from absence. Such a characterization is imprecise. An inverse disproportionality signal is not based merely on the absence of reports. It is based on an observed contrast between two reporting distributions. Specifically, it indicates that the target event occupies a smaller proportion, or lower reporting odds, within reports involving the drug of interest than within the reference set. In the same way, a positive disproportionality signal is not based merely on the presence of reports. It indicates that the target event occupies a larger proportion, or higher reporting odds, within reports involving the drug of interest than within the reference set.
Crucially, neither direction directly estimates incidence, absolute risk, or causality. The cells in the 2 × 2 table are counts of reports, not counts of exposed and unexposed individuals in a defined source population. Cell a does not represent all exposed individuals who developed the target event. It represents reports in which both the drug and the event were recorded. Cell b does not represent exposed individuals who remained event-free. It represents reports involving the drug in which the target event was not recorded. Similarly, cells c and d are reports in the reference set, not a complete enumeration of unexposed persons with and without the event [3,4,8,9].
Therefore, ROR > 1 should be interpreted as higher-than-expected reporting, not as increased incidence or causal harm. Likewise, ROR < 1 should be interpreted as lower-than-expected reporting, not as reduced incidence or causal protection. The inferential boundary is the same in both directions. A positive signal may generate a hypothesis about a potential harmful effect, but it does not prove that effect. An inverse signal may generate a hypothesis about a potential suppressive, protective, or disease-modifying effect, but it does not prove that effect either.
These disproportionality measures differ in their treatment of sparse cell counts. Frequentist measures such as the ROR and PRR provide point estimates and confidence intervals without Bayesian shrinkage, whereas Bayesian measures such as the Information Component and EBGM incorporate prior structures that shrink estimates toward the null when the available information is limited [14,15]. The implications of this distinction for inverse signals are discussed in Section 6.
3. Conceptual Issues in Interpreting Inverse Disproportionality Signals
The following subsections summarize six interpretive issues that can arise when interpreting inverse disproportionality signals. Some are explicitly addressed in regulatory guidance, reporting guidelines, or methodological commentaries; others are analytic distinctions developed in this review to clarify how ROR < 1 should be evaluated relative to ROR > 1. The purpose is not to claim that all of these issues have been stated verbatim in the literature, but to identify recurring ways in which reporting associations may be conflated with incidence, causality, or clinical benefit/harm.
Figure 2 summarizes these issues and the corresponding more precise interpretations. The central problem is that a descriptive reporting association may be interpreted as if it were an incidence estimate, a causal effect, or a clinical benefit/harm statement.
3.1. Absence Versus Relative Underrepresentation
A first potential conflation is to treat ROR < 1 as mere absence of evidence. This is not a claim that is usually formulated in these exact terms in the literature. Rather, it reflects how inverse signals may be informally perceived. In a case–non-case design, however, disproportionality is based on a contrast between reporting distributions, not on the simple presence or absence of reports. Case–non-case studies compare reports involving the event of interest with other reports and present results as RORs, thereby identifying relative reporting disproportionality rather than absence or presence alone [3].
Thus, ROR < 1 indicates that the target event is relatively underrepresented among reports involving the drug of interest compared with the chosen reference set. By analogy, ROR > 1 is not mere presence; it is relative overrepresentation. If ROR < 1 is framed as "nothing was observed," inverse signals appear intrinsically uninformative. But the observation is not nothing; it is a difference in the distribution of reported events. The relevant question is what explains that distributional contrast.
3.2. Reporting Versus Incidence
A second conflation is to interpret lower-than-expected reporting as lower incidence. This conflation is explicitly inconsistent with the limitations of spontaneous reporting systems. Spontaneous reporting systems lack systematic information on exposed populations, observation time, and non-events. FDA states that FAERS reports do not establish causation and cannot be used to estimate incidence rates; reports may be duplicate, incomplete, unverified, and influenced by multiple reporting factors [4]. READUS-PV similarly emphasizes that disproportionality analyses should not be interpreted as incidence or risk estimates [8,9].
These limitations apply equally to ROR > 1 and ROR < 1. Higher-than-expected reporting is not higher incidence, and lower-than-expected reporting is not lower incidence. The reporting–incidence distinction is therefore a fundamental property of disproportionality analysis, not a direction-specific issue. Confusing this distinction is a major source of asymmetric criticism of inverse signals, because the same logical error would equally undermine positive signals.
3.3. Protection Versus Lower-Than-Expected Reporting
A third conflation, explicitly criticized in the literature, is to interpret ROR < 1 as evidence of protection or therapeutic benefit. READUS-PV [9] and Khouri et al. [10] explicitly warn against interpreting inverse disproportionality as a protective drug-related effect. Raschi and colleagues similarly cautioned against concluding risk reduction from lower-than-expected reporting and against labeling reduced events as "beneficial reactions" [11,12]. Antonazzo et al. warned against inferring protective drug–drug interactions from spontaneous reporting systems alone [13]. Cutroneo et al. also identified protective interpretation of negative disproportionality as a potentially misleading practice [16].
The methodological warning is therefore explicit: an inverse disproportionality signal cannot, by itself, demonstrate protection. However, this warning addresses the causal label, not the descriptive observation. It does not prohibit reporting that the target event is observed less frequently among reports involving the drug of interest than among reference reports. It restricts the inferential statement that may be attached to that observation. Reframing ROR < 1 as lower-than-expected reporting, rather than as protection, is consistent with these critiques.
3.4. Case Review Differs by Signal Direction
A fourth possible source of asymmetry concerns case review. Positive signals often allow review of a-cell reports, in which both the drug and target event are recorded. Such review can support clinical contextualization by examining time-to-onset, dechallenge, rechallenge, co-medications, comorbidities, and other case-level information [17]. READUS-PV emphasizes the importance of contextualizing disproportionality results and reporting case-by-case analyses when performed [9]. However, the usefulness of a-cell review as a post-detection evaluation tool should not be conflated with mathematical superiority of ROR > 1 over ROR < 1.
In inverse signals, the evaluation focus differs. One cannot review "prevented cases" in the same way. Instead, one should examine the composition of drug-related reports, the nature of non-target-event reports, comparator choice, reporting pathways, co-reported drugs, and whether exposure and outcome reporting populations overlap. This difference may provide richer within-database clinical context for positive signals, but it does not convert positive disproportionality into an incidence or causal estimate, nor does it invalidate an inverse reporting contrast as a descriptive pattern. Accordingly, the inability to review individual prevented cases limits within-database clinical contextualization, but it does not preclude Level 2 hypothesis generation, which remains contingent on estimability, assessment of direction-specific artefacts, and external testing.
3.5. Why Prevented Cases Cannot Be Reviewed Directly
A fifth objection is that an individual “prevented case” cannot be observed directly. This is true, but it is not unique to inverse disproportionality. In causal inference, individual-level counterfactual outcomes are generally unobservable; causal effects are inferred from contrasts between potential outcomes, not from direct observation of both outcomes in the same individual. Holland's classic formulation of causal inference makes this point explicit [18].
The specific limitation of spontaneous reporting systems is not counterfactual non-observability per se, but the absence of defined exposed and unexposed populations required to estimate incidence contrasts. Randomized trials and cohort studies do not directly observe individuals who were "protected" by treatment. They infer prevention from group-level contrasts. Spontaneous reporting systems cannot construct such contrasts directly because they do not systematically capture exposed non-cases, unexposed comparison groups, and observation time.
3.6. The Same Claim Standard, with Direction-Specific Checks
A final issue is whether inverse signals should be subject to a checklist that is more stringent than the one applied to positive signals. We did not identify guidance that justifies such a direction-specific evidential burden. On the contrary, READUS-PV is framed as a reporting guideline for disproportionality analyses using individual case safety reports in general, not as a one-directional standard [8,9].
Many items often proposed for inverse signals—cell counts, reference group transparency, duplicate handling, role restriction, stratification, multiplicity control, sparse-data assessment, and external validation—are equally required for positive signals [8,9]. What is needed is not an inverse-specific checklist but a bidirectional evaluation framework. The claim-strength standard should be the same; the prioritized alternative explanations and sensitivity analyses may differ by direction.
4. What Existing Critiques Do and Do Not Refute
Existing critiques of inverse signals should be read carefully. Their central target is usually not ROR < 1 as descriptive lower-than-expected reporting, but causal labeling of ROR < 1 as protection, risk reduction, beneficial reaction, or inverse causality.
Khouri et al. criticized the interpretation of RORs below unity as inverse causality or protective effects in a FAERS-based repurposing study involving weight loss-inducing medications and multiple sclerosis [10]. Their recommendation that inverse disproportionality be described as lower-than-expected reporting is methodologically sound. They also cautioned against treating drugs as therapeutic candidates on the sole basis of an inverse association when bias, confounding control, and robustness analyses are under-specified. However, this critique does not invalidate inverse disproportionality as a reporting pattern; it limits the causal language that can be attached to it.
The scope of these critiques is therefore limited and important. They primarily refute causal labeling and premature therapeutic candidacy, not transparent descriptive reporting. Table 1 summarizes selected critiques and the symmetric implications proposed in this review.
5. Symmetric Inferential Limits of Positive and Inverse Signals
The major inferential limitations of spontaneous reporting systems apply symmetrically to positive and inverse disproportionality signals. The absence of exposure denominators, incomplete non-event information, reporting bias, comparator dependence, confounding, and causal non-identifiability do not selectively invalidate ROR < 1. They define the interpretive boundaries of disproportionality analysis as a whole [4,8,9,19,20,21,22].
These shared limitations constrain causal interpretation in both directions and, by themselves, do not justify accepting positive SDRs while categorically rejecting inverse SDRs at the same descriptive or hypothesis-generating level.

Table 2.
Symmetric inferential limits of positive and inverse signals. Most limitations invoked against inverse signals apply equally to positive signals.
Table 2.
Symmetric inferential limits of positive and inverse signals. Most limitations invoked against inverse signals apply equally to positive signals.
| Issue | ROR > 1 | ROR < 1 |
|---|---|---|
| Directly indicates | Higher-than-expected reporting | Lower-than-expected reporting |
| Does not indicate | Risk increase | Risk reduction |
| Causality | Not established | Not established |
| Denominator | Absent | Absent |
| Non-events | Incomplete or absent | Incomplete or absent |
| Reporting bias | Present | Present |
| Comparator dependence | Present | Present |
| Confounding | Present | Present |
| Hypothesis generation | Possible | Possible |
| External validation | Required for stronger claims | Required for stronger claims |
Abbreviation: ROR, reporting odds ratio.
This does not mean that all signals are equally informative, or that the two directions have identical prior probabilities, positive predictive values, or operational priorities. It means that their evidential limits arise from the data structure and the strength of interpretation, regardless of whether the ROR lies above or below unity.
6. Direction-Specific Manifestations, Not Direction-Specific Standards
Symmetric interpretive standards do not imply that positive and inverse signals have identical alternative explanations. The same broad categories of bias and confounding may manifest differently depending on signal direction. What differs by direction is not the evidential standard, but the typical form in which alternative explanations appear.
For positive signals, reporting-composition bias may appear as overrepresentation of known adverse events or stimulated reporting after regulatory alerts [19]. For inverse signals, the analogous phenomenon may appear as compositional dilution. In that situation, reports involving the drug are dominated by other event categories and the target event becomes relatively underrepresented. Positive signals may be shaped by reporting-pathway convergence, whereas inverse signals may be shaped by reporting-pathway separation. Positive signals may reflect high-risk population enrichment, whereas inverse signals may reflect exposure–outcome population non-overlap. Comparator dependence, masking, competition bias, and causal mislabeling can operate in both directions [20,21,22]. For inverse signals, masking and competition may themselves generate apparent lower-than-expected reporting and should therefore be examined before a finding is used for Level 2 or Level 3 purposes. More generally, a finding that is not robust to prespecified alternative specifications—for example, comparator, event-definition, drug-role, sparse-cell, metric, and sensitivity analyses—should not advance beyond Level 1 descriptive reporting on the basis of disproportionality analysis alone; for inverse findings, masking and competition are particularly important to examine.
Table 3.
Direction-specific manifestations of common biases. Direction-specific manifestations require direction-aware evaluation, not direction-specific evidential standards.
Table 3.
Direction-specific manifestations of common biases. Direction-specific manifestations require direction-aware evaluation, not direction-specific evidential standards.
| Common underlying principle | Positive-direction manifestation | Inverse-direction manifestation |
|---|---|---|
| Reporting-composition bias | Known adverse-event overrepresentation / compositional concentration | Compositional dilution |
| Reporting-pathway bias | Reporting-pathway convergence / stimulated reporting | Reporting-pathway separation |
| Population structure | High-risk population enrichment | Exposure–outcome population non-overlap |
| Indication structure | Confounding by indication | Channeling or selective avoidance in the treated population |
| Comparator dependence | Amplification of ROR > 1 | Generation or attenuation of ROR < 1 |
| Competition / masking | Missed or delayed positive signal | Apparent lower-than-expected reporting of the target event |
| Causal mislabeling | Jump to harmful effect | Jump to protective effect |
| Database ascertainment and reporting context | Events or drug classes subject to stronger reporting obligations, surveillance intensity, publicity, or seriousness-based attention may show amplified positive disproportionality. | Apparent ROR < 1 may reflect differential under-ascertainment across drugs, event classes, reporter types, regions, or reporting pathways rather than biologically meaningful under-representation. Uniform under-capture mainly reduces precision and should not be interpreted as evidence of reduced risk. |
Abbreviation: ROR, reporting odds ratio.
Thus, inverse disproportionality should not be granted privileged credibility. It also should not be held to uniquely punitive standards. Both directions require transparent reporting, sensitivity analyses, contextual interpretation, and external validation when stronger claims are made.
6.1. Bayesian Shrinkage and Direction-Aware Interpretation
A further methodological consideration concerns Bayesian disproportionality measures such as the Information Component and EBGM. These methods incorporate shrinkage toward the null when the available information is limited [14,15]. This shrinkage is the mechanism by which Bayesian methods stabilize estimates in sparse spontaneous-reporting data. Low-information deviations, whether positive or inverse, are pulled toward the null rather than treated as fully reliable evidence of disproportionality. This behavior should therefore be understood as a conservative feature of the chosen model, prior structure, and screening rule, not as a limitation unique to inverse disproportionality.
Bayesian disproportionality measures are not logically restricted to positive signals. On the relative-reporting or log-disproportionality scale, positive and inverse deviations share the same null value and can be evaluated as opposite tails of the same reporting contrast. Thus, inverse signals can, in principle, be assessed using prespecified lower-tail criteria. Examples include an upper confidence bound for the ROR below 1, an upper credibility bound for the IC below 0, or an upper credibility bound for the EBGM below 1. Stronger inverse criteria, such as EB95 < 0.5, may be considered as log-scale counterparts to stronger positive thresholds such as EB05 > 2. These lower-tail criteria should be presented as prespecified analytic rules rather than established regulatory standards unless externally validated for that purpose. However, the practical screening rules commonly used for Bayesian signal detection have historically been calibrated primarily for excess-reporting detection. Inverse-signal use therefore requires explicit redefinition of the lower-tail criterion, including the required level of expected information, the interval criterion, and the treatment of sparse cells. Sparse cells and zero observed counts affect the precision and stability of finite-sample estimates. A zero count may be informative when the expected count is sufficiently large, but weakly informative when the expected count is small. Such finite-sample issues do not make lower-tail deviations less meaningful than upper-tail deviations by nature. Observed algorithmic asymmetry should therefore be reported as a feature of the chosen model, prior, and screening rule, rather than interpreted as evidence that inverse reporting patterns are less meaningful by nature.
Accordingly, studies reporting inverse signals should disclose the underlying cell counts and expected counts, present confidence or credibility intervals where appropriate, and, when feasible, present frequentist and Bayesian estimates side by side.
6.2. Database Ascertainment and Reporting Context
A further direction-specific manifestation arises from database-level ascertainment and reporting context. Spontaneous reporting systems differ in reporting obligations, seriousness thresholds, reporter composition, inclusion of solicited reports, coding practices, deduplication procedures, and regional reporting cultures. These differences are particularly consequential for inverse signals because under-representation is inferred from the relative scarcity of reports rather than from an observed excess.
Importantly, uniform under-capture of an event class across an entire database does not necessarily create a drug-specific inverse signal. It may instead reduce statistical precision. The more serious interpretive problem arises when under-ascertainment is differential across drugs, event classes, indications, reporter types, regions, or reporting pathways. In databases or reporting subsets enriched for serious adverse reactions, apparent inverse signals for mild or low-attention outcomes may therefore reflect differential reporting scope or reporting attention rather than biologically meaningful risk reduction. Conversely, positive signals for severe or highly publicized outcomes may be amplified by the same reporting structure.
Accordingly, inverse signals should be interpreted as database-conditional descriptive patterns. Studies reporting inverse signals should specify the database source, reporting period, seriousness filters, reporter types, drug-role definitions, treatment of solicited reports, and deduplication procedures. Where feasible, investigators should examine whether inverse patterns persist across sensitivity analyses or across databases with different ascertainment schemes. The harm-oriented purpose of spontaneous reporting is therefore relevant to ascertainment and regulatory use, but it does not alter the definition of the observed reporting contrast.
7. Operationalizing Symmetric Interpretation
The preceding sections imply a simple symmetry check. When a critique is raised against ROR < 1, the first question should be whether the same critique also applies to ROR > 1. If it does, the critique represents a general limitation of disproportionality analysis and cannot justify selectively rejecting inverse signals. If it does not, the next question is whether the critique targets causal interpretation or descriptive reporting. This check is not intended to validate inverse signals automatically. Its purpose is to prevent asymmetric evidential standards: causal claims should be constrained and externally validated in both directions, whereas descriptive reporting contrasts should not be rejected solely because they lie below unity.
In practice, the check is applied in four steps: define the intended claim level; confirm that the reporting contrast is sufficiently estimable; assess shared and direction-specific alternative explanations; and restrict wording and follow-up to the evidence actually available. A finding advances only when the additional evidence required by Table 5 is supplied.
Table 4.
Symmetry check for critiques of inverse disproportionality. The check distinguishes general limitations of disproportionality analysis from potentially direction-specific critiques and separates objections to causal interpretation from objections to descriptive reporting.
Table 4.
Symmetry check for critiques of inverse disproportionality. The check distinguishes general limitations of disproportionality analysis from potentially direction-specific critiques and separates objections to causal interpretation from objections to descriptive reporting.
| Nature of critique | Appropriate response |
|---|---|
| Applies also to ROR > 1 | Treat it as a general limitation of disproportionality analysis; it does not justify direction-specific rejection of inverse signals. |
| Specific to ROR < 1 and targets causal interpretation | Revise causal language and require external validation for stronger claims. |
| Specific to ROR < 1 and targets descriptive reporting itself | Assess the reporting-distribution contrast directly, including comparator choice, expected information, masking or competition, and database ascertainment. |
Abbreviation: ROR, reporting odds ratio.
Table 5.
Claim-strength levels and corresponding evidential requirements. The required evidence increases with the inferential strength of the claim and applies symmetrically to positive and inverse signals.
Table 5.
Claim-strength levels and corresponding evidential requirements. The required evidence increases with the inferential strength of the claim and applies symmetrically to positive and inverse signals.
| Level | Claim type | ROR > 1 expression | ROR < 1 expression | Evidential requirement |
|---|---|---|---|---|
| 1 | Descriptive reporting | Higher-than-expected reporting | Lower-than-expected reporting | 2 × 2 table, estimate, CI, reference group |
| 2 | Hypothesis generation | Compatible with harmful-effect hypothesis | Compatible with suppressive-effect hypothesis | Stratification, sensitivity analyses |
| 3 | Candidate prioritization for follow-up evaluation | Candidate for follow-up evaluation of a harmful-effect hypothesis | Candidate for follow-up evaluation of a suppressive-effect hypothesis | Descriptive stability across justified comparator definitions, event definitions, drug-role restrictions, sparse-count rules, alternative metrics, and sensitivity analyses. No risk-reduction, protection, or causal claim is permitted. |
| 4 | Pharmacological plausibility | Mechanistically plausible harm | Mechanistically plausible suppression | Biological rationale, in vitro/in vivo/omics |
| 5 | Risk change | Risk increase suggested | Risk reduction suggested | EHR, claims, registry, rigorous observational design |
| 6 | Causal effect | Causal harmful effect shown | Causal protective effect shown | RCT, target trial emulation, robust causal evidence |
Abbreviations: CI, confidence interval; EHR, electronic health record; RCT, randomized controlled trial.
The symmetry check prevents two opposite errors. It prevents over-acceptance of inverse signals by requiring that protective or risk-reduction claims be externally validated. It also prevents over-rejection of inverse signals by showing that failure to prove protection does not eliminate the descriptive or hypothesis-generating value of lower-than-expected reporting.
8. Evidential Requirements Should Be Calibrated to Claim Strength, Regardless of Signal Direction
The practical consequence of symmetric interpretation is that evidential requirements should be calibrated to the strength of the claim, regardless of signal direction. ROR > 1 and ROR < 1 may both be described at the lowest level as reporting patterns. Stronger claims require stronger evidence in both directions.
Figure 3 and Table 5 summarize a six-level framework. At the lowest level, both positive and inverse signals may be reported descriptively if cell counts, reference groups, estimates, confidence intervals, event definitions, and preprocessing are transparent. As claims progress from hypothesis generation to candidate prioritization, mechanistic plausibility, risk change, and causal confirmation, the required evidence correspondingly increases. The upper levels draw on established pharmacoepidemiologic reporting and causal-inference frameworks for routinely collected data and target-trial emulation [23,24]. For claims of the same strength, this escalation applies to both directions; it does not imply identical prior probability, predictive value, or regulatory priority. Taken together, these direction-dependent differences in contextualization, detectability, prior probability, predictive value, and regulatory priority may alter the weight, posterior plausibility, and follow-up priority assigned to a finding, and may prevent advancement to higher claim levels when the relevant safeguards are not satisfied; they do not change the semantic definition of the claim levels or the eligibility of an estimable reporting contrast for Level 1 description and conditional Level 2 hypothesis generation.
For Level 3 candidate prioritization, robustness refers to descriptive stability across reasonable analytic choices, not to causal validity. These checks do not convert a disproportionality pattern into evidence of harm reduction or protection. Descriptive stability also does not exclude stable structural confounding, including channeling or confounding by indication; Level 3 therefore remains a basis for follow-up evaluation rather than evidence of risk reduction or protection.
Evidential requirements should therefore be calibrated to the strength of the claim, regardless of whether the disproportionality estimate lies above or below unity.
Among the levels in Table 5, Level 3 (candidate prioritization for follow-up evaluation) is the operational hinge between exploratory description and confirmatory inference, and therefore requires additional specification. Candidate prioritization based on disproportionality should not rely on a single ROR estimate below or above unity. It should assess the descriptive stability of the pattern across justified comparator definitions and sensitivity analyses. These may include active-comparator or therapeutic-class-restricted analyses to evaluate comparator dependence and indication-related reporting baselines. They may also include alternative event definitions using MedDRA Preferred Terms, Standardised MedDRA Queries, or clinically curated event sets, drug-role restrictions, minimum cell-count rules and interval estimates, alternative disproportionality metrics, and sensitivity analyses by reporting period, seriousness, report source, region or database, and case/non-case inclusion criteria. Where feasible, negative-control outcomes, inspection of co-reported events and co-medications, and assessment of masking, notoriety bias, or competition bias may further characterize signal specificity [16,19,20]. These checks are intended to support candidate prioritization for follow-up evaluation, not to establish risk reduction, protection, or causality. They should be applied in a direction-consistent manner, while allowing direction-specific sensitivity analyses when the rationale is explicitly stated.
9. Empirical Precedents for Inverse-Signal–Guided Candidate Prioritization
Inverse-signal research should not be framed as a collection of "success stories" proving therapeutic effects. Empirical precedents should instead be classified according to the stage of validation reached. Some studies remain purely statistical hypothesis generation. Others integrate computational or omics evidence, and a smaller number connect lower-than-expected reporting or inverse association to preclinical validation.
The examples in Table 6 were selected purposively because each publication included an inverse or lower-than-expected reporting component and represented a distinct stage in the follow-up pathway, ranging from statistical hypothesis generation without downstream validation to computational prioritization, external-data triangulation, or experimental evaluation. They are illustrative rather than exhaustive and are not used to estimate yield or predictive value.
A prominent example is the use of FAERS inverse associations to prioritize bile acid derivatives as candidate therapies for multiple sclerosis, followed by validation in experimental autoimmune encephalomyelitis models [25]. This does not prove that FAERS inverse association established a therapeutic effect. It shows that lower-than-expected reporting contributed to candidate prioritization that subsequently received preclinical support.
For transparency, the author of the present review was a coauthor of this study [25]. It is included under the same claim-level mapping rule as the other examples and is not treated as independent clinical, epidemiological, or causal validation.
Other examples involve adverse-event mitigation by drug combinations. Zhao et al. identified FAERS patterns suggesting that exenatide may mitigate rosiglitazone-associated myocardial infarction and linked these findings to clinical data, network analysis, and db/db mouse experiments [26]. Nagashima et al. used FAERS data mining to identify vitamin D as a potential mitigator of quetiapine-induced hyperglycaemia, followed by mouse and cell-based experiments [27]. These are not classical drug– disease inverse disproportionality examples, but they demonstrate that lower-than-expected reporting patterns can guide experimentally testable hypotheses.
Computational triangulation examples include Hosomi et al., who integrated FAERS, JMDC claims, and transcriptomic analysis to identify candidates for inflammatory bowel disease [28]. Böhm et al. used OpenVigil to search for inverse signals in viral respiratory infections [29]. Ko et al. combined FAERS inverse signals with disease and drug-induced gene expression profiles for psoriasis drug repositioning [30]. These studies show increasing methodological sophistication, but only some reach experimental validation, and few provide fully adjusted clinical or pharmacoepidemiological confirmation.
The studies listed in this table are presented as empirical precedents for hypothesis prioritization and follow-up evaluation, not as definitive proof of protective or therapeutic effects. Evidence levels are approximate and depend on the extent to which each study incorporated patient-level longitudinal data, confounding control, exposure timing, outcome ascertainment, and mechanistic validation.
The available literature suggests that inverse disproportionality has begun to contribute to drug-repurposing and adverse-event mitigation pipelines. However, examples progressing to independent experimental or clinical validation remain limited. This pattern supports neither unconditional acceptance nor categorical dismissal of inverse signals. Rather, it reinforces the need for symmetric interpretation standards and claim-strength-dependent validation. The empirical precedents summarized in Table 6 should be interpreted within the claim-strength framework proposed in this review. Several examples progressed from inverse-signal detection and candidate prioritization to mechanistic or preclinical validation, whereas some incorporated additional real-world data sources such as electronic health records or claims databases. However, the mere inclusion of real-world data does not necessarily constitute fully adjusted pharmacoepidemiological validation. Protective or disease-modifying interpretations of inverse signals remain vulnerable to confounding by indication, channeling effects, co-medication patterns, differential reporting, exposure misclassification, and, in longitudinal studies, time-related biases such as immortal time bias [23,24,31].
Accordingly, the precedents in Table 6 should be cited as illustrations of inverse-signal-guided hypothesis prioritization and follow-up evaluation, not as definitive demonstrations that inverse disproportionality establishes risk reduction or causal protection. Mechanistic and preclinical evidence can strengthen biological plausibility, but it does not by itself resolve epidemiological bias in the patient populations from which the signal was generated. A fully realized evidence-generating pathway would require inverse-signal detection, transparent candidate prioritization, mechanistic evaluation, and appropriately designed observational pharmacoepidemiological studies before causal or clinical claims are made.
10. Implications for Reporting Guidelines and Practice
10.1. Regulatory Precaution and Scientific-Interpretive Symmetry
The interpretive asymmetry between positive and inverse disproportionality signals does not arise solely from technical misunderstanding. It also reflects the historical purpose of pharmacovigilance as a public-health system for the early detection and prevention of serious harms. Spontaneous reporting systems were developed primarily to detect potential adverse drug reactions after medicines entered clinical use, and regulatory signal-management frameworks are consequently oriented toward the identification, evaluation, and mitigation of possible harm.
This regulatory asymmetry is legitimate. The consequences of missing a serious adverse drug reaction may be substantially greater than the consequences of investigating a false-positive safety concern. Accordingly, the threshold for initiating evaluation or precautionary communication about a potential harm may appropriately be lower than the threshold for making benefit or protective-effect claims. However, this does not imply that inverse disproportionality patterns are uninterpretable.
The framework does not propose automatic lower-tail screening in all routine pharmacovigilance workflows or equal allocation of regulatory resources. Such implementation decisions require separate evaluation of workload, operating characteristics, and public-health utility.
The argument advanced in this review is not that positive and inverse signals should trigger equivalent regulatory actions. Instead, the scientific interpretation of descriptive disproportionality patterns should remain consistent with the strength of the claim. At the level of description, hypothesis generation, and candidate prioritization for follow-up evaluation, a protective hypothesis raised by ROR < 1 is not a regulatory benefit claim. It is a hypothesis for further evaluation. Conversely, a positive signal based on ROR > 1 is not, by itself, causal proof of harm. The claim-strength framework gives a practical way to make this distinction. It allows symmetric descriptive and hypothesis-generating use of both signal directions while reserving high evidentiary thresholds for risk-change, clinical, or causal claims.
10.2. Safeguards Against Selective Reporting and Promotional Misuse
A reasonable concern is that inverse disproportionality findings could be selectively reported or used for promotional purposes, for example by highlighting ROR < 1 findings as evidence of a favorable safety profile while omitting unfavorable positive signals. This concern is legitimate, but it is not unique to inverse signals. Positive disproportionality findings can also be selectively amplified if drug–event pairs, comparator definitions, event definitions, time windows, or sensitivity analyses are chosen post hoc and reported without the full analytic context. The likely misuse differs by direction. Inverse signals may be misrepresented as evidence of reduced risk, protection, or comparative safety advantage. Positive signals may be misrepresented as causal proof of harm or used to amplify risk narratives without adequate context.
The appropriate safeguard is direction-consistent transparency, not the exclusion of inverse signals from the analytic record. Studies using disproportionality findings for Level 1–3 claims should define and report the analytic universe. This includes the database and time period, eligible drugs or chemical motifs, target and non-target events, comparator sets, drug-role definitions, minimum cell-count rules, metrics, ranking criteria, and planned or explored sensitivity analyses. Where feasible, investigators should provide the screened denominator, supplementary output, code or query definitions, and sufficient information to identify null, unstable, conflicting, or competing findings. For a candidate prioritized on the basis of an inverse signal, positive signals for related or serious adverse events should also be disclosed.
The claim-strength framework further limits misuse by separating hypothesis generation from risk or benefit claims. A Level 1–3 inverse signal cannot support statements of superior safety, reduced risk, protection, or clinical benefit. Conversely, a Level 1–3 positive signal cannot by itself establish causal harm. Regulatory prioritization of potential harms may be justified by public-health precaution, but such prioritization should remain distinct from causal interpretation. An inverse finding selected after an undisclosed search process, reported without the screened context, or used as promotional evidence of safety advantage should be regarded as a misuse of disproportionality analysis rather than an application of the framework proposed here. This review does not make inverse signals easier to use for favorable claims. It makes their misuse easier to identify.
Inverse findings should not be used to support promotional, comparative-safety, off-label, or patient-facing claims unless independent evidence supports the stated claim level.
10.3. Reporting Guidelines and Practice
The symmetric interpretation standards proposed here align with, rather than contradict, existing reporting guidance. READUS-PV discourages interpreting inverse disproportionality as a protective drug-related effect [9], and FDA guidance emphasizes that reports available through AEMS (formerly FAERS) do not establish causality or incidence [4]. These principles should be applied bidirectionally. ROR results should be reported as higher- or lower-than-expected reporting, and causal language should be reserved for externally validated claims.
The same logic applies to JADER studies. A Japanese checklist for JADER research emphasizes underreporting, denominator absence, reporting bias, and cautious interpretation [32]. These limitations should not be applied only to inverse signals. In practice, authors should specify whether a result is being presented as descriptive reporting, hypothesis generation, candidate prioritization, risk change, or causal effect. Titles and abstracts should avoid causal spin. For inverse signals, terms such as "protective effect," "risk reduction," and "beneficial reaction" should be reserved for externally validated findings. For positive signals, terms such as "causes," "risk increase," and "harmful effect" should be controlled similarly.
Table 7.
Essential reporting items for positive and inverse disproportionality analyses.
| Essential reporting item | Minimum information to report |
|---|---|
| Intended use and claim level | State whether the result is descriptive reporting, hypothesis generation, candidate prioritization for follow-up evaluation, risk estimation, or a causal claim. |
| Database and reporting context | Name the database, study period, reporter types, seriousness filters, and treatment of solicited reports. |
| Drug definition | Report product mapping, exposure definition, and drug-role restrictions. |
| Event definition | Report MedDRA level, Preferred Terms, Standardised MedDRA Queries, or curated event sets. |
| Comparator/reference set | Define the reference set and justify any active-comparator or therapeutic-class restriction. |
| Data processing | Describe deduplication, exclusions, missing data handling, and preprocessing. |
| Counts and estimability | Report the 2 × 2 cells, expected counts where relevant, effect estimate, and interval. |
| Statistical rule | Specify the disproportionality metric, lower- or upper-tail criterion, sparse-cell rule, and multiplicity procedure. |
| Direction-specific bias checks | Assess comparator dependence, masking or competition, channeling, co-prescription, reporting pathways, and database ascertainment as relevant. |
| Robustness and replication | Report prespecified sensitivity analyses, alternative definitions, temporal or regional analyses, controls, and replication where available. |
| Screened analytic context | Describe the screened universe and disclose null, unstable, conflicting, and competing findings where feasible. |
| Permissible wording and external evidence | Use higher- or lower-than-expected reporting for SDRs; reserve risk, protection, benefit, harm, and causality language for evidence sufficient to support those claims. |
| Communication safeguard | Do not use Level 1–3 inverse findings as promotional, comparative-safety, off-label, or patient-facing evidence of benefit. |
Abbreviations: AEMS, Adverse Event Monitoring System; CI, confidence interval; EBGM, empirical Bayes geometric mean; FAERS, FDA Adverse Event Reporting System; IC, information component; ROR, reporting odds ratio; SDR, signal of disproportionate reporting.
Future reporting guidance could explicitly state that ROR > 1 and ROR < 1 are both reporting associations. ROR > 1 should not be causally labeled as harm, and ROR < 1 should not be causally labeled as protection. Both may be used for hypothesis generation when reported transparently and interpreted within appropriate inferential boundaries.
11. Conclusion
Inverse disproportionality signals should neither be dismissed as meaningless nor interpreted as evidence of protection. They are legitimate patterns of lower-than-expected reporting, subject to the same inferential limits as positive disproportionality signals. The same claim-strength standard can therefore be applied while case review, masking, ascertainment, and other direction-specific issues are evaluated by the analyses appropriate to each direction. Under these standards, ROR < 1 may support description and hypothesis generation. It may also support candidate prioritization for follow-up evaluation when robust to comparator and sensitivity analyses. Claims of protection or risk reduction require appropriate external validation. This framework does not prescribe automatic routine lower-tail screening or equal regulatory resource allocation; those implementation decisions require separate evaluation. The framework is not intended to make favorable claims easier to make. Its purpose is to make descriptive use of inverse signals transparent, limited in claim strength, and auditable.
Author Contributions
Yoshihiro Uesawa: Conceptualization, methodology, literature interpretation, writing—original draft, writing—review and editing, supervision, and final approval of the manuscript.
Funding
No funding was received for the preparation of this manuscript.
Ethics Approval
Not applicable. This article is a narrative methodological review and does not involve human participants, animals, or identifiable personal data.
Consent to Participate
Not applicable.
Consent to Publish
Not applicable.
Data Availability
Data sharing is not applicable to this article because no new datasets were generated or analyzed.
Code Availability
Not applicable.
Conflicts of Interest
The author declares no financial competing interests. For transparency, the author was a coauthor of one empirical precedent cited in this review [25]. That study is presented as an illustrative preclinical precedent and not as independent clinical, epidemiological, or causal validation. No other relevant non-financial competing interests are declared.
Acknowledgments
Not applicable.
References
- Evans, S.J.W.; Waller, P.C.; Davis, S. Use of proportional reporting ratios (PRRs) for signal generation from spontaneous adverse drug reaction reports. Pharmacoepidemiol Drug Saf. 2001, 10(6), 483–486. [Google Scholar] [CrossRef] [PubMed]
- Bate, A.; Evans, S.J.W. Quantitative signal detection using spontaneous ADR reporting. Pharmacoepidemiol Drug Saf. 2009, 18(6), 427–436. [Google Scholar] [CrossRef] [PubMed]
- Faillie, J.L. Case–non-case studies: principle, methods, bias and interpretation. Therapie 2019, 74(2), 225–232. [Google Scholar] [CrossRef] [PubMed]
- U.S. Food and Drug Administration. FDA Adverse Event Monitoring System (AEMS) Public Dashboard [formerly FDA Adverse Event Reporting System (FAERS)]. Available online: https://www.fda.gov/drugs/fda-adverse-event-monitoring-system-aems/fda-adverse-event-monitoring-system-aems-public-dashboard (accessed on 13 July 2026).
- European Medicines Agency. EudraVigilance system overview. Available online: https://www.ema.europa.eu/en/human-regulatory-overview/research-development/pharmacovigilance-research-development/eudravigilance/eudravigilance-system-overview (accessed on 5 May 2026).
- Uppsala Monitoring Centre. About VigiBase. Available online: https://who-umc.org/vigibase-data-access/about-vigibase/ (accessed on 5 May 2026).
- Pharmaceuticals and Medical Devices Agency. Japanese Adverse Drug Event Report database (JADER): terms of use. Available online: https://www.pmda.go.jp/safety/info-services/drugs/adr-info/suspected-adr/0003.html (accessed on 5 May 2026).
- Fusaroli, M.; Salvo, F.; Bégaud, B.; et al. The REporting of A Disproportionality Analysis for DrUg Safety Signal Detection Using Individual Case Safety Reports in PharmacoVigilance (READUS-PV): Development and Statement. Drug Saf. 2024, 47, 575–584. [Google Scholar] [CrossRef] [PubMed]
- Fusaroli, M.; Salvo, F.; Bégaud, B.; et al. The REporting of A Disproportionality Analysis for DrUg Safety Signal Detection Using Individual Case Safety Reports in PharmacoVigilance (READUS-PV): Explanation and Elaboration. Drug Saf. 2024, 47, 585–599. [Google Scholar] [CrossRef] [PubMed]
- Khouri, C.; Hlavaty, A.; Revol, B.; Salvo, F.; Raschi, E. Comment on: Exploring the association between weight loss-inducing medications and multiple sclerosis: insights from the FDA adverse event reporting system database. Ther. Adv. Neurol. Disord. 2024, 17, 17562864241276847. [Google Scholar] [CrossRef] [PubMed]
- Raschi, E.; Salvo, F.; La Placa, M.; Poluzzi, E.; De Ponti, F. Reduced reporting of neuropsychiatric adverse events with tumor necrosis factor alpha inhibitors for hidradenitis suppurativa: caution before concluding for risk reduction. J. Eur. Acad. Dermatol. Venereol. 2020, 34, e430–e431. [Google Scholar] [CrossRef] [PubMed]
- Raschi, E.; Poluzzi, E.; De Ponti, F. Reduced neuropsychiatric events as "beneficial reactions" to drugs: seek associations with caution. Brain Behav. Immun. 2020, 84, 275–276. [Google Scholar] [CrossRef] [PubMed]
- Antonazzo, I.C.; Poluzzi, E.; Forcesi, E.; Salvo, F.; Pariente, A.; Marchesini, G.; et al. Signal of potentially protective drug–drug interactions from spontaneous reporting systems: proceed with caution. Acta Diabetol. 2020, 57(1), 115–116. [Google Scholar] [CrossRef] [PubMed]
- Bate, A.; Lindquist, M.; Edwards, I.R.; Olsson, S.; Orre, R.; Lansner, A.; et al. A Bayesian neural network method for adverse drug reaction signal generation. Eur. J. Clin. Pharmacol. 1998, 54(4), 315–321. [Google Scholar] [CrossRef] [PubMed]
- DuMouchel, W. Bayesian data mining in large frequency tables, with an application to the FDA Spontaneous Reporting System. Am. Stat. 1999, 53(3), 177–190. [Google Scholar] [CrossRef]
- Cutroneo, P.M.; Sartori, D.; Tuccori, M.; Crisafulli, S.; Battini, V.; Carnovale, C.; et al. Conducting and interpreting disproportionality analyses derived from spontaneous reporting systems. Front Drug Saf. Regul. 2024, 3, 1323057. [Google Scholar] [CrossRef] [PubMed]
- World Health Organization. The use of the WHO-UMC system for standardised case causality assessment; World Health Organization: Geneva, 2013; Available online: https://www.who.int/publications/m/item/WHO-causality-assessment (accessed on 5 May 2026).
- Holland, P.W. Statistics and causal inference. J. Am. Stat. Assoc. 1986, 81(396), 945–960. [Google Scholar] [CrossRef]
- Pariente, A.; Grégoire, F.; Fourrier-Réglat, A.; Haramburu, F.; Moore, N. Impact of safety alerts on measures of disproportionality in spontaneous reporting databases: the notoriety bias. Drug Saf. 2007, 30, 891–898. [Google Scholar] [CrossRef] [PubMed]
- Pariente, A.; Avillach, P.; Salvo, F.; et al. Effect of competition bias in safety signal generation: analysis of a research database of spontaneous reports in France. Drug Saf. 2012, 35, 855–864. [Google Scholar] [CrossRef] [PubMed]
- Salvo, F.; Leborgne, F.; Thiessard, F.; et al. A potential event-competition bias in safety signal detection: results from a spontaneous reporting research database in France. Drug Saf. 2013, 36, 565–572. [Google Scholar] [CrossRef] [PubMed]
- Gravel, C.A.; Bai, W.; Douros, A. Comparators in pharmacovigilance: a quasi-quantification bias analysis. Drug Saf. 2024, 47, 809–819. [Google Scholar] [CrossRef] [PubMed]
- Hernán, M.A.; Robins, J.M. Using big data to emulate a target trial when a randomized trial is not available. Am. J. Epidemiol. 2016, 183(8), 758–764. [Google Scholar] [CrossRef] [PubMed]
- Langan, S.M.; Schmidt, S.A.J.; Wing, K.; Ehrenstein, V.; Nicholls, S.G.; Filion, K.B.; et al. The reporting of studies conducted using observational routinely collected health data statement for pharmacoepidemiology (RECORD-PE). BMJ 2018, 363, k3532. [Google Scholar] [CrossRef] [PubMed]
- Asada, M.; Aizawa, F.; Mikami, T.; Goda, M.; Sonoda, Y.; Niimura, T.; et al. Bile acids as candidate therapies for multiple sclerosis: inverse signal analysis using the FDA Adverse Event Reporting System and preclinical validation. Mult. Scler. Relat. Disord. 2026, 109, 107113. [Google Scholar] [CrossRef] [PubMed]
- Zhao, S.; Nishimura, T.; Chen, Y.; et al. Systems pharmacology of adverse event mitigation by drug combinations. Sci. Transl. Med. 2013, 5(206), 206ra140. [Google Scholar] [CrossRef] [PubMed]
- Nagashima, T.; Shirakawa, H.; Nakagawa, T.; Kaneko, S. Prevention of antipsychotic-induced hyperglycaemia by vitamin D: a data mining prediction followed by experimental exploration of the molecular mechanism. Sci. Rep. 2016, 6, 26375. [Google Scholar] [CrossRef] [PubMed]
- Hosomi, K.; Fujimoto, M.; Ushio, K.; et al. An integrative approach using real-world data to identify alternative therapeutic uses of existing drugs. PLoS ONE 2018, 13, e0204648. [Google Scholar] [CrossRef] [PubMed]
- Böhm, R.; Bulin, C.; Waetzig, V.; Cascorbi, I.; Klein, H.J.; Herdegen, T. Pharmacovigilance-based drug repurposing: the search for inverse signals via OpenVigil identifies putative drugs against viral respiratory infections. Br. J. Clin. Pharmacol. 2021, 87(11), 4421–4431. [Google Scholar] [CrossRef] [PubMed]
- Ko, M.; Oh, J.M.; Kim, I.-W. Drug repositioning prediction for psoriasis using the adverse event reporting database. Front Med. 2023, 10, 1159453. [Google Scholar] [CrossRef] [PubMed]
- Suissa, S. Immortal time bias in pharmacoepidemiology. Am. J. Epidemiol. 2008, 167(4), 492–499. [Google Scholar] [CrossRef] [PubMed]
- Sakai, T. A checklist of important points in research using JADER. Jpn. J. Pharmacoepidemiol (Yakuzai Ekigaku) 2020, 25(2), 64–73. [Google Scholar] [CrossRef]
Figure 2.
Potential interpretive conflations and more precise interpretations. Some objections to inverse disproportionality explicitly arise from conflating reporting associations with incidence, causality, or clinical benefit/harm; others represent analytic distinctions proposed in this review to support symmetric interpretation standards. Abbreviations: ROR, reporting odds ratio; SDR, signal of disproportionate reporting.
Figure 2.
Potential interpretive conflations and more precise interpretations. Some objections to inverse disproportionality explicitly arise from conflating reporting associations with incidence, causality, or clinical benefit/harm; others represent analytic distinctions proposed in this review to support symmetric interpretation standards. Abbreviations: ROR, reporting odds ratio; SDR, signal of disproportionate reporting.
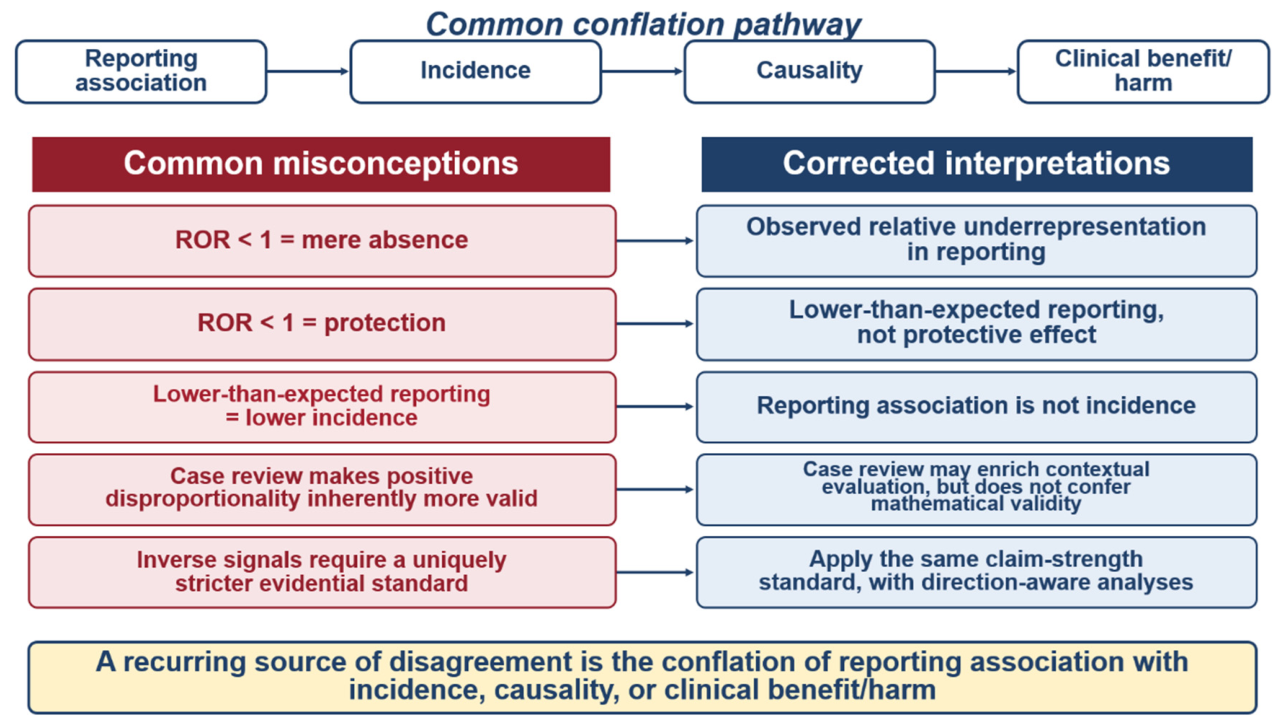
Figure 3.
Claim-strength framework. Evidential requirements increase with claim strength. The same levels apply to positive and inverse signals. Advancing to a higher level requires additional data sources or study designs; a stronger disproportionality estimate alone is insufficient. Abbreviation: EHR, electronic health record.
Figure 3.
Claim-strength framework. Evidential requirements increase with claim strength. The same levels apply to positive and inverse signals. Advancing to a higher level requires additional data sources or study designs; a stronger disproportionality estimate alone is insufficient. Abbreviation: EHR, electronic health record.
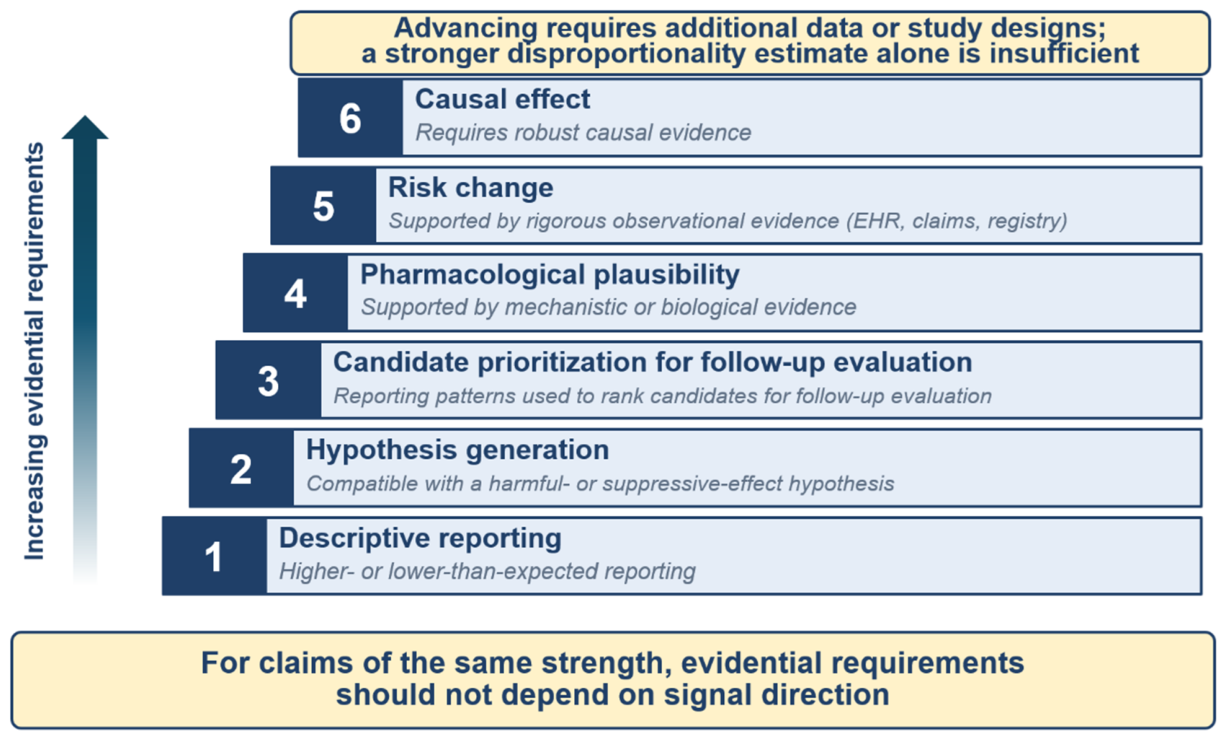
Table 1.
Selected existing critiques and their symmetric counterparts. Existing critiques primarily refute causal labeling and premature therapeutic candidacy rather than transparent descriptive inverse disproportionality. The final column states the direction-symmetric implication proposed in this review, not a claim attributed to the cited source.
Table 1.
Selected existing critiques and their symmetric counterparts. Existing critiques primarily refute causal labeling and premature therapeutic candidacy rather than transparent descriptive inverse disproportionality. The final column states the direction-symmetric implication proposed in this review, not a claim attributed to the cited source.
| Source or literature group | What it refutes | What it does not refute | Positive-signal counterpart |
|---|---|---|---|
| Khouri et al. [10] | ROR < 1 or inverse disproportionality = protection, risk reduction, or sufficient evidence by itself for therapeutic candidacy | Describing ROR < 1 as lower-than-expected reporting; exploratory follow-up using complementary methods, without treating the inverse association alone as therapeutic candidacy | ROR > 1 is also insufficient by itself to establish harm, risk increase, or causality |
| Raschi et al. [11,12] | Lower-than-expected reporting = risk reduction | Lower-than-expected reporting as a descriptive pattern | Higher-than-expected reporting = risk increase is also not justified |
| Antonazzo et al. [13] | Causal inference of protective DDI | Exploratory inverse DDI pattern | Causal inference of harmful DDI is also not justified |
| Cutroneo et al. [16] | Inverse disproportionality = protective drug effect | Descriptive inverse signal | Positive disproportionality = harmful drug effect is also not justified |
| READUS-PV [8,9] | Inverse signal = protective effect | Reporting an inverse signal itself as lower-than-expected reporting | Positive signal = causal harm is also not justified |
Abbreviations: DDI, drug–drug interaction; READUS-PV, REporting of A Disproportionality analysis for drUg Safety signal detection guideline; ROR, reporting odds ratio.
Table 6.
Empirical precedents for inverse-signal–guided candidate prioritization. The examples vary substantially in the downstream validation stage reached. They support candidate-prioritization value, not inverse-signal proof of therapeutic effects. The approximate ceiling was assigned by matching the strongest evidence reported in each publication toTable 5: statistical hypothesis generation, Level 2; candidate prioritization with internal robustness, Level 3; mechanistic or experimental support, Level 4; rigorous longitudinal risk estimation, Level 5; and robust causal evidence, Level 6. The mapping is illustrative and is not a study-quality score. Published examples are also likely to be affected by publication and survivorship bias;Table 6 therefore cannot characterize how often inverse findings fail to replicate or progress to downstream validation.
Table 6.
Empirical precedents for inverse-signal–guided candidate prioritization. The examples vary substantially in the downstream validation stage reached. They support candidate-prioritization value, not inverse-signal proof of therapeutic effects. The approximate ceiling was assigned by matching the strongest evidence reported in each publication toTable 5: statistical hypothesis generation, Level 2; candidate prioritization with internal robustness, Level 3; mechanistic or experimental support, Level 4; rigorous longitudinal risk estimation, Level 5; and robust causal evidence, Level 6. The mapping is illustrative and is not a study-quality score. Published examples are also likely to be affected by publication and survivorship bias;Table 6 therefore cannot characterize how often inverse findings fail to replicate or progress to downstream validation.
| Study | Data source | Inverse-direction information | Downstream support | Validation stage reached | Approximate claim-strength ceiling | Key evidentiary limitation |
|---|---|---|---|---|---|---|
| Zhao et al. 2013 [26] | FAERS | Drug-combination mitigation signal | Clinical data, network analysis, mouse model | Clinical database + animal-model support | Level 4 | No prospective design; residual confounding |
| Nagashima et al. 2016 [27] | FAERS | Vitamin D and quetiapine-related hyperglycaemia | Mouse and cell experiments | Experimental validation | Level 4 | No patient-level longitudinal RWD |
| Hosomi et al. 2018 [28] | FAERS, JMDC | IBD inverse associations | Claims and transcriptome | Claims + transcriptome triangulation | Level 3 | Limited explicit control for time-related bias in claims analysis |
| Böhm et al. 2021 [29] | FAERS/OpenVigil | Viral respiratory infection inverse signals | None | Statistical hypothesis generation | Level 2 | Computational hypothesis generation only |
| Ko et al. 2023 [30] | FAERS | Psoriasis inverse signals | GEO, LINCS, ChEMBL | Omics and ChEMBL triangulation | Level 3 | Computational prioritization only |
| Asada et al. 2026 [25] | FAERS | MS and bile acid inverse associations | EAE model | Preclinical validation | Level 4 | Preclinical only; no patient-level RWD |
Abbreviations: EAE, experimental autoimmune encephalomyelitis; FAERS, FDA Adverse Event Reporting System; GEO, Gene Expression Omnibus; IBD, inflammatory bowel disease; JMDC, Japan Medical Data Center; LINCS, Library of Integrated Network-based Cellular Signatures; MS, multiple sclerosis; RWD, real-world data.
Disclaimer/Publisher’s Note: The statements, opinions and data contained in all publications are solely those of the individual author(s) and contributor(s) and not of MDPI and/or the editor(s). MDPI and/or the editor(s) disclaim responsibility for any injury to people or property resulting from any ideas, methods, instructions or products referred to in the content. |
© 2026 by the authors. Licensee MDPI, Basel, Switzerland. This article is an open access article distributed under the terms and conditions of the Creative Commons Attribution (CC BY) license (http://creativecommons.org/licenses/by/4.0/).
Copyright: This open access article is published under a Creative Commons CC BY 4.0 license, which permit the free download, distribution, and reuse, provided that the author and preprint are cited in any reuse.