

Submitted:
23 July 2026
Posted:
24 July 2026
You are already at the latest version
Abstract
Located 30 km south–southeast of Kabul in Logar province, Aynak is the largest and best-known copper orebody in Afghanistan. The deposit is hosted by the Loy Khwar Formation, a Neoproterozoic-Cambrian metasedimentary sequence of dolomite marble, carbonaceous quartz schist and quartz–biotite–dolomite schist. The primary ore minerals are chalcopyrite and bornite with less abundant pyrite and minor cobaltite, chalcocite, pyrrhotite, sphalerite and molybdenite. Sulphides occur as bedded laminae and disseminations, in metamorphic segregations, and in syn- to post-metamorphic cross–cutting veins. The geochemistry of sulphide-rich separates from Central and Western Aynak (n=31), analysed by ICP-MS, confirm and quantify previous petrographic observations indicating varying admixtures of sulphide species. Co and As enrichment in chalcopyrite-dominant samples is consistent with cobaltite whereas Co enrichment in the absence of arsenic suggests the presence of carrollite. Fluid inclusion analyses of secondary quartz-hosted inclusions indicate interaction with moderately hot (approximately150- 300⁰C; pressure-uncorrected), highly saline (32.1 to 47.4 equivalent wt% NaCl) chloride-rich brines. It is uncertain whether these fluid parameters relate to primary copper transport and deposition, or to remobilisation during metamorphism. Nevertheless, comparison with analogous sediment-hosted copper deposits suggests that highly saline basinal brines played an important role in the formation and evolution of the deposit. Occurrences of scapolite provide additional evidence for a model of brine-related mineralization. Together with previously published mineralogical, lithogeochemical and sulphur isotope evidence, these findings support a sedimentary–diagenetic origin for the Aynak copper deposit that is broadly comparable with sediment-hosted stratiform copper systems of the Central African Copperbelt.
Keywords:
copper ore
; stratabound sulphide deposit
; bornite
; chalcopyrite
; cobaltite
; fluid inclusions
; basinal brines
; Neoproterozoic
1. Introduction
Copper remains one of the world’s most important industrial and strategic metals and continues to be in high demand owing to increasing urbanisation, electrification, renewable energy technologies, and the global energy transition. Afghanistan hosts numerous copper deposits in sediment-hosted, porphyry, skarn and vein-hosted systems (MoMP and AGS, 2014), many of which occur within the Kabul Copper District. The district covers approximately 800 km² within the tectonically complex Kabul Block and includes the world-class Aynak deposit together with the economically important Darband and Jawhar copper deposits (Figure 1). The Aynak deposit is located approximately 30 km south-southeast (SSE) of Kabul in Logar Province. Its regional geological setting, mineralogy and sulphur isotope characteristics have been described previously (Waizy et al., 2020), whereas the present study focuses on new sulphide geochemistry and fluid inclusion evidence that further constrain the genesis of the deposit.
The Aynak deposit has been exploited for more than 2,400 years and contains extensive archaeological remains, including ancient copper smelting furnaces, widespread slag deposits, monasteries and Buddhist settlements, reflecting a long history of copper production. Following its rediscovery during Afghan–Soviet exploration programmes in the 1970s, extensive geological investigations and drilling defined one of the largest known copper resources in Asia, with an indicated resource of approximately 240 Mt grading 2.3% Cu. Although the deposit was subsequently leased for development to the Metallurgical Corporation of China (MCC), commercial mining has yet to commence owing to a combination of archaeological, technical, economic, political and security challenges.
Copper mineralisation at Aynak is hosted principally by metasedimentary rocks of the Loy Khwar Formation, whereas the underlying Welayati Formation comprises metavolcanic and metasedimentary basement rocks that contain minor disseminated and vein-hosted sulphides (AGS & BGS, 2005a). Previous studies have proposed that these basement rocks may have acted as a potential source of copper and associated metals through metamorphic-hydrothermal remobilisation. Because the Welayati Formation was not intersected by drilling at Aynak, sulphide-bearing samples were collected from equivalent basement exposures in the Khayarkhana (Tara Khel) area near Kabul Airport (Figure 1b) to evaluate this hypothesis. Detailed descriptions of the regional geology and stratigraphy are provided in Section 2 and in Waizy et al. (2020). Regional metamorphism at the Aynak deposit has extensively recrystallised the host rocks and sulphide assemblages, largely obliterating primary ore textures that would otherwise provide direct evidence of mineralising processes (Craig and Vokes, 1993; Fontboté et al., 2017). However, even in weakly metamorphosed sediment-hosted copper deposits where primary textures are preserved, distinguishing between syngenetic, diagenetic and epigenetic mineralisation may remain problematic (Large et al., 1998; Taylor, 2004). Consequently, petrographic observations alone are insufficient to resolve the origin of the Aynak mineralisation. Independent geochemical constraints are therefore required. In this study, ICP-MS analyses of sulphide separates from the Aynak deposit and sulphide-bearing rocks of the Khayarkhana area are used to characterise trace-element distributions, evaluate possible metal sources, and provide new constraints on the genesis of the deposit. Complementing previous geological and mineralogical investigations (Waizy et al., 2020), this study presents new sulphide geochemistry and fluid inclusion data from the Aynak deposit, together with sulphide geochemical data from the Khayarkhana basement rocks. These datasets are used to evaluate possible sources of copper and associated metals, characterise the ore-forming fluids, and provide new constraints on the genesis of the Aynak deposit. The results also have broader implications for understanding metamorphosed sediment-hosted copper systems and may assist future exploration within the Kabul Copper District and comparable geological terranes.
2. Geological Setting of the Aynak Copper Deposit
2.1. Stratigraphy
The Aynak deposit occupies an area of around 6 square kilometres, divided into two prospects of Central Aynak and Western Aynak (Figure 2). The ore field is hosted by metamorphosed sedimentary and volcanic–sedimentary rocks of Neoproterozoic to possibly Cambrian age. These are partially overlain by Upper Permian, Neogene and Quaternary sedimentary deposits that infill a wide erosion–tectonic depression (Figure 2 and Figure 3). The Aynak area also contains several intrusive igneous bodies that can be grouped into three principal complexes according to their age and composition: (i) Late Proterozoic sub–alkaline intrusions; (ii) Ediacaran–Cambrian dykes; and (iii) Lower Cretaceous ultramafic intrusions (AGS & BGS, 2005b; Shroder et al., 2022).
The geological framework and stratigraphy of the Aynak deposit have been described in detail by AGS & BGS (2005a, b) and summarised by Waizy et al. (2020). The following account focuses on those geological features that are most relevant to the sulphide geochemistry and fluid inclusion data presented in this study. The oldest outcropping rocks in the area belong to the Welayati Formation. Akocdzhanyan et al. (1977) divided these rocks into three lithological units. The oldest unit occurs in the cores of anticlinal structures in the south and north of the deposit and comprises garnet-bearing gneisses, amphibolitic gneisses and schists, containing staurolite, andalusite and sillimanite. This unit is overlain with an angular unconformity by a sequence of basaltic–andesitic metavolcanic rocks with intercalations of quartzitic and carbonate schists. Despite regional greenschist-facies metamorphism, the metavolcanic rocks locally preserve primary volcanic textures and fabrics. The metavolcanic rocks are conformably overlain by the uppermost unit which comprises quartzitic schists and carbonate schists. Although the Welayati Formation hosts only minor disseminated and vein-type sulphide mineralisation, it has been proposed as a potential source of copper and associated metals for the Aynak deposit through metamorphic-hydrothermal remobilisation, a hypothesis examined later in this study.
The Welayati Formation is overlain unconformably by the Loy Khwar Formation, which has a thickness of 420 and 880 m in the western and central prospects respectively. This formation, which is host to the copper mineralisation at Aynak, comprises a repetitive cyclical sequence of dolomite marble, carbonaceous quartz schist and quartz–biotite–dolomite schist. The stratigraphy of the Loy Khwar formation was established during the Afghan–Russian exploration programme (Gusev et al.,1979), which subdivided the succession into seven members and several sub–members (Figure 3). In the western prospect the formation comprises a sequence of interbedded schists and calcareous metasedimentary rocks. The meta–evaporite mineral scapolite occurs locally within the schists and provides evidence for evaporitic components within the original sedimentary succession. Schist and dolomite marble commonly have fine rhythmic layering. Stromatolite remnants elsewhere within the Kabul block support a Neoproterozoic age of the formation, although the historical identification of the algae Tannuofia has also been interpreted as indicating an Early Cambrian age (Mennesier, 1961; Slavin et al., 1972, Feruz, 1973 and AGS & BGS, 2005a).
The Gulhamid Formation conformably overlies the Loy Khwar Formation (Figure 3), and is widely distributed throughout the Aynak area, attaining a thickness of approximately 500 m. Only the lower part of the formation is exposed, comprising amphibolites and melanocratic amphibole–biotite and calcareous–biotite schist which represent a basic to intermediate volcanic protolith. Subordinate intercalations of dolomite marble, carbonaceous quartz schists, and calcareous biotite schists also occur. The formation contains disseminated magnetite with minor ilmenite, hematite and pyrite (AGS & BGS, 2005a).
Upper Permian and Quaternary clastic sediments partially cover the older bedrock outcrop in the vicinity of the ore deposits.
2.2. Structural Geology
The Aynak ore field is situated within the Kabul Block, which has undergone a complex tectonic evolution involving Precambrian crustal development followed by multiple Phanerozoic deformation events and later Alpine reactivation (AGS & BGS, 2005a, b; Waizy, 2018; Shroder et al., 2022). At the deposit scale, the geological architecture is dominated by the asymmetrical Aynak anticline, approximately 4 km long and up to 2.5 km wide, with a core composed of amphibolites and gneisses of the Welayati Formation and limbs formed principally by the ore-hosting Loy Khwar Formation. The anticline trends predominantly northeast but swings to an east–west orientation towards its southwestern closure, suggesting superimposed deformation. The southeastern limb dips gently and contains several secondary folds, whereas the northwestern limb is steeply dipping to locally overturned, reflecting strong compressional deformation (AGS & BGS, 2005a; Waizy, 2018). Structural complexity is further enhanced by northeast-trending reverse (thrust) faults, numerous subsidiary faults, and later north–south, east–west and northeast–southwest fault sets, many of which are associated with brecciation and local mylonitisation. Although these structures locally displaced and modified the ore-bearing succession, copper mineralisation remains closely controlled by the stratigraphy of the Loy Khwar Formation, indicating that deformation primarily redistributed rather than generated the sulphide mineralisation. Regional metamorphism produced pervasive foliation, recrystallisation and local remobilisation of sulphides into quartz–carbonate veins and metamorphic segregations, obscuring many primary textures while preserving the overall stratabound geometry of the deposit.
2.3. Mineralogy
The wall-rock units of the Central and Western Aynak deposits are mineralogically similar. The ore bodies in these areas are hosted within the Ediacaran–Cambrian metasedimentary sequence of the Loy Khwar Formation, as previously described. The principal rock-forming minerals in the host rocks include carbonates, quartz, micas, and plagioclase feldspar, with scapolite also present in some samples. Carbonates are ubiquitous, dominated by ferroan dolomite, with calcite constituting a major component of dolomitic marble. Quartz occurs both as a fine-grained matrix in quartz-rich metasediments and as coarsely crystalline aggregates within metamorphic segregations and veins, commonly associated with dolomite, bornite, and chalcopyrite. The coarse quartz hosts abundant fluid inclusions that form the basis of the microthermometric investigations presented later in this study, giving the quartz a characteristic milky-white appearance in hand specimens. Biotite, phlogopite, and muscovite are abundant in the host rocks, particularly within quartz-mica-dolomite schist units. Plagioclase, ranging compositionally from andesine and oligoclase to albite, is commonly found in quartz-feldspar and feldspar-carbonate host rocks. Scapolite was identified as an important constituent in several Western Aynak samples by optical microscopy and SEM energy-dispersive X-ray (EDX) analyses. Because scapolite commonly forms in evaporite-bearing or saline fluid environments, its composition is particularly relevant to the interpretation of the ore-forming fluids discussed later. SEM-EDX analyses indicate that its composition ranges from Na1.99Ca1.89Al4.30Si7.70O24Cl to Na2.56Ca1.36Al4.01Si7.99O24Cl. Potassium is present in amounts of up to 0.6 wt%, while sulphur was not detected. Although carbonate ion concentrations cannot be determined using this analytical method, they are likely to be low, given the relatively high chlorine contents (2.1–3.1 wt%). Apatite is widespread, occurring as small, disseminated crystals within the host rocks and in veins and segregations with chalcopyrite and pyrite. Garnet is rare, with compositions intermediate between almandine and spessartine-grossular, and a minor pyrope component. In addition to the primary rock-forming minerals, minor quantities of rutile, ilmenite, titanite, magnetite, hematite, and zircon were observed microscopically in the studied samples (Waizy et al. 2020). Collectively, these mineral assemblages define the mineralogical framework of the host rocks and provide the basis for interpreting the sulphide geochemistry and fluid inclusion data presented in the following sections.
The lower sections of the main orebody are hosted in carbonaceous dolomite–quartz schist, which is locally breccia-textured. These rocks contain chalcopyrite, pyrite and pyrrhotite with minor cobaltite and sphalerite (Yurgenson et al. 1981). The central and upper sections of the orebody are hosted by carbonaceous quartz–biotite schist, quartzites and dolomite marble. In these sections, bornite is the dominant ore mineral, accompanied by subordinate chalcopyrite and minor molybdenite, cobaltite and magnetite. Minor amounts of carrollite, smaltite and pentlandite were reported by previous investigators (e.g., Yurgenson et al. 1981) but these minerals were not identified in the samples examined in the present study (Waizy et al. 2020). The dominant sulphides- chalcopyrite, bornite and pyrite, occur as stratabound laminae, disseminations, cross–cutting veins, and in metamorphic segregations associated with coarsely crystalline quartz, dolomite and calcite. In contrast, the minor quantities of pyrrhotite, cobaltite, chalcocite, sphalerite, cuprite and molybdenite commonly occur as disseminated grains (Figure 4).
Rock exposures in the Khayarkhana areas comprise amphiboles, basalt, quartzite and marble containing sulphide-bearing veins and segregations dominated by chalcopyrite, pyrite and pyrrhotite (Waizy, 2018; Waizy et al., 2020). These sulphide-bearing basement rocks were included in the present study because they provide representative samples of the Welayati Formation, allowing comparison with the Aynak ore assemblages to evaluate their potential as a source of copper and associated metals.
SEM-EDX analyses of pyrite from 14 samples (Waizy, 2018) indicates that pyrite is close to the stoichiometric formula FeS2, with only 6 of 45 analyses reporting Co and Ni concentrations above the analytical detection limit of 0.2 wt%. Nickel concentrations of 1.2 wt% and 2.4 wt% were measured in individual pyrite grains from Central Aynak samples 3703–4 and 3901–1 respectively (Table 1). Pyrite from sample 104–4a contains 1 and 4 wt% Co. In Western Aynak sample 1001–4, a single pyrite analysis yielded 9.3 wt % Co, although cobalt was not detected in other pyrite crystals within the same thin section. Arsenic was not detected by SEM-EDX in any pyrite. Chalcopyrite and bornite analysed by SEM-EDX are close to their stoichiometric formulae with trace element concentrations below the analytical detection limits (Waizy, 2018). These SEM-EDX observations indicate that trace-element enrichment in the principal copper sulphides is generally limited, thereby providing an important framework for interpreting the more sensitive ICP-MS analyses presented in the following sections.
3. Materials and Methods
3.1. Sulphide Geochemistry from Partial Acid Dissolution and ICP-MS
Due to deep weathering and supergene alteration, primary sulphide minerals are no longer present in near-surface rocks in the Aynak area. Consequently, all sulphide samples used in this study were obtained from deep exploration drillcore provided by the Metallurgical Corporation of China (MCC) and the Ministry of Mines and Petroleum (MoMP). A total of 31 sulphide-bearing drillcore samples were obtained from the Central and Western Aynak. In addition, 5 sulphide-bearing samples were collected from the ‘potential copper source rocks’ that outcrop with minimal oxidation in the Khayarkhana area. Waizy et al. (2020) report the results of detailed petrographic studies undertaken to understand the petrography and mineralogy of the samples and to establish textural relationships between the ore minerals.
To obtain the separation of pure sulphides from intergrown silicates and carbonates, the ~150-250 g drillcore samples were crushed and passed through sieves of various mesh sizes. Sulphide particles from the <500 µm and <250 µm fractions were handpicked under a binocular microscope and then crushed and treated with dilute acetic acid to dissolve any associated carbonate minerals while minimising attack on the sulphide phases. Aliquots (100 mg) of the sulphide concentrates were digested for 3 hours in concentrated nitric acid (HNO3) then centrifuged to remove residual solids and diluted twenty-fold prior to ICP-MS analysis. Details of the preparation procedure and a complete datasheet obtained from this method are available as Supplementary Materials. The resulting ICP-MS data are presented in section 4.1
3.2. Fluid Inclusion Microscopy
Fluid inclusions hosted in quartz associated with the Aynak copper mineralization were analysed to characterise the nature of the ore-forming fluids and to constrain the pressure-temperature (P-T) conditions of mineralization. Eight quartz-bearing samples from mineralised veins and hydrothermally altered host rocks in the Central and Western Aynak copper deposits were selected for fluid inclusion microthermometry (Table 2).
Analyses were undertaken on doubly polished wafers approximately 100 µm thick using a Linkam THM600 heating/freezing stage coupled to a Nikon ECLIPSE E600 microscope at the School of Applied Sciences, University of Brighton. The stage permits heating to 600⁰C and cooling to –190⁰C by circulating liquid nitrogen around the sample chamber. The LINKAM system is microprocessor controlled, and heating/freezing rate can be controlled accurately. Measured variables included the degree of fill of individual inclusions, and the temperatures at which certain phase changes take place (Shepherd et al., 1985; Fall, 2008), including (i) the first melting of the inclusion following freezing (TFM); (ii) total homogenization of the liquid and vapour phases (TH); and (iii) dissolution (homogenisation) of daughter minerals (e.g., halite or sylvite, TS). The resulting microthermometric data are presented in section 4. The heating/freezing stage was calibrated by carrying out the thermometric analysis on: (a) CO2 melting within a synthetic CO2 inclusion (-56.6⁰C), (b) ice melting of distilled water (normally 0⁰C), (c) melting of water-CO2 clathrate-hydrate about 9.9⁰C, (d) the temperature of CO2 homogenization (26.9⁰C), (e) the total melting of potassium permanganate (396⁰C), and (f) the heating rates during measurement (normally 0.5-1⁰C/min at low T and 5-10⁰C/min at high T).
4. Results
4.1. Sulphide Geochemistry
The aim of ICP-MS analysis was to quantify the concentrations of major components (Cu and Fe) and trace elements (including Ni, Co, As, Ag, Au, V, Mn, Mo, Te, Se, Sb, Cd and Tl) in sulphide concentrates obtained from the Aynak deposit and from the ‘potential source rocks’ of Khayarkhana area. Table 3a presents the concentrations of metals and metalloids typically hosted by sulphide minerals (Fe, Co, Ni, Cu, Zn, As, Se, Mo, Ag, Cd and Pb), normalised to a total of 100 wt%. Concentrations of Sb, Tl and Au were excluded from the normalisation because they were consistently near or below their analytical detection limits. Although sulphur was not analysed, for the purposes of this discussion it is considered that all these elements are contained in sulphides. However, despite the acetic acid treatment (section 3a), some Fe may be also hosted by residual carbonate and silicate inclusions in the concentrates.
In Table 3a, samples are listed in order of decreasing Cu values in each area (CA, WA, KH) to facilitate comparisons between the dominant sulphide mineralogy (e.g., bornite, chalcopyrite, pyrite) and the geochemistry of the sulphide separates. Samples are listed in the same order in Table 3b which shows modal proportions (expressed as weight %, not volume %) of major sulphide species that have been calculated from the metal concentrations. Stoichiometrically pure bornite has 85% Cu and 15% Fe based on metal-only proportions, and similarly chalcopyrite has approximately 53% Cu and 47% Fe. Based on these stoichiometric proportions, Fe and Cu in the Cu-rich samples are assigned to bornite or chalcopyrite or, in a few cases, both. For the purpose of these calculations, normalised Zn values are assigned to sphalerite, considered to be the only Zn-bearing sulphide in Aynak ore, and Co and Ni values are assigned to a hypothetical CoNiFeS phase (not a specific mineral). The remaining Fe not accounted for by these phases is assigned to iron sulphides, noting that pyrite and pyrrhotite cannot be distinguished in the absence of data on sulphur concentrations in the acid-digested sulphide separates.

Five Aynak samples in which bornite had been visually confirmed as the dominant sulphide yield calculated percentages close to 100% bornite (Table 3b). Using the stoichiometric formula for bornite, Cu5FeS4, in some cases the calculated proportion exceeds 100%. This may be due to calibration issues and/or to natural variation in bornite composition. Natural bornite exhibits substantial variation in the relative amounts of copper and iron with solid solution extending towards chalcopyrite (CuFeS2) and digenite (Cu9S5); the Fe:Cu:S ratio of high-temperature solid solutions is variable, and cooling leads to various exsolutions (Morimoto and Kullerud, 1961; Cook et al., 2011) which can be distinguished at nanometre scales (Ciobanu et al., 2017).
Cobalt and nickel show no systematic correlation on a scatterplot (Figure 5a). Bornite-dominant samples are notably poor in these elements. Nickel concentrations are highest (up to 1.9 wt%) in one pyrite-dominant sample from Aynak (sample 3703-3) and in two samples from the Khayarkhana area (TK-Kh3 and TK-Kh5-S2). The latter comprise mainly pyrrhotite and the likely host mineral for Ni is pentlandite. The Aynak pyrite sample enriched in Ni, sample 3703-3, is a quartz-dolomite marble (Table 1) and also contains pyrrhotite (part-replaced by post-metamorphic pyrite), although other pyrrhotite-bearing Aynak samples are not particularly enriched in Ni.
Two chalcopyrite-rich samples are relatively rich in both Co and As, one from Central Aynak (2901-3-S2) and one from Western Aynak (301-2-S1) (Table 3a and Figure 5b). Petrographic and SEM investigations confirmed the presence of cobaltite in sample 2901-3 as well as in Western Aynak chalcopyrite-rich sample 304-3 (Waizy, 2018). The enrichment of arsenic and cobalt in sample 301-2-S1 is consistent with the presence of cobaltite despite this not being observed in a thin section (Waizy, 2018). Considering the low arsenic contents of other sulphide samples that report 1.0-1.3% Co in the normalised data, namely 2901-3-S2, 301-5 and 304-2 (Table 3a), the Co-bearing, As-absent sulphide carrollite (CuCo)2S4 may occur in these samples. Carrollite has previously been reported by Yurgenson et al. (1981) as occurring in Aynak ore but was not observed in thin sections of the samples used in this study (Waizy, 2018; Waizy et al. 2020) (discussed in section 5.1).
Relatively high Zn values in two samples from Central Aynak (1.2% of total sulphide-associated metal content in 104-8 and 2.6% in 3901-2: Table 3a) indicate the presence of sphalerite (Table 3b). Petrographic examination confirmed the presence of sphalerite in sample 3901-2 (Waizy et al. 2020) but not in other drill-core samples. Sample 104-8 and other samples that contain Zn up to 0.7% of the sulphide-associated metals are inferred to contain minor sphalerite that was not observed in thin sections. Cadmium concentrations, which are generally very low in Aynak sulphides, reach 45 ppm (0.004%: Table 3a) in sphalerite-bearing sample 3901-2, and similar Cd values occur in two sulphide concentrates from the Khayarkhana area that contain 0.6-0.7% Zn (Table 3a and Figure 5c).
Western Aynak sample 301-3-S1 reports 0.23% Mo in the sulphide-associated metal content (Table 3a), suggesting that this rock contains molybdenite. Waizy (2018) and Waizy et al. (2020) report that, in petrographic and SEM studies, molybdenite was found in two chalcopyrite-rich samples from Central Aynak namely 301-2 and 304-4. In the thin section of sample 304–4, molybdenite forms irregular elongate grains 30–50 μm in length associated with chalcopyrite, pyrite and minor cobaltite. However, in the sulphide concentrate obtained from this sample, the Mo concentration is low (50 ppm, shown as 0.005% in Table 3a). Although molybdenite was petrographically identified in sample 304-4, the highest bulk Mo concentration was recorded in sample 301-3-S1.
In the analysed sample set, the highest Ag concentrations (up to 0.04 wt%) are in two Khayarkhana area sulphide samples (Table 3a and Figure 5d). Ag shows no systematic correlation with either Cu (Figure 5d) or with Pb contents in the samples. Pb values in the normalised dataset are up to 0.033 wt% in Aynak samples and 0.043 wt% in a Khayarkhana area.
4.2. Fluid Inclusions
As the host rocks of the copper mineralization in Aynak area were affected by regional metamorphism and deformation, primary fluid inclusions were not observed within the analysed samples. Of the eight samples prepared for fluid inclusion analysis, only one samples (104-5) from Central Aynak contained secondary fluid inclusions suitable for microthermometric analysis. The secondary fluid inclusions hosted by quartz in this sample are commonly small (around 10-20 µm) and may be of different generations. Of the observed fluid inclusions, 60–70% contain a halite daughter crystal recognised by its cubic habit (Shepherd et al., 1985) that occupies 5–30% of the inclusion volume (Figure 6a-b). The remaining inclusions are two phase aqueous inclusions consisting of liquid water and vapour bubble. In addition to these relatively large inclusions, numerous trails of smaller (about 2–8µm) secondary inclusions are present which commonly contain halite daughter crystals. Some of these smaller inclusions are necked down and deformed, often in the orientation of the fractures within the samples, therefore few were suitable for thermometric analysis (Figure 6c-d).
The temperatures of first melting (TFM); final ice melting (TIce), where it is present; total homogenization (THtot); and halite dissolution (TSol), where the halite daughter crystal was present, were measured during microthermometric analysis (Table 4). Measurements of first melting temperature were difficult to obtain due to the secondary nature of the fluid inclusions and their small sizes. Nevertheless, several measurements for the TFM were obtained (Table 4). The measured TFM were compared with the eutectic temperatures of experimentally determined salt-water systems summarized by Shepherd et al. (1985; Table 3).
The measured values for TFM fall into two main ranges, from -27 to -29 (n=3) and -53 to -56 (n=5). These eutectic temperatures suggest that the trapped fluids contain Na, Mg, Ca, and possibly K chlorides. The presence of halite daughter crystals indicates that many inclusions appear to be saturated with respect to NaCl, while the occurrence of minor, unidentified secondary daughter phases in a few inclusions may represent salts of one or more of the other components, such as Mg, Ca, or K (Table 5).
Total homogenization temperatures (THtot) were measured for 17 secondary fluid inclusions hosted by quartz (Table 4). The measured THtot values range from 156⁰C to 296⁰C, with all inclusions homogenising from the liquid + vapour state to a single liquid phase (Figure 7). In some inclusions, the presence of minor CO2 may have caused decrepitation before complete homogenization was achieved.
For fluid inclusions that are unsaturated with respect to halite, salinity (equivalent wt% NaCl) can be calculated for the NaCl-H2O binary system from the freezing-point depression, defined as the decrease in the final ice-melting temperature caused by dissolved NaCl (Equation 1; Bodnar, 1993). In Equation 1, θ represents the freezing-point depression (°C) relative to 0 °C at which ice melts:
Salinity (equiv. wt% NaCl) = 1.78ϴ - 0.0442ϴ2 + 0.000557ϴ3
For fluids inclusions saturated with respect to NaCl, salinity was calculated from the halite dissolution temperature using the empirical relationship of Sterner et al. (1988) (Equation 2). In Equation 2, γ represents the halite dissolution temperature (T/100, where T is expressed in °C).
Salinity (equiv. wt% NaCl) = 26.242 + 0.4928γ + 1.42γ2 – 0.223γ3 + 0.04129γ4 + 0.006295 γ5 – 0.001967 γ6 + 0.0001112 γ7
Of the 17 secondary quartz-hosted fluid inclusions analysed microthermometrically, halite dissolution temperatures (TSol) suitable for salinity calculations were obtained for 11 inclusions (Table 4). Salinity values calculated using Equation 2 are presented in Table 4 and Figure 8.
The salinity values obtained from sample 104-5 (Figure 8) are high, generally exceeding 30 equivalent wt% NaCl. Measured salinities range from 32.1 to 47.4 equivalent wt% NaCl, though only two measurements yielded values greater than 40 equivalent wt% NaCl (45.1 and 47.4 equivalent wt% NaCl respectively). McGowan (2003) noted that salinity estimates derived from Equation 2 should be regarded as approximate because the equation is most accurate where THtot exceeds TSol. Sterner et al. (1988) further suggested that, for THtot values above 300 °C, the uncertainty may reach approximately ±5 equivalent wt% NaCl.
The fluid inclusion data indicate that the fluids circulating through the quartz-dolomite marble at Aynak, either during or post-dating vein formation, were relatively hot (approximately 150-300⁰C) and saline in nature. However, homogenization temperatures represent minimum trapping temperatures and may not correspond to the actual temperatures of mineral precipitation, which depend on both pressure (controlled largely by burial depth) and the density of the trapped fluid (Shepherd et al., 1985). The host rocks for copper mineralization in Aynak area were subjected to considerable burial depth during basin-scale deformation. This depth of burial (lithostatic pressure) has significant effects on the true temperature formation of the mineralized beds, and ideally it would be useful to correct the homogenization data with respect to the pressure by using the equations suggested by Shepherd et al. (1985). As during this study measurements of the secondary fluid inclusions from only one sample were acquired and due to the lack of information on actual depths of burial, a pressure correction was not applied to the homogenization temperatures. Nevertheless, a pressure-temperature diagram for the system NaCl-H2O is presented (Figure 9) using methods described in the caption of Figure 9.
The lines of determination of pressure-temperature conditions are limited because of the sparsity of measurable fluid inclusions, and the complex nature of the assemblages. Fluid inclusions that homogenise by halite dissolution must have pressures above the liquid vapour curve, and calculation of P at Tsol halite suggests minimum trapping pressures of around 100-200 bar. Lw+V inclusions homogenise at higher temperature than Lw+Sh+V, and the isochores constructed suggest that these inclusions must have been trapped at lower pressure, higher temperature or both compared to the halite-bearing inclusions. The trapping conditions cannot be fully constrained without independent pressure or temperature constraints, but the data are consistent with interaction of high salinity brines with the deposit followed by dilution with increasing temperature. Alternatively, it may be that dilution occurred during exhumation of the deposit and Lw+V fluid inclusions were trapped at lower pressure.
5. Discussion
5.1. Sulphide Mineralogy and Geochemistry
ICP-MS analyses of dissolved sulphide concentrates from drill-core samples of the Aynak orebody and sulphide-bearing outcrop samples from the Khayarkhana area indicate that the analysed sulphides comprise variable proportions of bornite, chalcopyrite and iron sulphides, together with minor Co, Ni, Zn, As and Mo-bearing phases. Trace amounts of Cd in some Zn-bearing samples is likely to be hosted in sphalerite. Trace amounts of Se, Ag and Pb were detected in many of the analysed samples but exhibit little correlation with other elements and could not be assigned to specific sulphide minerals. This would require in-situ micro-analysis of individual sulphide crystals using LA-ICP-MS.
Most Aynak sulphide concentrates are characterised by low As concentrations, and only one analysed sulphide concentrate reported >0.35% As in the total sulphide-associated element values (Table 3a). Based on the low concentration of As in other chalcopyrite-rich samples, combined with relative enrichment in Co and Ni, it is suggested that carrollite, (CuCo)2S4, is the likely host for Co rather than the arsenic-rich mineral cobaltite (CoAsS). Carrollite is a common mineral in the Zambian and Congo Copperbelts and is the major cobalt-bearing sulphide in the Zambian sector (Mendelsohn, 1961). Although carrollite has previously been reported from Aynak (section 4.1), it was not identified in during the more recent petrographic investigations of Waizy (2018) and Waizy et al. (2020). The formula is more specifically Cu1.2+(Co2.4+)2(S1.5-)4 (Pattrick et al., 2008) and carrollite commonly contains Ni (Craig et al., 1979; Riley, 1980). A solid solution exists between CuCo2S4 and Cu(Ni,Co)2S4 in which Ni can replace 50% of the Co (Wagner and Cook, 1999). Pentlandite is probably the host mineral for Ni enrichment in samples that contain pyrrhotite.
Cook et al. (2011) report that bornite from skarn and epithermal ore deposits hosts significant amounts (hundreds to thousands of ppm) of Se and Ag, but is a poor host for Ni and Co. In our bulk dissolution analyses of Aynak sulphide samples, neither Se nor Ag show a significant correlation with Cu (Table 3a and Figure 5). In contrast, our results indicate that Se is relatively enriched in the pyrite- and pyrrhotite-rich samples, attaining concentrations of 0.019% (normalised data) in Central Aynak sample 3703-3 and in pyrrhotite-dominant sulphides from the Khayarkhana area.
In section 1 it was mentioned that the Welayati Formation basement rocks exposed in the Khayarkhana area (Tara Khel) north of Aynak (Figure 1b) have been considered by previous researchers as representative of the ‘potential source rocks’ for the mineralizing fluids that transported copper to form the Aynak deposit. Our analyses of a small number of sulphide samples from Tara Khel area (Table 1 and Table 3; Figure 5) indicate that Ni and Co have similar concentration ranges to the Aynak sulphides, but As, Se and Ag have distinctly different ranges in concentration to the Aynak sulphides. On the basis of these geochemical differences, our data do not support the hypothesis that the Welayati Formation basement rocks were the principal source of the metals forming the Aynak deposit. Instead, we favour a model in which metals were leached from the sedimentary strata of the Loy Khwar Formation in which the Aynak deposit is hosted. The metals were transported laterally by saline basinal brines, consistent with the fluid inclusion evidence presented in this study. The predominance of bornite–chalcopyrite assemblages, the inferred presence of carrollite, and the occurrence of highly saline basinal brines are broadly consistent with fluid evolution models proposed for sediment-hosted stratiform copper deposits in the Central African Copperbelt (e.g., Hitzman et al., 2005; Cailteux et al., 2005; Selley et al., 2005).
5.2. Fluid Inclusion Data of Comparable Ore Deposits
The fluid inclusion dataset presented here for Aynak deposit, albeit limited in the number of samples analysed, represent the first published such dataset for copper deposits in Afghanistan. Fluid inclusion data for the Zambian Copperbelt deposits is limited, considering the importance of these metal-rich ore horizons and the extensive use of fluid inclusion analysis in the study of ore deposits. Annels (1989) presented fluid inclusion analysis made by Cunningham (1986) on samples from Chambishi and Chambishi Southeast, who focused on investigating the mineralization temperature using sub-concordant quartz veins that host sulphides. Annels (1989), based on the fluid inclusion work of Cunningham (1986), interpreted the quartz veins and related sulphides are introduced at the same time as disseminated sulphides due to identical mineralogy of host rocks and veins and similar isotope composition. He reported ranges of ore fluid salinities and temperatures of 9-16% and 130⁰-160⁰C for veins associated with early pyrite and carrollite, and 16-22% and 125⁰-145⁰C for paragenetically later bornite and chalcopyrite. These contrast with the much higher temperatures and salinities of fluids reported here from the Aynak orebody.
Richards et al. (1988) undertook fluid inclusion analysis on the Musoshi deposit in Zambia, using data from vertical quartz-hematite vein arrays from within the footwall arkoses. They proposed a fluid temperature of approximately 395 ± 5⁰C, with 39 wt% NaCl, 15 wt% KCl, and minor amounts of CO2. These are significantly higher in both temperature and salinity than the Aynak fluids (excepting two high-salinity inclusions). Richards et al. (1988) interpreted halite dissolution temperatures to approximate the true trapping temperatures of the fluids, whereas the measured THtot values (335–380 °C) were regarded as minimum trapping temperatures.
McGowan (2003) carried out fluid inclusion analysis on the Nchanga copper-cobalt deposit of Zambian Copperbelt (subsequently reported by McGowan et al., 2006). Based on fluid characteristics, in combination with alteration mineral assemblages and whole-rock geochemistry, the authors suggested a potential ore-forming fluid of medium temperatures (after pressure correction), that was variously 300⁰ to 310⁰C within faults and 220⁰ to 240⁰C within ore zones (THtot = 230 to 240⁰C and 160⁰ to 180⁰C respectively) and high salinity in the range 30 to 38 equivalent wt% NaCl. It should be noted that, based on structural associations of higher ore grades with thrust faults and differing temperatures of fluids in the fault and strata-hosted orebodies, these authors interpreted the Nchanga deposit as epigenetic, suggesting that Cu and Co were introduced to the host rocks during compressional deformation rather than during sedimentation.
The quartz hosted fluid inclusions characteristics documented at Aynak are broadly comparable with those reported from Nchanga and other deposits of the Central African Copperbelt. Homogenization temperatures of 150⁰ to 300⁰C and salinities of 32 to 47 equivalent wt% NaCl (except for two outlier measurements) indicate that the fluids were highly saline and medium temperature. The fluid inclusion data indicate that the Aynak deposit interacted with moderately hot, high salinity (chloride-rich) brines during at least one stage of its geological evolution. The current limitations of the data set mean that this cannot be directly linked to either copper transport and deposition or to remobilisation during metamorphism. Nevertheless, comparison with fluid inclusion studies from other sediment-hosted copper deposits strongly suggests that highly saline basinal brines played an important role in the formation and evolution of the Aynak copper deposit.
In light of the geological and sulphur isotope observations made by Waizy et al. )2020), and current understanding of the Central African Copperbelt, a magmatic source for these high-salinity brines is considered unlikely. Instead, the medium temperature and high-salinity character is consistent with basinal fluids generated within the sedimentary basin, which were expelled toward the basin margins during subsequent compression and deformation (Oliver, 1986; Hanor, 1979; Garven and Raffensperger, 1997; McGowan et al. 2006). This interpretation is also supported by the predominance of bornite–chalcopyrite mineralisation, the inferred occurrence of carrollite, and the geochemical similarities between the Aynak deposit and sediment-hosted stratiform copper systems elsewhere in the Central African Copperbelt (Hitzman et al., 2005; Cailteux et al., 2005).
6. Conclusions
- The hypogene sulphide mineralisation at the Aynak deposit is dominated by chalcopyrite, bornite and pyrite, occurring as stratabound laminae, disseminations, cross-cutting veins and metamorphic segregations. Minor pyrrhotite, chalcocite, cobaltite, carrollite, sphalerite and molybdenite occur as disseminated grains and inclusions, which indicate a more complex sulphide assemblage than previously recognised.
- ICP-MS analyses of dissolved sulphide-rich separates from drill-core samples of the Aynak orebodies are interpreted in terms of the widely ranging proportions of the major and minor sulphide minerals, and substitution of trace elements in certain sulphides. The geochemical data for cobalt and arsenic confirm that cobaltite is present in some samples and indicate the presence of carrollite in other samples (despite carrollite not being observed in thin section petrography).
- Differences in the trace element geochemistry of sulphide-rich separates from the Aynak orebodies and from basement metamorphic rocks outcropping in the Khayarkhana area suggest that the basement rocks were unlikely to have been the principal source of the metals forming the stratabound Aynak copper deposit.
- Fluid inclusion data for quartz-hosted secondary inclusions, integrated with petrographic observations, whole-rock geochemistry and sulphur isotope evidence, indicate interaction between the Aynak deposits and moderately hot (approximately 150⁰ to 300⁰C, pressure uncorrected), highly saline (32 to 47 equivalent wt% NaCl) chloride brines. These hydrothermal fluids were capable of transporting significant quantities of dissolved components including Mg, Ca, Na as well as Cu. Although the available data do not allow this fluid event to be unequivocally linked to either primary copper mineralisation or later metamorphic remobilisation, comparison with other sediment-hosted stratiform copper deposits strongly suggests that highly saline basinal brines played an important role in the formation of the Aynak giant copper deposit.
- This study provides the first integrated sulphide geochemistry and fluid inclusion dataset for a copper deposit in Afghanistan, offering new constraints on the origin of the Aynak deposit and its relationship to sediment-hosted stratiform copper systems elsewhere in the Central African Copperbelt.
Supplementary
The following supporting information can be downloaded at: https:nnn Excel workbook comprising 2 sheets: (a) ICP-MS measurements of diluted solutions of acid-dissolved sulphide samples; (b) concentrations of selected metals and metalloids and their proportions normalised to total 100 wt%; (c) sorted version of data used to derive normative proportions of the major sulphides.:
Acknowledgments
This paper is based on research undertaken as part of a Ph.D. project at the University of Brighton, UK. The authors gratefully acknowledge Dr Bahawodin Baha for facilitating financial support for the project. We also thank colleagues at the Ministry of Mines and Petroleum of Afghanistan, particularly the Aynak Copper Project Office, and the Afghanistan Geological Survey (AGS) for their assistance during fieldwork and sample collection. Pete Lyons and Magda Grove of the School of Applied Sciences, University of Brighton, are gratefully acknowledged for their technical assistance with sample preparation and sulphide geochemical analyses.
References
- Afghanistan Geological Survey (AGS); British Geological Survey (BGS). Aynak Information Package. Part I: Introduction. 2005a. Available online: https://www.bgs.ac.uk/afghanminerals/docs/tenders/Aynak/PartI_Aynak_Information_Package.pdf</u>.
- Afghanistan Geological Survey (AGS); British Geological Survey (BGS). Aynak Information Package. Part II: Geological Setting of Aynak and Summary of Exploration. 2005b. Available online: https://www.bgs.ac.uk/afghanminerals/docs/tenders/Aynak/PartII_Western_Aynak.pdf</u>.
- Akocdzhanyan, L.A.; Kryukov, Y.A.; Zagorodniy, G.G.; Kashin, A.A.; Koloskov, V.P.; Kubatkin, L.V.; Makimov, T.M.; Nevretdinov, E.B.; Novosoltsev, V.M.; Sulikayev, K.I.; Cvetkov, L.P. Preliminary Report on Results of Geological Exploration of the Aynak Copper Deposit during 1974–1976. English translation compiled by Afghanistan Geological Survey and British Geological Survey (2005). 1977. Available online: https://www.bgs.ac.uk/afghanminerals/docs/tenders/Aynak/PartIII_Aynak_Central_translation.pdf</u>.
- Annels, A.E. Ore genesis in the Zambian Copperbelt, with particular reference to the northern sector of the Chambishi Basin. In Sediment-Hosted Stratiform Copper Deposits; Boyle, R.W., Brown, A.C., Jefferson, C.W., Jowett, E.C., Kirkham, R.V., Eds.; Geological Association of Canada, Special Paper, 1989; Volume 36, pp. 427–452. [Google Scholar]
- Archer, D.G. Thermodynamic properties of the NaCl–H₂O system. II. Thermodynamic properties of NaCl(aq), NaCl·2H₂O(cr), and phase equilibria. J. Phys. Chem. Ref. Data 1992, 21, 793–829. [Google Scholar] [CrossRef]
- Bakker, R.J. Package FLUIDS 1. Computer programs for analysis of fluid inclusion data and for modelling bulk fluid properties. Chem. Geol. 2003, 194, 3–23. [Google Scholar] [CrossRef]
- Bodnar, R.J. Revised equation and table for determining the freezing point depression of H₂O–NaCl solutions. Geochim. Et. Cosmochim. Acta 1993, 57, 683–684. [Google Scholar] [CrossRef]
- Bodnar, R.J. Synthetic fluid inclusions: XII. The system H₂O–NaCl. Experimental determination of the halite liquidus and isochores for a 40 wt.% NaCl solution. Geochim. Et. Cosmochim. Acta 1994, 58, 1053–1063. [Google Scholar] [CrossRef]
- Borisenko, A.S. Study of the salt composition of solutions in gas–liquid inclusions in minerals by the cryometric method. Sov. Geol. Geophys. 1977, 18, 11–19. [Google Scholar]
- Cailteux, J.L.H.; Kampunzu, A.B.; Lerouge, C.; Kaputo, A.K.; Milesi, J.-P. Genesis of sediment-hosted stratiform copper–cobalt deposits, Central African Copperbelt. J. Afr. Earth Sci. 2005, 42, 134–158. [Google Scholar] [CrossRef]
- Ciobanu, C.L.; Cook, N.J.; Ehrig, K. Ore minerals down to the nanoscale: Cu-(Fe)-sulphides from the iron oxide copper gold deposit at Olympic Dam, South Australia. Ore Geol. Rev. 2017, 81, 121–138. [Google Scholar] [CrossRef]
- Collett, S.; Faryad, S.W.; Mosazai, A.M. Polymetamorphic evolution of the granulite-facies Paleoproterozoic basement of the Kabul Block, Afghanistan. Mineral. Petrol. 2015, 109, 463–484. [Google Scholar] [CrossRef]
- Cook, N.J.; Ciobanu, C.L.; Danyushevsky, L.V.; Gilbert, S. Minor and trace elements in bornite and associated Cu-(Fe)-sulfides: A LA-ICP-MS study. Geochim. Et. Cosmochim. Acta 2011, 75, 6473–6496. [Google Scholar] [CrossRef]
- Craig, J.R.; Vaughan, D.J.; Higgins, J.B. Phase relations in the Cu–Co–S system and mineral associations of the carrollite (CuCo₂S₄)–linnaeite (Co₃S₄) series. Econ. Geol. 1979, 74, 657–671. [Google Scholar] [CrossRef]
- Craig, J.R.; Vokes, F.M. The metamorphism of pyrite and pyritic ores: An overview. Mineral. Mag. 1993, 57, 3–18. [Google Scholar] [CrossRef]
- Cunningham, M.J. Copper-Cobalt Mineralization in the Northern Portion of the Chambishi Basin, Zambia. Ph.D. Thesis, University College Cardiff, Cardiff, UK, 1986. [Google Scholar]
- Fall, A. Application of Fluid Inclusions in Geological Thermometry. Ph.D. Thesis, Virginia Polytechnic Institute and State University, Blacksburg, VA, USA, 2008. Available online: http://scholar.lib.vt.edu/theses/available/et12262008-152910/unrestricted/ETD_AFall1.pdf</u>.
- Feruz, N.M. The Geological Structure of the Kabul Tectonic Zone (Afghanistan). Ph.D. Thesis, Moscow State University, Moscow, Russia, 1973. [Google Scholar]
- Fontbote, L.; Kouzmanov, K.; Chiaradia, M.; Pokrovski, G.S. Sulfide minerals in hydrothermal deposits. Elements 2017, 13, 97–103. [Google Scholar] [CrossRef]
- Garven, G.; Raffensperger, J.P. Hydrogeology and geochemistry of ore genesis in sedimentary basins. In Geochemistry of hydrothermal ore deposits, 3rd edition; Barnes, H.L., Ed.; John Wiley & Sons, Inc.: New York, USA, 1997; pp. 125–189. [Google Scholar]
- Gusev, I.A.; et al. Geological Structure of the Kabul Copper Ore Field; Afghanistan Geological Survey Archive: Kabul, Afghanistan, 1979. [Google Scholar]
- Hanor, J.S. The sedimentary genesis of hydrothermal fluids. In Geochemistry of hydrothermal ore deposits, 2nd edition; Barnes, H.L., Ed.; John Wiley & Sons, Inc.: New York, USA, 1979; pp. 137–189. [Google Scholar]
- Hitzman, M.W.; Kirkham, R.V.; Broughton, D.W.; Thorson, J.; Selley, D. The sediment-hosted stratiform copper ore system. In Economic Geology 100th Anniversary Volume (1905–2005); Hedenquist, J.W., Thompson, J.F.H., Goldfarb, R.J., Richards, J.P., Eds.; Society of Economic Geologists: Littleton, CO, USA, 2005; pp. 609–642. [Google Scholar]
- Large, R.R.; Bull, S.W.; Cooke, D.R.; McGoldrick, P.J. A genetic model for the HYC deposit, Australia, based on regional sedimentology, geochemistry and sulfide–sediment relationships. Econ. Geol. 1998, 93, 1345–1368. [Google Scholar] [CrossRef]
- Lecumberri-Sanchez, P.; Steele-MacInnis, M.; Bodnar, R.J. A numerical model to estimate trapping conditions of fluid inclusions that homogenize by halite disappearance. Geochim. Et. Cosmochim. Acta 2012, 92, 14–22. [Google Scholar] [CrossRef]
- McGowan, R.R. The Origin of the Nchanga Copper–Cobalt Deposits of the Zambian Copperbelt. Ph.D. Thesis, Unpublished. University of Southampton, Southampton, UK, 2003; p. 247 pp. [Google Scholar]
- McGowan, R.R.; Roberts, S.; Boyce, A.J. Origin of the Nchanga copper–cobalt deposits of the Zambian Copperbelt. Miner. Depos. 2006, 40, 617–638. [Google Scholar] [CrossRef]
- Mendelsohn, F. The Geology of the Northern Rhodesian Copperbelt; Macdonald, London, UK, 1961; p. 423 pp. [Google Scholar]
- Mennessier, G. Les caractères structuraux des montagnes de la région de Kaboul (Afghanistan); (In French). Afghanistan Geological Survey Archive: Kabul, Afghanistan, 1961. [Google Scholar]
- Ministry of Mines and Petroleum (MoMP); Afghanistan Geological Survey (AGS). Copper of Afghanistan. Minerals in Afghanistan Series. 2014. Available online: http://mom.gov.af/Content/files/MOMP_COPPER_%20Midas_Jan_2014_LATEST.pdf</u>.
- Morimoto, N.; Kullerud, G. Polymorphism in bornite. Am. Mineral. 1961, 46, 1270–1282. [Google Scholar]
- Oliver, J. Fluids expelled tectonically from orogenic belts: their role in hydrocarbon migration and other geologic phenomena. Geology 1986, 14, 99–102. [Google Scholar] [CrossRef]
- Pattrick, R.A.D.; Coker, V.S.; Pearce, C.I.; Telling, N.D.; van der Laan, G. The oxidation state of copper and cobalt in carrollite, CuCo₂S₄. Can. Mineral. 2008, 46, 1317–1322. [Google Scholar] [CrossRef]
- Richards, J.P.; Krogh, T.E.; Spooner, E.T.C. Fluid inclusion characteristics and U–Pb rutile age of late hydrothermal alteration and veining at the Musoshi stratiform copper deposit, Central African Copperbelt, Zaire. Econ. Geol. 1988, 83, 118–139. [Google Scholar] [CrossRef]
- Riley, J.F. Ferroan carrollites, cobaltian violarites, and other members of the linnaeite group: (Co,Ni,Fe,Cu)₃S₄. Mineral. Mag. 1980, 43, 733–739. [Google Scholar] [CrossRef]
- Selley, D.; Broughton, D.; Scott, R.J.; Hitzman, M.W.; Bull, S.W.; Large, R.R.; McGoldrick, P.J.; Croaker, M.; Pollington, N. A new look at the geology of the Zambian Copperbelt. In Economic Geology 100th Anniversary Volume (1905–2005); Hedenquist, J.W., Thompson, J.F.H., Goldfarb, R.J., Richards, J.P., Eds.; Society of Economic Geologists: Littleton, CO, USA, 2005; pp. 965–1000. [Google Scholar]
- Shepherd, T.J.; Rankin, A.H.; Alderton, D.H.M. A Practical Guide to Fluid Inclusion Studies; Blackie, Glasgow and London, UK, 1985; p. 239 pp. [Google Scholar]
- Shroder, J.F.; Eqrar, N.; Waizy, H.; Ahmadi, H.; Weihs, B.J. Review of the geology of Afghanistan and its water resources. Int. Geol. Rev. 2022, 64, 1009–1031. [Google Scholar] [CrossRef]
- Slavin, V.I.; Fedorov, T.O.; Feroz, N.M. The Geology and Age of the Metamorphic Complex in the Kabul District. In Vestnik Moskovskogo Gosudarstvennogo Universiteta (Vestnik MSU); Moscow, Russia, 1972. [Google Scholar]
- Sterner, S.M.; Hall, D.L.; Bodnar, R.J. Synthetic fluid inclusions. V. Solubility relations in the system NaCl–KCl–H₂O under vapour-saturated conditions. Geochim. Et. Cosmochim. Acta 1988, 52, 989–1005. [Google Scholar] [CrossRef]
- Taylor, B.E. Biogenic and thermogenic sulfate reduction in the Sullivan Pb–Zn–Ag deposit, British Columbia (Canada): Evidence from micro-isotopic analysis of carbonate and sulfide in bedded ores. Chem. Geol. 2004, 204, 215–236. [Google Scholar] [CrossRef]
- Wagner, T.; Cook, N.J. Carrollite and related minerals of the linnaeite group: solid solutions and nomenclature in light of new data from the Siegerland district, Germany. Can. Mineral. 1999, 37, 545–558. [Google Scholar]
- Waizy, H. Geology and Genesis of the Aynak Copper Deposits in the Kabul Basin, Afghanistan. Ph.D. Thesis, Unpublished. University of Brighton, Brighton, UK, 2018; p. 230 pp. [Google Scholar]
- Waizy, H.; Moles, N.R.; Smith, M.P.; Boyce, A.J. Formation of the giant Aynak copper deposit, Afghanistan: Evidence from mineralogy, lithogeochemistry and sulphur isotopes. Int. Geol. Rev. 2020, 63, 2076–2104. [Google Scholar] [CrossRef]
- Yurgenson, G.A.; Akram, A.M.; Dzhelani, K.G.; Gavrilov, A.M. Mineralnyye tipy rud I posledovatel’nost’ obrazovaniya sul’fidov na mestorozhdenii medi Aynak (Respublika Afganistan) [Type minerals of ores and sulphide sequence in Aynak copper deposit, Afghanistan]. Izv. Vyss. Uchebnykh Zaved. Geol. I Razved. 1981, v. 1981(no. 6), 150–153. [Google Scholar]
- Zhang, Y.G.; Frantz, J.D. Determination of the homogenization temperatures and densities of supercritical fluids in the system NaCl–KCl–CaCl₂–H₂O using synthetic fluid inclusions. Chem. Geol. 1987, 64, 335–350. [Google Scholar] [CrossRef]
Figure 1.
(a) Tectonic map of Afghanistan with locations of the Kabul Block and the Aynak copper deposits, modified from AGS and BGS (2005a) and Waizy et al. (2020). (b) Digital terrain model of the northern part of the Kabul Block superimposed with locations of mineralization, modified from MOMP and AGS (2014). Orange squares indicate sediment hosted copper occurrences; the Aynak deposits are arrowed. Green squares indicate occurrences of chromite and asbestos in the Logar ultramafic complex. White star northwest of Kabul indicates location of the Khayakhana quarry (location details in Collett et al. 2015). Yellow box indicates the area shown in Figure 2.
Figure 1.
(a) Tectonic map of Afghanistan with locations of the Kabul Block and the Aynak copper deposits, modified from AGS and BGS (2005a) and Waizy et al. (2020). (b) Digital terrain model of the northern part of the Kabul Block superimposed with locations of mineralization, modified from MOMP and AGS (2014). Orange squares indicate sediment hosted copper occurrences; the Aynak deposits are arrowed. Green squares indicate occurrences of chromite and asbestos in the Logar ultramafic complex. White star northwest of Kabul indicates location of the Khayakhana quarry (location details in Collett et al. 2015). Yellow box indicates the area shown in Figure 2.
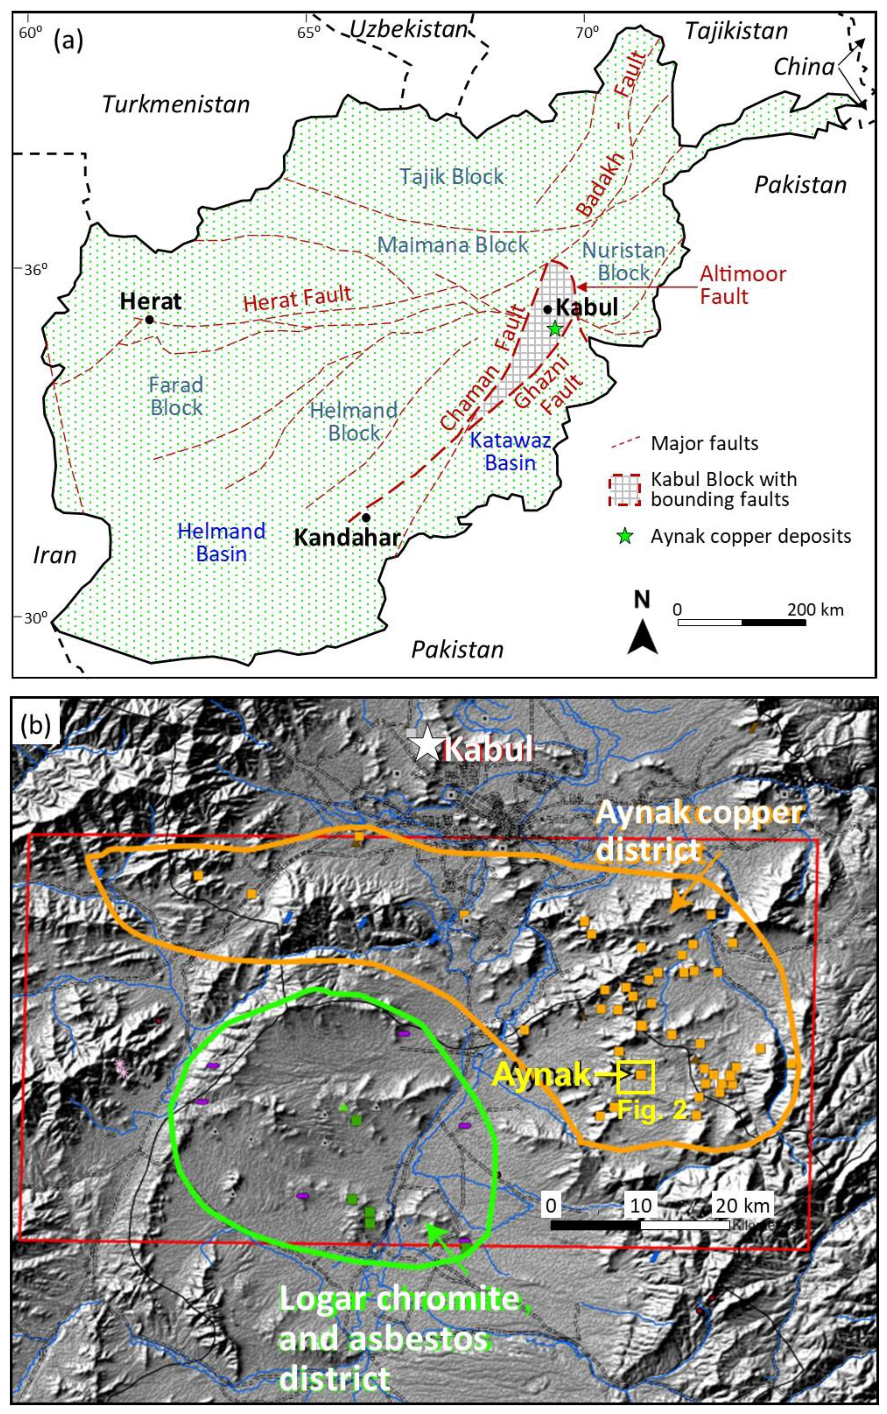
Figure 2.
Simplified geological map and cross-section of the Aynak deposits, modified from AGS and BGS (2005a) and Waizy et al. (2020) showing the Central and Western prospect areas and locations of drillholes from which samples were obtained for this study. Note that prefixes ‘BH-‘ and ‘D-‘ have been removed in the names of drillcore samples presented later.
Figure 2.
Simplified geological map and cross-section of the Aynak deposits, modified from AGS and BGS (2005a) and Waizy et al. (2020) showing the Central and Western prospect areas and locations of drillholes from which samples were obtained for this study. Note that prefixes ‘BH-‘ and ‘D-‘ have been removed in the names of drillcore samples presented later.
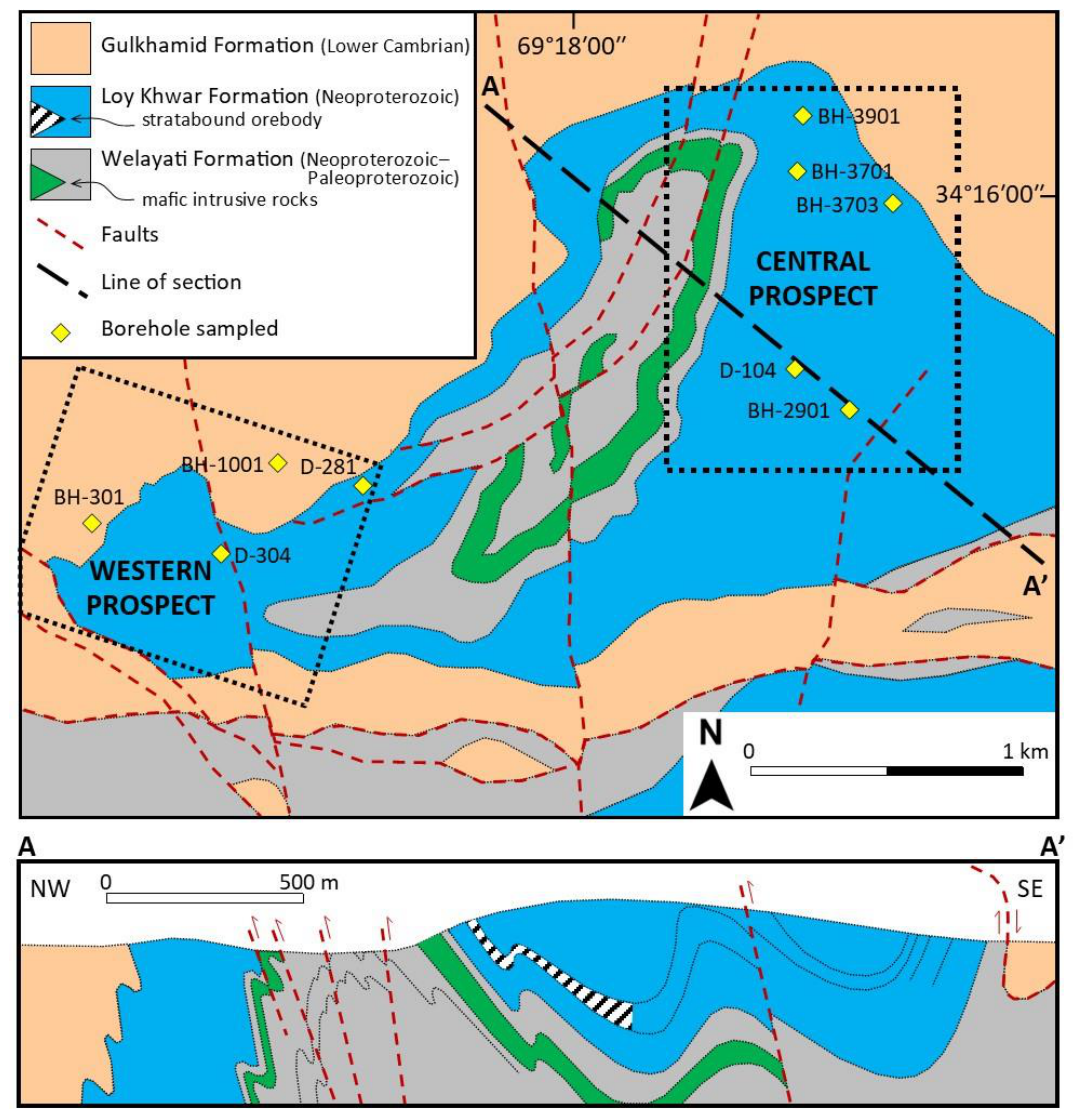
Figure 3.
Generalized stratigraphic column, after MOMP and AGS (2014) and Waizy et al. (2020) showing the major rock types and sulphide mineral zonation in the Aynak deposit. Not to scale, as thicknesses differ within, and between, the Central and Western parts of the ore deposit.
Figure 3.
Generalized stratigraphic column, after MOMP and AGS (2014) and Waizy et al. (2020) showing the major rock types and sulphide mineral zonation in the Aynak deposit. Not to scale, as thicknesses differ within, and between, the Central and Western parts of the ore deposit.
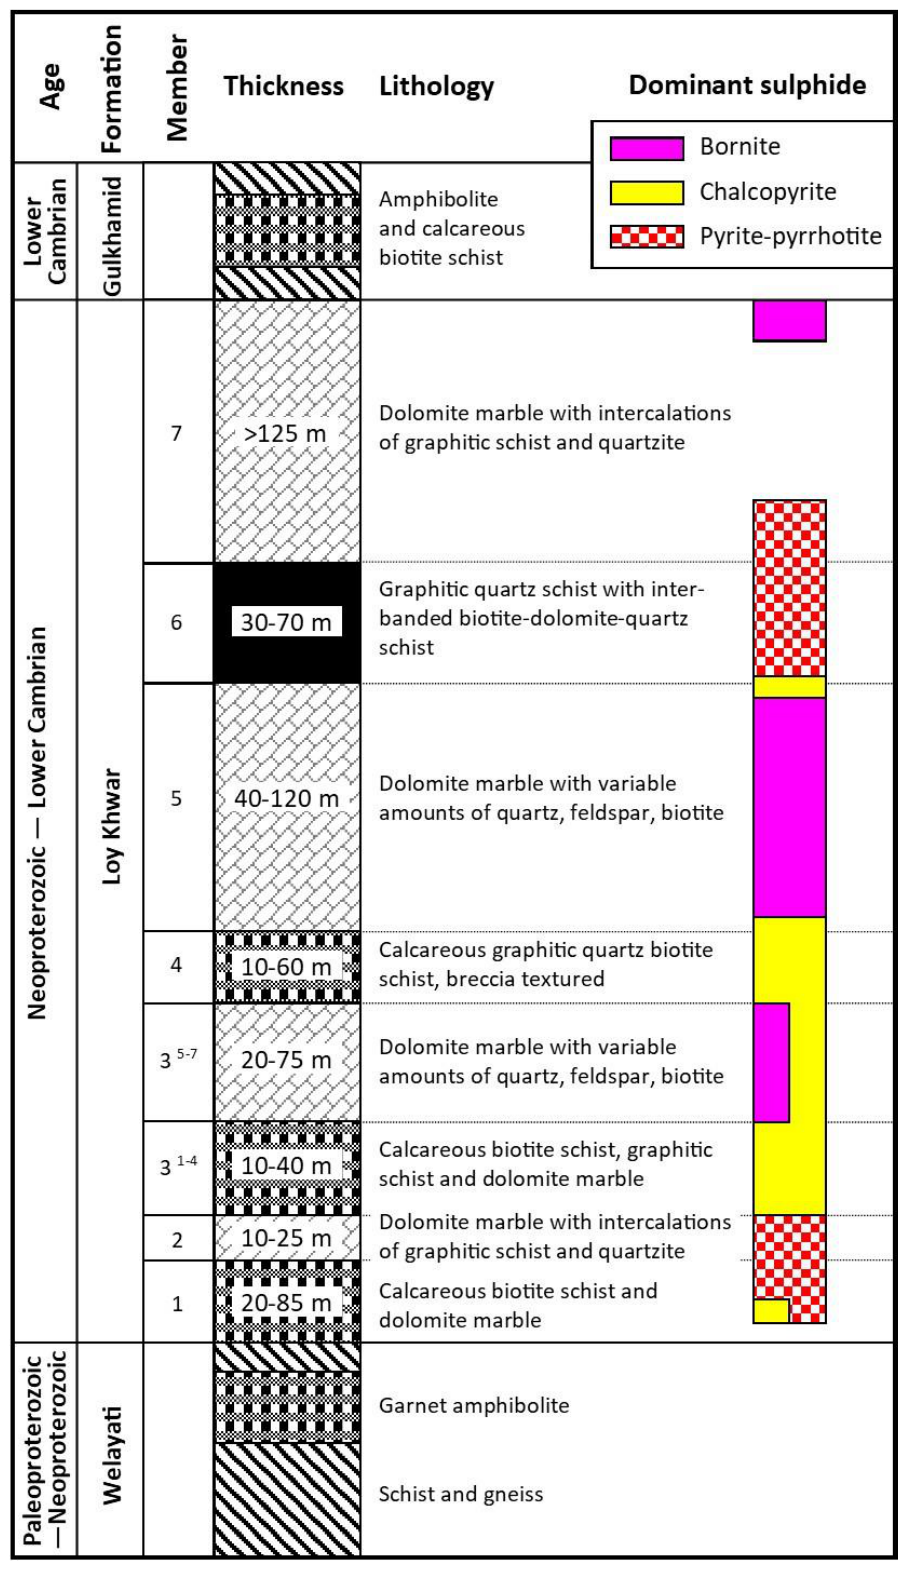
Figure 4.
Representative drill-core samples and reflected-light photomicrographs illustrating the principal sulphide mineralisation at the Aynak deposit. (a) massive chalcopyrite and bornite segregations in dolomite marble, sample 281–3. (b) stratabound chalcopyrite laminae in dolomite marble, sample 3901–2. (c)-(f): photomicrographs of main sulphide minerals, all taken in reflected light (Bn, bornite; Ccp, chalcopyrite; Py, pyrite): (c) sample 3703–3a showing extensive bornite exsolution in chalcopyrite or chalcopyrite replacement by bornite. (d) replacement of pyrite and bornite by massive chalcopyrite in sample 304–2. (e) pyrite replacement by chalcopyrite in sample 2901–3. (f) cross-cutting pyrite veins in 1001–2. Images reproduced from figures in Waizy et al. (2020).
Figure 4.
Representative drill-core samples and reflected-light photomicrographs illustrating the principal sulphide mineralisation at the Aynak deposit. (a) massive chalcopyrite and bornite segregations in dolomite marble, sample 281–3. (b) stratabound chalcopyrite laminae in dolomite marble, sample 3901–2. (c)-(f): photomicrographs of main sulphide minerals, all taken in reflected light (Bn, bornite; Ccp, chalcopyrite; Py, pyrite): (c) sample 3703–3a showing extensive bornite exsolution in chalcopyrite or chalcopyrite replacement by bornite. (d) replacement of pyrite and bornite by massive chalcopyrite in sample 304–2. (e) pyrite replacement by chalcopyrite in sample 2901–3. (f) cross-cutting pyrite veins in 1001–2. Images reproduced from figures in Waizy et al. (2020).
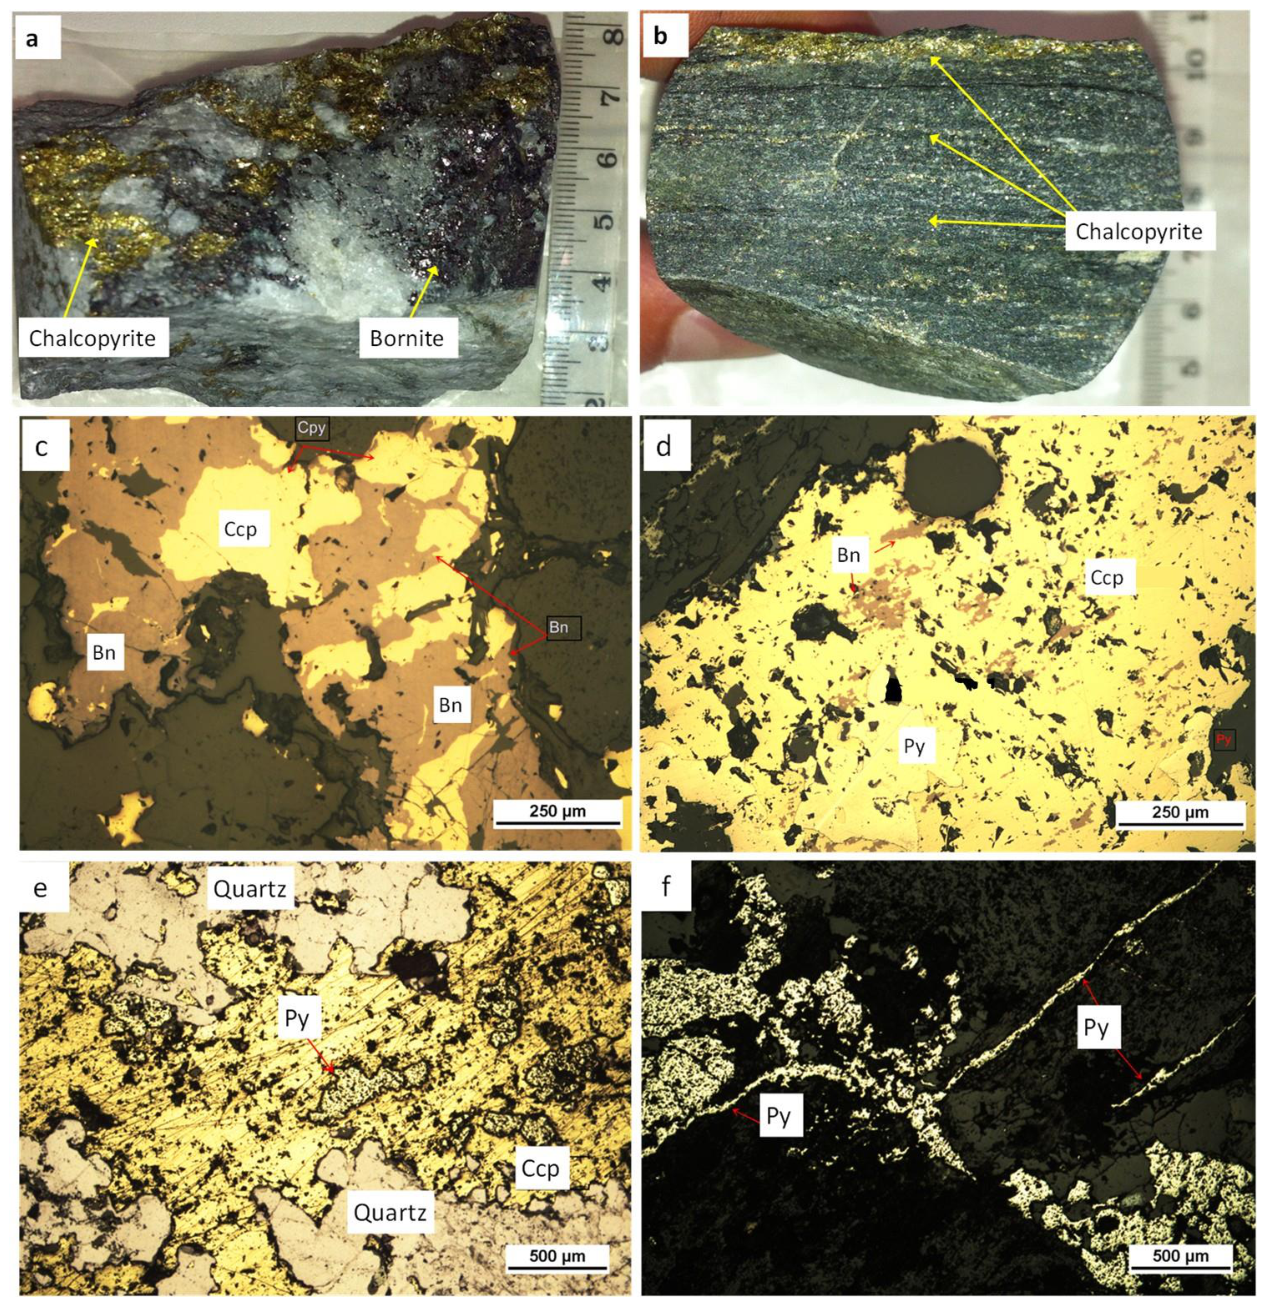
Figure 5.
Scatterplots of metal and metalloid concentrations in sulphide samples analysed by ICP-MS (normalised to total 100%; Table 3a) showing differences between bornite-, chalcopyrite-, and pyrite-dominant samples from the Aynak orebody and sulphide samples from the Khayarkhana area. (a) Co vs. Ni. (b) Co vs. As. (c) Zn vs. Cd. (d) Cu vs. Ag.
Figure 5.
Scatterplots of metal and metalloid concentrations in sulphide samples analysed by ICP-MS (normalised to total 100%; Table 3a) showing differences between bornite-, chalcopyrite-, and pyrite-dominant samples from the Aynak orebody and sulphide samples from the Khayarkhana area. (a) Co vs. Ni. (b) Co vs. As. (c) Zn vs. Cd. (d) Cu vs. Ag.
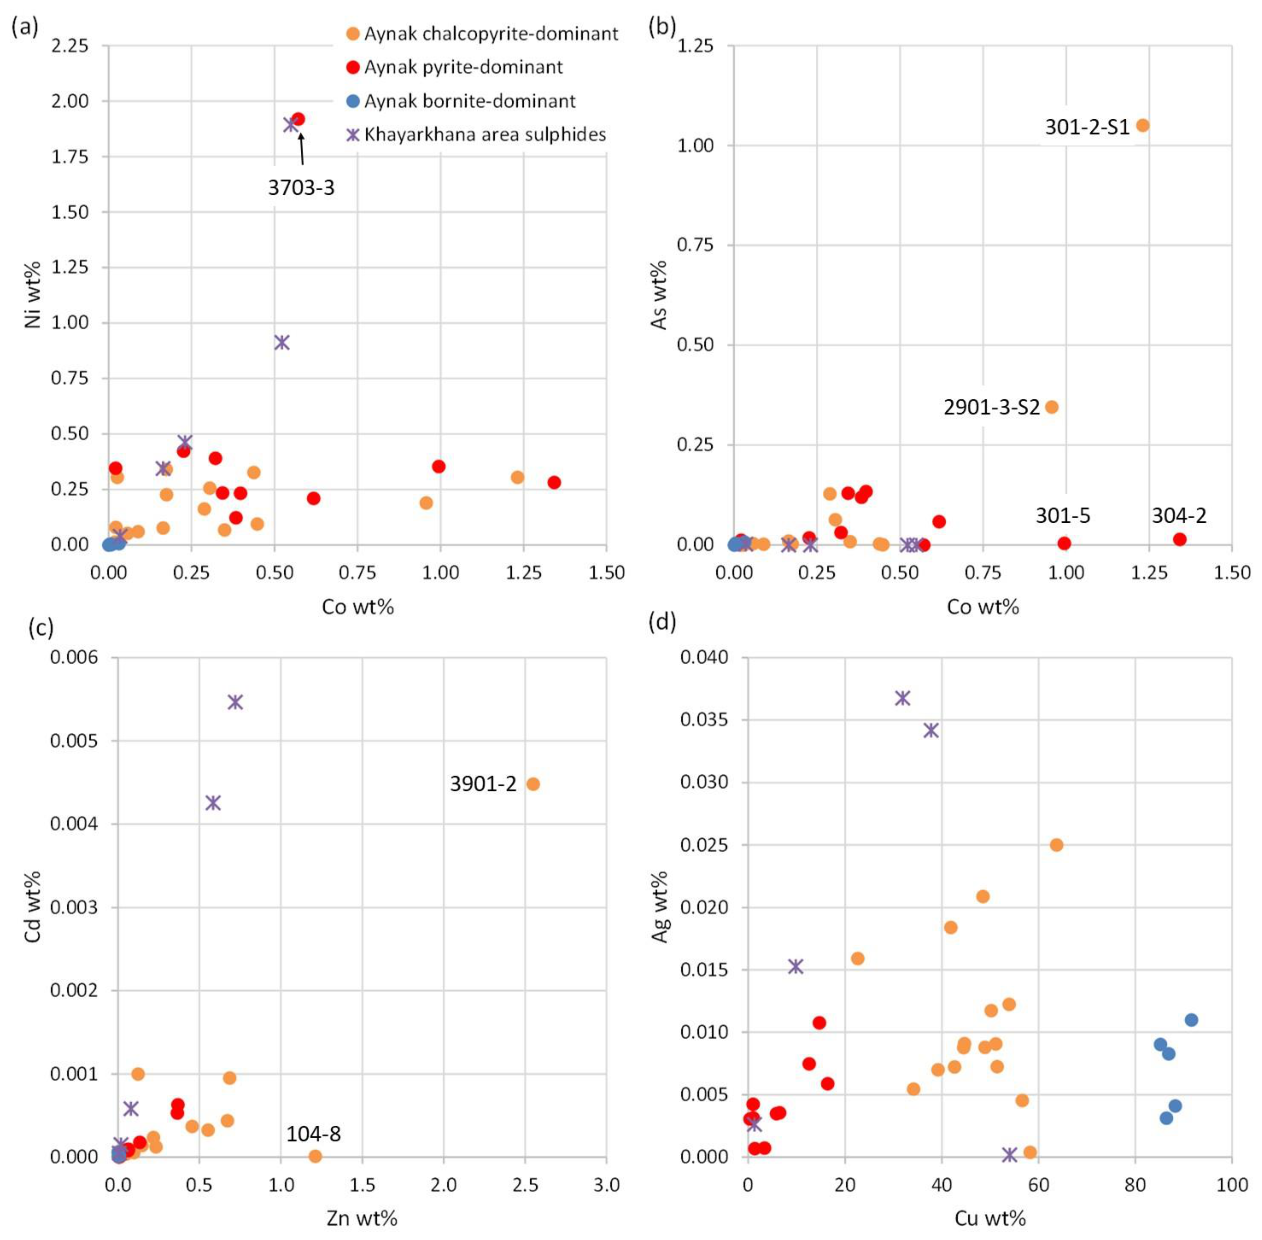
Figure 6.
Photomicrographs of quartz-hosted fluid inclusions in Central Aynak sample 104-5. (a) Secondary inclusion containing a cubic halite daughter crystal. (b) Cluster of small secondary fluid inclusions, and inclusion with a halite daughter crystal. (c) Trail of very small secondary fluid inclusions. (d) Trails of relatively large fluid inclusions containing halite daughter crystals.
Figure 6.
Photomicrographs of quartz-hosted fluid inclusions in Central Aynak sample 104-5. (a) Secondary inclusion containing a cubic halite daughter crystal. (b) Cluster of small secondary fluid inclusions, and inclusion with a halite daughter crystal. (c) Trail of very small secondary fluid inclusions. (d) Trails of relatively large fluid inclusions containing halite daughter crystals.
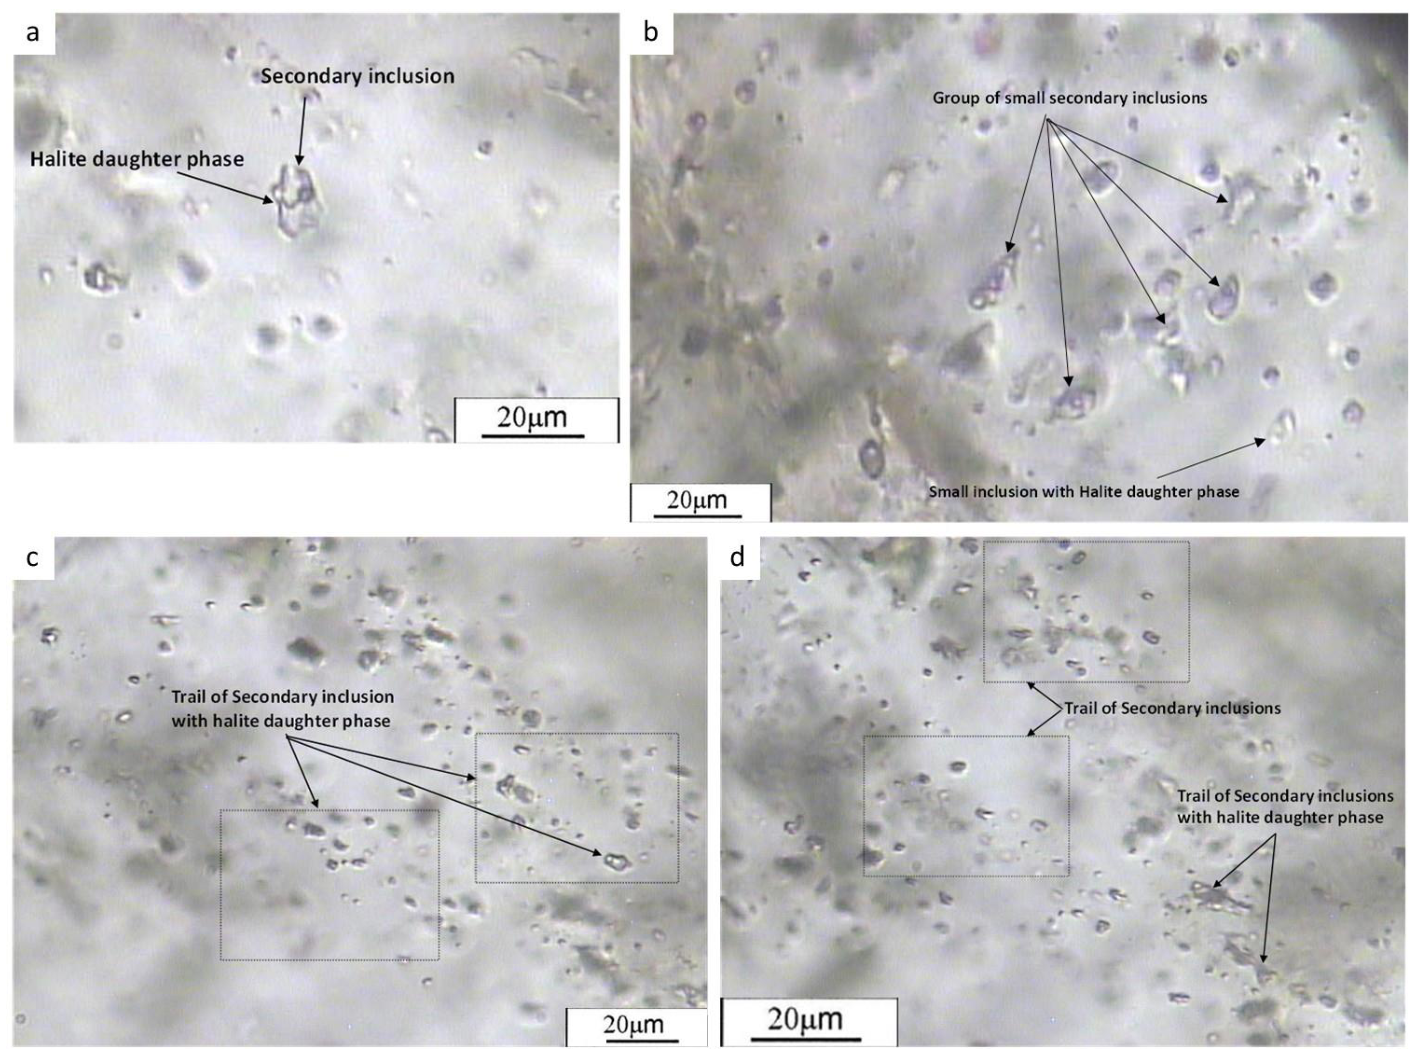
Figure 7.
Total homogenization temperature (THtot) of secondary quartz-hosted fluid inclusions in Central Aynak sample 104-5. All inclusions homogenised to the liquid phase.
Figure 7.
Total homogenization temperature (THtot) of secondary quartz-hosted fluid inclusions in Central Aynak sample 104-5. All inclusions homogenised to the liquid phase.
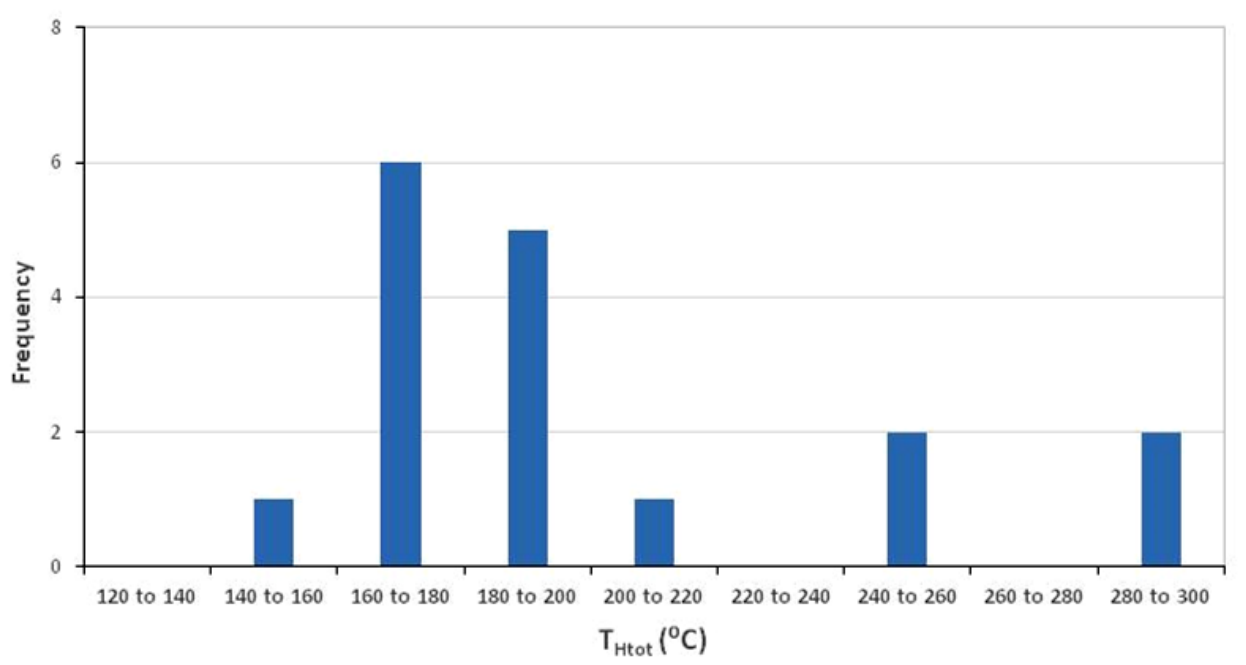
Figure 8.
Salinity-total homogenization temperature (THtot) plot for secondary quartz-hosted fluid inclusions in Central Aynak sample 104-5 (n = 17). Where halite dissolution temperature (TSol) could not be obtained for the measurement, the corresponding salinity range is shown on the Y-Axis.
Figure 8.
Salinity-total homogenization temperature (THtot) plot for secondary quartz-hosted fluid inclusions in Central Aynak sample 104-5 (n = 17). Where halite dissolution temperature (TSol) could not be obtained for the measurement, the corresponding salinity range is shown on the Y-Axis.
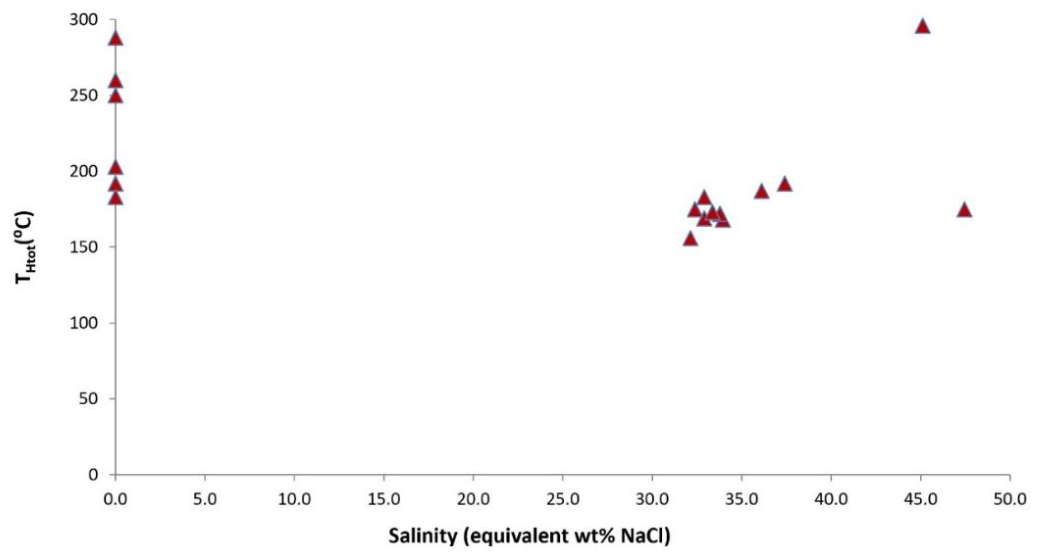
Figure 9.
Pressure-temperature (P-T) Isochore diagram for the system NaCl-H2O. The solid curve shows the co-existence (equilibrium) of liquid+halite+vapour (L+H+V; Archer, 1992). The thin lines labelled with L (30) are the halite liquids or halite dissolution (i.e., the melting/dissolution curves for halite) at different equivalent wt. % NaCl in the system calculated from Bodnar (1994). The plotted points represent measured total homogenisation temperatures (THtot; Lw+V → Lw) and the corresponding pressure at halite dissolution, calculated using equations from Lecumberri-Sanchez et al. (2012). The red lines show the isochores (line of constant density) for the highest and lowest THtot in Lw+V inclusion calculated using the equation of Zhang and Frantz (1987) and the FLUIDS software package of Bakker (2003).
Figure 9.
Pressure-temperature (P-T) Isochore diagram for the system NaCl-H2O. The solid curve shows the co-existence (equilibrium) of liquid+halite+vapour (L+H+V; Archer, 1992). The thin lines labelled with L (30) are the halite liquids or halite dissolution (i.e., the melting/dissolution curves for halite) at different equivalent wt. % NaCl in the system calculated from Bodnar (1994). The plotted points represent measured total homogenisation temperatures (THtot; Lw+V → Lw) and the corresponding pressure at halite dissolution, calculated using equations from Lecumberri-Sanchez et al. (2012). The red lines show the isochores (line of constant density) for the highest and lowest THtot in Lw+V inclusion calculated using the equation of Zhang and Frantz (1987) and the FLUIDS software package of Bakker (2003).
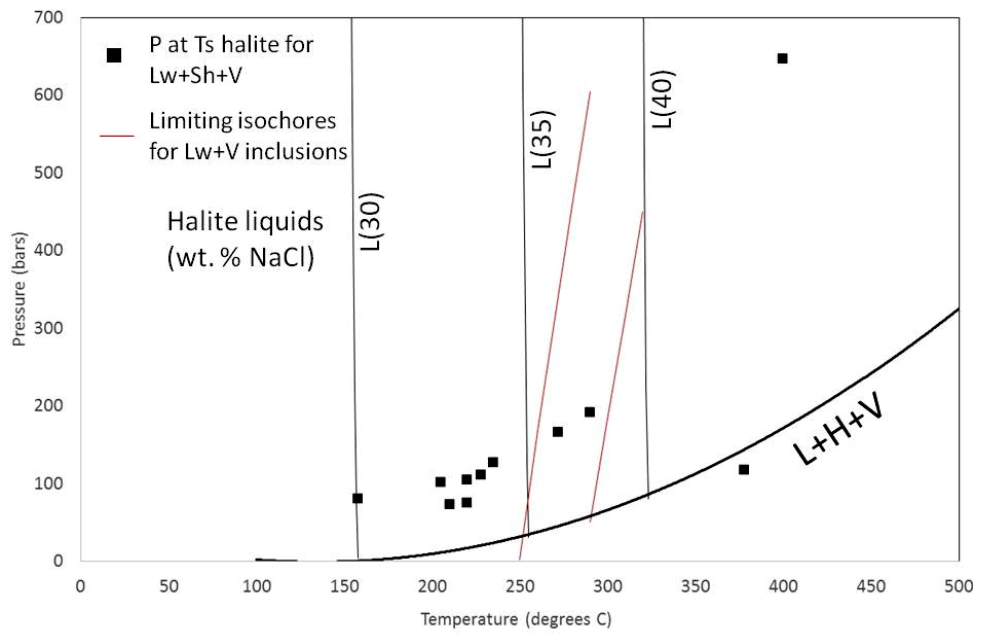

Table 1.
Dominant mineralogy and host rock type of sulphide samples selected for ICP-MS analysis.
| Location | No. | Sample name | Dominant sulphide ‡ | Rock type |
|---|---|---|---|---|
| Central Aynak | 1 | 2901-3-S2 | Ccp | Grey dolomite marble |
| 2 | 2901-4-S2 | Ccp | ||
| 3 | 3701-1 | Py | Quartz + carbonate schist | |
| 4 | 3703-1-S2 | Py | Grey-black marble + quartz schist | |
| 5 | 3703-3-S2 | Bn | Quartz + dolomite marble | |
| 6 | 3703-3-S3 | Ccp | ||
| 7 | 3703-4-S1 | Py | Black schist | |
| 8 | 3703-4-S2 | Py | ||
| 9 | 3901-2 | Ccp | Dolomite marble | |
| 10 | 3901-3 | Ccp | ||
| 11 | 104-1 | Bn | Marble | |
| 12 | 104-2 | Bn+Ccp | Quartz + dolomite schist | |
| 13 | 104-5 | Ccp | Quartz + dolomite marble | |
| 14 | 104-8 | Py | Black schist | |
| Western Aynak | 15 | 281-2-S1 | Bn | Dolomite marble |
| 16 | 281-2-S2 | Pyh | ||
| 17 | 281-3-S2-3 | Bn+Ccp | ||
| 18 | 281-3-S1 | Ccp | ||
| 19 | 281-5-S1 | Ccp | Biotite + carbonate schist | |
| 20 | 301-2-S1 | Ccp | Graphite + carbonate quartz schist | |
| 21 | 301-3-S1 | Ccp+Py | Light grey quartz + dolomite marble | |
| 22 | 301-3-S2 | Bn | ||
| 23 | 301-4 | Ccp | Dolomite marble | |
| 24 | 301-5 | Py+Ccp | Biotite, quartz + carbonate schist | |
| 25 | 1001-2 | Pyh | Grey-black graphite + quartz schist | |
| 26 | 1001-3 | Ccp | Quartz + dolomite marble | |
| 27 | 1001-4-S1 | Ccp | Carbonate + graphite schist | |
| 28 | 1001-5-S2 | Py+Ccp | Graphite + biotite + quartz+ dolomite marble | |
| 29 | 304-2 | Ccp+Pyh | Grey graphite schist + marble | |
| 30 | 304-3-S2 | Ccp | Marble + layered quartz | |
| 31 | 304-4 | Pyh | Dolomite marble + quartz | |
| Tara Khel - Khayarkhana | 32 | TK-Kh-3 | Py | Quartzite |
| 33 | TK-Kh-3 | Pyh | ||
| 34 | TK-Kh-5-S1 | Py | Gabbroic amphibolite | |
| 35 | TK-KH-5-S1 | Pyh+Ccp | ||
| 36 | TK-Kh-5-S2 | Pyh |
Mineral abbreviations: Ccp, Chalcopyrite; Bn, Bornite; Py, Pyrite; Pyh, Pyrrhotite.
Table 2.
Drillcore samples selected for fluid inclusion studies.
| No. | Sample name | Location | Depth (m) |
|---|---|---|---|
| 1 | 2901-2 | Central Aynak |
157 |
| 2 | 3703-4 | 587 | |
| 3 | 3901-2 | 351 | |
| 4 | 104-5 | 282 | |
| 5 | 104-7 | 350 | |
| 6 | 301-4 | Western Aynak |
350 |
| 7 | 1001-4 | 782 | |
| 8 | 304-3 | 265 |
Table 3.
a. Metal values (wt% basis, normalised to total 100% metals) in sulphide separates analysed by acid dissolution and ICP-MS. Area codes: CA, Central Aynak; WA, Western Aynak; KH, Khayarkhana.
Table 3.
a. Metal values (wt% basis, normalised to total 100% metals) in sulphide separates analysed by acid dissolution and ICP-MS. Area codes: CA, Central Aynak; WA, Western Aynak; KH, Khayarkhana.
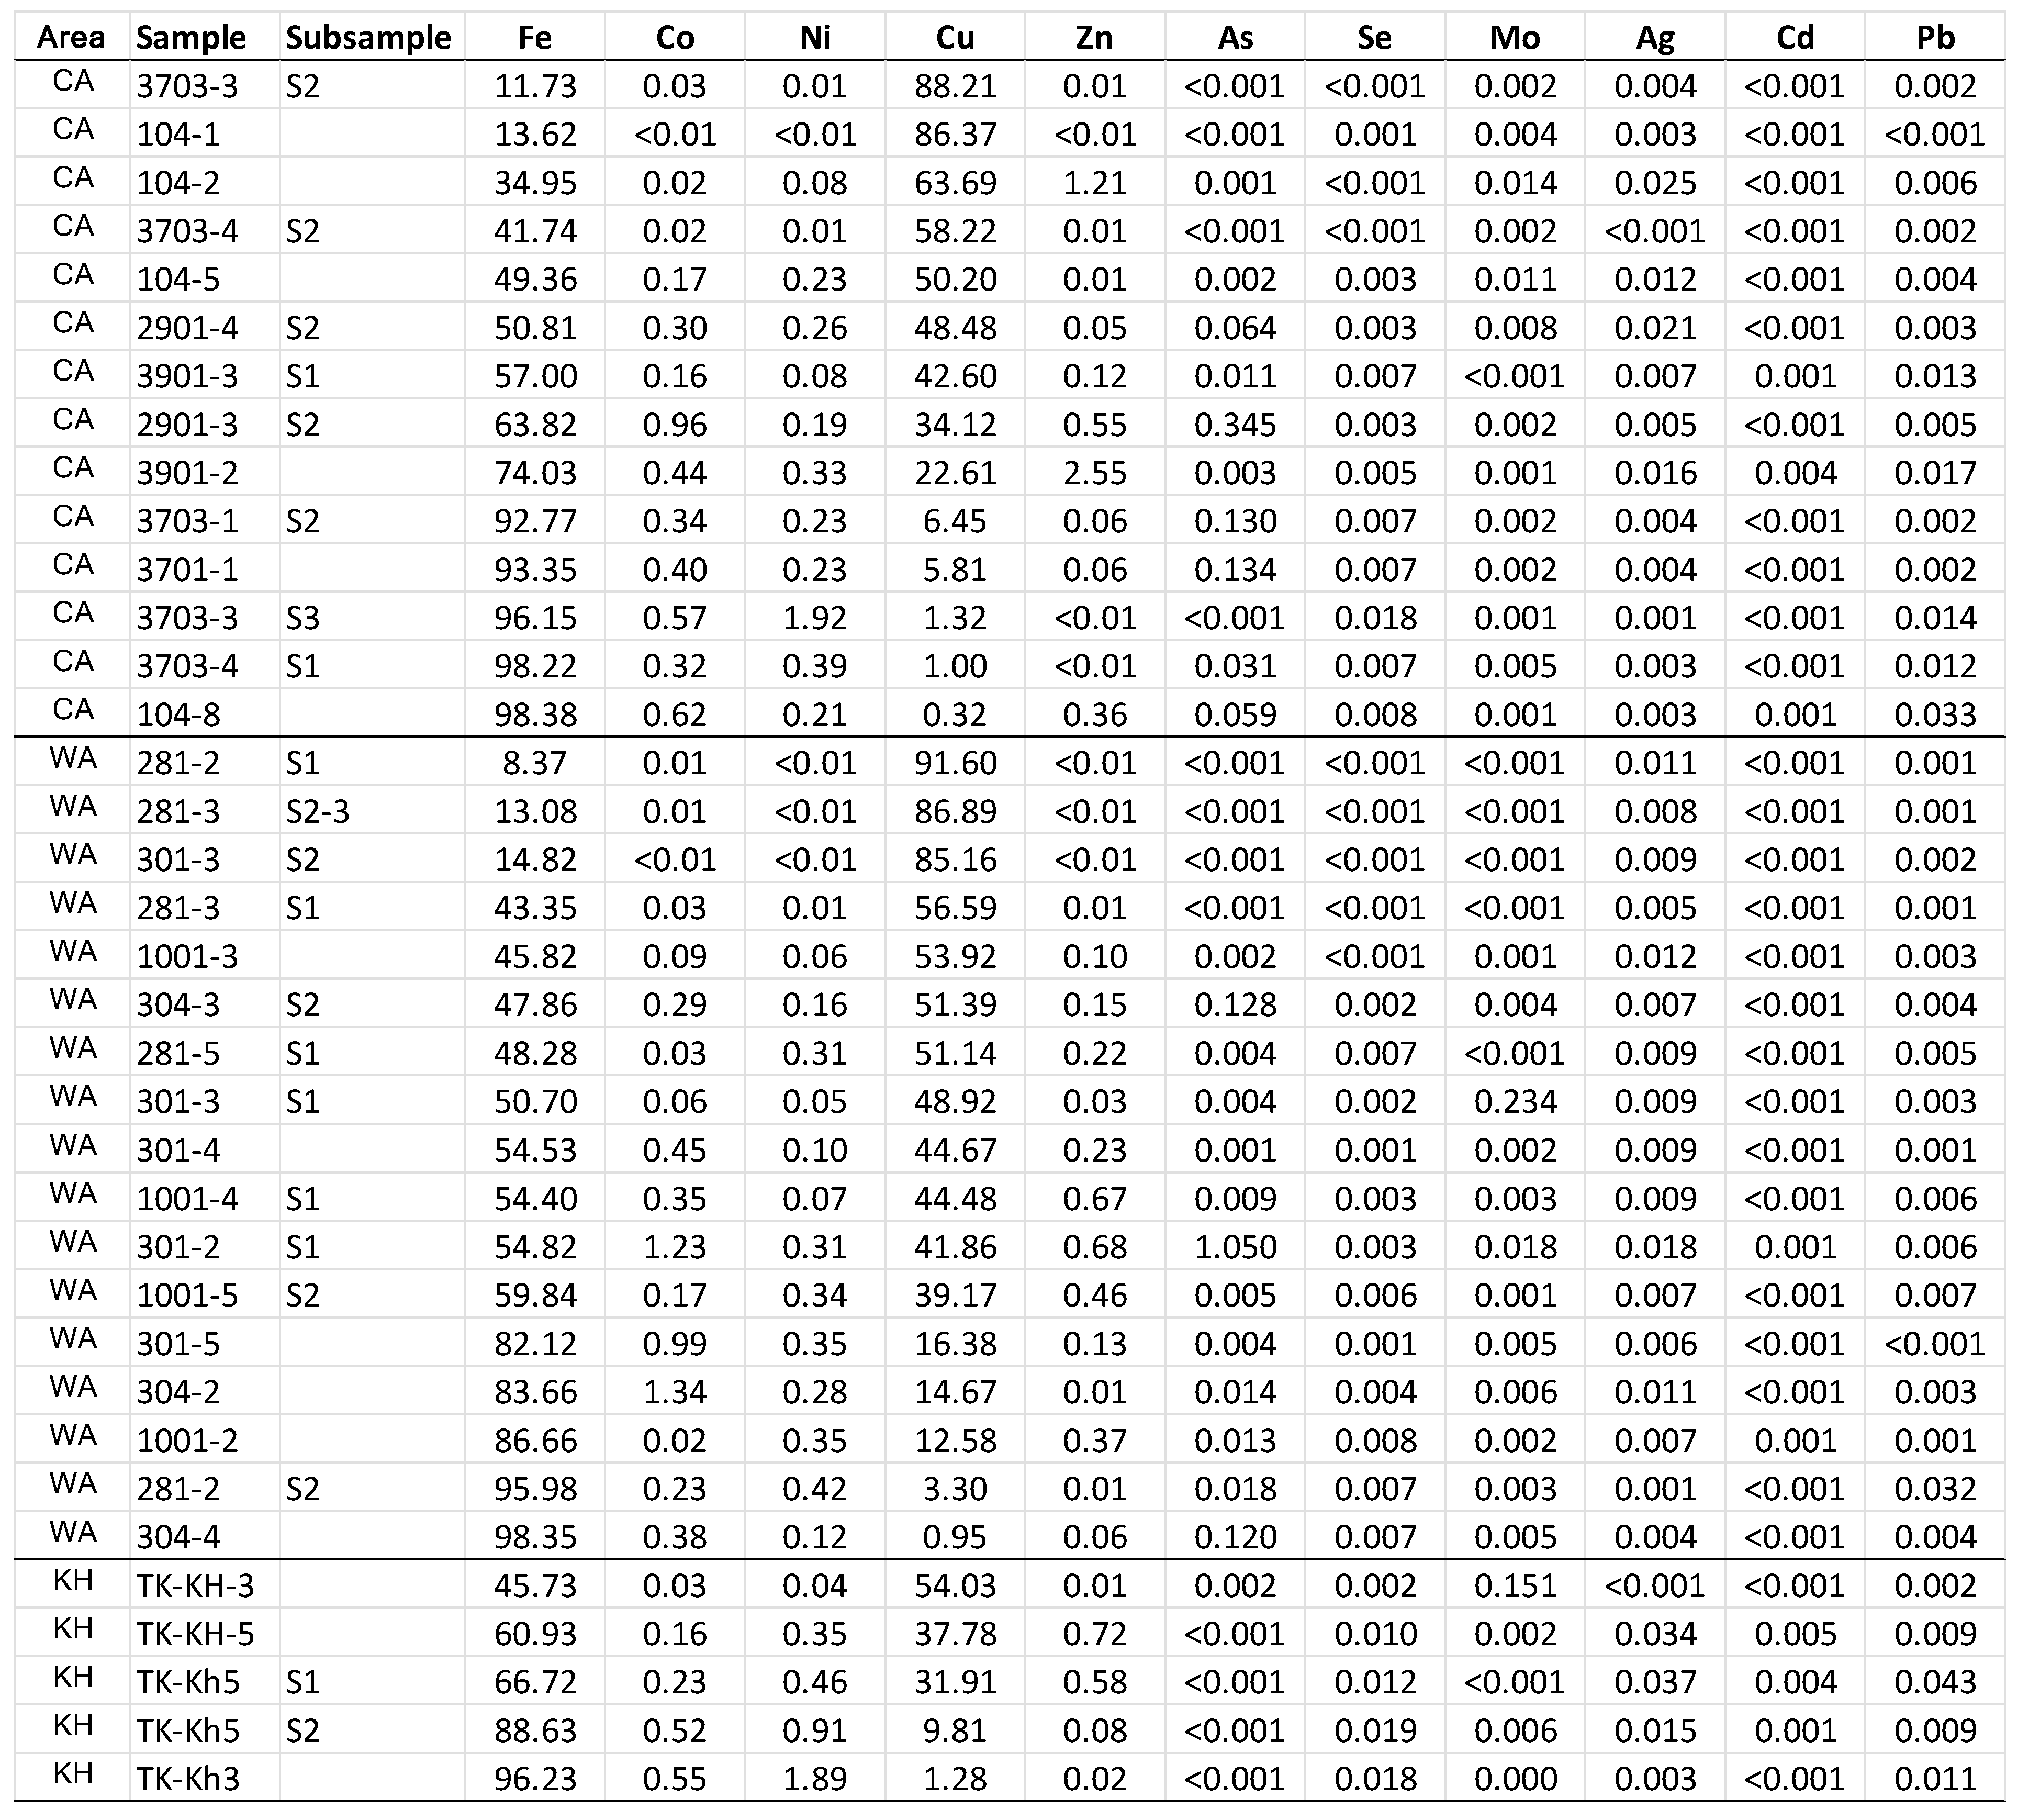
Table 3.
b. Sulphide modal proportions calculated from chemical analyses of sulphide separates.
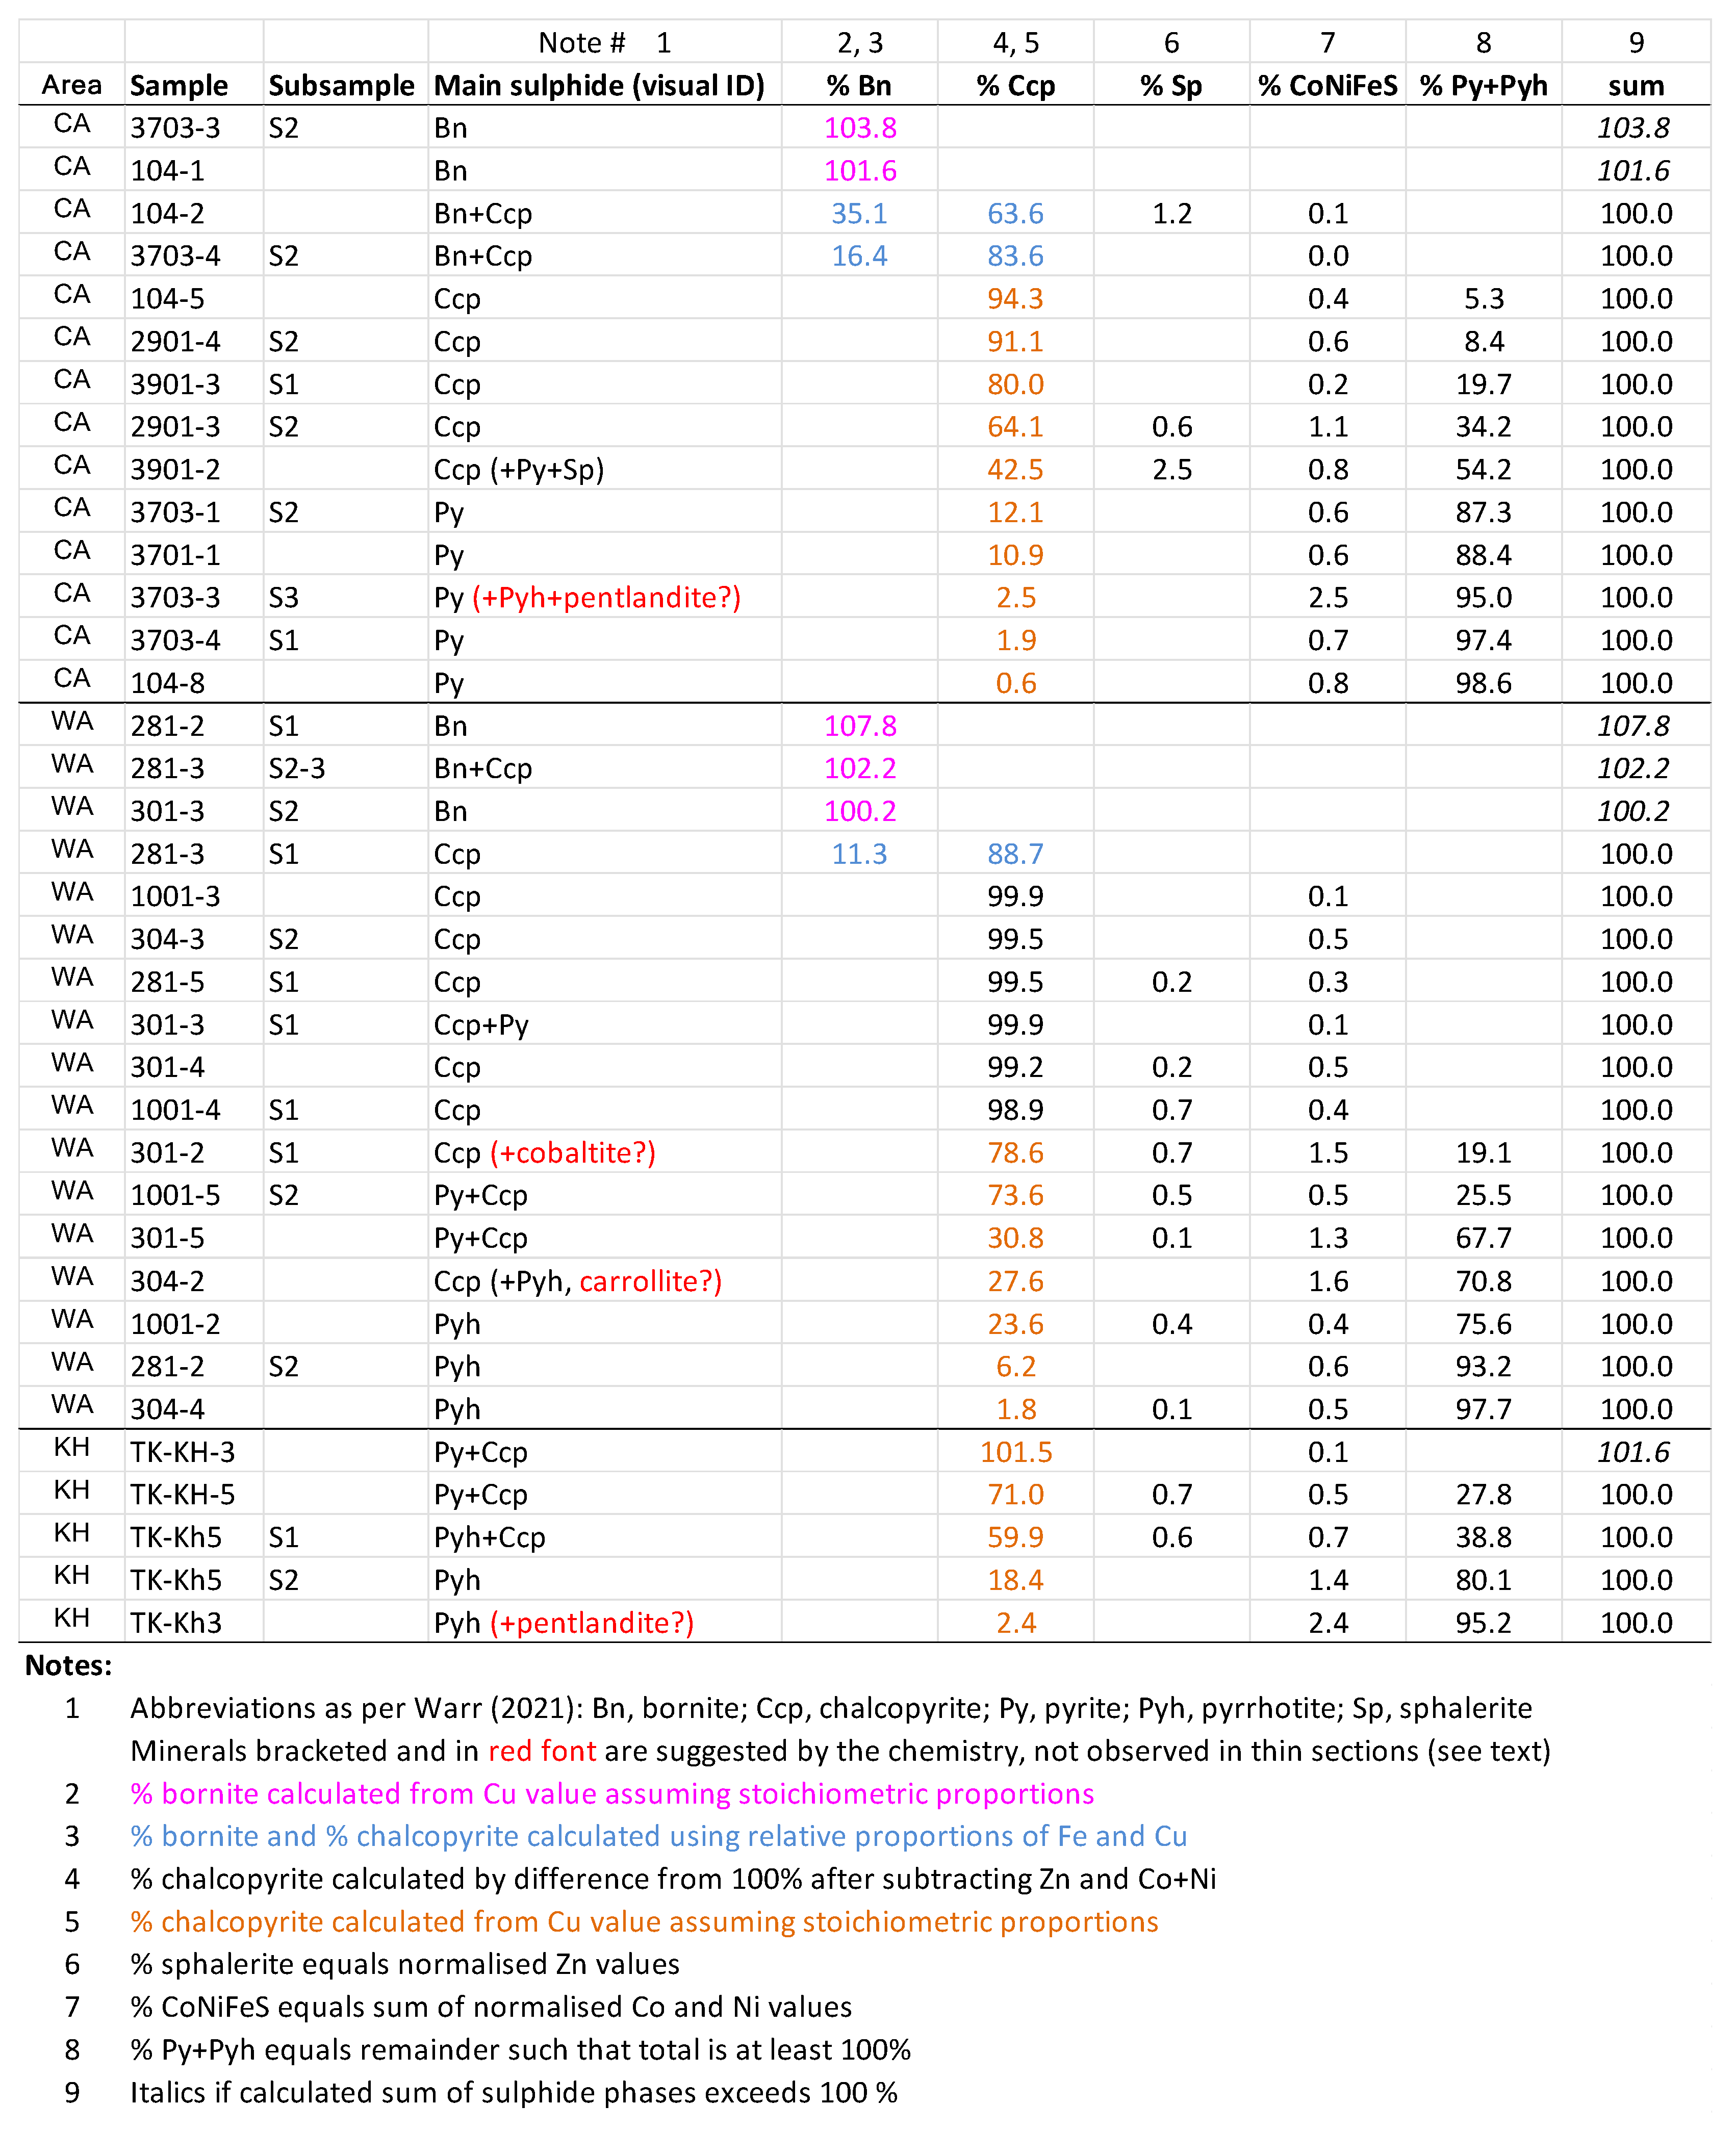
Table 4.
Secondary fluid inclusion data for sample 104-5, Central Aynak.
| Type | TFM ⁰C | TIce ⁰C | TSol ⁰C | THtot (⁰C) | Salinity | Notes | |
|---|---|---|---|---|---|---|---|
| Lw+Sh+V | -53 | -27 | 238 | 168 | 33.9 | ||
| Lw+V | -27.3 | -22.8 | ? | 260 | ? | decrepitated | |
| Lw+Sh+V | -29 | ? | 378 | 296 | 45.1 | ||
| Lw+V | -29 | -8.5 | ? | 250 | ? | ||
| Lw+V | -56 | -13.5 | ? | 288 | ? | ||
| Lw+Sh+V | ? | ? | 272 | 187 | 36.1 | did not freeze to -80 | |
| Lw+Sh+V | ? | ? | 205 | 156 | 32.1 | ||
| Lw+V | -56 | ? | 220 | 169 | 32.9 | ||
| Lw+V | -55 | ? | 290 | 192 | 37.4 | ||
| Lw+V | -53 | -17.5 | ? | 203 | ? | ||
| Lw+V | ? | -8 | ? | 192 | ? | ||
| Lw+Sh+V | ? | ? | >400 | 175 | 47.4 | decrepitated | |
| Lw+Sh+V | ? | ? | 235 | 172 | 33.8 | set on same trail | |
| Lw+Sh+V | ? | ? | 228 | 173 | 33.4 | set on same trail | |
| Lw+Sh+V | ? | ? | 210 | 175 | 32.4 | set on same trail | |
| Lw+Sh+V | ? | ? | ? | 183 | ? | set on same trail | |
| Lw+Sh+V | ? | ? | 220 | 183 | 32.9 | set on same trail | |
| Contractions: Lw, liquid water; Sh, solid halite; V, vapour; TFM, temperature of first melting; TIce, temperature of ice melting; TSol, temperature of halite dissolution; THtot, total temperature of homogenization. | |||||||
Table 5.
Eutectic temperature of various salt-water systems and solid phases formed during freezing (Shepherd et al., 1985, using the data of Borisenko, 1977).
Table 5.
Eutectic temperature of various salt-water systems and solid phases formed during freezing (Shepherd et al., 1985, using the data of Borisenko, 1977).
| Salt system | Eutectic Temperature (⁰C) | Solid phases |
|---|---|---|
| H2O-NaCl-CaCl2 | -55 | Ice + NaCl.2H2O + CaCl2.6H2O |
| H2O-MgCl2-CaCl2 | -52.2 | Ice + MgCl2.2H2O + CaCl2.6H2O |
| H2O-KCl-CaCl2 | -50.5 | Ice + CaCl2.6H2O |
| H2O-CaCl2 | -49.5 | Ice + CaCl2.6H2O |
| H2O-Na2CO3-K2CO3 | -37.0 | Ice + (K,Na)2CO3.6H2O + K2CO3.6H2O |
| H2O-NaCl-FeCl2 | -37.0 | Ice + NaCl.2H2O + FeCl2.6H2O |
| H2O-FeCl2 | -35.0 | Ice + FeCl2.6H2O |
| H2O-NaCl-MgCl2 | -35.0 | Ice + NaCl. 2H2O + MgCl2.12H2O |
| H2O-MgCl2 | -33.6 | Ice + MgCl2.12H2O |
| H2O-NaCl-KCl | -23.5 | Ice + NaCl.2H2O |
| H2O-NaCl | -12.2 | Ice + NaCl.H2O |
Disclaimer/Publisher’s Note: The statements, opinions and data contained in all publications are solely those of the individual author(s) and contributor(s) and not of MDPI and/or the editor(s). MDPI and/or the editor(s) disclaim responsibility for any injury to people or property resulting from any ideas, methods, instructions or products referred to in the content. |
© 2026 by the authors. Licensee MDPI, Basel, Switzerland. This article is an open access article distributed under the terms and conditions of the Creative Commons Attribution (CC BY) license (http://creativecommons.org/licenses/by/4.0/).
Copyright: This open access article is published under a Creative Commons CC BY 4.0 license, which permit the free download, distribution, and reuse, provided that the author and preprint are cited in any reuse.