
Submitted:
24 July 2026
Posted:
24 July 2026
You are already at the latest version
Preprints on COVID-19 and SARS-CoV-2
Abstract
This paper examines analyst earnings forecast accuracy for S&P 500 and Russell 2000 firms from 2015 to 2025, focusing on the COVID-19 pandemic and the subsequent AI era, which began in late 2022. Results show S&P 500 firms consistently have lower forecast errors than Russell 2000 firms, although the difference narrowed after the widespread adoption of AI-assisted tools. During the pandemic, forecast accuracy declined slightly for S&P 500 firms but much more for Russell 2000 firms, while it improved substantially for both groups during 2023–2025. These results remain similar after reducing the influence of extreme observations. The analysis of signed forecast errors indicates a persistent pessimistic bias for S&P 500 firms, while forecast bias for Russell 2000 firms was weaker and less consistent. An interesting finding is that the historical difference in forecast bias between S&P 500 and Russell 2000 firms disappeared in the later period and was no longer statistically significant.
Keywords:
analyst earnings forecasts
; forecast accuracy
; forecast bias
; S&P 500
; Russell 2000
; artificial intelligence
; COVID-19
1. Introduction
1.1. Analyst Forecast Accuracy and Firm Size
Financial analysts play an important role in capital markets by providing earnings forecasts that help investors evaluate firm performance and value securities [1]. Because earnings are an important factor in stock prices, forecast accuracy affects investment decisions and capital allocation [2,3]. Previous research shows that forecast accuracy depends on firm characteristics, analyst experience, information disclosure, and economic conditions [4,5,6].
One of the most consistent findings in the literature is that analysts generally produce more accurate forecasts for larger firms [7]. Large firms receive greater analyst coverage, provide more detailed financial disclosures, and often have more stable business operations [8]. Smaller firms, in contrast, tend to have greater information asymmetry, lower analyst coverage, and more volatile earnings, making future performance harder to predict [3,9].
Research also shows that forecast performance changes with economic conditions [10]. During periods of economic stability, differences in forecast accuracy between large and small firms tend to narrow because smaller firms’ high cyclical sensitivity becomes less disruptive to project models [11]. During periods of economic uncertainty, however, forecast accuracy usually declines and the gap between large and small firms often widens because smaller firms are more sensitive to changes in business conditions [12,13].
1.2. The Pandemic and the AI Era
The period from 2015 to 2025 provides an informative setting for examining these issues because financial markets experienced two major changes in the economic and information environment. The years 2015–2019 represent a relatively stable pre-pandemic period characterized by continued economic growth and improving corporate disclosure. The following period, 2020–2022, was dominated by the COVID-19 pandemic, which created significant uncertainty, business disruptions, supply-chain problems, and rapidly changing earnings expectations [14,15]. Previous studies generally find that forecasting became more difficult during this period because historical information became less useful and future business conditions became more uncertain. Bilinski [15] further documents that analysts increased research activity and revised forecasts more frequently in response to the rapidly changing environment.
Beginning in late 2022, the information environment changed again with the widespread adoption of generative artificial intelligence (AI) and other advanced analytical technologies. AI-assisted tools can summarize financial statements, analyze earnings conference calls, and process large amounts of information more efficiently than traditional methods. At the same time, improvements in financial databases, corporate disclosures, and analytical software continued to increase the amount of information available to analysts and investors. Recent studies suggest that machine learning methods can improve earnings forecasting and financial information processing, highlighting the potential role of advanced analytical tools in financial analysis [16,17].
Although these developments may have improved information processing and research efficiency, their effects on analyst forecast accuracy remain unclear. Some studies find that advanced machine learning models can outperform professional analyst consensus forecasts in certain settings [17]. Recent research also highlights the ways AI tools are changing how investors and analysts interact with financial information [18]. Because many developments occurred simultaneously during this period, it is difficult to identify the effect of any single factor. Therefore, this study treats the post-2022 period as a distinct information environment rather than attributing changes in forecast accuracy directly to artificial intelligence.
1.3. Research Gap and Motivation
Despite extensive research on analyst forecast accuracy, relatively little evidence exists regarding how forecast performance changed during the period spanning the COVID-19 pandemic and the subsequent expansion of AI-assisted analytical tools. In particular, little is known about whether historical differences between large-cap and small-cap firms changed during this period.
This paper examines analyst earnings forecast accuracy using a large sample of U.S. publicly traded firms. Specifically, we compare analyst forecast performance for firms included in the S&P 500 Index and the Russell 2000 Index between 2015 and 2025. To maintain a consistent sample over time, the study uses the S&P 500 and Russell 2000 constituents as of the end of 2025 and does not adjust for historical index changes. As a result, the findings describe the forecasting performance of surviving firms rather than the historical indices themselves.
1.4. Research Design and Contributions
The sample is divided into three periods: 2015–2019 (pre-pandemic), 2020–2022 (pandemic), and 2023–2025 (post-pandemic period, hereafter referred to as the AI era because it coincides with the widespread adoption of generative AI tools). This classification allows us to examine changes in forecast performance across different economic environments while also comparing large-cap and small-cap firms.
The analysis uses more than 81,000 quarterly earnings announcements from S&P 500 and Russell 2000 firms. Forecast accuracy is measured primarily using the price-scaled absolute forecast error [12,19,20], which allows comparisons across firms with different stock prices and earnings levels. The study also examines signed forecast errors to evaluate forecast bias.
This study contributes to the literature in three ways. First, it provides a comprehensive comparison of analyst forecast accuracy between large-cap and small-cap U.S. firms over the 2015–2025 period. Second, it examines how forecast performance changed across the pre-pandemic, pandemic, and post-pandemic periods. Third, by examining both forecast accuracy and forecast bias, the study provides a more complete picture of analyst forecasting behavior across different periods and firm sizes.
One particularly interesting question is whether the historical differences in earnings forecast accuracy between large-cap and small-cap firms changed in recent years. If improvements in information availability and analytical technologies benefited analysts covering smaller firms disproportionately, the traditional gap in forecasting performance may have narrowed. Examining this possibility is one of the main motivations of the present study.
The remainder of the paper is organized as follows. Section 2 discusses the data and sample selection process. Section 3 describes the variable definitions and research methodology. Section 4 presents the empirical results, including descriptive statistics, period comparisons, cross-index comparisons, and forecast bias analyses. Section 5 discusses the findings and their implications.
2. Data and Sample Selection
This study examines analyst earnings forecast accuracy using quarterly earnings announcements for firms in the S&P 500 and Russell 2000 indices from January 2015 through December 2025. Analyst consensus earnings forecasts and reported earnings per share (EPS) are obtained from the Benzinga earnings calendar database, while daily stock prices are obtained from Massive.com. For each earnings announcement, the closing stock price on the trading day immediately before the announcement is used. Observations with missing analyst forecasts, missing reported EPS, or stock prices below $1 are excluded from the analysis.
The sample is divided into three periods:1) 2015–2019: pre-pandemic period; 2) 2020–2022: pandemic period; 3) 2023–2025: post-pandemic (AI era). These periods represent different economic and information environments and allow forecast performance to be compared across changing market conditions. The next section describes the statistical methods used to evaluate differences in forecast accuracy across periods and market indices.
3. Research Design
3.1. Forecast Accuracy Measures
For each earnings announcement, the primary measure of forecast accuracy is the price-scaled absolute forecast error (PSAFE) [21]:
where is the reported earnings per share for stock i at day t, is the corresponding analyst consensus earnings estimate, and is the closing stock price immediately preceding the earnings announcement. Lower values of indicate greater forecast accuracy. Because firms differ substantially in stock prices and earnings magnitudes, scaling forecast errors by stock price improves comparability across firms and size groups [19].
Forecast bias is also measured using the signed price-scaled forecast error:
where positive values indicate that actual earnings exceed analyst expectations, while negative values indicate that analysts overestimated earnings.
3.2. Statistical Analysis
The empirical analysis proceeds in three steps. First, descriptive statistics are calculated separately for S&P 500 and Russell 2000 firms in each sample period. The reported statistics include the mean, median, standard deviation, root mean squared error (RMSE), 25th percentile, 75th percentile, and the 1% winsorized mean. Winsorization reduces the influence of extreme observations while retaining the full sample size.
Second, pairwise comparisons are conducted across sample periods to examine whether forecast accuracy changed over time. Third, cross-index comparisons are performed to evaluate differences in forecast accuracy between S&P 500 and Russell 2000 firms within each period.
4. Empirical Results
This section presents the empirical findings on analyst earnings forecast accuracy for S&P 500 and Russell 2000 firms during 2015–2025.
4.1. Sample Description
Table 1 summarizes the final sample used in the analysis. The dataset contains 81,636 quarterly earnings announcements, including 20,572 observations from S&P 500 firms and 61,064 observations from Russell 2000 firms during 2015–2025.
Several differences between the two indices are evident. S&P 500 firms have substantially higher average stock prices, with average prices increasing from $109.52 during 2015–2019 to $208.63 during 2023–2025. In contrast, average stock prices for Russell 2000 firms remain relatively stable at approximately $33 throughout the sample period. These differences highlight the importance of scaling forecast errors by stock price when comparing analyst performance across firms of different sizes. Overall, the sample provides broad coverage of both large-cap and small-cap U.S. firms across three distinct economic periods.
4.2. Forecast Accuracy Across Periods
Table 2A reports descriptive statistics for price-scaled absolute forecast errors, where lower values indicate higher forecast accuracy. As shown in Table 2A, analyst forecasts for S&P 500 firms are consistently more accurate than those for Russell 2000 firms. For S&P 500 firms, the mean forecast error rises from 0.25% during 2015–2019 to 0.32% during the pandemic period before falling to 0.22% during 2023–2025. This pattern suggests that forecasting became more difficult during the pandemic but improved afterward.
For Russell 2000 firms, forecast errors rose sharply during 2020–2022 and then fell during 2023–2025. However, the very high standard deviation and RMSE in 2020–2022, along with fairly stable median errors, suggest that the rise in the average was mainly caused by a few very large mistakes, not a significant drop in accuracy. Comparing 2015–2019 with 2023–2025, the average forecast error improved from 4.02% to 1.90%, while the median increased from 0.27% to 0.42%. These mixed results suggest that the lower average error during 2023-2025 is mainly due to fewer extreme mistakes, rather than better accuracy for the typical small-cap firm. In other words, analysts seem to have become better at avoiding very large errors during the post-pandemic period, but forecasting the typical Russell 2000 firm stayed just as hard or became slightly harder. This observation motivates the distributional analysis reported in Table 2B.
4.3. Distributional Characteristics and Robustness
Table 2B and Figure 1 provide additional insight into the distribution of forecast errors and the influence of extreme observations. Table 2B reports the 25th percentile, 75th percentile, and 1% winsorized mean of price-scaled absolute forecast errors, while Figure 1 presents boxplots of the corresponding 1% winsorized forecast error distributions.
For S&P 500 firms, as shown in Table 2A and 2B, the winsorized means remain close to the original sample means across all three periods, suggesting that extreme observations have relatively little influence on average forecast accuracy. The boxplots in Figure 1 further show that forecast errors for S&P 500 firms are relatively concentrated and stable over time, with only modest changes in the interquartile range across periods.
The results for Russell 2000 firms look quite different. While the raw mean forecast error rose to 21.01% during 2020–2022 (Table 2A), the 1% winsorized mean was only 1.76%. This large gap suggests that the increase in average forecast error during the pandemic was mainly driven by a small number of extreme values. Figure 1 presents a different picture from Table 2A when it comes to the median error. Table 2A shows that the median forecast error increased from 0.27% before the pandemic to 0.42% after it. However, Figure 1 shows that the median forecast error in 2023–2025 was lower than in 2015–2019, indicating an improvement rather than a decline. This difference is largely due to the winsorization of extreme earnings accuracy outliers.
The quartile statistics and boxplots support this conclusion. The 25th and 75th percentiles for Russell 2000 firms vary much less than the corresponding sample means, while Figure 1 shows that the majority of forecast errors remain within a relatively stable range despite the presence of extreme outliers. The figure also illustrates the consistently wider distribution of forecast errors for Russell 2000 firms relative to S&P 500 firms, indicating greater variability in analyst forecasting performance among small-cap firms.
After accounting for outliers, analyst forecasts remain consistently more accurate for S&P 500 firms than for Russell 2000 firms, and the overall patterns across periods remain largely the same. Overall, the evidence from Table 2B and Figure 1 suggests that the main conclusions of this study are not driven by a small number of unusually large observations.
4.4. Changes in Forecast Accuracy Across Periods
Table 3 reports pairwise comparisons of mean forecast errors using Welch two-sample t-tests, which allow for unequal variances and unequal sample sizes between groups.
For S&P 500 firms, all three pairwise comparisons are statistically significant, indicating meaningful changes in forecast accuracy across periods. For Russell 2000 firms, the results are less consistent. Despite a large mean difference of 19.11% between 2020–2022 and 2023–2025, the corresponding p-value is 0.29 because forecast errors during the pandemic period exhibit exceptionally large variation. In contrast, the smaller mean difference of 2.12 percentage points between 2015–2019 and 2023–2025 is statistically significant (p < 0.001). Although modest relative to the large fluctuations observed during the pandemic period, this difference remains economically meaningful and provides evidence of improved forecast accuracy for Russell 2000 firms during the post-pandemic AI era. These findings highlight the substantial variability of forecast errors among small-cap firms.
4.5. Cross-Index Comparison
Table 4 compares forecast accuracy between S&P 500 and Russell 2000 firms within each period. Using the original data, Table 4A shows S&P 500 firms exhibit significantly lower forecast errors than Russell 2000 firms during 2015–2019 and 2023–2025. During the pandemic period, however, the large variance of Russell 2000 forecast errors reduces statistical significance despite a large difference in means.
The winsorized results in Table 4B provide stronger evidence. After limiting the influence of extreme observations, S&P 500 firms exhibit significantly lower forecast errors in all three periods. Moreover, the differences are remarkably stable over time, ranging from -1.17% to -1.47%. These findings indicate that analyst forecasts for large-cap firms are consistently more accurate than those for small-cap firms.
Both Table 4A,B indicate that the difference in forecast errors between S&P 500 and Russell 2000 firms narrowed during the AI era. One possible explanation is the widespread adoption of AI tools for financial information processing, which may have improved analysts’ ability to obtain and process information for smaller firms.
4.6. Forecast Bias
Table 5A and Table 5B examine signed price-scaled forecast errors to evaluate forecast bias. Table 5A shows persistent positive forecast bias for S&P 500 firms throughout the sample period. Mean signed forecast errors are positive and statistically different from zero in every period, indicating that analysts systematically underestimate earnings for large-cap firms.
The evidence for Russell 2000 firms is weaker and less consistent. Mean signed forecast errors are close to zero and statistically insignificant during both 2015–2019 and 2020–2022, suggesting little systematic forecast bias during these periods. However, forecast errors become significantly positive during 2023–2025, indicating that analysts increasingly underestimated earnings for small-cap firms as well in the post-pandemic AI era.
The results in Table 5B reveal an interesting change in analyst forecasting behavior over time. During both 2015–2019 and 2020–2022, analysts covering S&P 500 firms exhibited greater earnings underestimation than analysts covering Russell 2000 firms, with mean bias differences of 0.15% and 0.14%, respectively (both p < 0.001). By 2023–2025, however, the difference in forecast bias declined to essentially zero (-0.01%) and became statistically insignificant (p = 0.81). This finding suggests that the historical difference in forecast bias between large-cap and small-cap firms largely disappeared during the post-pandemic period.
One possible explanation is that recent advances in financial information processing and AI-assisted tools may have benefited analysts covering smaller firms relatively more, reducing historical differences in forecast bias.
4.7. Summary of Findings
Overall, the results provide strong evidence that analyst forecasts are consistently more accurate for S&P 500 firms than for Russell 2000 firms. Forecast accuracy declined during the COVID-19 period but recovered notably during 2023–2025, particularly among large-cap firms. Importantly, the gap in forecast error between S&P 500 and Russell 2000 firms narrows in the post-pandemic period, suggesting a partial convergence in forecasting performance across firm sizes. These findings remain robust after controlling for the influence of extreme observations.
The next section discusses the implications of these findings and explores possible explanations for the observed patterns in analyst forecasting performance.
5. Discussion and Limitations
The most consistent finding of this study is that analyst forecasts are more accurate for S&P 500 firms than for Russell 2000 firms. Large firms usually receive more analyst coverage, provide more information to investors, and operate in richer information environments, all of which help analysts make more accurate forecasts.
Forecast accuracy changed considerably across the three sample periods. Forecast errors increased during the COVID-19 period, particularly for Russell 2000 firms, reflecting the high uncertainty created by supply-chain disruptions, labor shortages, inflation, and rapidly changing business conditions. Forecast accuracy improved during 2023–2025 as economic conditions stabilized and corporate earnings became more predictable. While technological developments may have contributed to this improvement, the present study does not identify the individual factors responsible for the observed changes.
The 2023–2025 period coincided with rapid advances in artificial intelligence and financial analysis tools. During this period, the difference in mean signed forecast errors between S&P 500 and Russell 2000 firms fell to nearly zero (-0.01%) and was not statistically significant (p = 0.81). In other words, analysts covering large-cap and small-cap firms exhibited very similar levels of earnings underestimation during this period. One possible explanation is that improvements in information availability and analytical technology may have benefited analysts covering smaller firms relatively more, reducing the historical difference in forecast bias between the two groups. However, the results should not be interpreted as evidence that AI directly caused the convergence in forecast bias. Economic recovery, improved corporate disclosures, better financial databases, and other advances in analytical technology likely also contributed to the changing information environment.
This study has several limitations. First, it only examines firms in the S&P 500 and Russell 2000, so the results may not apply to other firms or markets. Second, the analysis identifies relationships between variables but cannot determine cause and effect, so it cannot isolate the impact of AI or other individual factors. Third, the sample includes only firms that remained in the indices through the end of 2025, which may introduce survivorship bias. As a result, the findings mainly reflect the forecasting performance of these surviving firms. Future research may examine other markets, different types of financial forecasts, and direct measures of AI adoption.
6. Data and Code Availability
The Java source code used for data collection, processing, and statistical analysis in this study is publicly available at: https://github.com/ivyshanganalytics/StockEventAnalysis. The raw results underlying the tables and figures reported in this paper are also available in the GitHub repository to facilitate replication and verification of the reported findings.
Appendix A. Yearly Statistics for S&P 500 Stocks (2015–2025)
| Period | N | Mean | Median | Std | RMSE | P25 | P75 | W.mean |
| 2015 | 1749 | 0.24 | 0.06 | 1.37 | 1.39 | 0.019 | 0.16 | 0.19 |
| 2016 | 1774 | 0.24 | 0.06 | 1.78 | 1.79 | 0.021 | 0.16 | 0.17 |
| 2017 | 1780 | 0.25 | 0.07 | 0.95 | 0.98 | 0.025 | 0.17 | 0.21 |
| 2018 | 1796 | 0.25 | 0.07 | 0.80 | 0.84 | 0.028 | 0.20 | 0.21 |
| 2019 | 1833 | 0.28 | 0.07 | 1.13 | 1.17 | 0.025 | 0.19 | 0.23 |
| 2020 | 1886 | 0.40 | 0.12 | 1.12 | 1.19 | 0.040 | 0.34 | 0.37 |
| 2021 | 1913 | 0.27 | 0.10 | 0.64 | 0.69 | 0.035 | 0.25 | 0.23 |
| 2022 | 1924 | 0.28 | 0.09 | 0.74 | 0.79 | 0.032 | 0.23 | 0.26 |
| 2023 | 1952 | 0.30 | 0.09 | 0.94 | 0.98 | 0.033 | 0.23 | 0.26 |
| 2024 | 1984 | 0.18 | 0.06 | 0.38 | 0.42 | 0.026 | 0.16 | 0.17 |
| 2025 | 1981 | 0.18 | 0.08 | 0.34 | 0.39 | 0.030 | 0.20 | 0.18 |
| All | 20572 | 0.26 | 0.08 | 1.00 | 1.03 | 0.028 | 0.21 | 0.22 |
| Note: N is the number of earning announcements. W.mean is winsorized mean (1%). All values are percentages. | ||||||||
Appendix B. Yearly Statistics for Russell 2000 Stocks (2015–2025)
| Period | N | Mean | Median | Std | RMSE | P25 | P75 | W. mean |
| 2015 | 3361 | 6.26 | 0.22 | 137.7 | 137.8 | 0.08 | 0.83 | 1.32 |
| 2016 | 3920 | 2.47 | 0.25 | 20.2 | 20.3 | 0.08 | 0.97 | 1.60 |
| 2017 | 4211 | 3.88 | 0.26 | 64.0 | 64.1 | 0.08 | 0.98 | 1.31 |
| 2018 | 4526 | 4.97 | 0.28 | 97.1 | 97.2 | 0.09 | 0.98 | 1.50 |
| 2019 | 4942 | 2.96 | 0.31 | 29.4 | 29.5 | 0.10 | 1.25 | 1.63 |
| 2020 | 5301 | 3.52 | 0.62 | 28.3 | 28.6 | 0.19 | 1.88 | 2.12 |
| 2021 | 6173 | 55.90 | 0.40 | 4231 | 4231 | 0.14 | 1.17 | 1.42 |
| 2022 | 6808 | 3.01 | 0.45 | 36.1 | 36.2 | 0.16 | 1.39 | 1.76 |
| 2023 | 7106 | 2.07 | 0.48 | 16.5 | 16.6 | 0.16 | 1.43 | 1.46 |
| 2024 | 7408 | 1.65 | 0.38 | 15.2 | 15.3 | 0.13 | 1.10 | 1.19 |
| 2025 | 7308 | 1.99 | 0.42 | 11.9 | 12.1 | 0.15 | 1.30 | 1.50 |
| All | 61064 | 8.35 | 0.38 | 1346 | 1346 | 0.12 | 1.23 | 1.50 |
| Note: N is the number of earning announcements. W. mean is winsorized mean (1%). All values are percentages. | ||||||||
References
- Healy, P. M., & Palepu, K. G. (2001). Information asymmetry, corporate disclosure, and the capital markets: A review of the empirical disclosure literature. Journal of Accounting and Economics, 31(1–3), 405–440. [CrossRef]
- Beyer, A., Cohen, D. A., Lys, T. Z., & Walther, B. R. (2010). The financial reporting environment: Review of the recent literature. Journal of Accounting and Economics, 50(2–3), 296–343. [CrossRef]
- Hong, H., Lim, T., & Stein, J. C. (2000). Bad news travels slowly: Size, analyst coverage, and the profitability of momentum strategies. The Journal of Finance, 55(1), 265–295. [CrossRef]
- Jacob, J., Lys, T., & Neale, M. (1999). Expertise in forecasting performance of security analysts. Journal of Accounting and Economics, 28(1), 51–82. [CrossRef]
- Clement, M. B. (1999). Analyst forecast accuracy: Do ability, resources, and portfolio complexity matter? Journal of Accounting and Economics, 27(3), 285–303. [CrossRef]
- Brown, L. D. (2001). A temporal analysis of earnings surprises: Profits versus losses. Financial Analysts Journal, 57(2), 44–51.
- Larocque, S. (2013). Intermediaries’ forecasting errors and firm characteristics. Journal of Business Finance & Accounting, 40(1–2), 126–149.
- Barth, M. E., Kasznik, R., & McNichols, M. (2001). Analyst coverage and intangible assets. Journal of Accounting Research, 39(1), 1–34. [CrossRef]
- Lim, S. Y. (2022). Earnings forecasts and firm characteristics in the wholesale and retail industries. Journal of Distribution Science, 20(12), 117–127.
- Amiram, G., Owens, E. L., & Rozenbaum, O. (2016). Do financial analysts’ forecasts reflect macroeconomic conditions? Journal of Banking & Finance, 72, 167–181.
- Crouzet, N., & Mehrotra, N. R. (2020). Small and large firms over the business cycle. American Economic Review, 110(11), 3549–3601. [CrossRef]
- Loh, R. K., & Stulz, R. M. (2018). Is sell-side research more valuable in bad times? The Journal of Finance, 73(3), 959–1013. [CrossRef]
- Jo, S., & Sekkel, R. (2017). Macroeconomic uncertainty through the lens of professional forecasters. Journal of Business & Economic Statistics, 37(3), 436–446. [CrossRef]
- Baker, S. R., Bloom, N., Davis, S. J., & Terry, S. J. (2020). COVID-induced economic uncertainty. NBER Working Paper No. 26983.
- Bilinski, P. (2023). Analyst research activity during the COVID-19 pandemic. Abacus, 59(4), 1041–1073. [CrossRef]
- van Binsbergen, J. H., Han, X., & Lopez-Lira, A. (2023). Man versus machine learning: The term structure of earnings expectations and conditional biases. The Review of Financial Studies, 36(6), 2361–2405.
- Chen, X., Cho, Y. H., Dou, Y., & Lev, B. (2022). Predicting future earnings changes using machine learning and detailed financial data. Journal of Accounting Research, 60(2), 467–515. [CrossRef]
- Xue, J., Zhang, Q., & Zhu, W. (2025). Generative AI for analysts. arXiv. [CrossRef]
- Hope, O.-K. (2003). Disclosure practices, enforcement of accounting standards, and analysts’ forecast accuracy. Journal of Accounting Research, 41(2), 235–272. [CrossRef]
- Bae, K. H., Stulz, R. M., & Tan, H. (2008). Do local analysts know more? A cross-country study of the performance of local analysts and foreign analysts. Journal of Financial Economics, 88(3), 581–606. [CrossRef]
- Boudt, K., De Goeij, P., Thewissen, J., Van Campenhout, G., & Wyatt, A. (2015). Analysts’ forecast error: A robust prediction model and its short-term trading profitability. Accounting & Finance, 55(3), 683–715.
Figure 1.
Boxplots of 1% Winsorized Absolute Price-Scaled Forecast Errors. Note: The figure presents the distribution of 1% winsorized absolute price-scaled forecast errors for S&P 500 and Russell 2000 firms across three sample periods (2015–2019, 2020–2022, and 2023–2025). Boxes represent the interquartile range (25th–75th percentiles), the horizontal line within each box indicates the median, whiskers extend to the most extreme observations within 1.5 times the interquartile range, × denotes the mean.
Figure 1.
Boxplots of 1% Winsorized Absolute Price-Scaled Forecast Errors. Note: The figure presents the distribution of 1% winsorized absolute price-scaled forecast errors for S&P 500 and Russell 2000 firms across three sample periods (2015–2019, 2020–2022, and 2023–2025). Boxes represent the interquartile range (25th–75th percentiles), the horizontal line within each box indicates the median, whiskers extend to the most extreme observations within 1.5 times the interquartile range, × denotes the mean.
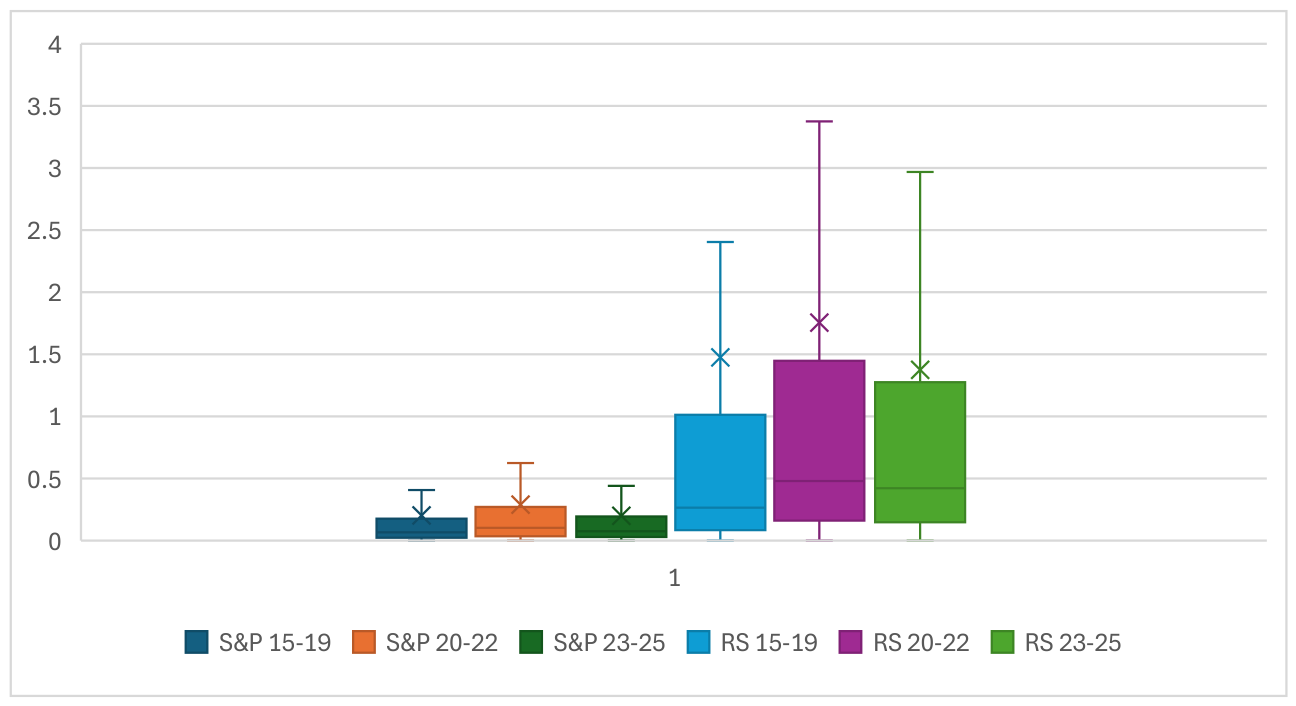

Table 1.
Sample Description. This table reports the number of firms and earnings reports used in the analysis for S&P 500 and Russell 2000 firms over 2015–2025.
Table 1.
Sample Description. This table reports the number of firms and earnings reports used in the analysis for S&P 500 and Russell 2000 firms over 2015–2025.
| Period | Firms | Earning Reports | Avg Price ($) | |
|---|---|---|---|---|
| S&P 500 | 2015–2019 | 470 | 8932 | 109.52 |
| 2020–2022 | 486 | 5723 | 180.81 | |
| 2023–2025 | 498 | 5917 | 208.63 | |
| 2015-2025 | 498 | 20572 | 157.85 | |
| Russell 2000 | 2015–2019 | 1325 | 20960 | 32.87 |
| 2020–2022 | 1762 | 18282 | 35.20 | |
| 2023–2025 | 1923 | 21822 | 32.88 | |
| 2015–2025 | 1923 | 61064 | 33.57 |
Notes: The sample includes earnings announcements with available actual EPS, analyst forecast EPS, and stock price data. Earnings announcements with a pre-announcement closing stock price below $1 are excluded. Average stock prices are calculated across all firms and trading days within each sample period.
Table 2.
A. Forecast Accuracy by Market Index and Time Period. B. Distribution of Forecast Errors by Market Index and Time Period.
Table 2.
A. Forecast Accuracy by Market Index and Time Period. B. Distribution of Forecast Errors by Market Index and Time Period.
| A | |||||
| Market Index | Period | Mean | Median | Std. Dev. | RMSE |
| S&P 500 | 2015-2019 | 0.25 | 0.07 | 1.25 | 1.27 |
| 2020-2022 | 0.32 | 0.10 | 0.86 | 0.92 | |
| 2023-2025 | 0.22 | 0.08 | 0.62 | 0.65 | |
| 2015-2025 | 0.26 | 0.08 | 1.00 | 1.03 | |
| Russell 2000 | 2015-2019 | 4.02 | 0.27 | 78.6 | 78.70 |
| 2020-2022 | 21.01 | 0.48 | 2458.91 | 2458.93 | |
| 2023-2025 | 1.90 | 0.42 | 14.66 | 14.79 | |
| 2015-2025 | 8.35 | 0.38 | 1346.25 | 1346.26 | |
| Notes: Forecast accuracy is measured by the price-scaled absolute forecast error. Lower values indicate higher forecast accuracy. RMSE denotes the root mean squared error. All values are percentages. | |||||
| B | |||||
| Market Index | Period | P25 | P75 | W.Mean (1%) | |
| S&P 500 | 2015-2019 | 0.023 | 0.177 | 0.203 | |
| 2020-2022 | 0.035 | 0.271 | 0.291 | ||
| 2023-2025 | 0.030 | 0.194 | 0.201 | ||
| 2015-2025 | 0.028 | 0.207 | 0.225 | ||
| Russell 2000 | 2015-2019 | 0.084 | 1.013 | 1.475 | |
| 2020-2022 | 0.161 | 1.447 | 1.756 | ||
| 2023-2025 | 0.147 | 1.276 | 1.376 | ||
| 2015-2025 | 0.123 | 1.234 | 1.499 | ||
| Notes: P25 and P75 denote the 25th and 75th percentiles calculated from the original sample, while W.Mean (1%) denotes the mean forecast error after applying 1% winsorization. | |||||
Table 3.
Pairwise Period Comparison.
| Market Index | Comparison Period | Mean Difference | t-stat | p-value |
|---|---|---|---|---|
| S&P 500 | 2015–19 vs 2020–22 | -0.07 | -3.70 | 0.000 |
| 2020–22 vs 2023–25 | 0.10 | 7.00 | 0.000 | |
| 2015–19 vs 2023–25 | 0.03 | 2.12 | 0.034 | |
| Russell 2000 | 2015–19 vs 2020–22 | -16.99 | -0.93 | 0.350 |
| 2020–22 vs 2023–25 | 19.11 | 1.05 | 0.290 | |
| 2015–19 vs 2023–25 | 2.12 | 3.83 | 0.000 |
Note: Pairwise comparisons are based on Welch two-sample t-tests using the price-scaled absolute forecast error defined in Table 2. Mean difference is calculated as earlier time period mean – later time period mean. A larger positive mean difference indicates improved forecast accuracy in the later period.
Table 4.
A. S&P 500 vs. Russell 2000 Comparison. B. S&P 500 vs. Russell 2000 forecast errors comparison using 1% winsorization.
Table 4.
A. S&P 500 vs. Russell 2000 Comparison. B. S&P 500 vs. Russell 2000 forecast errors comparison using 1% winsorization.
| A | |||
| Period | Mean Difference | t-stat | p-value |
| 2015-2019 | -3.75 | -6.89 | 0.000 |
| 2020-2022 | -20.69 | -1.13 | 0.250 |
| 2023-2025 | -1.68 | -16.89 | 0.000 |
| Note: Mean difference is calculated as the S&P 500 mean forecast error minus the Russell 2000 mean forecast error for the corresponding sample period, based on the original data. | |||
| B | |||
| Period | Mean Difference | t-stat | p-value |
| 2015-2019 | -1.27 | -39.18 | 0.000 |
| 2020-2022 | -1.47 | -43.25 | 0.000 |
| 2023-2025 | -1.17 | -57.84 | 0.000 |
| Note: Mean difference is calculated as the mean forecast error for the S&P 500 minus that for the Russell 2000 within the same sample period. | |||
Table 5.
A. Forecast Bias (Signed Price-Scaled Forecast Error). B. Cross-index bias comparison using 1% Winsorized forecast errors.
Table 5.
A. Forecast Bias (Signed Price-Scaled Forecast Error). B. Cross-index bias comparison using 1% Winsorized forecast errors.
| A | |||||
| Market Index | Period | Mean | Std. Dev. | t-stat(vs.0) | p-value |
| S&P500 | 2015-2019 | 0.13 | 0.36 | 34.31 | 0.000 |
| 2020-2022 | 0.17 | 0.47 | 27.69 | 0.000 | |
| 2023-2025 | 0.14 | 0.35 | 30.10 | 0.000 | |
| 2015-2025 | 0.14 | 0.38 | 53.32 | 0.000 | |
| Russell 2000 | 2015-2019 | -0.02 | 3.21 | -0.86 | 0.380 |
| 2020-2022 | 0.03 | 3.67 | 1.02 | 0.300 | |
| 2023-2025 | 0.14 | 2.60 | 8.07 | 0.000 | |
| 2015-2025 | 0.06 | 3.06 | 5.09 | 0.000 | |
| Notes: Results are based on 1% winsorized forecast errors. Positive values indicate analyst underestimation of earnings, while negative values indicate analyst overestimation. | |||||
| B | |||||
| Period | Mean Difference | t-stat | p-value | ||
| 2015-2019 | 0.15 | 6.65 | 0.000 | ||
| 2020-2022 | 0.14 | 5.17 | 0.000 | ||
| 2023-2025 | -0.01 | -0.23 | 0.810 | ||
| 2015-2025 | 0.08 | 6.41 | 0.000 | ||
Note: mean difference is S&P mean – Russell mean.
Disclaimer/Publisher’s Note: The statements, opinions and data contained in all publications are solely those of the individual author(s) and contributor(s) and not of MDPI and/or the editor(s). MDPI and/or the editor(s) disclaim responsibility for any injury to people or property resulting from any ideas, methods, instructions or products referred to in the content. |
© 2026 by the authors. Licensee MDPI, Basel, Switzerland. This article is an open access article distributed under the terms and conditions of the Creative Commons Attribution (CC BY) license (http://creativecommons.org/licenses/by/4.0/).
Copyright: This open access article is published under a Creative Commons CC BY 4.0 license, which permit the free download, distribution, and reuse, provided that the author and preprint are cited in any reuse.


