

Submitted:
23 July 2026
Posted:
23 July 2026
You are already at the latest version
Abstract
Abstract
Introduction: The conversion of ventricular pressure into forward arterial blood flow is the fundamental mechanism by which the heart transfers hydraulic energy to the circulation. Conventional hemodynamic indices, including ventricular pressure, stroke volume, cardiac output, ejection fraction, and dP/dt, assess pressure generation and flow separately and therefore provide only indirect insight into ventricular hydraulic energy transfer. A novel pressure–flow (PF) loop framework was developed to characterize the temporal coupling between left ventricular pressure (LVP) and aortic blood flow under baseline conditions and during Dobutamine-induced enhancement of cardiac performance. Materials and Methods: Simultaneous high-fidelity measurements of LVP, aortic pressure, and transit-time aortic blood flow were obtained in a large-animal model. PF loops were constructed by plotting instantaneous LVP against corresponding aortic flow throughout individual cardiac cycles. Mean flow acceleration (dV/dt), dP/dt_max, heart rate, and cardiac timing intervals were analyzed under baseline conditions and during Dobutamine infusion (5 μg·kg⁻¹·min⁻¹). Results: Dobutamine significantly altered ventricular pressure–flow coupling and PF-loop morphology. Mean dV/dt increased from 9.0 ± 2.1 to 12.4 ± 1.0 ml·min⁻¹·s⁻¹ (p = 0.0005), while dP/dt_max increased from 1260.7 ± 77.9 to 3626.5 ± 82.8 mmHg·s⁻¹ (p < 0.0001). Heart rate increased from 114 to 155 beats·min⁻¹. IVCT and ET decreased significantly, whereas IVRT plus filling time increased. PF loops demonstrated enlargement and steepening during β-adrenergic stimulation, consistent with accelerated hydraulic energy transfer. Conclusions: PF-loop analysis provides a proof-of-concept methodology for quantifying ventricular hydraulic energy transfer from synchronized invasive pressure and flow recordings. This approach captures dynamic aspects of pressure-to-flow conversion not directly measurable using conventional pressure-or-volume-based indices and may serve as a foundation for future quantitative biomarkers of ventricular and valvular performance.
Keywords:
pressure-flow loop
; ventricular hydraulic energy transfer
; left ventricular pressure
; aortic blood flow
; dobutamine stress
; dP/dt
; ventricular-vascular coupling
; hemodynamics
; cardiac mechanics
; valve physiology
1. Introduction
The conversion of ventricular pressure into forward arterial blood flow represents the fundamental mechanism by which the heart transfers hydraulic energy to the circulation. Current hemodynamic assessment relies on measurements of ventricular pressure, stroke volume, cardiac output, ejection fraction, and pressure-derived indices such as dP/dt. However, these parameters evaluate pressure generation and blood flow separately and therefore provide only indirect information regarding ventricular hydraulic energy transfer [1,2,3,4,5]. Simultaneous assessment of ventricular pressure and arterial blood flow offers an opportunity to characterize pressure-flow coupling throughout the cardiac cycle. Accordingly, the present study introduces a novel pressure-flow (PF) loop framework to evaluate the temporal relationship between left ventricular pressure (LVP) generation and aortic blood flow under baseline conditions and during pharmacologically enhanced cardiac performance induced by dobutamine stress. Recent advances in invasive hemodynamic instrumentation permit synchronized acquisition of high-fidelity ventricular pressure together with transit-time blood flow measurements from the ascending aorta and pulmonary artery. These simultaneous recordings provide a unique opportunity to construct ventricular pressure-flow loops that describe the instantaneous relationship between ventricular pressure generation and arterial blood flow throughout the cardiac cycle [6]. Unlike conventional pressure-volume loops, which quantify ventricular mechanical work, PF loops characterize the transfer of hydraulic energy from the ventricle into the arterial circulation and therefore provide a more direct physiological assessment of transvalvular energy transmission [7,8,9,10,11]. Pharmacological manipulation of cardiac performance provides an effective means of evaluating the sensitivity of PF-loop analysis to dynamic changes in ventricular loading conditions and contractile state. Dobutamine, a β-adrenergic agonist widely used to increase myocardial contractility and heart rate, produces predictable increases in ventricular pressure development, flow acceleration, and cardiac output [12,13]. Consequently, Dobutamine stress testing provides a physiological model for examining how ventricular pressure-flow coupling adapts during enhanced cardiac performance and whether PF loops can detect changes in hydraulic energy transfer that are not readily captured by conventional hemodynamic indices [14,15].
In the present study, the author introduces a novel framework termed Valve Hydraulic Energy Transfer (VHET), based on simultaneous invasive measurements of ventricular pressure and arterial blood flow obtained in a large-animal model. Rather than considering pressure or flow independently, VHET integrates both variables to characterize instantaneous hydraulic power generation and its temporal evolution during ventricular ejection. To establish proof of concept, pressure-flow relationships were evaluated under baseline conditions and during Dobutamine-induced hemodynamic stress [14].
It was hypothesized that β-adrenergic stimulation would substantially alter ventricular pressure-flow coupling, resulting in increased flow acceleration, shortened ejection-related timing intervals, and measurable changes in PF-loop morphology. Specifically, enhanced contractility was expected to increase the rate of pressure development (dP/dt), accelerate hydraulic energy transfer into the arterial circulation, and produce larger and steeper pressure-flow loops indicative of more efficient systolic ejection. Furthermore, it was hypothesized that PF-loop-derived parameters would provide mechanistic insights into ventricular energy transfer beyond those obtainable from traditional measures such as cardiac output, stroke volume, and ejection fraction.
Power(t) = P(t) × Q(t)
2. Materials and Methods
Experimental Preparation: Acute experiments were performed in anesthetized swine following institutional approval and in accordance with the Public Health Service Policy on the Humane Care and Use of Laboratory Animals and Institutional Animal Care and Use Committee (IACUC) guidelines. Following induction of anesthesia and mechanical ventilation, a median sternotomy was performed to expose the heart and great vessels. The sternum was divided along the midline using an oscillating saw while protecting the underlying mediastinal structures. The pericardium was opened longitudinally, allowing exposure of the ascending aorta, main pulmonary artery, and ventricular apices. Throughout the procedure, meticulous hemostasis was maintained using electrocautery, suction, and bone wax when necessary.
Flow Probe Placement: Transit-time flow probes were placed around the ascending aorta and the main pulmonary artery to obtain continuous measurements of instantaneous blood flow. Appropriate probe size was selected to ensure a non-constrictive fit, with the vessel occupying approximately 75–90% of the probe lumen. Twenty-millimeter PAU-Series perivascular transit-time flow probes (Transonic Systems Inc., Ithaca, NY, USA) were secured around each outflow tract after careful removal of surrounding perivascular adipose tissue. Probe cables were anchored with sutures to minimize motion artifacts and optimize signal quality. Flow probes were connected to a T420 Perivascular Flowmeter (Transonic Systems Inc., Ithaca, NY, USA). Ventricular Pressure Measurements: High-fidelity ventricular pressure was measured using 5F solid-state pressure catheters (Transonic Scisense Inc., London, ON, Canada). Prior to instrumentation, pressure sensors were hydrated for 30 minutes in 0.9% saline at 38 °C according to the manufacturer’s recommendations and subsequently pressure balanced. Catheters were introduced directly through the left and right ventricular apices, permitting simultaneous acquisition of left ventricular (LV) and right ventricular (RV) pressure waveforms throughout the experiment. Hemodynamic Data Acquisition: Left ventricular pressure (LVP), right ventricular pressure (RVP), ascending aortic blood flow, pulmonary artery blood flow, electrocardiogram (ECG), first derivative of ventricular pressure (dP/dt), and derived cardiac output (CO) were recorded simultaneously using an ADV500 pressure control unit (Transonic Scisense Inc., London, ON, Canada), a T420 Perivascular Flowmeter (Transonic Systems Inc., Ithaca, NY, USA), and an iWorx data acquisition system (iWorx Systems Inc., Dover, NH, USA). Data acquisition and subsequent analyses were performed using LabScribe3 software (iWorx Systems Inc., Dover, NH, USA). Signals were sampled at 200 Hz. To minimize respiratory motion artifact during acquisition, recordings were obtained during brief end-inspiratory ventilatory pauses (15–20 seconds). Pressure-Flow Loop Construction: Pressure-flow (PF) loops were constructed by plotting instantaneous ventricular pressure against simultaneously measured blood flow in the corresponding outflow vessel throughout each cardiac cycle. Left ventricular PF loops were generated using LVP and ascending aortic blood flow, whereas right ventricular PF loops were generated using RVP and pulmonary artery blood flow. Loop progression was analyzed throughout isovolumetric contraction, ventricular ejection, and isovolumetric relaxation.
Instantaneous hydraulic power (1) was defined as the product of ventricular pressure and corresponding arterial blood flow. The time integral of hydraulic power over one cardiac cycle represented ventricular hydraulic energy transfer (2). The temporal relationship between pressure generation and forward blood flow was evaluated by comparing the timing of peak ventricular pressure, peak dP/dt, peak blood flow, and valve opening and closure events identified from synchronized ECG, pressure, and flow recordings.
Study Endpoints: The primary endpoint was characterization of ventricular pressure-flow coupling and hydraulic energy transfer during systole. Secondary analyses compared temporal PF relationships between the left and right ventricles, including the delay between peak pressure development and maximal forward blood flow, PF loop morphology, and enclosed loop area as an index of hydraulic energy transfer.
Data Acquisition: Pressure and flow signals were sampled at 200 Hz and analyzed offline. Ventricular ejection onset was identified by dP/dt_max and ejection termination by dP/dt_min with confirmation using the aortic pressure notch. Pressure–flow loops were generated by plotting instantaneous left ventricular pressure against simultaneously acquired aortic blood flow values throughout each cardiac cycle.
Valve Hydraulic Energy Transfer (VHET)
(1) Instantaneous hydraulic power
Power(t) = PLV(t) × QAo(t)
P(t) = ventricular pressure (mmHg); Q(t) = arterial flow (L/min); Power(t) = instantaneous hydraulic power
Power in Watts (W)=P(mmHg)×Q(L/min) ×0.002222
Due to 1 mmHg×1 L/min=0.002222 W
(2) Hydraulic energy (Integrated hydraulic energy transfer per cardiac beat)
E = ʃ P(t)Q(t)dt
(3) Normalized Energy Transfer (index)
This normalized index has flow like units and represents the pressure weighted mean forward flow during ejection.
Statistical Analysis: All values are reported as mean ± SD. Hemodynamic and PF loop variables were measured from 10 consecutive cardiac cycles acquired during steady-state baseline conditions and during steady-state Dobutamine infusion (5 μg·kg−1·min−1). Variables analyzed included mean flow acceleration during ejection (dV/dt), dP/dt_max, dP/dt_min, IVCT, ET, and IVRT + filling time. Comparisons between baseline and Dobutamine conditions were performed using two-tailed Student’s t-tests. Statistical significance was defined as p < 0.05. Because these observations were obtained from repeated cardiac cycles within the same experimental preparation, statistical results should be interpreted as demonstrating physiological differences between conditions rather than population-level inference.
3. Results
Construction of Left Ventricular PF Loops: Simultaneous acquisition of left ventricular pressure (LVP), aortic pressure, aortic blood flow, and dP/dt signals enabled construction of PF loops throughout individual cardiac cycles (Figure 1). Ventricular ejection was identified using dP/dt_max and dP/dt_min together with the aortic pressure notch, allowing the ejection phase to be isolated and quantified. Plotting instantaneous LVP against corresponding aortic blood flow generated reproducible PF loops that characterized the dynamic relationship between ventricular pressure generation and forward arterial flow.
Quantification of baseline biventricular hydraulic energy transfer: Using cardiac cycle landmark-based trapezoidal integration of synchronized pressure-flow data, baseline LV ejection generated an estimated integrated hydraulic energy transfer of 0.421 J/beat, corresponding to a mean ejection hydraulic power of 2.25 W. The normalized VHET index was 12.50 L/min, reflecting the pressure-weighted mean forward flow during ejection. The estimated LV ejection volume derived from the analyzed pressure-flow segment was 33.9 mL, and the cardiac cycle landmark-based PF-loop area was 435.6 mmHg·L/min. The RV demonstrated a lower absolute hydraulic energy transfer, with an estimated 0.070 J/beat and mean ejection hydraulic power of 0.37 W. However, normalized RV VHET was 9.95 L/min, indicating relatively preserved pressure-weighted forward flow despite substantially lower pulmonary ventricular pressure. The estimated RV ejection volume from the analyzed segment was 25.8 mL, and the cardiac cycle landmark-based RV PF-loop area was 38.6 mmHg·L/min.
Temporal dissociation between pressure generation and flow delivery: In the LV, aortic flow remained low during the early increase in ventricular pressure, rising from near zero to only 6.649 L/min as LVP increased to approximately 97.5 mmHg. Peak aortic flow occurred later, reaching 22.827 L/min while LVP remained near 96.7 mmHg, and substantial forward flow persisted as LVP declined toward 58.4 mmHg. This pattern indicates delayed conversion of ventricular pressure into maximal forward flow, consistent with transient storage and release of hydraulic energy within the proximal arterial system.
In contrast, the RV achieved peak pulmonary flow earlier in relation to pressure development. PA flow increased to 12.862 L/min as RVP reached 22.845 mmHg, consistent with more immediate pressure-to-flow conversion in the low-pressure pulmonary circuit.
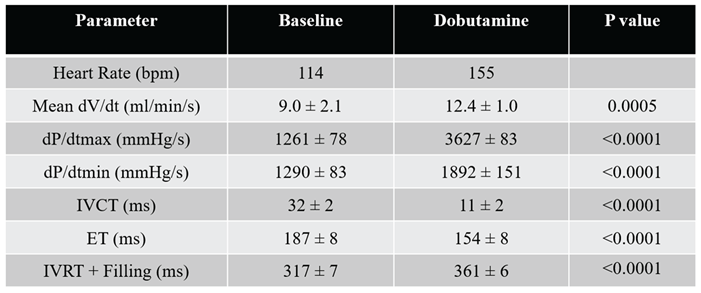
Dobutamine Increases Flow Acceleration and Contractility: Analysis of ten consecutive cardiac cycles demonstrated a significant increase in mean flow acceleration (dV/dt) during ejection from 9.0 ± 2.1 to 12.4 ± 1.0 ml·min−1·s−1 following Dobutamine administration (p = 0.00052). Peak ventricular contractility increased substantially, with dP/dt_max rising from 1260.7 ± 77.9 to 3626.5 ± 82.8 mmHg·s−1 (p = 7.76 × 10⁻²³). Similarly, dP/dt_min increased from 1289.7 ± 82.7 to 1891.8 ± 151.1 mmHg·s−1 (p = 2.78 × 10⁻⁸). Heart rate increased from 114 bpm at baseline to 155 bpm during Dobutamine infusion. These findings indicate enhanced ventricular pressure generation and more rapid transfer of hydraulic energy into the systemic circulation during β-adrenergic stimulation.
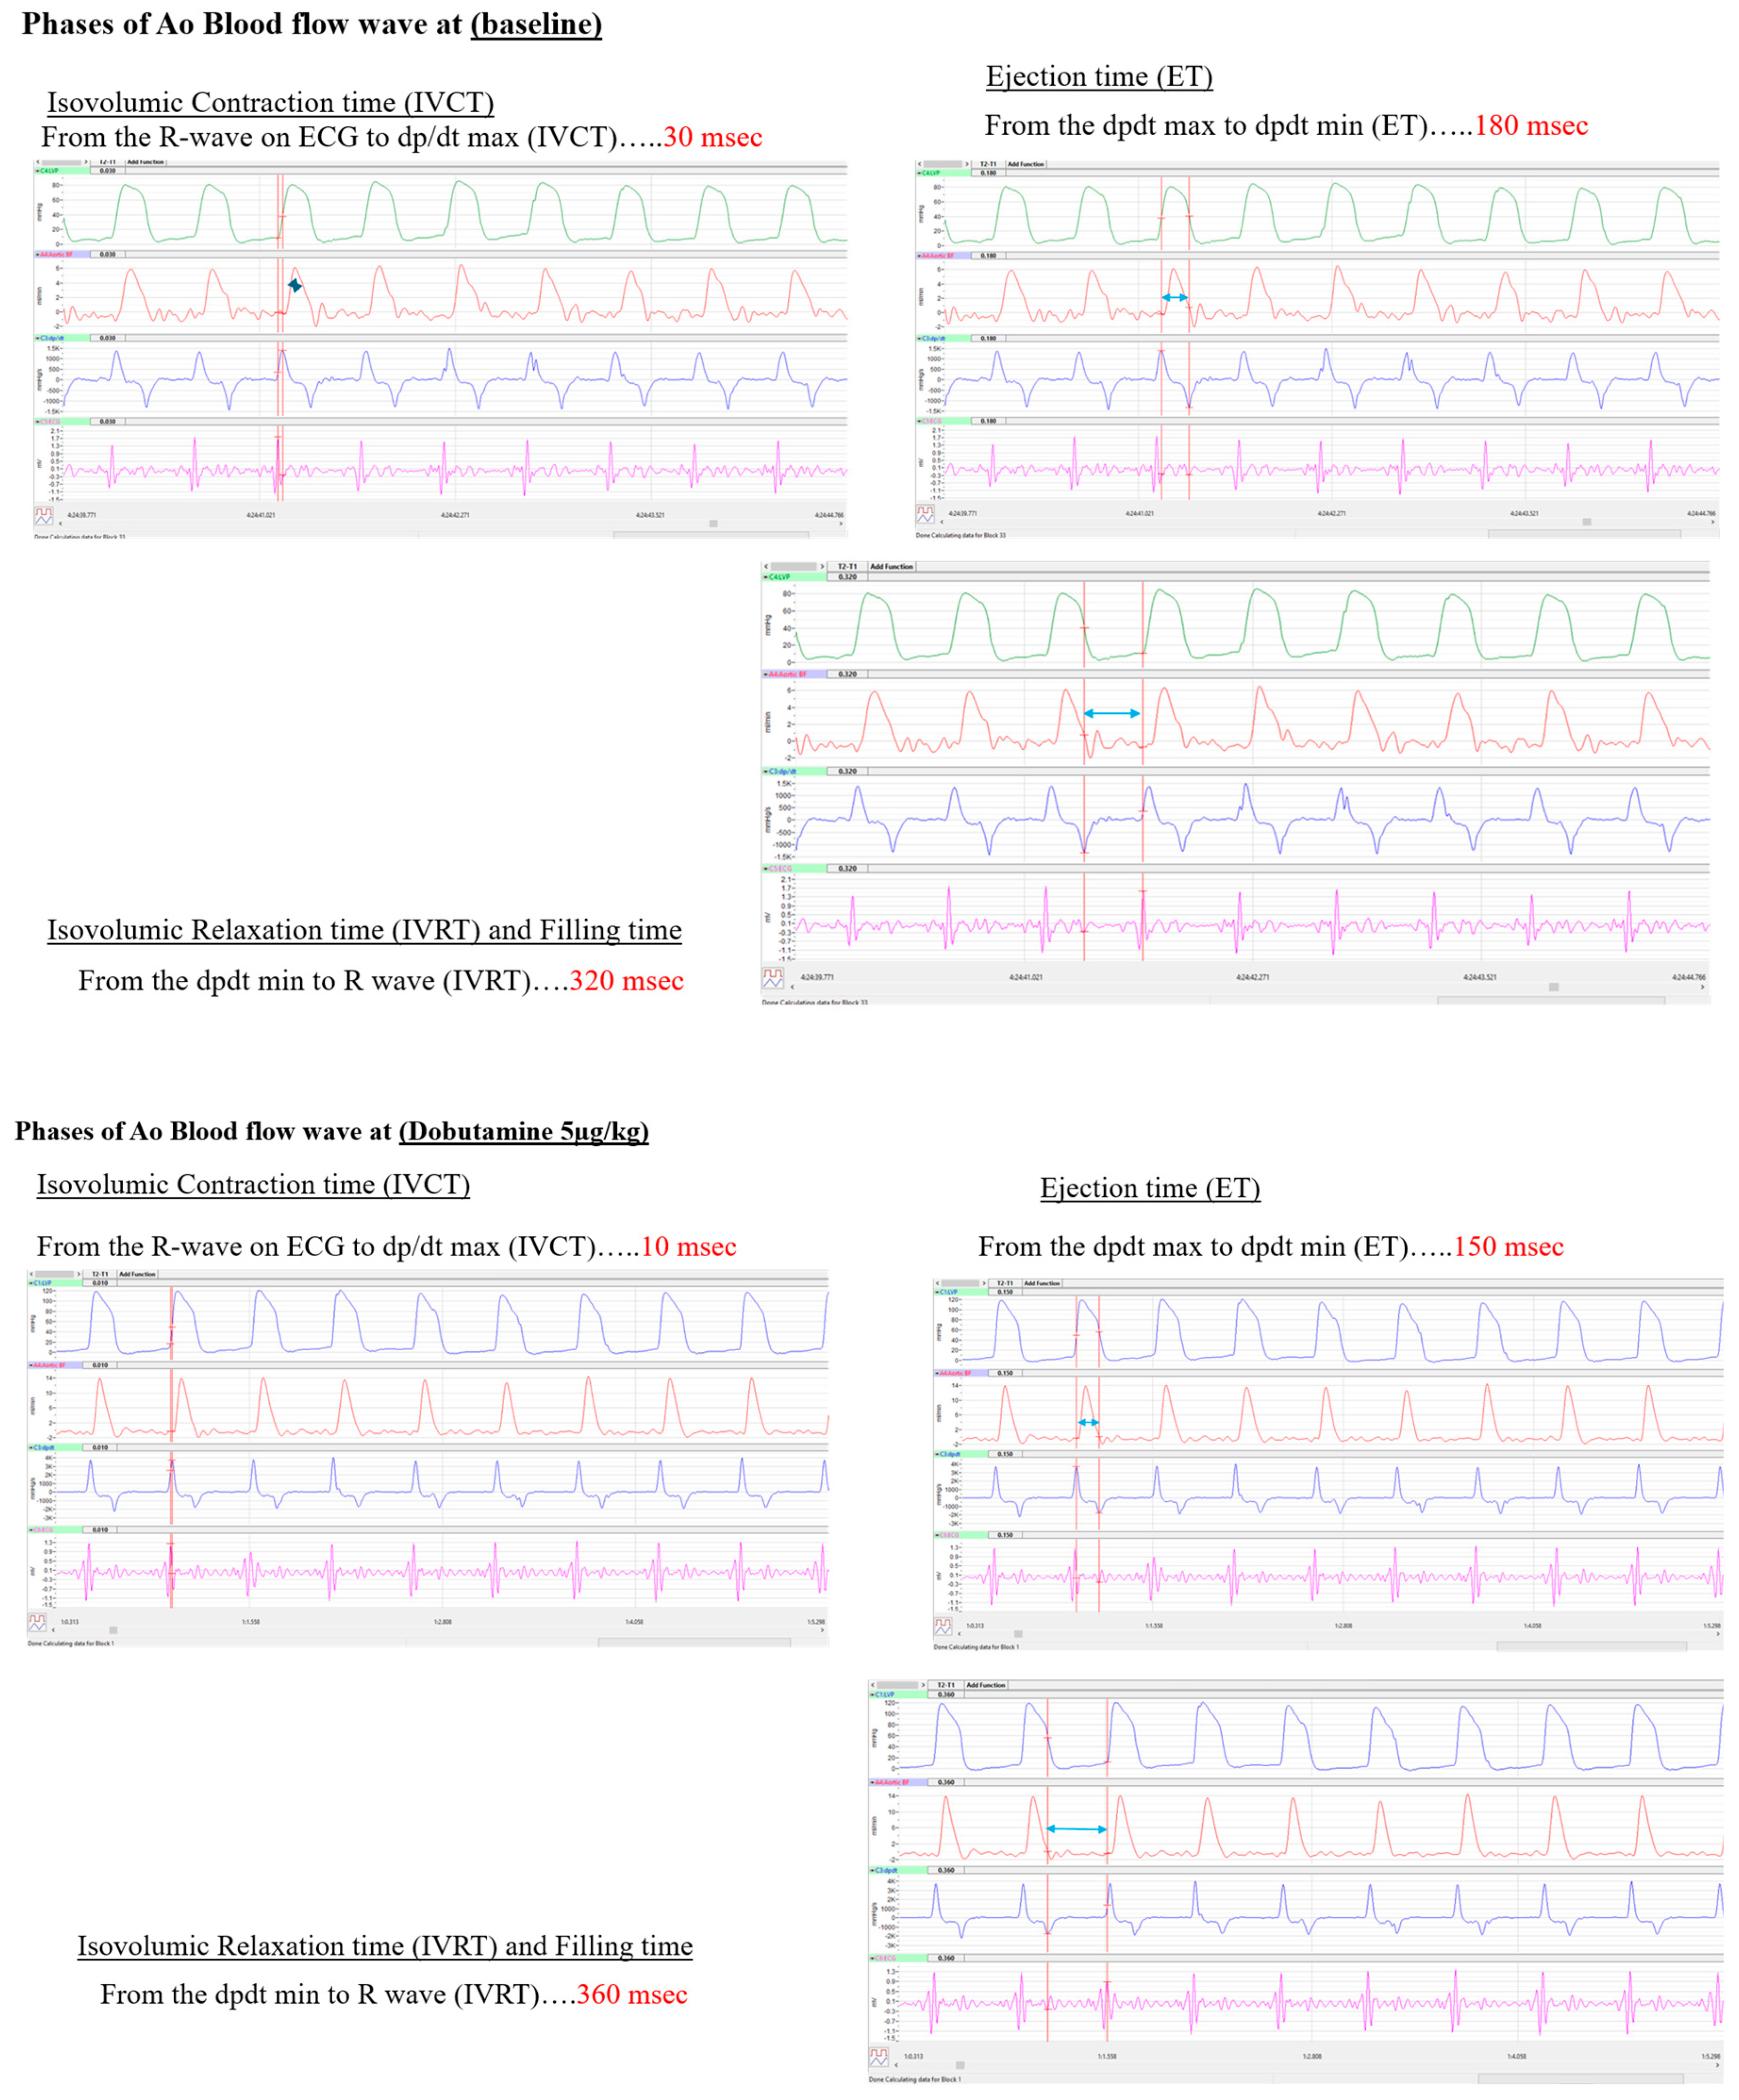
Dobutamine Modifies Cardiac Cycle Timing: PF-loop analysis also detected significant alterations in cardiac cycle timing. Isovolumic contraction time (IVCT) decreased from 32 ± 2.4 ms to 11 ± 2.1 ms (p = 1.15 × 10⁻¹³), while ejection time (ET) was shortened from 187 ± 8.2 ms to 154 ± 7.5 ms (p = 2.03 × 10⁻⁸). Conversely, isovolumic relaxation plus filling time (IVRT + filling) increased from 317 ± 6.7 ms to 361 ± 6.1 ms (p = 1.13 × 10⁻¹¹). These observations demonstrate accelerated systolic activation and ejection kinetics during Dobutamine stress while preserving a substantial diastolic filling period despite the higher HR.
Simultaneous recordings of left ventricular pressure (LVP), aortic pressure, aortic blood flow, and the first derivative of left ventricular pressure (dP/dt) were acquired at 200 samples/s during baseline conditions. The onset of ventricular ejection was defined by dP/dt_max, while the end of ejection was identified by dP/dt_min and confirmed by the aortic pressure notch. A single cardiac cycle was reconstructed by plotting instantaneous aortic blood flow against corresponding left ventricular pressure to generate a pressure–flow (PF) loop. The ejection phase of the PF loop is highlighted, illustrating the dynamic relationship between ventricular pressure generation and forward flow during systole. Mean flow acceleration (dV/dt) and cardiac timing intervals were subsequently derived from the identified ejection.
Determination of cardiac cycle intervals from simultaneously acquired left ventricular pressure and aortic blood flow signals during baseline conditions and Dobutamine infusion (5 µg·kg−1·min−1). Isovolumic contraction time (IVCT) was measured from the electrocardiographic R-wave to dP/dt_max, ejection time (ET) from dP/dt_max to dP/dt_min, and isovolumic relaxation plus filling time (IVRT + filling) from dP/dt_min to the subsequent R-wave. Dobutamine significantly shortened IVCT (32 ± 2 ms vs. 11 ± 2 ms) and ET (187 ± 8 ms vs. 154 ± 8 ms) while increasing IVRT + filling time (317 ± 7 ms vs. 361 ± 6 ms). These alterations demonstrate faster ventricular activation and ejection kinetics during inotropic stimulation and provide a mechanistic explanation for the observed changes in PF loop morphology.

Table 1A.
The approximate LV VHET values are based on calculation from the PF loop using trapezoidal integration across the LV cardiac cycle.
Table 1A.
The approximate LV VHET values are based on calculation from the PF loop using trapezoidal integration across the LV cardiac cycle.
| Displayed LV PF loop data | LV estimate |
| Integrated P × Q | 189.4 mmHg·L/min·s |
| Integrated hydraulic energy per beat | 0.421 J/beat |
| Mean hydraulic power during ejection | 2.25 W |
| Normalized VHET | 12.50 L/min |
| Mean ejection pressure | 81.0 mmHg |
| Mean ejection flow | 10.87 L/min |
| Estimated ejected volume during analyzed ejection | 33.9 mL |
| PF-loop landmark area | 435.6 mmHg·L/min |
Table 1B.
The approximate RV VHET values are based on calculation from the PF loop using trapezoidal integration across the RV cardiac cycle.
Table 1B.
The approximate RV VHET values are based on calculation from the PF loop using trapezoidal integration across the RV cardiac cycle.
| Displayed RV PF loop data | RV estimate |
| Integrated P × Q | 31.43 mmHg·L/min·s |
| Integrated hydraulic energy per beat | 0.0698 J/beat |
| Mean hydraulic power during ejection | 0.373 W |
| Normalized VHET | 9.95 L/min |
| Mean ejection pressure | 16.90 mmHg |
| Mean ejection flow | 8.27 L/min |
| Estimated ejected volume during analyzed ejection | 25.8 mL |
| PF-loop landmark area | 38.6 mmHg·L/min |
Cardiac cycle landmark-based integration of the baseline PF loops demonstrated that the LV transferred approximately 0.421 J/beat of forward hydraulic energy during ejection, corresponding to a mean ejection hydraulic power of 2.25 W. In contrast, the RV transferred approximately 0.070 J/beat, corresponding to 0.37 W. Despite the much lower RV pressure, normalized VHET was relatively preserved, measuring 9.95 L/min in the RV compared with 12.50 L/min in the LV, consistent with efficient low-pressure pulmonary flow transfer.
Table 2.
LV Hemodynamic and Pressure-Flow (PF) Loop Metrics during baseline and Dobutamine challenge.
Table 2.
LV Hemodynamic and Pressure-Flow (PF) Loop Metrics during baseline and Dobutamine challenge.
 |
4. Discussion
The present study introduces a novel pressure-flow (PF) loop framework for evaluating ventricular hydraulic energy transfer by integrating simultaneously acquired left ventricular pressure (LVP) and aortic blood flow measurements (Figure 1). Unlike conventional hemodynamic indices that assess pressure generation or blood flow independently, PF-loop analysis characterizes the temporal interaction between these two variables throughout systole and therefore provides a direct assessment of ventricular-to-arterial hydraulic coupling [16]. Baseline biventricular PF-loop analysis demonstrated distinct hydraulic transfer patterns between the systemic and pulmonary ventricles. The LV generated substantially greater integrated hydraulic energy than the RV, primarily because of its higher systolic pressure. However, normalized VHET was less divergent than absolute energy transfer, indicating that the RV achieved substantial forward flow despite operating at markedly lower pressure (Figure 2 and Table 1A and 1B). This finding supports the physiological concept that the RV functions as a low-pressure, flow-efficient hydraulic pump, whereas the LV operates as a higher-pressure energy-transfer system coupled to the systemic arterial tree.
Moreover, the principal findings demonstrate that Dobutamine-induced increases in contractility substantially altered PF-loop morphology (Figure 2B), increased flow acceleration, shortened systolic timing intervals, and enhanced pressure-to-flow conversion during ventricular ejection as previously suggested [17,18]. Collectively, these observations support the concept that PF loops provide physiological information beyond that obtainable from traditional pressure-or flow-based measurements alone.
One of the most important observations of the present study is that maximal forward aortic blood flow was not temporally synchronized with maximal ventricular pressure generation [10,19,20,21]. PF-loop trajectories demonstrated that substantial ventricular pressure development occurred before the peak aortic blood flow was achieved, and that a large portion of forward flow occurred during the declining phase of the LVP waveform (Figure 3). This finding highlights a temporal dissociation between pressure generation and flow delivery and suggests that ventricular hydraulic energy is not transferred instantaneously into forward blood flow. Instead, a portion of the generated hydraulic energy appears to be temporarily stored within the compliant proximal aorta and subsequently released during systolic ejection, consistent with the classical Windkessel model of arterial function. PF-loop analysis provides a unique visualization of this phenomenon by directly linking ventricular pressure development with the resulting flow response. Dobutamine administration produced marked alterations in PF-loop configuration. Mean flow acceleration (dV/dt) increased by approximately 38%, while dP/dt_max increased nearly threefold (Table 1), indicating substantially enhanced ventricular contractile performance. At the same time, PF loops demonstrated enlargement and steepening, suggesting more rapid transfer of hydraulic energy from the ventricle into the systemic circulation (Figure 2). Although conventional measurements such as HR, CO, and dP/dt clearly identified increased inotropic state, PF-loop analysis additionally illustrated how these physiological changes modified the relationship between pressure generation and forward flow throughout ejection. These findings support the sensitivity of PF loops to dynamic changes in ventricular performance and demonstrate their potential utility as a functional marker of ventricular hydraulic efficiency. A second notable finding was the effect of Dobutamine on cardiac cycle timing. Dobutamine significantly shortened isovolumic contraction time (IVCT) and ejection time (ET) while preserving an adequate diastolic filling interval despite a substantial increase in heart rate (Figure 2). These changes are consistent with accelerated myocardial contraction and relaxation associated with β-adrenergic stimulation [22]. Importantly, PF-loop analysis allowed these temporal adaptations to be interpreted within the context of hydraulic energy transfer rather than solely as electrophysiological or contractility-related phenomena. The shortening of IVCT suggests a more rapid conversion of ventricular pressure generation into effective forward flow, while the shorter ET indicates that hydraulic energy transfer can be accomplished more efficiently during enhanced contractile states. From a physiological perspective, the current findings support the concept that ventricular performance should be viewed not only as the ability to generate pressure but also as the ability to transfer hydraulic energy efficiently across the semilunar valve into the arterial circulation. Existing hemodynamic indices such as EF, SV, CO, and ventricular dP/dt describe important aspects of cardiac function but do not directly characterize the coupling between pressure generation and blood flow production. PF loops overcome this limitation by simultaneously evaluating both variables and therefore may provide a more comprehensive representation of ventricular-vascular interaction and hydraulic energy transmission. The present study should be interpreted within several limitations. Data were obtained from a single large-animal preparation and analyzed using repeated cardiac cycles under baseline and Dobutamine conditions. Consequently, the statistical comparisons primarily reflect within-subject physiological responses rather than population-level inference. In addition, PF-loop analysis was evaluated only under normal physiological conditions and β-adrenergic stimulation. Future studies are therefore needed to determine how PF-loop morphology is altered in pathological states such as ventricular hypertrophy, heart failure, pulmonary hypertension, aortic stenosis, and valvular regurgitation.
The long-term significance of this work lies in the development of a quantitative framework for Valve Hydraulic Energy Transfer (VHET). Future investigations may incorporate loop area analysis, hydraulic power calculations, and forward-versus-reverse flow components to establish objective indices of transvalvular energy transmission and hydraulic efficiency. Such metrics may ultimately provide clinically useful biomarkers for assessment of native valve function, prosthetic valve performance, surgical valve repair, transcatheter aortic valve replacement (TAVR), and ventricular-vascular coupling in cardiovascular disease [23].
This proof-of-concept study demonstrates that synchronized ventricular pressure and arterial flow recordings can be integrated to quantify ventricular hydraulic energy transfer [15]. Cardiac cycle landmark-based analysis showed that LV ejection generated higher absolute hydraulic energy than RV ejection, whereas normalized VHET revealed relatively preserved pressure-weighted flow transfer in the RV despite lower operating pressure. Dobutamine stress altered pressure-flow kinetics, increasing flow acceleration and shortening ejection time, supporting the sensitivity of PF-loop analysis to physiological changes in contractile state. These findings establish VHET as a quantitative methodological framework for pressure-flow analysis. Further studies using raw waveform integration across larger cohorts and disease models are required before VHET can be validated as a biomarker of ventricular, vascular, or valvular function.
Funding
This work received no external funding.
Data Availability Statement
On request.
Acknowledgments
The author acknowledges the investigators whose foundational work has shaped the current understanding of PF loop to characterize cardiopulmonary hemodynamics. AI-assisted language editing was used during manuscript preparation. The author reviewed, edited, and verified all scientific content and takes full responsibility for the final manuscript.
Conflicts of Interest
The author declares no conflicts of interest.
References
- Suga, H.; Sagawa, K. Instantaneous pressure-volume relationships and their ratio in the excised, supported canine left ventricle. Circ. Res. 1974, 35(1), 117–126. [Google Scholar] [CrossRef] [PubMed]
- Sagawa, K. The ventricular pressure-volume diagram revisited. Circ. Res. 1978, 43(5), 677–687. [Google Scholar] [CrossRef] [PubMed]
- Suga, H. Total mechanical energy of a ventricle model and cardiac oxygen consumption. Am. J. Physiol. 1979, 236(3), H498–H505. [Google Scholar] [CrossRef] [PubMed]
- Burkhoff, D.; Mirsky, I.; Suga, H. Assessment of systolic and diastolic ventricular properties via pressure-volume analysis: a guide for clinical, translational, and basic researchers. Am. J. Physiol. Heart Circ. Physiol. 2005, 289(2), H501–H512. [Google Scholar] [CrossRef] [PubMed]
- Kass, D.A.; Maughan, W.L. From “Emax” to pressure-volume relations: a broader view. Circulation 1988, 77(6), 1203–1212. [Google Scholar] [CrossRef] [PubMed]
- Mynard, J.P.; Kondiboyina, A.; Kowalski, R.; Cheung, M.M.H.; Smolich, J.J. Measurement, analysis and interpretation of pressure/flow waves in blood vessels. Front Physiol. 2020, 11, 1085. [Google Scholar] [CrossRef] [PubMed]
- Elzinga, G.; Westerhof, N. Pressure and flow generated by the left ventricle against different impedances. Circ. Res. 1973, 32(2), 178–186. [Google Scholar] [CrossRef] [PubMed]
- Sunagawa, K.; Maughan, W.L.; Burkhoff, D.; Sagawa, K. Left ventricular interaction with arterial load studied in isolated canine ventricle. Am. J. Physiol. 1983, 245 5 Pt 1, H773–H780. [Google Scholar] [CrossRef] [PubMed]
- Milnor, W.R. Hemodynamics, 2nd ed.; Williams & Wilkins: Baltimore, 1989. [Google Scholar]
- Nichols, W.W.; O’Rourke, M.F. McDonald’s Blood Flow in Arteries: Theoretical, Experimental and Clinical Principles, 6th ed.; Hodder Arnold: London, 2011. [Google Scholar]
- Protti, I.; van den Enden, A.; Van Mieghem, N.M.; Meuwese, C.L.; Meani, P. Looking back, going forward: understanding cardiac pathophysiology from pressure-volume loops. Biology 2024, 13(1), 55. [Google Scholar] [CrossRef] [PubMed]
- Robie, N.W.; Goldberg, L.I. Comparative systemic and regional hemodynamic effects of dopamine and dobutamine. Am. Heart J. 1975, 90(3), 340–345. [Google Scholar] [CrossRef] [PubMed]
- Ruffolo, R.R., Jr. The pharmacology of dobutamine. Am. J. Med. Sci. 1987, 294(4), 244–248. [Google Scholar] [CrossRef] [PubMed]
- Riva, A.; Eriksson, J.; Viola, F.; Sturla, F.; Votta, E.; Ebbers, T.; et al. Impact of dobutamine stress on diastolic energetic efficiency of healthy left ventricle: an in vivo kinetic energy analysis. Front Cardiovasc Med. 2023, 10, 1103751. [Google Scholar] [CrossRef] [PubMed]
- Ridderbos, F.J.S.; Hoendermis, E.S.; van Hassel, G.; Ebels, T.; van Melle, J.P.; Berger, R.M.F. Hemodynamic profiling of patients with a Fontan circulation using pulmonary pressure/flow relations during dobutamine stress and pulmonary vasodilation testing. Am. J. Physiol. Heart Circ. Physiol. 2025, 329(2), H366–H373. [Google Scholar] [CrossRef] [PubMed]
- Monge García, M.I.; Santos, A. Understanding ventriculo-arterial coupling. Ann. Transl. Med. 2020, 8(12), 795. [Google Scholar] [CrossRef] [PubMed]
- Chantler, P.D.; Lakatta, E.G.; Najjar, S.S. Arterial-ventricular coupling: mechanistic insights into cardiovascular performance at rest and during exercise. J. Appl. Physiol. 2008, 105(4), 1342–1351. [Google Scholar] [CrossRef] [PubMed]
- Kass, D.A. Ventricular arterial stiffening: integrating the pathophysiology. Hypertension 2005, 46(1), 185–193. [Google Scholar] [CrossRef] [PubMed]
- Westerhof, N.; Lankhaar, J.W.; Westerhof, B.E. The arterial Windkessel. Med. Biol. Eng. Comput. 2009, 47(2), 131–141. [Google Scholar] [CrossRef] [PubMed]
- Parker, K.H. A brief history of arterial wave mechanics. Med. Biol. Eng. Comput. 2009, 47(2), 111–118. [Google Scholar] [CrossRef] [PubMed]
- Westerhof, N.; Sipkema, P.; van den Bos, G.C.; Elzinga, G. Forward and backward waves in the arterial system. Cardiovasc Res. 1972, 6(6), 648–656. [Google Scholar] [CrossRef] [PubMed]
- Gleason, W.L.; Braunwald, E. Studies on the first derivative of the ventricular pressure pulse in man. J. Clin. Invest. 1962, 41(1), 80–91. [Google Scholar] [CrossRef] [PubMed]
- Sarraf, M.; Chehab, O.; Nagaraja, V. Understanding the pressure-volume loop in valvular heart disease. Heart Lung Circ. 2026, 35(1), 31–44. [Google Scholar] [CrossRef] [PubMed]
Figure 1.
Construction of the Pressure–Flow (PF) Loop from Simultaneous Left Ventricular Pressure and Aortic Blood Flow Measurements.
Figure 1.
Construction of the Pressure–Flow (PF) Loop from Simultaneous Left Ventricular Pressure and Aortic Blood Flow Measurements.
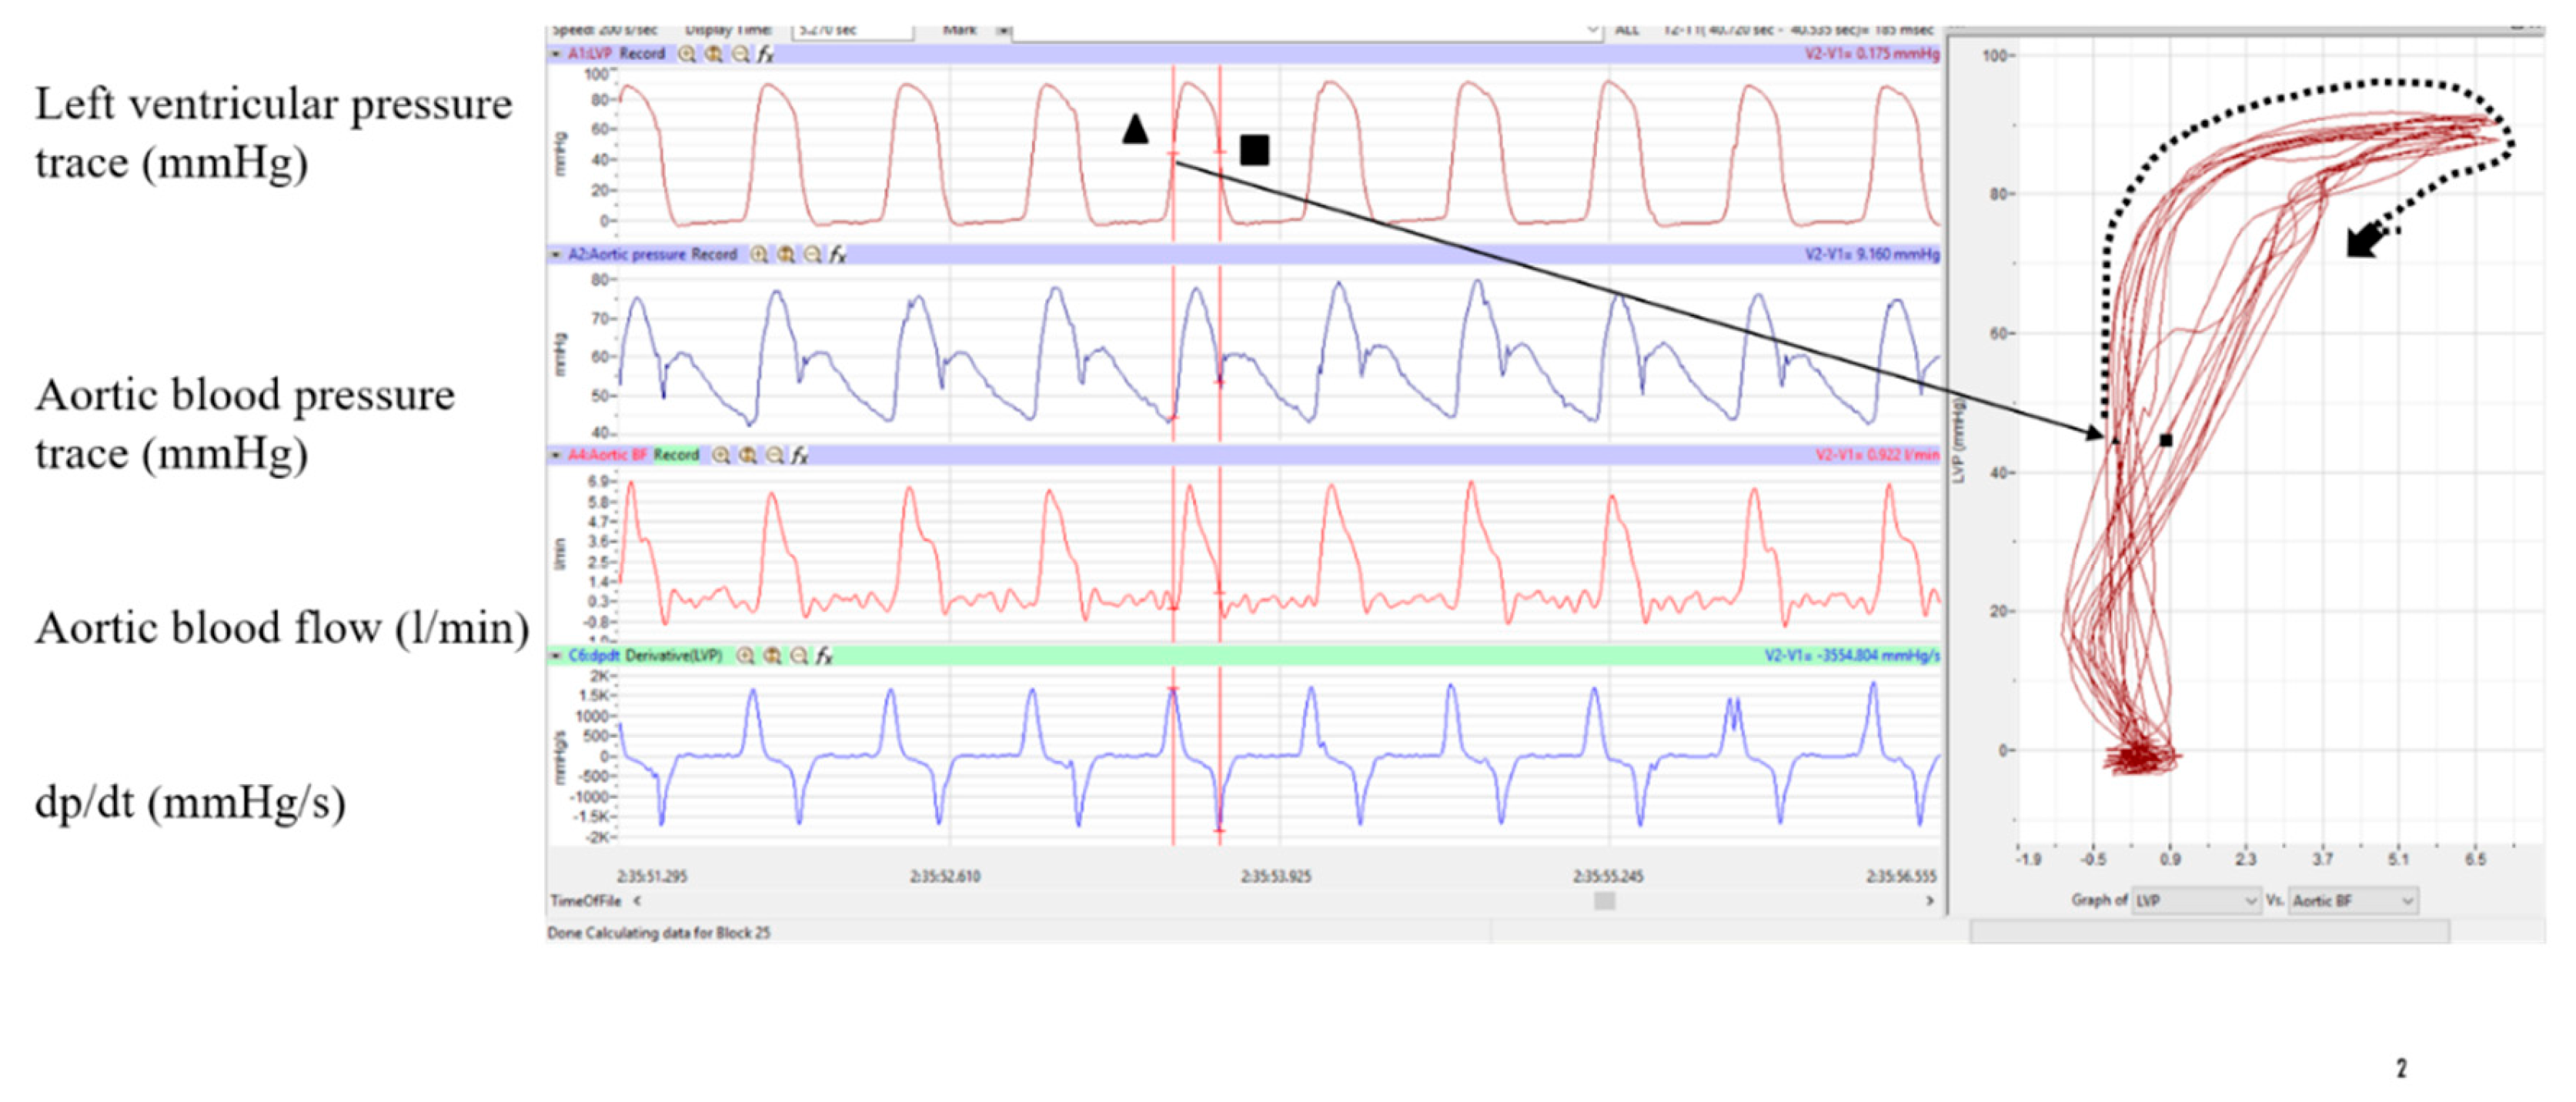
Figure 2.
(A) Graphical representation of LV and RV PF loops: After an initial pressure built up during an isovolumetric contraction (IVC) phase, this portion of the cycle ends (on the image as green dot), and the LVP further increases, while Ao blood flow does not catch up to the initial surge of LVP, however when LVP reaches its plateau (yellow dot at 97 mmHg), Ao blood flow massively increases from 6.649 ml/min, until closing of the Ao valve at 22.827 ml/min (grey dot). Arrows show loop progression. Isovolumetric relaxation phase starts from the red dot on the loop. In the RV driving pressure after opening of the PA valve provides maximally efficient blood flow through the PA as it accommodates most blood flow right after pressure built up during IVC phase (bold dash line). Loops compare low pressure BF, characteristic of the RV BF-pressure hemodynamic pattern. (B) Effect of Dobutamine on LV PF Loop Morphology and LV Ventricular Ejection Dynamics: Representative PF loops obtained during baseline conditions (red) and during Dobutamine infusion (blue) (5 µg·kg−1·min−1). Dobutamine challenge increased HR and ventricular contractility, resulting in a larger and steeper PF loop characterized by increased aortic flow for a given level of ventricular pressure. Analysis of ten consecutive cardiac cycles demonstrated a significant increase in mean flow acceleration (dV/dt) from 9.0 ± 2.1 to 12.4 ± 1.0 ml·min−1·s−1, accompanied by an increase in dP/dt_max from 1261 ± 78 to 3627 ± 83 mmHg·s−1. These changes indicate enhanced systolic performance and more rapid ventricular ejection during β-adrenergic stimulation. Dobutamine produced a rightward and upward expansion of the PF loop with increased flow generation.
Figure 2.
(A) Graphical representation of LV and RV PF loops: After an initial pressure built up during an isovolumetric contraction (IVC) phase, this portion of the cycle ends (on the image as green dot), and the LVP further increases, while Ao blood flow does not catch up to the initial surge of LVP, however when LVP reaches its plateau (yellow dot at 97 mmHg), Ao blood flow massively increases from 6.649 ml/min, until closing of the Ao valve at 22.827 ml/min (grey dot). Arrows show loop progression. Isovolumetric relaxation phase starts from the red dot on the loop. In the RV driving pressure after opening of the PA valve provides maximally efficient blood flow through the PA as it accommodates most blood flow right after pressure built up during IVC phase (bold dash line). Loops compare low pressure BF, characteristic of the RV BF-pressure hemodynamic pattern. (B) Effect of Dobutamine on LV PF Loop Morphology and LV Ventricular Ejection Dynamics: Representative PF loops obtained during baseline conditions (red) and during Dobutamine infusion (blue) (5 µg·kg−1·min−1). Dobutamine challenge increased HR and ventricular contractility, resulting in a larger and steeper PF loop characterized by increased aortic flow for a given level of ventricular pressure. Analysis of ten consecutive cardiac cycles demonstrated a significant increase in mean flow acceleration (dV/dt) from 9.0 ± 2.1 to 12.4 ± 1.0 ml·min−1·s−1, accompanied by an increase in dP/dt_max from 1261 ± 78 to 3627 ± 83 mmHg·s−1. These changes indicate enhanced systolic performance and more rapid ventricular ejection during β-adrenergic stimulation. Dobutamine produced a rightward and upward expansion of the PF loop with increased flow generation.
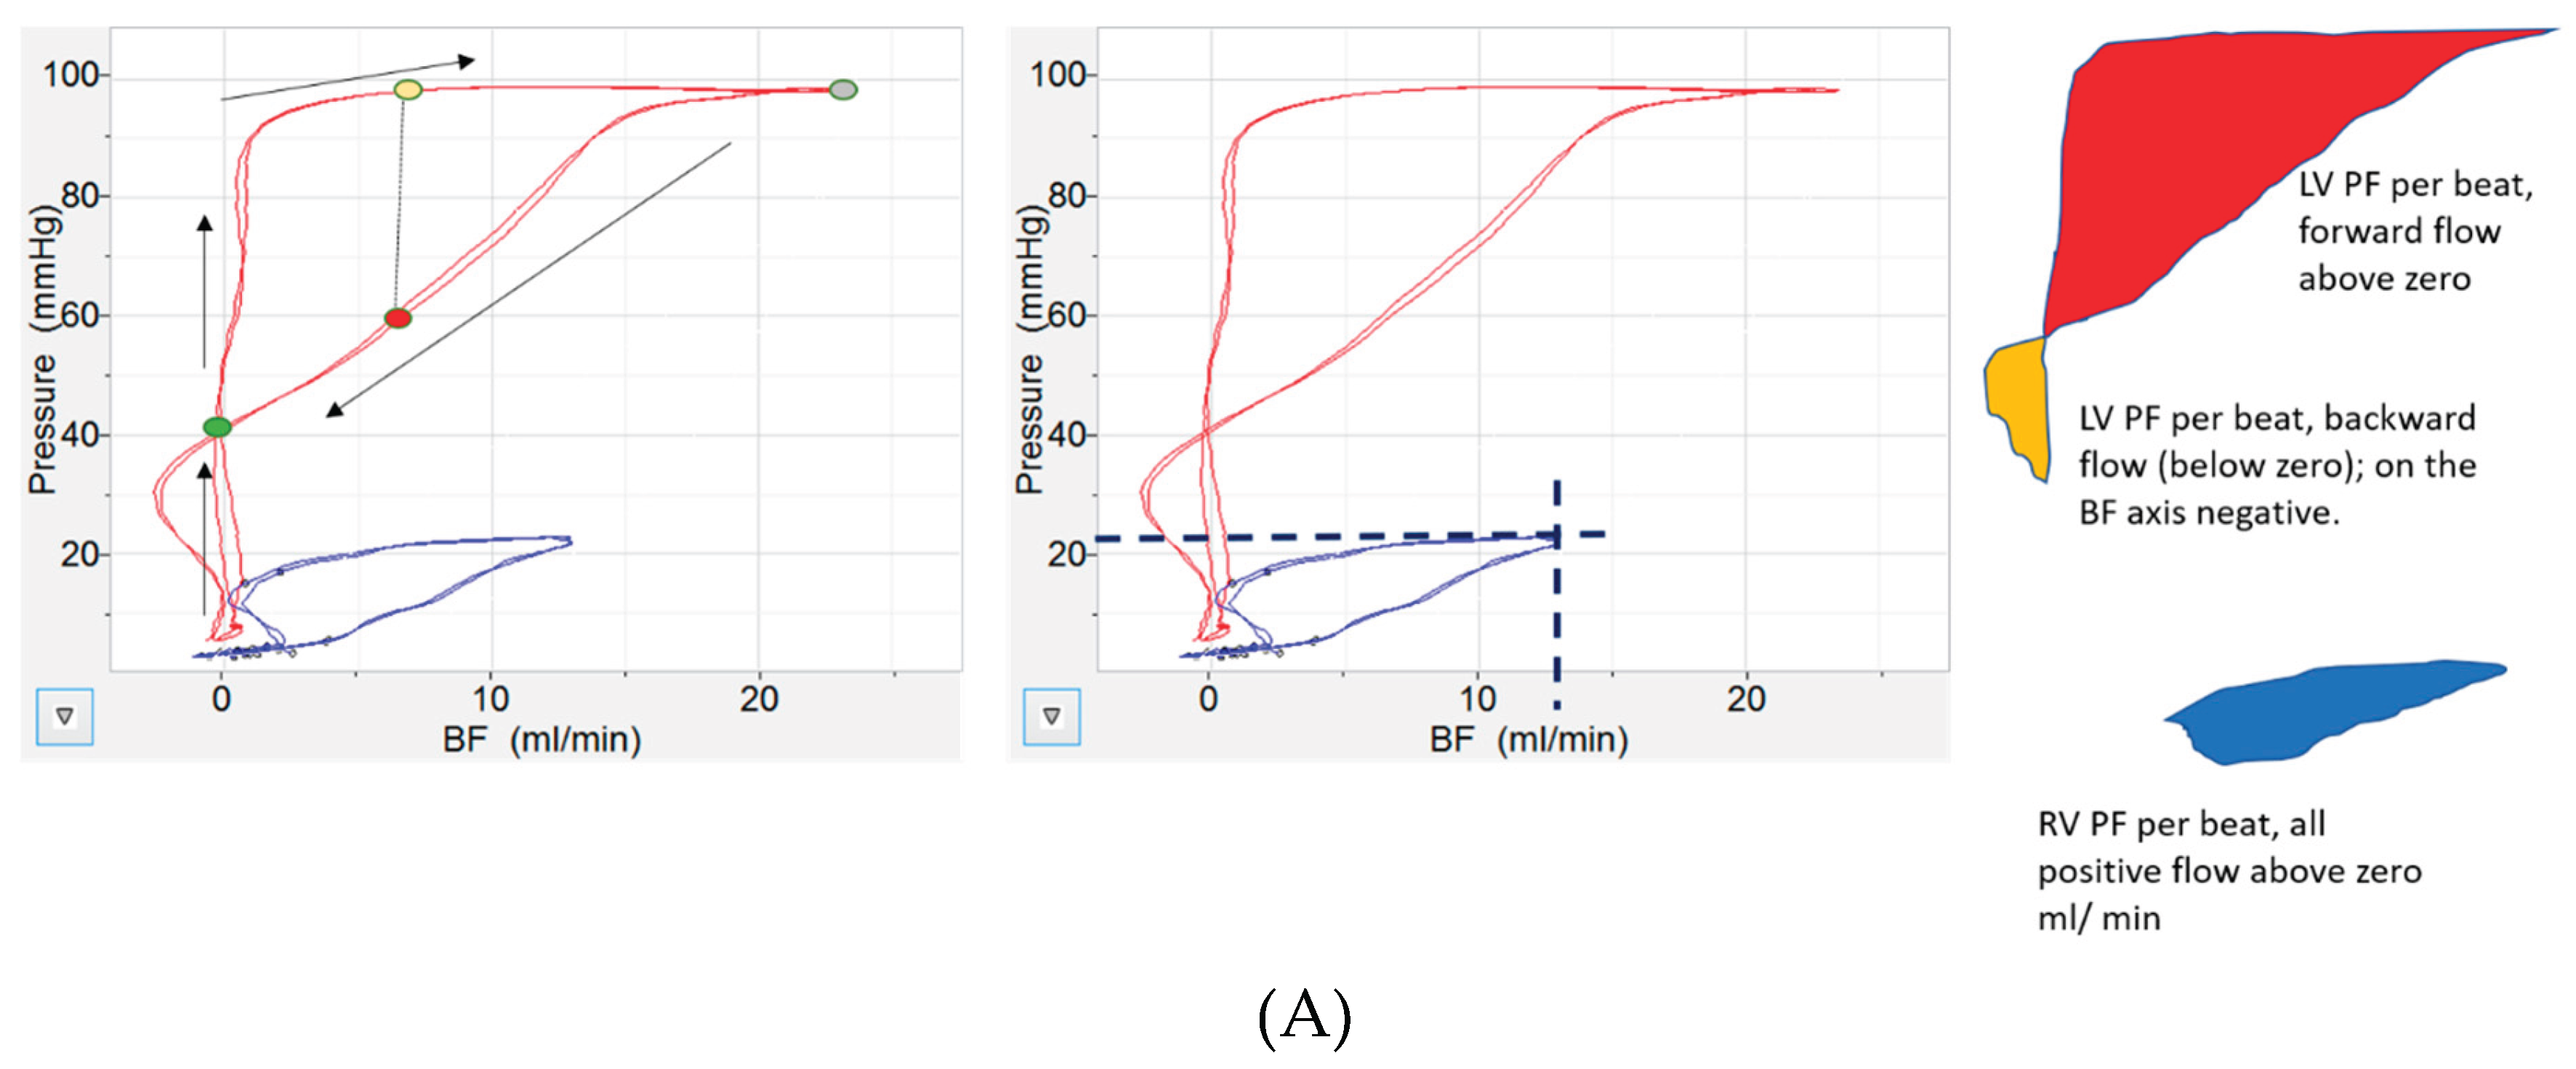
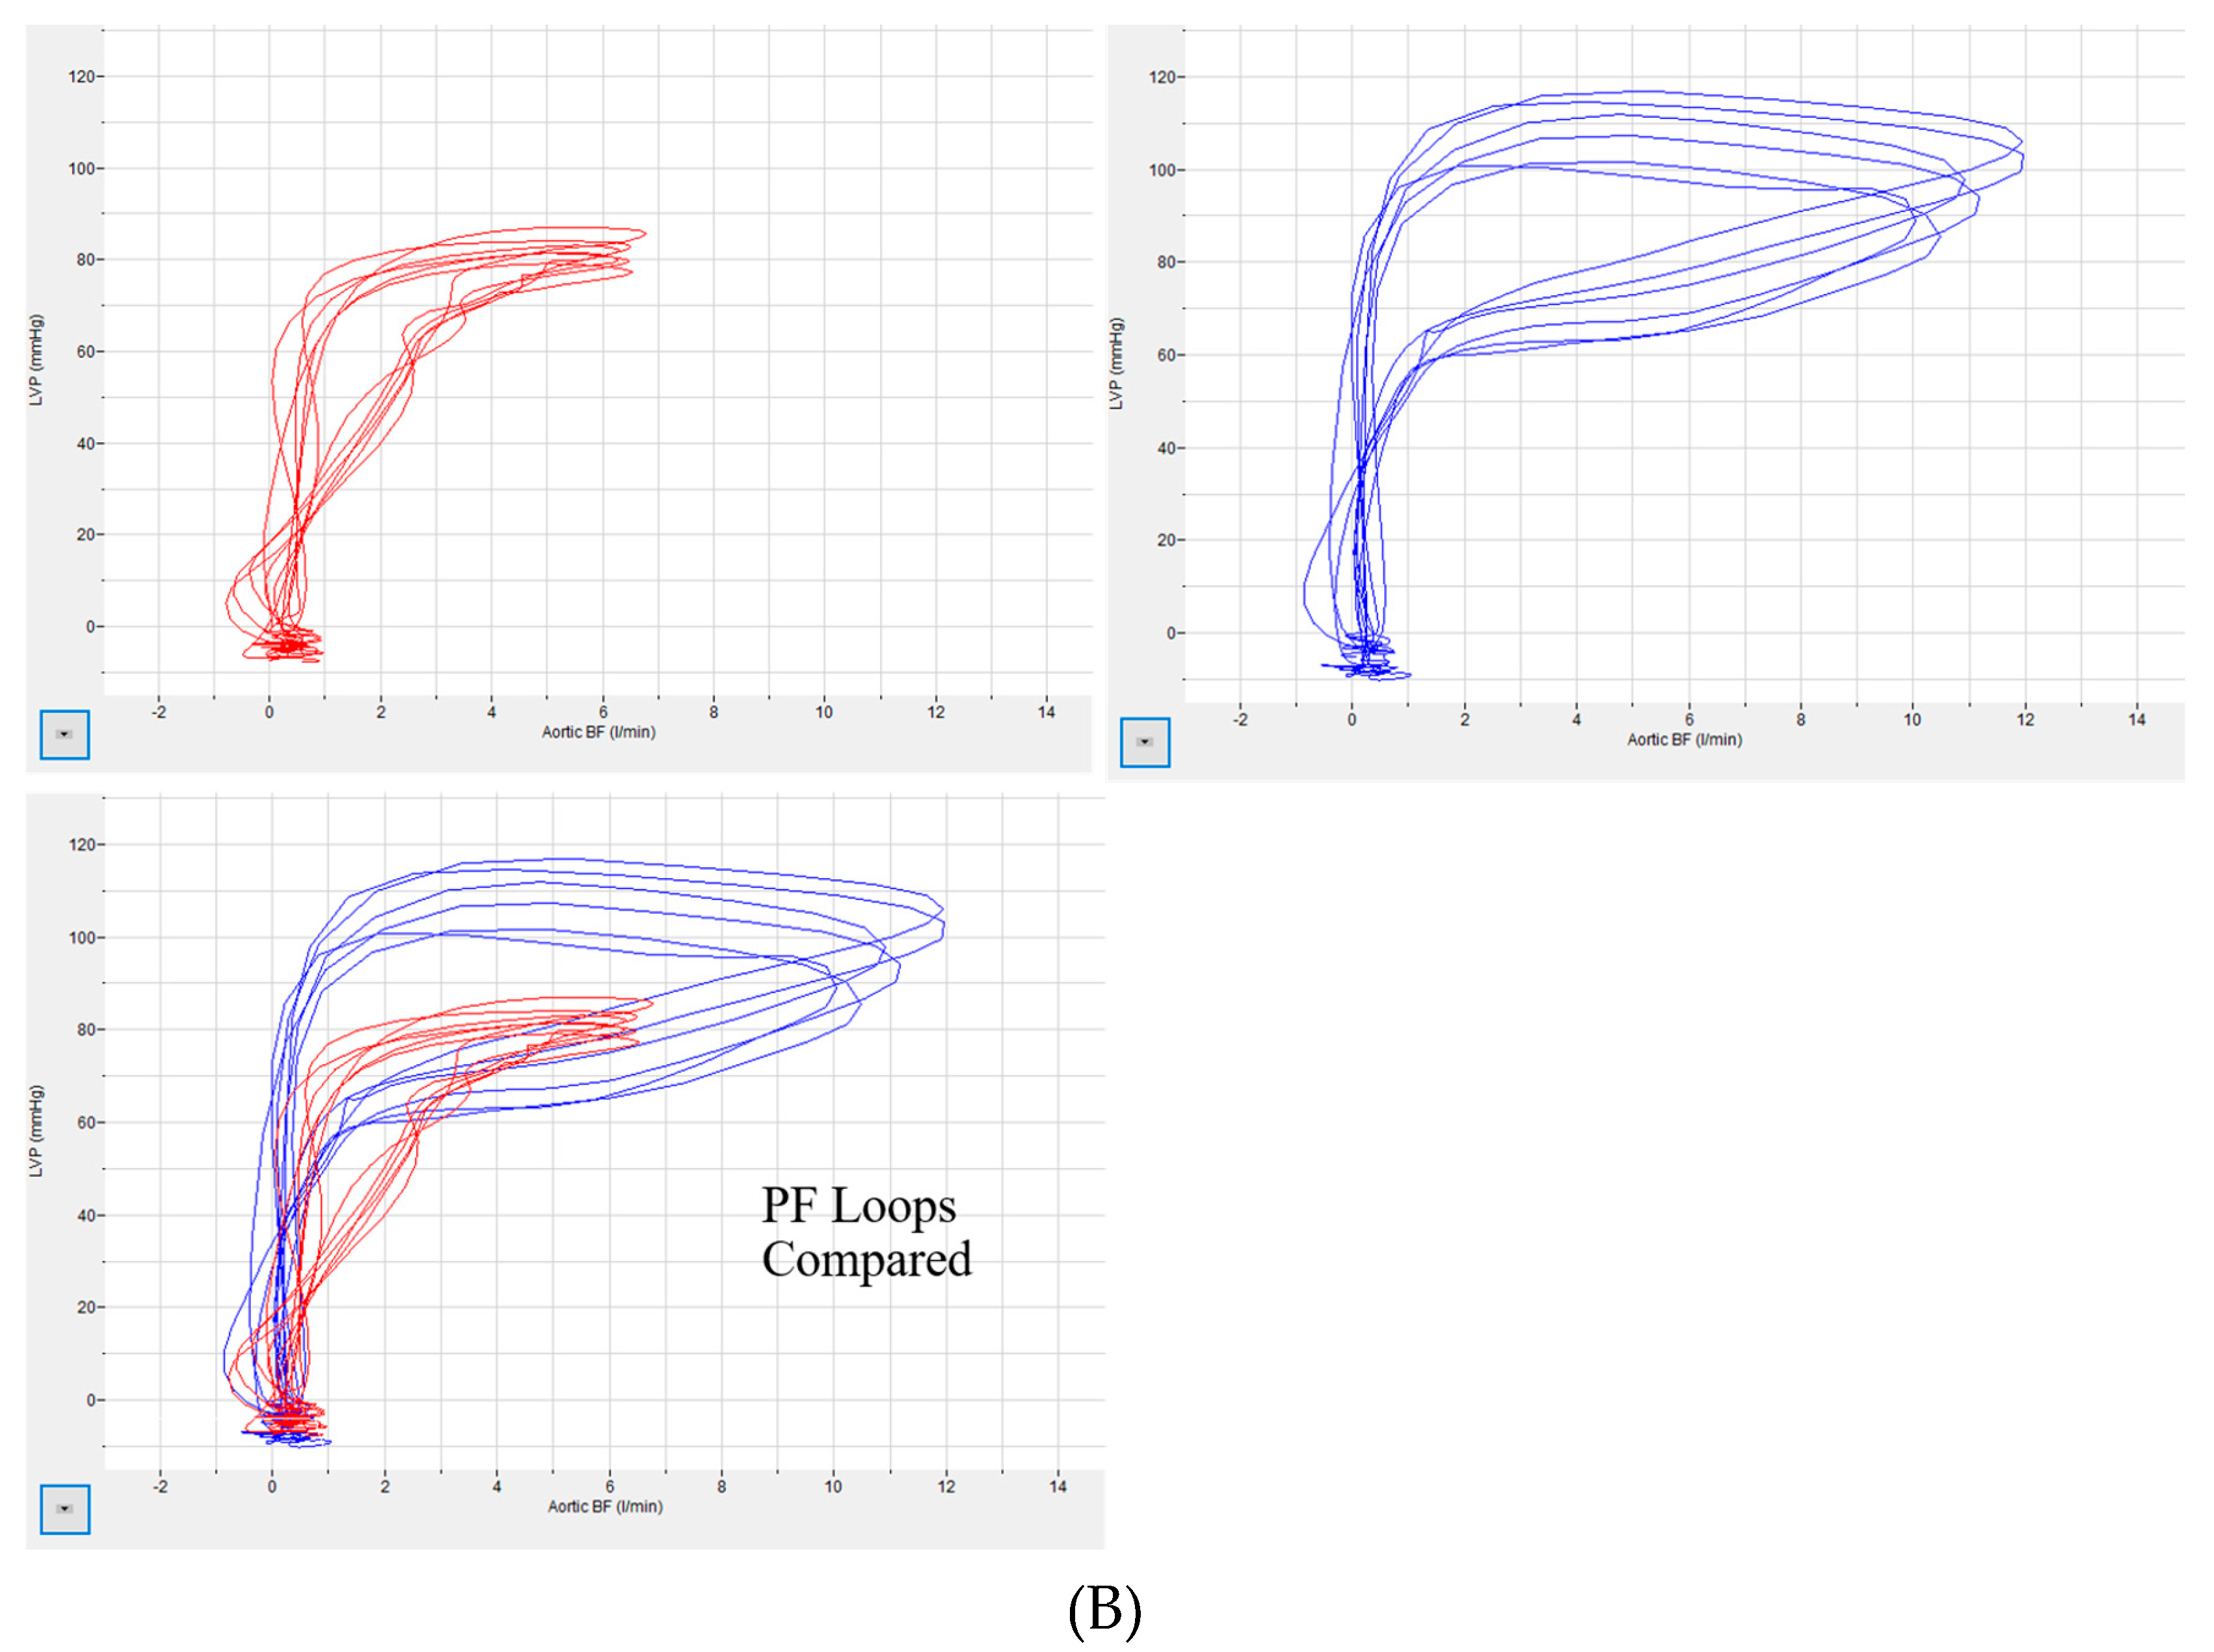
Figure 3.
Influence of Dobutamine on Cardiac Cycle Timing Derived from Pressure-Flow Analysis.
Disclaimer/Publisher’s Note: The statements, opinions and data contained in all publications are solely those of the individual author(s) and contributor(s) and not of MDPI and/or the editor(s). MDPI and/or the editor(s) disclaim responsibility for any injury to people or property resulting from any ideas, methods, instructions or products referred to in the content. |
© 2026 by the authors. Licensee MDPI, Basel, Switzerland. This article is an open access article distributed under the terms and conditions of the Creative Commons Attribution (CC BY) license (http://creativecommons.org/licenses/by/4.0/).
Copyright: This open access article is published under a Creative Commons CC BY 4.0 license, which permit the free download, distribution, and reuse, provided that the author and preprint are cited in any reuse.