
Submitted:
22 July 2026
Posted:
23 July 2026
You are already at the latest version
Abstract
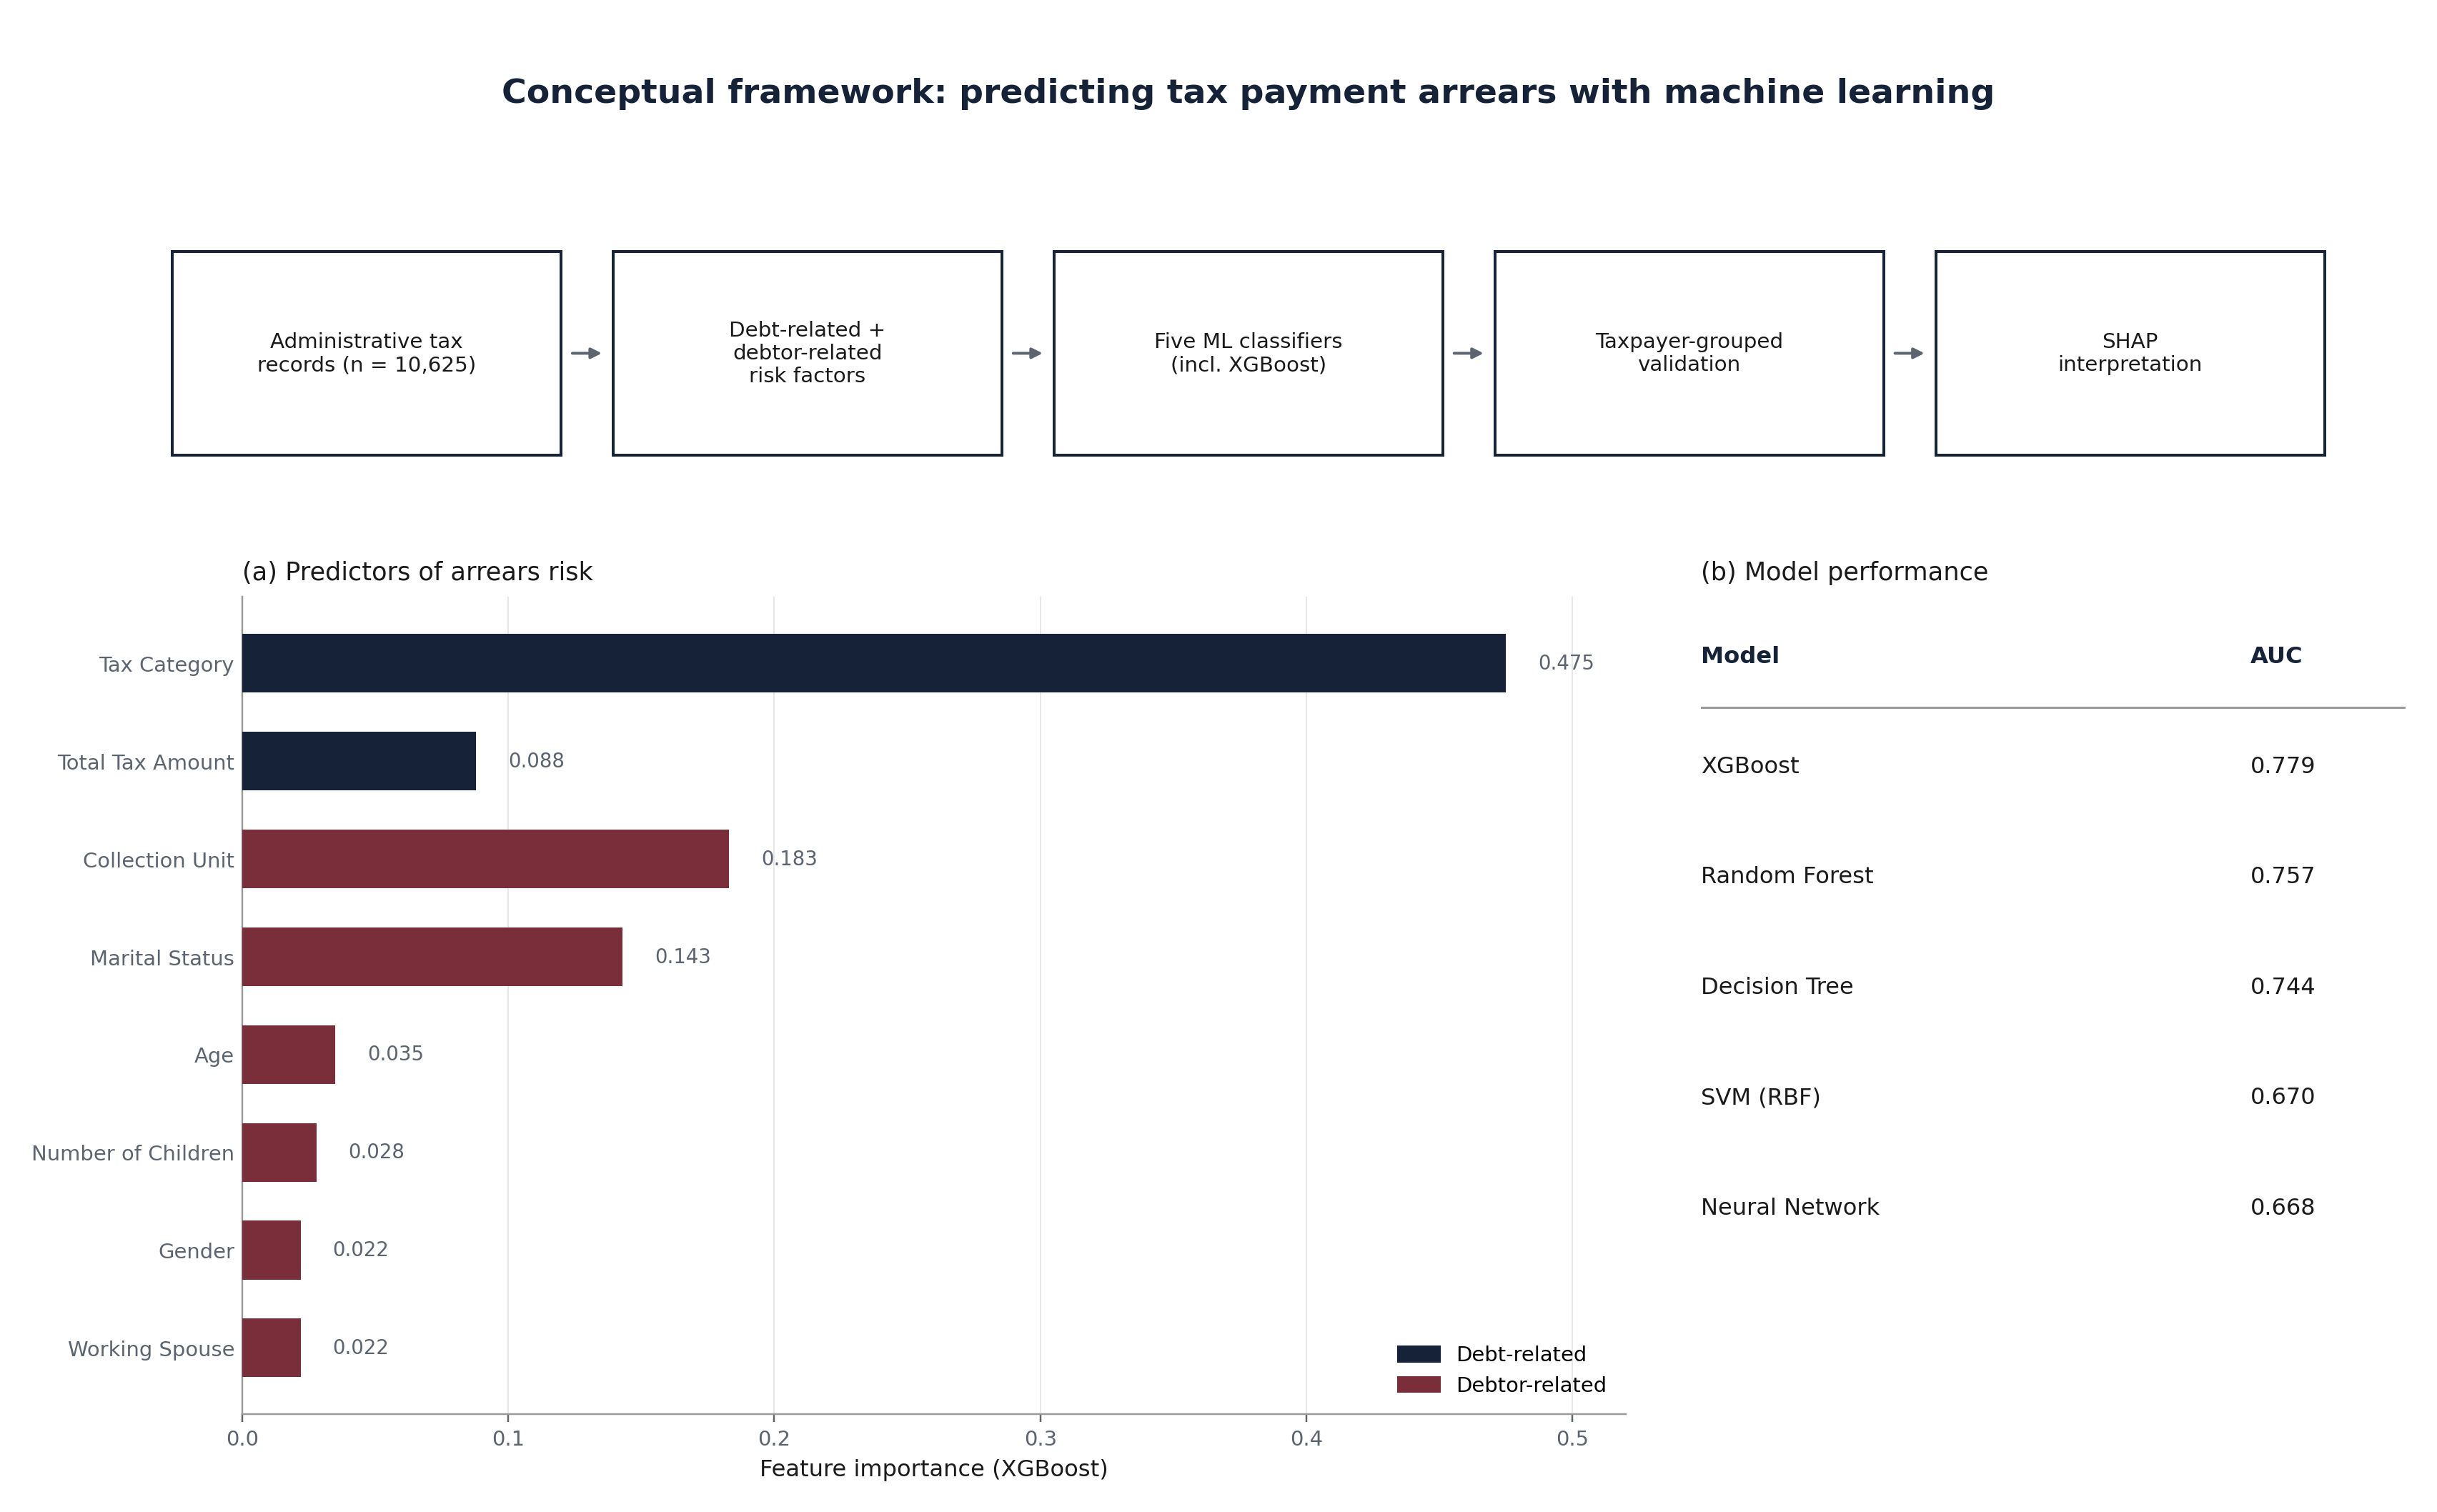
Tax administrations increasingly rely on data-driven risk models to prioritize enforcement and outreach resources, yet machine learning applications to personal income tax arrears remain scarce compared with corporate-tax and fraud-detection contexts. This study introduces TaxMind, a machine learning framework for predicting tax payment arrears, operationalized as escalation to mandatory (forced) collection, comparatively evaluating five classifiers and applying Shapley-value techniques to interpret the resulting model. A dataset of 16,010 administrative tax records was cleaned by removing 5,385 exact duplicate rows (33.6% of raw data), yielding 10,625 records across 9,264 taxpayers; a taxpayer-grouped train/test split prevented information leakage between related observations. Decision Tree, Random Forest, XGBoost, Support Vector Machine, and a Multi-Layer Perceptron were trained on eight demographic and fiscal attributes, with a signed-logarithm transformation correcting skew in the tax-amount field; interpretability was assessed using Shapley Additive Explanations (SHAP). XGBoost achieved the best discrimination (AUC = 0.779, accuracy = 70.2%, F1 = 0.699), outperforming the other models compared. SHAP identified tax amount, tax category, and taxpayer age, a socio-demographic attribute, as dominant predictors, diverging from gain-based rankings. These findings indicate that duplicate contamination and non-grouped validation can distort administrative model evaluations, and that debtor-related attributes carry under-exploited predictive value for tax segmentation.
Keywords:
risk-based segmentation
; tax arrears
; machine learning
; explainable artificial intelligence
; SHAP
; decision support systems
; personal income tax
; fiscal risk prediction
1. Introduction
Worldwide, tax non-compliance and tax evasion reduce governments’ fiscal capacity, taking away revenues needed for public investment (Zaim & Sahbani, 2026). From a risk-management standpoint, this represents a large and persistently under-managed exposure on the public balance sheet: unlike a lender’s loan book, a tax administration’s “portfolio” of taxpayer obligations is rarely stratified, scored, or actively monitored for default risk. Preventing this loss is the core objective of any tax administration, which must ensure the timely and accurate collection of tax revenues to fund public services (OECD, 2024). A persistent challenge, however, is delayed tax payment (OECD, 2014, 2016), which manifests as elevated arrears-to-revenue ratios across tax types and constitutes a significant, quantifiable fiscal risk exposure for revenue authorities (OECD, 2024). To manage this exposure, the OECD recommends risk-based segmentation: stratifying the taxpayer population into risk tiers according to their estimated probability of default, and directing enforcement and outreach resources in proportion to each tier’s exposure, together with early intervention that targets tax debts before they accumulate into losses (OECD, 2016). The urgency of this shift is reinforced by the progressive digitization of financial services in recent decades, which has substantially changed how economic transactions occur, increasing both their volume and velocity (Chambi Condori et al., 2026); a shift that is simultaneously expanding the data available for risk-based segmentation and raising the administrative capacity required to act on it, particularly in developing and emerging economies undergoing digital transformation.
In fact, the principle of tailoring intervention to the specific risk profile of the obligor is not unique to tax administration; it is a defining feature of sound risk management practice more broadly. Credit risk management, for instance, is critical in developing economies, where elevated default rates can threaten broader financial stability (Masekoameng, Mbona, Ananth, & Chifurira, 2026). Analogous risk-management imperatives apply to tax administration, where artificial intelligence has emerged as one of the most promising areas of application: tax authorities can now perform pattern recognition, predictive risk assessment, and real-time anomaly detection at unprecedented scales through machine learning algorithms, neural networks, and natural language processing systems (Zaim & Sahbani, 2026), narrowing the gap between how credit risk is managed in lending portfolios and how compliance risk is managed in tax portfolios.
Central to that convergence is a shared underlying principle: just as lenders assess the borrower’s risk profile rather than evaluating a loan in isolation, the OECD (2014) explicitly recommends that revenue bodies focus on the debtor, not only the debt. Rather than treating outstanding obligations uniformly, like sending the same reminder letter to every late payer regardless of whether experience shows that certain debtor segments simply disregard it, tax administrations should draw on the full range of available taxpayer information to target the right debtor with the right intervention at the right time, reducing the cost of ineffective interventions and improving revenue flow.
Operationalizing this recommendation, however, depends on validated, debtor-aware risk-scoring models, which is the tool that the academic literature has yet to supply. Despite promising applications of ML for risk-based taxpayer segmentation (OECD, 2016, 2024), the risk-modeling literature has not kept pace: systematic validation of default-risk models, feature engineering guidance, and rigorous system-design frameworks remain scarce, and few studies address ML-based tax arrears prediction as a risk-scoring problem in its own right. Existing work concentrates almost entirely on forecasting corporate tax arrears (Siimon & Lukason, 2021), with virtually no attention paid to modeling default risk in voluntary personal income tax (PIT) payments. This is a notable gap in risk coverage: PIT accounts for 26% of net revenue collections and is the principal tax type administered by 36% of OECD member countries (OECD, 2024), making it a substantial, largely unscored source of fiscal risk exposure.
This study responds to that gap by introducing TaxMind, an ML-based risk management framework for the risk-based segmentation of PIT taxpayers. In line with this aim, the study addresses three key research questions:
- Which ML approaches demonstrate the most reliable performance as default-risk classifiers for PIT compliance, the specific risk-modeling task facing revenue authorities?
- Which economic (debt-related) and socio-demographic (debtor-related) attributes most significantly drive taxpayer default risk, and therefore warrant inclusion in a public-sector risk-scoring model?
- How can ML-based risk scoring be operationalized within a risk management framework that meets the accountability and resource-allocation demands specific to public financial management, rather than the private-sector credit risk contexts in which such techniques were first developed?
Viewed through the lens of operational and financial risk management, AI implementation in tax administration is not a purely technical exercise: its effectiveness depends on identifying, assessing, and mitigating context-specific risks, particularly data quality, placing this study at the nexus of technological innovation, institutional risk capacity, and governance in financial systems (Zaim & Sahbani, 2026). Accordingly, the study addresses a critical gap between risk-management theory and practice, with direct relevance to both the academic risk-modeling literature and the operational needs of revenue authorities. The study’s contributions are threefold. First, at the level of risk-factor design, the research advances PIT default-risk modeling by combining debt-related exposure features with debtor-related socio-demographic risk indicators, capturing both the financial and behavioral determinants of default. Second, at the level of model selection, a systematic evaluation of five widely used ML classifiers is conducted, providing empirical evidence on which algorithm most reliably scores PIT compliance risk. Third, at the level of practical deployment, this study presents and validates TaxMind, the first risk management framework designed specifically for scoring and segmenting PIT arrears exposure, demonstrating how ML-based risk scoring can be embedded into tax administration processes. Among the five algorithms compared, XGBoost achieved the strongest discrimination (accuracy = 70.2%, AUC = 0.779), and SHAP-based interpretation showed that taxpayer age, a socio-demographic risk factor, ranked third in overall importance, ahead of most debt-related exposure variables — indicating that debtor-level risk characteristics carry meaningful, currently under-exploited value for default-risk scoring.
The remainder of this article is organized as follows. Section 2 explains the research methodology followed for constructing and validating the default-risk classification models. Section 3 presents the results of the study, including the comparative evaluation of model performance and the analysis of risk-factor importance. Section 4 discusses the findings and their implications for risk-based tax administration and revenue-authority resource allocation. Section 5 concludes with the main findings, contributions to the risk-management literature, and directions for future research.
2. Theoretical and Empirical Background
2.1. Economic and Behavioral Foundations of Tax Compliance
The decision to pay or avoid taxes is shaped by both economic and behavioral factors. Traditional deterrence models (Allingham & Sandmo, 1972) suggest that taxpayers respond to the degree of enforcement: compliance rises when penalties are high or audit probability is strong. Although originally developed to explain income underreporting, the same principle extends to payment compliance, where perceived enforcement capability and the effectiveness of collection strategies affect whether a taxpayer settles obligations on time or delays payment.
Deterrence alone, however, does not explain why taxpayers often comply voluntarily even when enforcement risk is moderate or low. Behavioral approaches highlight that compliance is also shaped by perceptions of fairness, social responsibility, and institutional trust. The Slippery-Slope Framework (Kirchler, Hoelzl, & Wahl, 2008) holds that both the enforcement power of authorities and citizens’ trust in their legitimacy jointly shape compliance decisions, while the Psychological Tax Contract (Feld & Frey, 2007) frames tax payment as a reciprocal exchange, positively influenced by government transparency and the quality of public services. Within Behavioral Public Finance, socio-demographic factors such as age, marital status, gender, and household structure have likewise been shown to influence non-compliance, whether through late payment (Mohamad, Radzuan, & Hamid, 2017) or underreporting (Inna, 2016).
Together, these theories position payment compliance within a framework driven by both enforcement incentives and personal context. This theoretical distinction is echoed in practice: the OECD (2014) has itself called for revenue bodies to move beyond managing debts alone and to give equal attention to managing debtors, recommending that administrations draw on the full range of available taxpayer information — not only the characteristics of the outstanding obligation — to target interventions more effectively. Forming the conceptual basis for integrating debt-related economic factors with socio-demographic attributes within the TaxMind framework, which uses ML to identify patterns of late or non-payment to guide risk-based intervention
2.2. Machine Learning in Tax Compliance Research
Applications of ML to tax risk scoring have historically centered on audit case selection — Wu (1994), for example, constructed a predictive model to flag taxpayers requiring further income-tax auditing. Subsequent comparative studies sought the most reliable risk classifiers for this task: Da Silva et al. (2015) compared Naïve Bayes and Tree-Augmented Naïve Bayes for high-risk taxpayer selection at the Brazilian Tax Administration (24,277 cases, 35 features), while Abdul Rahman (2020) compared five algorithms on 3,365 Malaysian companies, finding Logistic Regression and Random Forest performed best as fraud-risk classifiers. More recently, hybrid and ensemble approaches have addressed limited public tax data availability; Alrasheedi et al. (2025), for instance, built a soft-voting ensemble of Random Forest, XGBoost, and LSTM for tax fraud detection using 3,105 instances. However, this body of work centers on detecting fraud risk after it has materialized rather than on ex-ante default-risk prevention.
A separate strand of research has modeled default risk in corporate tax arrears specifically. Di Oliveira et al. (2021) used Neural Networks to forecast corporate tax arrears among Brazilian corporations from socioeconomic and financial risk indicators, while Siimon and Lukason (2021) compared decision tree, random forest, k-nearest neighbors, and neural network models to forecast next-month default risk for Estonian SMEs (2011–2018). Swenson (2024) similarly compared neural network, random forest, and decision tree methods for predicting quarterly corporate tax payment default among U.S. publicly traded companies. These studies confirm ML’s value for corporate tax default-risk scoring but leave individual taxpayers unaddressed, whose risk profiles and compliance incentives differ substantially from firms, underscoring the need to extend default-risk modeling to PIT.
At the individual level, risk-modeling research has been considerably narrower, concentrated on local or municipal tax rather than PIT. Lee & Kim (2024), for instance, modeled individual local tax default risk in the Republic of Korea using machine learning and deep learning architectures — convolutional neural networks (CNN), long short-term memory (LSTM), and sequence-to-sequence (seq2seq) models. While this represents a meaningful step toward individual-level default-risk scoring, it is confined to local tax data and does not generalize to national PIT risk contexts. Outside taxation, ML-based default-risk scoring is considerably more mature in credit risk management: Galindo & Tamayo (2000) applied data mining techniques to assess default risk in mortgage portfolios, Koh et al. (2006) constructed credit scoring models to classify borrower risk, and Khandani et al. (2010) used ML algorithms to forecast consumer credit-risk exposure from both credit bureau data and transactional behavior. More recently, Sudhakar and Reddy (2016) developed risk-scoring models to help banks identify creditworthy loan applicants, Ginting et al. (2018) proposed models to flag borrowers at elevated risk of becoming non-performing, Nuthalapati (2022) presented a framework for optimizing lending risk analysis using ML, cloud computing, and Big Data, and Belhadi et al. (2025) developed a hybrid ensemble ML approach for agricultural SME credit-risk exposure. Despite the maturity of these credit-risk-scoring techniques, comparable approaches have not yet been effectively adapted to personal income tax (PIT) arrears — a clear opportunity to transfer established default-risk modeling practice from private credit portfolios to public tax revenue portfolios.
Overall, the literature reveals a clear coverage gap: ML-based risk modeling in taxation has concentrated mainly on fraud-risk detection, with limited attention to corporate tax default-risk forecasting and local tax delinquency, and a general emphasis on retrospective risk detection over ex-ante risk scoring, despite the latter placing less burden on governmental enforcement resources (OECD, 2016, 2024). As far as we know, no research has yet modeled PIT default risk specifically, and the relative contribution of socio-demographic versus economic risk factors to individual default risk remains empirically unquantified. Given that PIT constitutes, on average, the main revenue source across many countries (OECD, 2024), this is a substantial, largely unscored source of fiscal risk exposure that this study addresses directly.
2.3. Explainable AI and Model Interpretability in Risk Modeling
A parallel development in the credit risk literature bears directly on the modeling choices made in this study. Comparative studies of forecasting performance have generally found ensemble and deep learning architectures to outperform traditional statistical methods for credit default-risk prediction, particularly as feature dimensionality increases (Chang et al., 2024). A systematic review of deep learning applications in fintech lending similarly identifies model architecture selection as a central, unresolved question for the field, alongside broader open challenges around data handling and model generalizability in default-risk prediction contexts (Saputra et al., 2026).
Alongside this pursuit of predictive performance, the credit risk literature has increasingly turned to Explainable Artificial Intelligence (XAI) to address the black-box nature of high-performing risk models. Ch et al. (2026) argue that SHAP-based feature attribution enhances both the soundness and the credibility of credit risk models, and further note that a central challenge in the field is no longer predictive power alone, but keeping risk models understandable, equitable, and stable across changing economic conditions. Taken together, these developments mark a shift away from accuracy-focused risk modeling and toward risk-scoring systems that are simultaneously performant, interpretable, and defensible to regulators and other stakeholders — a shift this study extends from private-sector credit risk into the public finance domain of tax arrears risk, where accountability to taxpayers imposes comparable demands for transparency (see Section 5).
3. Materials and Methods
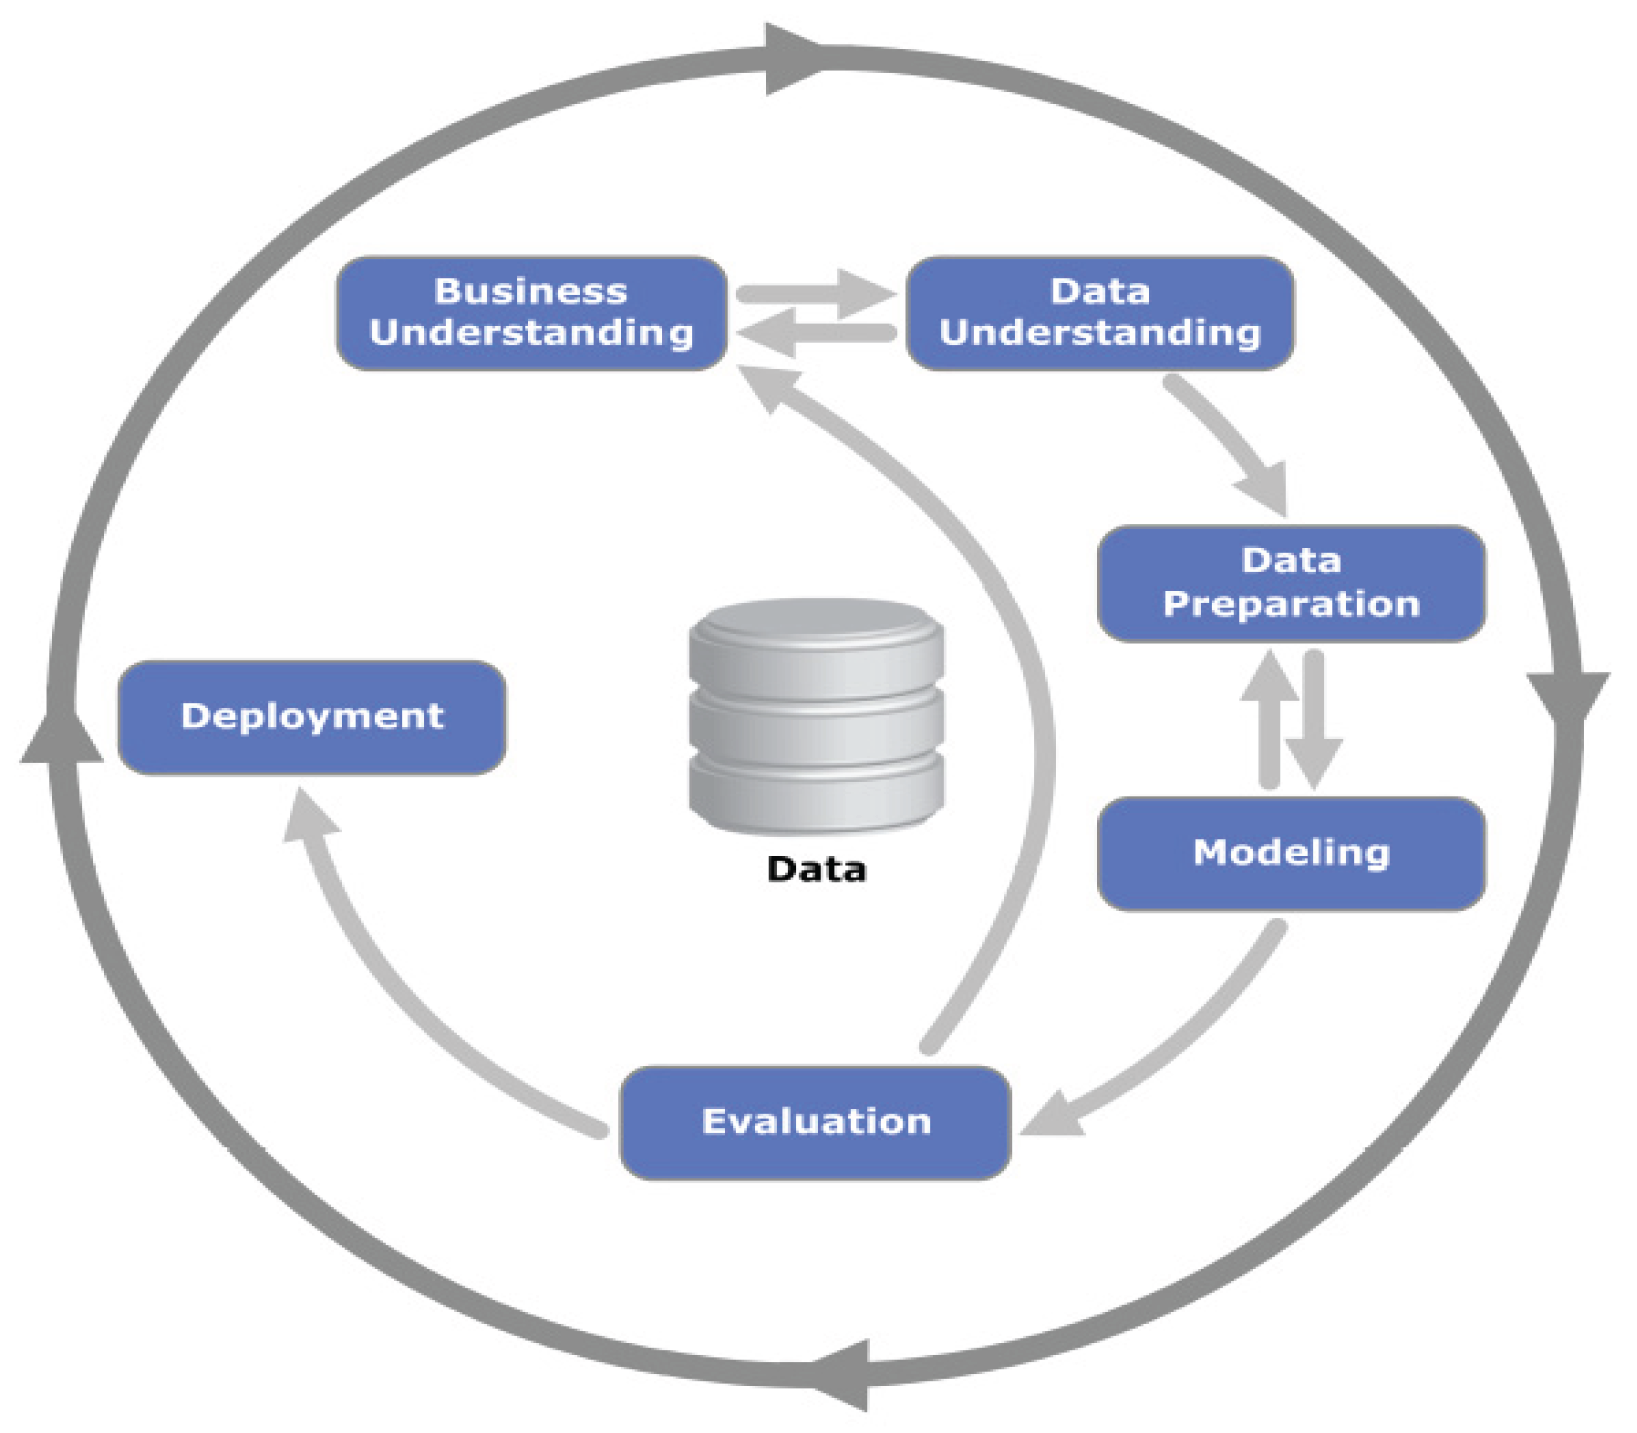
This study adopts a structured empirical approach guided by the Cross Industry Standard Process for Data Mining (CRISP-DM) (Wirth & Hipp, 2000), organizing the study into six iterative phases: 1) business understanding, 2) data understanding, 3) data preparation, 4) modeling, 5) evaluation, and 6) deployment. CRISP-DM is a standardized, model- and industry-independent knowledge discovery process (Chapman et al., 2000), ensuring methodological rigor alongside the practical usability needed for policy-relevant public finance problems.
Figure 1.
CRISP-DM Methodology Illustration.
3.1. Business Understanding
This stage translates the study’s risk-management objective into a concrete modeling problem: predicting which taxpayers are likely to require mandatory collection versus settling voluntarily, corresponding to the practical question guiding this study: “Which PIT taxpayers are at risk of mandatory collection?”
3.2. Data Understanding
This study relies on secondary data: anonymized administrative records collected by the Lebanese Tax Administration in the ordinary course of tax collection, drawn from two source systems. The collections database records enforcement actions and payment outcomes for issued tax obligations, while SIGTAS — the tax administration’s integrated system for taxpayer registration, assessment, and lifecycle management — holds the underlying taxpayer and obligation-level information, including the socio-demographic fields used in this study. Access to both systems was formally authorized by the Lebanese Ministry of Finance for the purposes of this research, and all records were de-identified prior to analysis, with no personally identifying information retained in the working dataset.
The dataset covers the full population of PIT obligations issued in the 2013 tax period for which matching records existed in both source systems, with payment and enforcement outcomes observed through 2018. This five-year window reflects a statutory limitation period under Lebanese tax law: mandatory collection actions must be initiated within five years of a tax obligation being issued, after which the obligation becomes time-barred and can no longer be legally enforced (MOF, 2008). Observing outcomes through 2018 therefore captures the full window within which each 2013 obligation’s enforcement status is legally determined.
The outcome of interest is whether a taxpayer’s obligation ultimately required mandatory (enforced) collection, or was instead paid voluntarily before enforcement.
Eight risk factors were available for modeling, selected based on data availability and in line with the OECD’s (2014) recommendation to combine information about the debt itself with socio-demographic information about the debtor. The individual-level factors are motivated by Mohamad et al. (2017) while the household-level factors draw on Inna (2016).
- Debt-related factors: the tax amount owed, which is traditionally used by the tax administration for prioritizing tax collection cases(OECD, 2014), and the tax category reflecting the three income-tax chapters defined under Lebanese tax law (MOF, 2008): the first chapter covers profits from industrial, commercial, and non-commercial activity; the second covers salaries, wages, and pension income; and the third covers revenues from movable capital (e.g., interest, dividends, and other investment income). Each chapter is levied at a different rate and is a recognized indicator of compliance risk (Allingham & Sandmo, 1972; Alm et al., 1995; Graetz & Wilde, 1985; Kirchler et al., 2008).
-
Socio-demographic (debtor-related) factors:
- Individual: gender, age, marital status, and collection unit (reflecting the address of the taxpayer)
- Household: number of children and whether the spouse works or not.
Table 1 summarizes these fields as recorded at the time the tax obligation was issued, before any payment outcome was known.
3.3. Data Preparation
This stage prepared the raw data for modeling, consolidating records from the two source systems into a single, consistent dataset (Yan et al., 2003). Four main steps were applied:
- Feature engineering: each taxpayer’s date of birth was converted into age.
- Data cleansing: 5,385 exact-duplicate records (33.6% of the raw 16,010 instances) were identified and removed to improve data integrity.
- Encoding: categorical fields were numerically encoded so that all algorithms could process them consistently (Rodríguez et al., 2018).
- Scaling and skew correction: the tax amount field was highly right-skewed, so a standard transformation was applied to compress extreme values while preserving their relative size and sign; this and the other numeric fields (age, number of children) were then standardized to a common scale before training.
After removing duplicates, the dataset comprised 10,625 valid records across 9,264 unique taxpayers, in which 5,118 (48.2%) requiring mandatory collection and 5,507 (51.8%) settled voluntarily; reflecting the balance between the two classes. Because some taxpayers contributed more than one record (up to nine, in a few cases), the data were split into training and test sets by taxpayer rather than by record (75%/25%), ensuring no taxpayer appeared in both the training set (7,955 records) and the held-out test set (2,670 records). The last step was applied to prevent the model from effectively “remembering” a specific taxpayer from training and inflating its apparent accuracy on the test set.
3.4. Modeling
In the modeling phase ML techniques should be employed. In this study, modeling involves comparing the performance of five ML algorithms frequently employed in predictive analytics (Wu, 1994; Abdul Rahman, 2020; Alrasheedi et al., 2025), namely: Random Forest (RF), Decision Tree (DT), Neural Network (NN), Extreme Gradient Boosting (XGBoost), and Support Vector Machine (SVM). All modeling and analysis were implemented in Python.
- Random Forest (RF): an ensemble of tree-based classifiers combined via majority vote (Breiman, 2001).
- Neural Network (NN): a computational model of interconnected nodes loosely modeled on the brain (Ngai et al., 2011; Gershenson, 2003).
- Decision Tree (DT): a hierarchical, rule-based classifier that recursively partitions the feature space into increasingly homogeneous subsets to maximize class separability at each node (Breiman, Friedman, Olshen, & Stone, 1984).
- XGBoost: a scalable tree-boosting system built on gradient-boosted decision trees (Chen & Guestrin, 2016).
- Support Vector Machine (SVM): separates classes via the decision surface that maximizes the margin between them (Cortes & Vapnik, 1995).
3.5. Evaluation
After obtaining the prediction results on the held-out test set, the confusion matrix is computed, providing the true positives (TP), false positives (FP), true negatives (TN), and false negatives (FN) that underlie all evaluation metrics. For evaluation, model performance is reported using accuracy, precision, recall, F1-score, and the area under the receiver operating characteristic curve (ROC-AUC).
To interpret the predictions of the best-performing model, SHAP (SHapley Additive exPlanations) values (Lundberg & Lee, 2017) were computed using the TreeExplainer algorithm (Lundberg et al., 2020) on a random sample of 500 test instances (fixed random seed), yielding both a global feature-importance ranking and instance-level directional attributions. This was compared against the model’s native gain-based feature-importance measure, both reported at the level of individual one-hot-encoded feature levels, to assess the consistency of the two interpretability approaches.
3.6. Deployment
The final stage translates the model’s technical output into a practical decision-making tool: TaxMind, a risk management framework built around the model developed in this study.
As shown in Figure 2, TaxMind has three layers. A data integration layer brings together information from the collections system and SIGTAS; a data processing layer applies the risk model to score each taxpayer’s likelihood of default; and a presentation layer gives decision-makers a ranked list of taxpayers by risk level, to support more targeted and cost-effective collection efforts.
By combining data on tax debts with information about taxpayers, TaxMind puts the OECD’s (2014, 2016, 2024) risk-based segmentation strategy into practice — moving beyond the debt-centric enforcement that has traditionally characterized tax collection, toward the debtor-centric targeting the OECD itself has called for. In practice, this means the risk score could be generated at the point a tax obligation is issued and attached to the taxpayer’s record within the Ministry of Finance’s existing collection system, so that case officers already see a risk indicator alongside the usual case details, rather than needing a separate tool or process. In doing so, it shifts arrears management from a reactive process, focused on debts that have already accumulated, to a proactive strategy that anticipates risk before it materializes, at the exact point where collection decisions are already being made
4. Results
4.1. Predictive Performance
Table 2 reports held-out test performance for all five classifiers, evaluated on the taxpayer-disjoint test set (n = 2,670), sorted by ROC-AUC. Because the outcome is close to evenly split (51.8% voluntary settlement, 48.2% mandatory collection), accuracy is not distorted by class imbalance and is therefore a meaningful primary metric here, unlike in more skewed risk-prediction settings where it can be misleading.
Figure 3 presents the accuracy achieved by each of the five classifiers. XGBoost achieved the highest accuracy (70.2%), followed by Random Forest (68.2%), Decision Tree (65.1%), Support Vector Machine (62.5%), and the Neural Network (62.0%) — a consistent ordering with the ROC-AUC ranking in Table 2, where XGBoost again led (0.779), ahead of Random Forest (0.757), Decision Tree (0.744), Support Vector Machine (0.670), and the Neural Network (0.668). This consistency across two different metrics strengthens confidence that XGBoost’s advantage reflects genuine discriminative power rather than an artifact of a single evaluation measure.
The Decision Tree is a partial exception to this pattern: despite its lower accuracy and AUC, it achieved by far the highest recall (84.0%), correctly identifying the largest share of taxpayers who actually required mandatory collection, but at the cost of the lowest precision (59.6%) among all five models, which means many of its flagged cases did not, in fact, proceed to arrears. XGBoost, by contrast, balanced precision (67.6%) and recall (72.3%) more evenly, which supports its selection as the primary model for the SHAP-based interpretability analysis that follows.
Figure 4 shows the ROC curve of the XGBoost model, the best-performing classifier. The model achieved an AUC of 0.779 on the taxpayer-disjoint held-out test set, indicating useful, though not exceptional, discriminative performance given only eight administrative fields and no payment-history information.
4.3. Interpretability Findings
Figure 5 presents the SHAP summary plot for the XGBoost model. Because categorical fields were one-hot encoded prior to modeling, SHAP importance is reported per encoded level (e.g., Tax Category_2, Collection unit_6) rather than per original field, preserving level-specific directional effects that an aggregated per-field summary would obscure.
The results indicate that the debt-centric emphasis common in traditional tax risk models captures most, but not all, of the available predictive signal. Total tax amount and Tax Category = 2 — both debt-related — ranked first and second in global importance, consistent with the presumption that debt characteristics carry the strongest signal. However, the debtor-related feature age ranked third, ahead of every other debt-related feature except these top two, including Collection unit and Tax Category = 1. A debtor characteristic thus outperforms most debt-related information in this dataset — a result that would go undetected under a modeling approach restricted to debt-related fields alone.
Directionally, the debt-related features showed the cleanest patterns: Tax Category = 2 was associated with consistently elevated predicted risk and Tax Category = 3 with consistently reduced risk; Collection unit = 6 showed a smaller but consistent risk-reducing effect not observed for the other five units. Total tax amount showed a wider, interaction-dependent spread of SHAP values without a single monotonic direction, suggesting its effect depends on which debt category it is combined with. Among debtor-related features, age showed the clearest signal: younger taxpayers contributed a long tail of positive SHAP values (elevated risk), an effect that compressed toward zero for older taxpayers. The remaining debtor-related features — number of children, marital status, gender, and working-spouse status — contributed little individually, clustering close to zero.
Finally, the model’s native gain-based feature-importance (Figure 6) measure produced a materially different ranking than SHAP, assigning Collection unit and marital status substantially more weight. This divergence reflects a known property of gain-based importance: it credits a feature every time it contributes to a split, which can favor categorical variables with several one-hot-encoded levels even when each level’s aggregate contribution to individual predictions, as measured by SHAP, is small (Strobl, Boulesteix, Zeileis, & Hothorn, 2007).
5. Discussion
Four findings are of particular significance for default-risk modeling in tax administration. First, debtor-level risk factors, most notably taxpayer age, carry risk-discriminating power that rivals several debt-related exposure variables, despite showing only a modest univariate association with the outcome (Section 4.1). The gap between univariate and SHAP-based multivariate importance indicates that age operates substantially through interaction with other risk factors rather than as an independent marginal effect.
This finding lends direct empirical support to the OECD’s (2014) recommendation that revenue bodies to focus on the debtor’s characteristics in addition to the characteristics of the debt itself for implementing “smarter” collection strategies. In the matter of fact, the present results provide a quantitative basis for that shift: SHAP-based multivariate analysis shows that debtor-level signal, such as age, is not merely additive but interacts with debt-related exposure in ways a bivariate or debt-only screening approach would miss, and age-based segmentation of outreach intensity is one concrete mechanism through which debtor-centric targeting could be operationalized. Incorporating debtor-level demographic fields into existing risk scorecards, where legally and ethically permissible, may therefore realize predictive gains that OECD guidance has recommended in principle but that, to our knowledge, have not previously been quantified at the level of individual predictions. This finding is consistent with survey-based evidence that age and household characteristics shape non-compliance behavior (Mohamad et al., 2017; Inna, 2016); the present study extends that evidence by showing, using large-scale administrative data and a machine-learning risk model rather than self-reported survey measures, that such socio-demographic risk factors are detectable and quantifiable at the level of individual predictions.
The present results provide a quantitative basis for that shift: SHAP-based multivariate analysis shows that debtor-level signal, such as age, is not merely additive but interacts with debt-related exposure in ways a bivariate or debt-only screening approach would miss, and age-based segmentation of outreach intensity is one concrete mechanism through which debtor-centric targeting could be operationalized. Incorporating debtor-level demographic fields into existing risk scorecards, where legally and ethically permissible, may therefore realize predictive gains that OECD guidance has recommended in principle but that, to our knowledge, have not previously been quantified at the level of individual predictions. This finding is consistent with survey-based evidence that age and household characteristics shape non-compliance behavior (Mohamad et al., 2017; Inna, 2016); the present study extends that evidence by showing, using large-scale administrative data and a machine-learning risk model rather than self-reported survey measures, that such socio-demographic risk factors are detectable and quantifiable at the level of individual predictions.
Second, the substantial share of exact-duplicate records (33.6%) identified in the raw dataset, and their measurable effect on estimated model performance once removed, highlights data quality as an issue warranting systematic attention in administrative risk-modeling pipelines. In this study specifically, undetected duplication would have materially affected estimated discrimination and, by extension, any capital, staffing, or enforcement decisions calibrated against that performance
Third, the taxpayer-grouped validation protocol adopted here addresses a leakage risk that a conventional random split would not have surfaced: where the unit of prediction (a tax record) and the unit of ultimate interest (a taxpayer) differ, and the same taxpayer can contribute multiple records, grouped validation should be considered a default rather than an optional refinement in tax administration risk modeling.
Fourth, the observed divergence between SHAP-based and gain-based feature importance illustrates that interpretability conclusions are not method-agnostic. A practitioner relying solely on a model’s built-in importance measure could conclude that Collection unit and marital status are comparatively important, a conclusion the SHAP analysis does not support at the level of individual predictions. This has direct implications for debt-versus-debtor prioritization specifically: a gain-based analysis alone would understate the debtor-related contribution of age relative to debt-related category and Collection unit variables, potentially reinforcing rather than correcting the field’s existing debt-centric bias.
These results also situate the study within the broader comparative machine-learning literature on tax arrears. Prior work on corporate tax arrears has similarly relied on tree-based and neural architectures to model payment default (Siimon & Lukason, 2021; Di Oliveira et al., 2021; Swenson, 2024), and the present findings, in which tree-based ensemble methods (XGBoost, Random Forest) outperformed the neural network, are consistent with the general reliance on tree-based approaches for tabular administrative data in this literature. At the individual level, Lee & Kim (2024) demonstrated the feasibility of deep-learning approaches for predicting local tax defaults in South Korea; the present study extends this feasibility argument to personal income tax specifically, using a taxpayer-grouped validation design not reported in that study, and to a national rather than municipal tax context.
Taken together, these findings speak to the three contributions this study set out to make: a feature-engineering approach that jointly captures debt-related and debtor-related risk, a systematic comparison identifying which model architecture best scores that risk, and a practical demonstration of how such scoring can be embedded into an administrative workflow. The results reported above substantiate each in turn — the age finding validates the feature-engineering premise specifically, and the model comparison in Section 4 identifies XGBoost as the strongest candidate for the third.
From an institutional perspective, the presented framework constitutes a scalable and replicable model that could be adjusted to the administrative structure of other jurisdictions. Although validation is based on data from the Lebanese Tax Administration, the underlying approach is transferable to other settings. Given an AUC of 0.779 using only eight administrative fields and no payment-history information, the model is best positioned as a tool for risk-based prioritization of cases for review or outreach, rather than for fully automated decision-making. Successful AI adoption in tax administration is, in this sense, itself an operational-risk problem, shaped by data quality, regulatory fragmentation, and organizational readiness, and situating frameworks such as this one at the intersection of technological innovation, institutional capacity, and governance (Zaim & Sahbani, 2026).
These findings also point to concrete, low-cost applications. A validated XGBoost-based risk score, built entirely from routinely collected administrative fields, could serve as an early-warning indicator within existing case-management workflows, allowing revenue authorities to flag elevated-risk taxpayers before arrears accumulate into full enforcement cases. The pronounced age effect further suggests that outreach could be differentiated by age group rather than applied uniformly. At the same time, the limited individual contribution of most other socio-demographic variables — marital status, gender, number of children — is itself a favorable property for deployment: a small, validated set of risk factors appears sufficient for effective segmentation, without requiring revenue authorities to collect additional personal data.
From a policy perspective, these results establish a scalable, interpretable basis for risk-based segmentation, a strategy the OECD has consistently recommended (OECD, 2014, 2016, 2024). Embedding this approach within the broader compliance enforcement framework allows resources to be allocated in closer proportion to estimated risk, while supporting fairness and transparency in how enforcement burden is distributed across taxpayers. The proposed framework also offers a replicable template for data-driven fiscal governance in developing and emerging economies pursuing tax administration modernization.
6. Conclusions
This study introduced TaxMind, a risk management framework contributing to the emerging intersection of ML and public finance, standing among the first empirical efforts to construct predictive models for individual payment compliance beyond corporate and municipal arrears.
The empirical analysis, conducted on 10,625 administrative PIT instances after removing 5,385 exact-duplicate records (33.6% of the raw 16,010 instances), indicated the superior performance of XGBoost among the five algorithms compared, with an Accuracy of 0. 0.702 and an AUC of 0.779 on a taxpayer-disjoint held-out test set. In addition, SHAP-based feature-importance analysis revealed that the socio-demographic, debtor-related predictor “Age” ranked third overall, ahead of every debt-related predictor except total tax amount and tax category, emphasizing that individual payment compliance is shaped not only by fiscal capacity but also by demographic and behavioral characteristics.
These findings carry a direct practical implication for revenue authorities: meaningful gains in risk-based segmentation may be available from data already collected, without new data-collection efforts, simply by incorporating debtor-level socio-demographic fields alongside the debt-related variables risk models have traditionally relied on. The approach demonstrated here shows that even resource-constrained tax administrations could adopt a comparable framework as a starting point for risk-based prioritization.
Future research could extend this work in several directions: evaluating the TaxMind framework in live administrative settings to assess its operational impact and end-user acceptance, using instruments such as the Technology Acceptance Model (TAM); incorporating additional behavioral and psychological risk factors into the model; validating the framework on data from other jurisdictions; and extending the approach to other tax bases, such as property and indirect taxes.
Supplementary Materials
The following supporting information can be downloaded at the website of this paper posted on Preprints.org.
Author Contributions
Conceptualization, M.K. H.H., and S.D.; methodology, M.K.; software, M.K; validation, M.K, H.H. and S.D.; formal analysis, M.K, H.H.; investigation, H.H.; resources, M.K.; data curation, M.K.; writing—original draft preparation, M.K; writing—review and editing, M.K, H.H. and S.D.; visualization, M.K.; supervision, M.K.; project administration, M.K.; funding acquisition, N/A All authors have read and agreed to the published version of the manuscript.
Funding
This research received no external funding.
Institutional Review Board Statement
Not applicable.
Informed Consent Statement
Not applicable.
Data Availability Statement
The administrative tax data used in this study contain confidential taxpayer information and are not publicly available due to legal and data protection restrictions imposed by the Lebanese Tax Administration. Data may be made available by the corresponding author upon reasonable request.
Acknowledgments
During the preparation of this study, the author(s) used ClaudeAI for the purposes of enhancing English. The authors have reviewed and edited the output and take full responsibility for the content of this publication.
Conflicts of Interest
The authors declare no conflicts of interest.
Abbreviations
The following abbreviations are used in this manuscript:
| PIT | Personal Income Tax |
| ML | Machine Learning |
| AI | Artificial Intelligence |
| SHAP | Shapley Additive Explanations |
| XGBoost | Extreme Gradient Boosting |
| RF | Random Forest |
| DT | Decision Tree |
| SVM | Support Vector Machine |
| MLP | Multi-Layer Perceptron |
| AUC | Area Under the (ROC) Curve |
References
- Abdul Rahman, R.; Masrom, S.; Omar, N.; Zakaria, M. An application of machine learning on corporate tax avoidance detection model. IAES International Journal of Artificial Intelligence (IJ-AI) 2020, 9(4). [Google Scholar] [CrossRef]
- Allingham, M.; Sandmo, A. Income tax evasion: A theoretical analysis. Journal of Public Economics 1972, 1, 323–338. [Google Scholar] [CrossRef]
- Alm, J.; Sanchez, I.; De Juan, A. Economic and noneconomic factors in tax compliance. Kyklos 1995, 48(1), 1–18. [Google Scholar] [CrossRef]
- Alrasheedi, M. A.; Ijaz, S.; Alrashdi, A. M.; Lee, S.-W. Advanced Tax Fraud Detection: A Soft-Voting Ensemble Based on GAN and Encoder Architecture. Mathematics 2025, 13(4), 642. [Google Scholar] [CrossRef]
- Belhadi, A.; Kamble, S. S.; Mani, V.; Benkhati, I.; Touriki, F. E. An ensemble machine learning approach for forecasting credit risk of agricultural SMEs’ investments in agriculture 4.0 through supply chain finance. Annals of Operations Research 2025, 345(2), 779–807. [Google Scholar] [CrossRef] [PubMed]
- Breiman, L. Random forests. Machine Learning 2001, 45(1), 5–32. [Google Scholar] [CrossRef]
- Breiman, L.; Friedman, J. H.; Olshen, R. A.; Stone, C. J. Classification and regression trees; Chapman & Hall/CRC, 1984. [Google Scholar]
- Ch, R. K.; Meenadevi, K.; Kumar D, D.; Nagaraj, R. Deep Learning in Credit Risk Assessment: A Data-Driven Approach to Transforming Financial Decision-Making and Risk Analytics. Journal of Risk and Financial Management 2026, 19(5), 361. [Google Scholar] [CrossRef]
- Chambi Condori, P. P.; Chambi Vásquez, M.; Saravia Ticona, T. Beyond accuracy: Economic performance of machine learning models in financial fraud detection. Journal of Risk and Financial Management 2026, 19(5), 332. [Google Scholar] [CrossRef]
- Chang, V.; Sivakulasingam, S.; Wang, H.; Wong, S. T.; Ganatra, M. A.; Luo, J. Credit risk prediction using machine learning and deep learning: A study on credit card customers. Risks 2024, 12(11), 174. [Google Scholar] [CrossRef]
- Chapman, P.; Clinton, J.; Kerber, R.; Khabaza, T.; Reinartz, T.; Shearer, C.; Wirth, R. CRISP-DM 1.0: Step-by-step data mining guide. SPSS inc. 2000. [Google Scholar] [CrossRef]
- Chen, T.; Guestrin, C. XGBoost: A scalable tree boosting system. In Proceedings of the 22nd ACM SIGKDD International Conference on Knowledge Discovery and Data Mining 785–794; 2016; pp. 785–794. [Google Scholar]
- Cortes, C.; Vapnik, V. Support-vector network. Machine Learning 1995, 20, 1–25. [Google Scholar] [CrossRef]
- Da Silva, L. S.; Carvalho, R. N.; Souza, J. C. F. Predictive models on tax refund claims: Essays of data mining in Brazilian tax administration. International Conference on Electronic Government and the Information Systems Perspective (EGOVIS 2015); 2015; pp. 220–228. [Google Scholar]
- Di Oliveira, V.; Chaim, R. M.; Weigang, L.; Neto, S. A. P. B.; Filho, G. P. R. Towards a Smart Identification of Tax Default Risk with Machine Learning. In International Conference on Web Information Systems and Technologies, WEBIST - Proceedings; 2021; pp. 422–429. [Google Scholar] [CrossRef]
- Feld, L. P.; Frey, B. S. Tax compliance as the result of a psychological tax contract: The role of incentives and responsive regulation. Law & Policy 2007, 29(1), 102–120. [Google Scholar] [CrossRef]
- Galindo, J.; Tamayo, P. Credit risk assessment using statistical and machine learning: Basic methodology and risk modeling applications. Computational Economics 2000, 15(1–2), 107–143. [Google Scholar] [CrossRef]
- Gershenson, C. Artificial neural networks for beginners. arXiv 2003. [Google Scholar]
- Ginting, S. L. B.; Adler, J.; Ginting, Y. R.; Kurniadi, A. H. The development of bank applications for debtors’ selection by using Naïve Bayes classifier technique. IOP Conference Series: Materials Science and Engineering 2018, 407(1), 1–7. [Google Scholar] [CrossRef]
- Graetz, M. J.; Wilde, L. L. The economics of tax compliance: Fact and fantasy. National Tax Journal 1985, 38(3), 355–363. [Google Scholar] [CrossRef]
- Inna, L. The determinants of tax evasion among ukrainian households. Master Thesis, Kyiv School of Economics, 2016. [Google Scholar]
- Khandani, A. E.; Kim, A. J.; Lo, A. W. Consumer credit-risk models via machine-learning algorithms. Journal of Banking & Finance 2010, 34(11), 2767–2787. [Google Scholar] [CrossRef]
- Kirchler, E.; Hoelzl, E.; Wahl, I. Enforced versus voluntary tax compliance: The “slippery slope” framework. Journal of Economic Psychology 2008, 29(2), 210–225. [Google Scholar] [CrossRef]
- Koh, H. C.; Tan, W. C.; Goh, C. P. A two-step method to construct credit scoring models with data mining techniques. International Journal of Business and Information 2006, 1(1), 96–118. [Google Scholar]
- Lee, Y.; Kim, E. Deep Learning-based Delinquent Taxpayer Prediction: A Scientific Administrative Approach. KSII Transactions on Internet & Information Systems 2024, 18(1), 30. [Google Scholar] [CrossRef]
- Lundberg, S. M.; Lee, S.-I. A unified approach to interpreting model predictions. Advances in Neural Information Processing Systems 2017, 30, 4765–4774. [Google Scholar]
- Lundberg, S. M.; Erion, G.; Chen, H.; DeGrave, A.; Prutkin, J. M.; Nair, B.; Katz, R.; Himmelfarb, J.; Bansal, N.; Lee, S.-I. From local explanations to global understanding with explainable AI for trees. Nature Machine Intelligence 2020, 2(1), 56–67. [Google Scholar] [CrossRef] [PubMed]
- Masekoameng, J. L.; Mbona, S. V.; Ananth, A.; Chifurira, R. Bayesian logistic regression for credit risk modelling among South African loan borrowers. Journal of Risk and Financial Management 2026, 19(5), 358. [Google Scholar] [CrossRef]
- MOF. Tax Procedures Law - TPL - and its amendments. 2008.
- Mohamad, A.; Radzuan, N.; Hamid, Z. Tax arrears amongst individual income taxpayers in Malaysia. Journal of Financial Crime 2017, 24(1), 17–34. [Google Scholar] [CrossRef]
- Ngai, E. W. T.; Hu, Y.; Wong, Y. H.; Chen, Y.; Sun, X. The application of data mining techniques in financial fraud detection: A classification framework and an academic review of literature. Decision Support Systems 2011, 50(3), 559–569. [Google Scholar] [CrossRef]
- Nuthalapati, A. Optimizing Lending Risk Analysis & Management with Machine Learning, Big Data, and Cloud Computing. Remittances Review 2022, 7(2), 172–184. [Google Scholar]
- OECD. Working smarter in tax debt management; OECD Publishing: Paris, 2014. [Google Scholar] [CrossRef]
- OECD. Advanced analytics for better tax administration: Putting Data to Work; OECD Publishing: Paris, 2016. [Google Scholar] [CrossRef]
- OECD. Tax Administration 2024: Comparative Information on OECD and other Advanced and Emerging Economies; OECD Publishing: Paris, 2024. [Google Scholar] [CrossRef]
- Rodríguez, P.; Bautista, M. A.; Gonzalez, J.; Escalera, S. Beyond one-hot encoding: Lower dimensional target embedding. Image and Vision Computing 2018, 75, 21–31. [Google Scholar] [CrossRef]
- Saputra, M. P. A.; Sukono; Riaman; Kartiwa, A.; Misiran, M.; Wahid, A. J. Deep learning for credit risk prediction in fintech lending: A systematic literature review on model architectures, imbalanced data handling, and research agenda. Journal of Risk and Financial Management 2026, 19(7), 465. [Google Scholar] [CrossRef]
- Siimon, Õ. R.; Lukason, O. A decision support system for corporate tax arrears prediction. Sustainability (Switzerland) 2021, 13(15). [Google Scholar] [CrossRef]
- Sudhakar, M.; Reddy, C. V. K. Two step credit risk assesment model for retail bank loan applications using decision tree data mining technique. International Journal of Advanced Research in Computer Engineering & Technology (IJARCET,) 2016, 5(3), 705–718. [Google Scholar]
- Strobl, C.; Boulesteix, A. L.; Zeileis, A.; Hothorn, T. Bias in random forest variable importance measures: Illustrations, sources and a solution. BMC Bioinformatics 2007, 8, 25. [Google Scholar] [CrossRef] [PubMed]
- Swenson, C. Using Machine Deep Learning AI to Improve Forecasting of Tax Payments for Corporations. Forecasting 2024, 6(4), 968–984. [Google Scholar] [CrossRef]
- Wirth, R.; Hipp, J. CRISP-DM: Towards a standard process model for data mining. In Proceedings of the 4th International Conference on the Practical Applications of Knowledge Discovery and Data Mining; 2000; pp. 29–39. [Google Scholar]
- Wu, R. C. F. Integrating neurocomputing and auditing expertise. Managerial Auditing Journal 1994, 9(3), 20–26. [Google Scholar] [CrossRef]
- Yan, X.; Zhang, C.; Zhang, S. Towards databases mining: Pre-processing collected data. Applied Artificial Intelligence 2003, 17(5–6), 545–561. [Google Scholar] [CrossRef]
- Zaim, H.; Sahbani, S. Artificial intelligence in tax compliance and evasion mitigation: Trends, mechanisms, and institutional implications. Journal of Risk and Financial Management 2026, 19(7), 513. [Google Scholar] [CrossRef]
Figure 2.
TaxMind Risk-Management Framework.
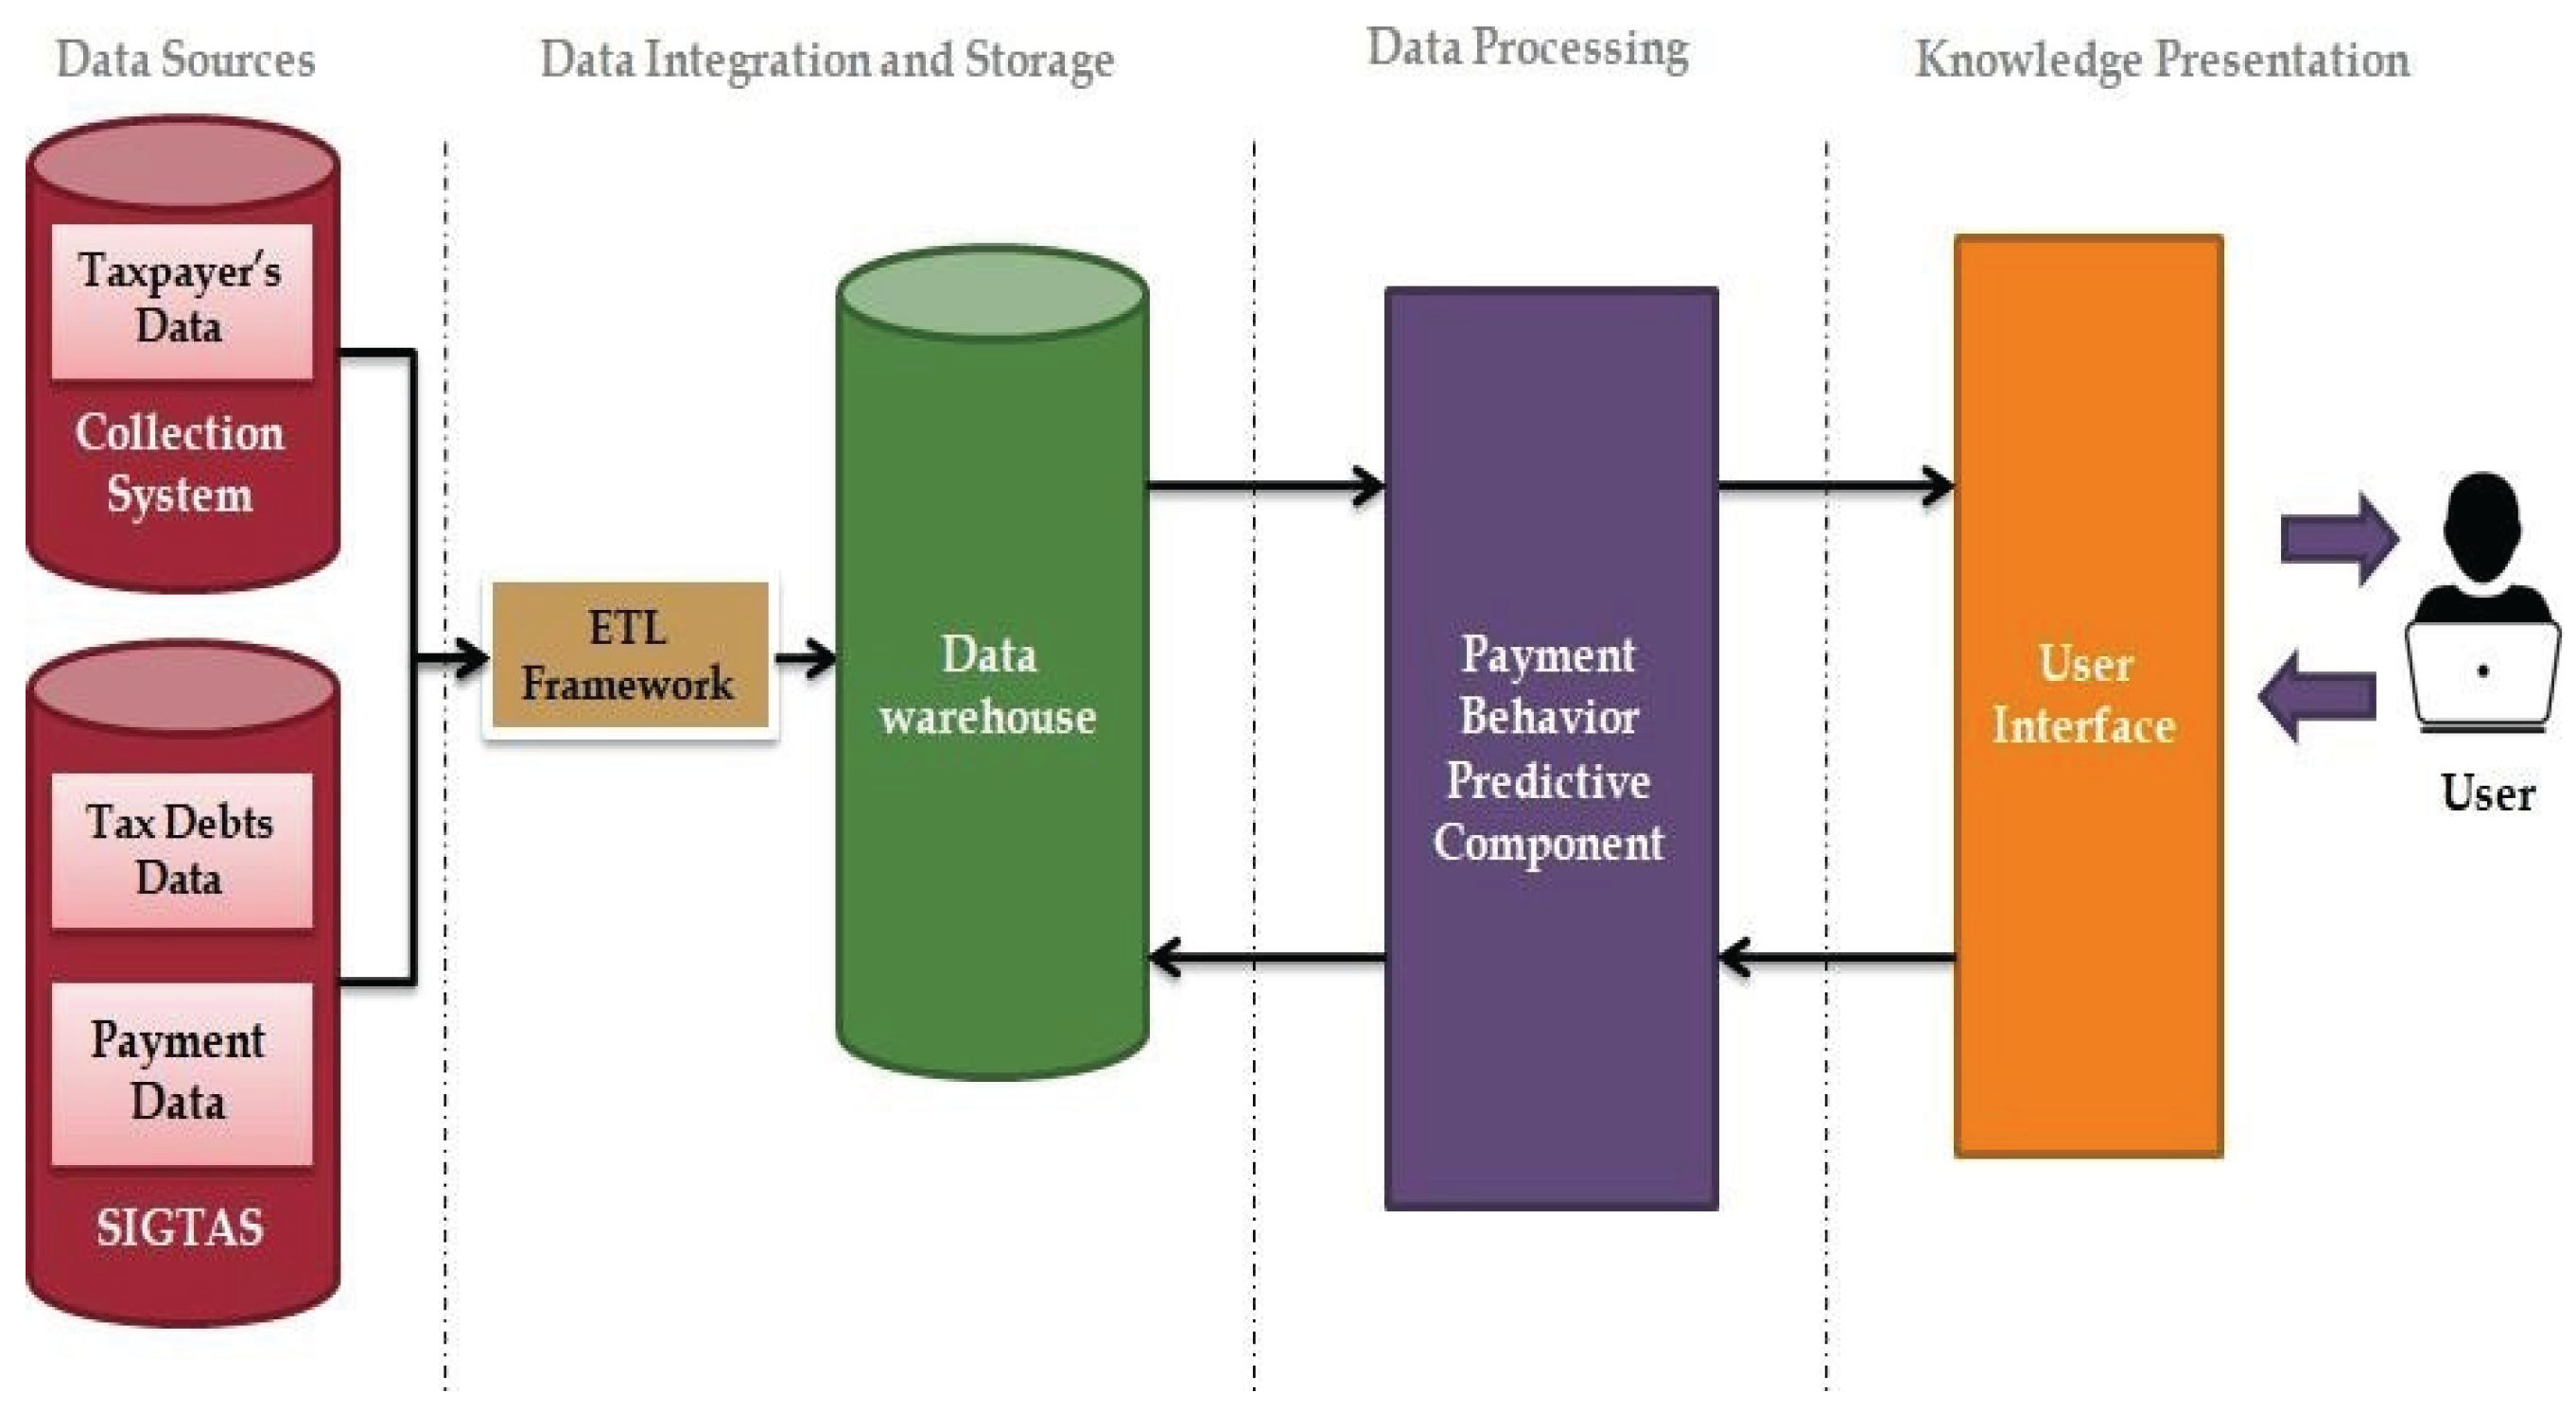
Figure 3.
Model Performance Comparison Across Metrics.
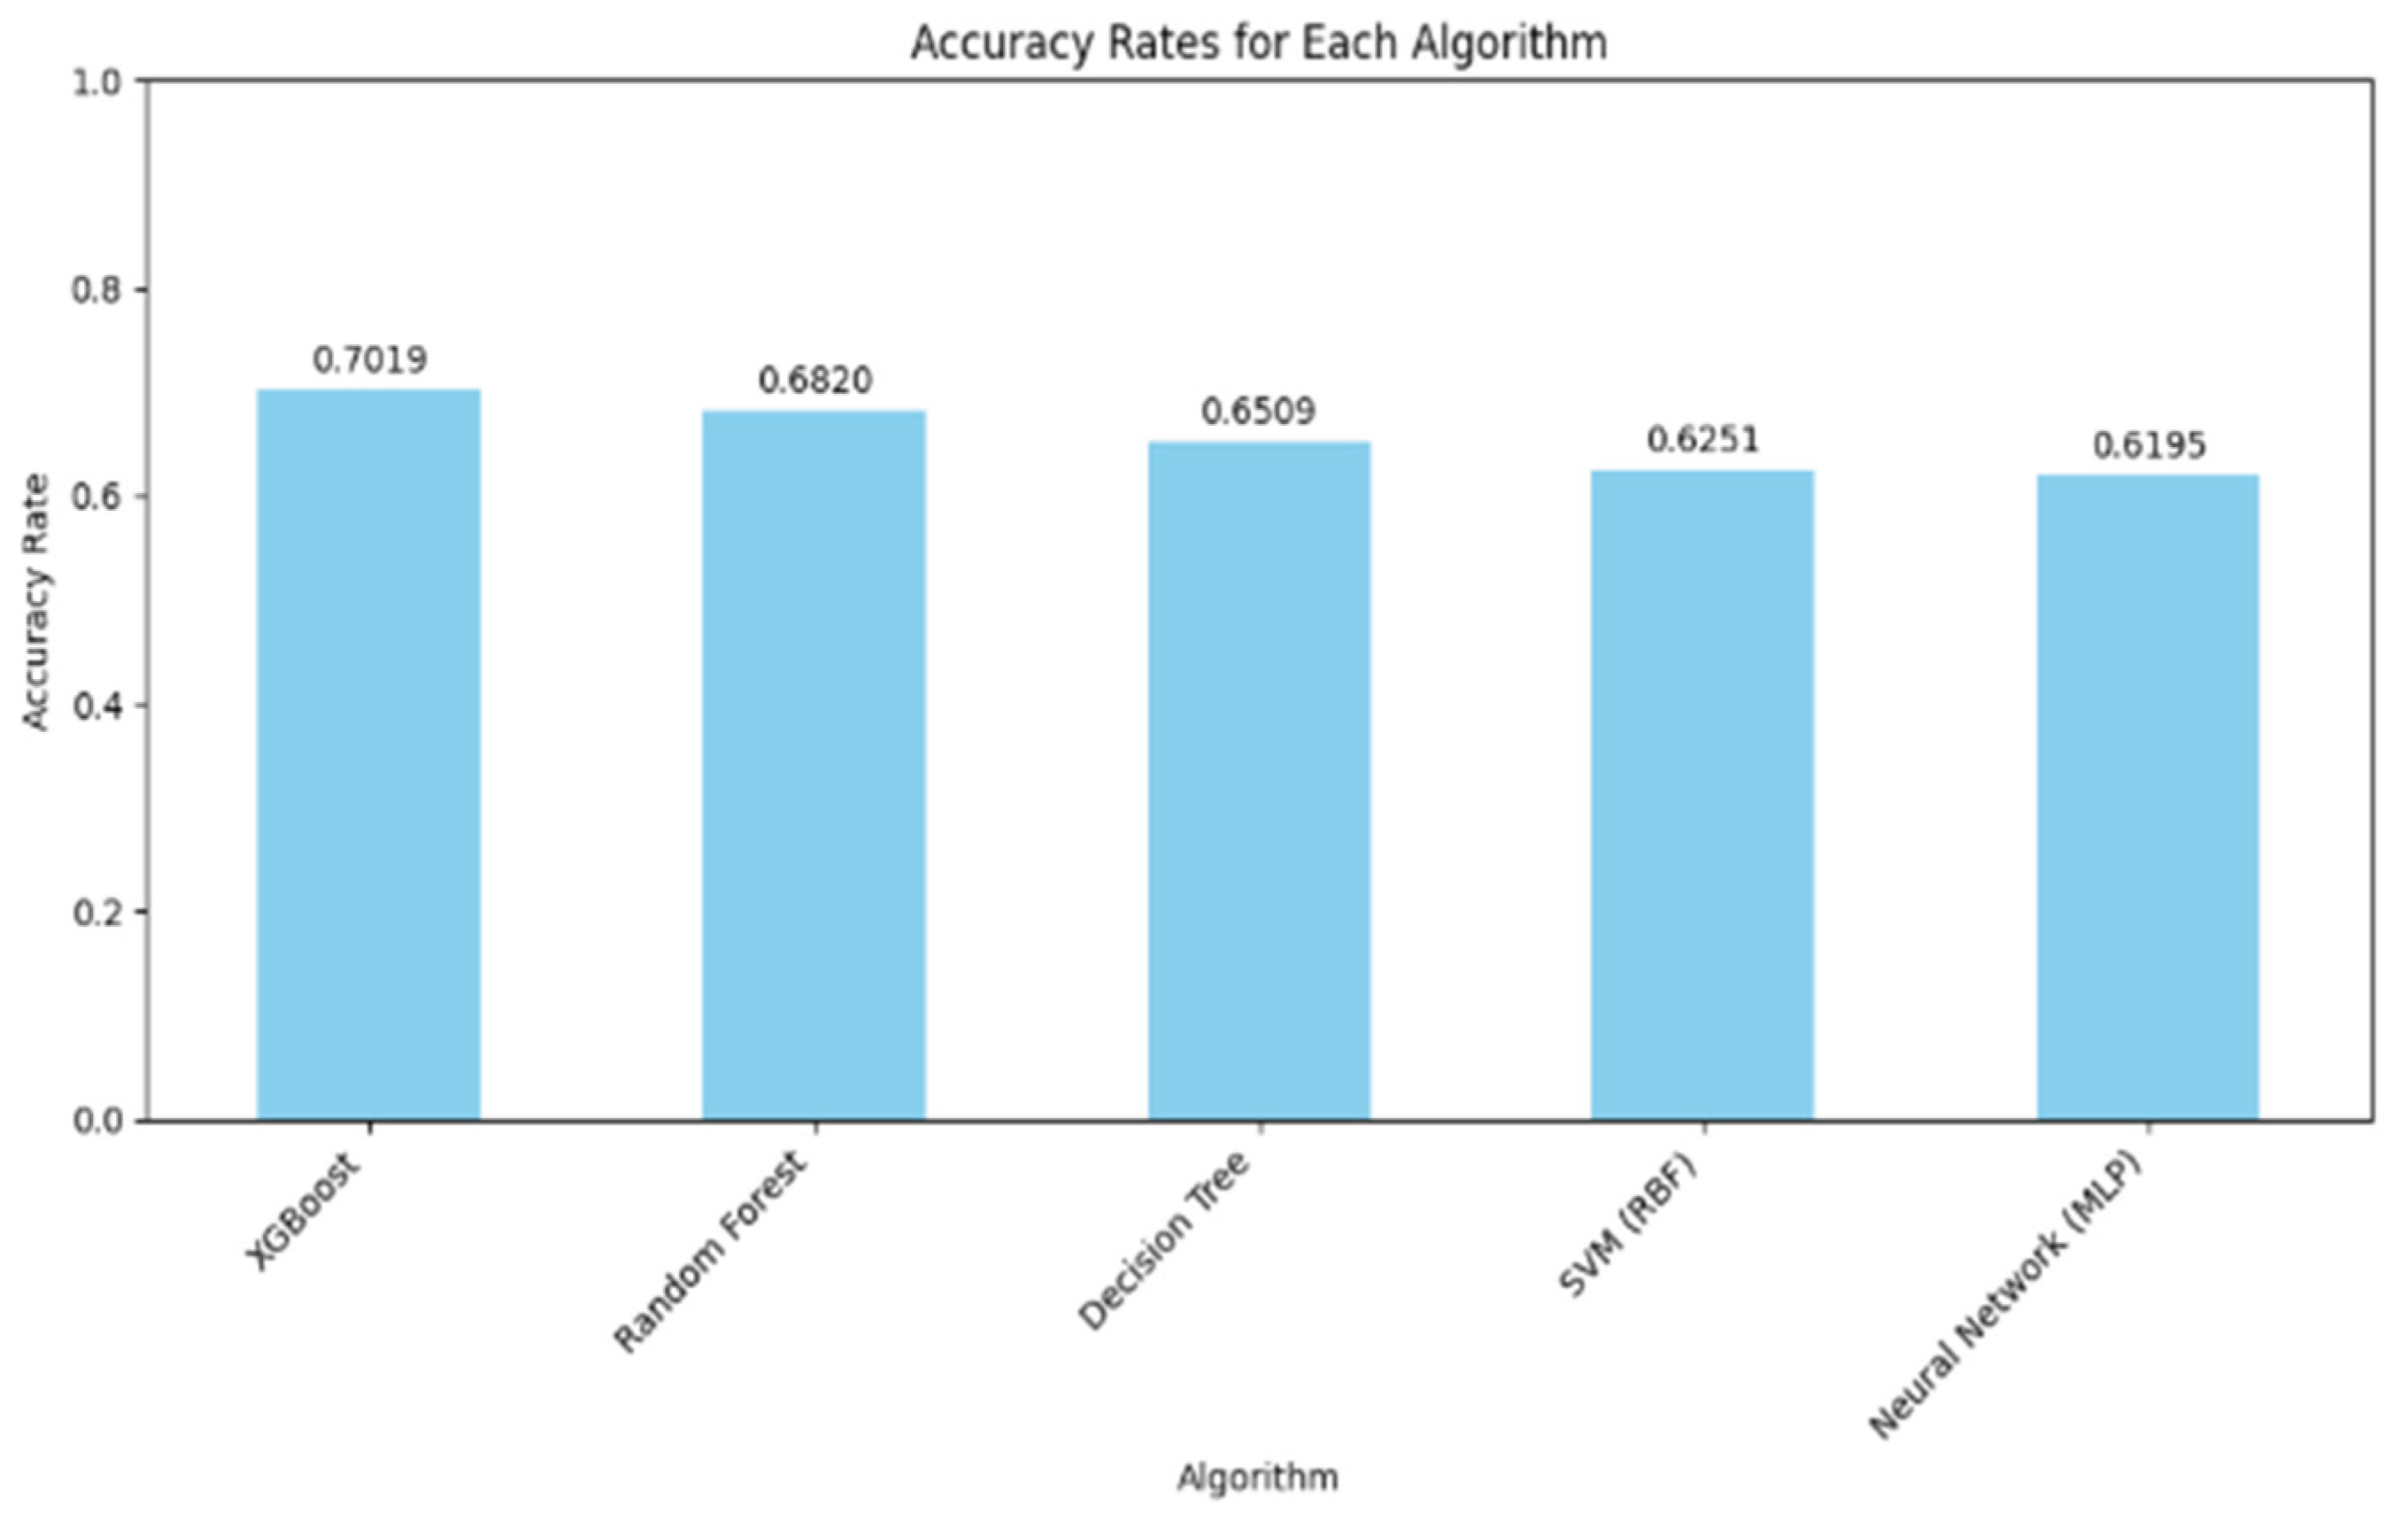
Figure 4.
ROC curve of XGBoost algorithm.
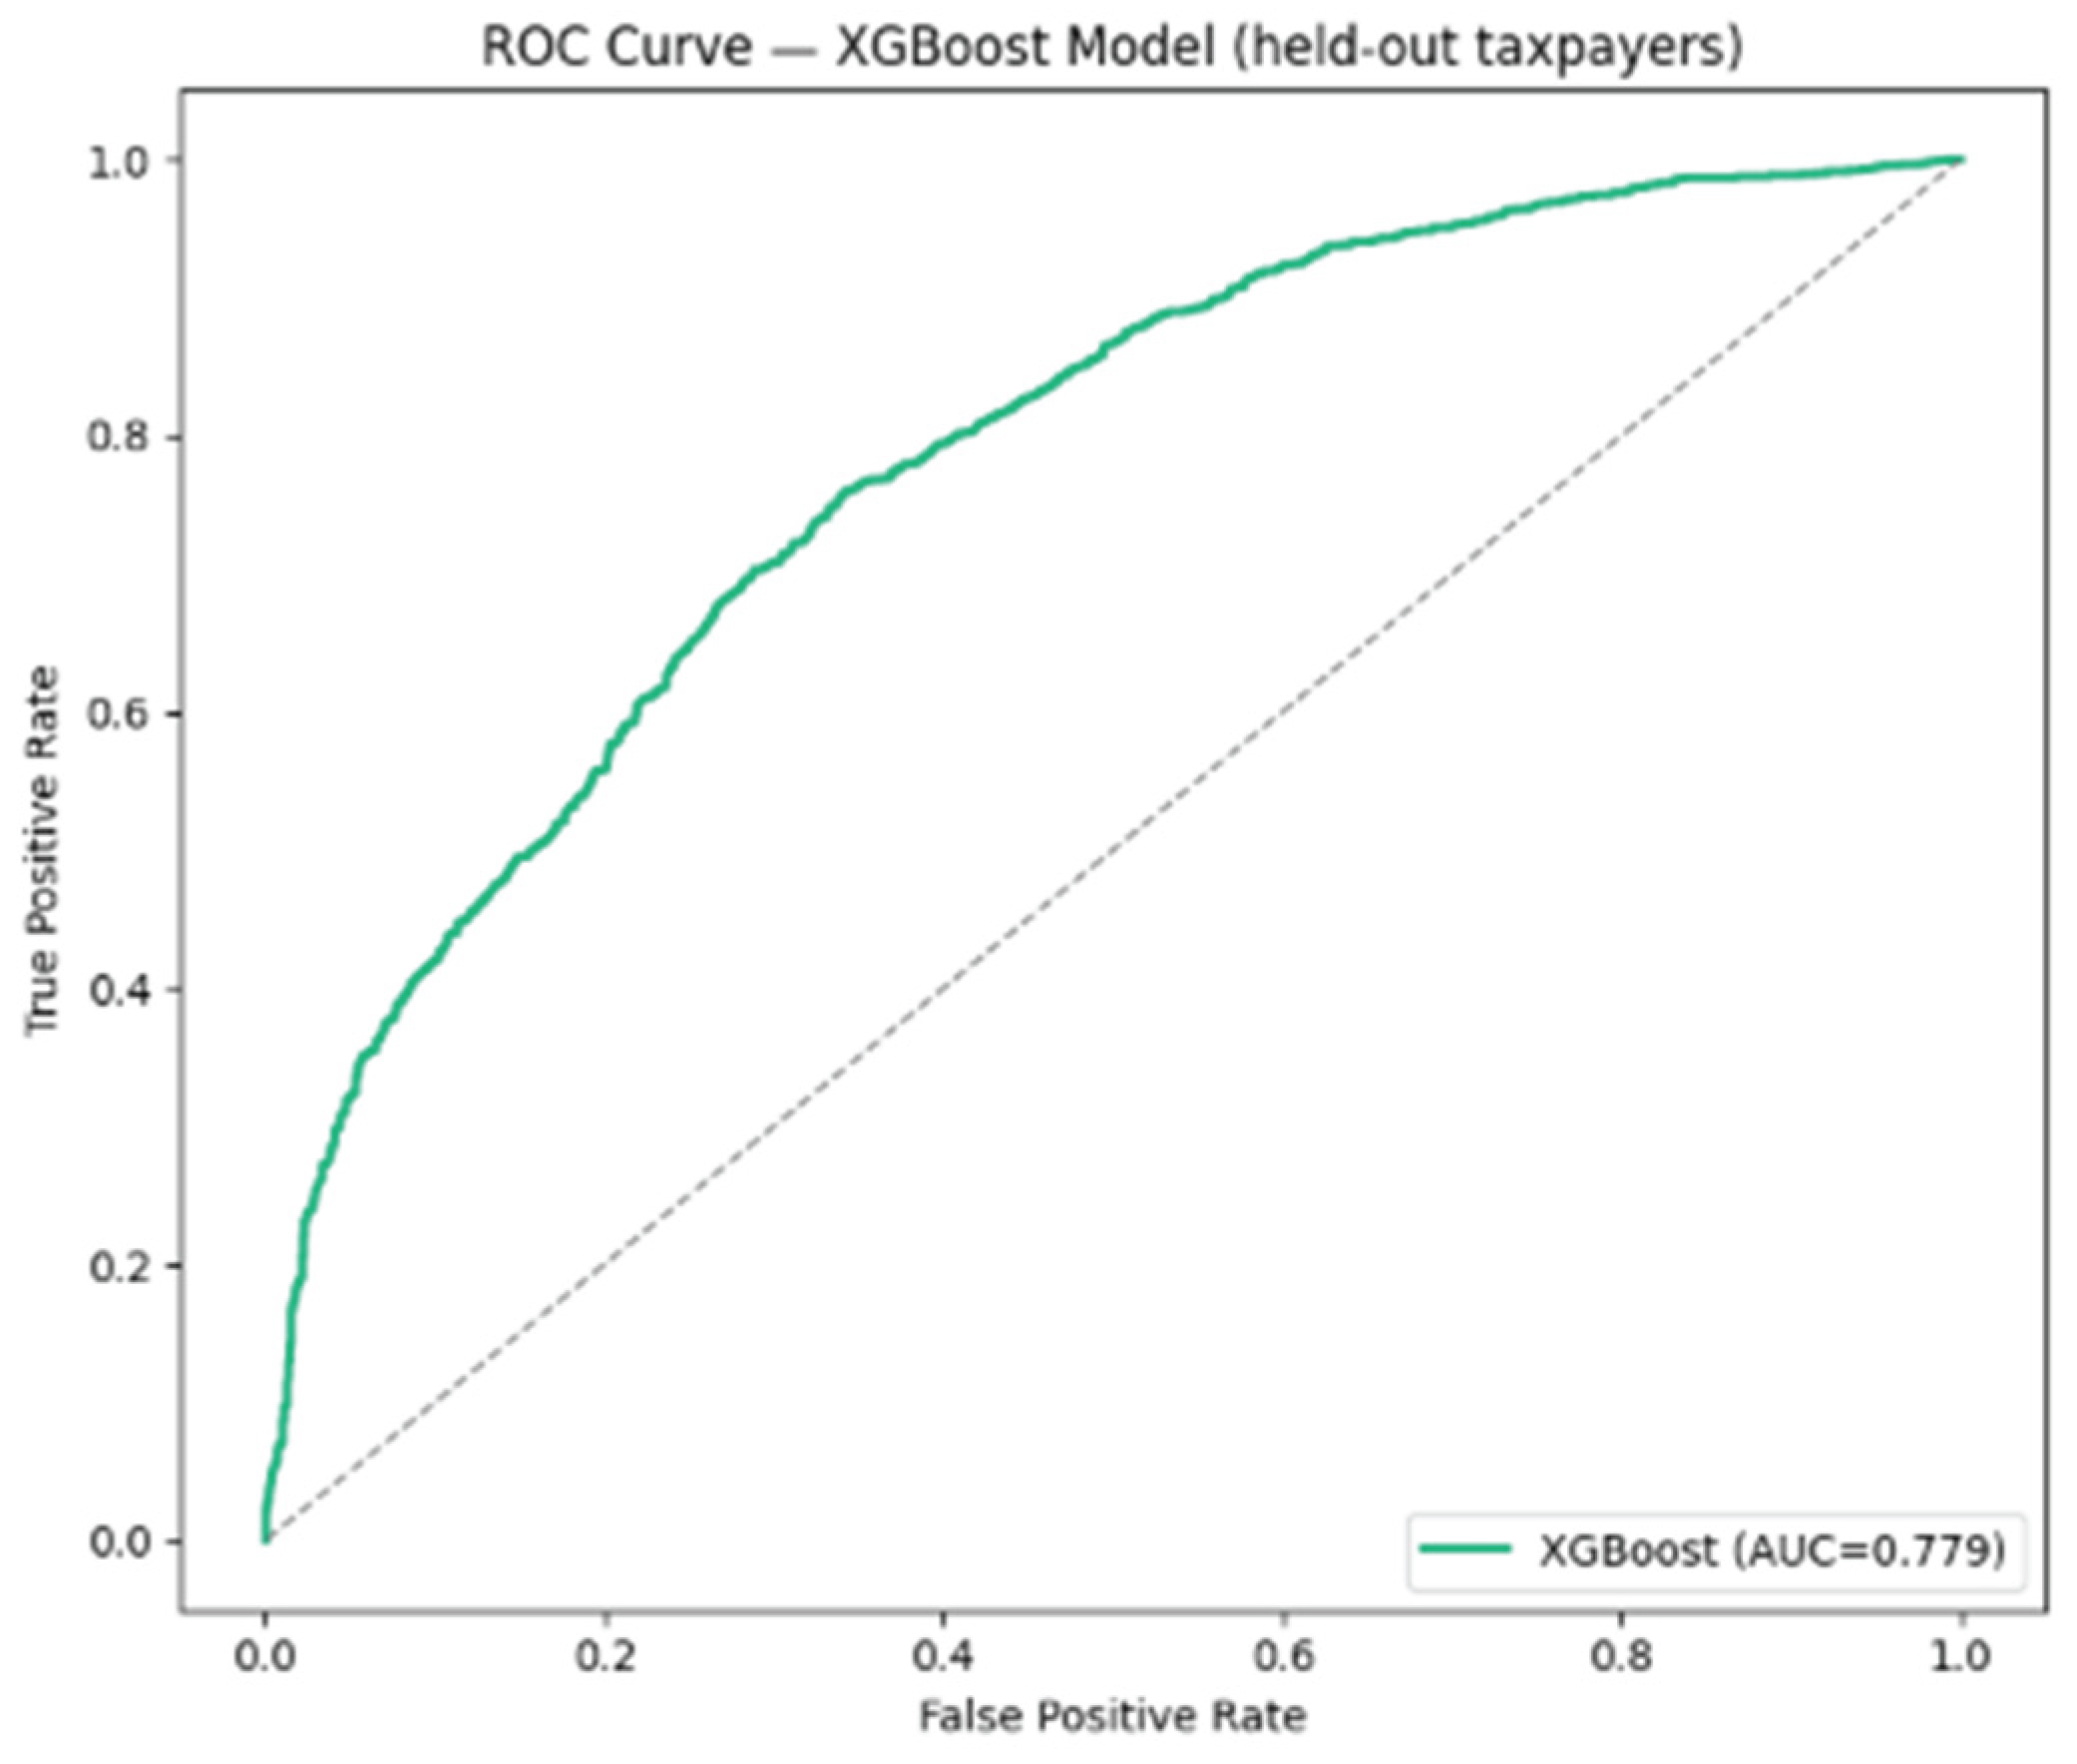
Figure 5.
SHAP summary plot for the XGBoost model (held-out test instances).
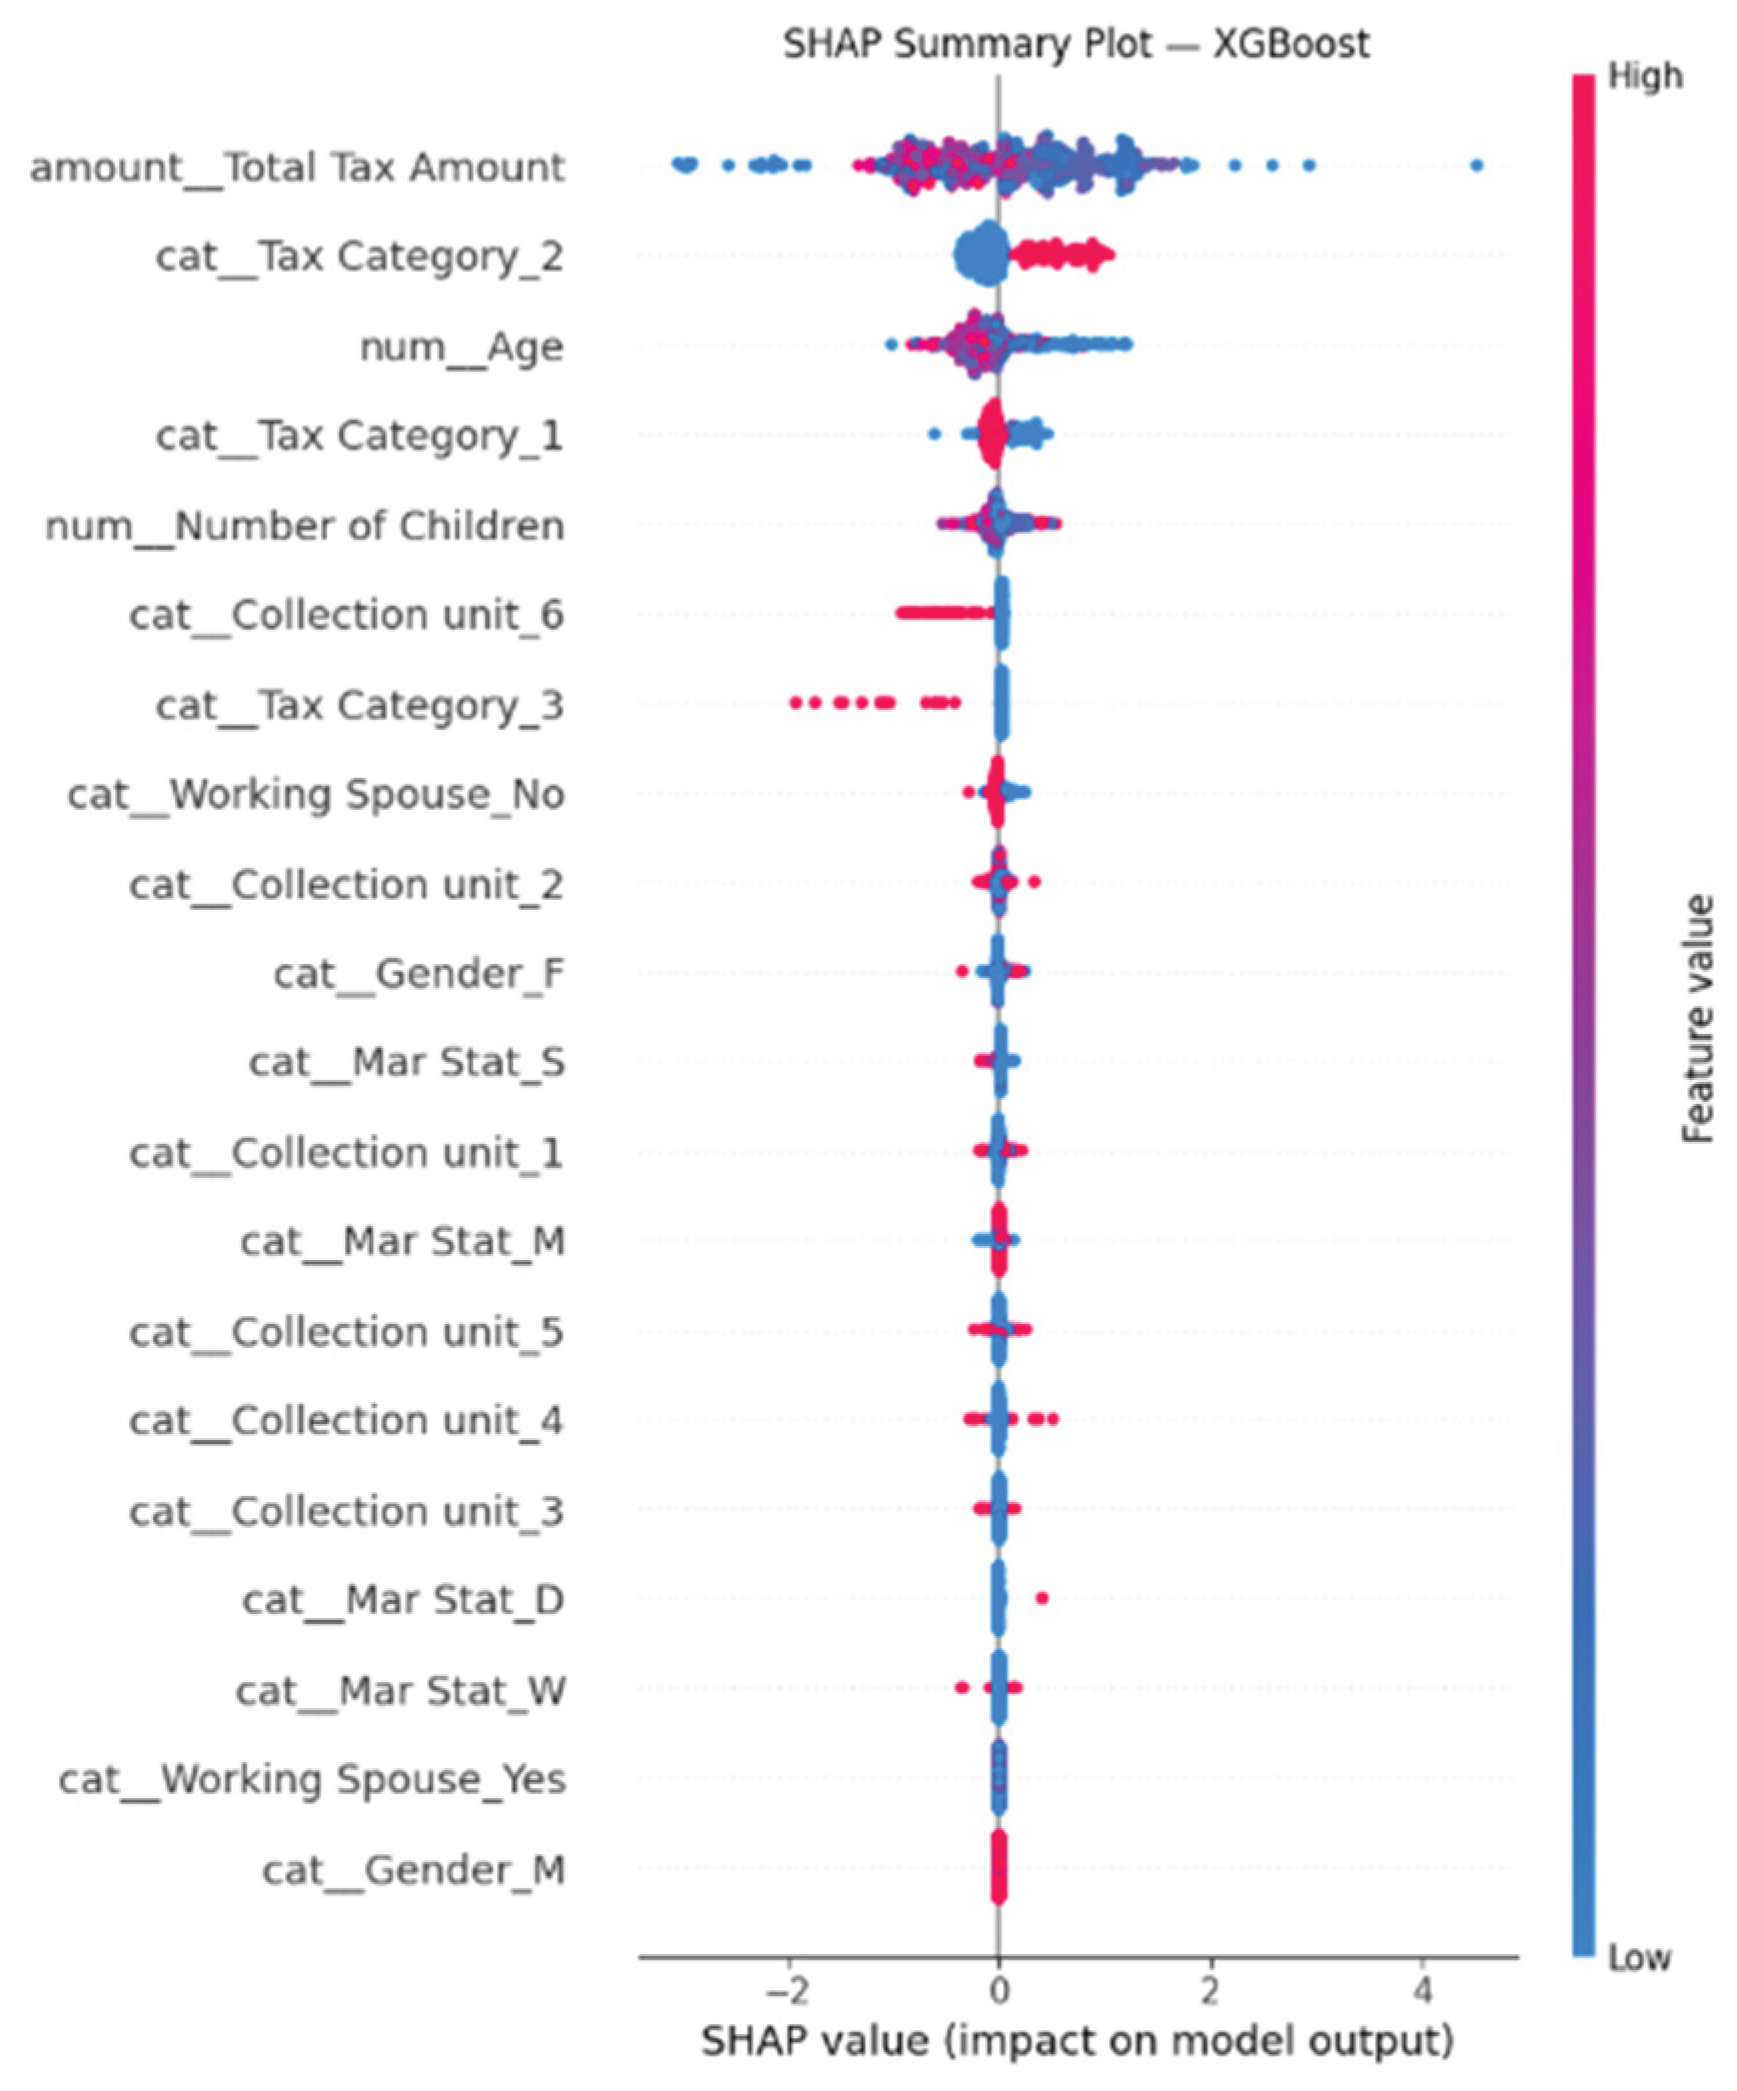
Figure 6.
XGBoost Gain-Based Feature Importance.
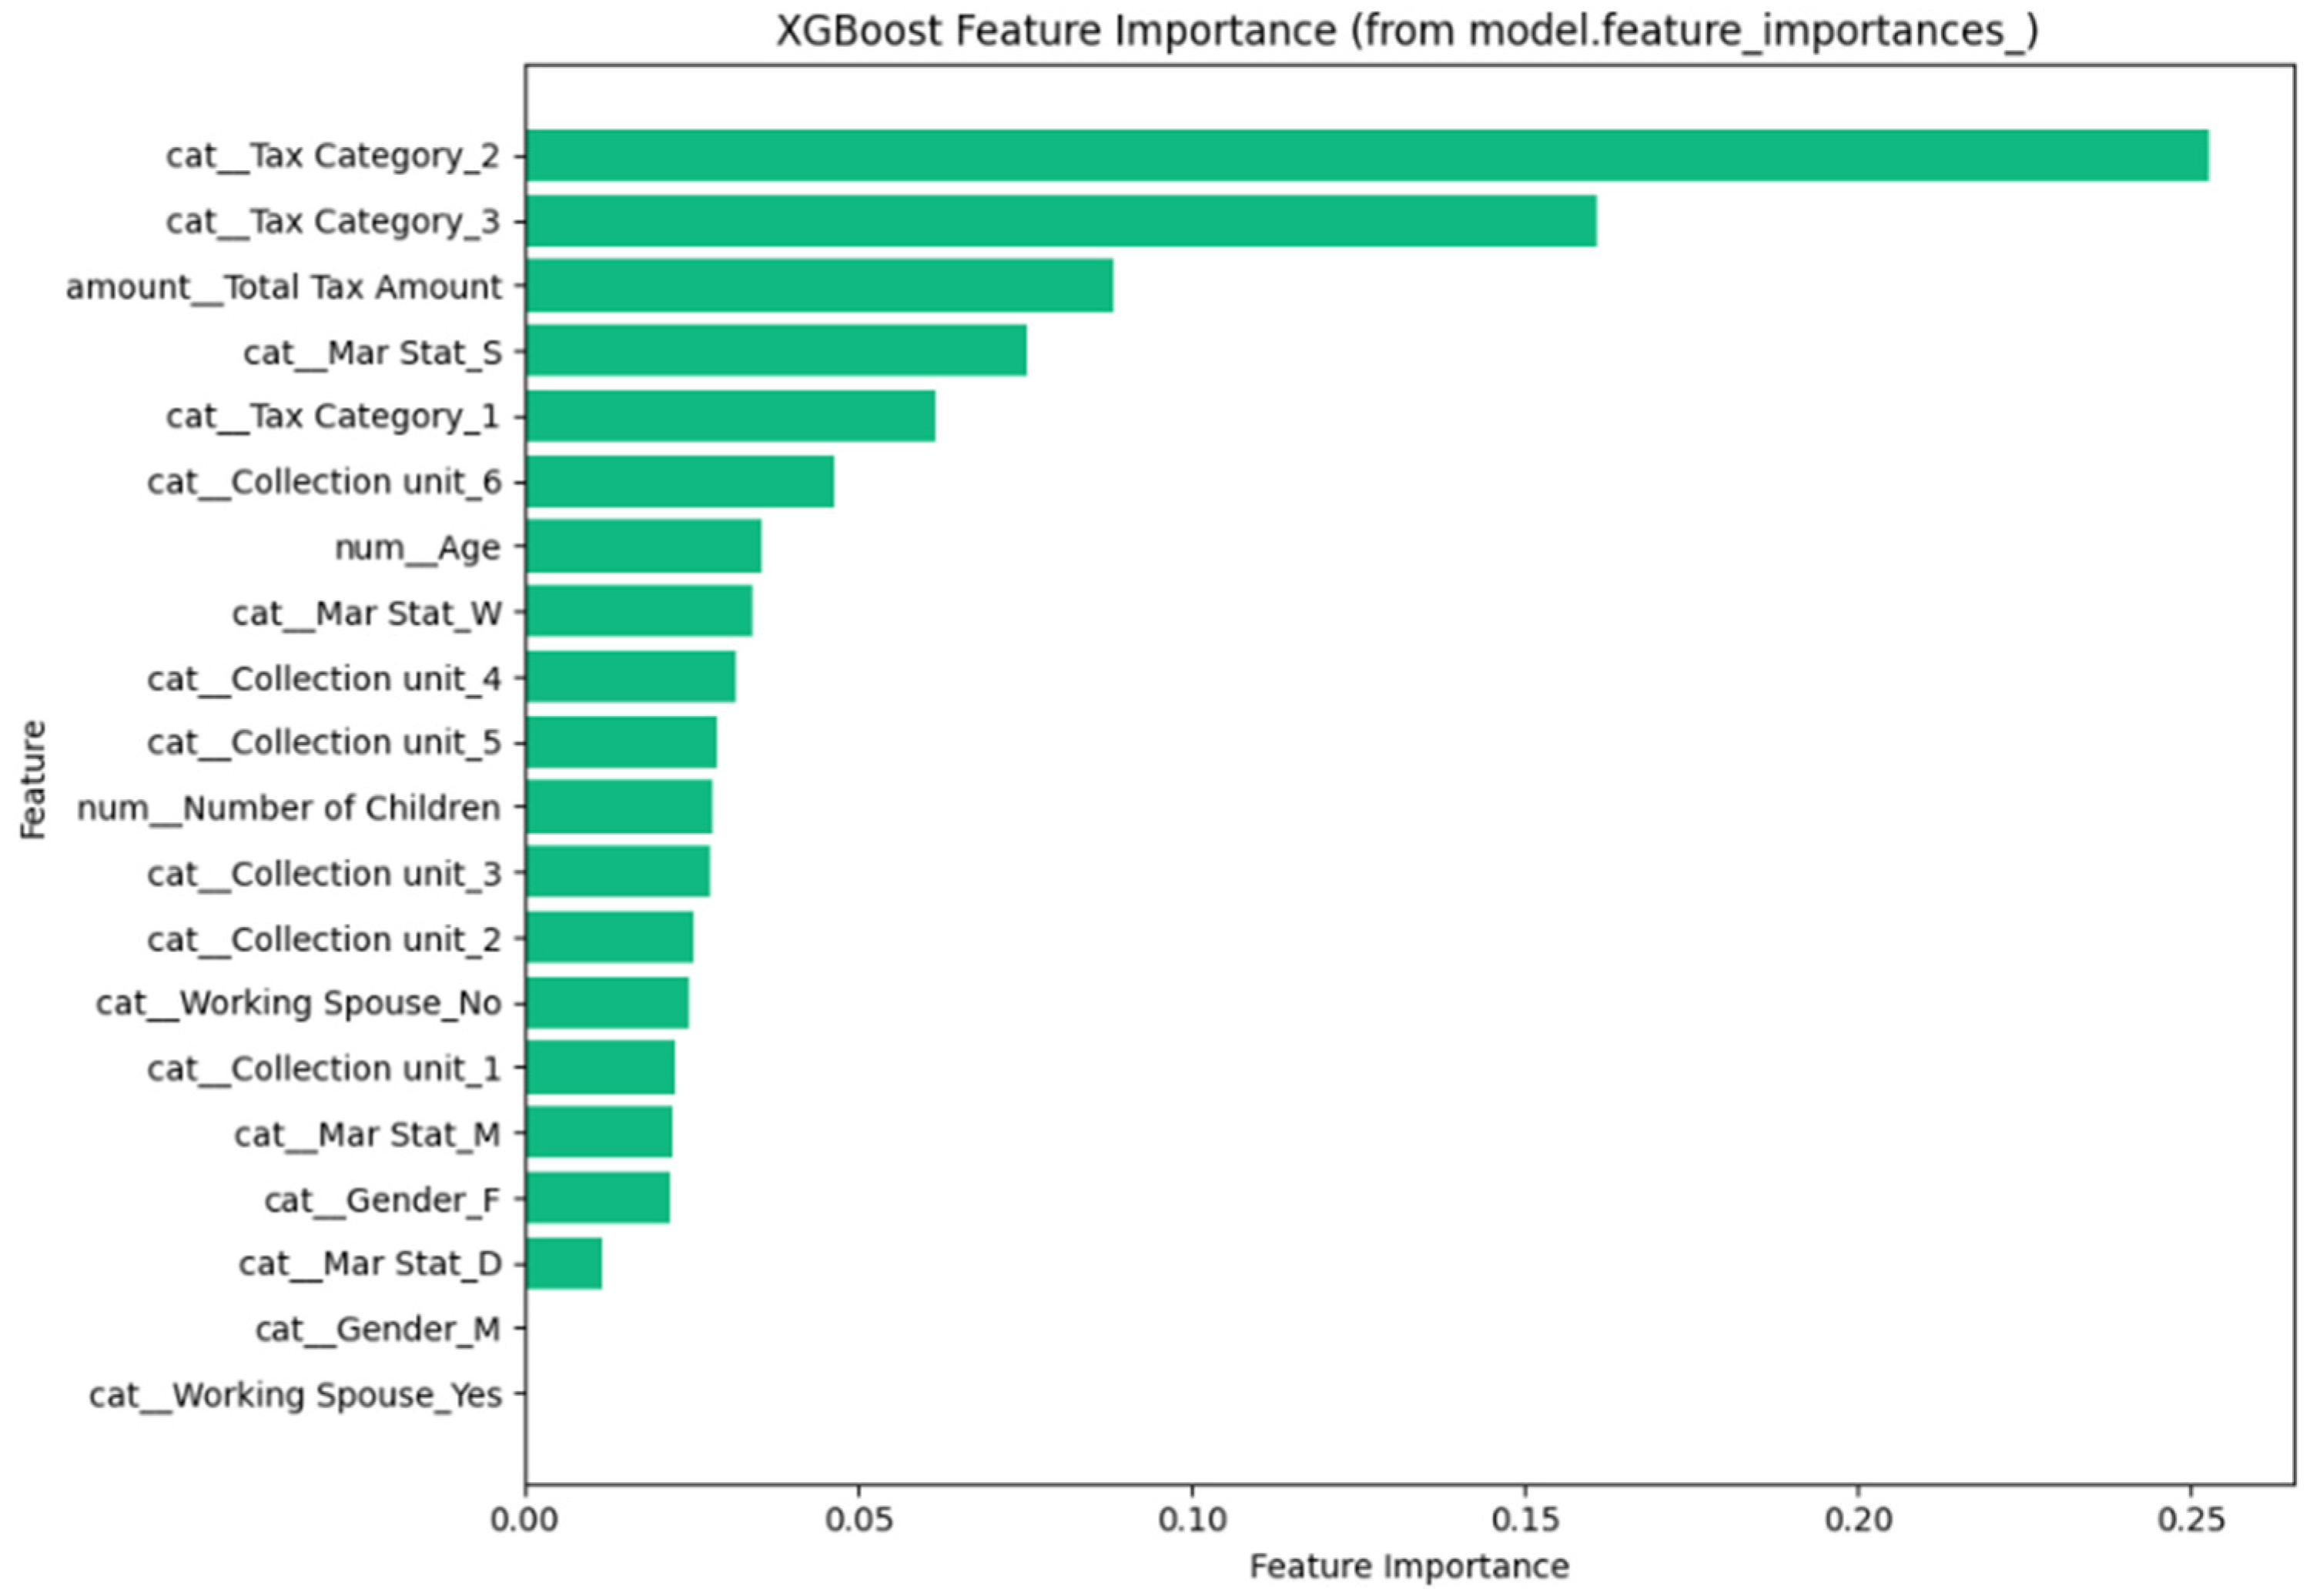

Table 1.
Features Description.
| Category | Feature | Description | Raw type | Domain / values |
|---|---|---|---|---|
| Economic | Tax Amount | Total PIT due to the obligation | Float | ≥ 0 |
| Tax Category | PIT chapter/category | Integer (1–3) | {1, 2, 3} | |
| Sociodemographic — Individual | Gender | Taxpayer gender | Categorical (binary) | {F, M} |
| Age | Age at issuance year | Integer | ≥ 18 | |
| Marital Status | Legal marital status | Categorical | {S (Single), M (Married), D (Divorced), W (Widowed)} |
|
| Collection Unit | Taxpayer’s address | Categorical (coded) | 1…K units | |
| Sociodemographic — Household | Number of Children | Count of dependent children | Integer | ≥ 0 |
| Working Spouse | Spouse has declared income | Binary | {0=No, 1=Yes} |
Table 2.
Held-out classification performance (taxpayer-disjoint test set, n = 2,670).
| Model | Accuracy | Precision | Recall | F1 | ROC-AUC |
|---|---|---|---|---|---|
| XGBoost | 0.702 | 0.676 | 0.723 | 0.699 | 0.779 |
| Random Forest | 0.682 | 0.663 | 0.680 | 0.672 | 0.757 |
| Decision Tree | 0.651 | 0.596 | 0.840 | 0.697 | 0.744 |
| Support Vector Machine (RBF) | 0.625 | 0.614 | 0.582 | 0.598 | 0.670 |
| Neural Network (MLP) | 0.620 | 0.636 | 0.477 | 0.545 | 0.668 |
Disclaimer/Publisher’s Note: The statements, opinions and data contained in all publications are solely those of the individual author(s) and contributor(s) and not of MDPI and/or the editor(s). MDPI and/or the editor(s) disclaim responsibility for any injury to people or property resulting from any ideas, methods, instructions or products referred to in the content. |
© 2026 by the authors. Licensee MDPI, Basel, Switzerland. This article is an open access article distributed under the terms and conditions of the Creative Commons Attribution (CC BY) license (http://creativecommons.org/licenses/by/4.0/).
Copyright: This open access article is published under a Creative Commons CC BY 4.0 license, which permit the free download, distribution, and reuse, provided that the author and preprint are cited in any reuse.