

Submitted:
21 July 2026
Posted:
23 July 2026
You are already at the latest version
Abstract
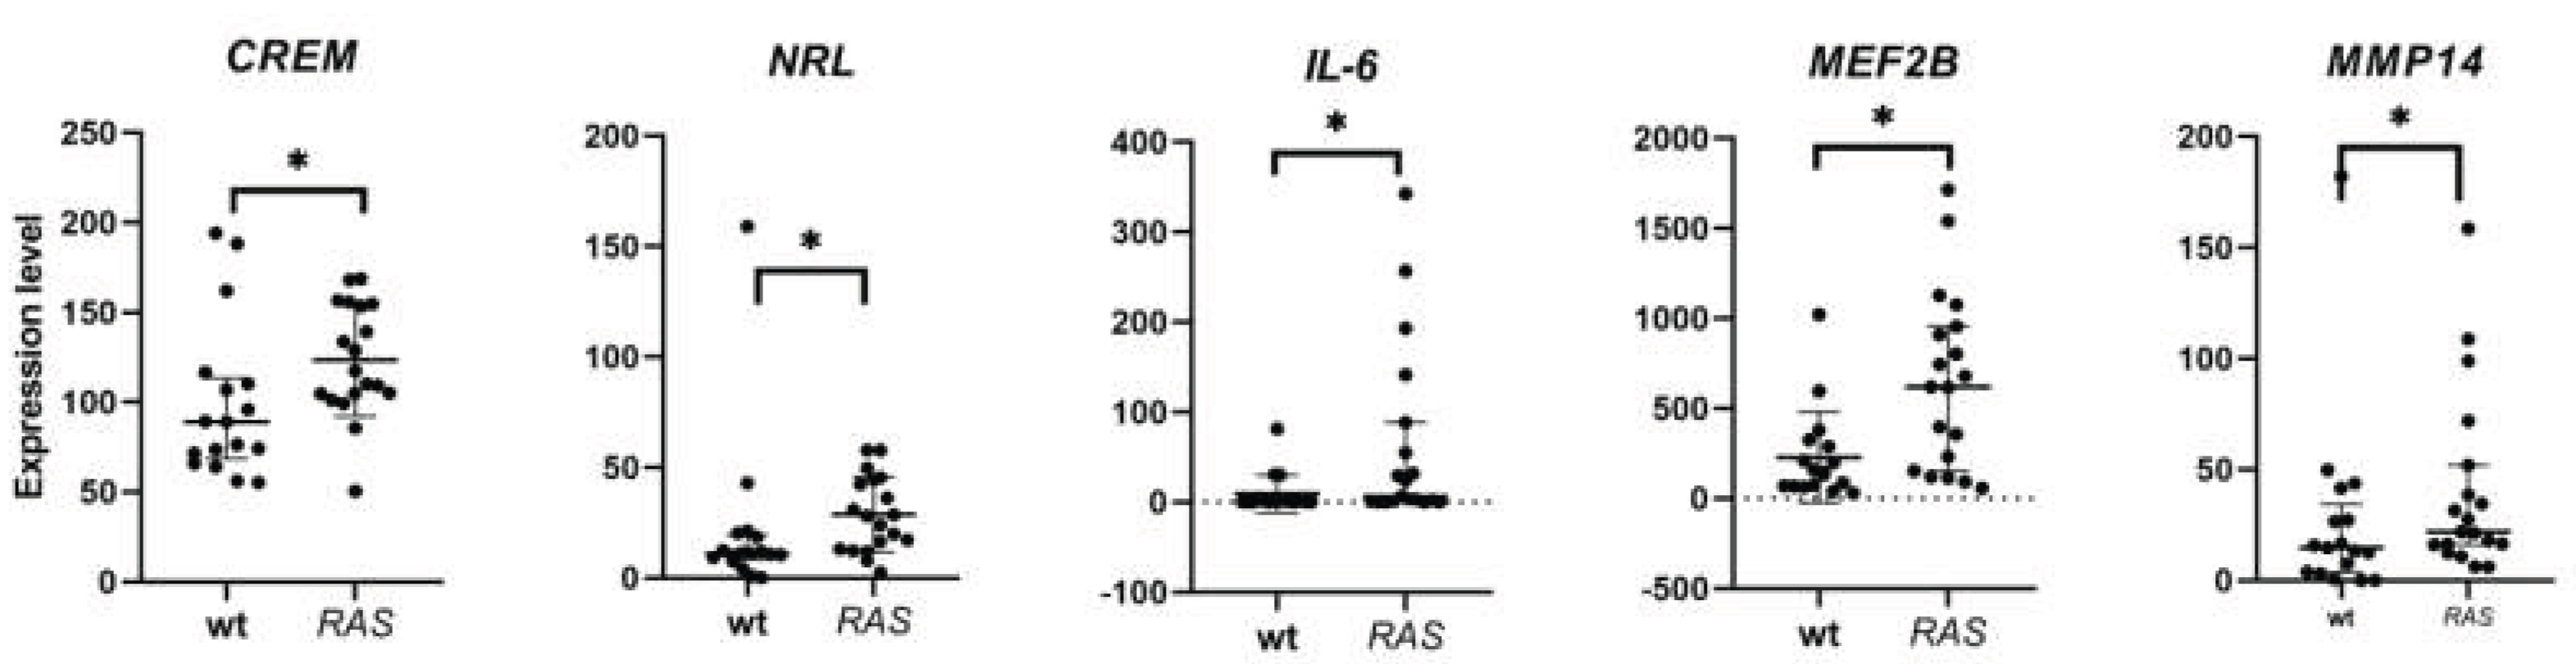
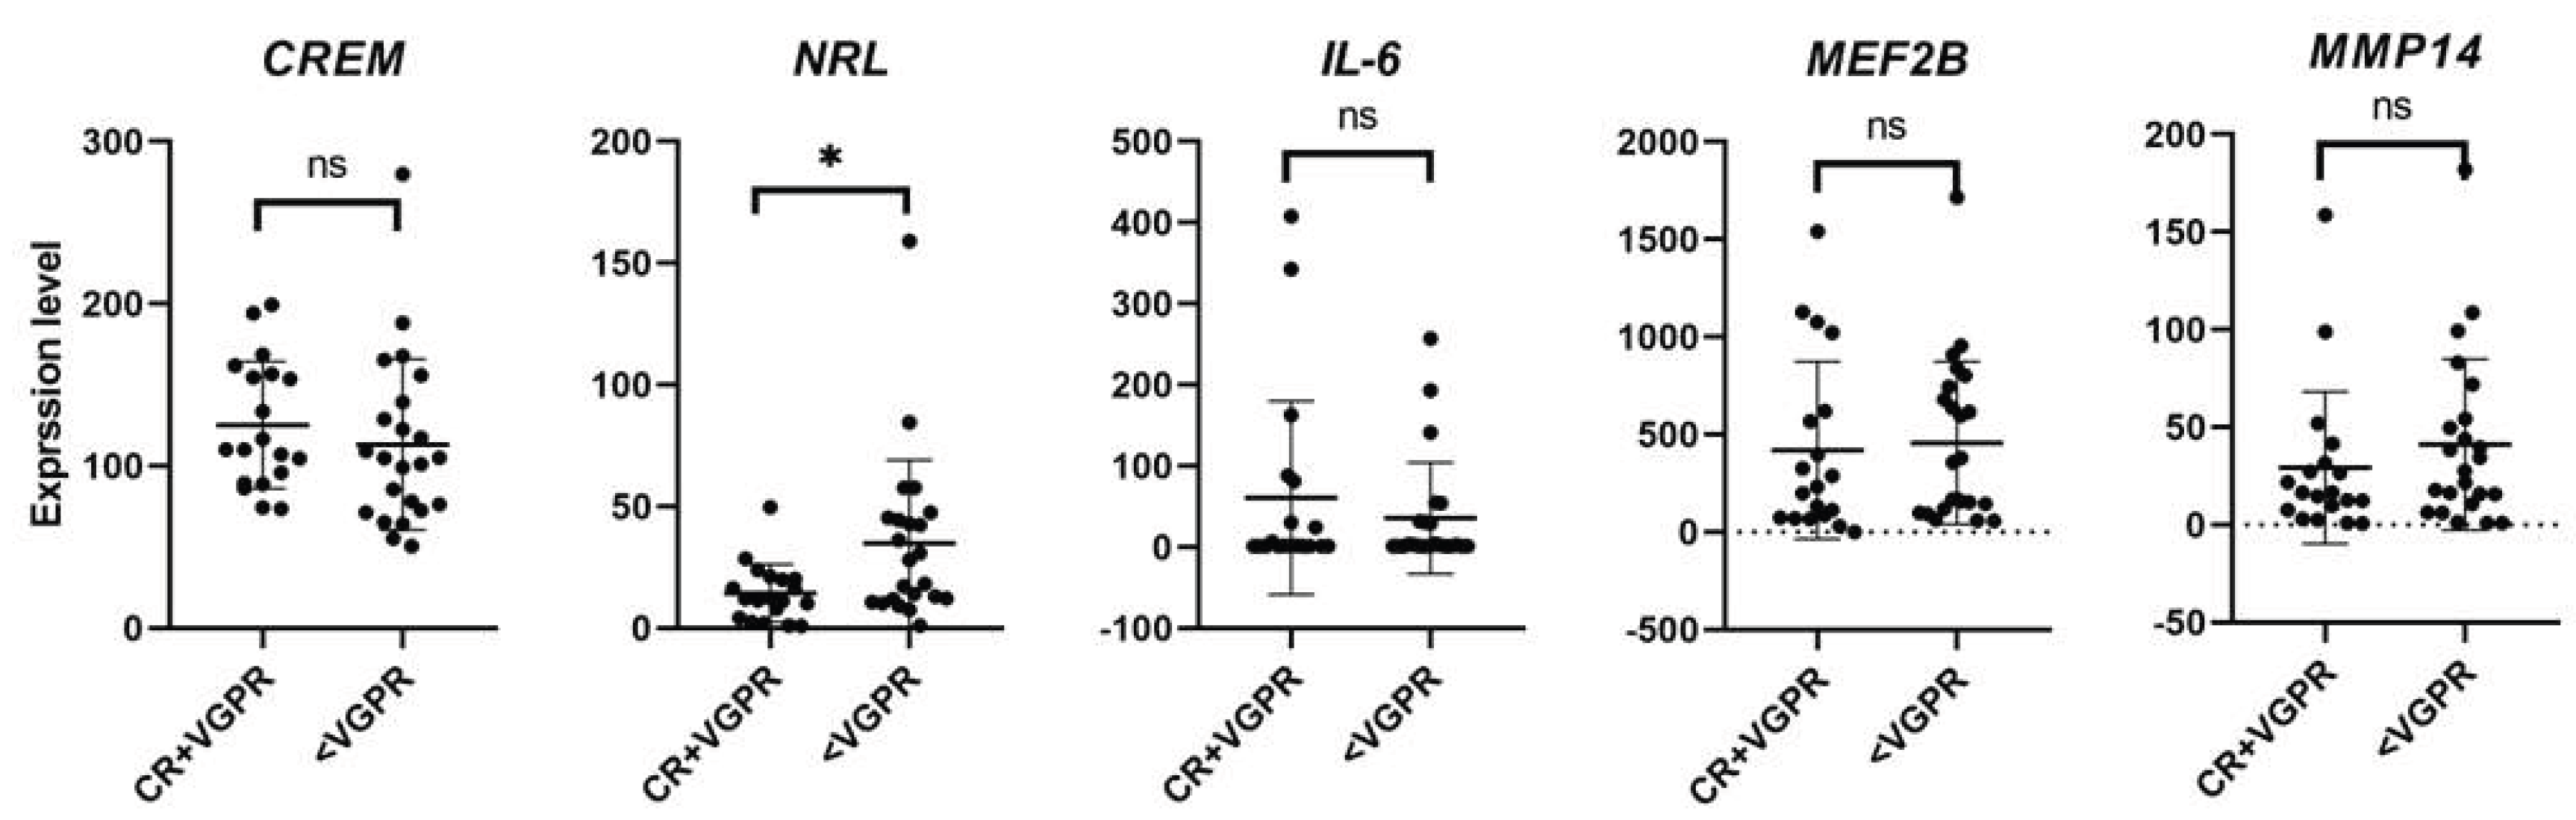
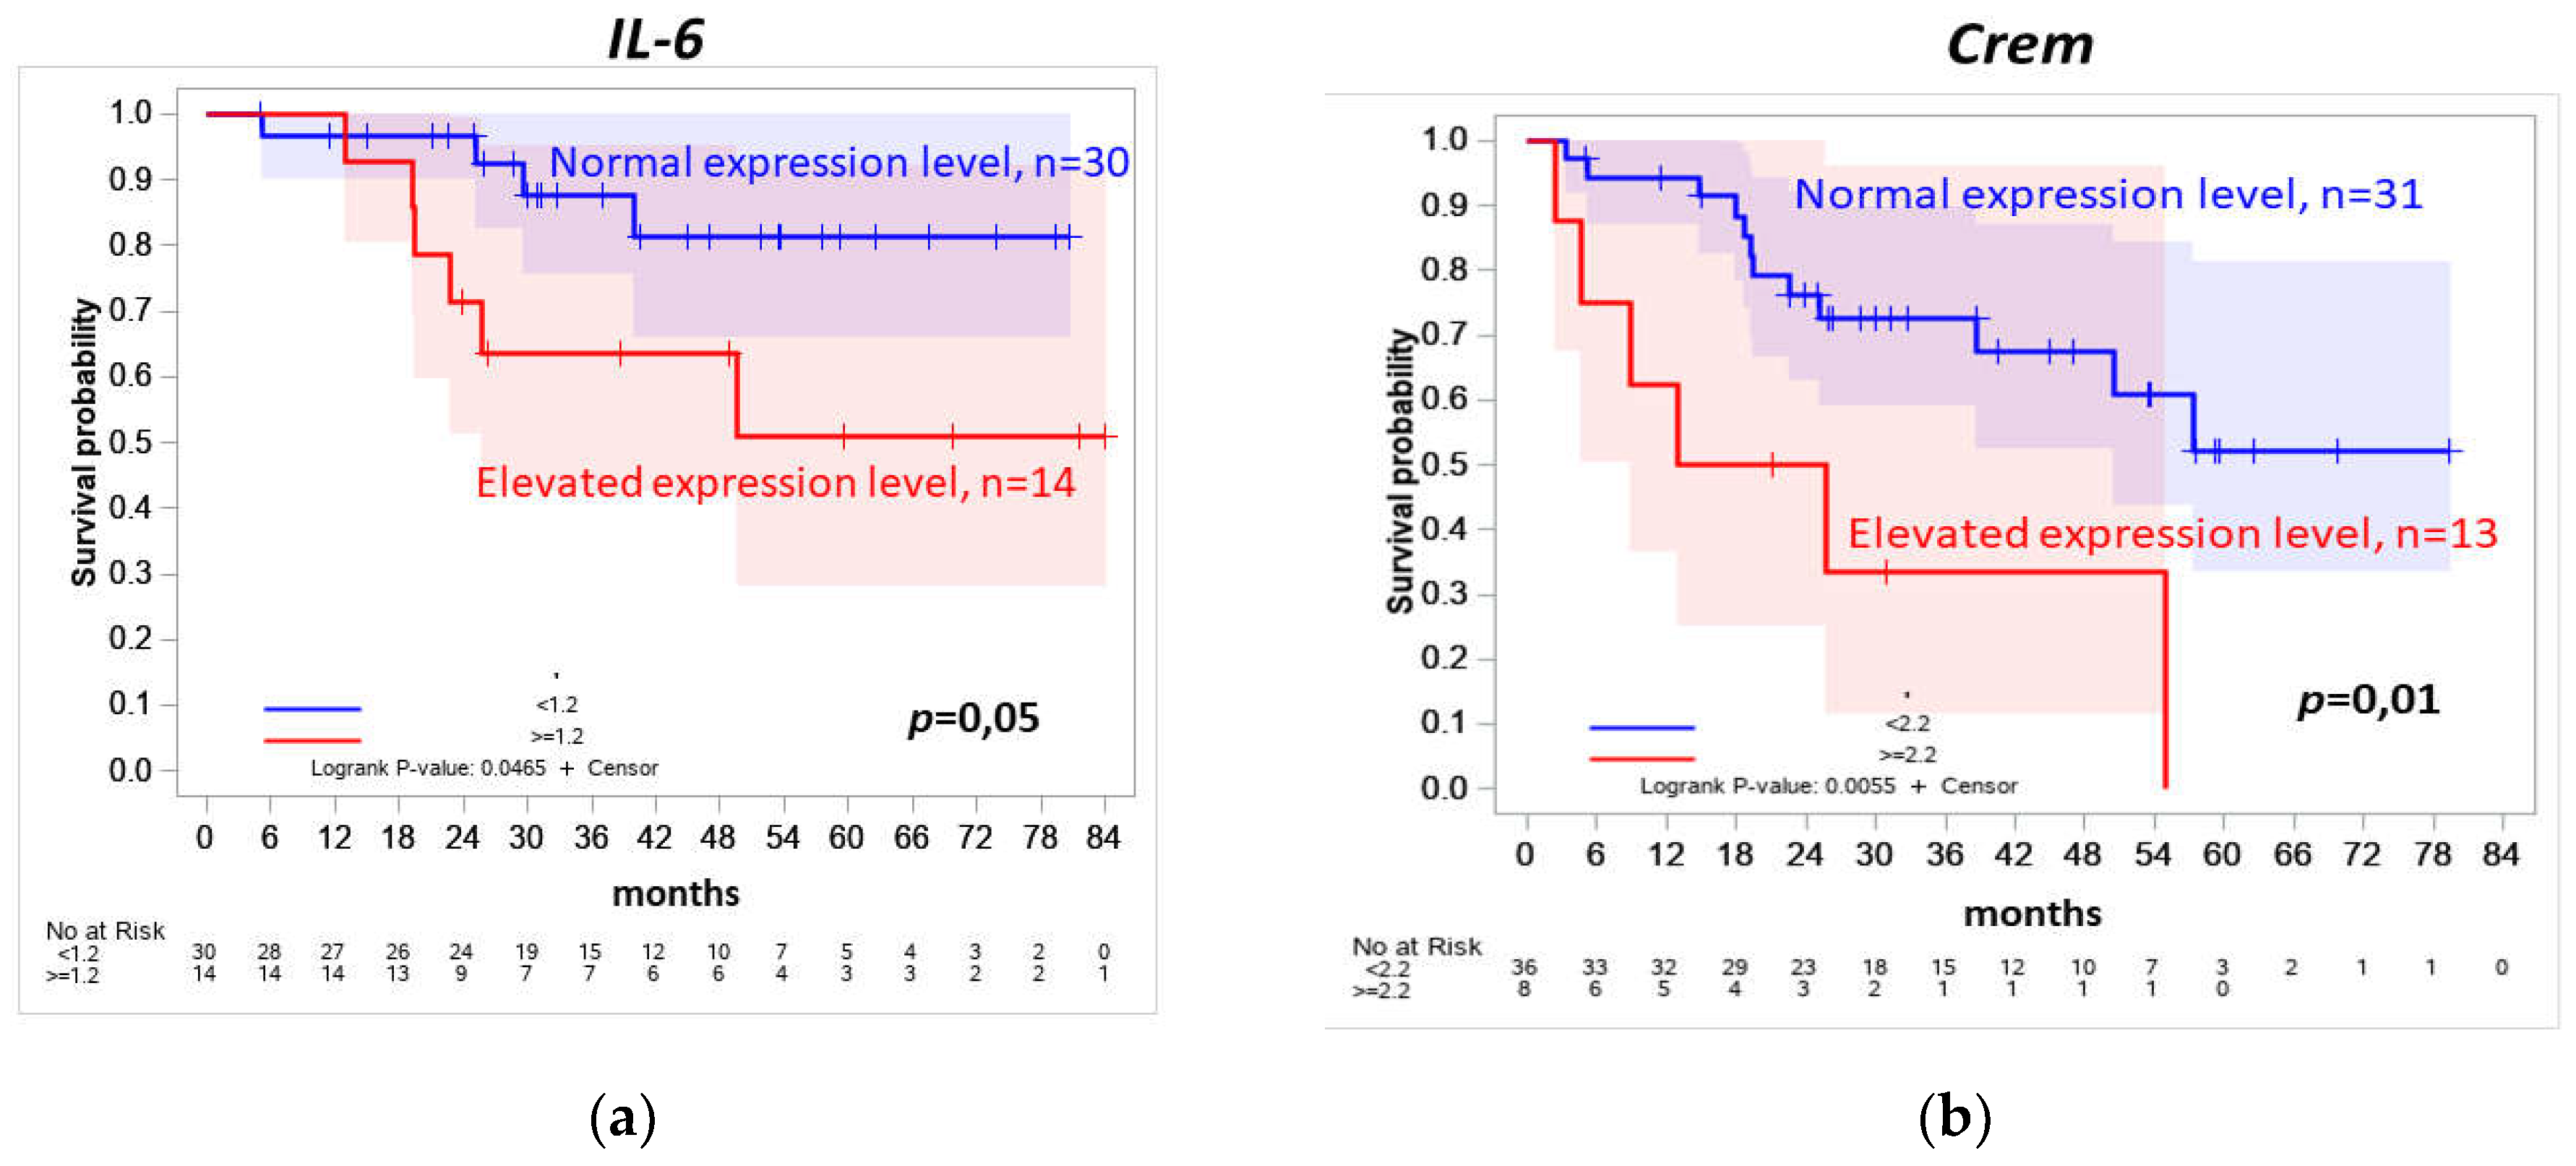
Background: Multiple myeloma (MM) is a biologically heterogeneous plasma cell malignancy with variable responses to induction therapy that are not fully explained by current risk stratification systems. Mutations in RAS family genes are prevalent in MM, yet contemporary risk stratification systems do not include them despite their oncogenic potential. Our previous findings showed reduced tumor cell sensitivity to bortezomib-containing triplet induction regimens in the presence of RAS mutations. The aim of this study is to identify RAS pathway–related molecular targets and evaluate their relationship with clinical outcomes. Methods: Forty-four patients with newly diagnosed MM received bortezomib-based induction therapy (VCD or PAD/VCD). Bone marrow CD138+ plasma cells were isolated for transcriptome analysis. KRAS and NRAS gene mutations were identified by Sanger sequencing, and RNA sequencing was performed on the Illumina HiSeq 3000 platform. Gene expression was analyzed using Salmon and DESeq2. The clinical endpoints were depth of response, progression-free survival (PFS), and overall survival (OS). Results: Of 66 candidate RAS-pathway genes examined, five—CREM, NRL, IL-6, MMP14 and MEB2B—showed significantly higher expression in samples with KRAS and NRAS gene mutations (t-test, p < 0.05). Lower NRL gene expression was associated with achieving a deep response (CR/VGPR; p = 0.02). Elevated IL6 gene expression correlated with poorer OS (HR 3.18; p = 0.05), while increased CREM gene expression was associated with shorter PFS (HR 2.62; p = 0.01). Conclusions: Increased expression of NRL, CREM, and IL6 genes could serve as potential prognostic biomarkers in MM and may reflect the molecular mechanisms underlying the adverse effects of KRAS and NRAS gene mutations.
Keywords:
1. Introduction
2. Results
2.1. Identification of Differentially Expressed Genes Associated with Mutations in the NRAS/KRAS Genes in Tumor Cells of Patients with Multiple Myeloma
2.2. Association of IL-6, CREM, NRL, MMP14, and MEF2B Gene Expression Levels with Therapy Response of MM Patients
2.3. The Association of IL-6, CREM, NRL, MMP14 and MEF2B Gene Expression Levels with MM Outcome
3. Discussion
4. Materials and Methods
4.1. Patients
4.2. Isolation of Tumor Cells
4.3. Sequencing of NRAS/KRAS Genes
4.4. RNA Sequencing
4.5. Statistical Analysis
5. Conclusions
Author Contributions
Funding
Institutional Review Board Statement
Informed Consent Statement
Data Availability Statement
Acknowledgments
Conflicts of Interest
Abbreviations
| MM | Multiple myeloma |
| BM | Bone marrow |
| PCs | Plasma cells |
| RAS | Rat sarcoma proto-oncogene family |
| KRAS | Kirsten rat sarcoma viral oncogene homolog |
| NRAS | Neuroblastoma RAS viral oncogene homolog |
| ERK | Extracellular signal-regulated kinase |
| PI3K | Phosphoinositide 3-kinase |
| AKT | Protein kinase B |
| NF-κB | Nuclear factor kappa B |
| IL-6 | Interleukin-6 |
| VCD | Bortezomib, cyclophosphamide, dexamethasone |
| PAD | Bortezomib, doxorubicin, dexamethasone |
| PFS | Progression-free survival |
| OS | Overall survival |
| CR | Complete response |
| VGPR | Very good partial response |
| PR | Partial response |
| IMWG | International Myeloma Working Group |
| ISS | International Staging System |
| R-ISS | Revised International Staging System |
| ROC | Receiver operating characteristic |
| HR | Hazard ratio |
| CI | Confidence interval |
| IQR | Interquartile range |
| PCR | Polymerase chain reaction |
| RNA | Ribonucleic acid |
| DNA | Deoxyribonucleic acid |
| GEO | Gene Expression Omnibus |
| FASTQ | FASTQ sequence format |
| VST | Variance-stabilizing transformation |
| HGNC | HUGO Gene Nomenclature Committee |
| DEPC | Diethyl pyrocarbonate |
Appendix A

| Gene | Patients without NRAS/KRAS mutations, mean | Patients with NRAS/KRAS mutations, mean | Significance level, p value |
Patients without NRAS/KRAS mutations, SD | Patients with NRAS/KRAS mutations, SD |
|---|---|---|---|---|---|
| с-JUN | 9.08 | 9.24 | 0.65 | 1.07 | 1.00 |
| JUNB | 8.29 | 8.12 | 0.68 | 1.24 | 1.17 |
| JUND | 8.29 | 8.52 | 0.39 | 0.83 | 0.73 |
| c-FOS | 8.90 | 9.27 | 0.16 | 0.82 | 0.74 |
| FOSB | 9.69 | 9.85 | 0.53 | 0.83 | 0.70 |
| Fra-1 | 2.61 | 2.69 | 0.86 | 1.19 | 1.28 |
| Fra-2 | 5.96 | 5.61 | 0.35 | 1.34 | 0.88 |
| CREB | 6.17 | 6.02 | 0.38 | 0.27 | 0.66 |
| CREM | 4.52 | 4.78 | 0.03 | 0.39 | 0.29 |
| ATF-1 | 4.80 | 4.76 | 0.85 | 0.55 | 0.46 |
| CREB-2 (ATF-4) | 8.47 | 8.37 | 0.50 | 0.38 | 0.49 |
| CREB-3 | 6.04 | 6.13 | 0.47 | 0.38 | 0.34 |
| CREB-5 | 3.65 | 4.35 | 0.25 | 1.98 | 1.55 |
| ATF-2 (CRE-BP1) | 6.10 | 6.23 | 0.14 | 0.27 | 0.26 |
| ATF-3 | 5.89 | 6.09 | 0.61 | 1.21 | 1.09 |
| ATF-5 (ATFX) | 6.22 | 6.23 | 0.99 | 1.39 | 1.31 |
| ATF-6 | 7.10 | 7.03 | 0.69 | 0.57 | 0.41 |
| ATF-7 | 5.72 | 6.04 | 0.09 | 0.56 | 0.53 |
| B-ATF | 1.26 | 1.24 | 0.97 | 1.82 | 1.77 |
| MAF | 4.46 | 4.18 | 0.71 | 2.30 | 2.22 |
| MAFA | 0.71 | 1.39 | 0.10 | 0.82 | 1.45 |
| MAFB | 3.99 | 3.78 | 0.75 | 2.24 | 1.52 |
| NRL | 2.38 | 3.13 | 0.03 | 1.19 | 0.78 |
| CCND1 | 5.39 | 7.44 | 0.06 | 3.25 | 3.13 |
| VEGF | 6.69 | 6.50 | 0.33 | 0.54 | 0.56 |
| EGFR | 0.32 | 0.43 | 0.73 | 0.84 | 1.03 |
| FGFR1 | 4.38 | 4.34 | 0.84 | 0.73 | 0.61 |
| BCL2 | 7.85 | 7.69 | 0.34 | 0.55 | 0.46 |
| BCL2L1 | 6.73 | 6.63 | 0.59 | 0.39 | 0.65 |
| BCL2L2 | 5.40 | 5.52 | 0.48 | 0.42 | 0.60 |
| MCL1 | 9.73 | 9.49 | 0.15 | 0.43 | 0.55 |
| BAX | 5.39 | 5.60 | 0.20 | 0.52 | 0.44 |
| BCL2A1 | 3.56 | 3.08 | 0.40 | 1.67 | 1.68 |
| BAK1 | 5.71 | 5.68 | 0.82 | 0.50 | 0.47 |
| BOK | 0.15 | 0.53 | 0.19 | 0.64 | 1.01 |
| BCL2L10 | 0.77 | 0.69 | 0.80 | 0.95 | 0.87 |
| BCL2L12 | 4.34 | 4.68 | 0.30 | 1.29 | 0.55 |
| BCL2L13 | 5.86 | 5.82 | 0.71 | 0.28 | 0.38 |
| BCL2L14 | 3.88 | 3.58 | 0.23 | 0.67 | 0.78 |
| BCL2L15 | 4.97 | 5.05 | 0.79 | 0.71 | 0.95 |
| BNIP2 | 6.53 | 6.35 | 0.18 | 0.36 | 0.42 |
| BCLXL | 6.73 | 6.63 | 0.59 | 0.39 | 0.65 |
| BIRC5 | 4.52 | 4.61 | 0.62 | 0.46 | 0.51 |
| IL-6 | 0.93 | 2.40 | 0.02 | 1.42 | 2.17 |
| IL6R | 7.46 | 7.11 | 0.35 | 1.10 | 1.14 |
| TNF-alpha | 2.32 | 2.37 | 0.95 | 2.33 | 2.26 |
| MMP2 | 0.85 | 1.26 | 0.34 | 1.26 | 1.28 |
| MMP8 | 4.03 | 3.73 | 0.64 | 1.29 | 2.30 |
| MMP9 | 4.29 | 4.55 | 0.69 | 1.66 | 2.06 |
| MMP11 | 4.06 | 3.98 | 0.71 | 0.40 | 0.78 |
| MMP13 | 0.80 | 0.91 | 0.70 | 0.63 | 0.95 |
| MMP14 | 2.39 | 3.29 | 0.04 | 1.54 | 0.92 |
| MMP15 | 1.20 | 1.18 | 0.97 | 1.63 | 1.54 |
| MMP16 | 2.46 | 2.22 | 0.76 | 2.42 | 2.28 |
| MMP17 | 0.96 | 1.34 | 0.48 | 1.30 | 1.85 |
| MMP19 | 2.56 | 2.34 | 0.70 | 1.76 | 1.64 |
| MMP21 | 1.66 | 2.03 | 0.27 | 0.99 | 0.98 |
| MMP23B | 1.71 | 2.22 | 0.22 | 0.92 | 1.40 |
| MMP25 | 2.99 | 3.21 | 0.73 | 1.79 | 1.91 |
| C-MYC | 7.16 | 6.37 | 0.06 | 1.29 | 1.18 |
| p21 | 7.31 | 7.55 | 0.38 | 0.73 | 0.86 |
| p27 | 6.80 | 6.93 | 0.46 | 0.46 | 0.55 |
| MEF2A | 6.75 | 6.66 | 0.37 | 0.31 | 0.25 |
| MEF2B | 4.99 | 6.08 | 0.00 | 0.96 | 1.03 |
| MEF2C | 8.02 | 7.92 | 0.65 | 0.73 | 0.47 |
| MEF2D | 7.65 | 7.86 | 0.08 | 0.33 | 0.38 |
| Samples | Gene expression level, VST- normalized gene counts | ||||
|---|---|---|---|---|---|
| CREM | NRL | IL-6 | MMP14 | MEF2B | |
| D1 | 1.91 | 1.00 | 1.13 | 1.46 | 1.75 |
| D11 | 1.73 | 0.40 | 0.91 | 1.79 | 1.93 |
| D2 | 1.93 | 1.05 | 1.16 | 0.54 | 1.84 |
| D3 | 2.09 | 1.52 | 1.11 | 1.94 | 2.38 |
| D5 | 2.14 | 1.32 | 0.63 | 2.11 | 2.19 |
| D7 | 1.83 | 1.39 | 1.22 | 1.90 | 2.33 |
| D9 | 1.99 | 1.17 | 0.85 | 1.74 | 2.09 |
| Gene expression level (max) | 2.14 | 1.52 | 1.22 | 2.11 | 2.38 |
References
- Canevarolo, R.R.; Sudalagunta, P.R.; Meads, M.B.; Silva, M.; Zhao, X.; Magaletti, D.; Alugubelli, R.R.; DeAvila, G.; DeAvila, D.; Persi, E.; et al. Integrated Genomic and Epigenomic Analysis Reveals Epigenetic Plasticity in Disease Progression and Multidrug Resistance in Multiple Myeloma. Cancer Res. 2026. [Google Scholar] [CrossRef] [PubMed]
- Avet-Loiseau, H.; Davies, F.E.; Samur, M.K.; Corre, J.; D’Agostino, M.; Kaiser, M.F.; Raab, M.S.; Weinhold, N.; Gutierrez, N.C.; Paiva, B.; et al. International Myeloma Society/International Myeloma Working Group Consensus Recommendations on the Definition of High-Risk Multiple Myeloma. J. Clin. Oncol. Off. J. Am. Soc. Clin. Oncol. 2025, 43, 2739–2751. [Google Scholar] [CrossRef] [PubMed]
- Zhang, G.; Sun, N.; Chawla, Y.; Jevremovic, D.; Taro, H.; Kumar, S.K.; Gonsalves, W.I.; Walch, A.K. Metabolic Heterogeneity and Niche Rewiring in Bone Marrow Plasma Cells from Patients with MGUS, Solitary Bone Plasmacytoma and Multiple Myeloma. Blood Cancer J. 2026. [Google Scholar] [CrossRef] [PubMed]
- Gómez-Echarte, N.; San José-Enériz, E.; Urizar-Compains, E.; Rodriguez-Otero, P.; Prósper, F.; Agirre, X. Multiple Myeloma: A Tale of Deregulated Transcription Factors. HemaSphere 2026, 10, e70411. [Google Scholar] [CrossRef] [PubMed]
- Liu, E.; Jaouadi, O.; Sharma, R.; Becker, N.; Johnson, T.S.; Sudha, P.; Chopra, V.S.; Zafar, F.; Hamidi, H.; Pawlyn, C.; et al. Utilizing Genomics to Identify Novel Immunotherapeutic Targets in Multiple Myeloma High-Risk Subgroups. Genome Med. 2025, 17, 79. [Google Scholar] [CrossRef] [PubMed]
- Avet-Loiseau, H.; Davies, F.E.; Samur, M.K.; Corre, J.; D’Agostino, M.; Kaiser, M.F.; Raab, M.S.; Weinhold, N.; Gutierrez, N.C.; Paiva, B.; et al. International Myeloma Society/International Myeloma Working Group Consensus Recommendations on the Definition of High-Risk Multiple Myeloma. J. Clin. Oncol. Off. J. Am. Soc. Clin. Oncol. 2025, 43, 2739–2751. [Google Scholar] [CrossRef] [PubMed]
- D’Agostino, M.; Cairns, D.A.; Lahuerta, J.J.; Wester, R.; Bertsch, U.; Waage, A.; Zamagni, E.; Mateos, M.-V.; Dall’Olio, D.; van de Donk, N.W.C.J.; et al. Second Revision of the International Staging System (R2-ISS) for Overall Survival in Multiple Myeloma: A European Myeloma Network (EMN) Report Within the HARMONY Project. J. Clin. Oncol. Off. J. Am. Soc. Clin. Oncol. 2022, 40, 3406–3418. [Google Scholar] [CrossRef] [PubMed]
- Rajkumar, S.V. Multiple Myeloma: 2024 Update on Diagnosis, Risk-Stratification, and Management. Am. J. Hematol. 2024, 99, 1802–1824. [Google Scholar] [CrossRef] [PubMed]
- Rees, M.J.; Kumar, S. High-Risk Multiple Myeloma: Redefining Genetic, Clinical, and Functional High-Risk Disease in the Era of Molecular Medicine and Immunotherapy. Am. J. Hematol. 2024, 99, 1560–1575. [Google Scholar] [CrossRef] [PubMed]
- Voorhees, P.M.; Kaufman, J.L.; Laubach, J.; Sborov, D.W.; Reeves, B.; Rodriguez, C.; Chari, A.; Silbermann, R.; Costa, L.J.; Anderson, L.D.; et al. Daratumumab, Lenalidomide, Bortezomib, and Dexamethasone for Transplant-Eligible Newly Diagnosed Multiple Myeloma: The GRIFFIN Trial. Blood 2020, 136, 936–945. [Google Scholar] [CrossRef] [PubMed]
- Corradini, P.; Ladetto, M.; Inghirami, G.; Boccadoro, M.; Pileri, A. N- and K-Ras Oncogenes in Plasma Cell Dyscrasias. Leuk. Lymphoma 1994, 15, 17–20. [Google Scholar] [CrossRef] [PubMed]
- Rasmussen, T.; Kuehl, M.; Lodahl, M.; Johnsen, H.E.; Dahl, I.M.S. Possible Roles for Activating RAS Mutations in the MGUS to MM Transition and in the Intramedullary to Extramedullary Transition in Some Plasma Cell Tumors. Blood 2005, 105, 317–323. [Google Scholar] [CrossRef] [PubMed]
- Walker, B.A.; Boyle, E.M.; Wardell, C.P.; Murison, A.; Begum, D.B.; Dahir, N.M.; Proszek, P.Z.; Johnson, D.C.; Kaiser, M.F.; Melchor, L.; et al. Mutational Spectrum, Copy Number Changes, and Outcome: Results of a Sequencing Study of Patients With Newly Diagnosed Myeloma. J. Clin. Oncol. Off. J. Am. Soc. Clin. Oncol. 2015, 33, 3911–3920. [Google Scholar] [CrossRef] [PubMed]
- Walker, B.A.; Mavrommatis, K.; Wardell, C.P.; Ashby, T.C.; Bauer, M.; Davies, F.; Rosenthal, A.; Wang, H.; Qu, P.; Hoering, A.; et al. A High-Risk, Double-Hit, Group of Newly Diagnosed Myeloma Identified by Genomic Analysis. Leukemia 2019, 33, 159–170. [Google Scholar] [CrossRef] [PubMed]
- Chng, W.J.; Gonzalez-Paz, N.; Price-Troska, T.; Jacobus, S.; Rajkumar, S.V.; Oken, M.M.; Kyle, R.A.; Henderson, K.J.; Van Wier, S.; Greipp, P.; et al. Clinical and Biological Significance of RAS Mutations in Multiple Myeloma. Leukemia 2008, 22, 2280–2284. [Google Scholar] [CrossRef] [PubMed]
- Li, N.; Lin, P.; Zuo, Z.; You, M.J.; Shuai, W.; Orlowski, R.; Manasanch, E.E.; Li, S.; Xu, J.; Garces, S.; et al. Plasma Cell Myeloma with RAS/BRAF Mutations Is Frequently Associated with a Complex Karyotype, Advanced Stage Disease, and Poorer Prognosis. Cancer Med. 2023, 12, 14293–14304. [Google Scholar] [CrossRef] [PubMed]
- Perroud, C.; Thurian, D.; Andres, M.; Künzi, A.; Wiedemann, G.; Zeerleder, S.; Bacher, U.; Pabst, T.; Banz, Y.; Porret, N.; et al. Effect of MAPK Activation via Mutations in NRAS, KRAS and BRAF on Clinical Outcome in Newly Diagnosed Multiple Myeloma. Hematol. Oncol. 2023, 41, 912–921. [Google Scholar] [CrossRef] [PubMed]
- Sergeeva, A.M.; Surin, V.L.; Chabaeva, Yu.A.; Kraizman, A.A.; Solovev, M.V.; Kulikov, S.M.; Mendeleeva, L.P. KRAS/NRAS Gene Mutations and the Efficacy of Bortezomib-Based Triplet Induction Therapy in Patients with Newly Diagnosed Multiple Myeloma. Clin. Oncohematology 2024, 17, 256–265. [Google Scholar] [CrossRef]
- Li, S.; Fu, J.; Xu, X.; Deng, S.; Landry, D.; Mapara, M.; Lentzsch, S. Treatment of RAS-Mutated Multiple Myeloma by Targeting MAP4K2. Clin. Lymphoma Myeloma Leuk. 2019, 19, e131–e132. [Google Scholar] [CrossRef]
- Molina, J.R.; Adjei, A.A. The Ras/Raf/MAPK Pathway. J. Thorac. Oncol. 2006, 1, 7–9. [Google Scholar] [CrossRef]
- Vojtek, A.B.; Der, C.J. Increasing Complexity of the Ras Signaling Pathway. J. Biol. Chem. 1998, 273, 19925–19928. [Google Scholar] [CrossRef] [PubMed]
- Tago, K.; Funakoshi-Tago, M.; Ohta, S.; Kawata, H.; Saitoh, H.; Horie, H.; Aoki-Ohmura, C.; Yamauchi, J.; Tanaka, A.; Matsugi, J.; et al. Oncogenic Ras Mutant Causes the Hyperactivation of NF-κB via Acceleration of Its Transcriptional Activation. Mol. Oncol. 2019, 13, 2493–2510. [Google Scholar] [CrossRef] [PubMed]
- Yoshizawa, R.; Sako, Y. Cell Cycle Dependence of ERK Activation Dynamics Is Regulated by PI3K and PAK1 Signaling. Sci. Rep. 2025, 15, 27688. [Google Scholar] [CrossRef] [PubMed]
- Shirazi, F.; Jones, R.J.; Singh, R.K.; Zou, J.; Kuiatse, I.; Berkova, Z.; Wang, H.; Lee, H.C.; Hong, S.; Dick, L.; et al. Activating KRAS, NRAS, and BRAF Mutants Enhance Proteasome Capacity and Reduce Endoplasmic Reticulum Stress in Multiple Myeloma. Proc. Natl. Acad. Sci. U. S. A. 2020, 117, 20004–20014. [Google Scholar] [CrossRef] [PubMed]
- van Andel, H.; Kocemba, K.A.; Spaargaren, M.; Pals, S.T. Aberrant Wnt Signaling in Multiple Myeloma: Molecular Mechanisms and Targeting Options. Leukemia 2019, 33, 1063–1075. [Google Scholar] [CrossRef] [PubMed]
- Li, L.; Hu, X.; Nkwocha, J.; Kmieciak, M.; Meads, M.B.; Shain, K.H.; Alugubelli, R.R.; Silva, A.S.; Mann, H.; Sudalagunta, P.R.; et al. Combined MEK1/2 and ATR Inhibition Promotes Myeloma Cell Death through a STAT3-Dependent Mechanism in Vitro and in Vivo. Br. J. Haematol. 2024, 205, 2338–2348. [Google Scholar] [CrossRef] [PubMed]
- Matthes, T.; Manfroi, B.; Huard, B. Revisiting IL-6 Antagonism in Multiple Myeloma. Crit. Rev. Oncol. Hematol. 2016, 105, 1–4. [Google Scholar] [CrossRef] [PubMed]
- Song, D.; Lian, Y.; Zhang, L. The Potential of Activator Protein 1 (AP-1) in Cancer Targeted Therapy. Front. Immunol. 2023, 14, 1224892. [Google Scholar] [CrossRef] [PubMed]
- Steinbrunn, T.; Stühmer, T.; Sayehli, C.; Chatterjee, M.; Einsele, H.; Bargou, R.C. Combined Targeting of MEK/MAPK and PI3K/Akt Signalling in Multiple Myeloma. Br. J. Haematol. 2012, 159, 430–440. [Google Scholar] [CrossRef] [PubMed]
- Tian, E.; Zhan, F.; Walker, R.; Rasmussen, E.; Ma, Y.; Barlogie, B.; Shaughnessy, J.D. The Role of the Wnt-Signaling Antagonist DKK1 in the Development of Osteolytic Lesions in Multiple Myeloma. N. Engl. J. Med. 2003, 349, 2483–2494. [Google Scholar] [CrossRef] [PubMed]
- Wu, P.-K.; Becker, A.; Park, J.-I. Growth Inhibitory Signaling of the Raf/MEK/ERK Pathway. Int. J. Mol. Sci. 2020, 21, 5436. [Google Scholar] [CrossRef] [PubMed]
- Blank, V.; Andrews, N.C. The Maf Transcription Factors: Regulators of Differentiation. Trends Biochem. Sci. 1997, 22, 437–441. [Google Scholar] [CrossRef] [PubMed]
- Qiang, Y.-W.; Ye, S.; Chen, Y.; Buros, A.F.; Edmonson, R.; van Rhee, F.; Barlogie, B.; Epstein, J.; Morgan, G.J.; Davies, F.E. MAF Protein Mediates Innate Resistance to Proteasome Inhibition Therapy in Multiple Myeloma. Blood 2016, 128, 2919–2930. [Google Scholar] [CrossRef] [PubMed]
- Lauta, V.M. Interleukin-6 and the Network of Several Cytokines in Multiple Myeloma: An Overview of Clinical and Experimental Data. Cytokine 2001, 16, 79–86. [Google Scholar] [CrossRef] [PubMed]
- Interleukin-6 and Its Relation to Inflammation and Disease - PubMed. Available online: https://pubmed.ncbi.nlm.nih.gov/1728989/ (accessed on 8 July 2026).
- Klein, B.; Zhang, X.G.; Jourdan, M.; Boiron, J.M.; Portier, M.; Lu, Z.Y.; Wijdenes, J.; Brochier, J.; Bataille, R. Interleukin-6 Is the Central Tumor Growth Factor in Vitro and in Vivo in Multiple Myeloma. Eur. Cytokine Netw. 1990, 1, 193–201. [Google Scholar] [PubMed]
- Billadeau, D.; Liu, P.; Jelinek, D.; Shah, N.; LeBien, T.W.; Van Ness, B. Activating Mutations in the N- and K-Ras Oncogenes Differentially Affect the Growth Properties of the IL-6-Dependent Myeloma Cell Line ANBL6. Cancer Res. 1997, 57, 2268–2275. [Google Scholar] [PubMed]
- CREM Is Correlated With Immune-Suppressive Microenvironment and Predicts Poor Prognosis in Gastric Adenocarcinoma - PubMed. Available online: https://pubmed.ncbi.nlm.nih.gov/34938728/ (accessed on 8 July 2026).
- Kudalkar, R.; Altom, J.; Galloway, J.; Manning, V.; Taranto, S.; Cottini, F. Regulation of Stress Tolerance by CREB1 Sustains Multiple Myeloma Cell Survival. Cell Death Dis. 2026, 17, 46. [Google Scholar] [CrossRef] [PubMed]
- Sergeeva, A.M.; Abramova, T.V.; Surin, V.L.; Obukhova, T.N.; Dovydenko, M.V.; Suntsova, M.V.; Buzdin, A.A.; Mendeleeva, L.P. Molecular genetic structure of multiple myeloma tumour cells prior to treatment and at the time of relapse: short review and case report. Russ. J. Hematol. Transfusiology 2019, 64, 362–374. [Google Scholar] [CrossRef]
- Patro, R.; Duggal, G.; Love, M.I.; Irizarry, R.A.; Kingsford, C. Salmon Provides Fast and Bias-Aware Quantification of Transcript Expression. Nat. Methods 2017, 14, 417–419. [Google Scholar] [CrossRef] [PubMed]
- Soneson, C.; Delorenzi, M. A Comparison of Methods for Differential Expression Analysis of RNA-Seq Data. BMC Bioinform. 2013, 14, 91. [Google Scholar] [CrossRef] [PubMed]
- Love, M.I.; Soneson, C.; Hickey, P.F.; Johnson, L.K.; Pierce, N.T.; Shepherd, L.; Morgan, M.; Patro, R. Tximeta: Reference Sequence Checksums for Provenance Identification in RNA-Seq. PLoS Comput. Biol. 2020, 16, e1007664. [Google Scholar] [CrossRef] [PubMed]
- Durinck, S.; Spellman, P.T.; Birney, E.; Huber, W. Mapping Identifiers for the Integration of Genomic Datasets with the R/Bioconductor Package biomaRt. Nat. Protoc. 2009, 4, 1184–1191. [Google Scholar] [CrossRef] [PubMed]
- Love, M.I.; Huber, W.; Anders, S. Moderated Estimation of Fold Change and Dispersion for RNA-Seq Data with DESeq2. Genome Biol. 2014, 15, 550. [Google Scholar] [CrossRef] [PubMed]
| Genes expression evaluated | Functional Group |
|---|---|
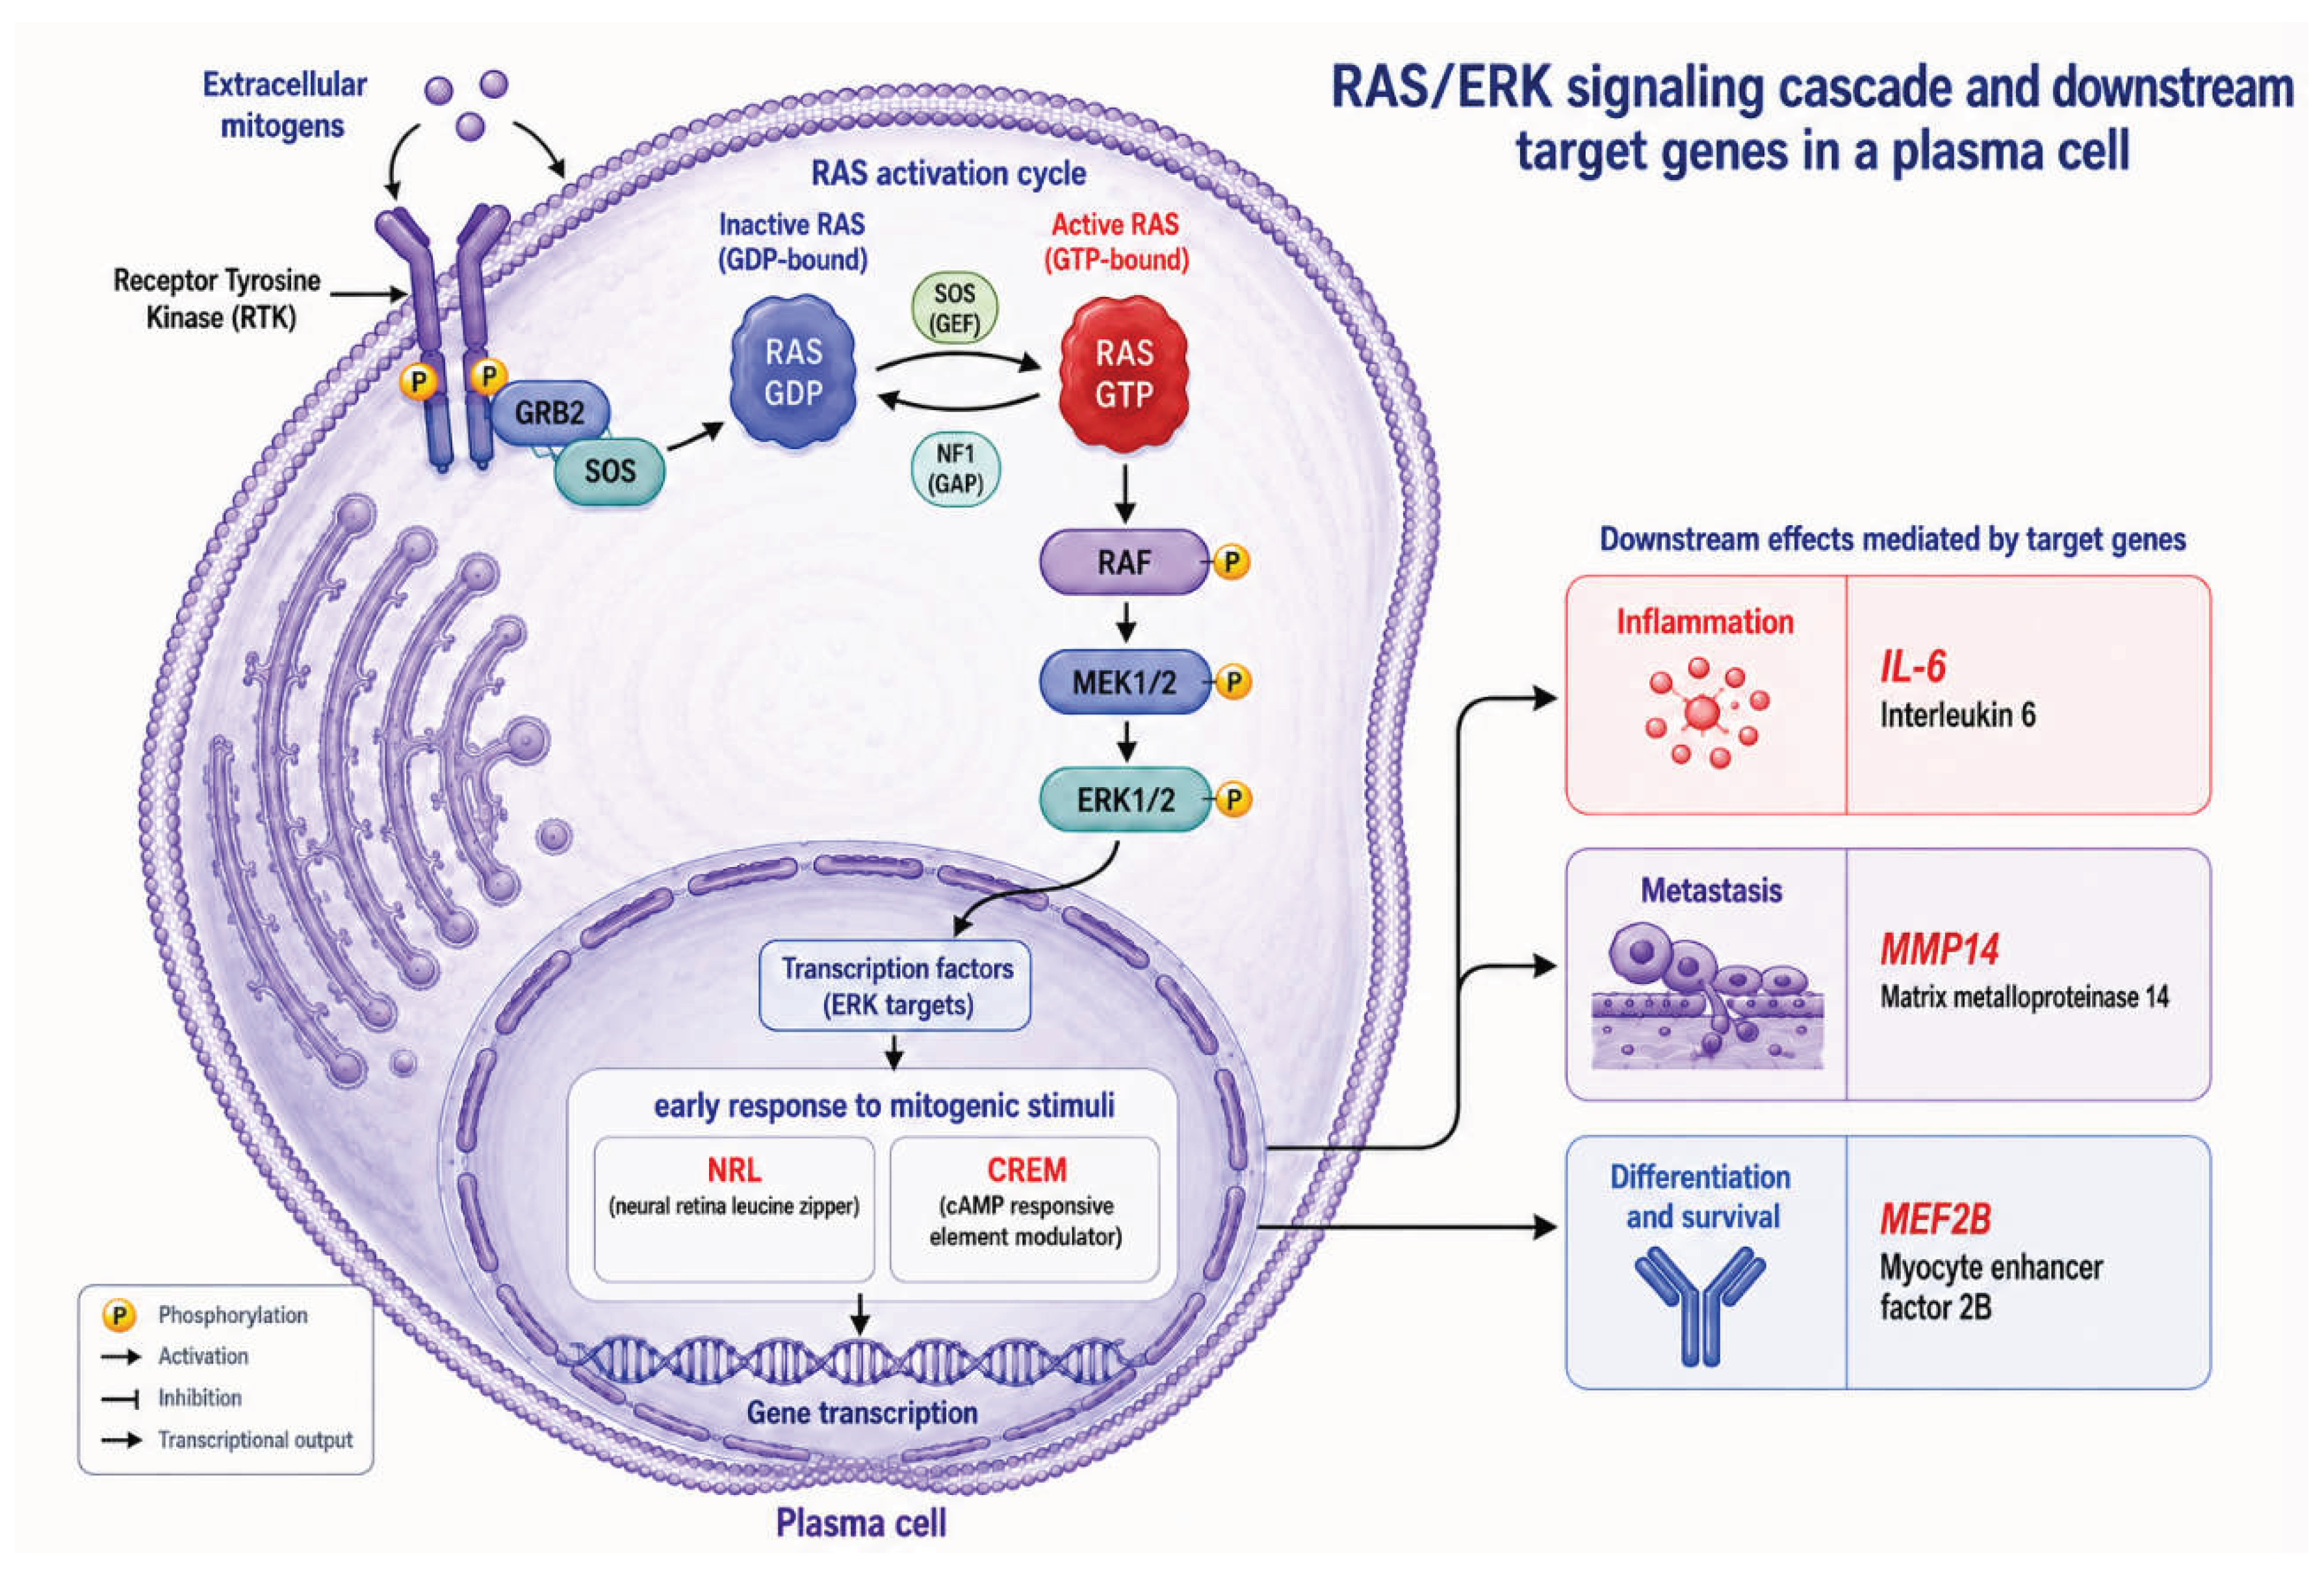
| c-JUN, JUNB, JUND, c-FOS, FOSB, Fra-1, Fra-2, CREB, CREM, ATF-1, CREB-1, CREB-2 (ATF-4), CREB-3, CREB-5, ATF-2 (CRE-BP1), ATF-3, ATF-5 (ATFX), ATF-6, ATF-7, B-ATF, MAF, MAFA, MAFB, NRL | Early response to mitogenic stimuli |
| CCND1, p21, p27, c-MYC, VEGF, EGFR, FGFR1 | Cell proliferation |
| BCL2, BCL2L1, BCL2L2, MCL1, BAX, BCL2A1, BAK1, BOK, BCL2L10, BCL2L12, BCL2L13, BCL2L14, BCL2L15, BNIP2, BCLXL, BIRC5 | Apoptosis |
| IL-6, IL6R, TNF-alpha | Inflammation |
| MMP2, MMP8, MMP9, MMP11, MMP13, MMP14, MMP15, MMP16, MMP17, MMP19, MMP21, MMP23B, MMP25 | Metastasis |
| MEF2A, MEF2B, MEF2C, MEF2D | Differentiation and survival |
| Gene | Patients without NRAS/KRAS mutations | Patients with NRAS/KRAS mutations | Significance level, p value |
|---|---|---|---|
| Median [IQR], VST-normalized counts | |||
| CREM | 89.0 [68.7-113.4] | 117.4 [104.7-154.7] | 0.03 |
| NRL | 11.1 [8.4-19.4] | 28.2 [13.0-44.4] | 0.03 |
| IL6 | 1.4 [0-3.5] | 6.6 [1.0-88.4] | 0.024 |
| MEF2B | 144.4 [67.9-307.6] | 620.5 [152.7-955.3] | 0.04 |
| MMP14 | 14.7 [3.5-34.5] | 21.8 [16-51.9] | 0.002 |
| Gene | Patients achieving CR+VGPR | Patients achieving <VGPR | Significance level, p value |
|---|---|---|---|
| Median [IQR], VST-normalized counts | |||
| CREM | 110.2 [89.3-156.7] | 104.8 [72.7-159.3] | 0.20 |
| NRL | 12.1 [4.2-20.2] | 28.1 [12.0-45.4] | 0.02 |
| IL6 | 1.6 [1.0-81.4] | 2.6 [1.0-31.7] | 1.00 |
| MEF2B | 232.3 [74.0-620.5] | 356.7 [120.8-144.0] | 0.58 |
| MMP14 | 16.6 [7.6-31.5] | 27.5 [10.8-54.3] | 0.24 |
| Overall Survival | |||||
|---|---|---|---|---|---|
| Gene | Long rank test, p value | Cox model | |||
| Hazard Ratio |
95% CI (lower) |
95% CI (upper) |
Significance level, p value | ||
| CREM | 0.15 | 2.44 | 0.70 | 8.44 | 0.16 |
| NRL | 0.54 | 0.62 | 0.13 | 2.93 | 0.55 |
| IL6 | 0.05 | 3.18 | 0.90 | 11.30 | 0.07 |
| MMP14 | 0.50 | 2.02 | 0.25 | 16.24 | 0.51 |
| MEF2B | 0.31 | 0.50 | 0.13 | 1.94 | 0.32 |
| Progression Free Survival | |||||
| Gene | Long rank test, p value | Cox model | |||
| Hazard Ratio |
95% CI (lower) |
95% CI (upper) |
Significance level, p value | ||
| CREM | 0.01 | 2.62 | 1.12 | 6.09 | 0.03 |
| NRL | 0.58 | 1.29 | 0.53 | 3.15 | 0.58 |
| IL6 | 0.25 | 1.61 | 0.71 | 3.69 | 0.26 |
| MMP14 | 0.75 | 1.40 | 0.19 | 10.46 | 0.75 |
| MEF2B | 0.93 | 1.04 | 0.46 | 2.35 | 0.93 |
| Parameter | Total number of patients, n (%) |
|---|---|
| Sex (male/female) | 27 (61.4) / 17 (38.6) |
| Median age, years (range) | 59 (28-78) |
| Durie-Salmon stage (I/ II/ III/unknown) | 3 (6.8) / 15 (34.1) / 25 (56.8) / 1 (2.3) |
| ISS stage (I/ II/ III/ unknown) | 4 (9.1) / 5 (11.4) / 31 (70.4) / 4 (9.1) |
| R-ISS stage (I/ II/ III/ unknown) | 1 (2.3) /3 (6.8) /30 (68.2) /10 (22.7) |
Cytogenetics (done/ unknown)
|
30 (68.2)/14 (31.8) 3 (10) / 27 (90) 3 (10) / 27 (90) 4 (13.3) / 26 (86.7) |
Disclaimer/Publisher’s Note: The statements, opinions and data contained in all publications are solely those of the individual author(s) and contributor(s) and not of MDPI and/or the editor(s). MDPI and/or the editor(s) disclaim responsibility for any injury to people or property resulting from any ideas, methods, instructions or products referred to in the content. |
© 2026 by the authors. Licensee MDPI, Basel, Switzerland. This article is an open access article distributed under the terms and conditions of the Creative Commons Attribution (CC BY) license (http://creativecommons.org/licenses/by/4.0/).